
Exhaust Emissions Measurement of a Vehicle with Retrofitted LPG System
by
 , , and
Branislav Šarkan
1,2, 
Marek Jaśkiewicz
2,*,
Przemysław Kubiak
3,4 ,
,
Dariusz Tarnapowicz
5 and
Michal Loman
1 1
Department of Road and Urban Transport, University of Žilina, 010-26 Žilina, Slovakia
2
Department of Automotive Engineering and Transport, Kielce University of Technology, 25-314 Kielce, Poland
3
Institute of Vehicles and Construction Machinery Engineering, Warsaw University of Technology, Narbutta 84, 02-524 Warsaw, Poland
4
Ecotechnology Team, Lodz University of Technology, 266 Piotrkowska Street, 90-924 Lodz, Poland
5
Faculty of Mechatronics and Electrical Engineering, Maritime University of Szczecin, ul. Wały Chrobrego 1-2, 70-500 Szczecin, Poland
*
Author to whom correspondence should be addressed.
Energies 2022, 15(3), 1184; https://0-doi-org.brum.beds.ac.uk/10.3390/en15031184
Submission received: 5 January 2022
/
Revised: 29 January 2022
/
Accepted: 1 February 2022
/
Published: 6 February 2022
(This article belongs to the Special Issue Alternative Fuels and Their Application for Transport - Recent Research and Challenges)
Abstract
:The aim of this study was to compare and evaluate the production of exhaust emissions from a vehicle with a petrol engine with the Euro 4 emission standard and powered by petrol and LPG (liquefied petroleum gas). The paper presents new possibilities for monitoring exhaust emissions using an exhaust gas analyzer. At the same time, it points out the topicality and significance of the issue in the monitored area. It examines the impact of a change in fuel on emissions. This change is monitored in various areas of vehicle operation. Measurements were performed during real operation, which means that the results are fully usable and applicable in practice. The driving simulation as well as the test conditions correspond to the RDE (Real Driving Emissions) test standard. A commercially available car was first selected to perform the tests, which was first measured in the original configuration (petrol drive). Based on real-time RDE driving tests, it is possible to determine the number of exhaust emissions. Subsequently, the same measurements were performed with the same vehicle, but the vehicle’s propulsion was changed to LPG. The vehicle was equipped with an additional system that allowed the vehicle to be powered by LPG. The results from the individual driving tests allowed the determination of the exhaust emissions. Emissions of CO (carbon monoxide), CO2 (carbon dioxide), HC (hydrocarbons), and NOx (nitrogen oxides) were monitored as a matter of priority. Through the driving tests, it was found that the gasoline combustion produced higher CO (1.926 g/km) and CO2 (217.693 g/km) emissions compared to the combustion of liquefied gas, where the concentration of the CO emissions was 1.892 g/km and that of the CO2 emissions was 213.966 g/km. In contrast, the HC (0.00397 g/km) and NOx (0.03107 g/km) emissions were lower when petrol was burned. During LPG combustion, the HC emissions reached 0.00430 g/km, and the NOx emissions reached 0.05134 g/km. At the end of the research, the authors compared the emissions determined by real driving (in g/km) with the emission values produced by the emission standard EURO 4 and the certificate of conformity (COC). Practical measurements showed that the vehicle produced excessive amounts of CO when burning gasoline. This production is 0.926 g/km higher and 0.892 g/km higher when burning LPG compared to the limit set by the Euro 4 Emission Standard. The difference is even greater than the limit value stated in the COC document. For other substances, the monitored values are in the norm and are even far below the permitted value
1. Introduction
Most metropolitan areas in the European Union suffer from high traffic intensity and deteriorating air quality. At the same time, the air conditions and quality have a negative impact on the health of the population, as evidenced by several studies [1,2,3]. According to the European Environment Agency, around 90% of the population of European cities is exposed to pollutants in concentrations higher than air quality levels considered harmful to health [4]. NO2 (nitrogen dioxide) concentrations in most high-traffic cities in the EU consistently exceed the annual limit value set in EU regulations. NO and NO2, which are the main acidifying pollutants, are formed during high-temperature combustion or in exhaust after-treatment plants [5]. As a result, road transport is a major source of nitrogen dioxide (NO2), one of the main pollutants that harms health. This pollutant is also a precursor to ozone and particulate matter that can form in the air [6]. Transport is also an important source of primary particulate matter, which is not only due to t fuel combustion but also the wear and tear of tires and brakes and, last but not least, it is a very important source of greenhouse gas emissions [7,8]. In their study, Caban et al. monitored vehicle emissions when crossing an intersection [9]. Through their research, they supported the claim that road transport is one of the main producers of greenhouse gases. In order to reduce harmful gases, and NOx emissions in particular, from light commercial vehicles, which are very popular, especially in urban areas, the EU has introduced increasingly stringent regulations in recent years [10].
Protecting air quality and reducing greenhouse gas emissions is a priority for the European Commission. At present, emission standards apply to light commercial vehicles (passenger cars, vans) and heavy commercial vehicles (lorries, buses) and to non-road mobile machinery. The Commission also supports technological developments that help protect the environment and reduce air pollution [11]. The Euro 5 and 6 emission limit standards for light passenger and commercial vehicles have introduced new, more stringent emission limits [12]. Gradual reduction of CO2 emissions—The EU sets binding emission targets for new car fleets and vans in order to reduce CO2 emissions from light commercial vehicles. Methods to achieve these targets and reduce overall emissions have been explored by Morthorst in his research [13]. To improve test procedures, since 1 September 2017, it has been mandatory for new car models to pass new and more reliable emission tests in real driving conditions (Real Driving Emissions—RDE). It is also mandatory for new vehicles to perform improved World Harmonized Light Vehicle Test (WLTP) laboratory tests. After passing these tests, they are able to drive on European roads [13].
The proposed regulatory measures have led to a 64% reduction in NOx emissions over the last 15 years under the NEDC (New European Driving Cycle) test protocol, which can be determined by comparing EURO 3 emission limits with EURO 5 emission limits. Nevertheless, ambient NOx concentrations in heavily traded areas still remain above air quality limits. The main reason for this is that modern diesel vehicles have much higher NOx emission levels under actual driving conditions compared to their NEDC emission levels, which are lower than the corresponding emission limits [14,15,16].
The monitoring and reporting of CO2 emissions from light commercial vehicles in Europe and other major markets is based on the new European driving cycle (NEDC) and the accompanying test protocol. This approach has been proven to be unrepresentative for real-world vehicle operation, fuel consumption, and CO2 emissions, leading to a difference between officially reported emissions and emissions that occur during real-world operation. It is said that this distance increases over time. To address this issue and to improve the certification process for pollutant emissions from vehicles during actual driving, a new WLTP test protocol for light commercial vehicles has been proposed. The results show that European passenger cars with a difference in certified and actually emitted CO2 emissions for the average European passenger car reach up to 40 g CO2/km (~32% higher than certification). With the introduction of WLTP, there has been an improvement, but there may remain a shortage of about 10–15% between the official and real-world measurements [17,18].
The latest emission regulations in Europe have introduced the so-called Actual Emission Test Procedure (RDE), in which the vehicle is measured under real driving conditions using Portable Emission Measurement Systems (PEMS) [19]. This means that in addition to the WLTP driving cycle, since September 2017, fuel consumption and emissions have been measured according to the RDE test method in Europe. Unlike the NEDC and WLTP driving cycles, emission measurements are not performed in the test room, but in actual traffic. The emissions (nitrogen oxides, particulate matter, and fine dust) detected while driving in traffic are called actual emissions. The RDE test does not replace but instead complements WLTP laboratory tests. As previously mentioned, during the RDE test, the vehicle is used on the road in a wide range of different conditions. These include altitude, temperature, additional loads, uphill and downhill driving, urban roads (low speed), rural roads (medium speed), and motorways (high speed) [20]. According to Kartyka et al., research into the emission of pollutants under actual driving conditions carried out using a portable computer measuring device reflects the environmental performance of vehicles. Their results showed increased emissions of some exhaust gases compared to tests performed under laboratory conditions. However, these conditions (such as congestion, the driver’s predisposition, and driving style, as well as accidental events that occur while driving) are unpredictable. Their research showed that increased acceleration resulted in an increase in carbon monoxide, carbon dioxide, nitrogen oxides, and hydrocarbon exhaust emissions from both of the tested vehicles. Subsequently, the values of the dynamic parameters of both tests (vehicle speed and acceleration and other parameters) were compared [21,22].
Łagowski points to the report in order to determine whether it is possible to observe a difference between the production of exhaust emissions when driving a vehicle powered by an internal combustion engine on petrol and on LPG or another propulsion system [23]. The research focuses on achieving emission levels using existing technology under real conditions and examines the side effects of the required technology, particularly in terms of CO, CO2, HC, and NOx emissions. The following steps included the selection of a measurement technique that will be used to evaluate the measurements and that will be able to fully meet the requirements of the RDE. First of all, vehicle inspection was updated, and the RDE conditions were implemented while driving on real roads. The course of the measurement as well as the procedure itself had to be set in advance. The methodology used for the measurements is comparable to that used in Kuranc’s research, which describes the methodology for measuring exhaust emissions based on the use of information about the air flow supplying an engine and the measured volumetric shares of particular fume components through an exhaust gas analyzer [24]. Vojtisek used a similar methodology, which was developed to determine the amount of exhaust emissions [25]. In the future, RDE conditions will be able to be reproduced in laboratory conditions to see to what extent emission levels can be improved. Recommendations and suggestions are also issued based on the performed experimental research [26,27]. The expected results show how environmentally friendly the LPG vehicle is. Several studies have been conducted on this issue. LPG, an alternative fuel, could replace 10% of current oil consumption or create significant CO and CO2 emission reductions. Ultimately, it contributes to reducing the harmful greenhouse effect [28,29]. In connection with the issue of comparison, several studies have been conducted that point to the lower production of pollutants during LPG combustion [30,31].
2. Real Driving Emission
The driving tests were based on RDE performance conditions. The tests were performed by measuring the exhaust emissions determined by the RDE: the exhaust pipe-out emissions. Calculations were made in accordance with the methodology determined in Regulation 2017/1151. For the purposes of these calculations, we also needed to determine the H/C ratio. The authors worked with the values set as recommendations by the regulation. The H values vary for individual fuels. In the research, the authors considered a value of 1.92 for gasoline, and for the LPG, fuel this value was 3.92. The C value was equal to 1 for both fuels [32]. It is necessary to point out the different fuel qualities. While not included in the present research, Karczewski et al. investigated the impact of fuel on CO2 emissions [33]. During the RDE measurements, the vehicle travelled a route consisting of one third of urban driving, one third of extra-urban driving, and one third of motorway travel with random acceleration and deceleration while always respecting road traffic regulations. The average speed in the city is between 15 and 40 km/h and can reach a maximum of 60 km/h. On the roads outside the city, the vehicle speed ranges from 60 to 90 km/h. Vehicles can travel on motorways at a speed of 145 km/h, and for a short time, they can travel at speeds up to 160 km/h. The vehicle is equipped with a portable measuring system PEMS (Portable Emission Measurement System). The test drive takes about 90 to 120 min. The outside temperature must be between −7 and +35 °C, and the air conditioning can be switched on [34]. The vehicle was warmed up to operating temperature (from 80 to 90 °C) during the measurements. This prevented possible discrepancies between the individual measurements.
The definition of the measurement conditions themselves is in COMMISSION REGULATION (EU) 2016/427 (RDE Act 1), which lists all of the conditions during the test.
The requirements set out in the Regulation must be observed when performing the driving test. These requirements include general requirements, boundary conditions, driving requirements, operating requirements, oil and fuel requirements, and lastly, emission assessment and driving requirements. The analysis of RDE test conditions has been discussed in the studies of Bodisco et al. and Gielchaskiel et al., which analyzed individual test and driving conditions [35,36].
Part of the Regulation for RDE tests characterizes the general requirements of how the test should be performed. The next point is the boundary conditions, where the vehicle load, test mass, dynamic conditions (slope of the road, etc.), and the conditions of the operating environment (use of air conditioning during the measurement) are defined.
Improvements to these tests will be considered in the future. With the introduction of the expected Euro 7 emissions legislation and its expected content, vehicle manufacturers and developers will face new challenges. The exact scope of the planned adjustments in the transition from Euro 6 to Euro 7 is not yet known in detail. However, it is already clear that in addition to improved exhaust after-treatment systems and advanced measurement systems for the accurate measurement of very low concentrations of already limited and other new pollutants, extended or even new development structures and procedures need to be provided in some areas [37,38].
2.1. RDE Driving Requirements and Measuring Route Planning
Driving requirements are one of the most important parts of the measurements. A study by Guo et al. has been shown to reduce fuel consumption and thus emissions due to route planning [39]. For RDE tests, it is important that the conditions specified in the Regulation are met. For this purpose, Table 1 was processed, where the individual requirements are defined [40].
2.2. Emission Measurement Based on RDE Methodology—Measurement by Authors
For the purposes of measuring emissions, a route was designed that meets the conditions described above. On this route, it was possible to perform the emission measurement itself according to the characterized Regulation (RDE).
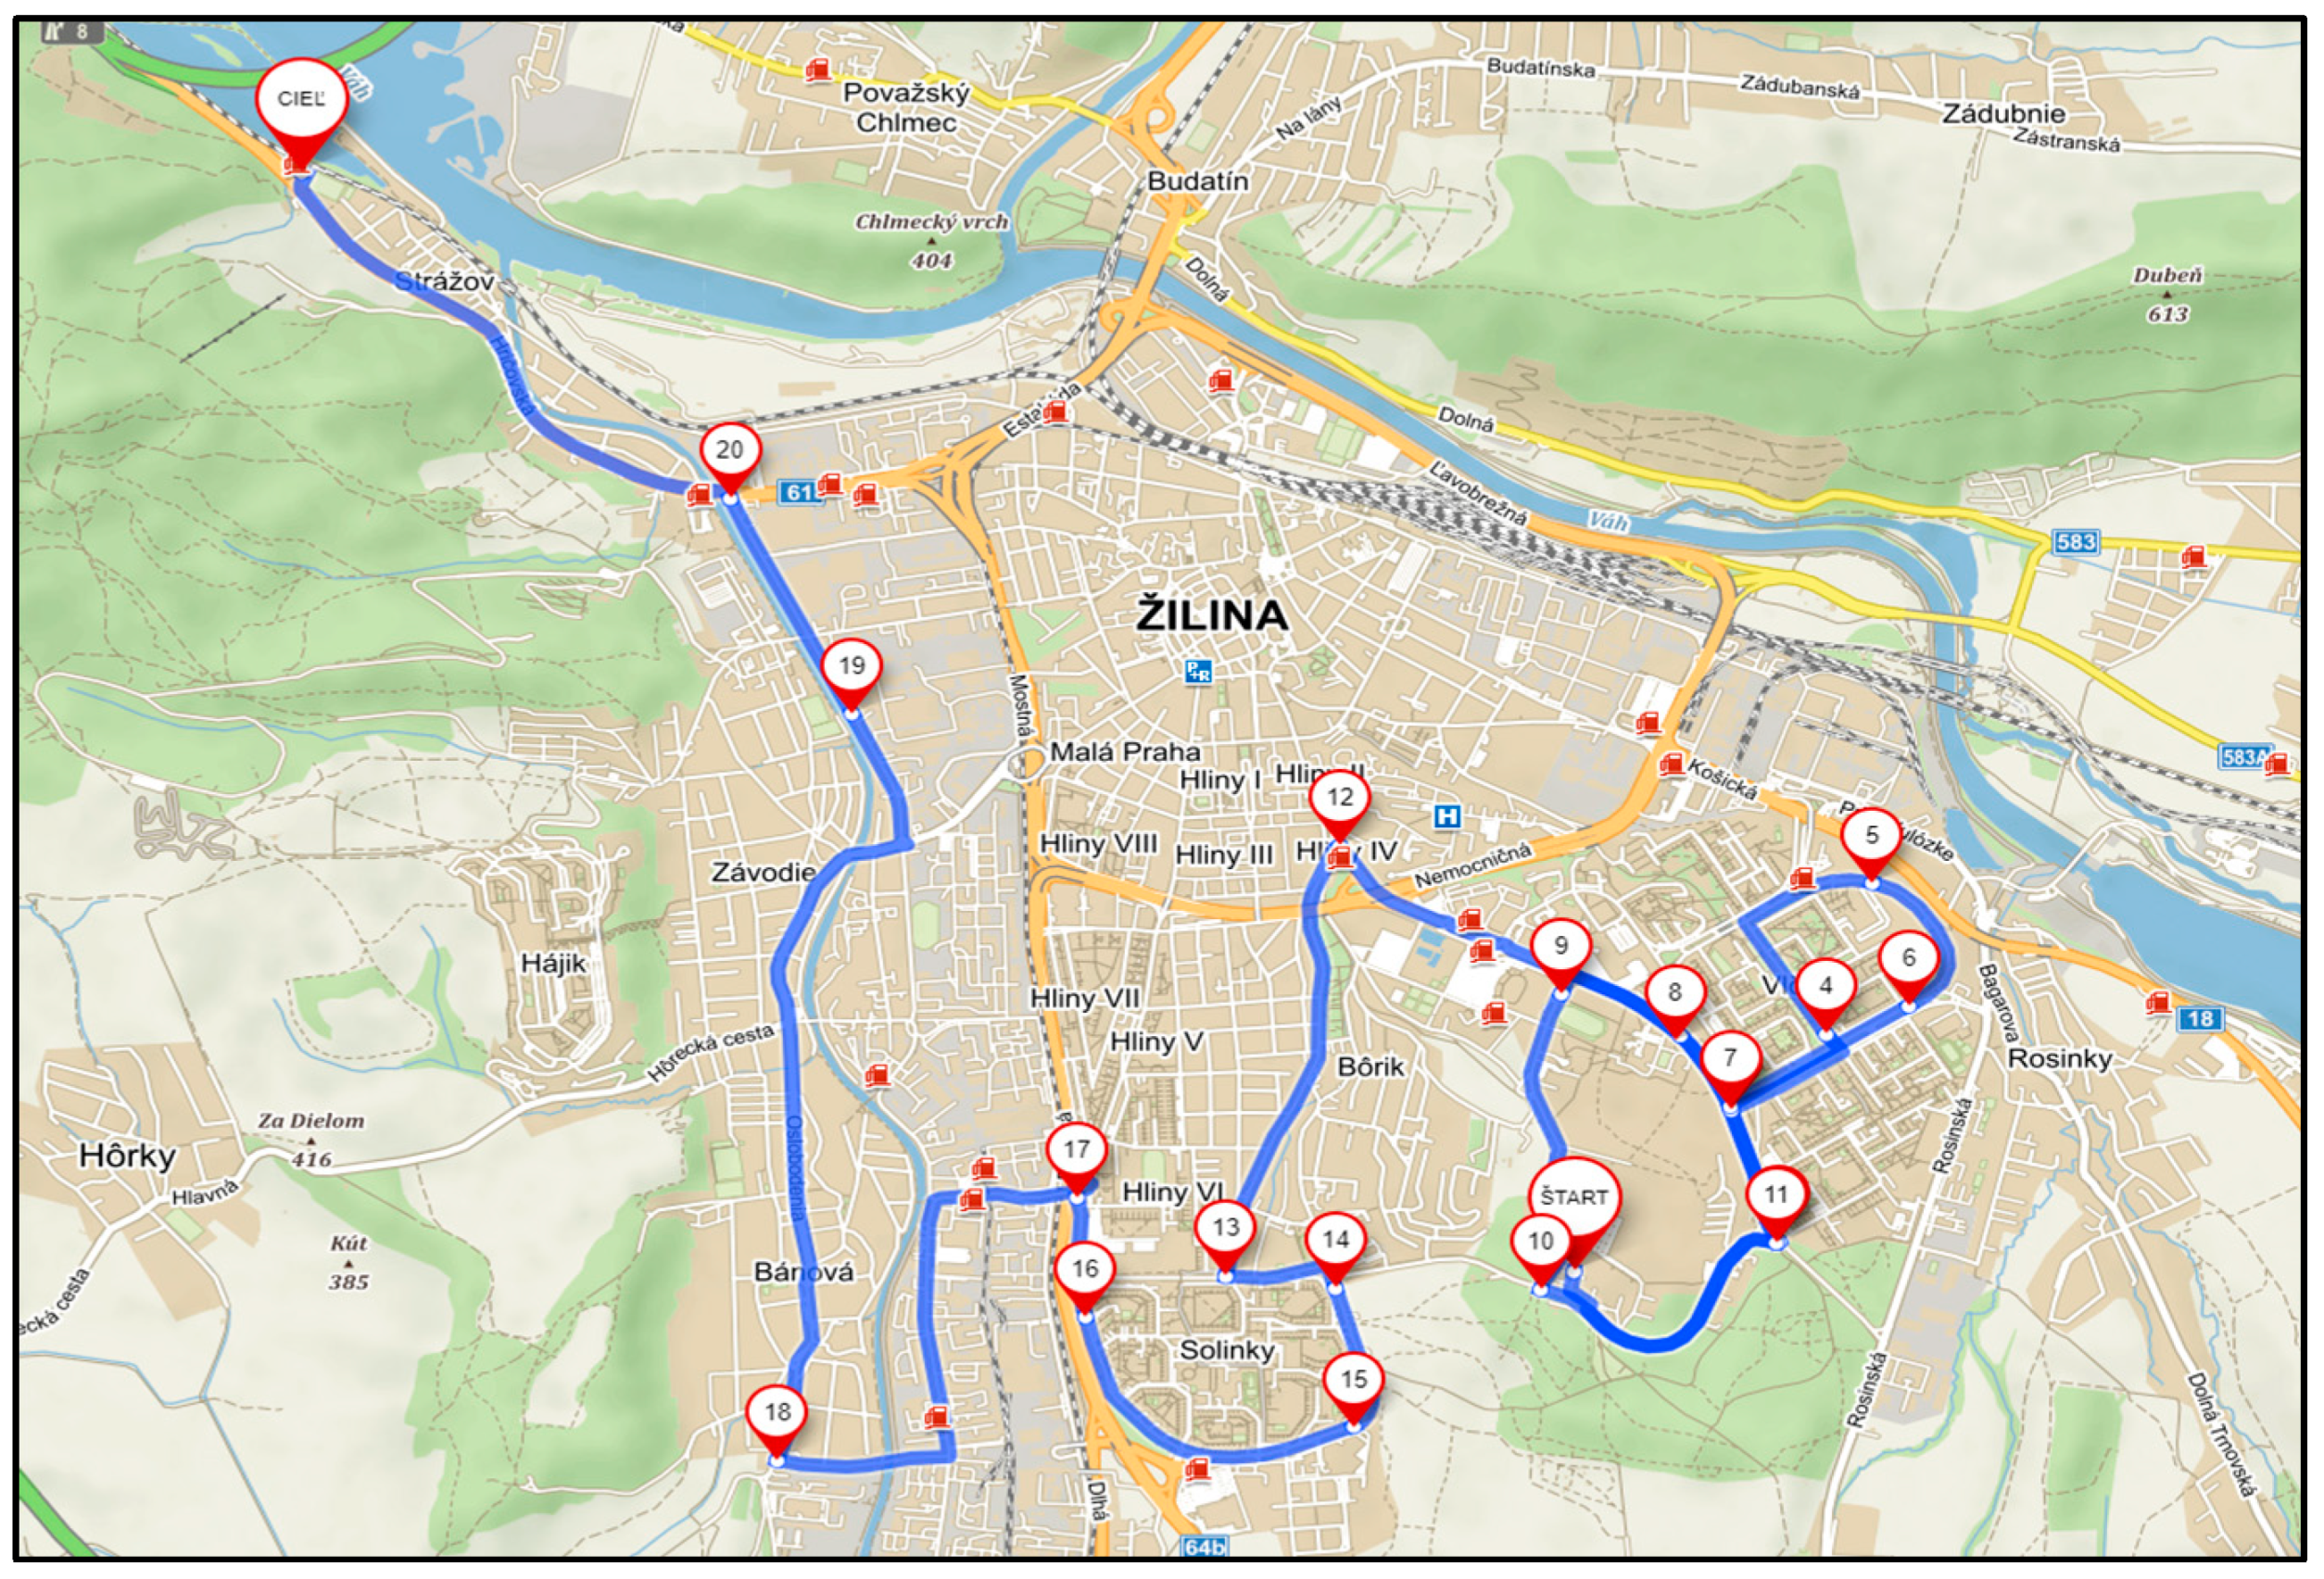
In Figure 1, it is possible to follow the planned route in an urban environment. The planned route is 21.5 km long. When planning it, attention was paid to the fact that the route travelled through the built-up area of the city of Žilina. This ensured that the measured amount of exhaust emissions sufficiently represented the value of the emissions produced by the vehicle when driving in an urban environment. The route was planned in the internet planner Mapy.cz. This is due to the specific guidance of the measuring route, and this planner allows points to be added to the planned section in the work environment. It can be seen that 20 auxiliary points (crossing points) were used to plan the route. The planned route starts at an altitude of 394 m above sea level and ends at an altitude of 353 m above sea level. During the entire route, the vehicle moved within a tolerance of 100 altitude meters. The highest point of the measuring route was reached by the vehicle while driving through the city, 406 m above sea level; on the contrary, the lowest point of the measuring route was measured at an altitude of 312 m above sea level. This point was located on the highway section. There were seven roundabouts on the planned route. During the measurements, the driver had to respect the traffic signs as well as the maximum allowed speed. When driving through the city, the speed was up to 50 km/h. On the planned route, the vehicle passed through eight intersections where the driver had to give way (two of which were light-controlled) and two intersections where the driver had to stop and give way. The total driving time through the city was 53 min.
One of the RDE conditions (route planning) is that the vehicle must be driven on a highway section. The motorway section (Figure 2) between Žilina and Považská Bystrica was chosen. The section starts at an altitude of 330 m above sea level and ends at the already mentioned 312 m above sea level. The measuring route represents a section of the D3 motorway on which a maximum speed of 130 km/h is permitted. This section has a length of 21.4 km, and it took 15 min for the measuring vehicle to complete the route.
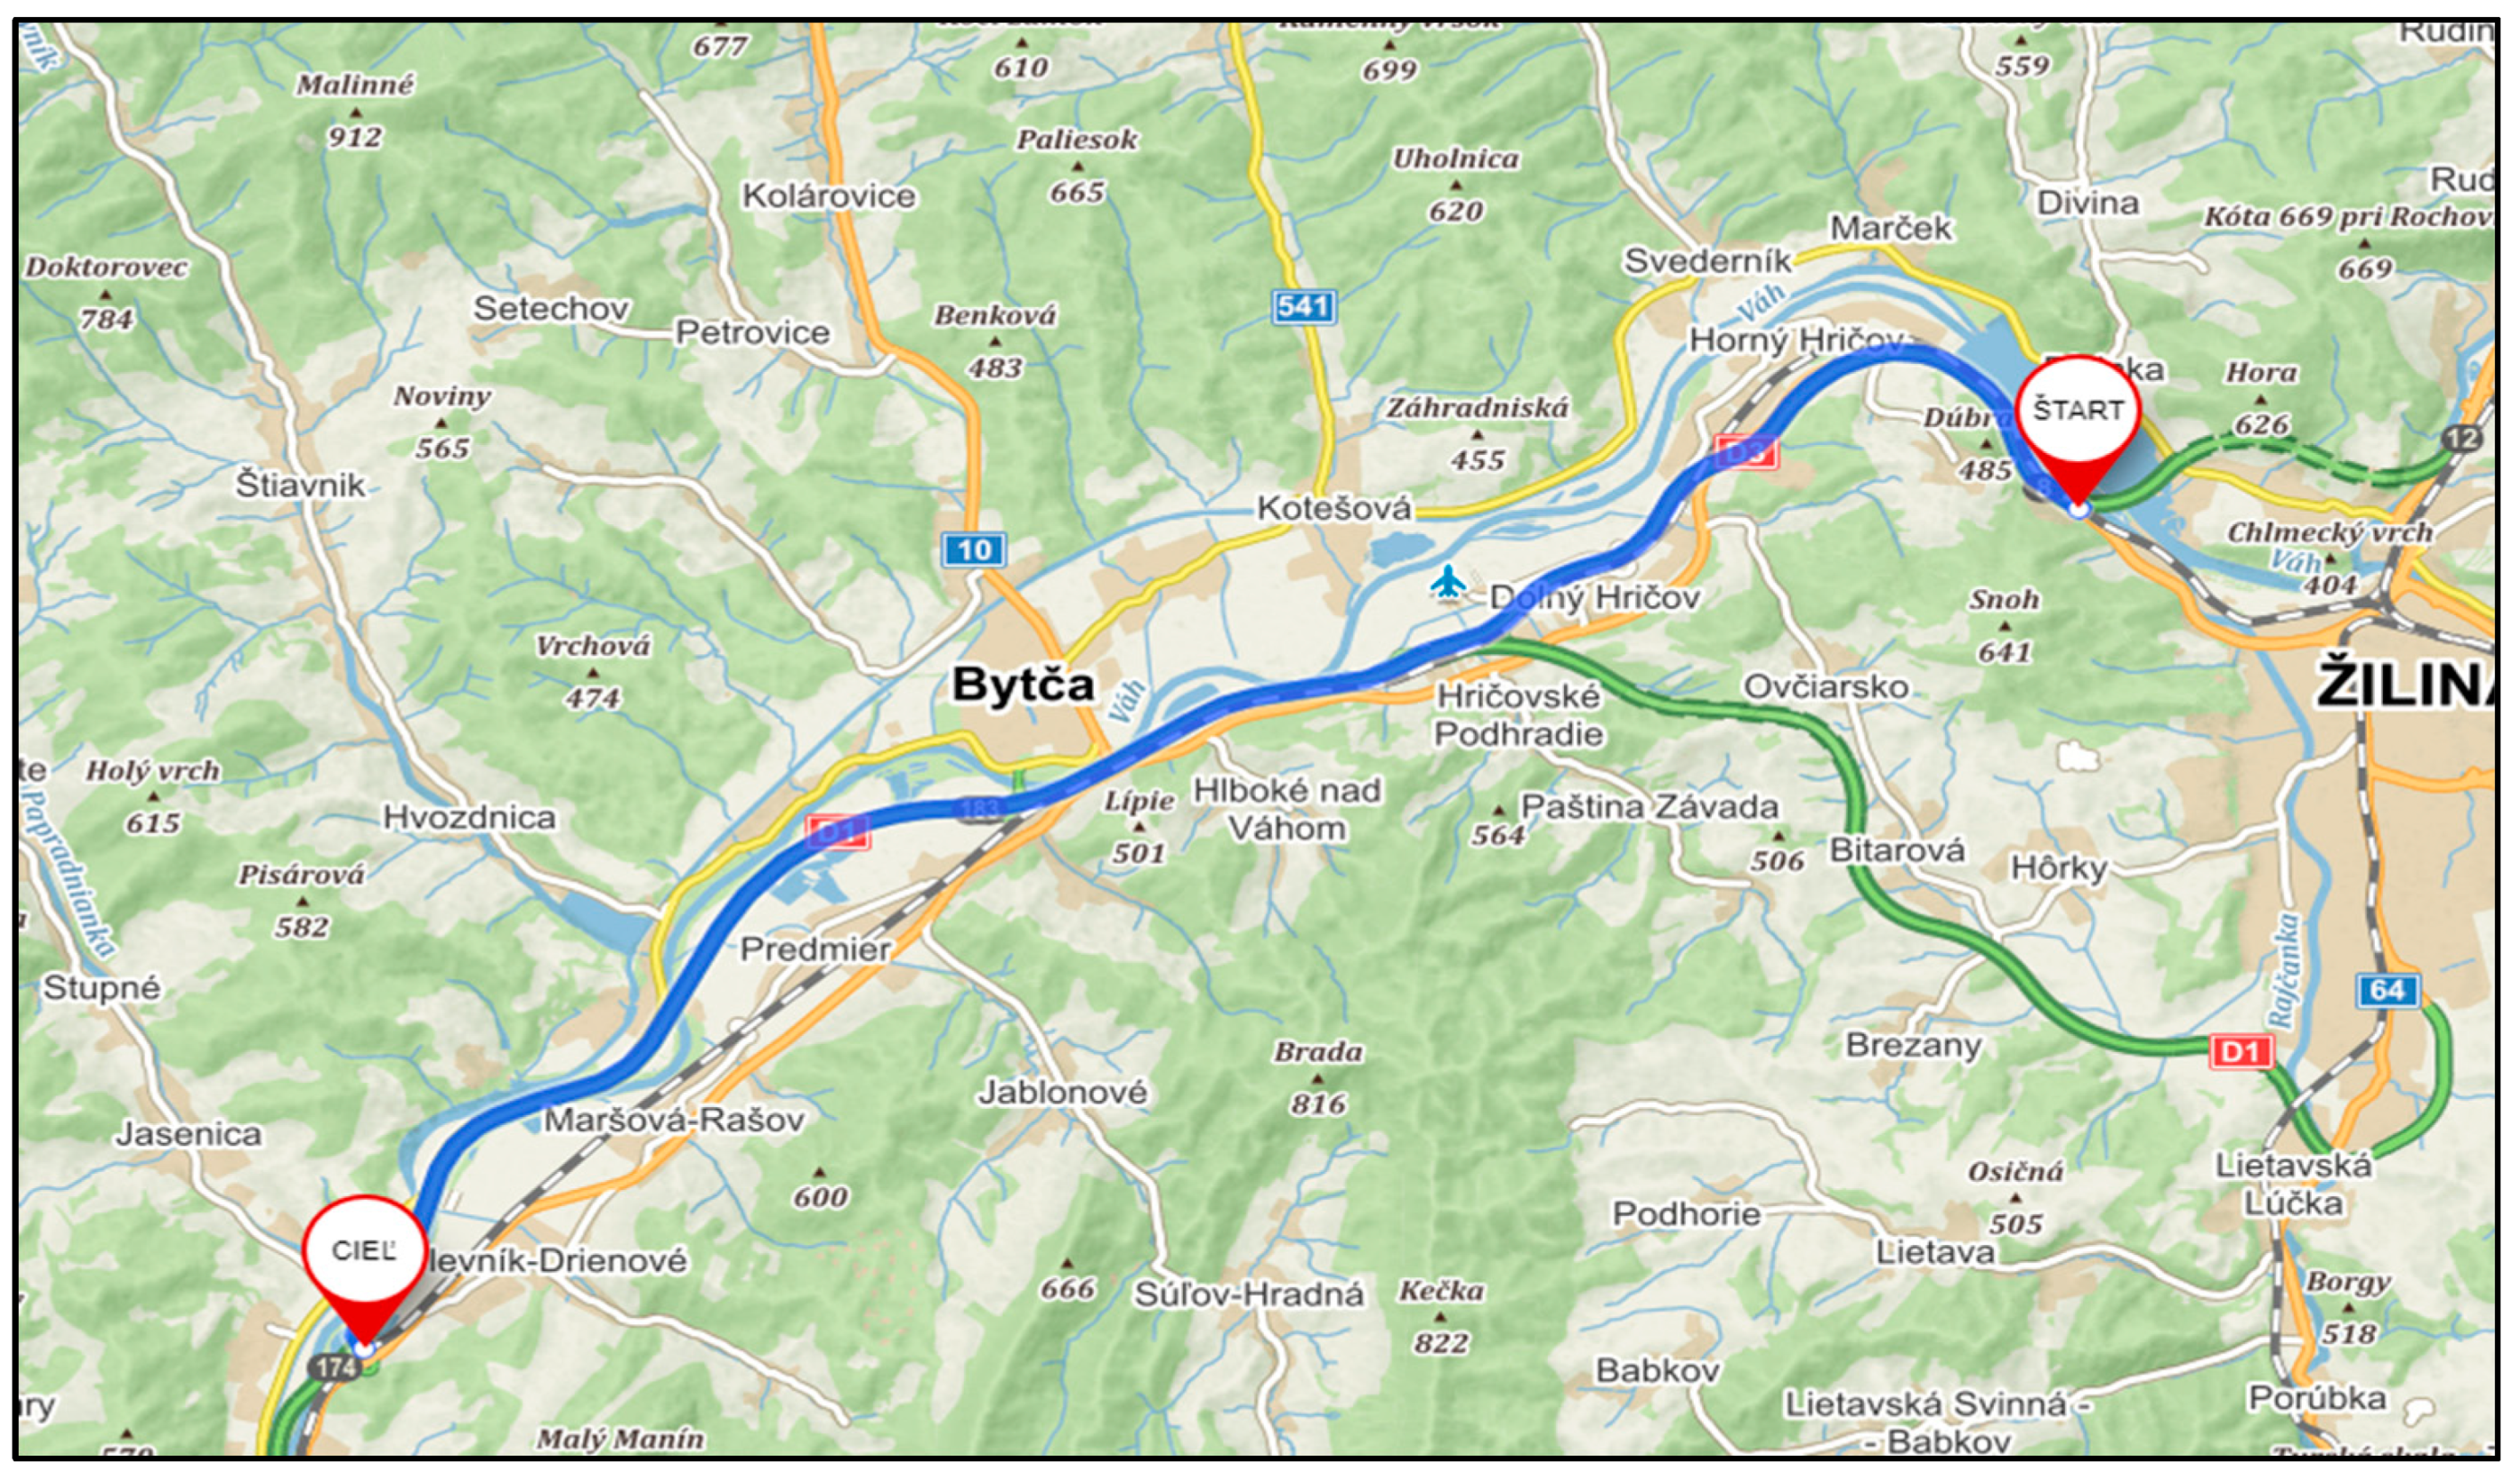
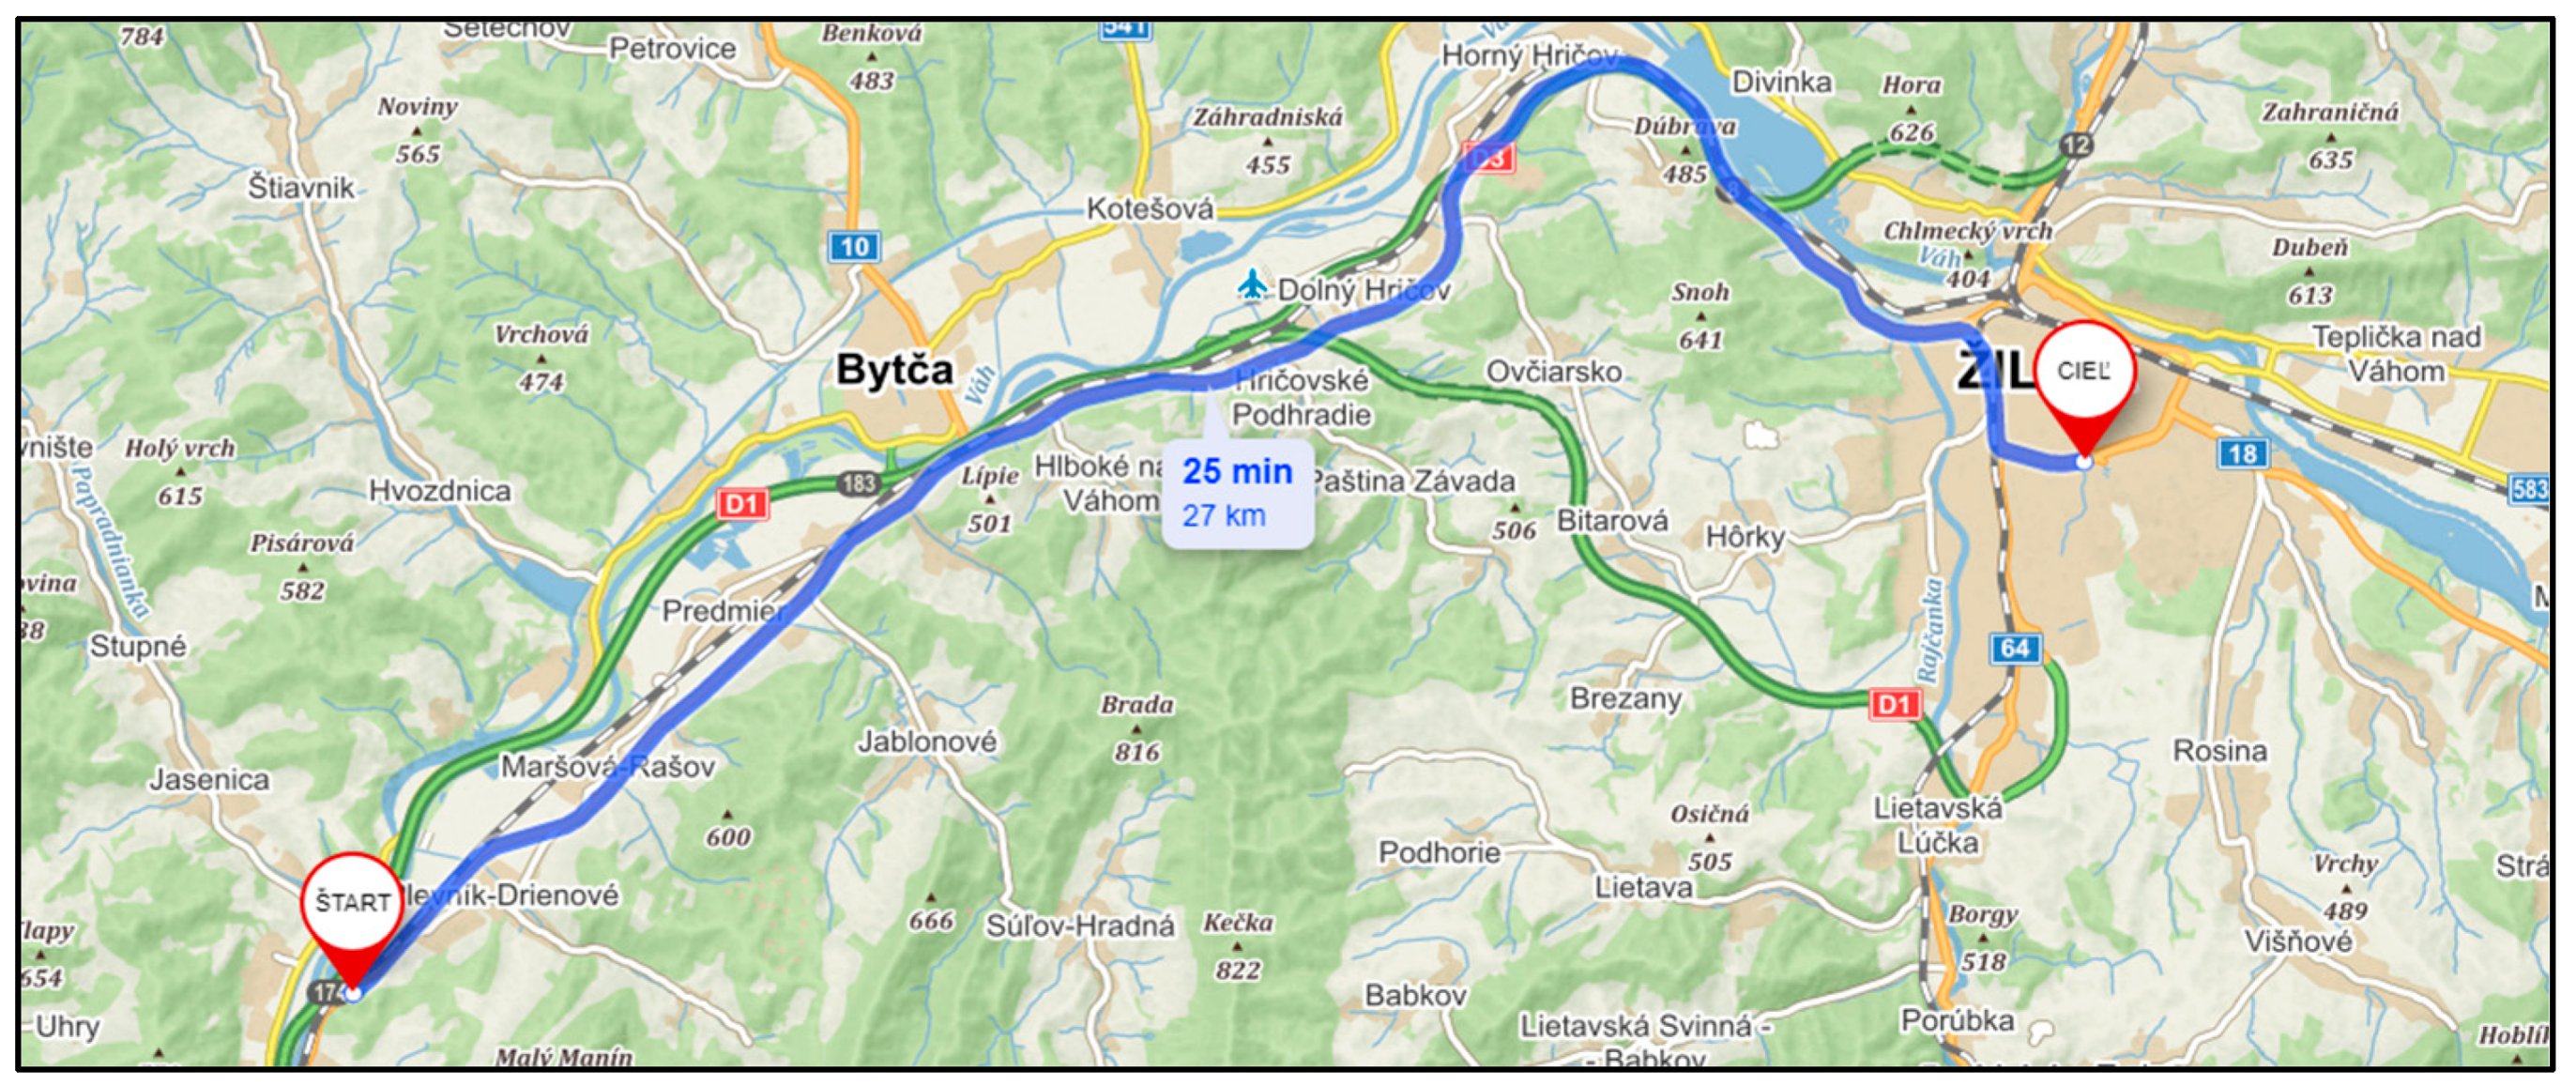
The out-of-town vehicle ride is represented by the section between Považská Bystrica and Žilina (Figure 3). The beginning of the measuring route is located at an altitude of 312 m above sea level and ends at 353 m above sea level. The measurements were performed on a 1st class road. The “number” of the path is 16. This section is 26.5 km in length, and the vehicle took 27 min to complete the section. The measuring sections were traversed one after the other without a break. The vehicle travelled at speeds of up to 80 km/h outside of the city.
The division of the sections into the described parts is for the purpose of being able to determine a more detailed specification of the measured data and for a specific comparison of the emissions produced by the measuring vehicle. The total length of the measuring section is 69.4 km. The total transit time required to complete the measure section in 95 min. This means that the basic RDE conditions are met (driving time 90–120 min). The other RDE requirements were also observed when driving through the measuring section.
The RDE results determine the size of emissions production under real operating conditions. RDEs are measured outside the laboratory environment (in traffic), and these data can be compared to data that the included in the vehicle documents determined by the results of type-approval tests. It is important to note that when performing any exhaust emission measurements, we are able to observe the thorough vehicle and exhaust system warm-up conditions. This process was provided in the form of a several-minute test run, during which the available catalyst warm-up information from the OBD system was monitored.
Triantafyllopoulos et al. also addressed this in their research, which confirmed that Euro 6b diesel vehicles emit 5 to 16 times higher NOx emissions in real operation than in type-approval tests [40]. Similar research was also conducted by Merkisz et al., who performed tests on a hybrid vehicle [41].
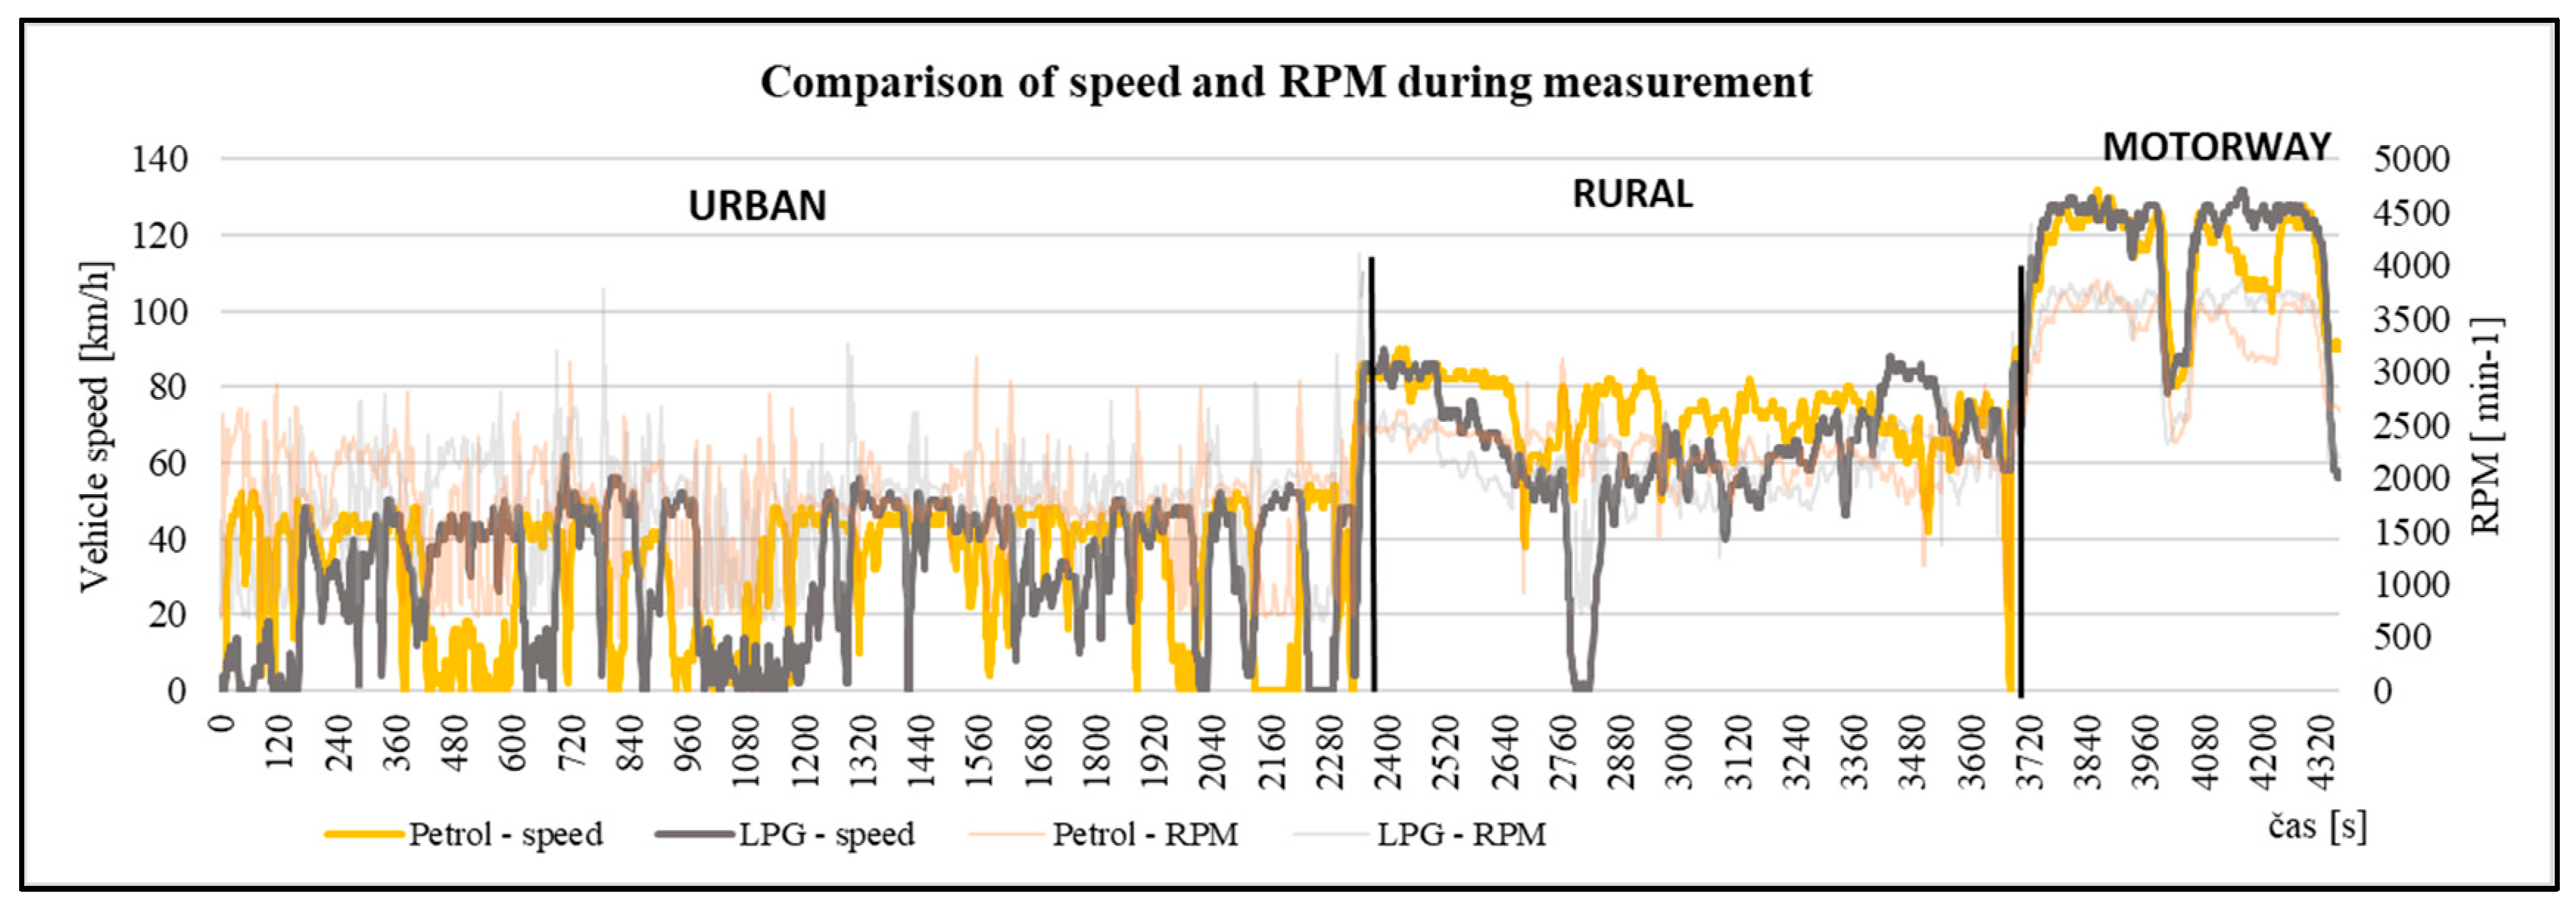
The performed measurement is reflected in Figure 4, where it is possible to monitor the speed and revolutions of the vehicle during the measurement procedure. Individual speeds and revolutions are compared to each other. From the graph, it is possible to observe the apparent division of the measuring section into the city part, the time spent outside of the city, and the portion of the course where the vehicle was on the motorway. The graph and the individual curves correspond exactly to these divisions.
3. Methodology, Measuring Technology and Tested Vehicle
According to the Regulation described above, the RDE test also includes a PEMS (portable emissions measurement system) device. Due to its high procurement value, such a system (equipment) was, unfortunately, not available when conducting our research. Due to the above-described possibilities of determining the amount of emission production, this PEMS system can be replaced by a conventional exhaust gas analyzer. This task can also be provided by the mentioned exhaust gas analyzer. Giechalskiel et al. has addressed the uncertainty of PEMS in their research. Based on experimental data received from the stakeholders of the RDE technical working group in 2017, two NOx margin scenarios of 0.24–0.43 were calculated, accounting for different possible zero-drift behaviour assumptions of the PEMS during the tests [42].
The whole procedure and the calculation of the amount of emissions produced are governed by Regulation 2017/1151. On the basis of the calculation of emissions under this Regulation, it is possible to determine the emission of the individual components in g/s. The amount of air mass flow was recorded by the OBD diagnostic application Torque Pro. The recording frequency was 1 Hz. The lambda calculation formula was also used to calculate the emissions according to known regulations. The individual procedures by which it is possible to determine the amount of exhaust emissions are also enshrined in renowned publications [24,25]. The sum of the individual points thus provides the mass of the individual emission components for the entire duration of the measurement route. In order to be able to further process the individual data up to the comparison value (g/s), it is necessary to perform several calculations. An important part of the performed measurement is the data from the engine control unit, which are recorded by diagnostics via OBD connection. For the purposes of calculating the individual emission components, it is necessary to record data such as:
- RPM;
- Vehicle speed;
- Mass air flow.
Individual data were recorded in two different ways:
- Exhaust emissions production—Exhaust gas analyzer;
- Data from the engine control unit—ELM 327 diagnostic equipment.
After exporting the data to a PC, mutual synchronization was necessary. For simplicity, the recording frequency was set to 1 s, which ensured the possibility of pairing the exported data. A detailed description of the methodology for calculating the individual exhaust gas components is elaborated upon by Kuranc et al. [43].
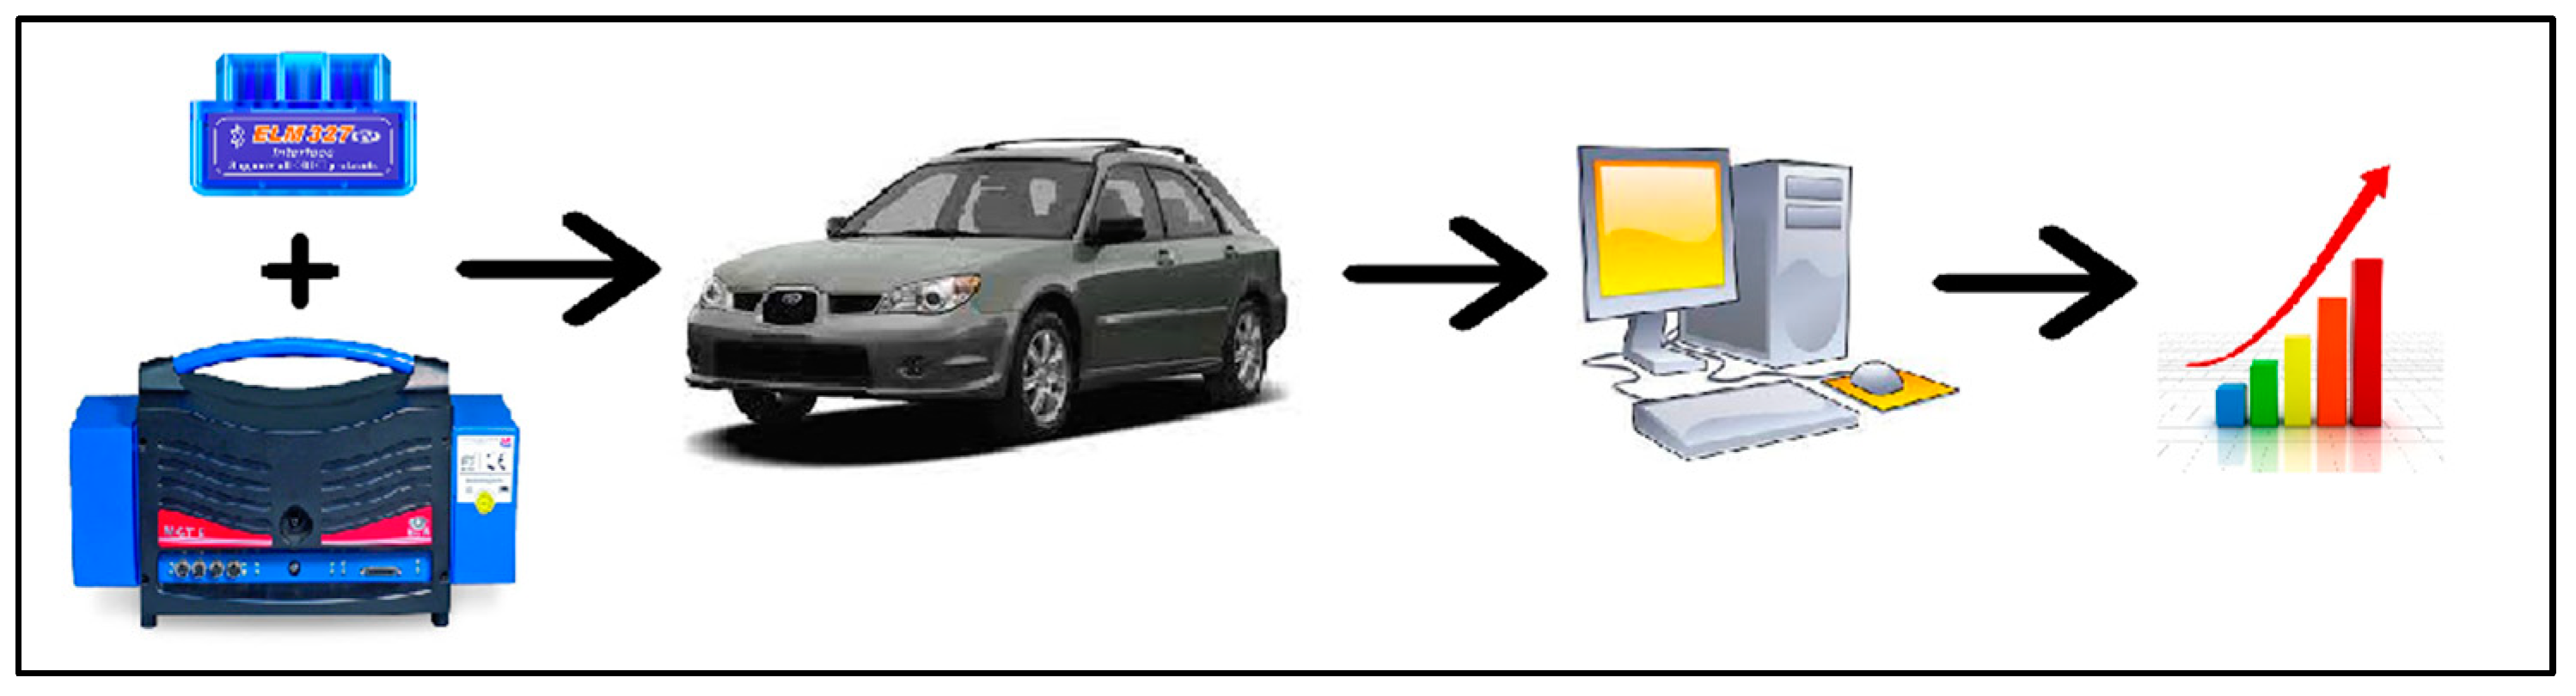
As seen in Figure 5, several devices were involved in the measurement. By connecting and setting them up correctly, we were able to record the required data according to RDE conditions and were then able to calculate specific exhaust emission values while driving.
It is necessary to state that the chosen measuring technique is not primarily intended for the purposes of obtaining a specific measurement. Compact instruments (PEMS) are currently being developed for this type of measurement (RDE). They can record the data and then provide the required values directly without the need for any adjustments. This means that no synchronization of the recorded data or the connection of other measuring technology are required. The PEMS measuring device contains all of the necessary sensors. During our measurements, we were able to replace such a measuring device, but after the measurements, it was necessary to work with the measured data and to adjust them in the next steps. After examining the current market offers in the field of PEMS equipment, the authors found that the price of such equipment ranges from EUR 91,000 (Cubic—Ruiyi, China) to EUR 150,000 (Senzors—Germany). Of course, these price offers are not available on the Internet, and as part of the research, we approached selected companies [internal data provided on request].
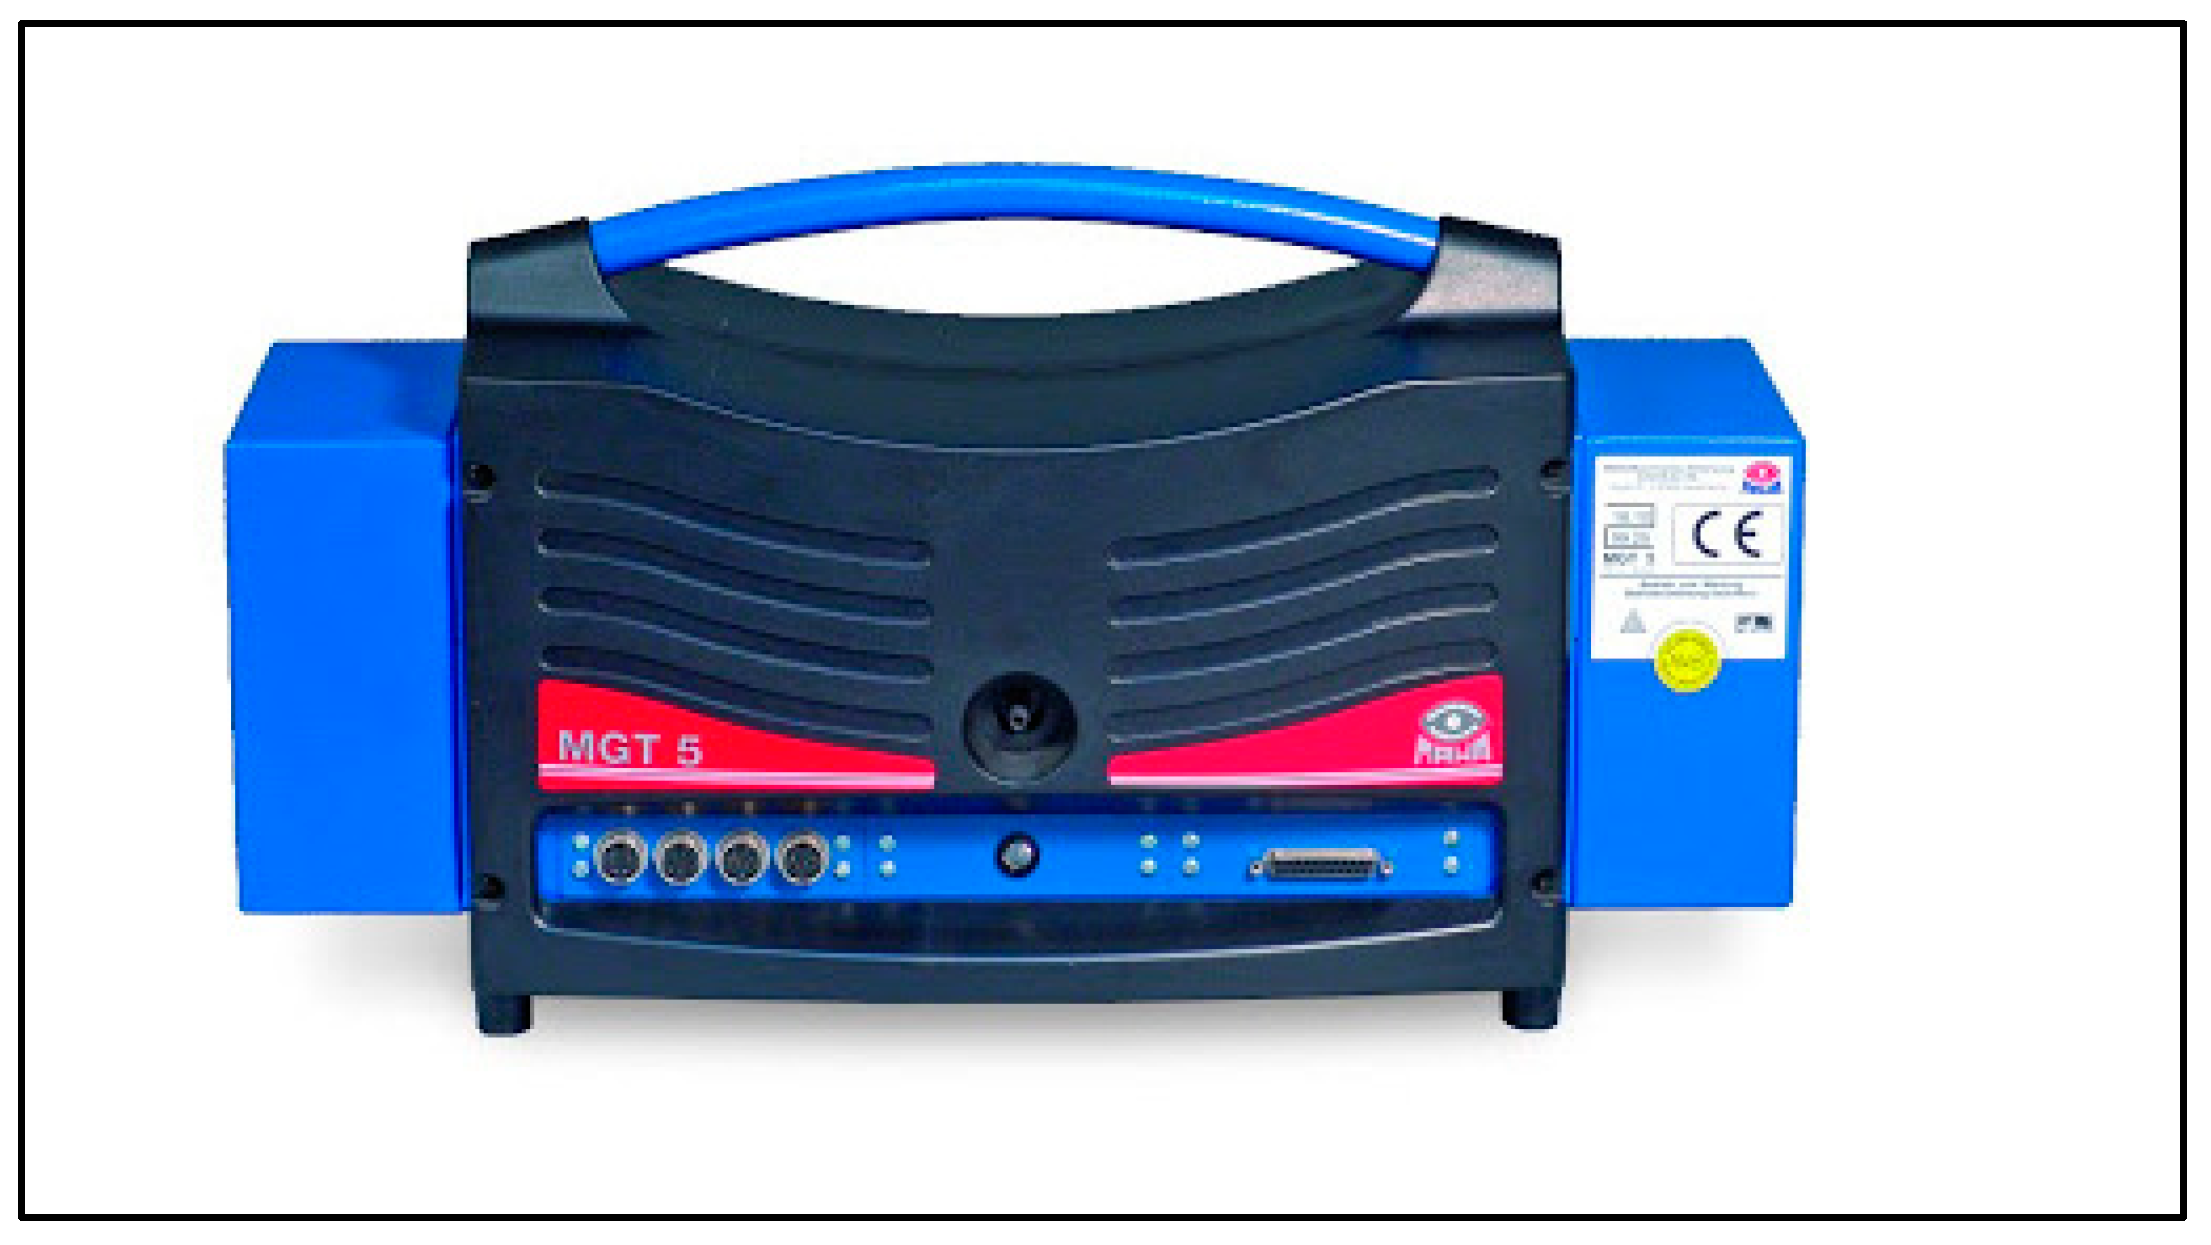
3.1. MAHA MGT 5 Exhaust Gas Analyzer
A low-current emission tester Maha MGT 5 (Figure 6) without a display (basic unit) was used for HC, CO, CO2, and O2 analysis with lambda calculation. Basic exhaust gas analyzer technical data are in Table 2. In our case, the analyzer was also supplemented with a NOx sensor, which are not normally mounted in these devices. The analyzer is primarily intended to measure the emissions of a stationary vehicle (for example, when performing an emission inspection). The device is regularly calibrated in accordance with the applicable national metrological legislation. In our measurement, the analyzer was placed in the vehicle during the measurements and recorded data while driving through the individual sections. The data are processed using specialized software from the manufacturer—Maha Emission Viewer. This allows the exhaust gas components to be recorded (in % or ppm).
The analyzer was further equipped with an active condensed water separator using a separate diaphragm pump. It also had other functions comprising automatic hose cleaning and a measuring unit with 2-point calibration [44].
During the measurement procedure, individual exhaust gas emissions were monitored. Their size is given in%. After the measurement, the values of the monitored emissions were processed in the Maha Emission Viewer program, and subsequently, individual production courses were created.
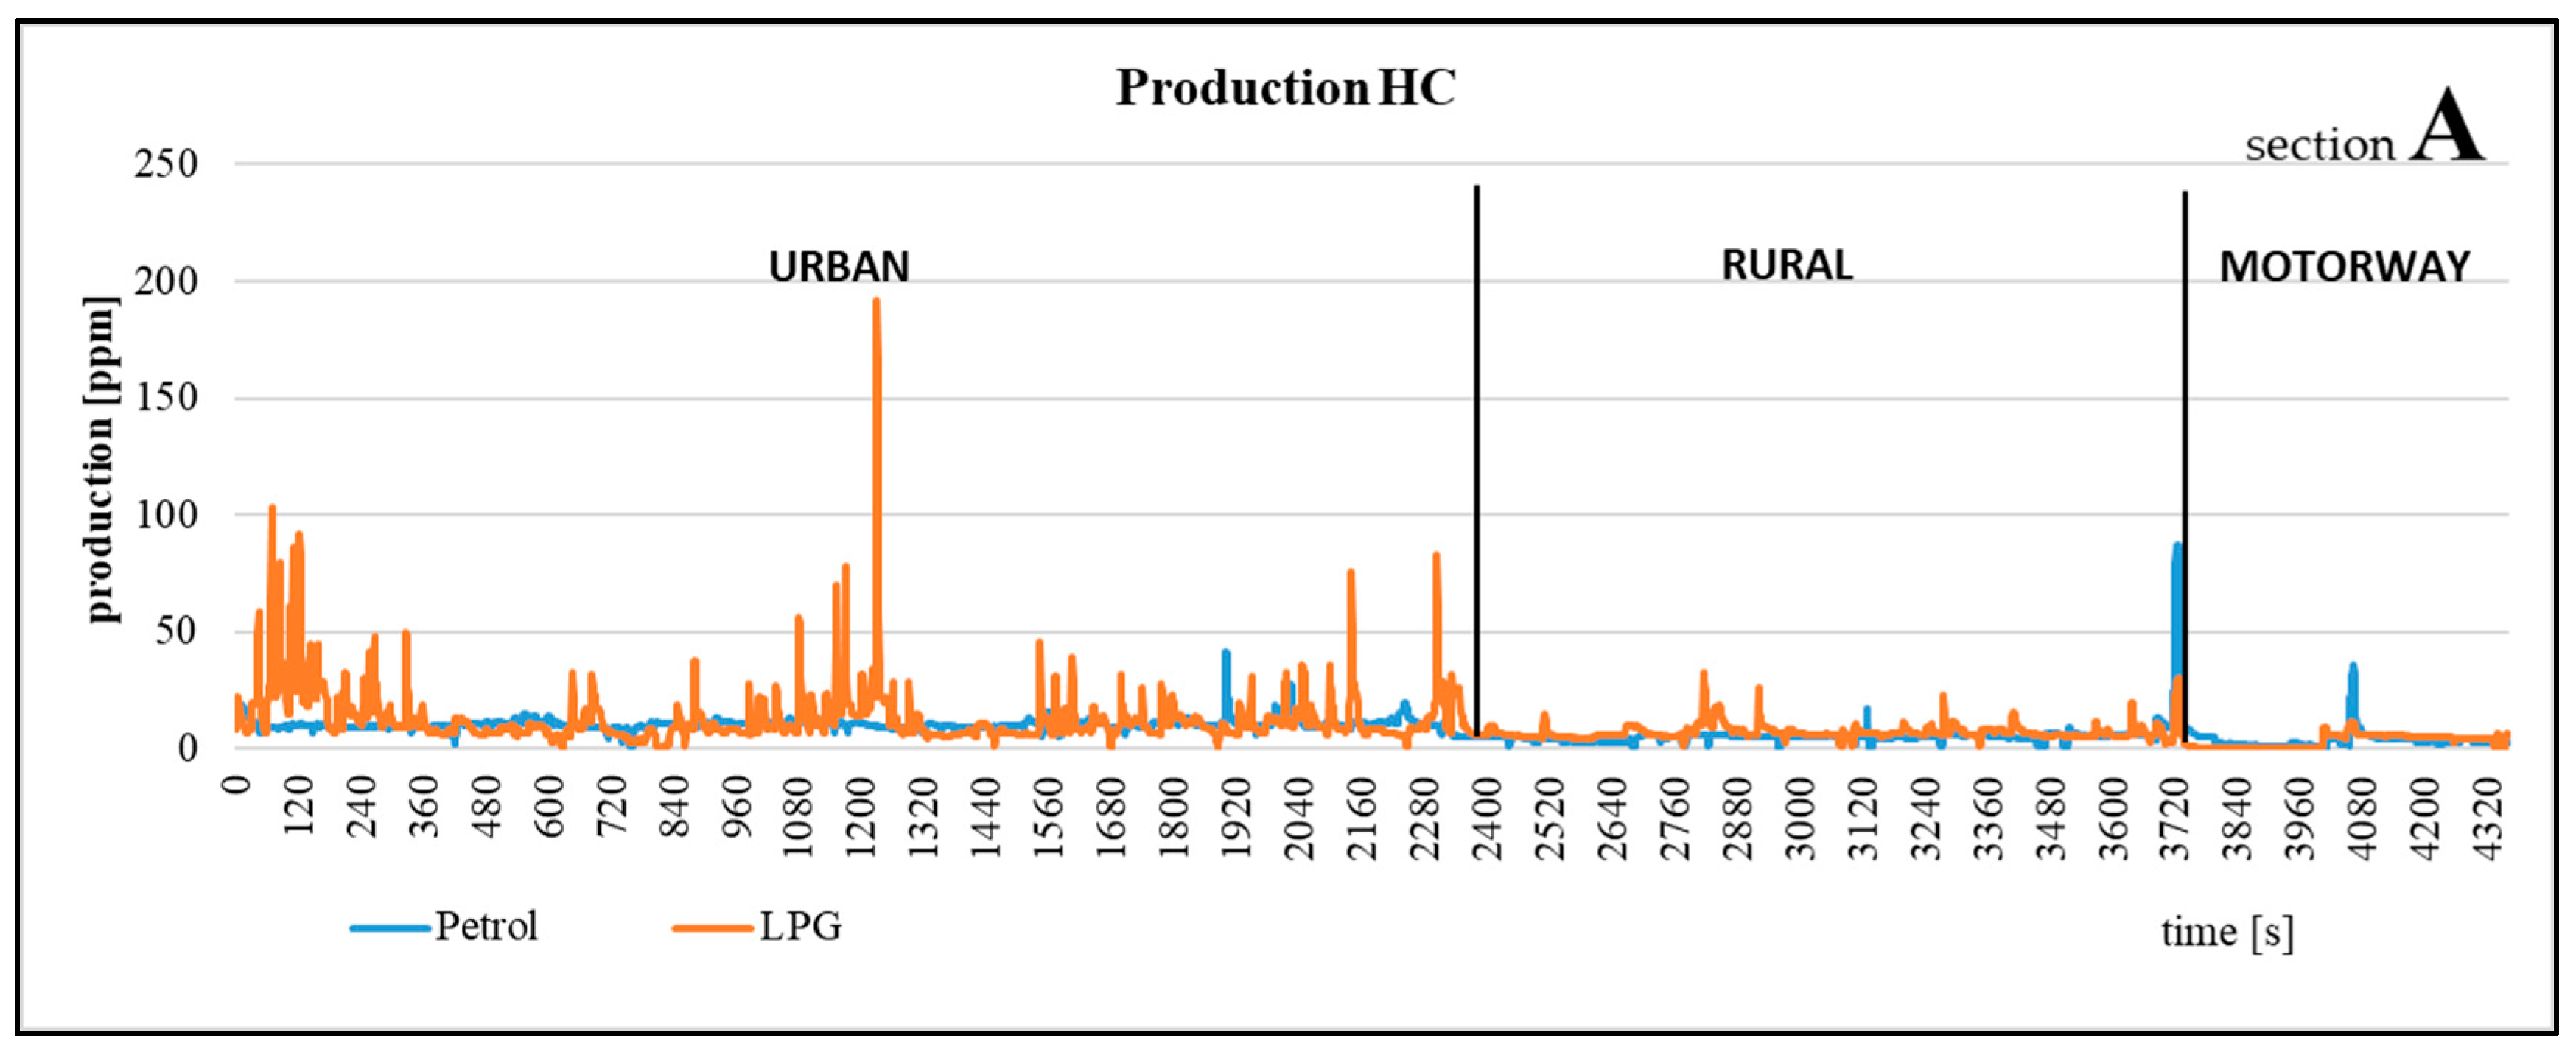
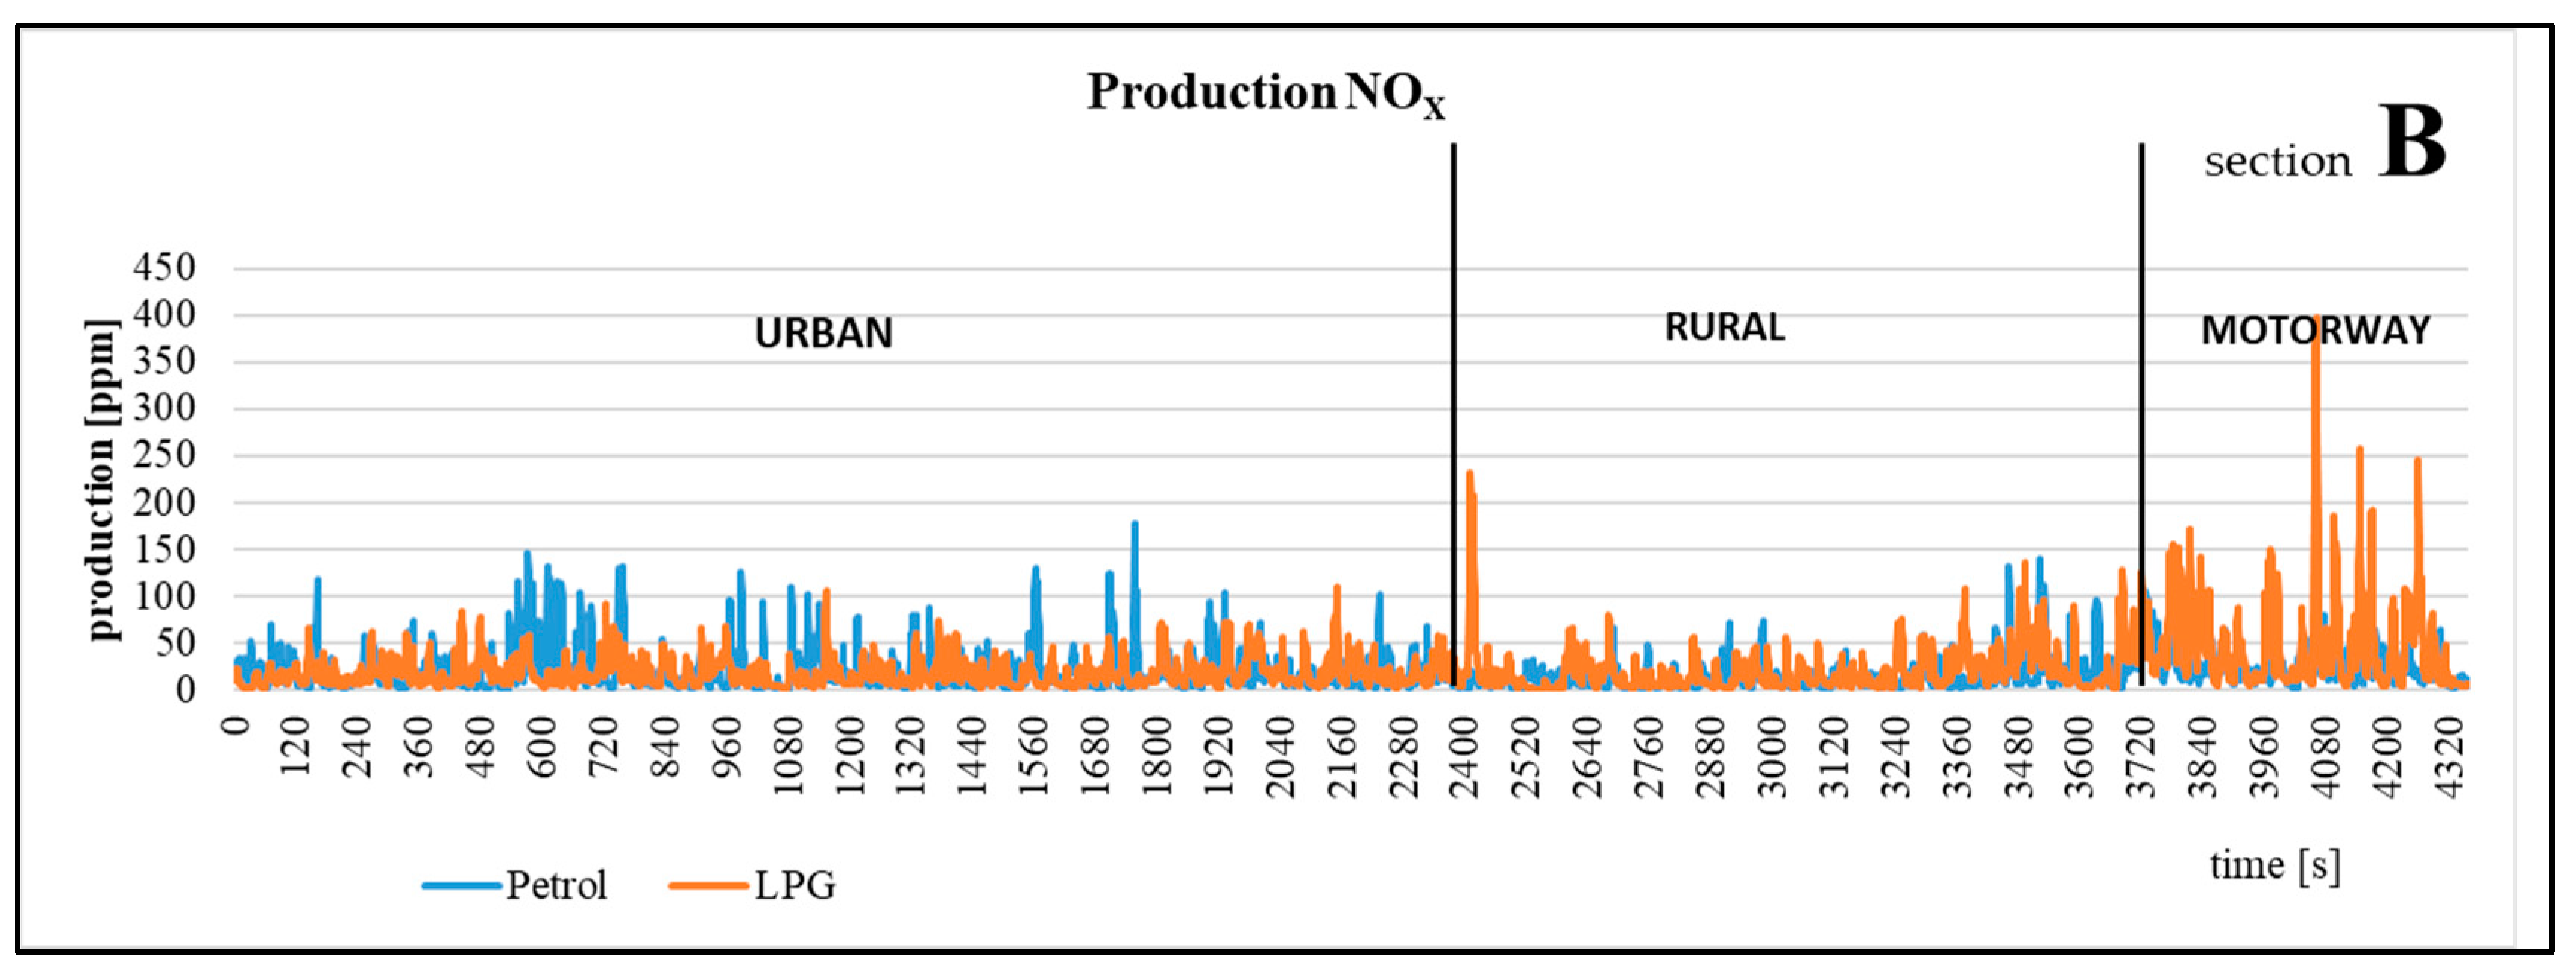
In Figure 7, it is possible to monitor the course of HC (section A) and NOx (section B) production while driving. The course of HC production is almost identical as the course identified in gasoline and LPG combustion. However, larger deviations can be observed in the LPG combustion in the urban part of the driving cycle. In the second part of the picture, we follow the course of NOx production, the production of which is higher during gasoline combustion higher. We can especially observe this phenomenon in the urban part of the cycle. However, when driving on a motorway section, NOx production is higher when burning LPG. This can be observed in the final part of the graph, where the orange curve (LPG) indicates high deviations. The CO and CO2 production processes can be seen in Figure 8 in the next section.
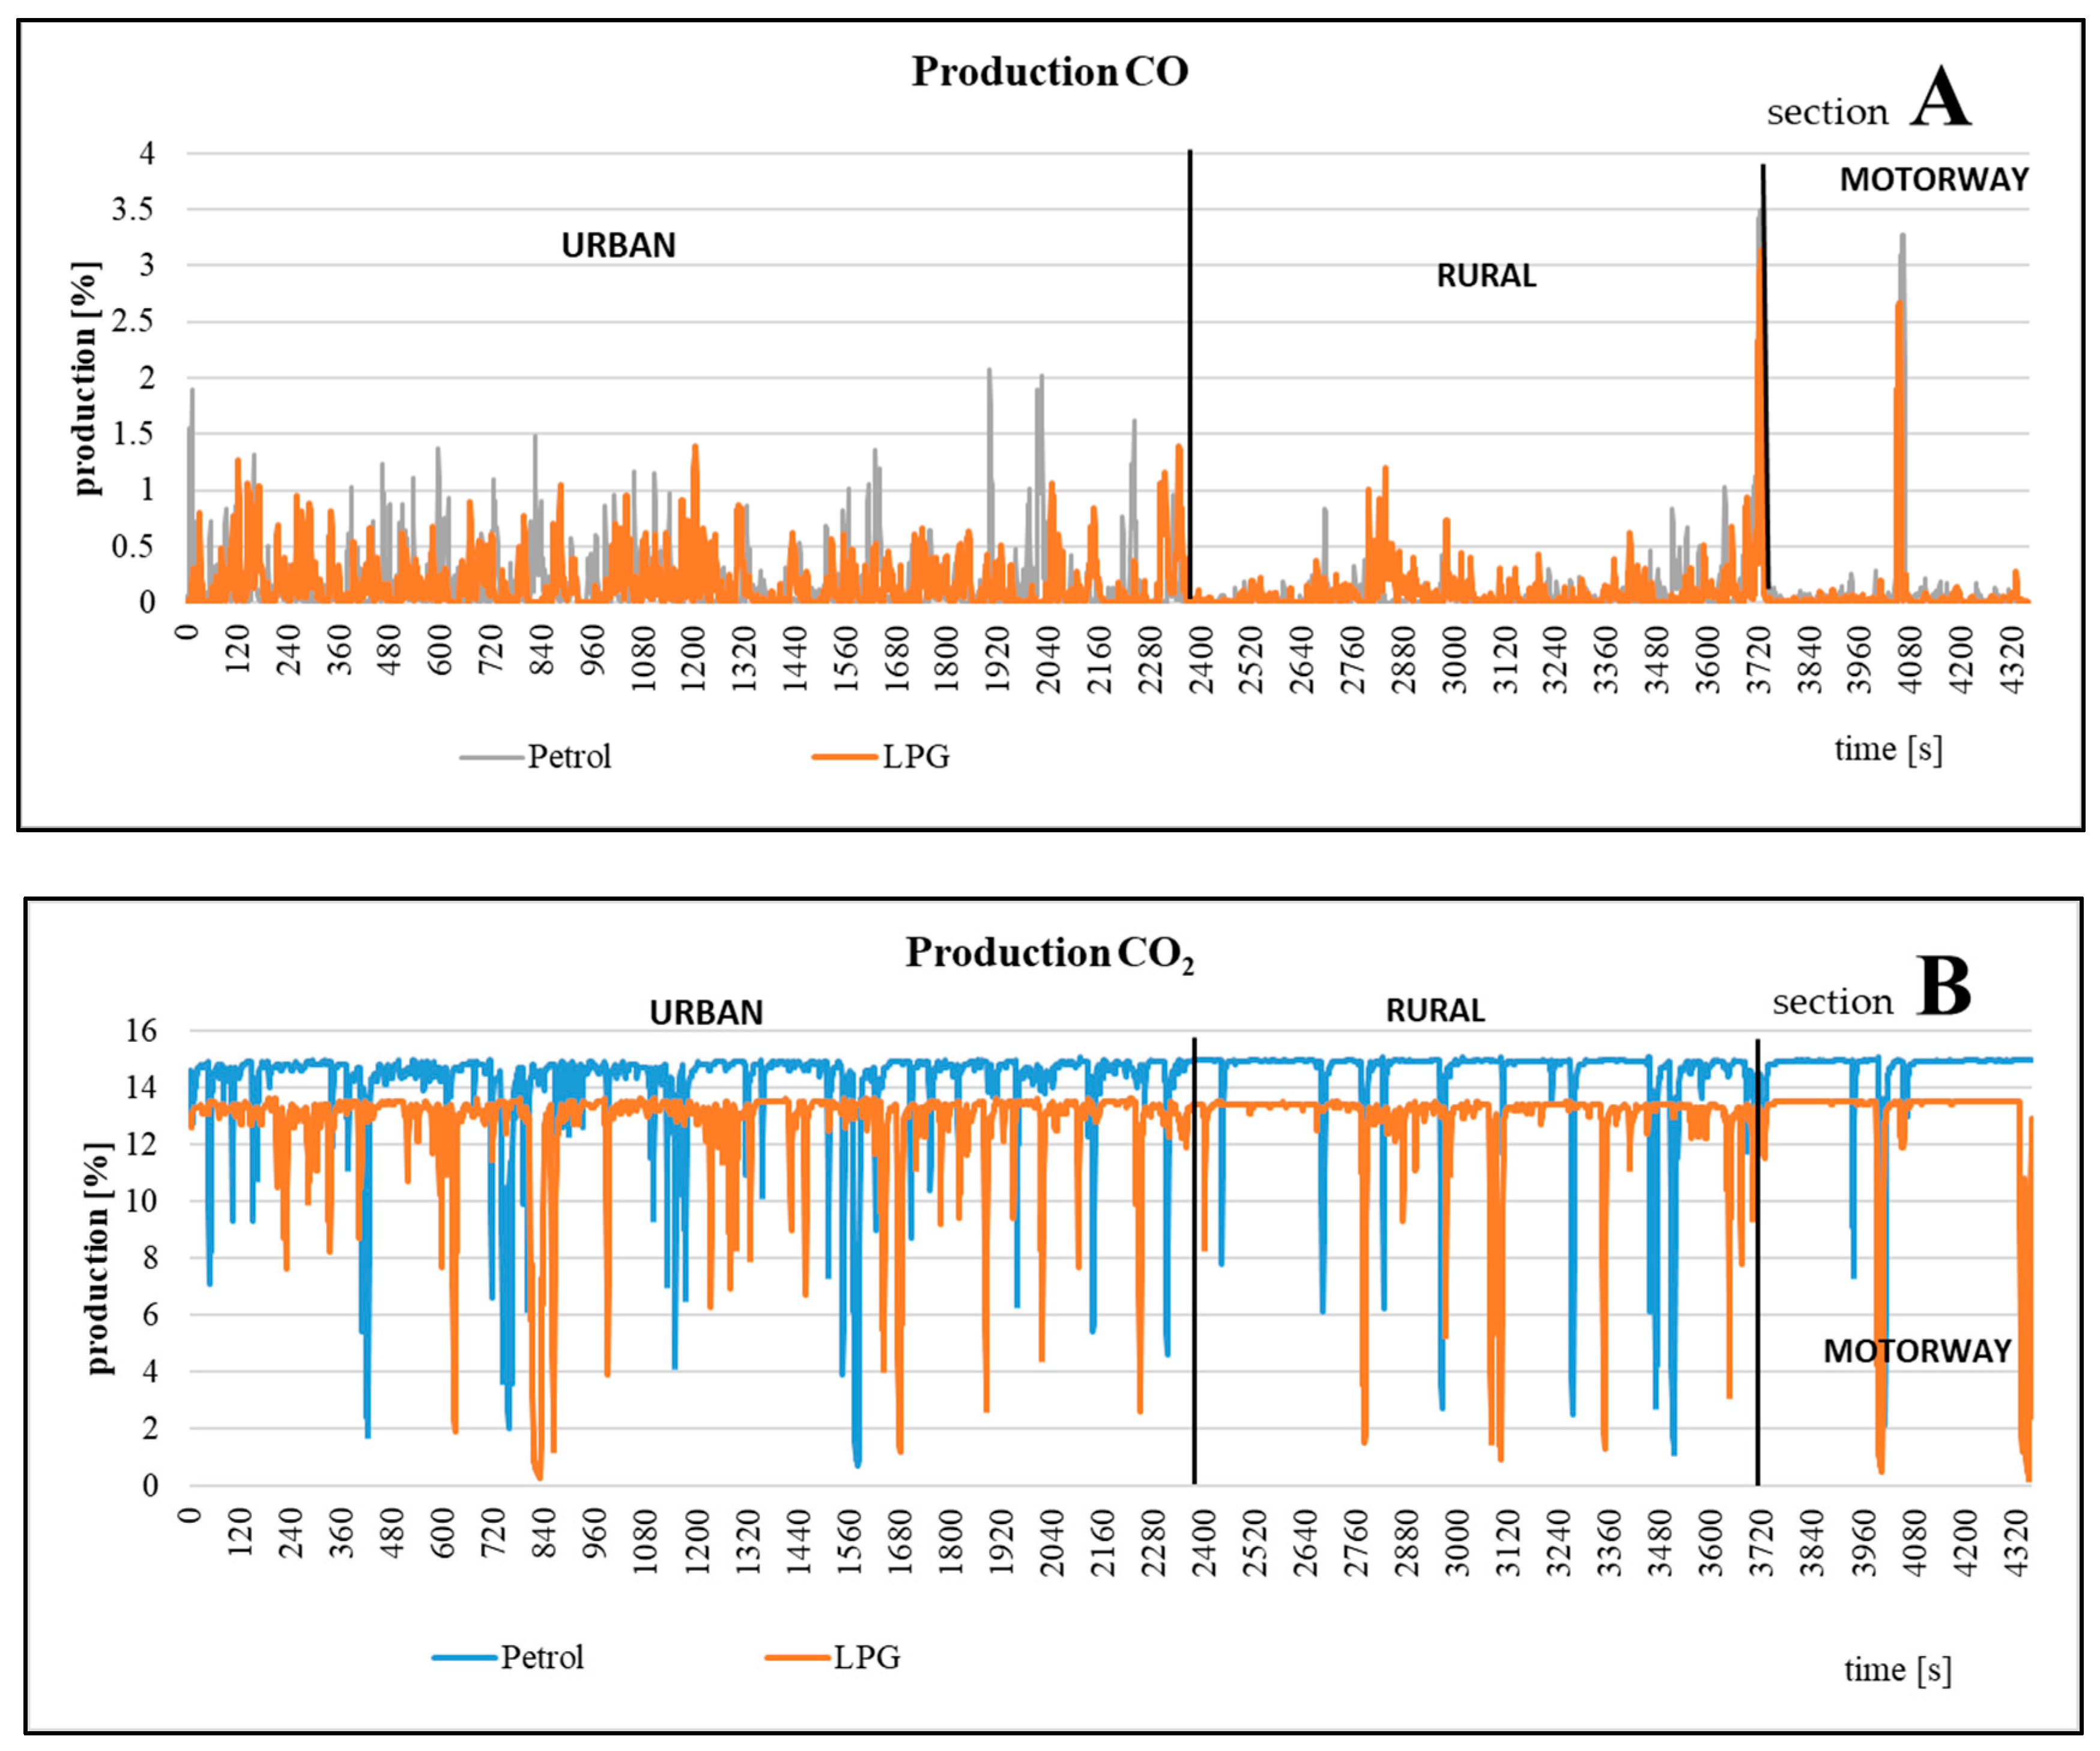
When monitoring CO production (section A), it is possible to state that the curves have an almost identical course, but the curve representing LPG combustion is located lower than the combustion curve of gasoline. The same is true when monitoring CO2 production (section B). The waveforms of the individual curves are identical, but the curve representing LPG combustion reaches a lower value in each monitored section of the measuring path.
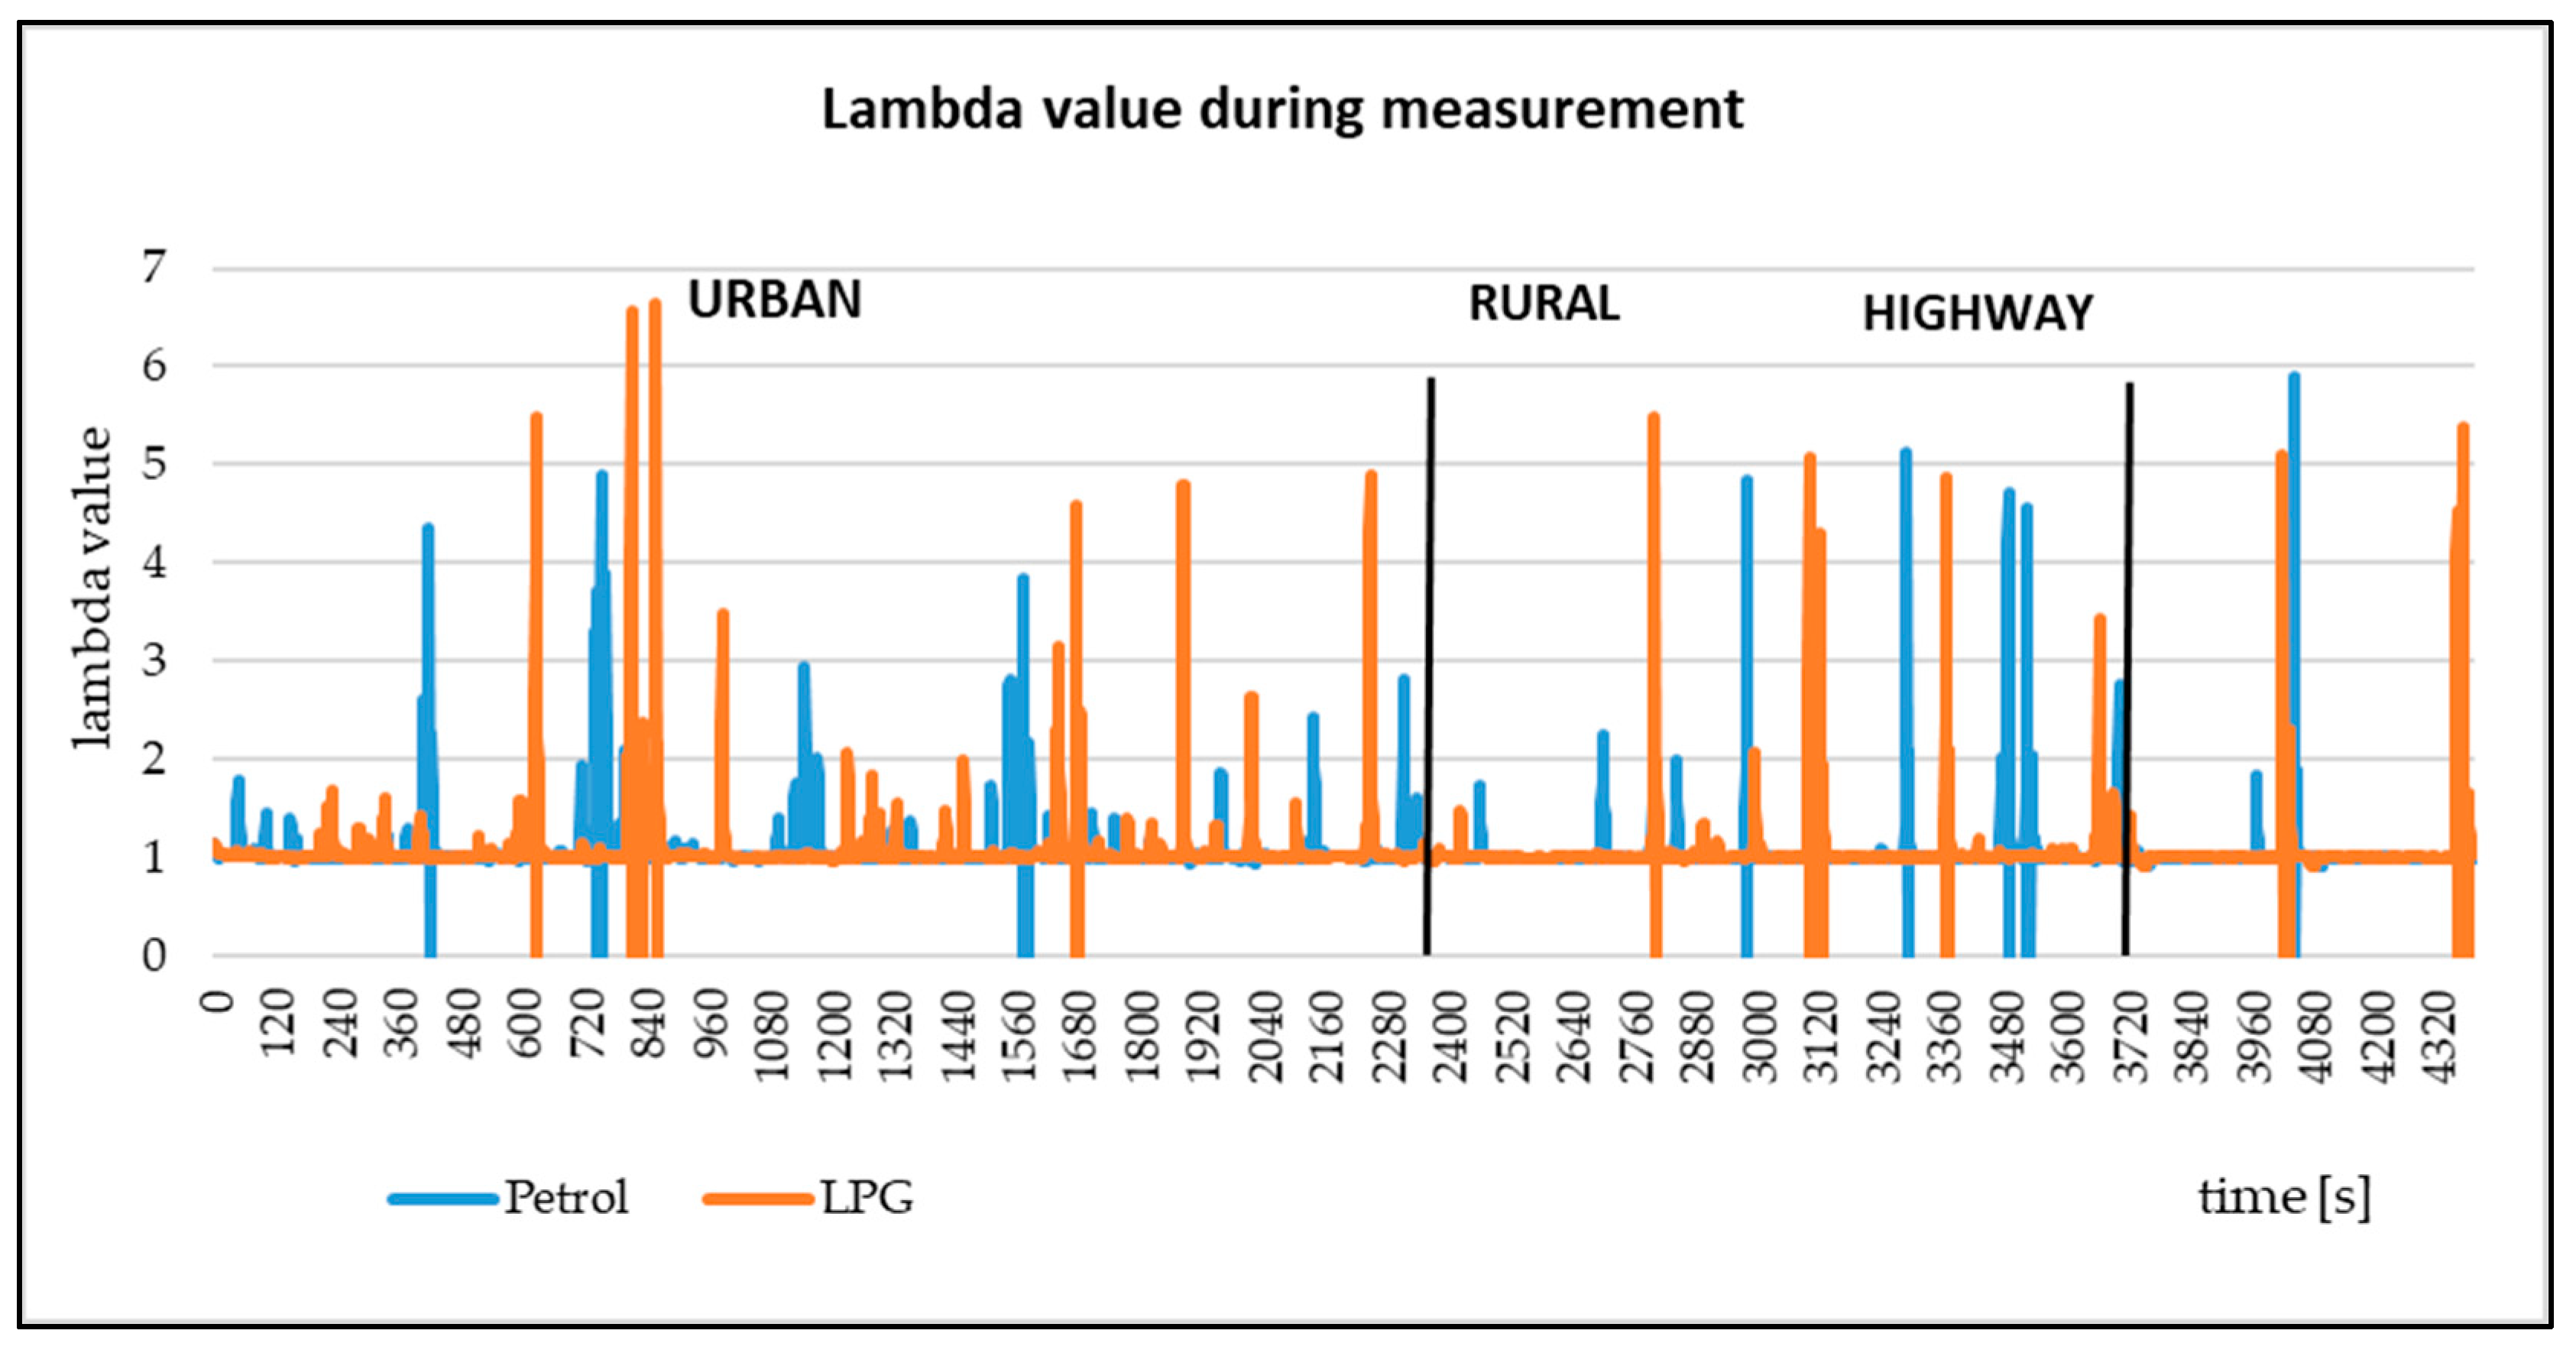
Figure 9 shows the lambda factor for both fuels. Since the emission measurement is in the form of a volume concentration, it cannot be deduced from the percentage of CO2 during the measurement of a higher CO2 concentration in %, which means a higher production in grams. The LPG vehicle was operated at a significantly higher fuel surplus coefficient value. It follows that there was also a significantly higher exhaust gas mass flow.
3.2. ELM 327 Diagnostic Tool
The key task for the measurement was to select the correct application and diagnostic tool. The research was carried out using the Torque Pro application (Bosch KTS 540, AutoCom and mobile application were analyzed) in connection with device ELM 327 Mini Interface (Figure 10). We chose the ELM 327 Torque Pro application to perform the measurements. The ELM 327 displays real-time detailed data such as engine speed, calculated engine load, coolant temperature, fuel system condition, vehicle speed, and more. It is also able to clear and identify fault codes written in the MIL engine control unit (“Check Engine” indicator light) [45].
The Bluetooth version of this device was chosen for the research. To log (upload) data, it is necessary to pair this device with a mobile application. For the measurements, the Torque PRO application was used. In this environment, the required data from the engine control unit started to be uploaded before the start of the ride. After the end of the measurement procedure (departure of the planned section of the route), data recording was stopped, and the data were further transferred to a PC for further processing.
3.3. Tested Vehicle
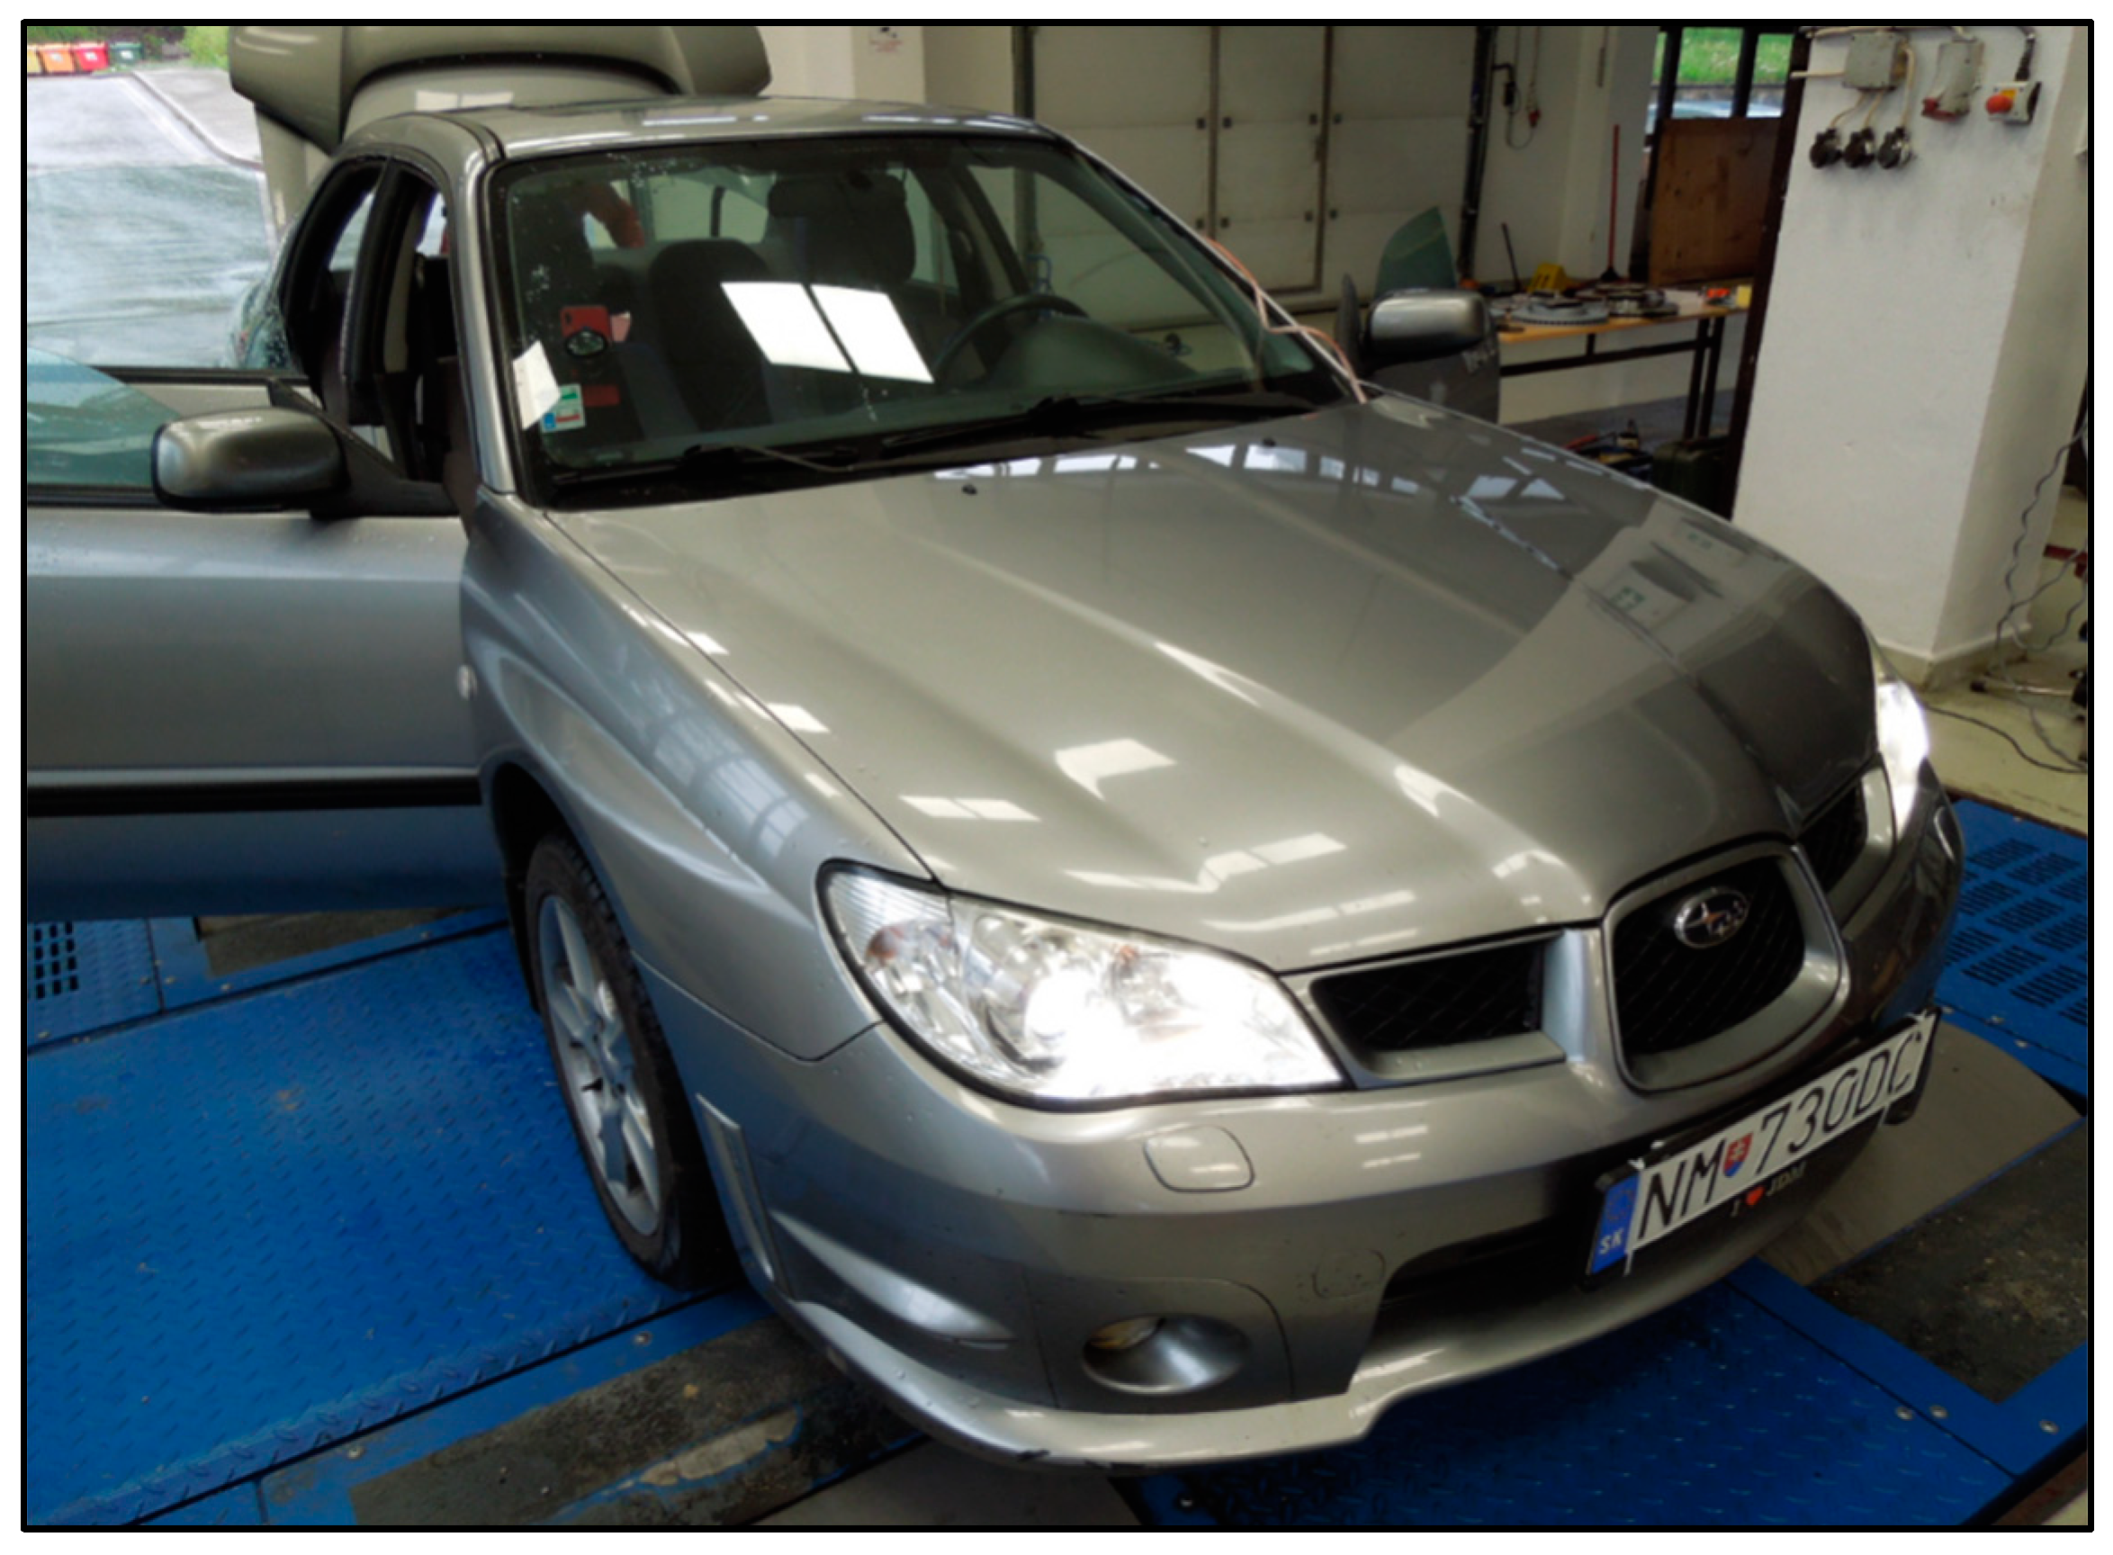
When performing the measurements according to the RDE, a Subaru Impreza vehicle (Figure 11) with technical parameters (Table 3) was selected, and the vehicle was powered by an internal combustion engine fueled by petrol. The vehicle is subject to the EURO 4 emission standard and meets the requirements of Council Directive 70/220/EEC. The vehicle and its power were not modified in any way before the measurements. The additional engine modifications could result in changes, which are described in the study by Mucková et al. [46]. To evaluate the production of emissions in the individual environments that were planned during the ride (city, out of town, highway), a vehicle powered by an alternative drive was also chosen. This drive was LPG. The tested vehicle was selected due to the availability of petrol/LPG dual propulsion. The vehicle underwent a valid technical inspection, and the gasifier underwent a regular inspection at the time of the test. Part of the test performance was to check the technical condition of the engine by reading the fault memory via OBD. The inspection was performed using a BOSCH KTS 560 device. With regard to the selection of the vehicle, it can be further argued that approximately 50,000 LPG vehicles are still in operation in the Slovak Republic, which represents approximately 5% of the total number of registered passenger cars with a petrol engine. However, in Central EU countries, we are seeing an increase in the number of LNG trucks. LNG-powered trucks represent a step forward in the field of alternative fuels and, in particular, in reducing the production of exhaust emissions from transport activities. The authors addressed this issue and have provided a detailed overview of low-emission fuels. Karczewski et al. confirmed that alternative fuels could be the key to reducing CO2 and other greenhouse gas emissions that are produced during the combustion process [33].
As already mentioned, it is a vehicle that meets the EURO 4 emission standard with type approval from 2006, is equipped with an I Knock sensor, and thus the adaptive power of the engine control unit. The measured vehicle has only one type of fuel (petrol) from the manufacturer, and it was rebuilt for LPG combustion (additionally installed LPG combustion system). By building a vehicle, the operating mass of the vehicle changes to LPG. It will increase by 70 kg. In the case of the present research, the vehicle was rebuilt before the start of the measurement, which means that the change in operating mass does not affect the conclusions and results of the research. The vehicle had a mileage of 350,000 km during the measurement. When the gasifier was installed, the vehicle had a mileage of 175,000 km. Under the conditions of the Slovak Republic, vehicle emissions from such a conversion are no longer controlled. It is also important to say that there was no RDE methodology at the time of vehicle production, meaning that the emissions provided by the manufacturer at type approval were not based on real driving. In the Slovak Republic, there is a strict method for operating dual-powered vehicles (petrol/LPG). A vehicle that can run on LPG must only be converted into approved gas installation facilities. The tested vehicle had a Teleflex gasifier. This device was retrofitted to the vehicle at the request of the owner. The installation of such equipment also includes other vehicle modifications. During these modifications, a gas tank of another component was installed. Complete vehicle conversion includes the installation of a pressure relief valve, evaporator, injectors, and a control device. All of these components are necessary for the correct operation of the LPG system in the measured vehicle. Prior to the measurement, the vehicle was already running on LPG. This means that the retrofit was duly approved and that the vehicle has been tested in and has met all of the requirements.
4. Results
The measured data from the exhaust gas analyzer as well as the diagnostic equipment were transferred to a computer, where they were processed in the MAHA Emission Exhibition Viewer and Microsoft Excel software. After completing the previous steps, we received data that could be compared with each other and further evaluated [43].
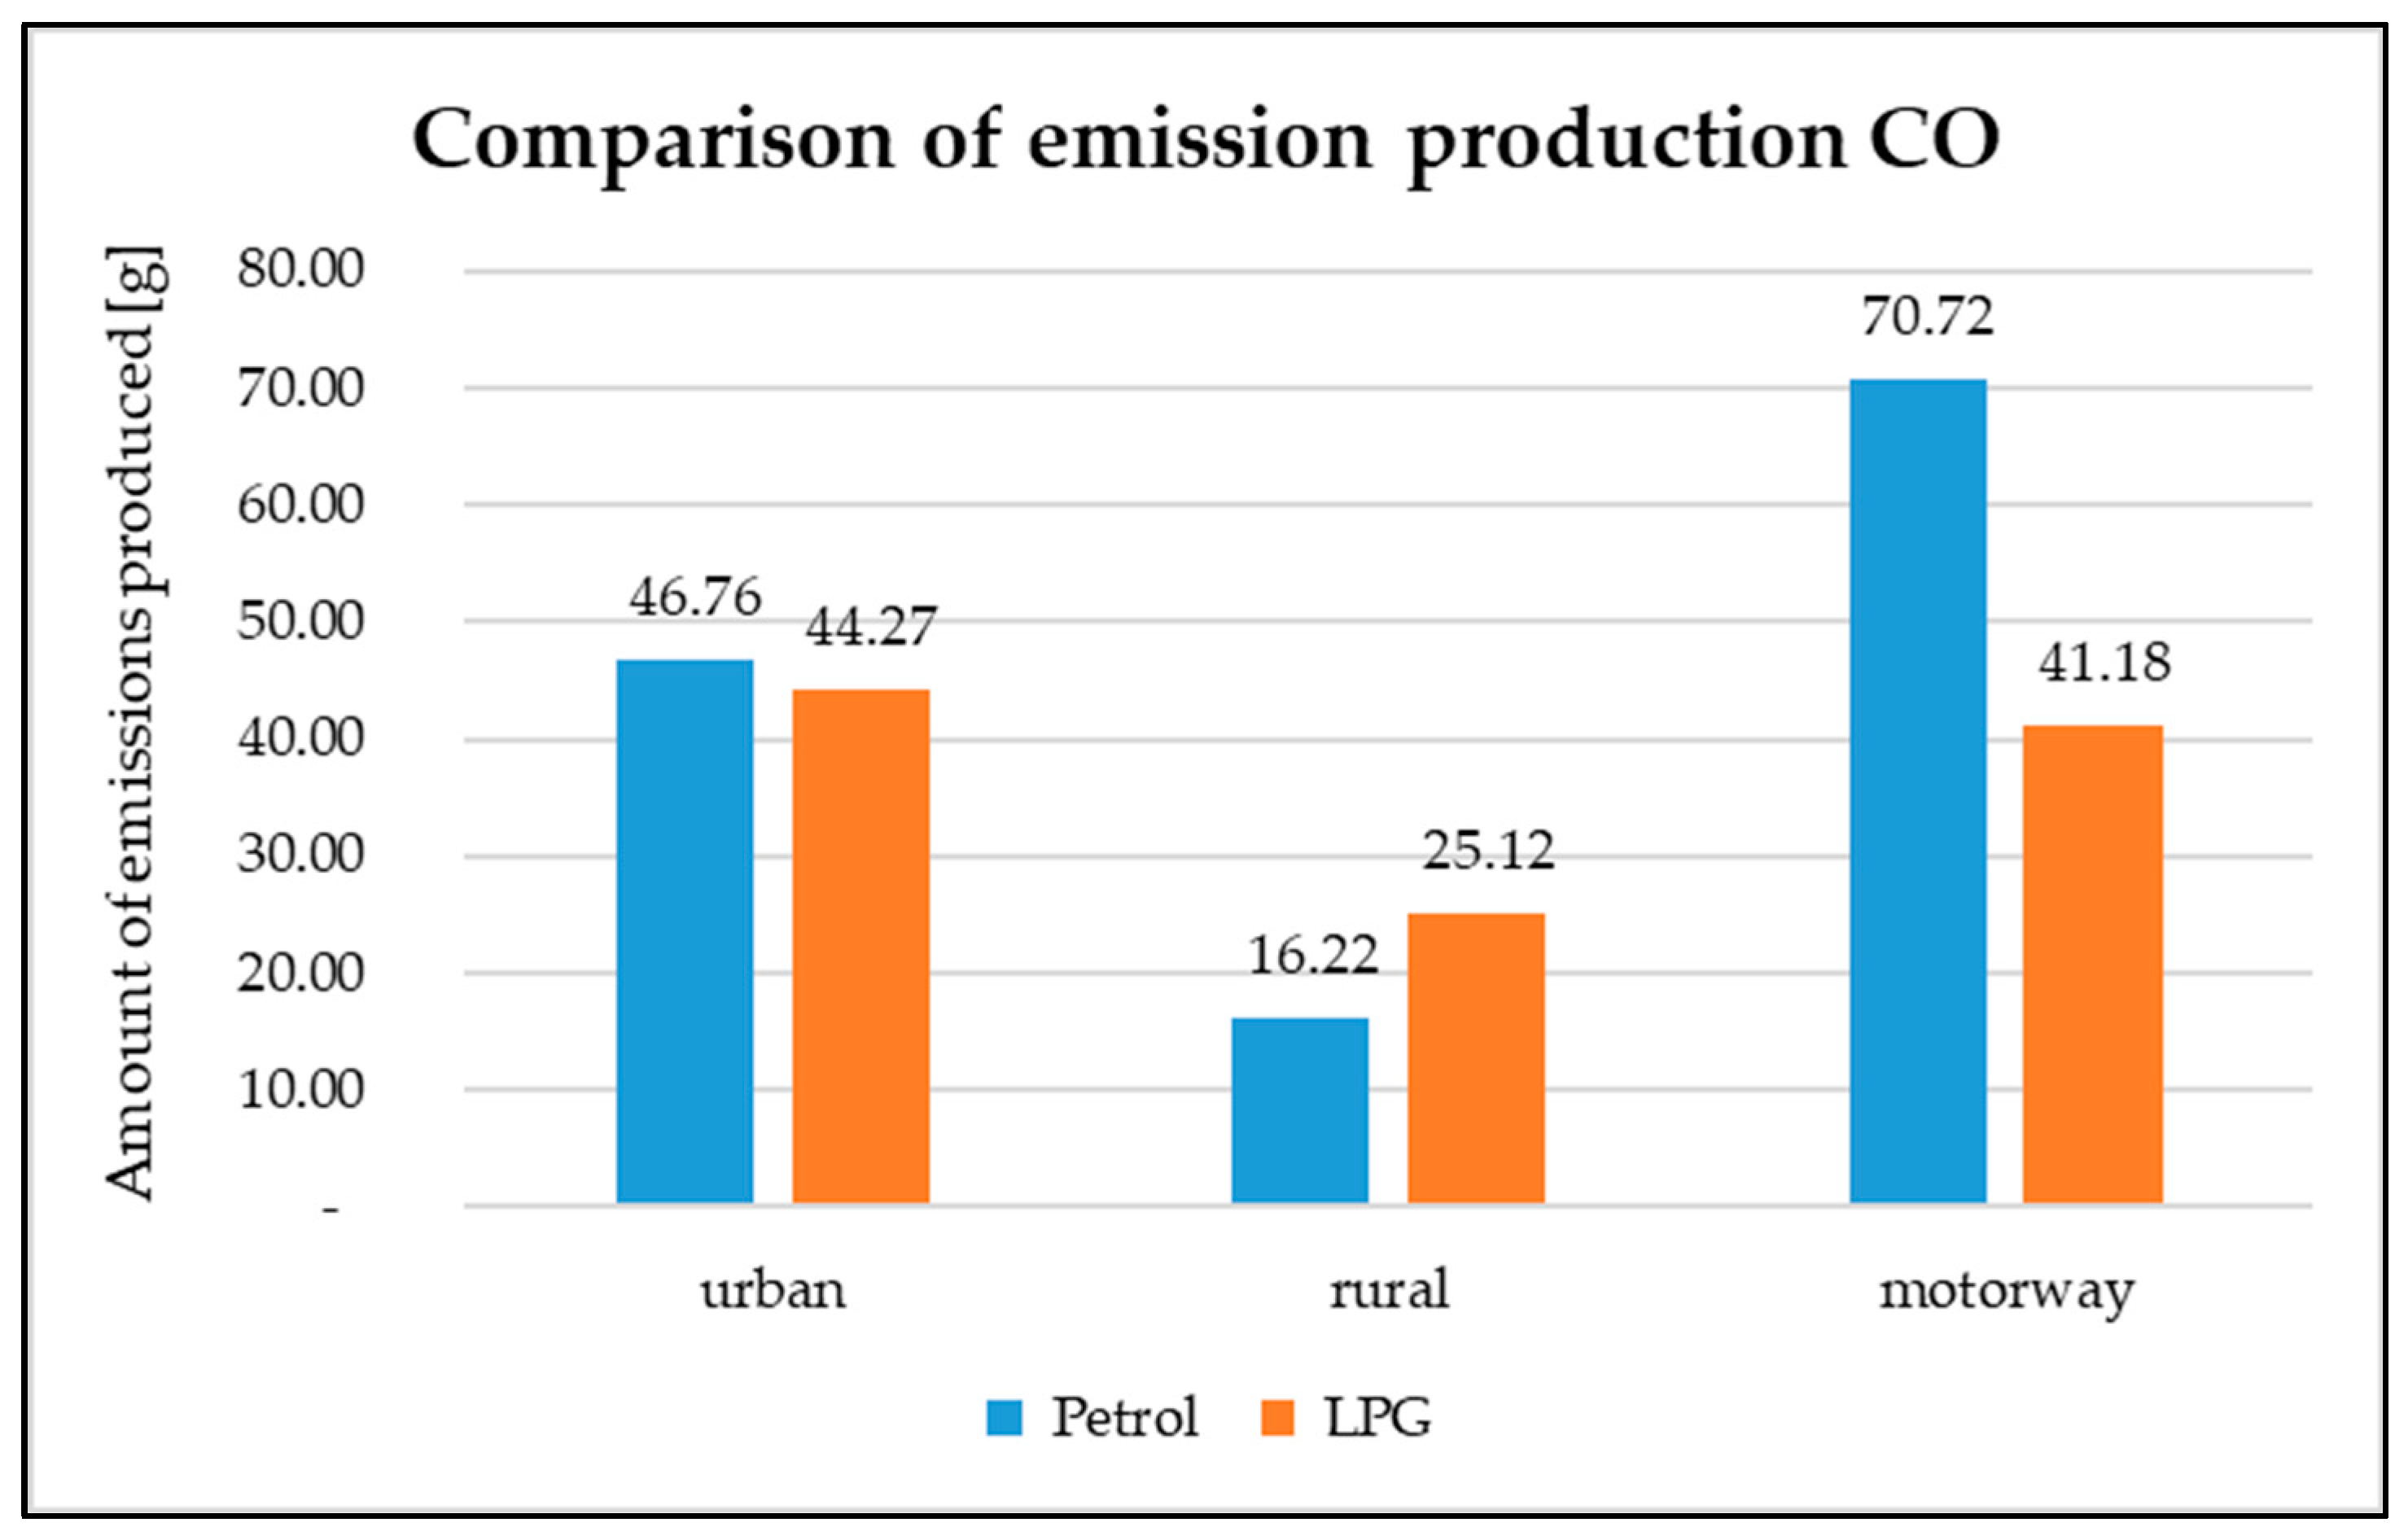
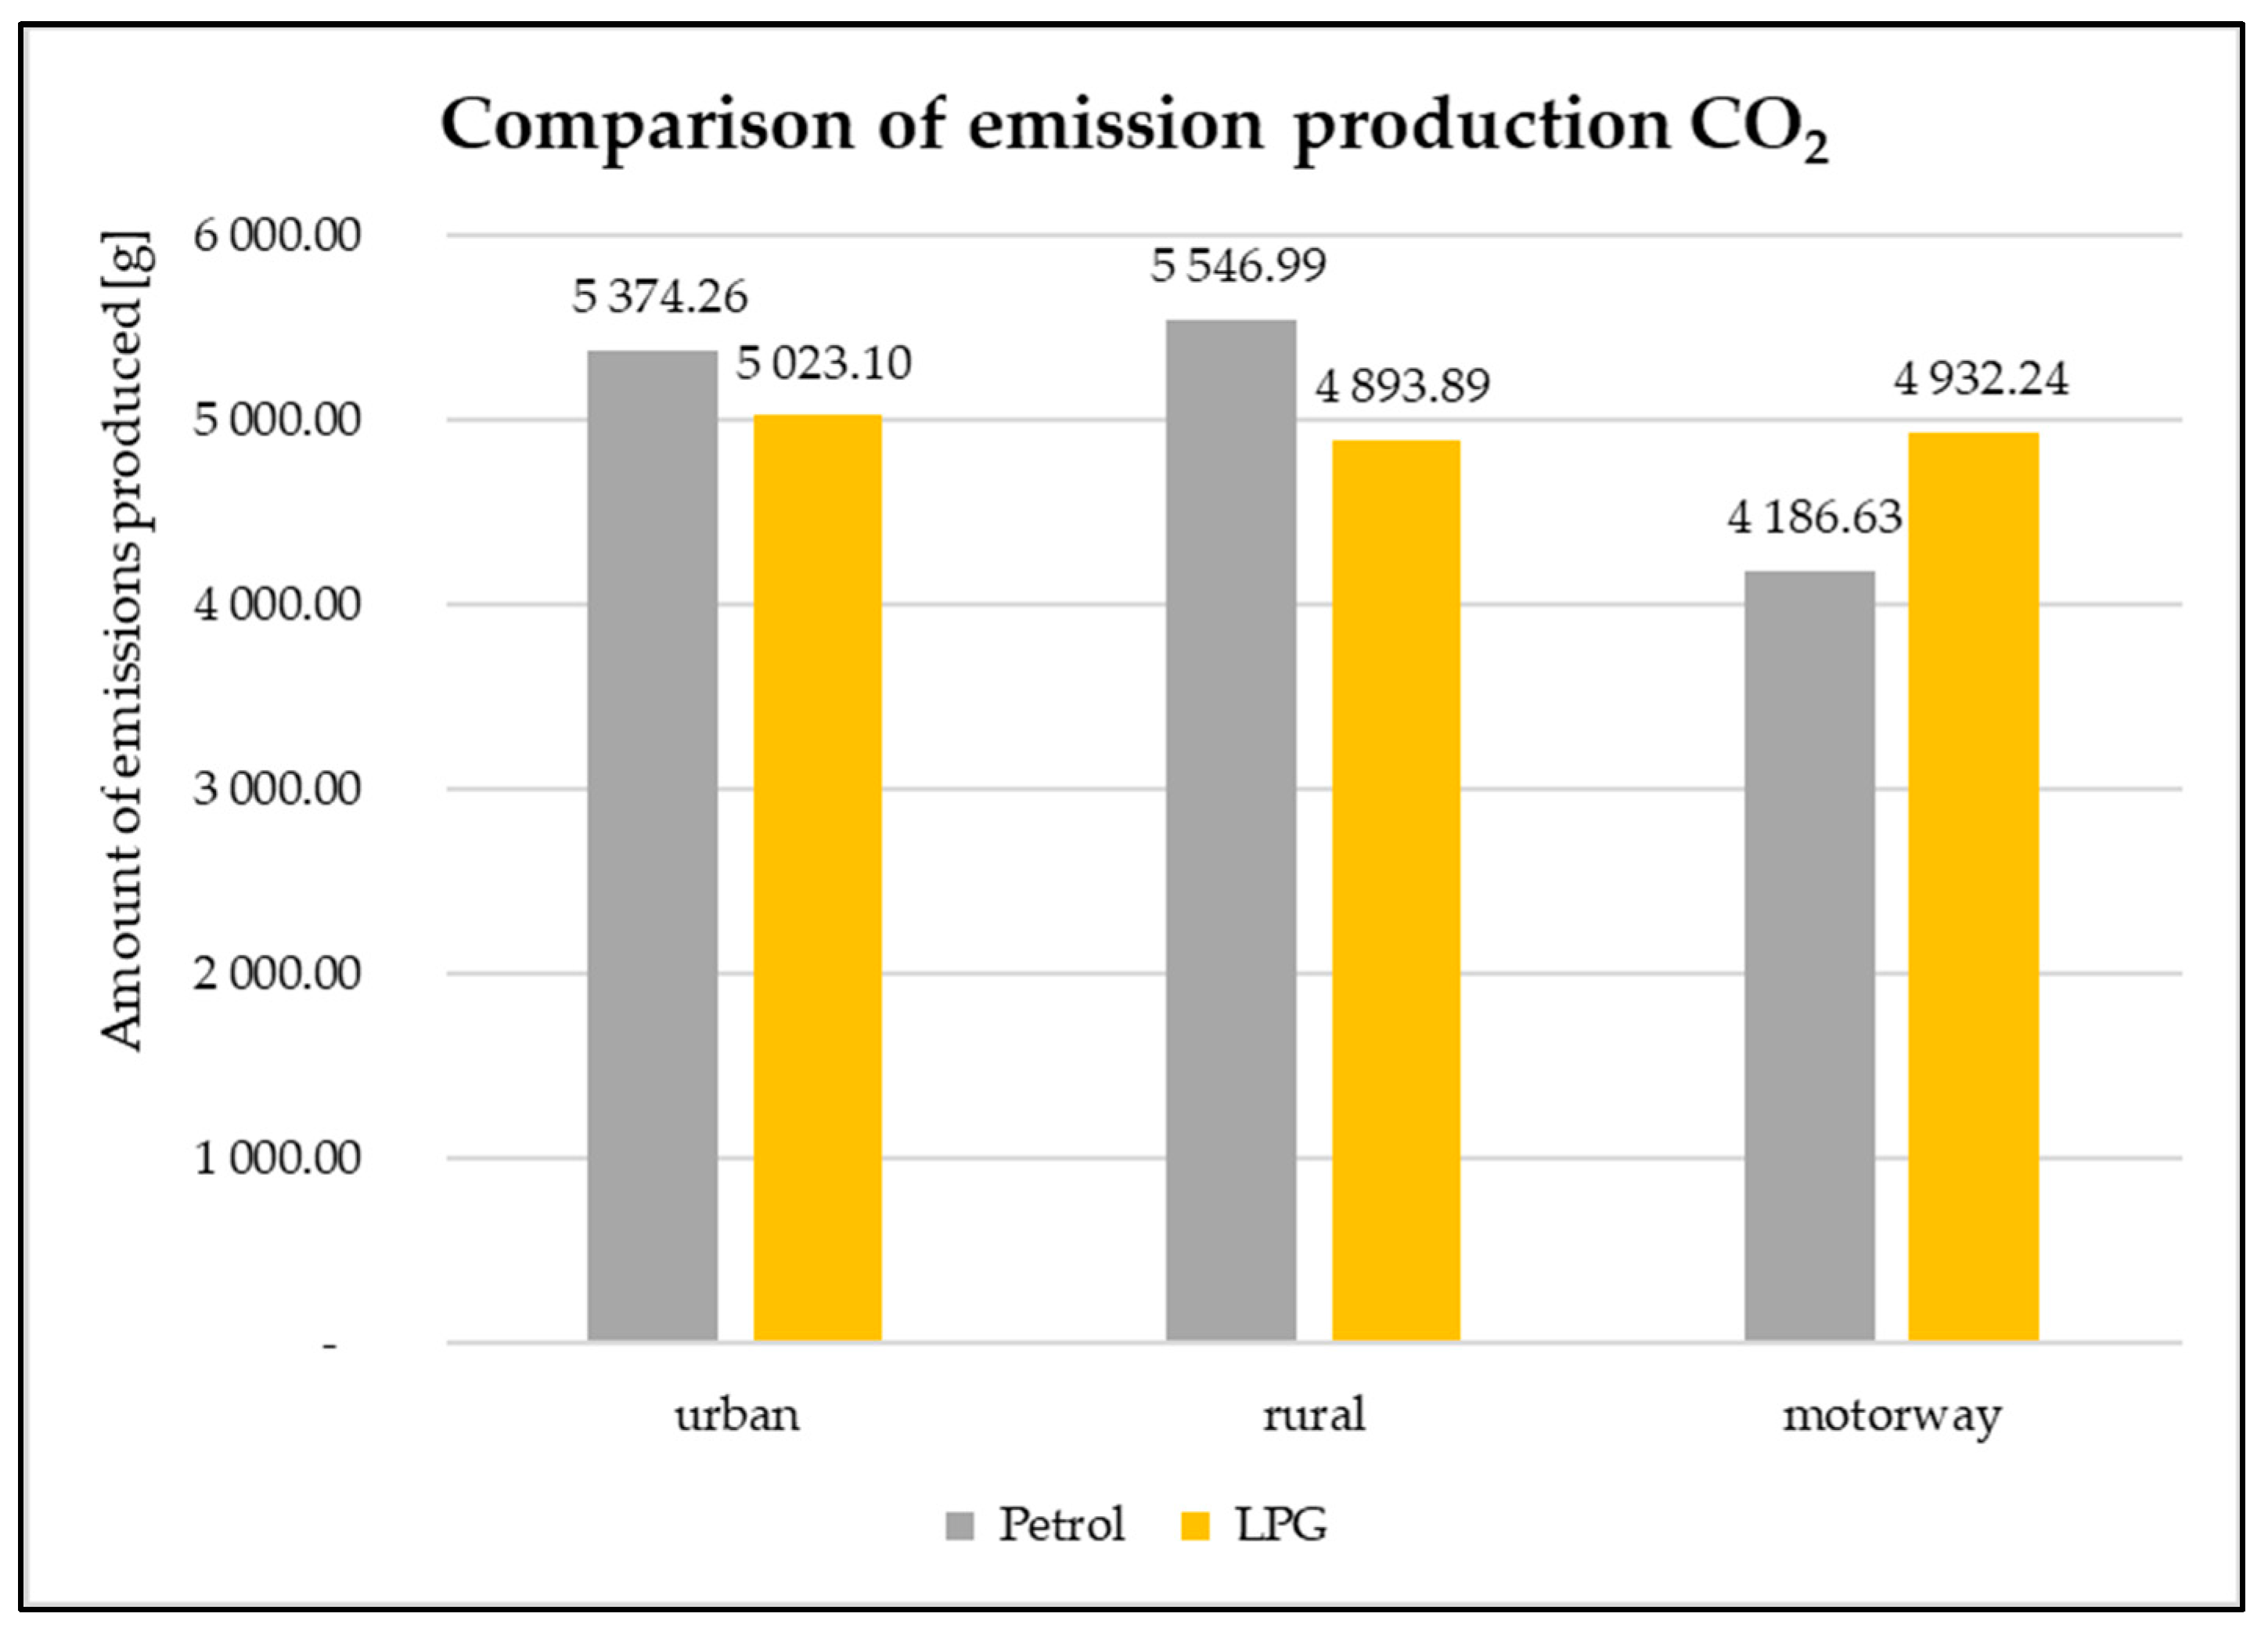
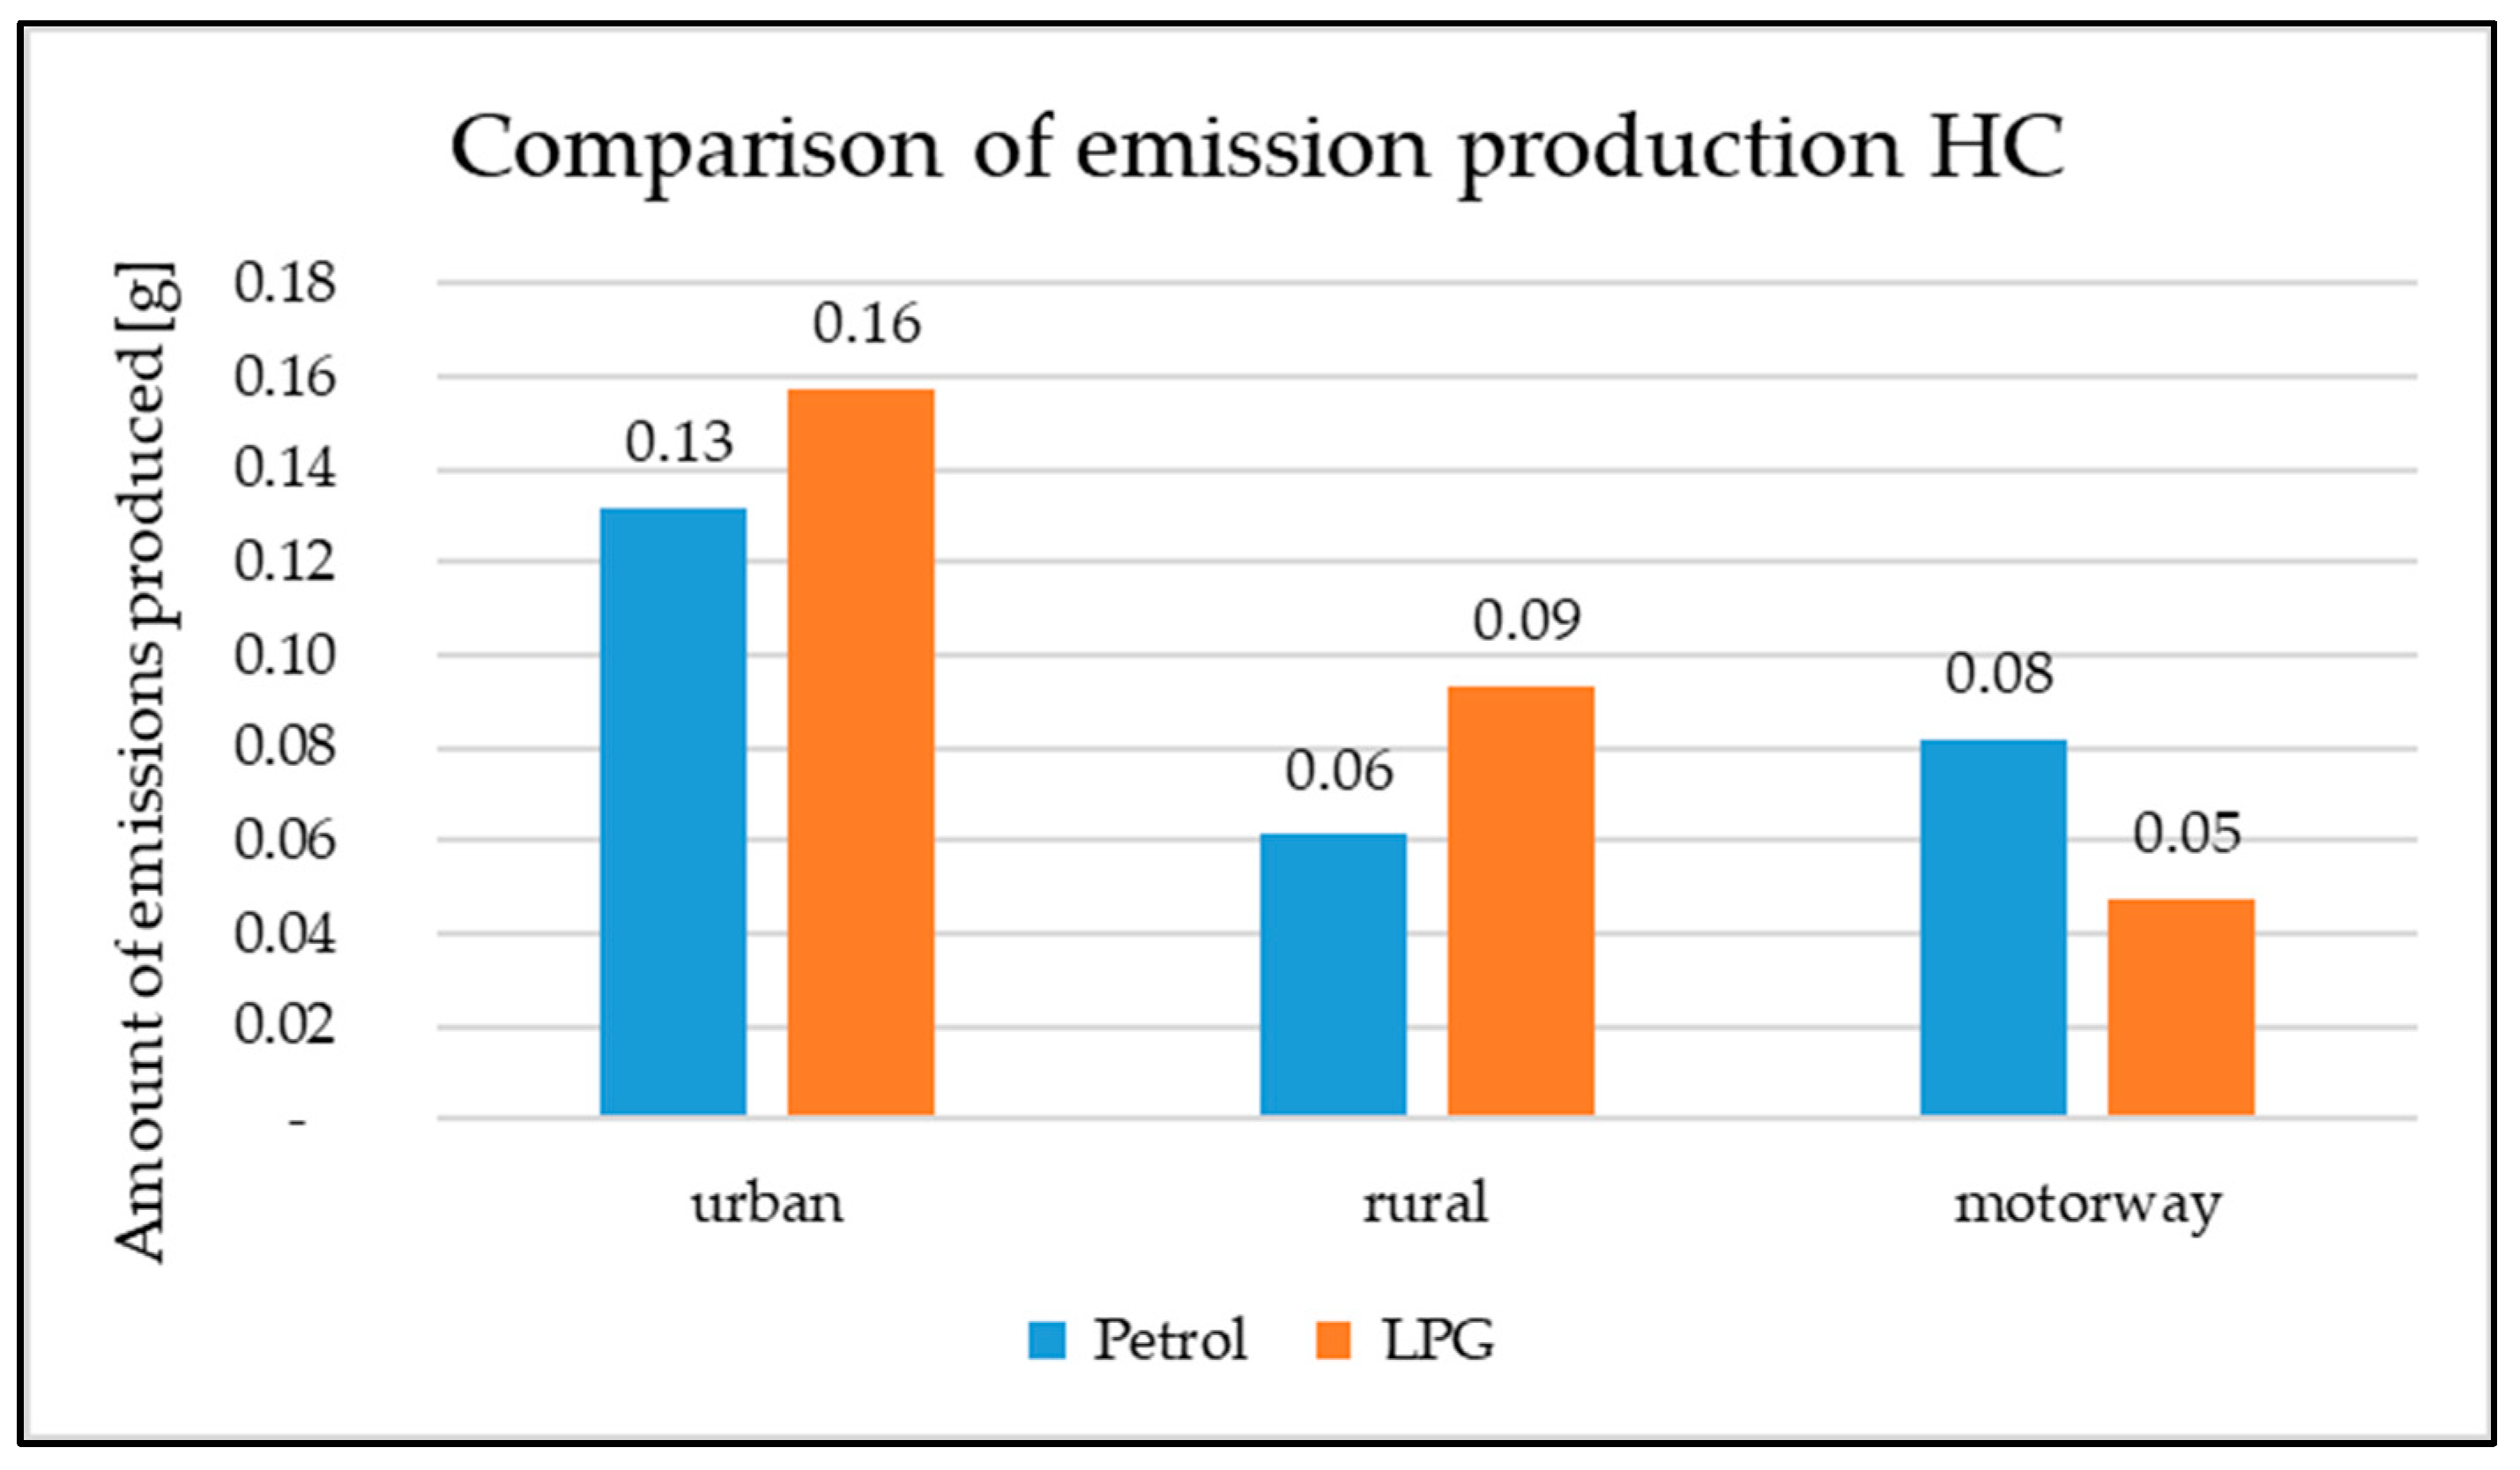
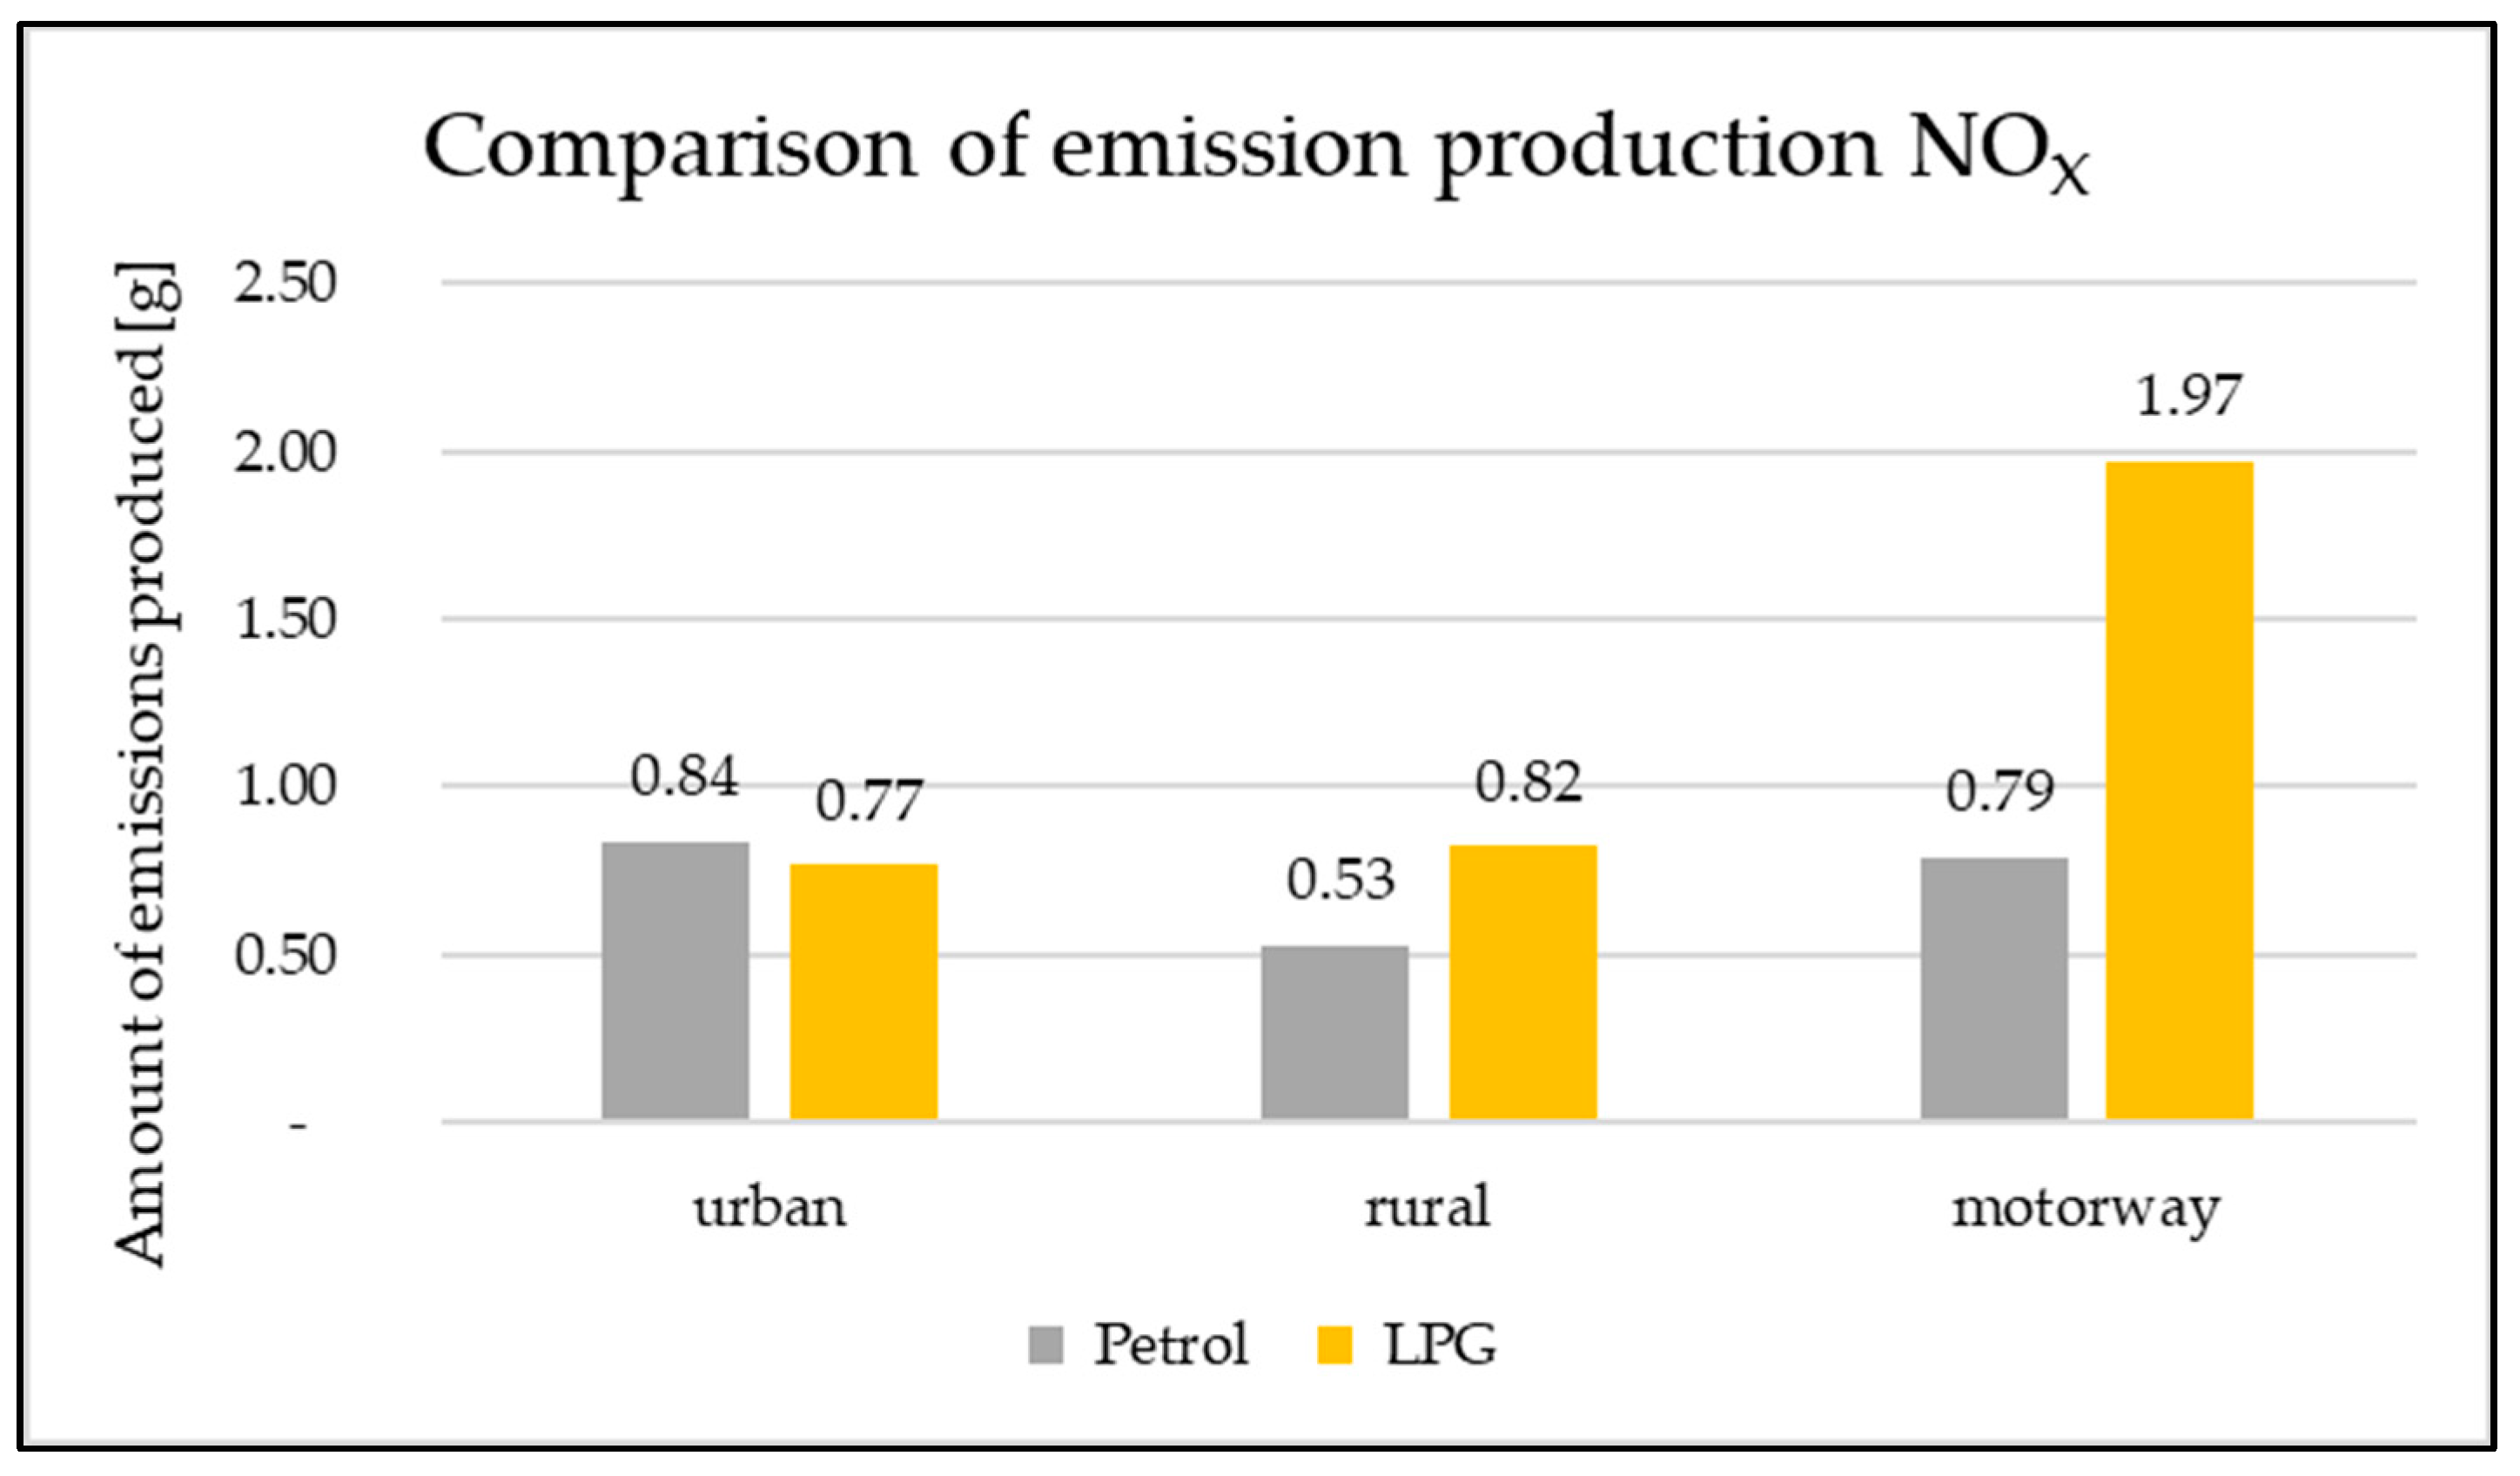
Table 4 shows the emissions produced by the Subaru Impreza. The average values are a weighted average and represent the emission mass depending on the distance traveled by the vehicle. For each part of the RDE test, the exhaust emission components in g/km are calculated and are shown graphically in Figure 12, Figure 13, Figure 14 and Figure 15.
As for CO production, the biggest difference can be observed when driving on the highway section, where 70.72 g of petrol was produced and 41.18 g of CO was produced when burning LPG. This difference represents a decrease of almost 41.7% compared to gasoline combustion. Thus, it can be stated that from this point of view, driving on LPG is assessed as being more environmentally friendly.
In the case of CO2 production, we can state that the individual productions are more or less equivalent for each ride. However, the value of production when driving in and out of the city is only higher when burning gasoline. On the contrary, when driving on the highway, the CO2 production is increased when burning LPG.
When comparing the amount of HC produced, we can observe that when driving in and out of the city, the HC value is higher when burning LPG. Conversely, when driving at higher speeds, this fact changes, and HC production is only higher when burning gasoline.
When comparing NOx production, we can once again observe the biggest difference when driving on the highway section. NOx production was 1.18 g lower when burning gasoline compared to LPG combustion. There was a reduction in NOx of almost 60% compared to LPG combustion.
5. Discussion
The present research monitors the production of exhaust emissions during vehicle operation in real conditions. From the evaluation of the results of individual measurements, it is possible to state to what extent the LPG combustion represents an ecological alternative. We will compare the absolute amount of emissions produced on the monitored route. The results of the measurements show that when driving in the city, a vehicle powered by LPG was able to achieve lower values of exhaust emissions than when burning gasoline. However, when monitoring HC production, production was higher when burning LPG. When monitoring driving outside the urban environment, we observed that the vehicle had lower emissions when burning gasoline. However, when monitoring CO2 production in an urban area, production was lower when burning LPG. When the vehicle was driven on the motorway section, the production of CO2 and NOx emissions was higher when burning LPG. The production of other monitored emissions (CO, HC) was only higher when burning gasoline. This comparison makes it possible to monitor the extent to which the fuel may affect the production of exhaust emissions.
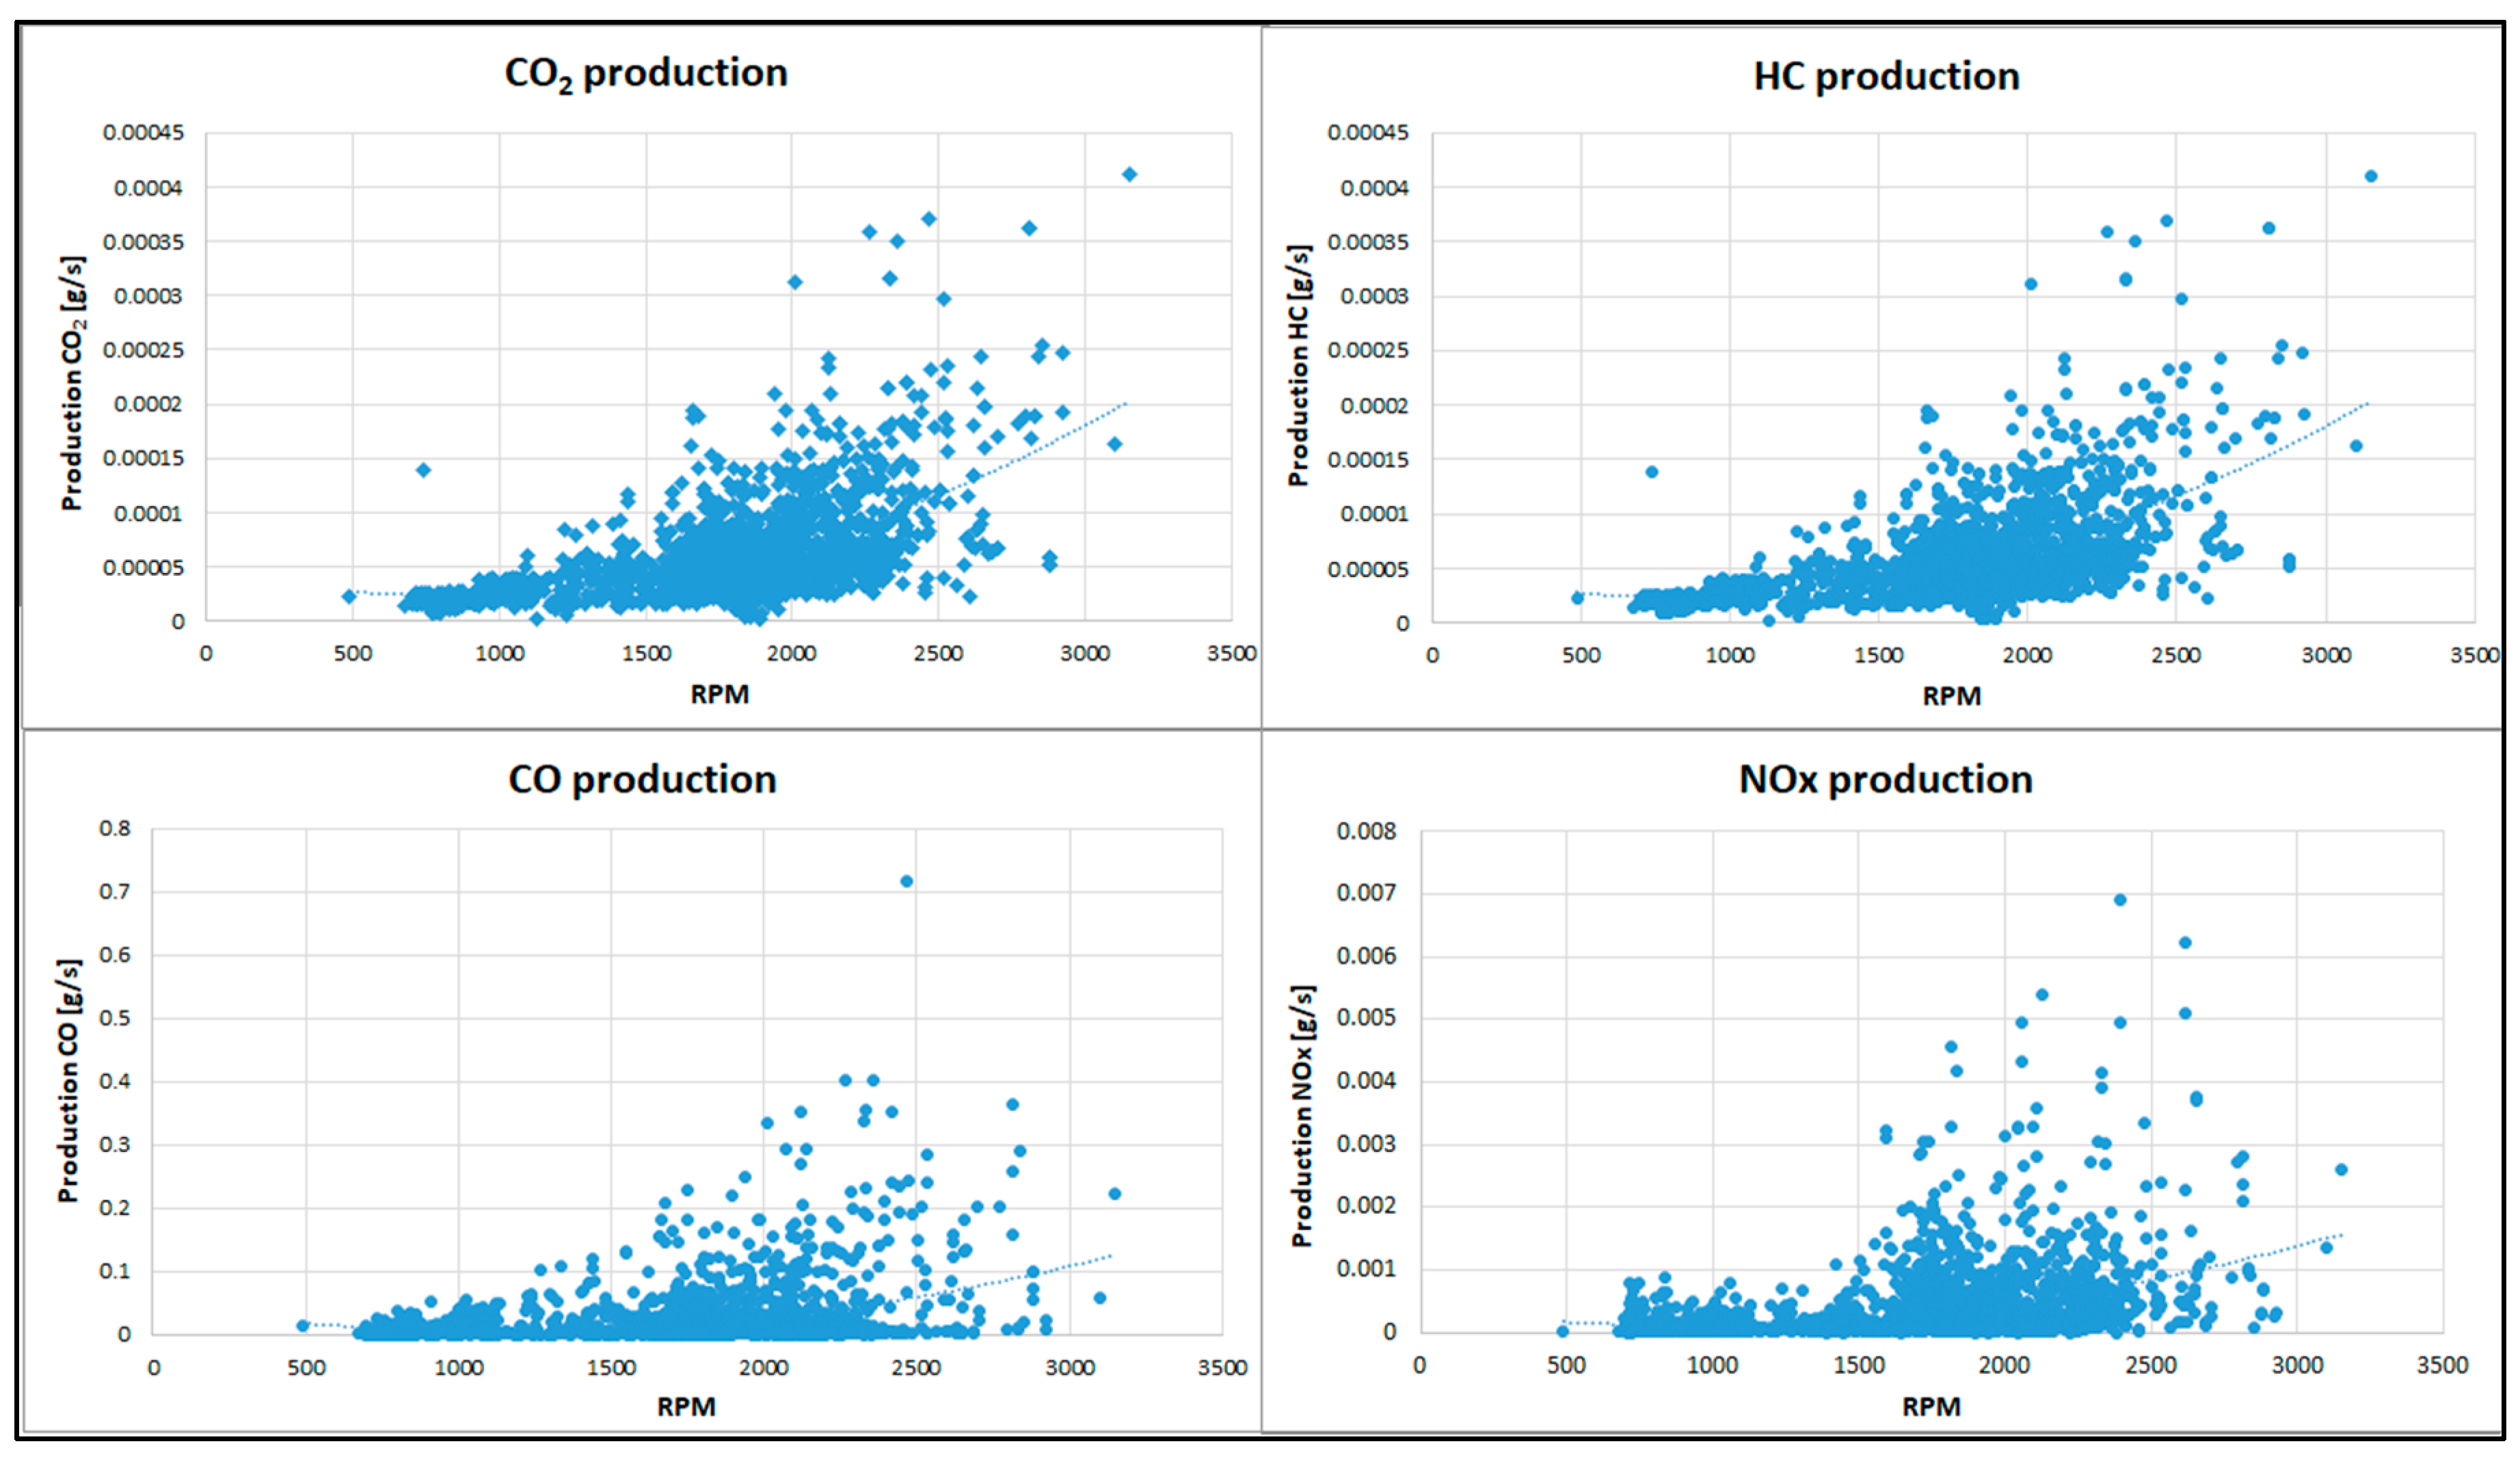
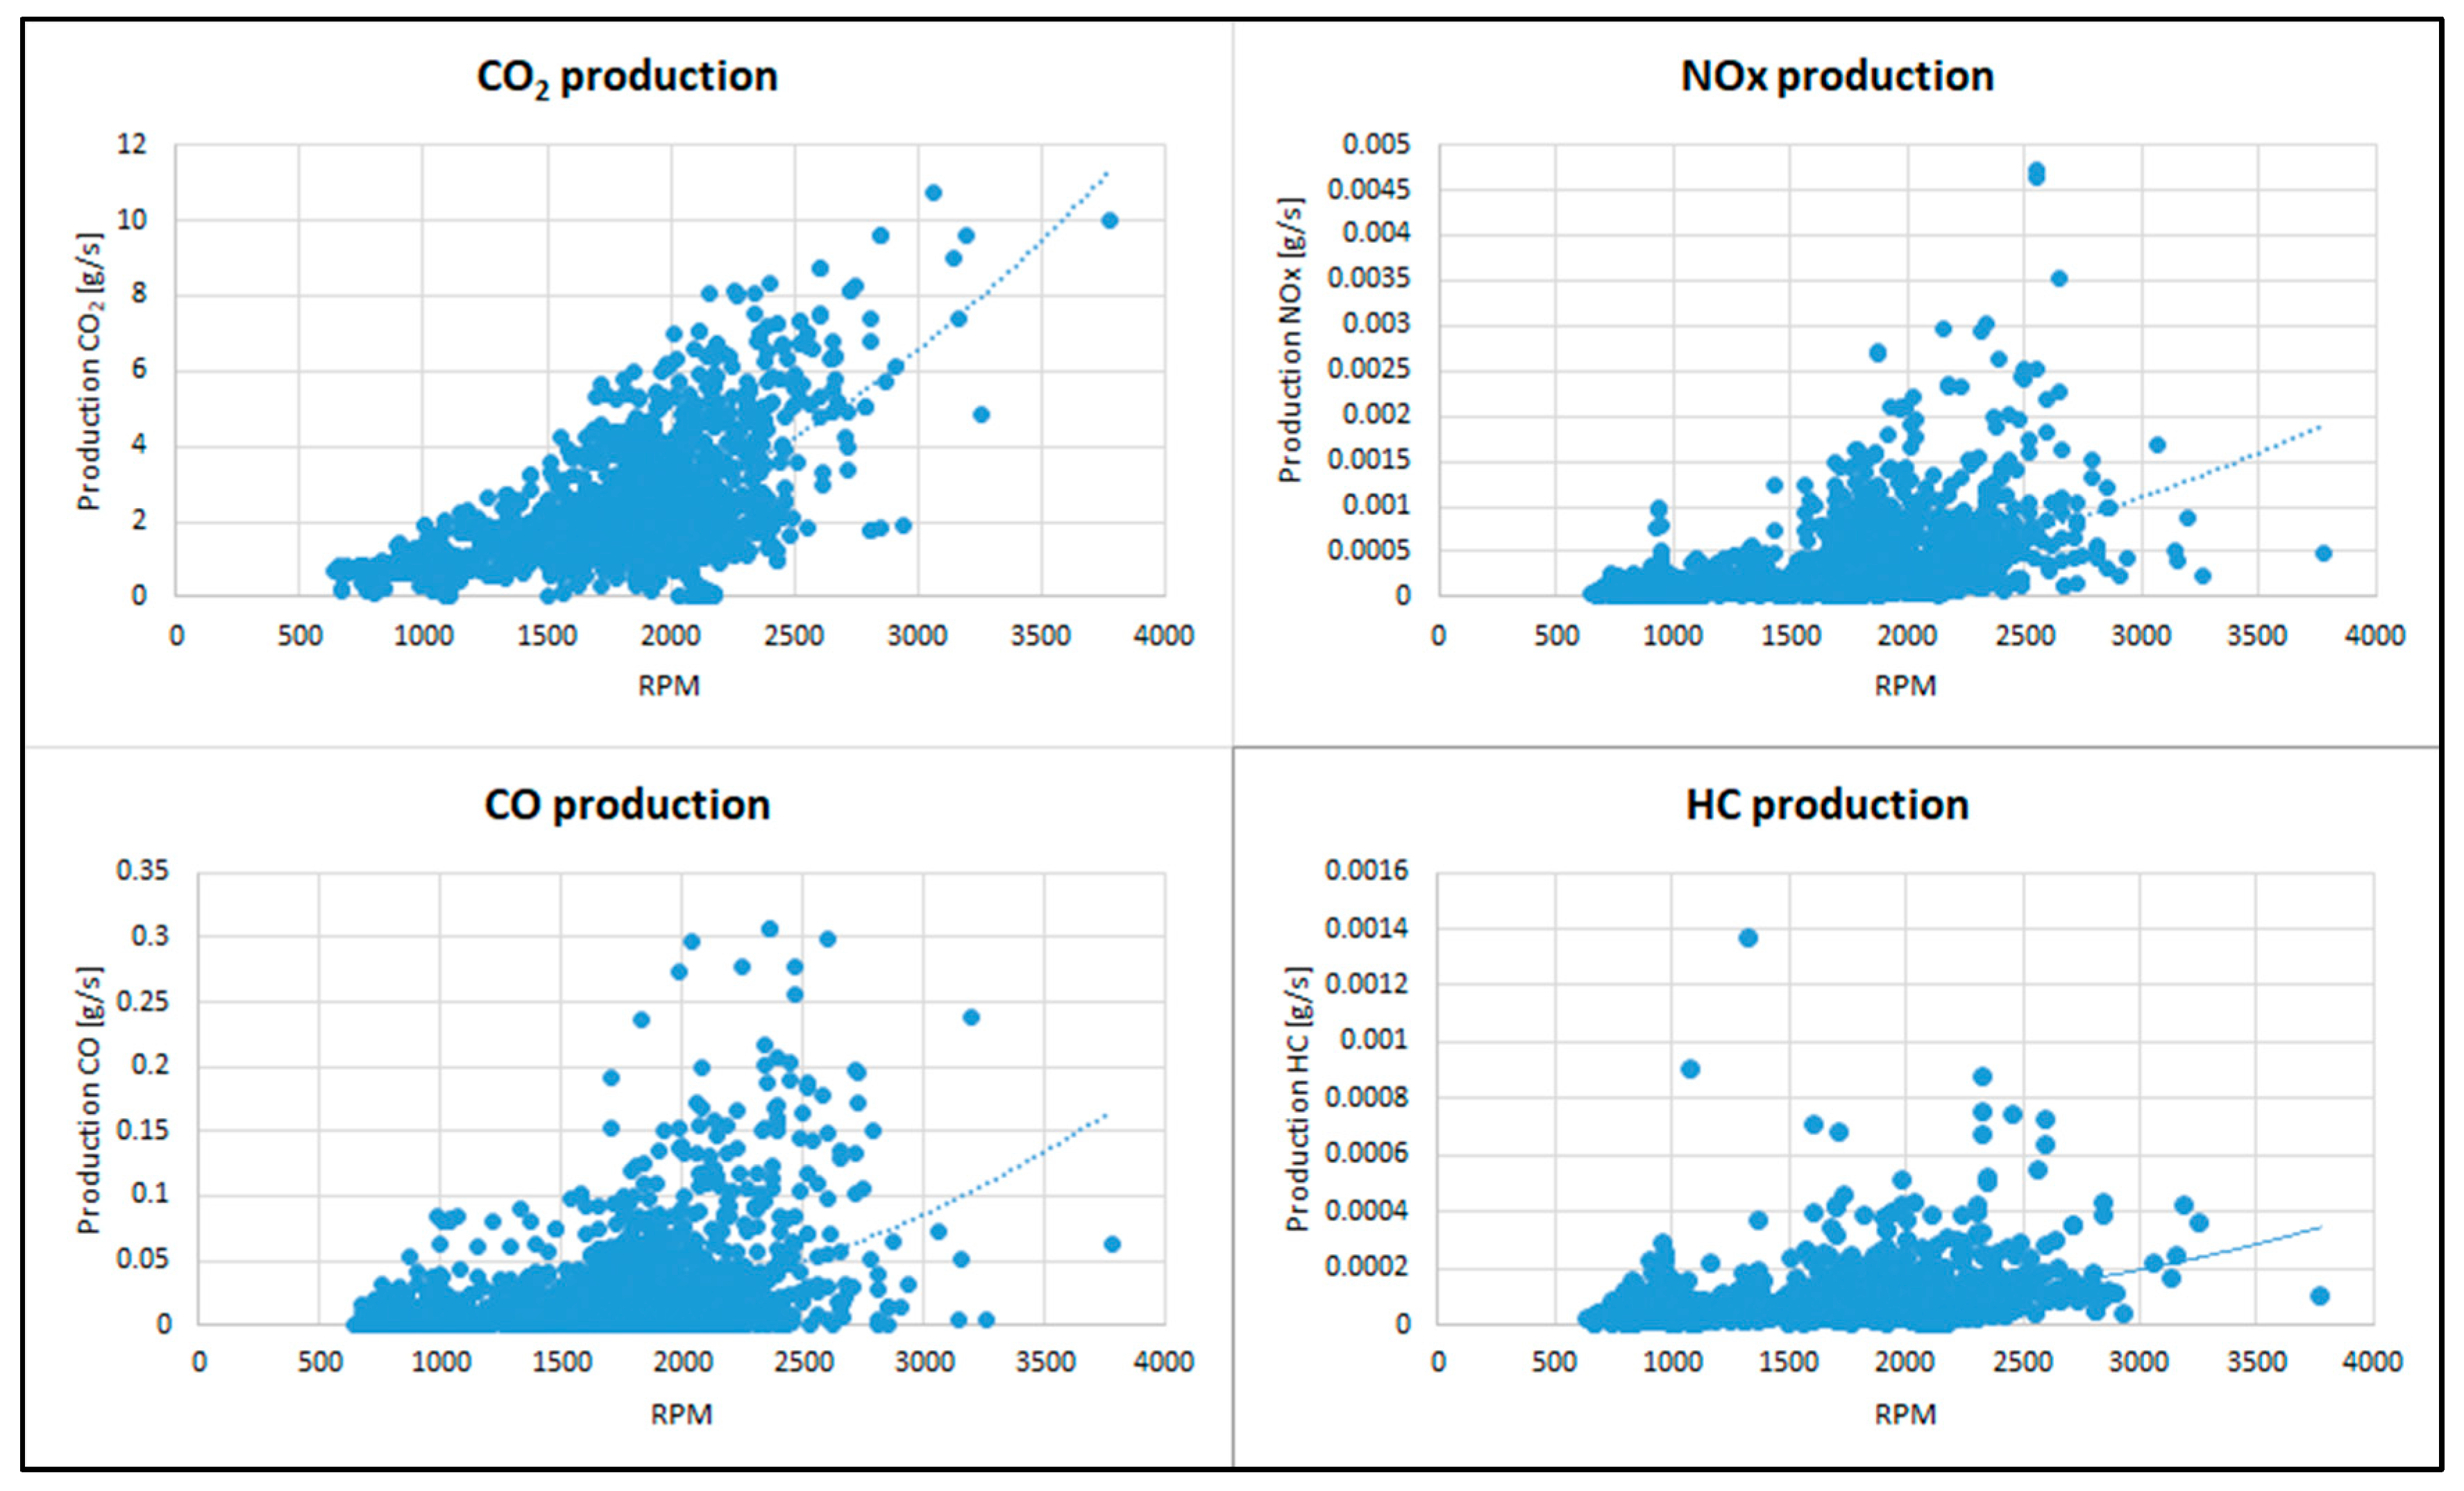
In the analysis of different concentrations of the monitored components of CO, CO2, HC, and NOx emissions, THE graphs representing the engine speed and individual emissions in g/s were prepared (Figure 16 and Figure 17). The amount of emissions produced in g/s depends significantly on the way the vehicle is driven during the RDE test. How the test vehicle is driven significantly affects the production of individual emission components. Vehicle acceleration was necessary several times during testing. In particular, CO2, and HC are affected by the current engine speed.
Similar research has been conducted by Javorski et al., who proved that vehicles powered by LPG are more environmentally friendly in all of the monitored indicators. The production of CO, CO2, HC, and NOx emissions was lower when burning LPG. This fact was confirmed when driving in any environment (city, out of town, highway). Specific research was carried out on a vehicle with the EURO 3 emission standard [47]. It is equally important to compare the production of emissions with the emission standards that set limit values for pollutants in the exhaust gases of internal combustion engines. This comparison was made in the research of Merkisz et al. The result of such a comparison exceeded the CO limit by 0.472 g/km [48]. The HC and NOx emission limits were not exceeded. Bielaczyc et al. engaged in similar research, but the emission values were compared between an internal combustion engine vehicle and a hybrid vehicle. During the research, several significant differences in the emission profiles of the two vehicles were observed. CO2 and CO emissions were much lower for the hybrid vehicle, while HC and NOx emissions were comparable and very low [49]. Regarding the production of emissions from buses Jurkovic and bicycles, they performed a study observing the production of emissions from the combustion of LNG and diesel. The research compares the production of greenhouse gas emissions from the current EURO 2 diesel bus fleet, EURO 6 diesel buses, and a pilot-tested version of LNG that meets the same emission standard. In terms of emissions, the LNG version produces lower emissions compared to diesel buses. However, the savings achieved are relatively low but not negligible in terms of the overall life of the vehicle [50]. The level of vehicle exhaust emissions generally depends on the vehicle, the driver, and the environment in which it is operated. In our research, we focused on the level of exhaust emissions that was solely dependent on the vehicle. The aim of the research was to quantify the changes in the fuel of the same vehicle [51]. Several studies confirm that it makes sense to carry out tests and to measure emissions while actually driving was another type-approval test to take into account the impact of road profile, ambient conditions, and traffic situations [19,52].
Usman et al. investigated the emission production for the individual operating characteristics of a vehicle. A petrol engine powered by various fuels, including gasoline, liquefied petroleum gas (LPG), and a hybrid hydrogen–oxygen mixture (HHO) and LPG, was used for the experiment. The results of this research show that, CO emissions fell by 21% and 48.1% for the LPG–HHO-powered vehicle compared to LPG- and petrol-powered vehicles. Average CO2 production was 9% lower for the HHO LPG blends compared to LPG alone. In addition, the average proportion of unburned hydrocarbons in the exhaust gases decreased by 21.8% for the LPG–HHO mixtures compared to LPG. However, other NOx emissions were 16.1% higher for LPG–HHO than they were for LPG [53]. Taking into account a holistic view of the emissions analysis and considering the strengths and weaknesses of the LPG–HHO blend, it can be said with considerable certainty that this blend can be used to gain its basic advantages. The authors conclude that globally, emissions have been reduced by 21%, 9%, and 21.8% for CO, CO2, and unburned hydrocarbons compared to LPG. The inclusion of alternative fuels would not only reduce dependence on conventional fuels but would also contribute to their sustainability for future generations. At the same time, reducing harmful pollutants would help to mitigate and combat the threats of climate change [53].
6. Conclusions
The aim of the present research was to specify a method to calculate exhaust emissions produced during road vehicle operation. In the introduction, the individual problems and impacts of pollutants on human health were characterized. There are currently several options for determining the amount of exhaust emissions [54,55,56].
The calculation of individual emissions in research is specified in Regulation 2017/1151. Based on the calculation of emissions according to this Regulation, it is possible to determine the emission production of individual components in g/s. By dividing this value by the number of kilometers traveled, we arrive at the unit g/km. This unit represents values that can be compared with each other.
The measurement itself as well as the way it was performed meets all RDE conditions. Indeed, the results and the individual comparisons of the measured data confirm that the measurements and the way in which they were performed are correct. The values of the produced exhaust emissions are comparable with the values measured in similar studies where certified PEMS devices were used as measuring devices [36].
For the research, two measurements were performed, during which the vehicle moved along the measuring path. It was important to comply with the conditions set out in the RDE regulations. The rides were made only once for each type of fuel. This is due to compliance with the RDE conditions. The regulation does not specify the conditions for the repeatability of the measurements in determining the exhaust emissions during actual driving. The conditions as well as the whole cycle were performed according to the prescription; therefore, it was not necessary to repeat the measurement several times. During the first drive, the vehicle burned gasoline, and during the second drive, it was powered by LPG. Both of these measurements were performed on the same routes (city, out of town, highway) and the same measuring sections. The lengths of the measuring sections in the individual measurements were constant. This ensured the possibility of their mutual comparison and evaluation. After the measurements, the authors were able to evaluate the emission production of individual sections of the measurement but also for the whole measurement comprehensively.
Table 5 shows a comparison of the emissions (in g/km) with the emission values provided by the EURO 4 emission standard and the certificate of conformity (COC). In individual comparisons, we are able to observe a color scale, where red indicates a violation (overproduction), and green indicates that the emission production is normal. The light colors indicate the limit value to which a comparison can be made. From Table 5, it can be stated that the vehicle produces an excessive amount of CO when burning gasoline. This production is 0.926 g/km higher and 0.892 g/km higher when burning LPG. Compared to the limit value stated in the COC, the difference is even greater. For other substances, the monitored values are normal, even far below the permitted values. As described above, this fact was pointed out in his research by Merkisz et al. [48]. As for the COC comparison, the vehicle produced an excessive amount of CO2, but only when burning gasoline. This value is OK when driving the vehicle on LPG. In the case of NOx production, this value is higher in both of the monitored conditions (petrol, LPG). The only value that is in the norm and that does not exceed the specified limits is the production of HC.
Given that similar studies that have been conducted, we can assess whether we take into account a holistic view of the emissions analysis, and by considering the strengths and weaknesses of the LPG-HHO mixture, it can be said with considerable certainty that this fuel mixture can be used to obtain its basic advantages. The authors of this study claim that globally, emissions have been reduced by 21%, 9%, and 21.8% for CO, CO2, and unburned hydrocarbons, respectively. This means that this decrease is even higher compared to gasoline combustion. The inclusion of alternative fuels would not only reduce dependence on conventional fuels but would also contribute to their sustainability for future generations. At the same time, reducing harmful pollutants would help mitigate and combat the threats of climate change [53].
As for the evaluation of the measurement itself, we start from Table 6. It shows the weighted arithmetic averages for the individual components of the exhaust emissions. Weighted averages represent the value for driving according to RDE. This means that they contain data from driving in the city, outside the city, and on the highway. From these data, the arithmetic mean is calculated, with the mass representing the distance traveled during the relevant measurements.
Table 6 symbolically shows the results of the comparison of the measured data. The individual symbols represent the values of the weighted arithmetic mean. The symbol X indicates that the value found in a particular measurement is higher than the value with which it is compared (indicated by symbol ✔). Based on these data, it is possible to state that there is higher CO and CO2 production during gasoline combustion. When burning LPG, the production of HC and NOx is higher. The comparison itself is based on the fact that the overall measurement is performed on the same vehicle with the same characteristic parameters. Due to the research methodology, it is difficult to compare two vehicles that are not the same. If we wanted to maintain the accuracy of the measurements, we would have to deal with a number of design factors. One of them is the influence of the transmission system on the performance of the vehicle itself [58]. However, it was important that this vehicle could measure the combustion of gasoline as well as LPG.
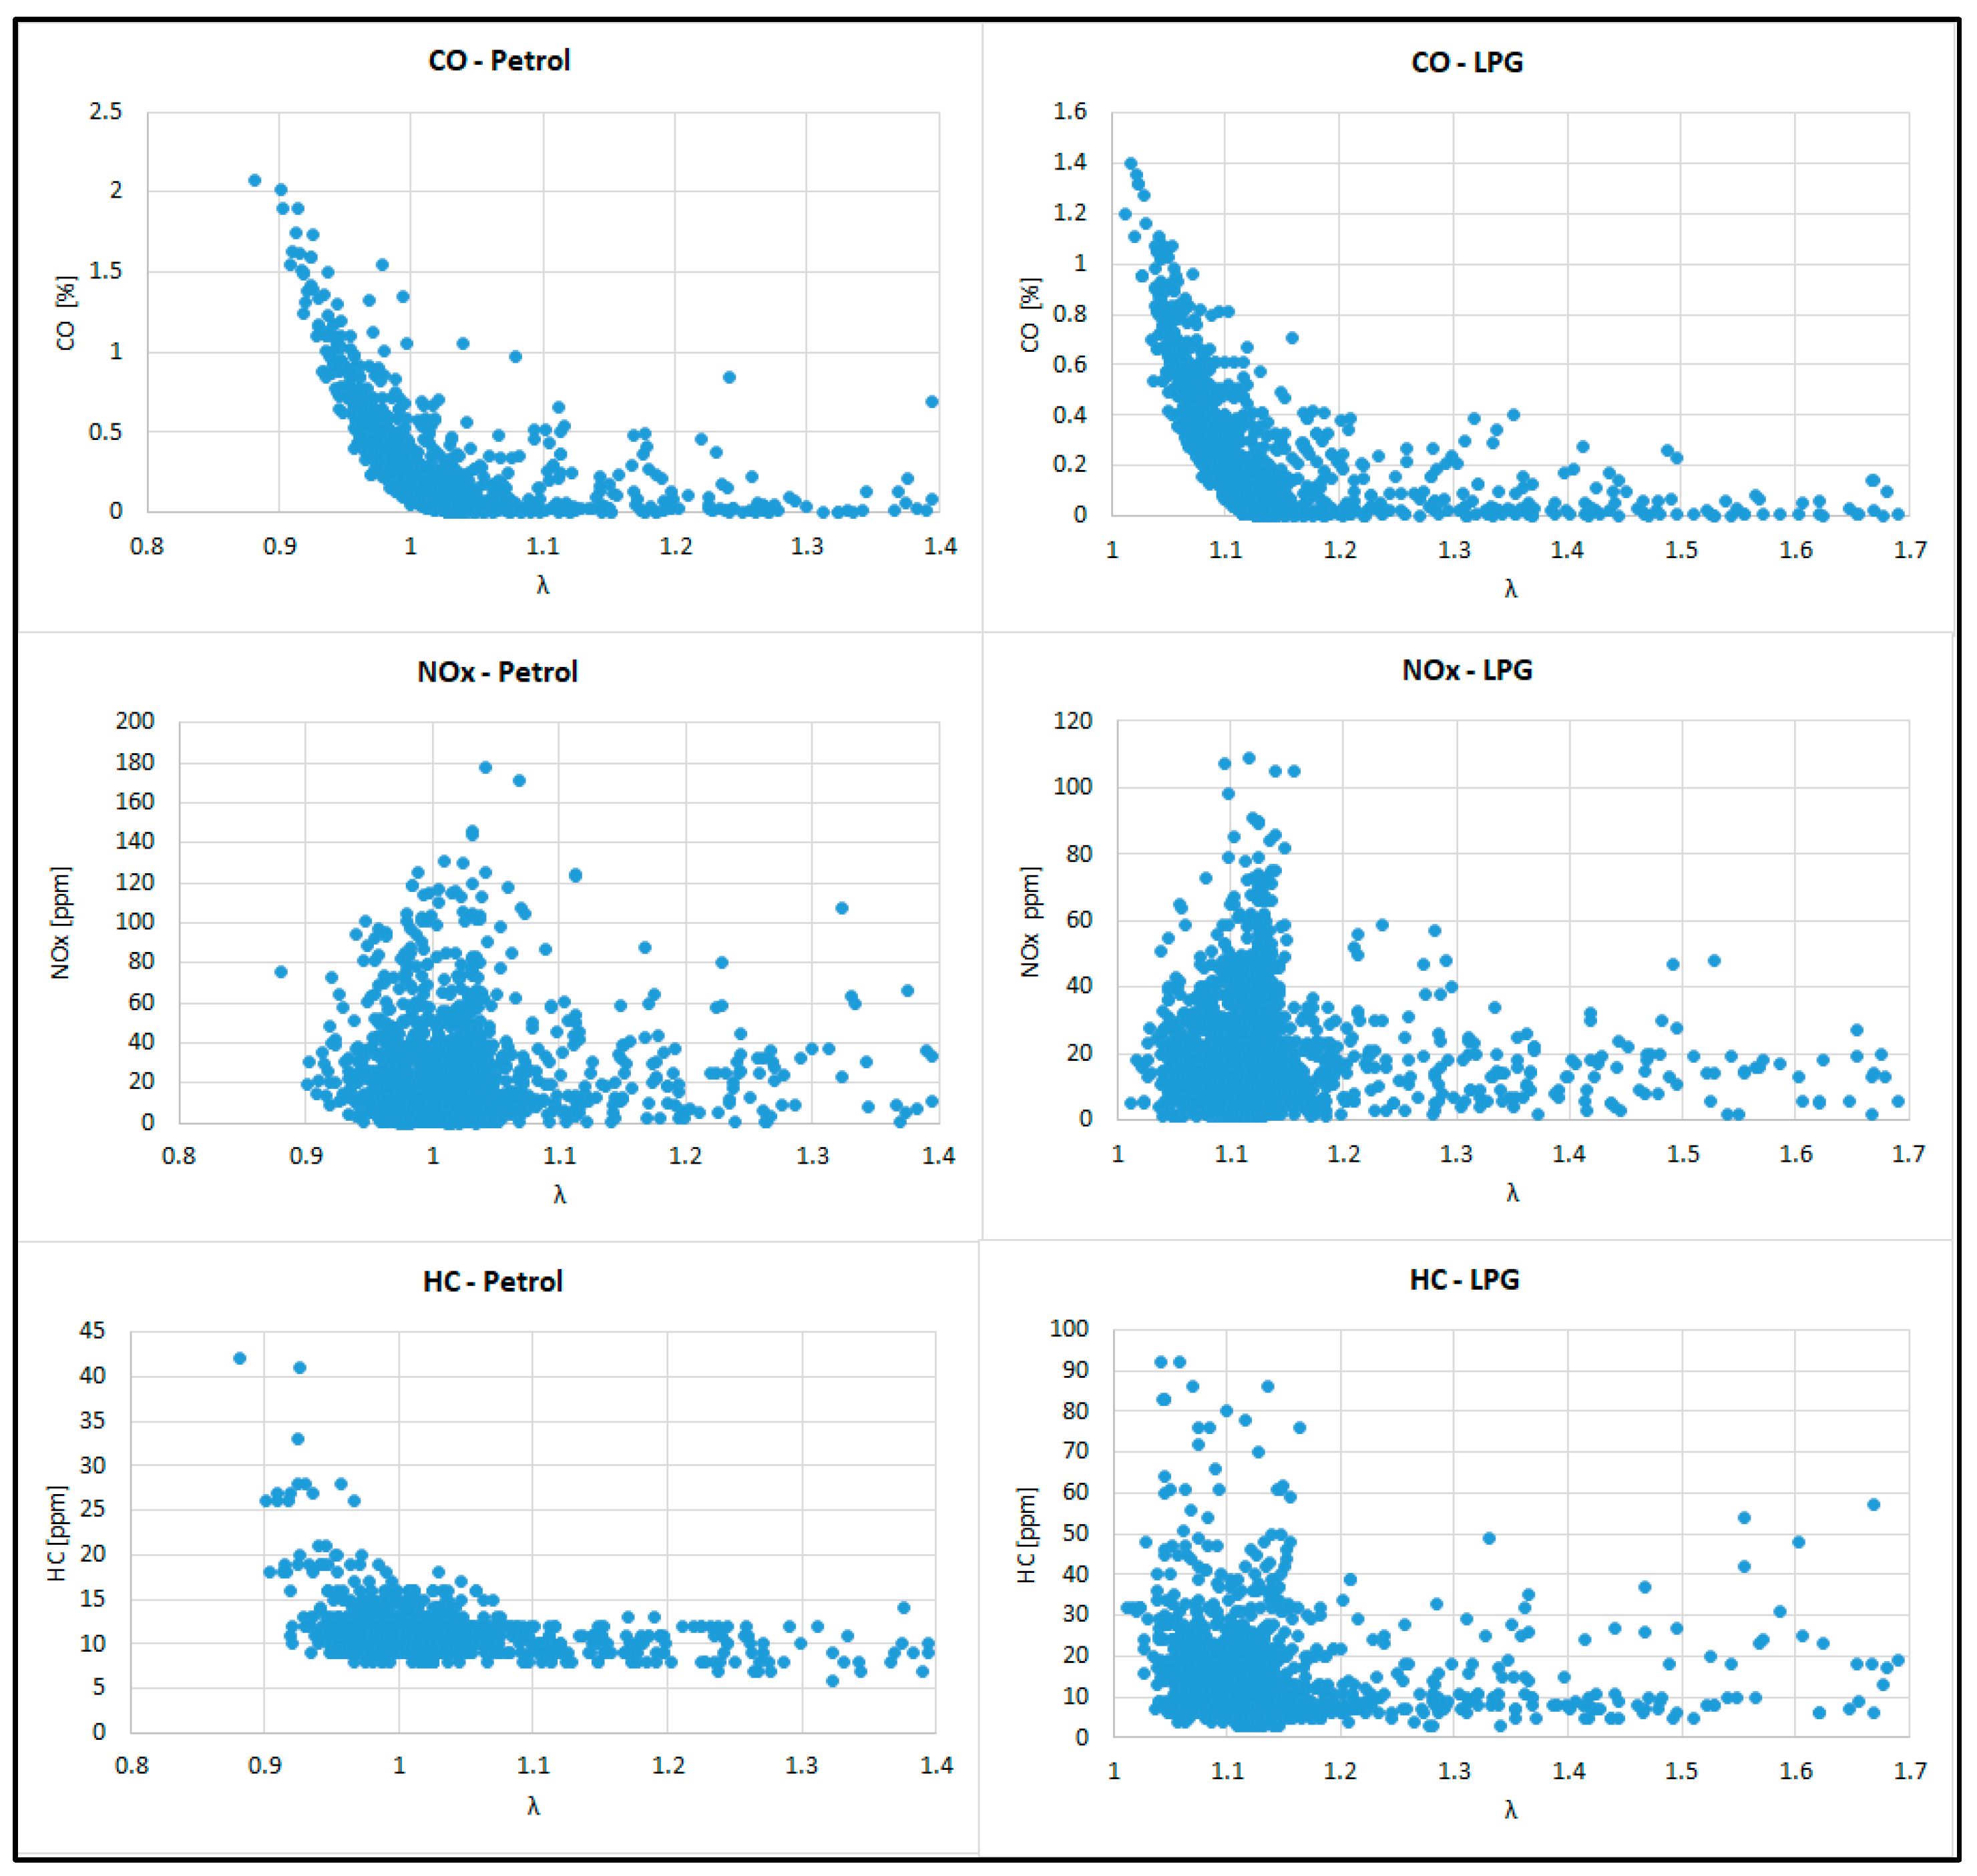
The difference in the calculated components of the CO, HC, and NOx exhaust emissions between petrol and LPG fuels can also be understood in connection with one of the most important parameters, the air–lambda excess factor. As seen in Figure 18, the preparation of the fuel mixture on the gasoline fuel takes place to a significant degree at a lambda value of 1. When the vehicle is running on LPG fuel, the coefficient of excess air in particular is in the range of 1.1 to 1.15.
In the future, these measurements could be extended to other vehicles. The basis for such research could be a study analyzing the EU vehicle fleet [59]. The individual outputs could characterize the progress and procedures for reducing emissions within the technical and technological development of internal combustion engines as well as vehicles powered by alternative propulsion methods.
Author Contributions
Conceptualization, B.Š.; methodology, B.Š. and M.L.; software, M.L.; validation, M.J.; formal analysis, B.Š. and M.J.; investigation, B.Š.; resources, D.T., P.K. and M.J.; data curation, B.Š.; writing—original draft preparation, B.Š., M.J. and M.L.; writing—review and editing, B.Š., M.J. and M.L.; visualization, M.L.; supervision, B.Š.; funding acquisition, B.Š. and M.J. All authors have read and agreed to the published version of the manuscript.
Funding
This research was funded by the project of institutional research of the Faculty of Operation and Economics of Transport and Communications, University of Žilina no. 2/KCMD/2021 Research on the impact of urban logistics on the environment.
Conflicts of Interest
The authors declare no conflict of interest.
References
- Izquierdo, R.; Dos Santos, S.G.; Borge, R.; de la Paz, D.; Sarigiannis, D.; Gotti, A.; Boldo, E. Health impact assessment by the implementation of Madrid City air-quality plan in 2020. Environ. Res. 2019, 183, 109021. [Google Scholar] [CrossRef]
- Khreis, H.; de Hoogh, K.; Nieuwenhuijsen, M.J. Full-chain health impact assessment of traffic-related air pollution and childhood asthma. Environ. Int. 2018, 114, 365–375. [Google Scholar] [CrossRef]
- Miri, M.; Aval, H.E.; Ehrampoush, M.H.; Mohammadi, A.; Toolabi, A.; Nikoonahad, A.; Derakhshan, Z.; Abdolahnejad, A. Human health impact assessment of exposure to particulate matter: An AirQ software modeling. Environ. Sci. Pollut. Res. 2017, 24, 16513–16519. [Google Scholar] [CrossRef]
- European Environment Agency. Air Pollution. Available online: https://www.eea.europa.eu/sk/themes/air/intro (accessed on 25 August 2021).
- Bartram, M.; Koel, B. The molecular adsorption of NO2 and the formation of N2O3 on Au(111). Surf. Sci. 1989, 213, 137–156. [Google Scholar] [CrossRef]
- European Environment Agency. Air Quality Remains a Hot Topic for Many Europeans. Available online: https://www.eea.europa.eu/articles/air-quality-remains-a-hot (accessed on 25 August 2021).
- European Environment Agency. Air Quality in Europe. Available online: https://www.eea.europa.eu/publications/air-quality-in-europe-2019 (accessed on 25 August 2021).
- Jereb, B.; Stopka, O.; Skrúcaný, T. Methodology for Estimating the Effect of Traffic Flow Management on Fuel Consumption and CO2 Production: A Case Study of Celje, Slovenia. Energies 2021, 14, 1673. [Google Scholar] [CrossRef]
- Caban, J. Traffic congestion level in 10 selected cities of Poland. Sci. J. Silesian Univ. Technol. Ser. Transp. 2021, 112, 17–31. [Google Scholar] [CrossRef]
- Panko, J.; Kreider, M.; Unice, K. Chapter 7—Review of Tire Wear Emissions: A Review of Tire Emission Measurement Studies: Identification of Gaps and Future Needs. In Non-Exhaust Emissions; Academic Press: Cambridge, MA, USA, 2018; pp. 147–160. [Google Scholar] [CrossRef]
- Synák, F.; Gaňa, J.; Rievaj, V.; Mokričková, L. Ways of reducing carbon dioxide from road transport. Arch. Motoryz. 2019, 86, 41–54. [Google Scholar] [CrossRef]
- Hájnik, A.; Harantová, V.; Kalašová, A. Use of electromobility and autonomous vehicles at airports in Europe and worldwide. Transp. Res. Procedia 2021, 55, 71–78. [Google Scholar] [CrossRef]
- Morthorst, P. National environmental targets and international emission reduction instruments. Energy Policy 2003, 31, 73–83. [Google Scholar] [CrossRef]
- European Comission. Emissions in the Automotive Sector. Available online: https://ec.europa.eu/growth/sectors/automotive/environment-protection/emissions_en (accessed on 20 September 2021).
- May, J.; Favre, C.; Bosteels, D.; Andersson, J.; Clarke, D.; Heaney, M. On-Road Testing and PEMS Data Analysis for two Euro 6 Diesel Vehicles. SAE Int. J. Fuels Lubr. 2014, 7, 919–934. [Google Scholar]
- Ntziachristos, L.; Papadimitriou, G.; Ligterink, N.; Hausberger, S. Implications of diesel emissions control failures to emission factors and road transport NOx evolution. Atmos. Environ. 2016, 141, 542–551. [Google Scholar] [CrossRef]
- Merkisz, J.; Jacyna, M.; Merkisz-Guranowska, A.; Pielecha, J. The parameters of passenger cars engine in terms of real drive emission test. Arch. Transp. 2014, 32, 43–50. [Google Scholar] [CrossRef] [Green Version]
- Fontaras, G.; Ciuffo, B.; Zacharof, N.; Tsiakmakis, S.; Marotta, A.; Pavlovic, J.; Anagnostopoulos, K. The difference between reported and real-world CO2 emissions: How much improvement can be expected by WLTP introduction? Transp. Res. Procedia 2017, 25, 3933–3943. [Google Scholar] [CrossRef]
- Marotta, A.; Pavlovic, J.; Ciuffo, B.; Serra, S.; Fontaras, G. Gaseous Emissions from Light-Duty Vehicles: Moving from NEDC to the New WLTP Test Procedure. Environ. Sci. Technol. 2015, 49, 8315–8322. [Google Scholar] [CrossRef]
- DieselNet. Cars and Light Trucks: RDE Testing. Available online: https://dieselnet.com/standards/eu/ld_rde.php (accessed on 26 August 2021).
- European Comission. EU Action to Curb Air Pollution by Cars. Available online: https://ec.europa.eu/commission/presscorner/detail/en/MEMO_17_2821 (accessed on 26 August 2021).
- Kurtyka, K.; Pielecha, J. The evaluation of exhaust emission in RDE tests including dynamic driving conditions. Transp. Res. Procedia 2019, 40, 338–345. [Google Scholar] [CrossRef]
- Łagowski, P. The Effect of Biofuel on the Emission of Exhaust Gas from an Engine with the Common Rail System. Arch. Motoryz. 2021, 90, 33–44. [Google Scholar] [CrossRef]
- Kuranc, A. Exhaust emission test performance with the use of the signal from air flow meter. Eksploat. i Niezawodn. Maint. Reliab. 2015, 17, 129–134. [Google Scholar] [CrossRef]
- Vojtisek-Lom, M.; Cobb, J.T. Vehicle Mass Emissions Measurement Using a Portable 5-Gas Exhaust Analyzer and Engine Computer Data. 1997. Available online: https://www.researchgate.net/profile/Michal-Vojtisek-Lom/publication/240393978_Vehicle_Mass_Emissions_Measurement_using_a_Portable_5Gas_Exhaust_Analyzer_and_Engine_Computer_Data/links/54a26ade0cf256bf8baf9102/Vehicle-Mass-Emissions-Measurement-using-a-Portable-5Gas-Exhaust-Analyzer-and-Engine-Computer-Data.pdf (accessed on 15 January 2022).
- Bielaczyc, P.; Woodburn, J. Trends in Automotive Emission Legislation: Impact on LD Engine Development, Fuels, Lubri-cants and Test Methods: A Global View, with a Focus on WLTP and RDE Regulations. Emiss. Control Sci. Technol. 2019, 5, 86–98. [Google Scholar] [CrossRef] [Green Version]
- Volkswagen. WLTP: New Standards for Consumption Values. Available online: https://www.vw.sk/wltp (accessed on 26 August 2021).
- Masi, M. Experimental analysis on a spark ignition petrol engine fuelled with LPG (liquefied petroleum gas). Energy 2012, 41, 252–260. [Google Scholar] [CrossRef]
- Pundkar, A.H.; Lawankar, S.M.; Deshmukh, S. Performance and Emissions of LPG Fueled Internal Combustion Engine: A Review. Available online: http://citeseerx.ist.psu.edu/viewdoc/summary?doi=10.1.1.302.3514 (accessed on 20 January 2022).
- Myung, C.-L.; Kim, J.; Choi, K.; Hwang, I.G.; Park, S. Comparative study of engine control strategies for particulate emissions from direct injection light-duty vehicle fueled with gasoline and liquid phase liquefied petroleum gas (LPG). Fuel 2012, 94, 348–355. [Google Scholar] [CrossRef]
- Park, G.; Mun, S.; Hong, H.; Chung, T.; Jung, S.; Kim, S.; Seo, S.; Kim, J.; Lee, J.; Kim, K.; et al. Characterization of Emission Factors Concerning Gasoline, LPG, and Diesel Vehicles via Transient Chassis-Dynamometer Tests. Appl. Sci. 2019, 9, 1573. [Google Scholar] [CrossRef] [Green Version]
- European Comission. Comission Regulation EU 2017/654. Available online: https://eur-lex.europa.eu/legal-content/SK/TXT/PDF/?uri=CELEX:32017R0654&from=MT (accessed on 10 November 2021).
- Karczewski, M.; Chojnowski, J.; Szamrej, G. A Review of Low-CO2 Emission Fuels for a Dual-Fuel RCCI Engine. Energies 2021, 14, 5067. [Google Scholar] [CrossRef]
- European Comission. Commission Regulation (EU) 2016/427 of 10 March 2016 amending Regulation (EC) No 692/2008 as Regards Emissions from Light Passenger and Commercial Vehicles (Euro 6). Available online: https://eur-lex.europa.eu/legal-content/EN/TXT/PDF/?uri=CELEX:32016R0427&from=EN (accessed on 10 November 2021).
- Bodisco, T.; Zare, A. Practicalities and Driving Dynamics of a Real Driving Emissions (RDE) Euro 6 Regulation Homologation Test. Energies 2019, 12, 2306. [Google Scholar] [CrossRef] [Green Version]
- Giechaskiel, B.; Vlachos, T.; Riccobono, F.; Forni, F.; Colombo, R.; Montigny, F.; Le-Lijour, P.; Carriero, M.; Bonnel, P.; Weiss, M. Implementation of Portable Emissions Measurement Systems (PEMS) for the Real-driving Emissions (RDE) Regulation in Europe. J. Vis. Exp. 2016, e54753. [Google Scholar] [CrossRef] [Green Version]
- Claßen, J.; Krysmon, S.; Dorscheidt, F.; Sterlepper, S.; Pischinger, S. Real Driving Emission Calibration—Review of Current Validation Methods against the Background of Future Emission Legislation. Appl. Sci. 2021, 11, 5429. [Google Scholar] [CrossRef]
- Claßen, J.; Pischinger, S.; Krysmon, S.; Sterlepper, S.; Dorscheidt, F.; Doucet, M.; Reuber, C.; Görgen, M.; Scharf, J.; Nijs, M.; et al. Statistically supported real driving emission calibration: Using cycle generation to provide vehicle-specific and statis-tically representative test scenarios for Euro 7. Int. J. Engine Res. 2020, 21, 1783–1799. [Google Scholar] [CrossRef]
- Guo, D.; Wang, J.; Zhao, J.B.; Sun, F.; Gao, S.; Li, C.D.; Li, M.H.; Li, C.C. A vehicle path planning method based on a dynamic traffic network that considers fuel consumption and emissions. Sci. Total Environ. 2019, 663, 935–943. [Google Scholar] [CrossRef]
- Triantafyllopoulos, G.; Dimaratos, A.; Ntziachristos, L.; Bernard, Y.; Dornoff, J.; Samaras, Z. A study on the CO2 and NOx emissions performance of Euro 6 diesel vehicles under various chassis dynamometer and on-road conditions including latest regulatory provisions. Sci. Total Environ. 2019, 666, 337–346. [Google Scholar] [CrossRef] [PubMed]
- Merkisz, J.; Pielecha, J.; Bielaczyc, P.; Woodburn, J.; Szalek, A. A Comparison of Tailpipe Gaseous Emissions from the RDE and WLTP Test Procedures on a Hybrid Passenger Car; SAE International: Warrendale, PA, USA, 2020. [Google Scholar] [CrossRef]
- Giechaskiel, B.; Clairotte, M.; Valverde-Morales, V.; Bonnel, P.; Kregar, Z.; Franco, V.; Dilara, P. Framework for the as-sessment of PEMS (Portable Emissions Measurement Systems) uncertainty. Environ. Res. 2018, 166, 251–260. [Google Scholar] [CrossRef]
- Šarkan, B.; Kuranc, A.; Kučera, L. Calculations of exhaust emissions produced by vehicle with petrol engine in urban area. IOP Conf. Ser. Mater. Sci. Eng. 2019, 710, 012023. [Google Scholar] [CrossRef]
- Technical Data MAHA MGT 5. Available online: https://www.maha.ru/upload/iblock/e86/e860efa3deae00e7eeecb3f1adb26c02.pdf (accessed on 27 August 2021).
- Elm Electronics. ELM 327. Available online: https://www.elmelectronics.com/wp-content/uploads/2016/07/ELM327DS.pdf (accessed on 27 August 2021).
- Mücková, P.; Famfulík, J.; Richtář, M. Optimization of four stroke spark ignition engine for firesport. Transp. Res. Procedia 2021, 55, 496–502. [Google Scholar] [CrossRef]
- Jaworski, A.; Lejda, K.; Lubas, J.; Mądziel, M. Comparison of exhaust emission from Euro 3 and Euro 6 motor vehicles fueled with petrol and LPG based on real driving conditions. Combust. Engines 2019, 178, 106–111. [Google Scholar] [CrossRef]
- Merkisz, J.; Gallas, D.; Siedlecki, M.; Szymlet, N.; Sokolnicka, B. Exhaust emissions of an LPG powered vehicle in real operating conditions. In Proceedings of the E3S Web of Conferences, Polanica-Zdrój, Poland, 8–10 April 2019; EDP Sciences: Les Ulis, France; Volume 100, p. 53. [Google Scholar] [CrossRef] [Green Version]
- Bielaczyc, P.; Merkisz, J.; Pielecha, J.; Woodburn, J. A Comparison of Gaseous Emissions from a Hybrid Vehicle and a Non-Hybrid Vehicle under Real Driving Conditions; SAE International: Warrendale, PA, USA, 2018. [Google Scholar] [CrossRef]
- Jurkovič, M.; Kalina, T.; Skrúcaný, T.; Gorzelanczyk, P.; Ľupták, V. Environmental Impacts of Introducing LNG as Alter-native Fuel for Urban Buses—Case Study in Slovakia. Promet. Traffic Transp. 2020, 32, 837–847. [Google Scholar] [CrossRef]
- Caban, J. Study of eco-driving possibilities in passenger car used in urban traffic. Arch. Motoryz. 2021, 91, 37–48. [Google Scholar] [CrossRef]
- Luján, J.M.; Guardiola, C.; Pla, B.; Pandey, V. Impact of driving dynamics in RDE test on NOx emissions dispersion. Proc. Inst. Mech. Eng. Part D J. Automob. Eng. 2019, 234, 1770–1778. [Google Scholar] [CrossRef]
- Usman, M.; Farooq, M.; Naqvi, M.; Saleem, M.W.; Hussain, J.; Naqvi, S.R.; Jahangir, S.; Usama, H.M.J.; Idrees, S.; Anukam, A. Use of Gasoline, LPG and LPG-HHO Blend in SI Engine: A Comparative Performance for Emission Control and Sus-tainable Environment. Processes 2020, 8, 74. [Google Scholar] [CrossRef] [Green Version]
- Petro, F.; Konecny, V. Calculation of Emissions from Transport Services and their use for the Internalisation of External Costs in Road Transport. Procedia Eng. 2017, 192, 677–682. [Google Scholar] [CrossRef]
- Ropkins, K.; Beebe, J.; Li, H.; Daham, B.; Tate, J.; Bell, M.; Andrews, G. Real-World Vehicle Exhaust Emissions Monitoring: Review and Critical Discussion. Crit. Rev. Environ. Sci. Technol. 2009, 39, 79–152. [Google Scholar] [CrossRef]
- Skrúcaný, T.; Kendra, M.; Kalina, T.; Jurkovič, M.; Vojtek, M.; Synák, F. Environmental Comparison of Different Transport Modes. Naše More 2018, 65, 192–196. [Google Scholar] [CrossRef]
- DieselNet. Cars and Light Trucks. Available online: https://dieselnet.com/standards/eu/ld.php#test (accessed on 31 August 2021).
- Jaśkiewicz, M.; Lisiecki, J.; Lisiecki, S.; Pokropiński, E.; Więckowski, D. Facility for performance testing of power transmission units. Zesz. Nauk. Akad. Morskiej w Szczec. 2015, 42, 14–25. [Google Scholar]
- Kubáňová, J.; Kubasáková, I.; Dočkalik, M. Analysis of the Vehicle Fleet in the EU with Regard to Emissions Standards. Transp. Res. Procedia 2021, 53, 180–187. [Google Scholar] [CrossRef]
Figure 1.
Description of the measuring route—driving in an urban environment (online maps: Mapy.cz).
Figure 1.
Description of the measuring route—driving in an urban environment (online maps: Mapy.cz).

Figure 2.
Description of the measuring route—driving on the motorway section (online maps: Mapy.cz).
Figure 2.
Description of the measuring route—driving on the motorway section (online maps: Mapy.cz).

Figure 3.
Description of the measuring route—driving outside the city (online maps: Mapy.cz).

Figure 4.
The course of speed and revolutions of the vehicle during the measurement [author].

Figure 5.
Schematic representation of the performed measurement.

Figure 6.
Exhaust gas analyzer MAHA MGT 5 [44].
Figure 6.
Exhaust gas analyzer MAHA MGT 5 [44].

Figure 7.
HC (A) and NOx (B) production process while driving.


Figure 8.
CO (A) and CO2 (B) production during driving [author].

Figure 9.
Lambda value during measurement [author].

Figure 10.
ELM 327 diagnostic tool [45].
Figure 10.
ELM 327 diagnostic tool [45].

Figure 11.
Measured vehicle Subaru Impreza [author].

Figure 12.
Comparison of CO production [measurement results processed by the author].

Figure 13.
Comparison of CO2 production [measurement results processed by the author].

Figure 14.
Comparison of HC production [measurement results processed by the author].

Figure 15.
Comparison of NOx production [measurement results processed by the author].

Figure 16.
Comparison of emission production depending on engine speed—Petrol, urban cycle.

Figure 17.
Comparison of emission production depending on engine speed—LPG, urban cycle.

Figure 18.
Production of monitored emissions in relation to the excess air factor λ [author].


Table 1.
RDE driving requirements [27].
Table 1.
RDE driving requirements [27].
| Driving in the village is characterized by a vehicle speed of up to 60 km/h. |
| Driving outside the village is characterized by vehicle speed from 60 to 90 km/h. |
| Driving on motorways is characterized by a vehicle speed higher than 90 km/h. |
| Driving consists of approximately 34% driving in the village, 33% driving outside the village, and 33% riving on the motorway; these sections are classified according to speed. |
| The vehicle speed does not normally exceed 145 km/h. This maximum speed may be exceeded by a maximum deviation of 15 km/h at intervals not exceeding 3% of the total driving time on the motorway. |
| The average speed (including stops) while driving in the village should be in the range of 15 to 30 km/h. Stop times, defined as the time when the vehicle speed does not exceed 1 km/h, represent at least 10% of the driving time in the village. |
| The speed range when driving on the motorway properly covers the speed range from 90 to at least 110 km/h. The vehicle speed is higher than 100 km/h for at least 5 min. |
| Driving time ranges from 90 to 120 min. |
| The altitude of the start and end points does not differ by more than 100 m. |
| The minimum distance traveled in the village, outside the village, and on the highway is 16 km. |
Table 2.
Technical data MAHA MGT5 [44].
Table 2.
Technical data MAHA MGT5 [44].
| Technical Data MAHA MGT 5 | |||||
|---|---|---|---|---|---|
| Measured Gases | CO | CO2 | HC | O2 | NOx |
| Measuring ranges | 0–15.00 Vol% | 0–20.00 Vol% | 0–2000 ppm Vol (Hexan) 0–4000 ppm Vol (Propan) | 0–25.00 Vol% | 0–5000 ppm Vol |
| Measurement accuracy | 0.06 Vol% | 0.5 Vol% | 12 ppm | 0.1 Vol% | 32–120 ppm Vol |
| Measurement principle | Infrared | infrared | infrared | electro-chemical | electro-chemical |
| Value resolution | 0.001 | 0.01 | 0.1 | 0.01 | 1 |
| Measuring range deviation | less than ±0.6% of the final value of the measuring range | ||||
| Flow | max. 3.5 l/min • min 1.5 l/min | ||||
| Gas outlet | approx. 2.5 l/min | ||||
| Condensate drain | automatically, continuously • approx. 1 l/min | ||||
| Working pressure | 750–1100 mbar | ||||
| Pressure fluctuations | max. error 0.2% with fluctuations of 5 kPa | ||||
Table 3.
Technical parameters of the measured vehicle [certificate of registration].
| Technical Parameters of the Measured Vehicle | |
|---|---|
| Brand | SUBARU |
| Trade name | Impreza |
| Engine code | EJ20 |
| Number of cylinders | 4 |
| Cylinder displacement | 1994 cm3 |
| Highest engine power | 118.00 kW |
| Speed at max. torque | 6400 min−1 |
| Fuel type | Petrol/LPG |
| Length | 4465 mm |
| Width | 1740 mm |
| Operating mass | 1440 kg |
| Size and type of tires | 205/50 R16 87V |
Table 4.
Amount of emissions produced [measurement results processed by the author].
| s | CO | CO2 | HC | NOx | |
|---|---|---|---|---|---|
| km | g/km | g/km | g/km | g/km | |
| Petrol—urban | 21.50 | 2.17480 | 249.966 | 0.00614 | 0.03886 |
| Petrol—rural | 26.50 | 0.61223 | 209.320 | 0.00232 | 0.01995 |
| Petrol—motorway | 21.40 | 3.30445 | 195.637 | 0.00382 | 0.03701 |
| weighted average | 1.92648 | 217.693 | 0.00397 | 0.03107 | |
| LPG—urban | 21.50 | 3.00000 | 233.632 | 0.00732 | 0.03565 |
| LPG—rural | 26.50 | 0.94798 | 184.675 | 0.00353 | 0.03107 |
| LPG—motorway | 21.40 | 1.94930 | 230.479 | 0.00223 | 0.09220 |
| weighted average | 1.89246 | 213.966 | 0.00430 | 0.05134 |
Table 5.
Measured values of road emissions for CO, CO2, HC, and NOx in relation to Euro 4 and COC limits [57].
Table 5.
Measured values of road emissions for CO, CO2, HC, and NOx in relation to Euro 4 and COC limits [57].
| Monitored Value | CO | CO2 | NOx | HC | ||||||||
|---|---|---|---|---|---|---|---|---|---|---|---|---|
| EURO 4 Limit | COC | Driving Test | EURO 4 Limit | COC | Driving Test | EURO 4 Limit | COC | Driving Test | EURO 4 Limit | COC | Driving Test | |
| Petrol | 1 | 0.192 | 1.926 | 214 | 217.693 | 0.15 | 0.018 | 0.031 | 0.1 | 0.017 | 0.0039 | |
| LPG | 1 | 0.192 | 1.892 | 214 | 213.966 | 0.15 | 0.018 | 0.051 | 0.1 | 0.017 | 0.0043 | |
Table 6.
Comparison of emission production based on weighted arithmetic averages [measurement results processed by the author].
Table 6.
Comparison of emission production based on weighted arithmetic averages [measurement results processed by the author].
| CO | CO2 | HC | NOx | |
|---|---|---|---|---|
| Petrol |  | |  | |
| LPG | | | | |
Publisher’s Note: MDPI stays neutral with regard to jurisdictional claims in published maps and institutional affiliations. |
© 2022 by the authors. Licensee MDPI, Basel, Switzerland. This article is an open access article distributed under the terms and conditions of the Creative Commons Attribution (CC BY) license (https://creativecommons.org/licenses/by/4.0/).
Share and Cite
MDPI and ACS Style
Šarkan, B.; Jaśkiewicz, M.; Kubiak, P.; Tarnapowicz, D.; Loman, M. Exhaust Emissions Measurement of a Vehicle with Retrofitted LPG System. Energies 2022, 15, 1184. https://0-doi-org.brum.beds.ac.uk/10.3390/en15031184
AMA Style
Šarkan B, Jaśkiewicz M, Kubiak P, Tarnapowicz D, Loman M. Exhaust Emissions Measurement of a Vehicle with Retrofitted LPG System. Energies. 2022; 15(3):1184. https://0-doi-org.brum.beds.ac.uk/10.3390/en15031184
Chicago/Turabian StyleŠarkan, Branislav, Marek Jaśkiewicz, Przemysław Kubiak, Dariusz Tarnapowicz, and Michal Loman. 2022. "Exhaust Emissions Measurement of a Vehicle with Retrofitted LPG System" Energies 15, no. 3: 1184. https://0-doi-org.brum.beds.ac.uk/10.3390/en15031184
Note that from the first issue of 2016, this journal uses article numbers instead of page numbers. See further details here.