
Techno-Environmental Evaluation of a Liquefied Natural Gas-Fuelled Combined Gas Turbine with Steam Cycles for Large Container Ship Propulsion Systems

Abstract
:1. Introduction
- Jefferson [8] studied the performance of a simple CCGT propulsion system under steady-state operation and transient periods, including acceleration, deceleration, and the impact of inlet air conditions. The heat recovery steam generator adopted in this study was a single-pressure generator. Therefore, the CCGT performance was affected by atmospheric conditions such as temperature, pressure, and relative humidity;
- Edwin [3] studied the cycle efficiency, specific fuel consumption, and boil-off gas of a simple CCGT fuelled by natural gas, in addition to a two-stroke diesel engine fuelled by heavy fuel oil for propulsion systems in liquefied natural gas ships. Additionally, they studied the emissions (SOX, NOX, and CO2) and fuel consumption reductions in the CCGT. The results of this study demonstrated that CCGT propulsion is an attractive alternative for LNG ships. LNG permits a lower CO2 footprint (by approximately 20%) because of its higher hydrogen content. Another fundamental advantage of natural gas fuel is that it delivers (in land applications) very low (25 ppm) amounts of NOx with appropriately designed combustors;
- Benvenuto [9] studied a simple CCGT fuelled by marine gas oil as an alternative to a two-stroke diesel engine fuelled by heavy fuel oil for the propulsion of a 9000 twenty-foot equivalent unit container ship. They investigated the performance of the powerplant and the efficiency of the design and high-load off-design conditions in both steady-state and dynamic situations, and determined the engine weight, dimensions, layout, capacity, and maintenance costs. The results revealed lower amounts of pollutant emissions from the CCGT plant than the two-stroke diesel engines. Furthermore, in terms of weight and dimensions, the two-stroke diesel engine had disadvantages compared with the CCGT with equivalent power. In terms of noise and vibration, the two-stroke diesel engine was much higher than the CCGT. The CCGT plant had a slight advantage over the two-stroke diesel engine in terms of engine efficiency. Additionally, the CCGT plant required significantly lower maintenance than a typical marine diesel engine. However, the costs of installation and operation still favoured the diesel engine;
- Benvenuto [10] also studied the performance of a CCGT with a marine gas turbine with a variety of steam turbine plants layouts, including single-pressure and dual-pressure HRSG layouts. The study results showed that the dual-pressure steam plant layout (with two boilers) had complex and high weights, dimensions, and costs, but had the best efficiency. The dual-pressure steam plant layout (with a single boiler) was less efficient. In terms of the complexity, weights, dimensions, and cost, the dual-pressure steam plant layout with one boiler was comparable to the dual-pressure steam plant layout with two boilers;
- Emmanuel-Douglas [11] analysed the performance of an optimal CCGT for cruise ships for 2000 h of operation and with various operating modes in terms of the vessel demands from power, electricity, and heat. The combined-cycle system consisted of a combined gas turbine electric and steam plant, CCGT turbines, a combined diesel–electric and gas turbine plant, a combined power and heat generation plant, and a diesel–electric plant with waste heat recovery. The results showed that the diesel engines show the best results compared with other propulsion systems in the cruise ship in terms of the economic aspects. Additionally, the flexibility of the gas turbine configuration enhanced the performance and made it appropriate for different applications;
- Altosole [2] studied a CCGT with single-pressure HRSG, CCGT with dual-pressure HRSG with a single boiler and CCGT with dual-pressure HRSG with two boilers in contrast to a conventional 2-stroke diesel engine as a prime mover in a 9000 TEU unit large containership. He studied the 2-stroke diesel engine with waste heat recovery as a prime mover in an oil tanker vessel and investigated the performance, emissions, and economic aspects along with the weight and dimensions of all propulsion systems. The results showed that the efficiency levels of the dual-pressure steam plant with two boilers was 1.3% and 2.3% better when compared with the dual-pressure (single boiler) and single-pressure steam plant, respectively. Moreover, the CCGT plant was smaller, and its components weighed less than those of the two-stroke diesel engine. However, it was 20–40% more expensive. The CCGT exhibited an 8% reduction in specific fuel consumption over the two-stroke diesel engine.
- Based on the literature review, the following concepts for marine propulsion systems were studied:
- The use of enhanced LNG cycles with cryogenic qualities to improve CCGT efficiency;
- A comprehensive environmental assessment to measure the emissions of NOX and CO2 from the presented CCGT cycles and a two-stroke diesel engine.
- For these particular cycles, other analytical aspects were brought together for the first time using existing algorithms:
- A technical assessment was performed on the CCGT cycles, simple combined gas turbine–steam system, reheat combined gas steam turbine, and the intercooler–reheat combined gas steam turbine with a single HRSG fuelled by MDO and LNG as propulsion systems in a large container ship;
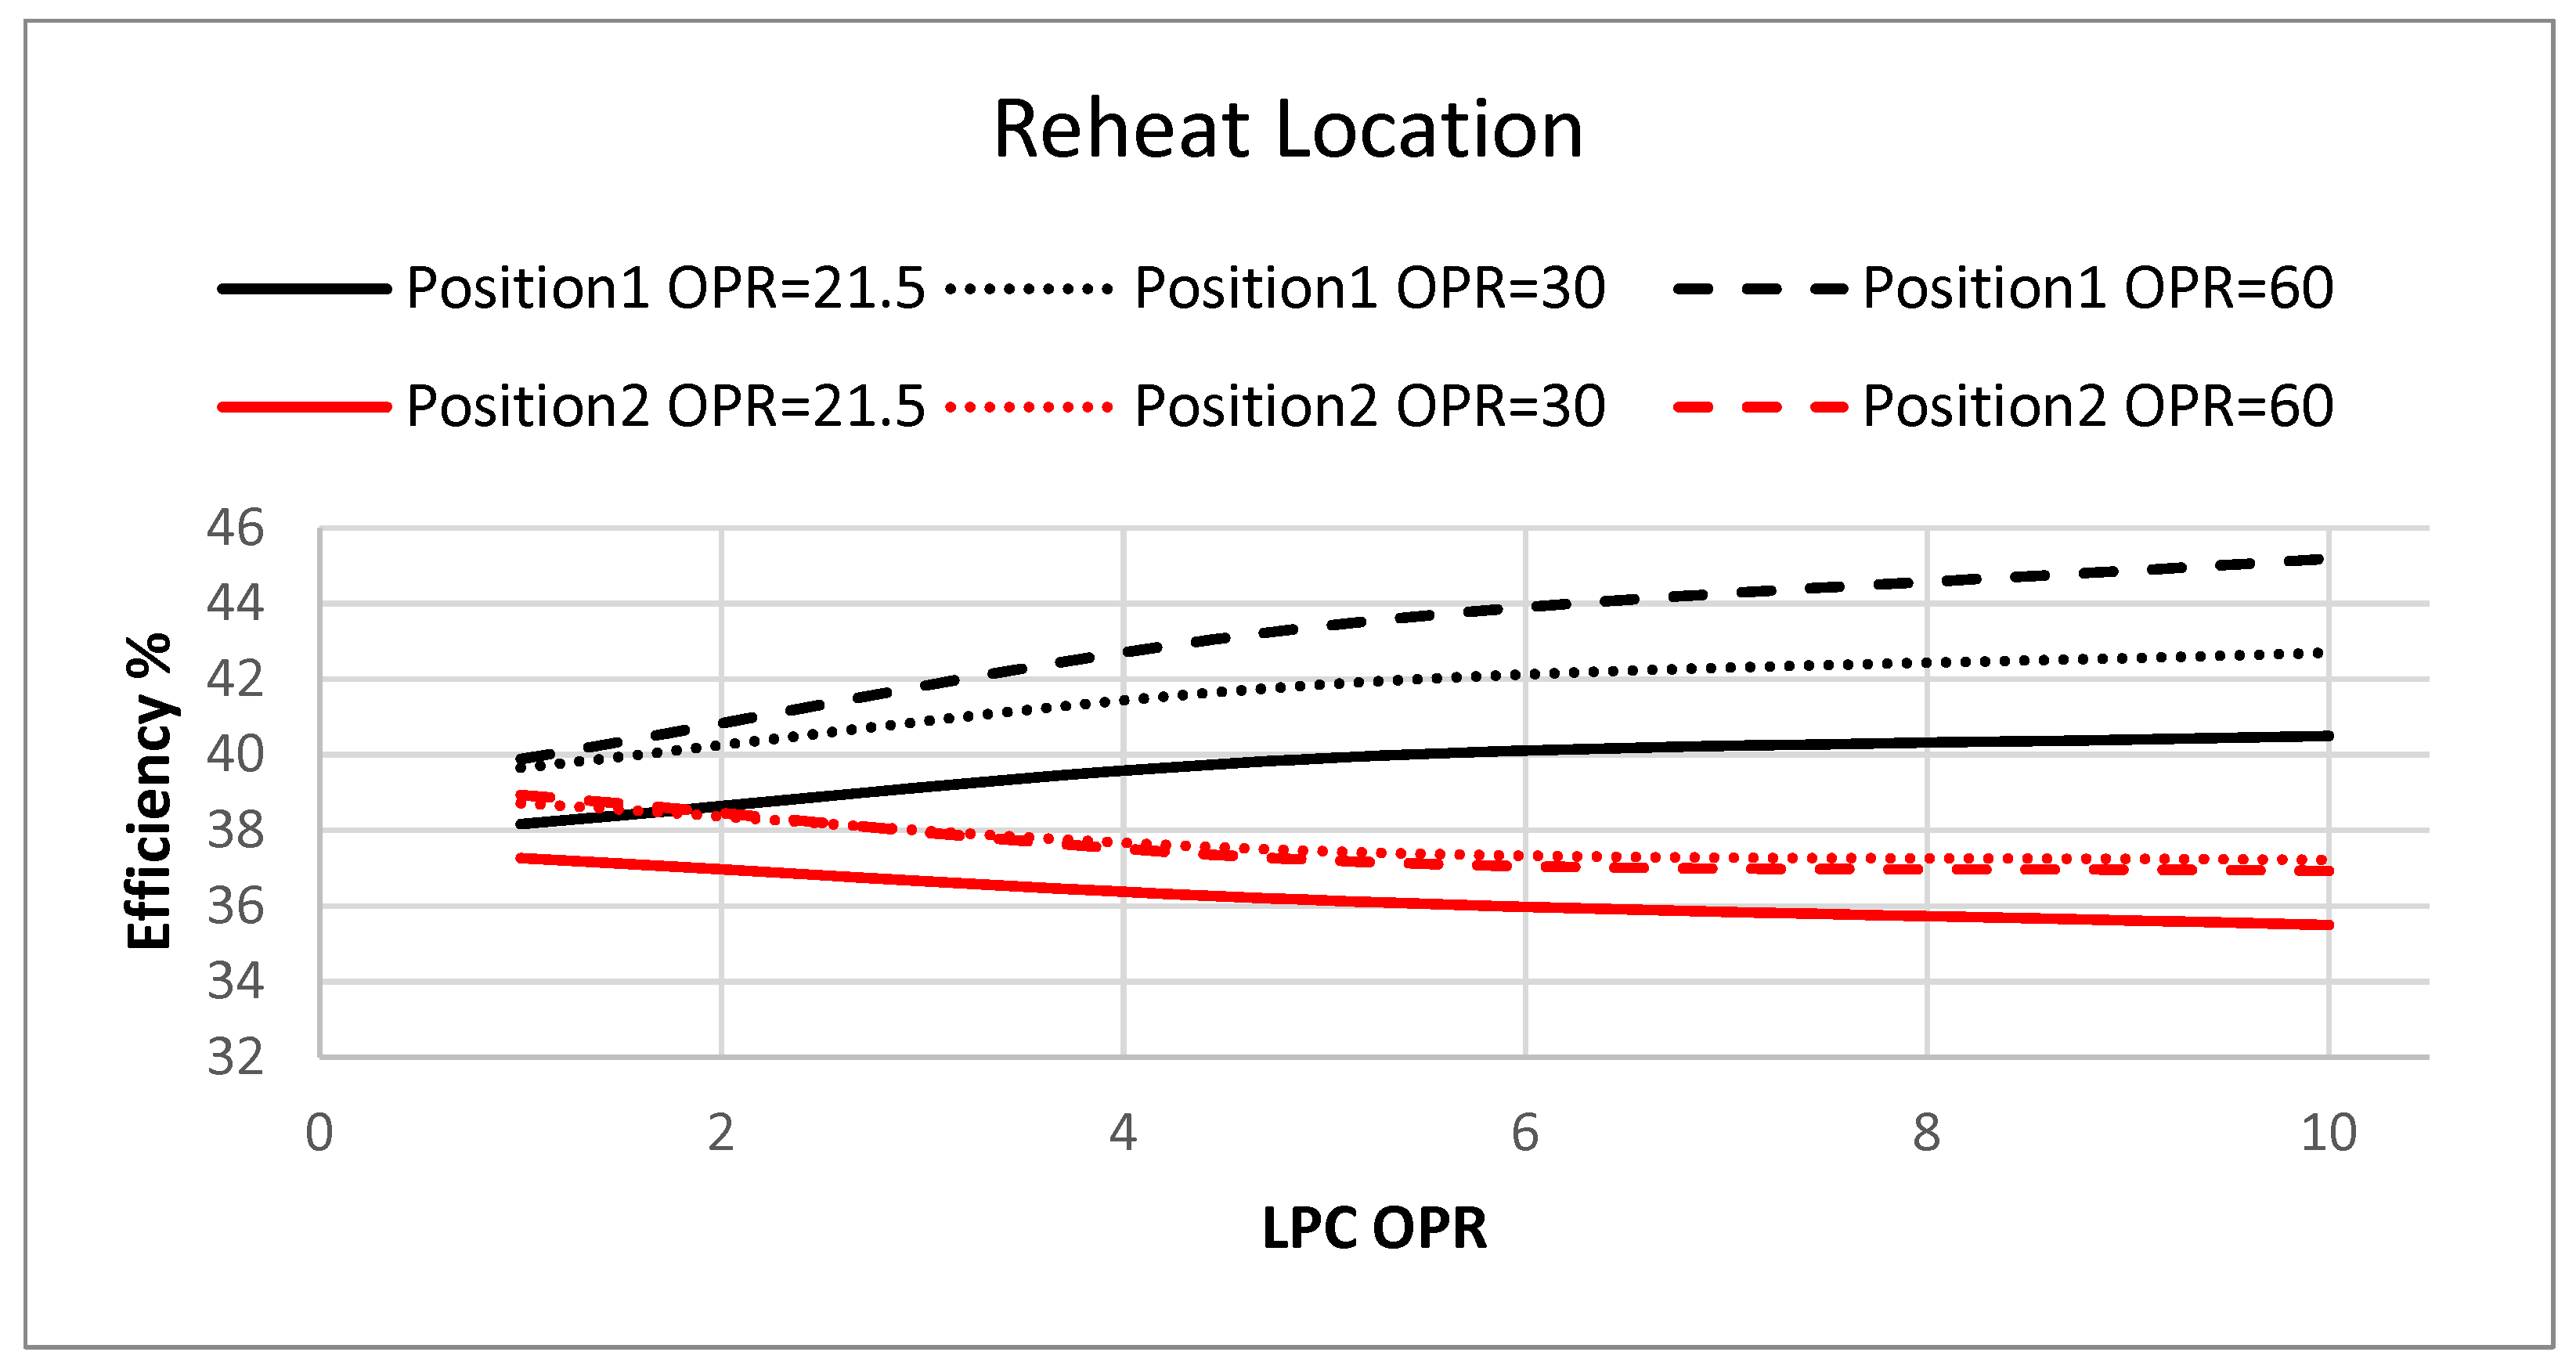
- The possibility of positing the intercooler and reheater was assessed, which can significantly affect the engine output and efficiency;
- A method and model for the sizing and weighting of advanced CCGT cycles for the large container ship was proposed.
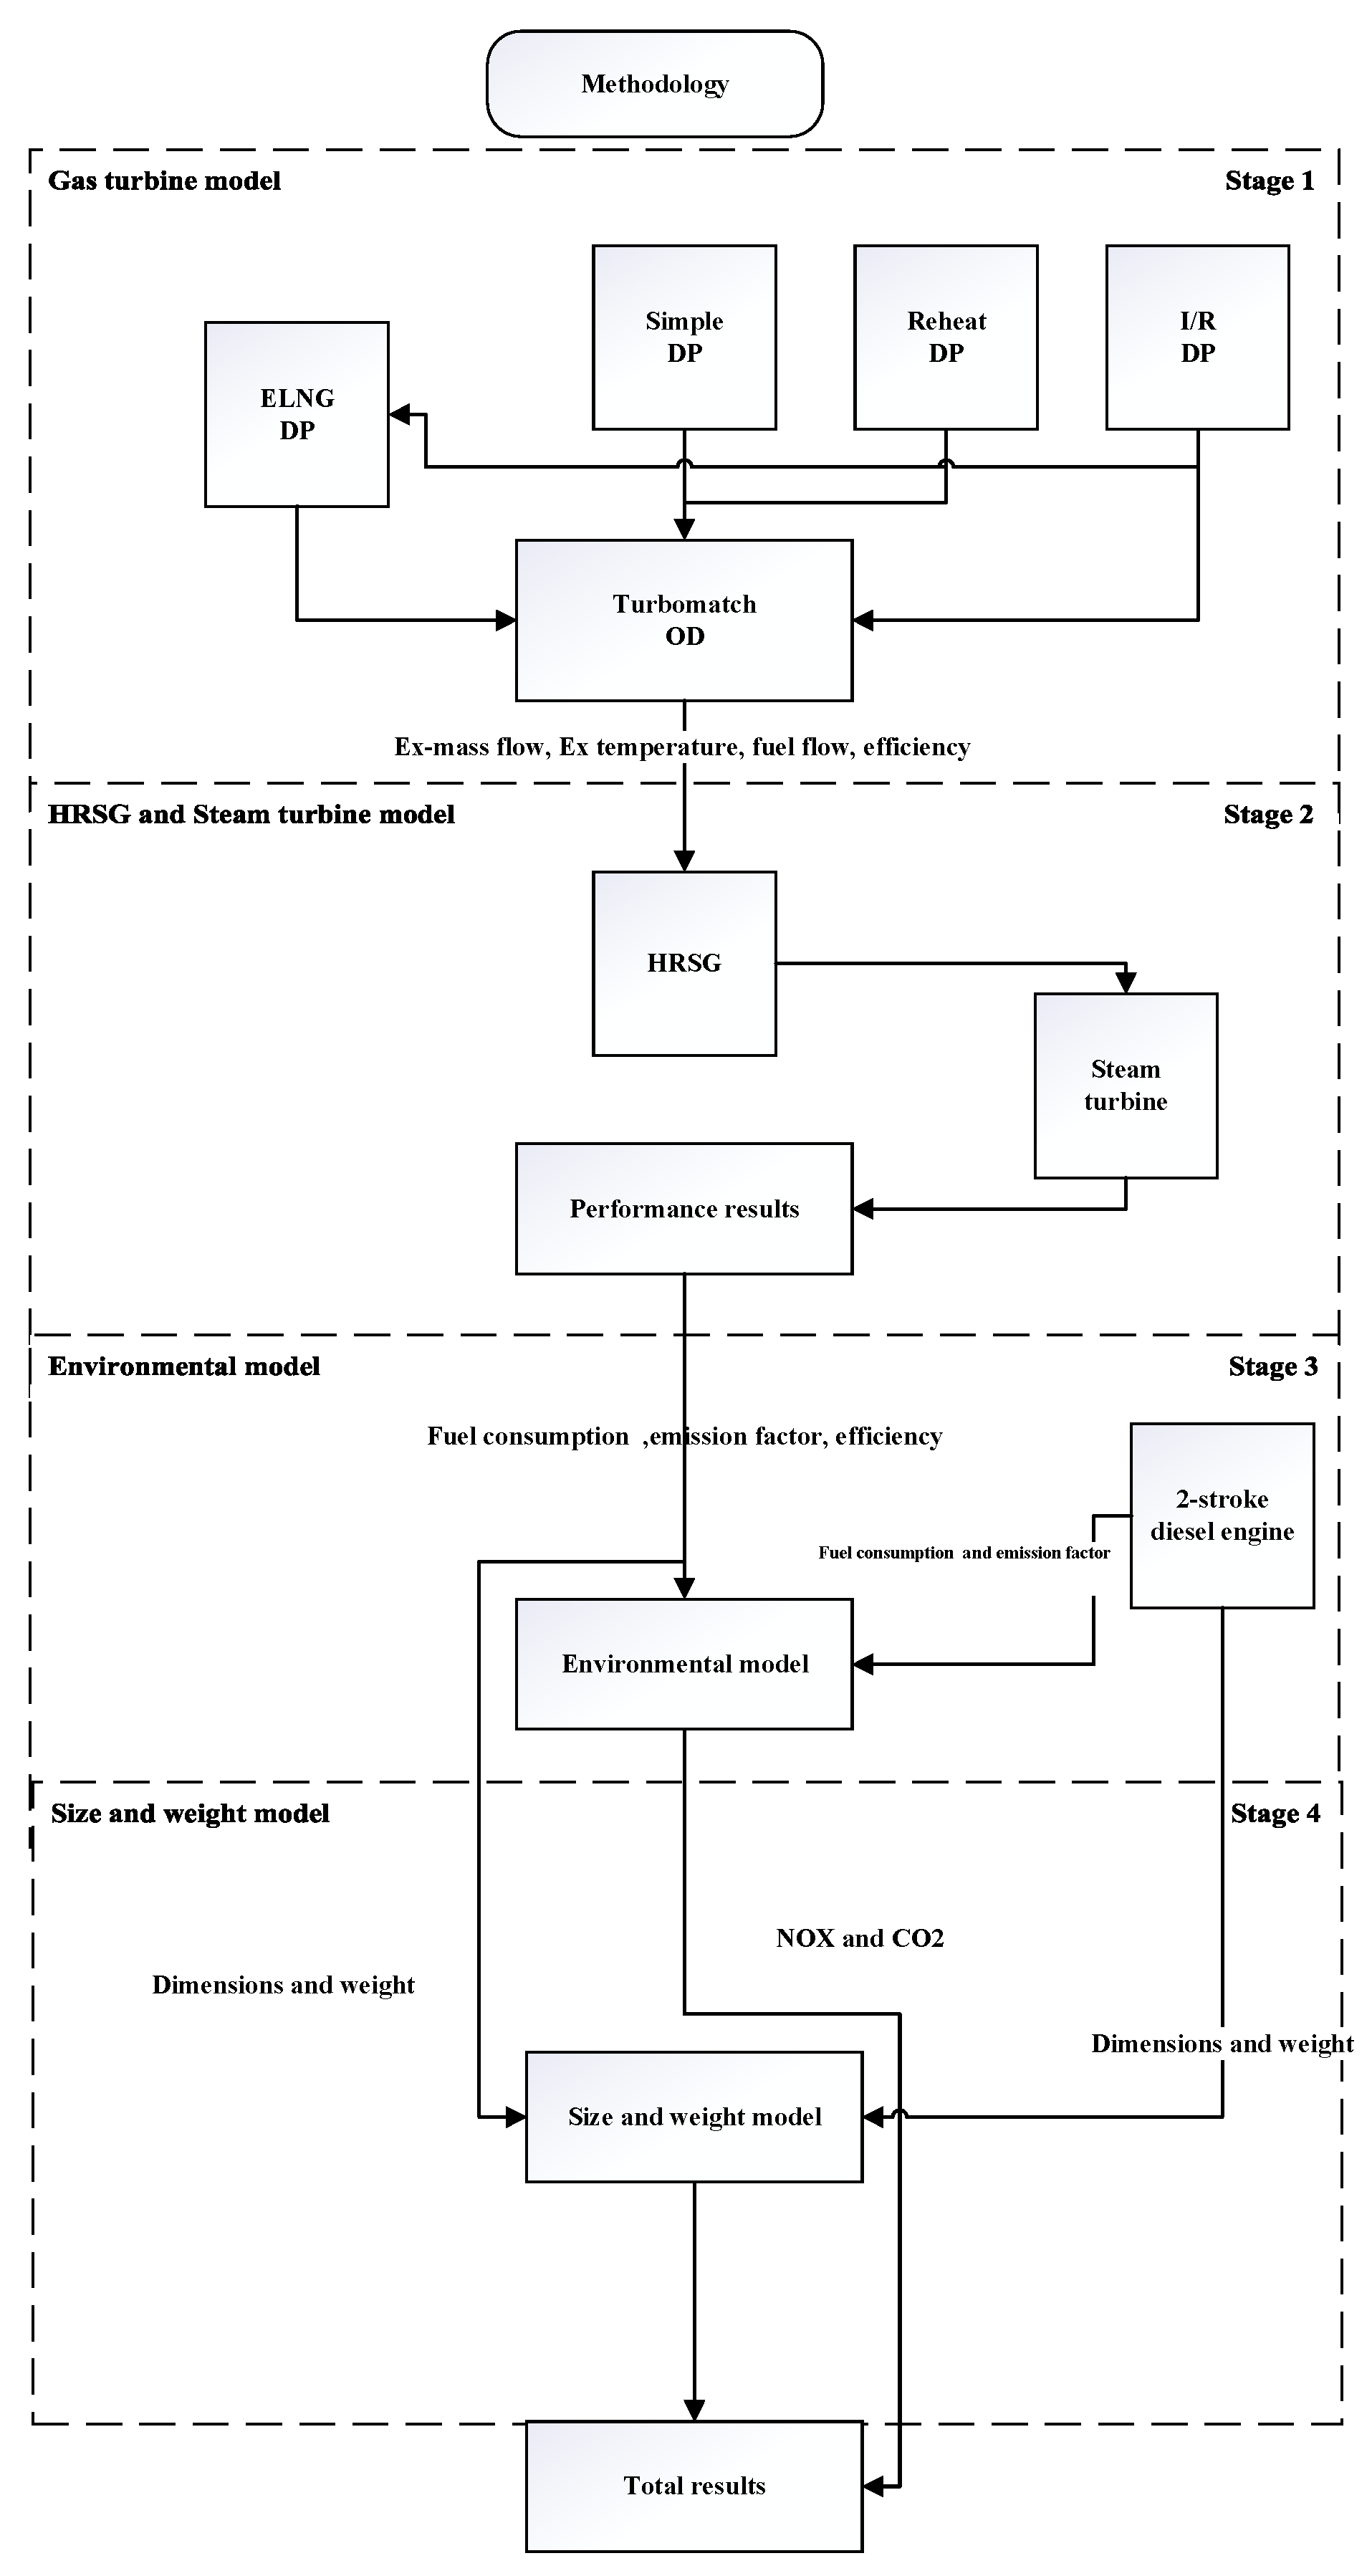
2. Materials and Methods
- Simple cycle fuelled by LNG and MDO;
- Complex cycles incorporating reheating and intercooling fuelled by LNG and MDO;
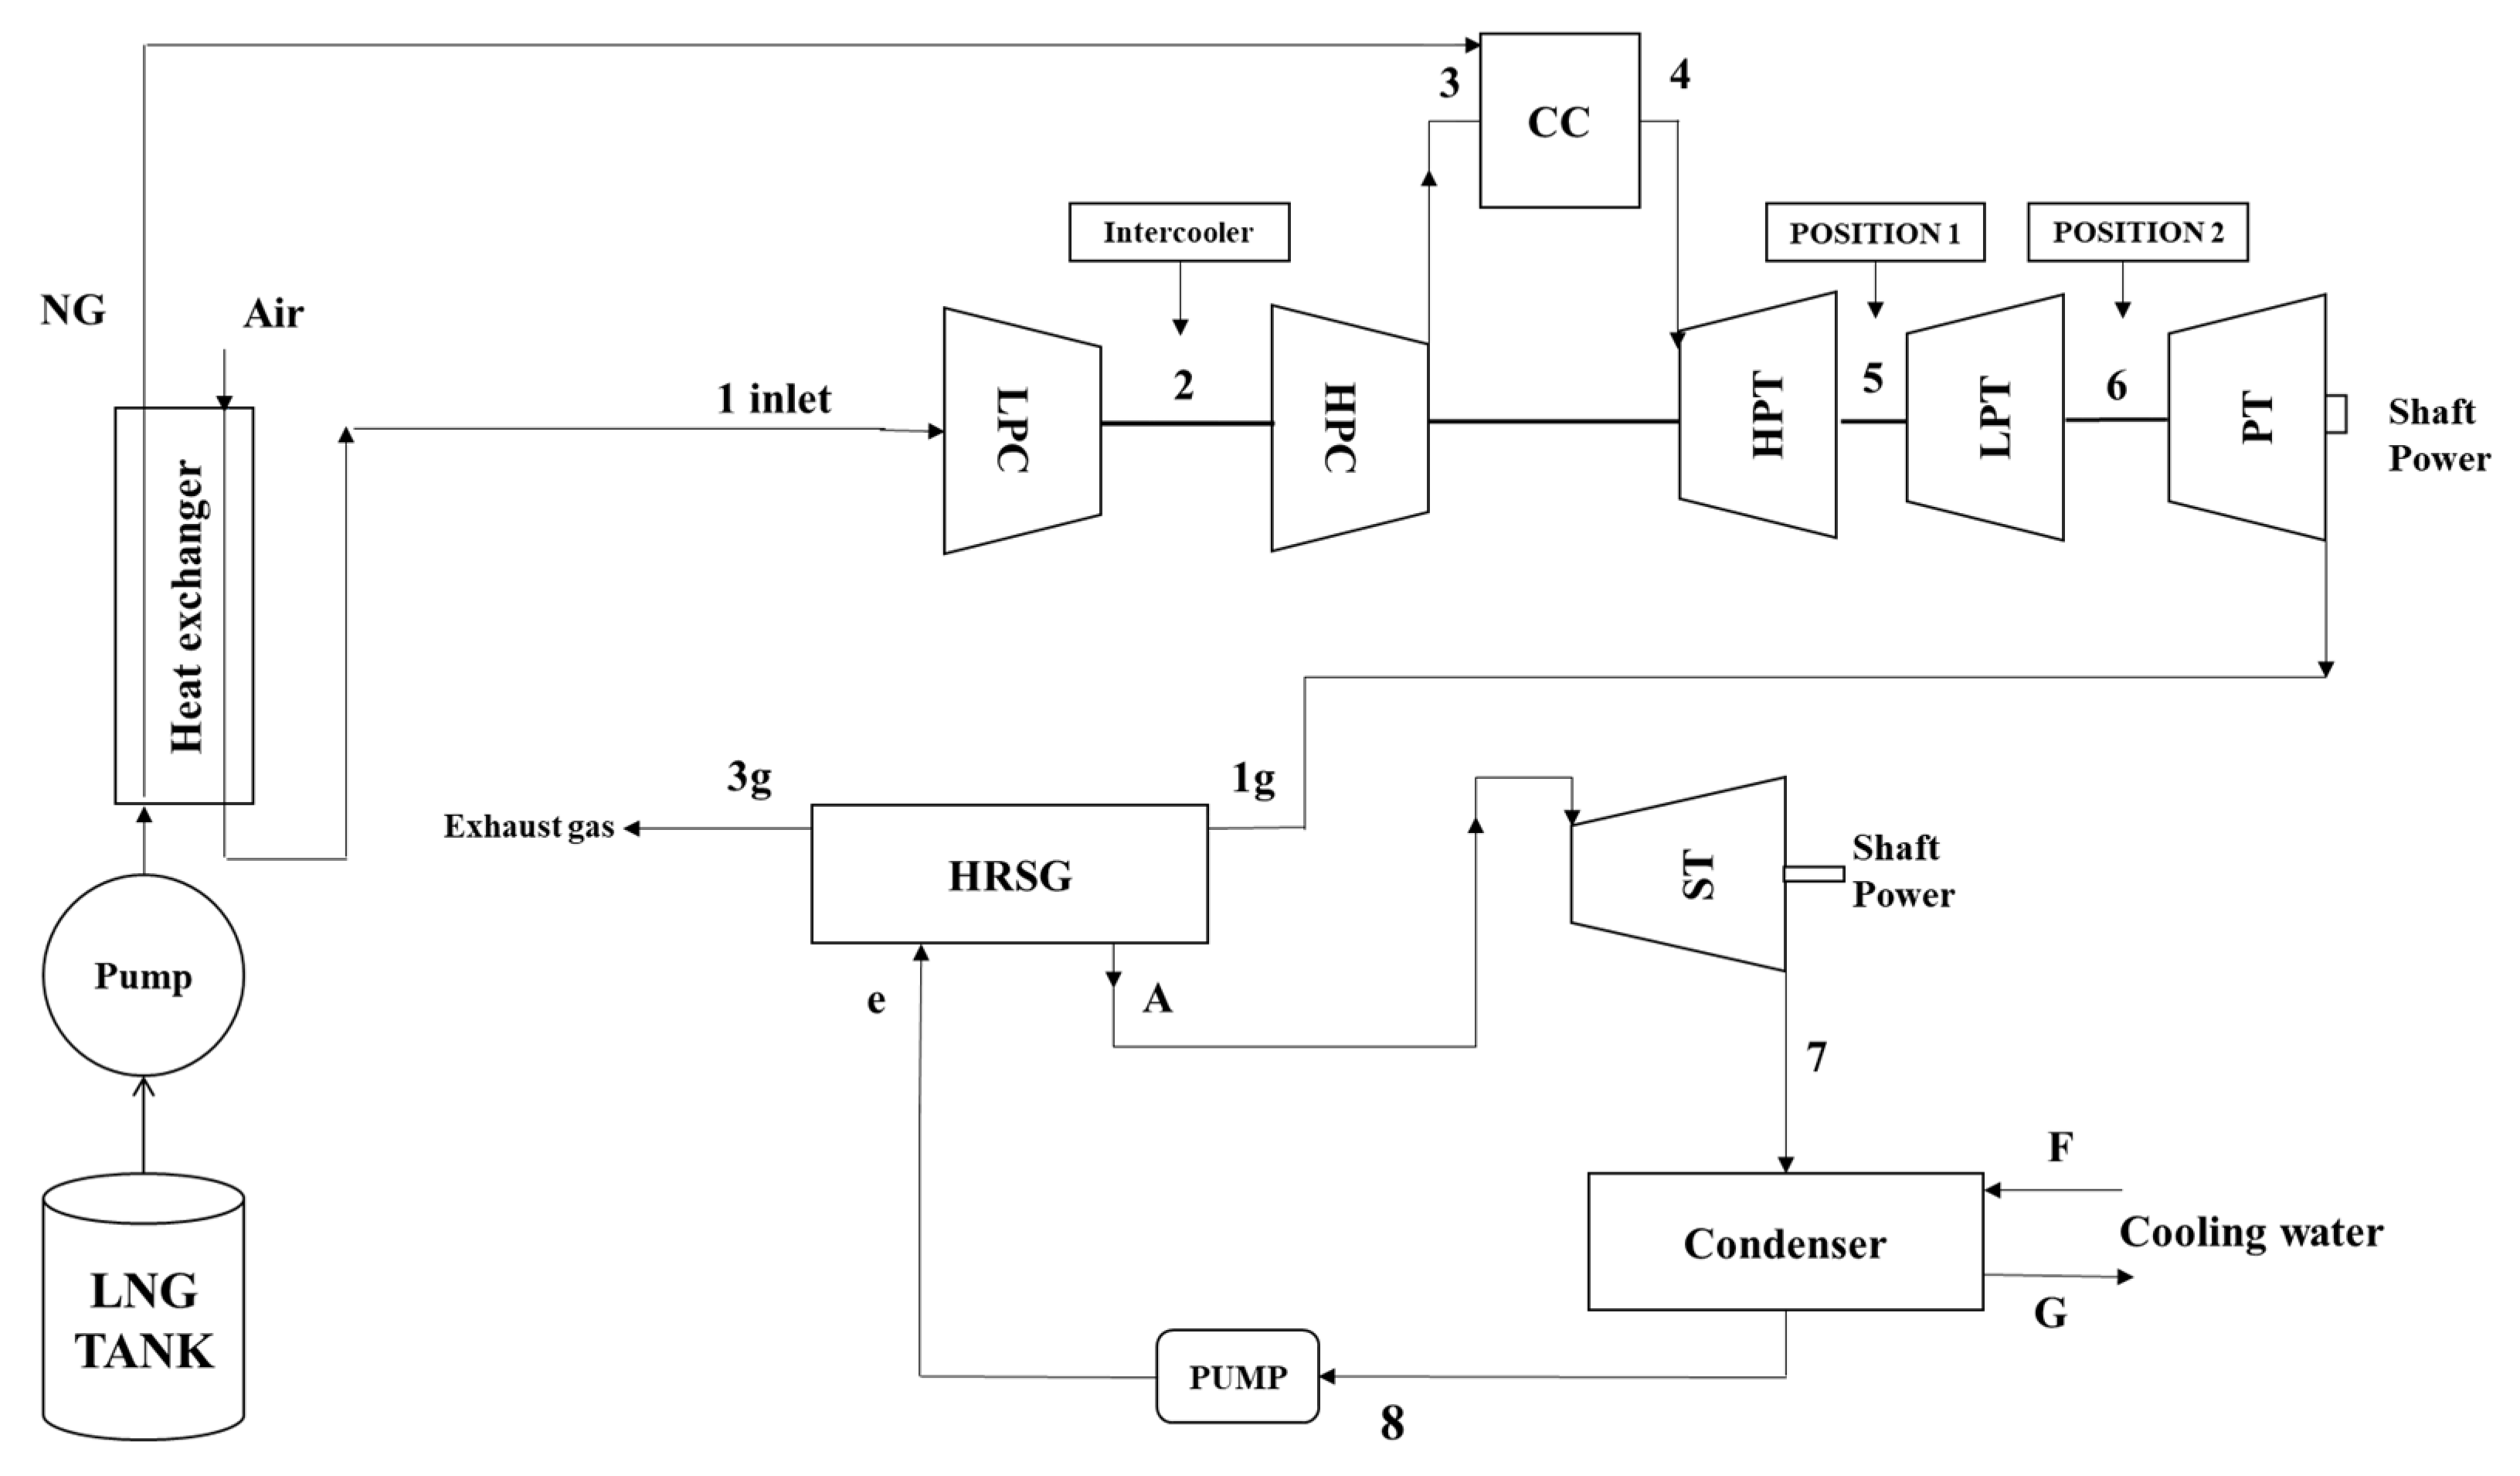
- Enhanced LNG benefitting from LNG’s cryogenic properties.
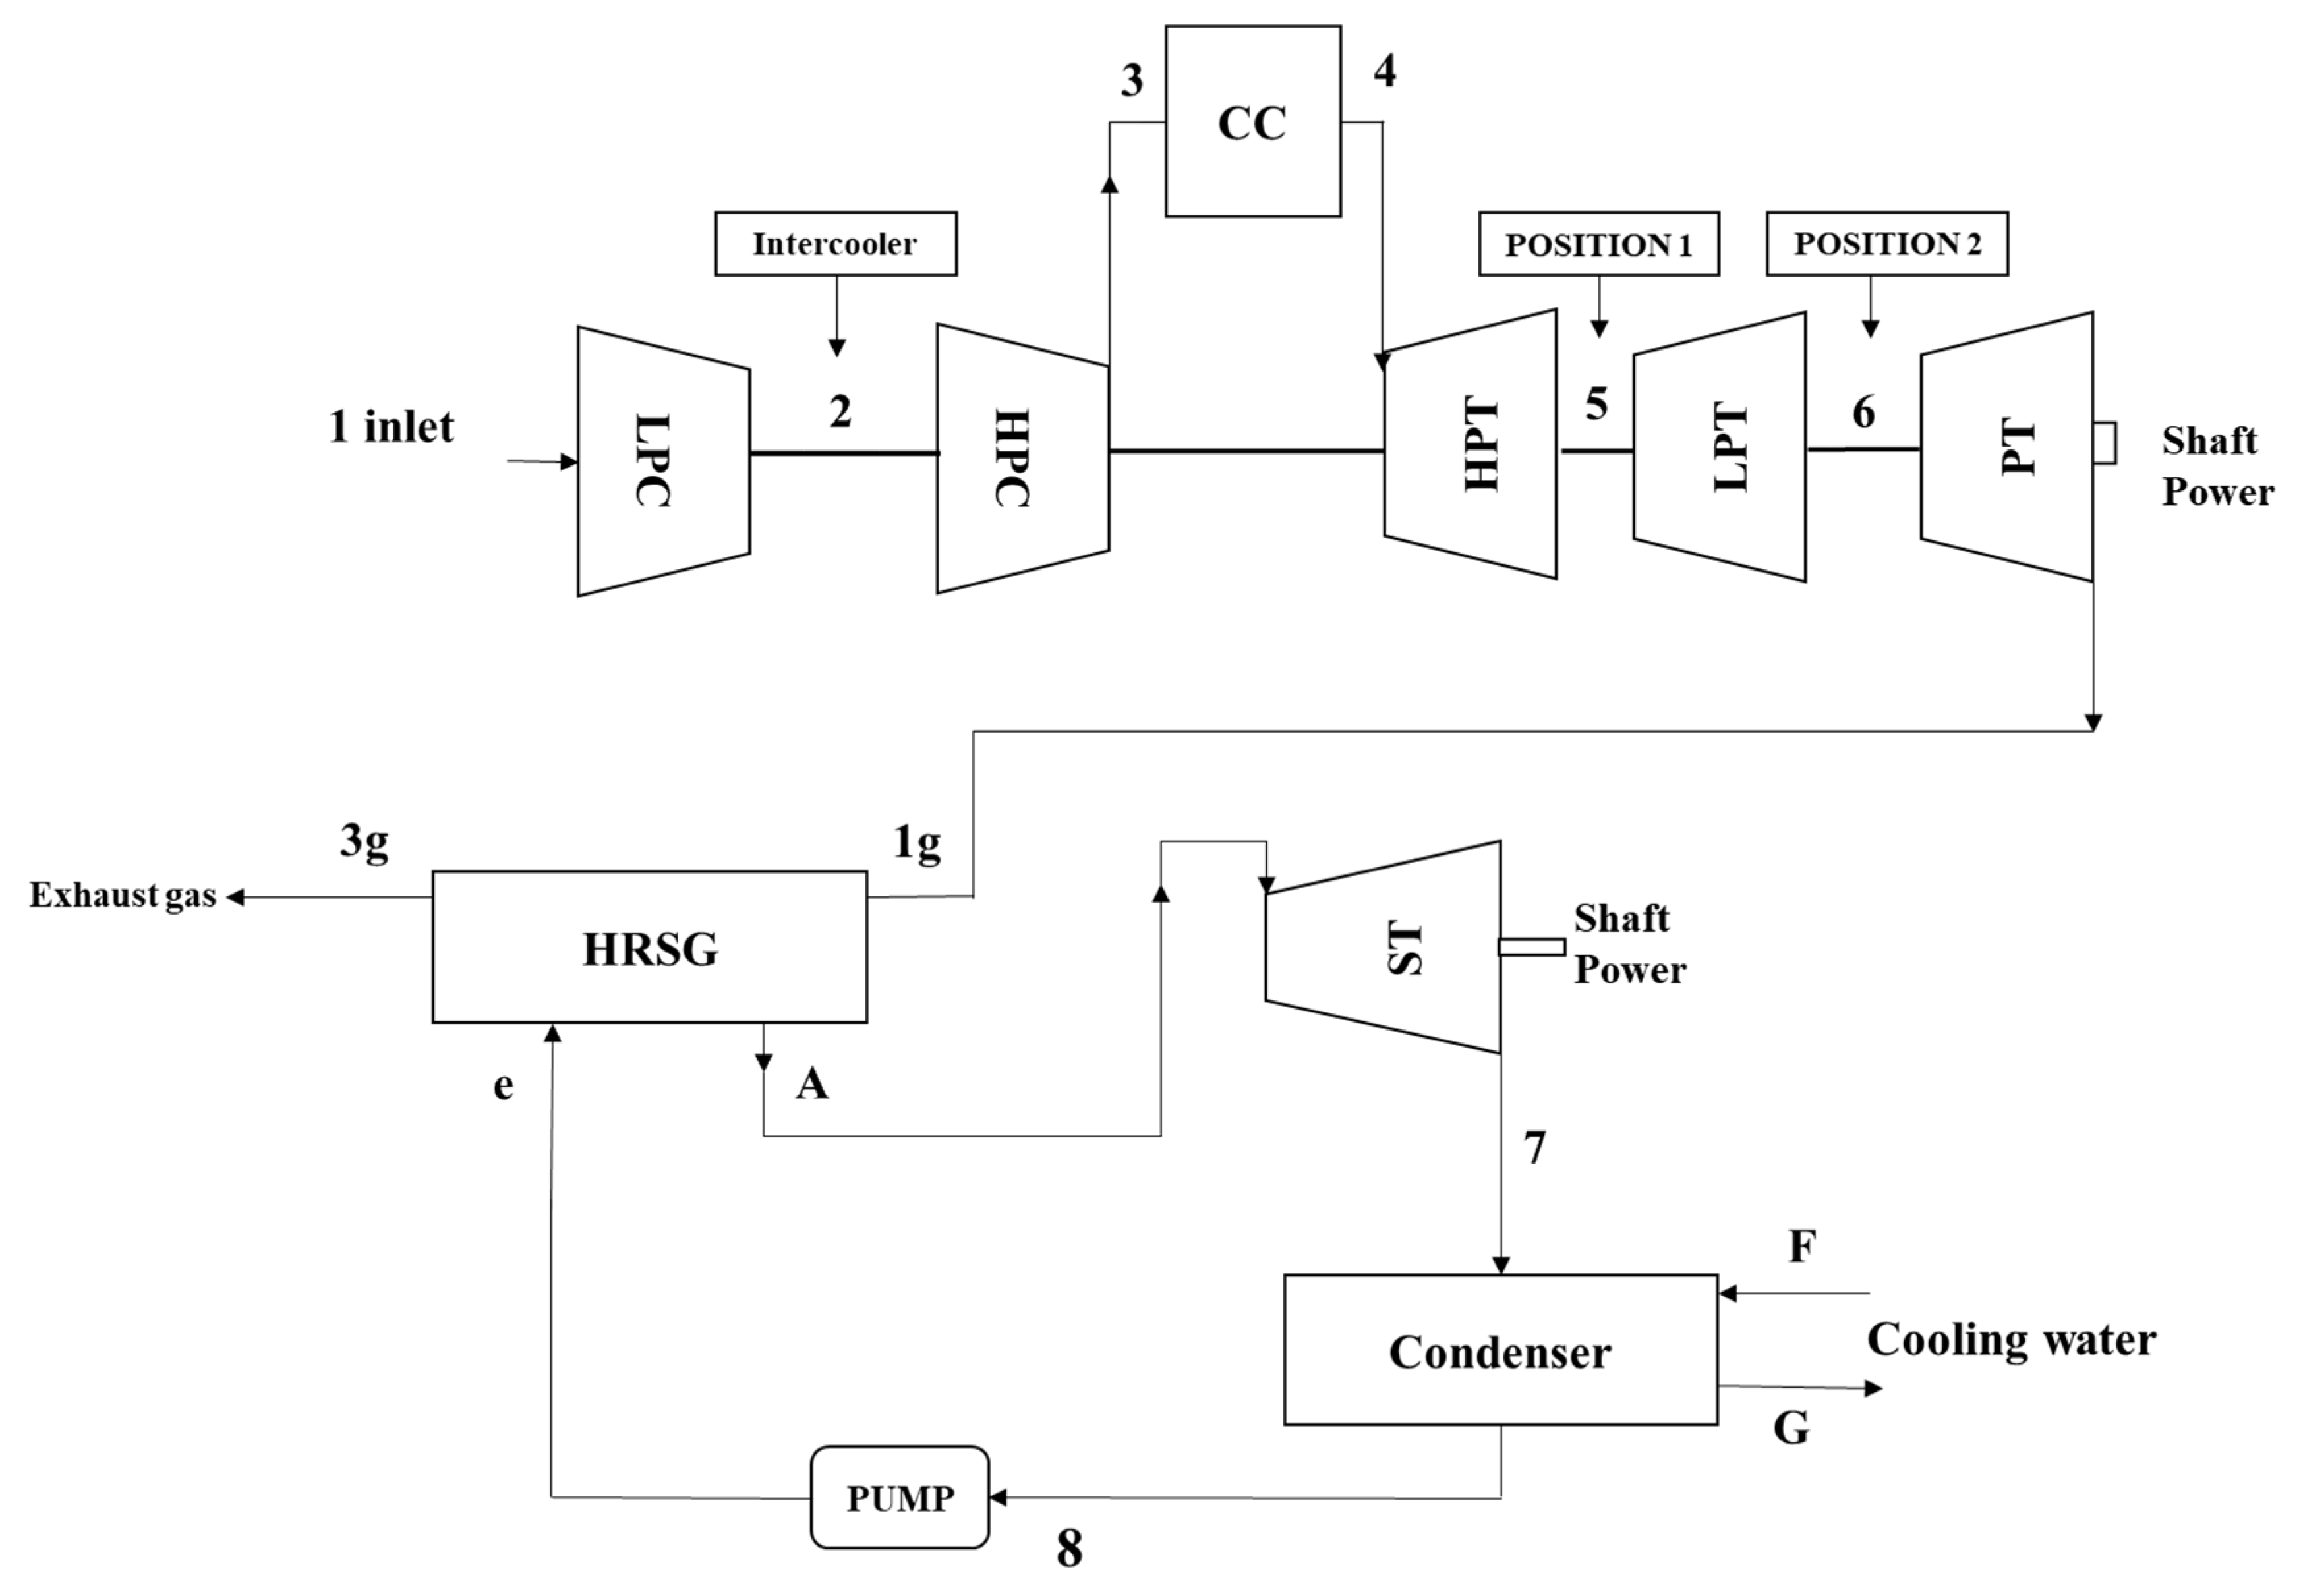
2.1. Combined-Cycle (CCGT) Model
2.1.1. Gas Turbine Model
- D.P. matching calculation of the gas turbine
- Simple, reheat, I/R, and ELNG cycles for D.P. and Off-Design Performance Prediction
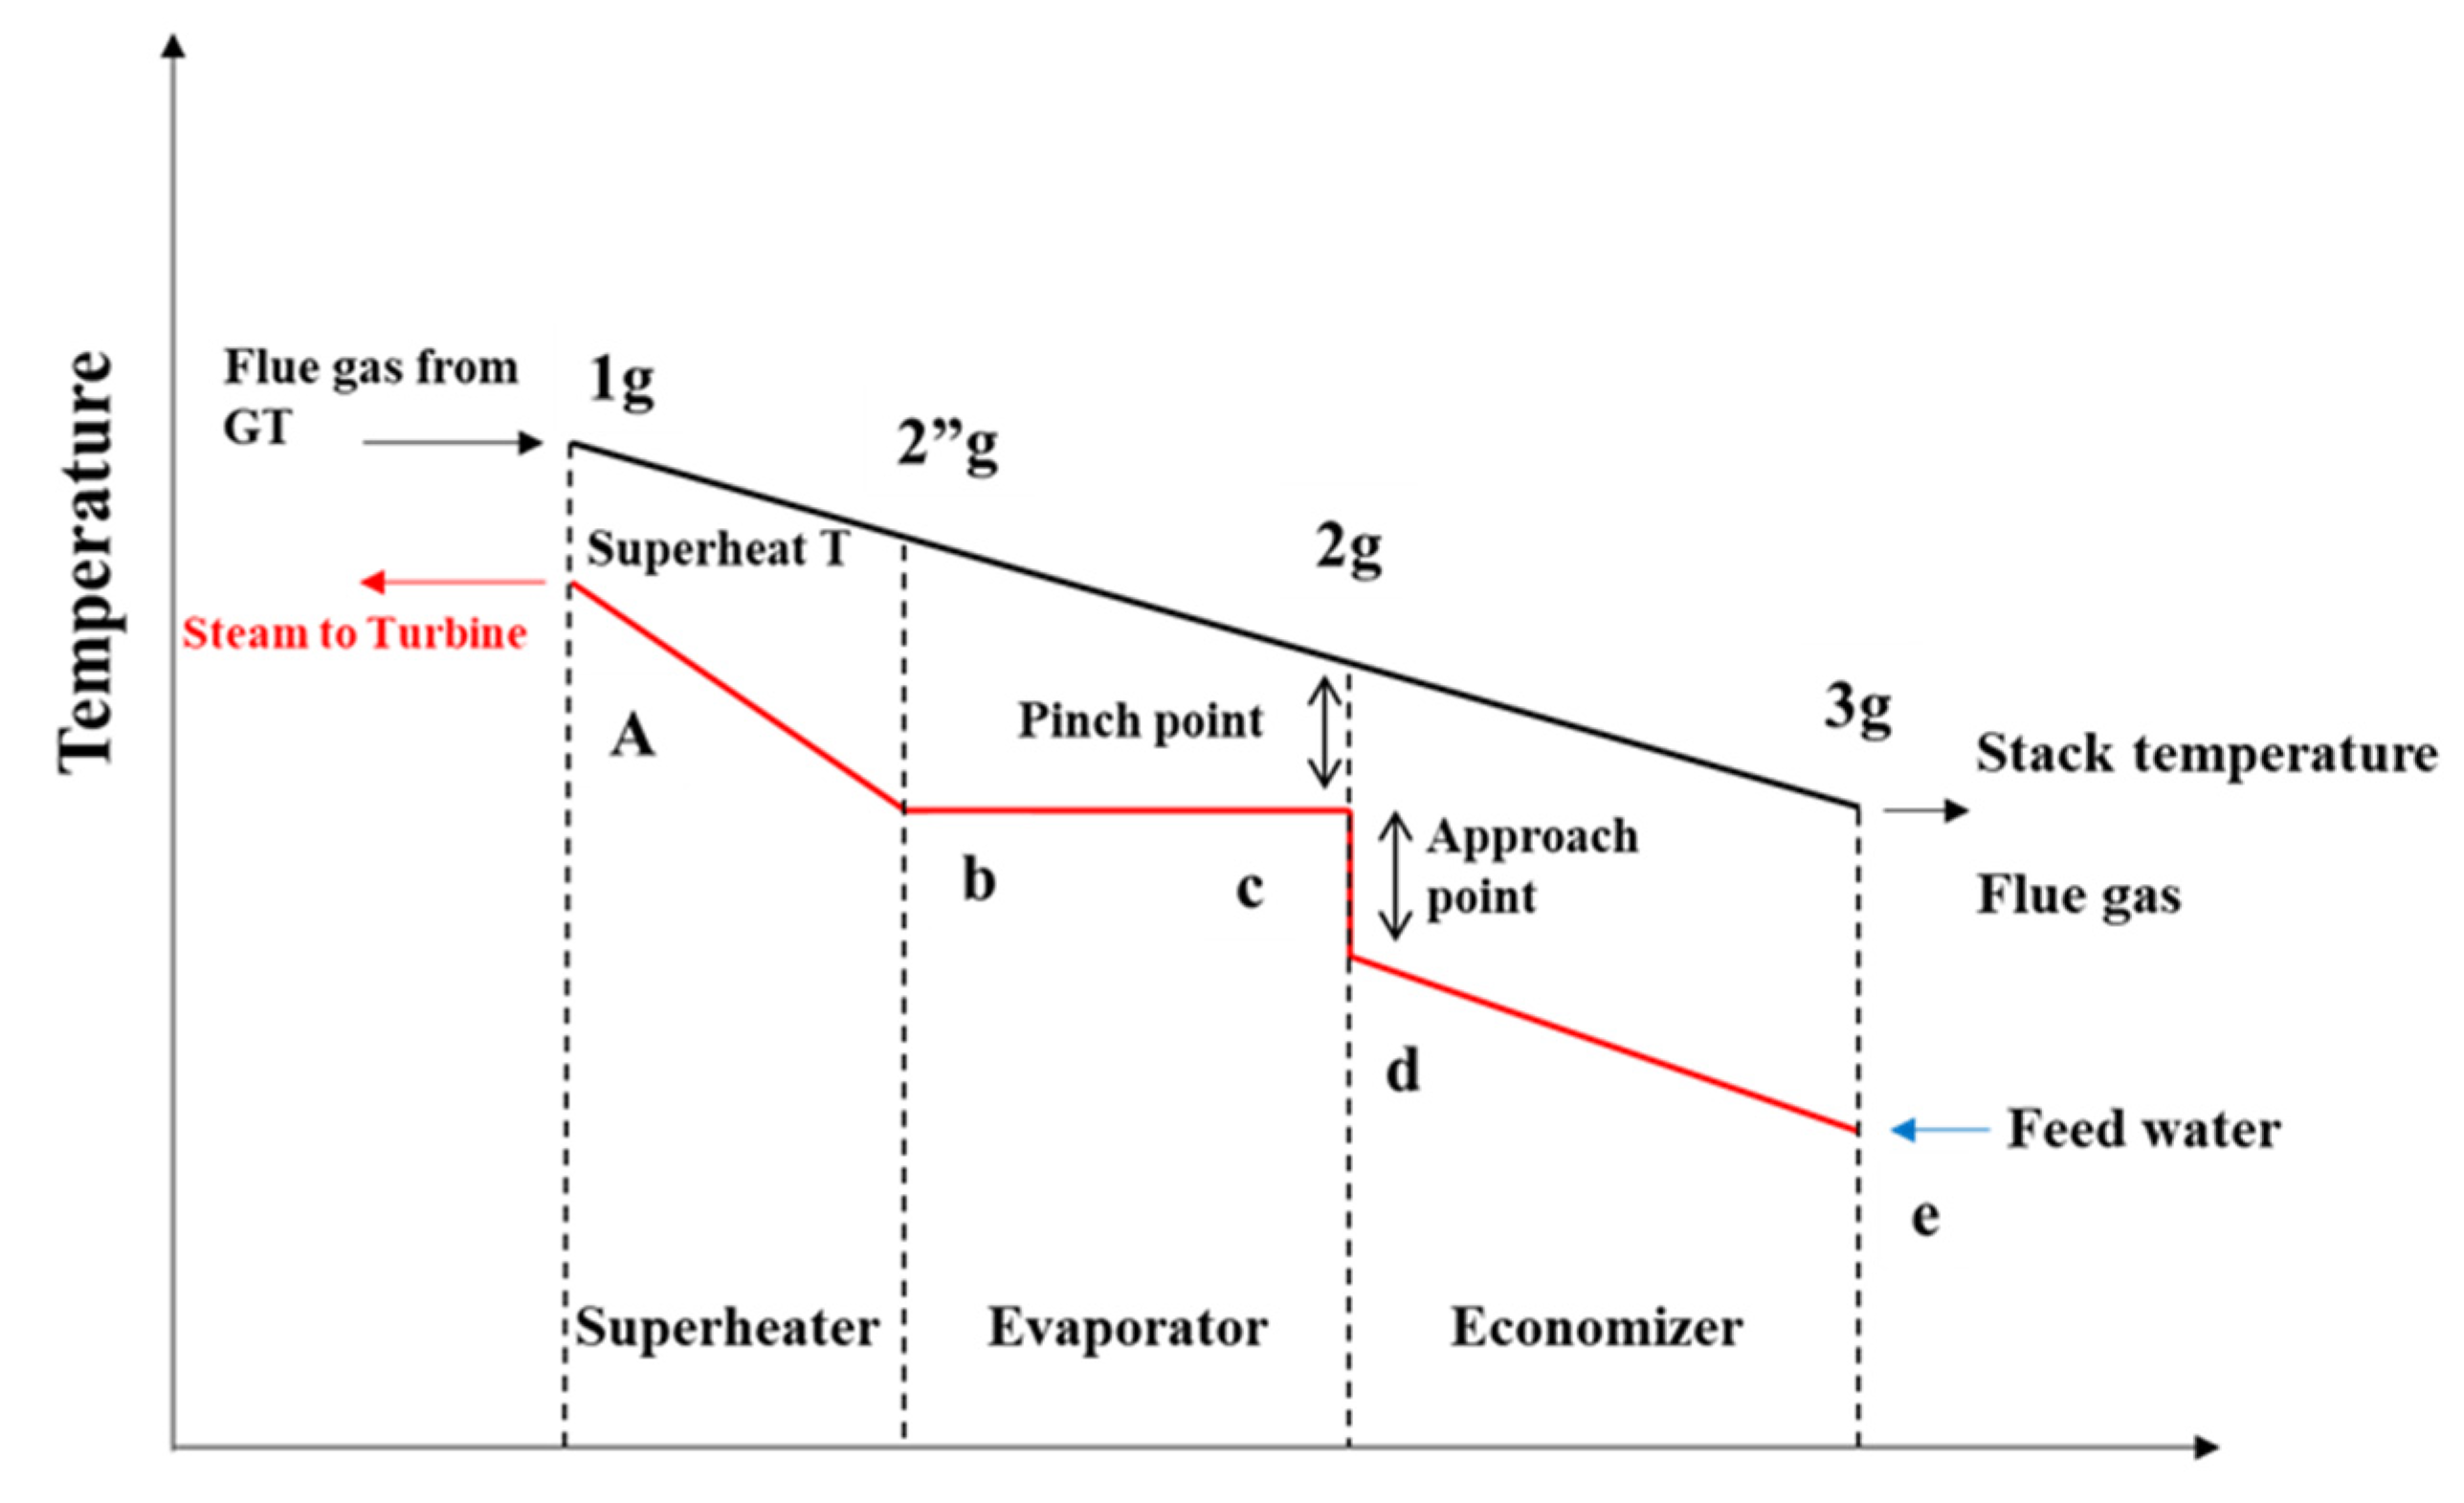
- If EGT < 873 K, steam cycle T = EGT − pinch point difference;
- If EGT > 873 K, steam cycle T = 873 − pinch point difference (i.e., constant).
2.1.2. HRSG Model
2.1.3. Steam Turbine Model
2.1.4. Condenser Model
2.1.5. Pump Model
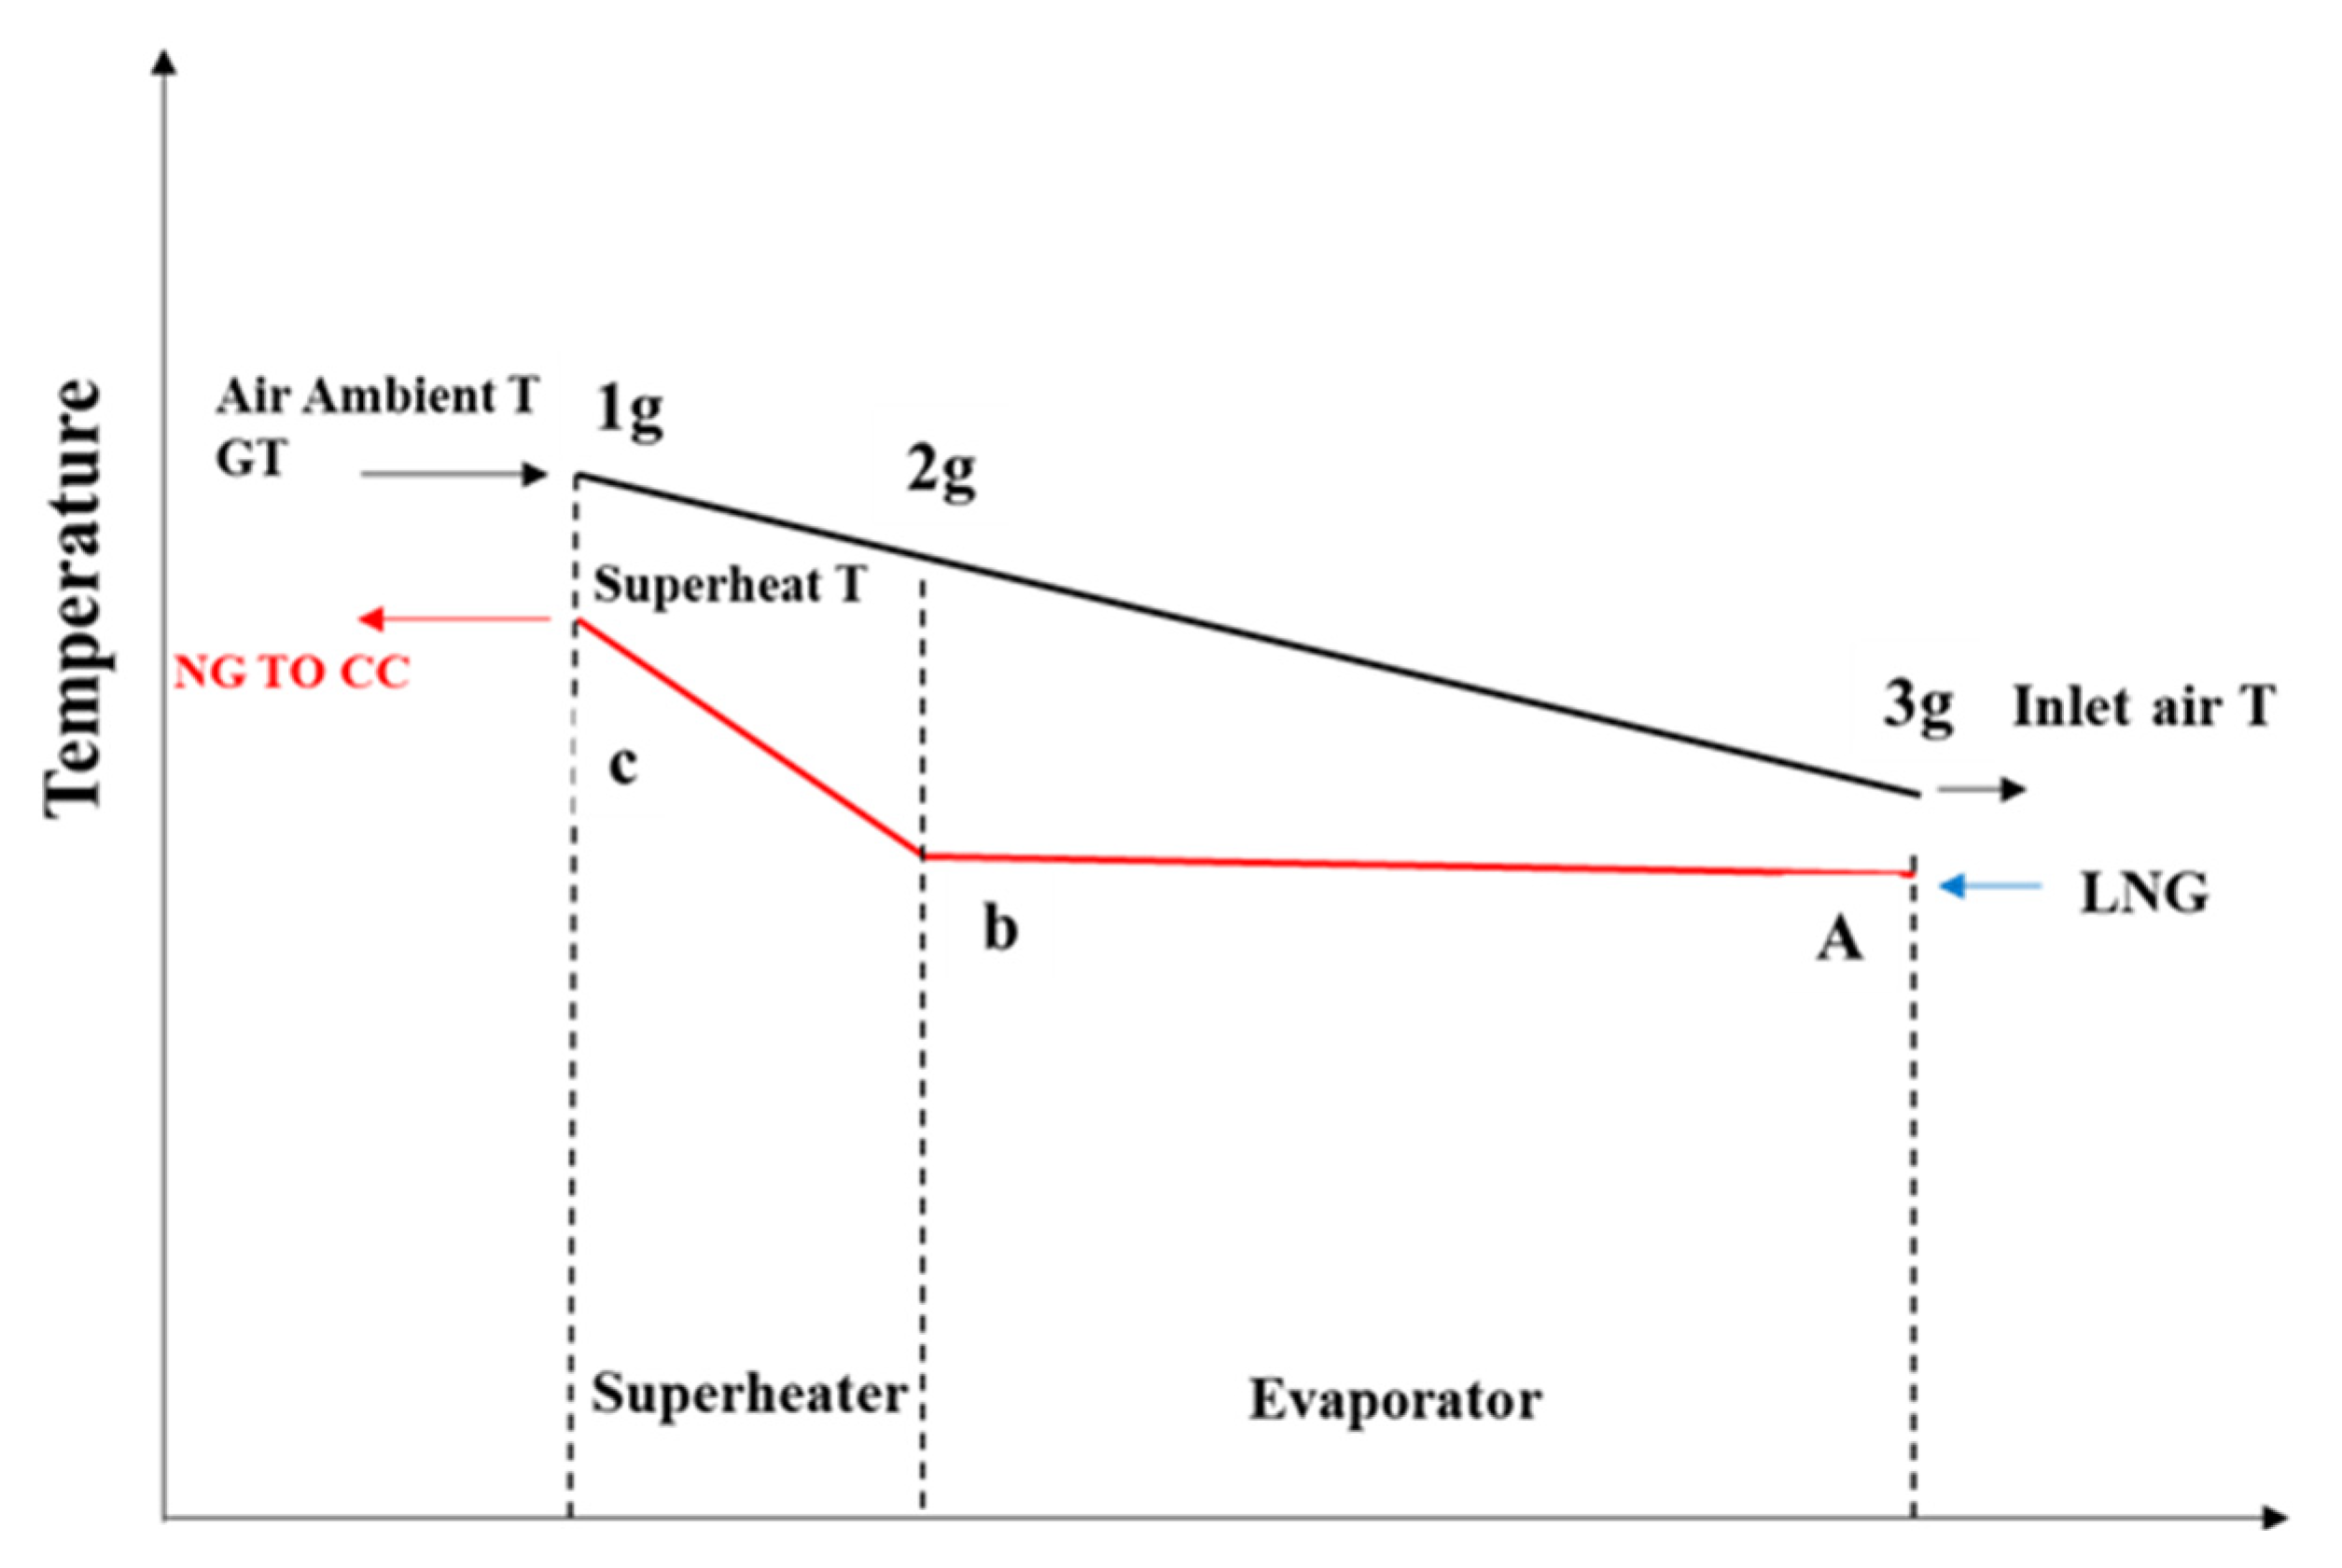
2.2. ELNG Cycle
2.3. Estimated Size and Weight of the CCGT
- Gas and steam turbine weight
- HRSG and condenser weight
2.4. Environmental Model
- Nitrogen Oxides NOx:
- Carbon dioxide CO2:
2.5. Assumptions, Simulation, and Validation
3. Results
3.1. Technical D.P. and Off-Design Point (O.D.) Results for All CCGT Cycles
3.1.1. D.P. of CCGT Cycles
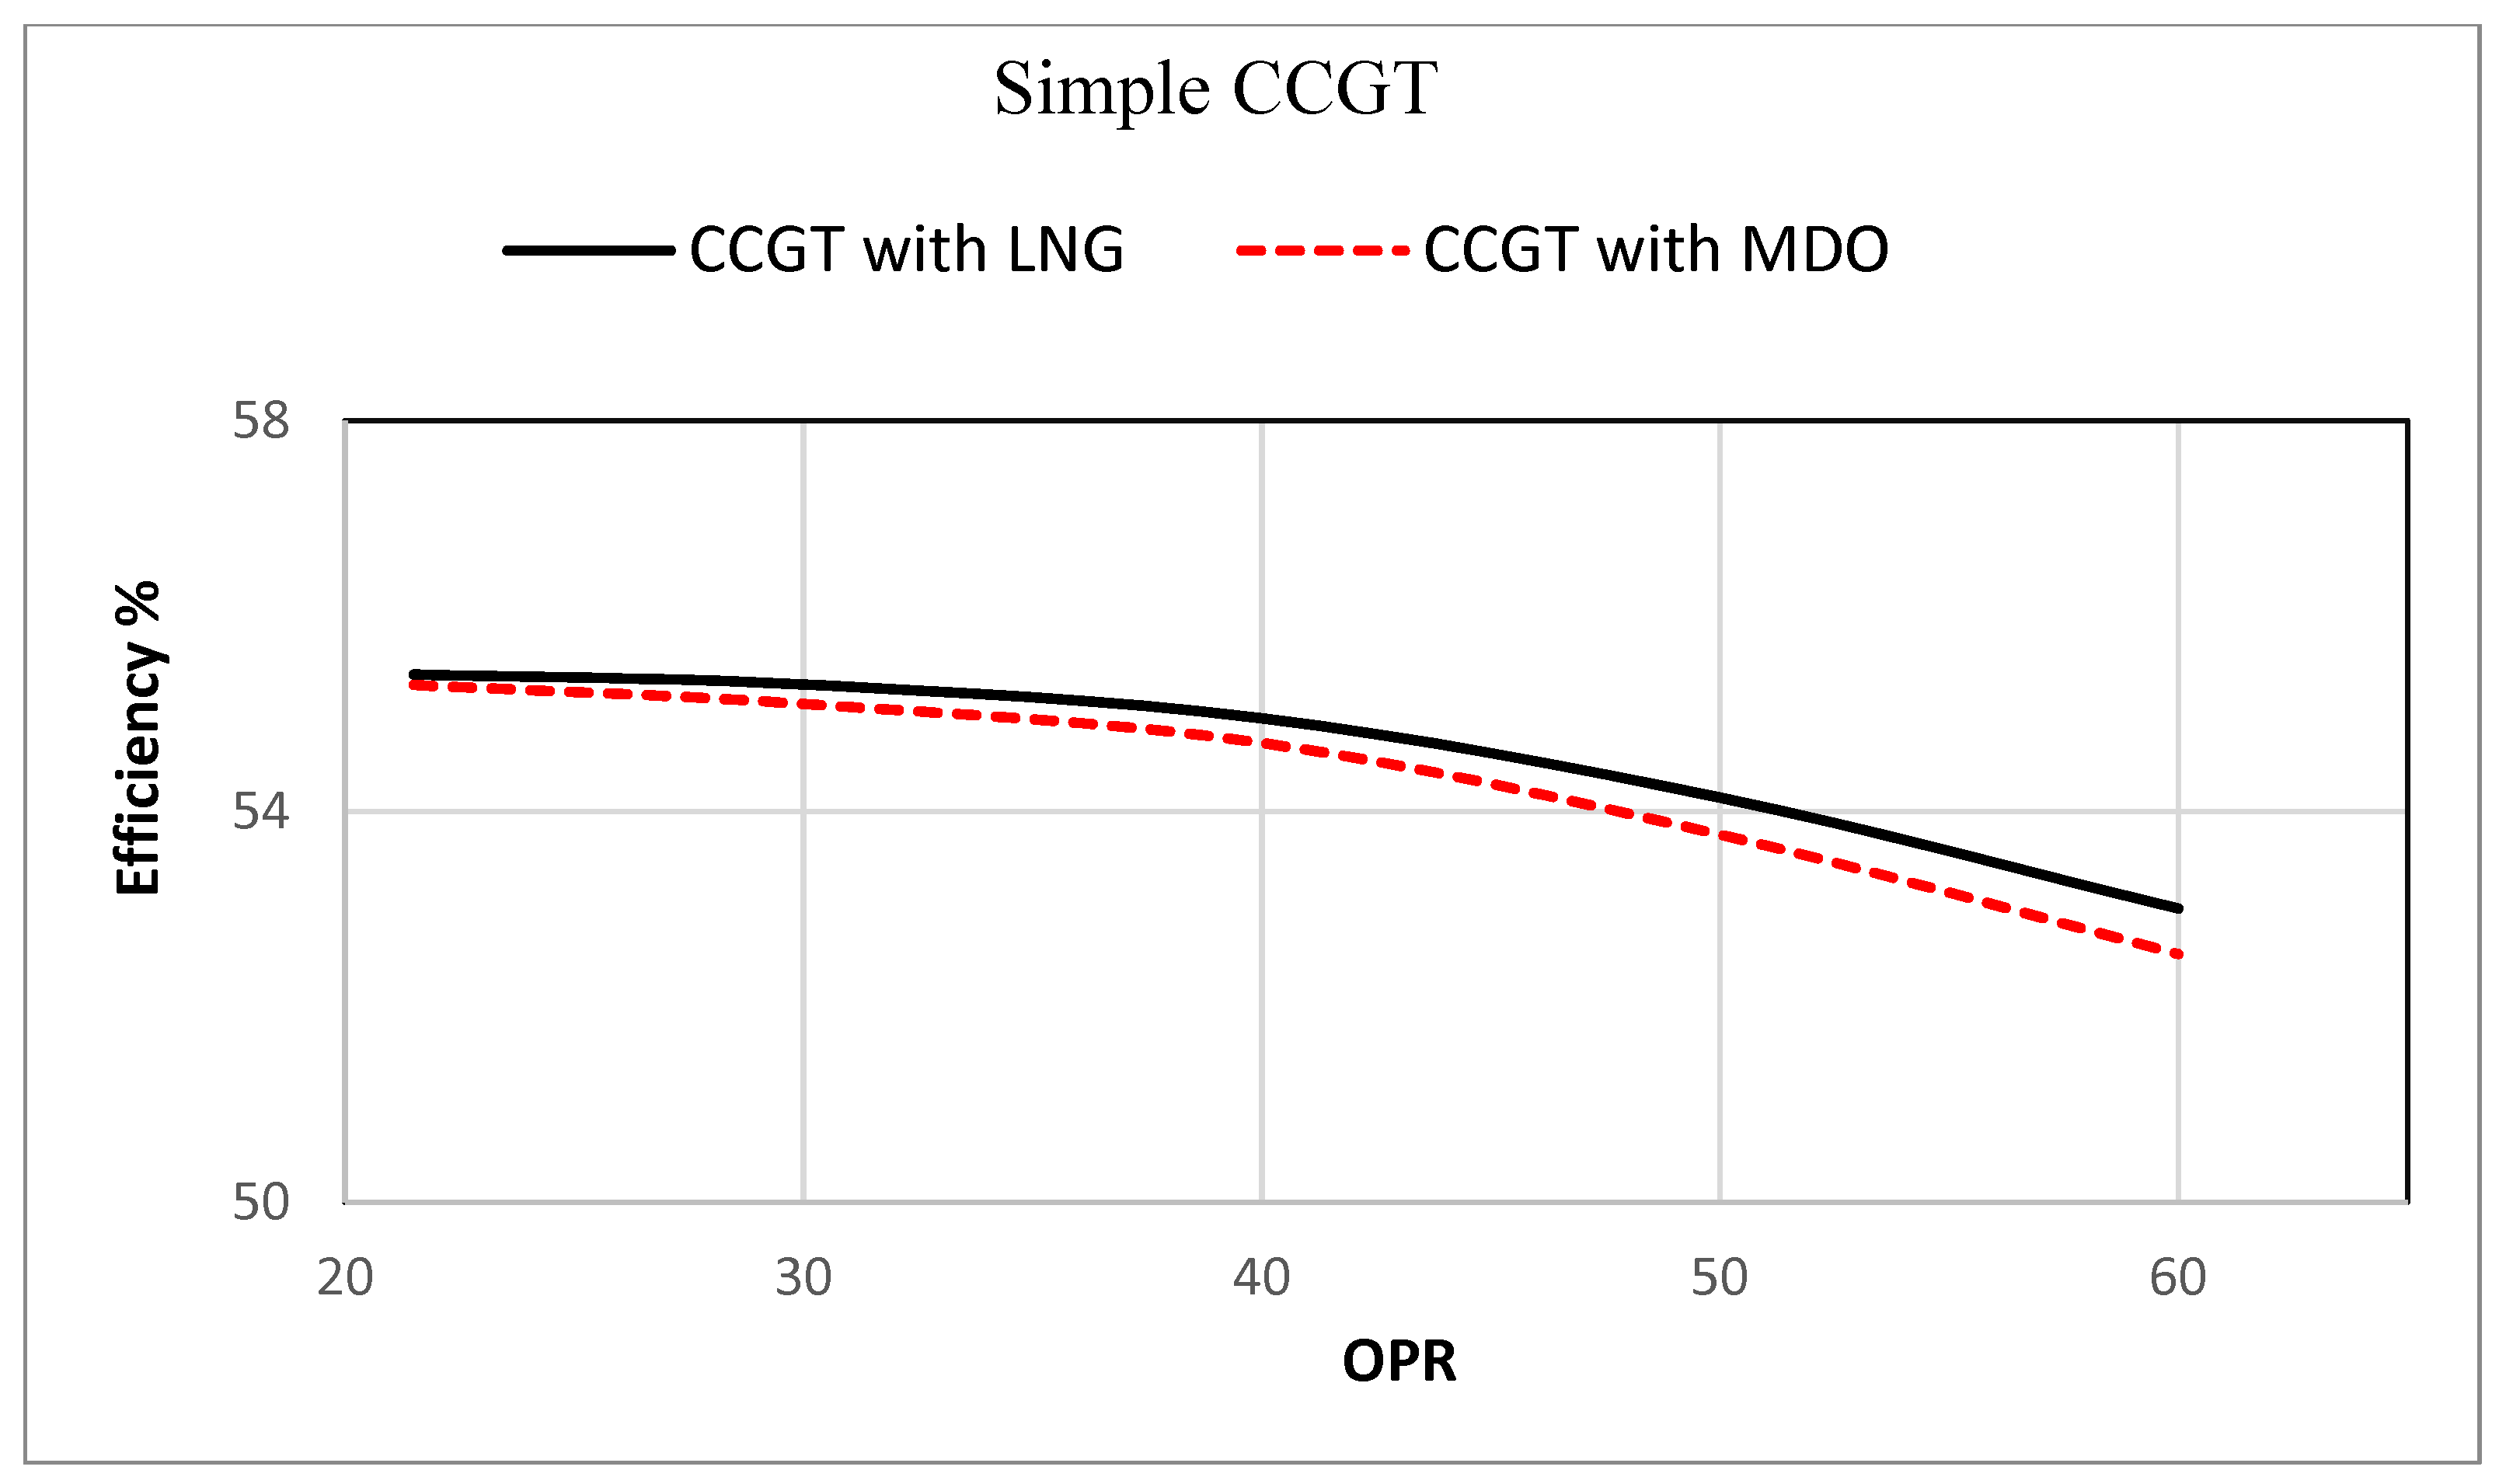
- Combined cycle (CCGT) with a simple-cycle gas turbine
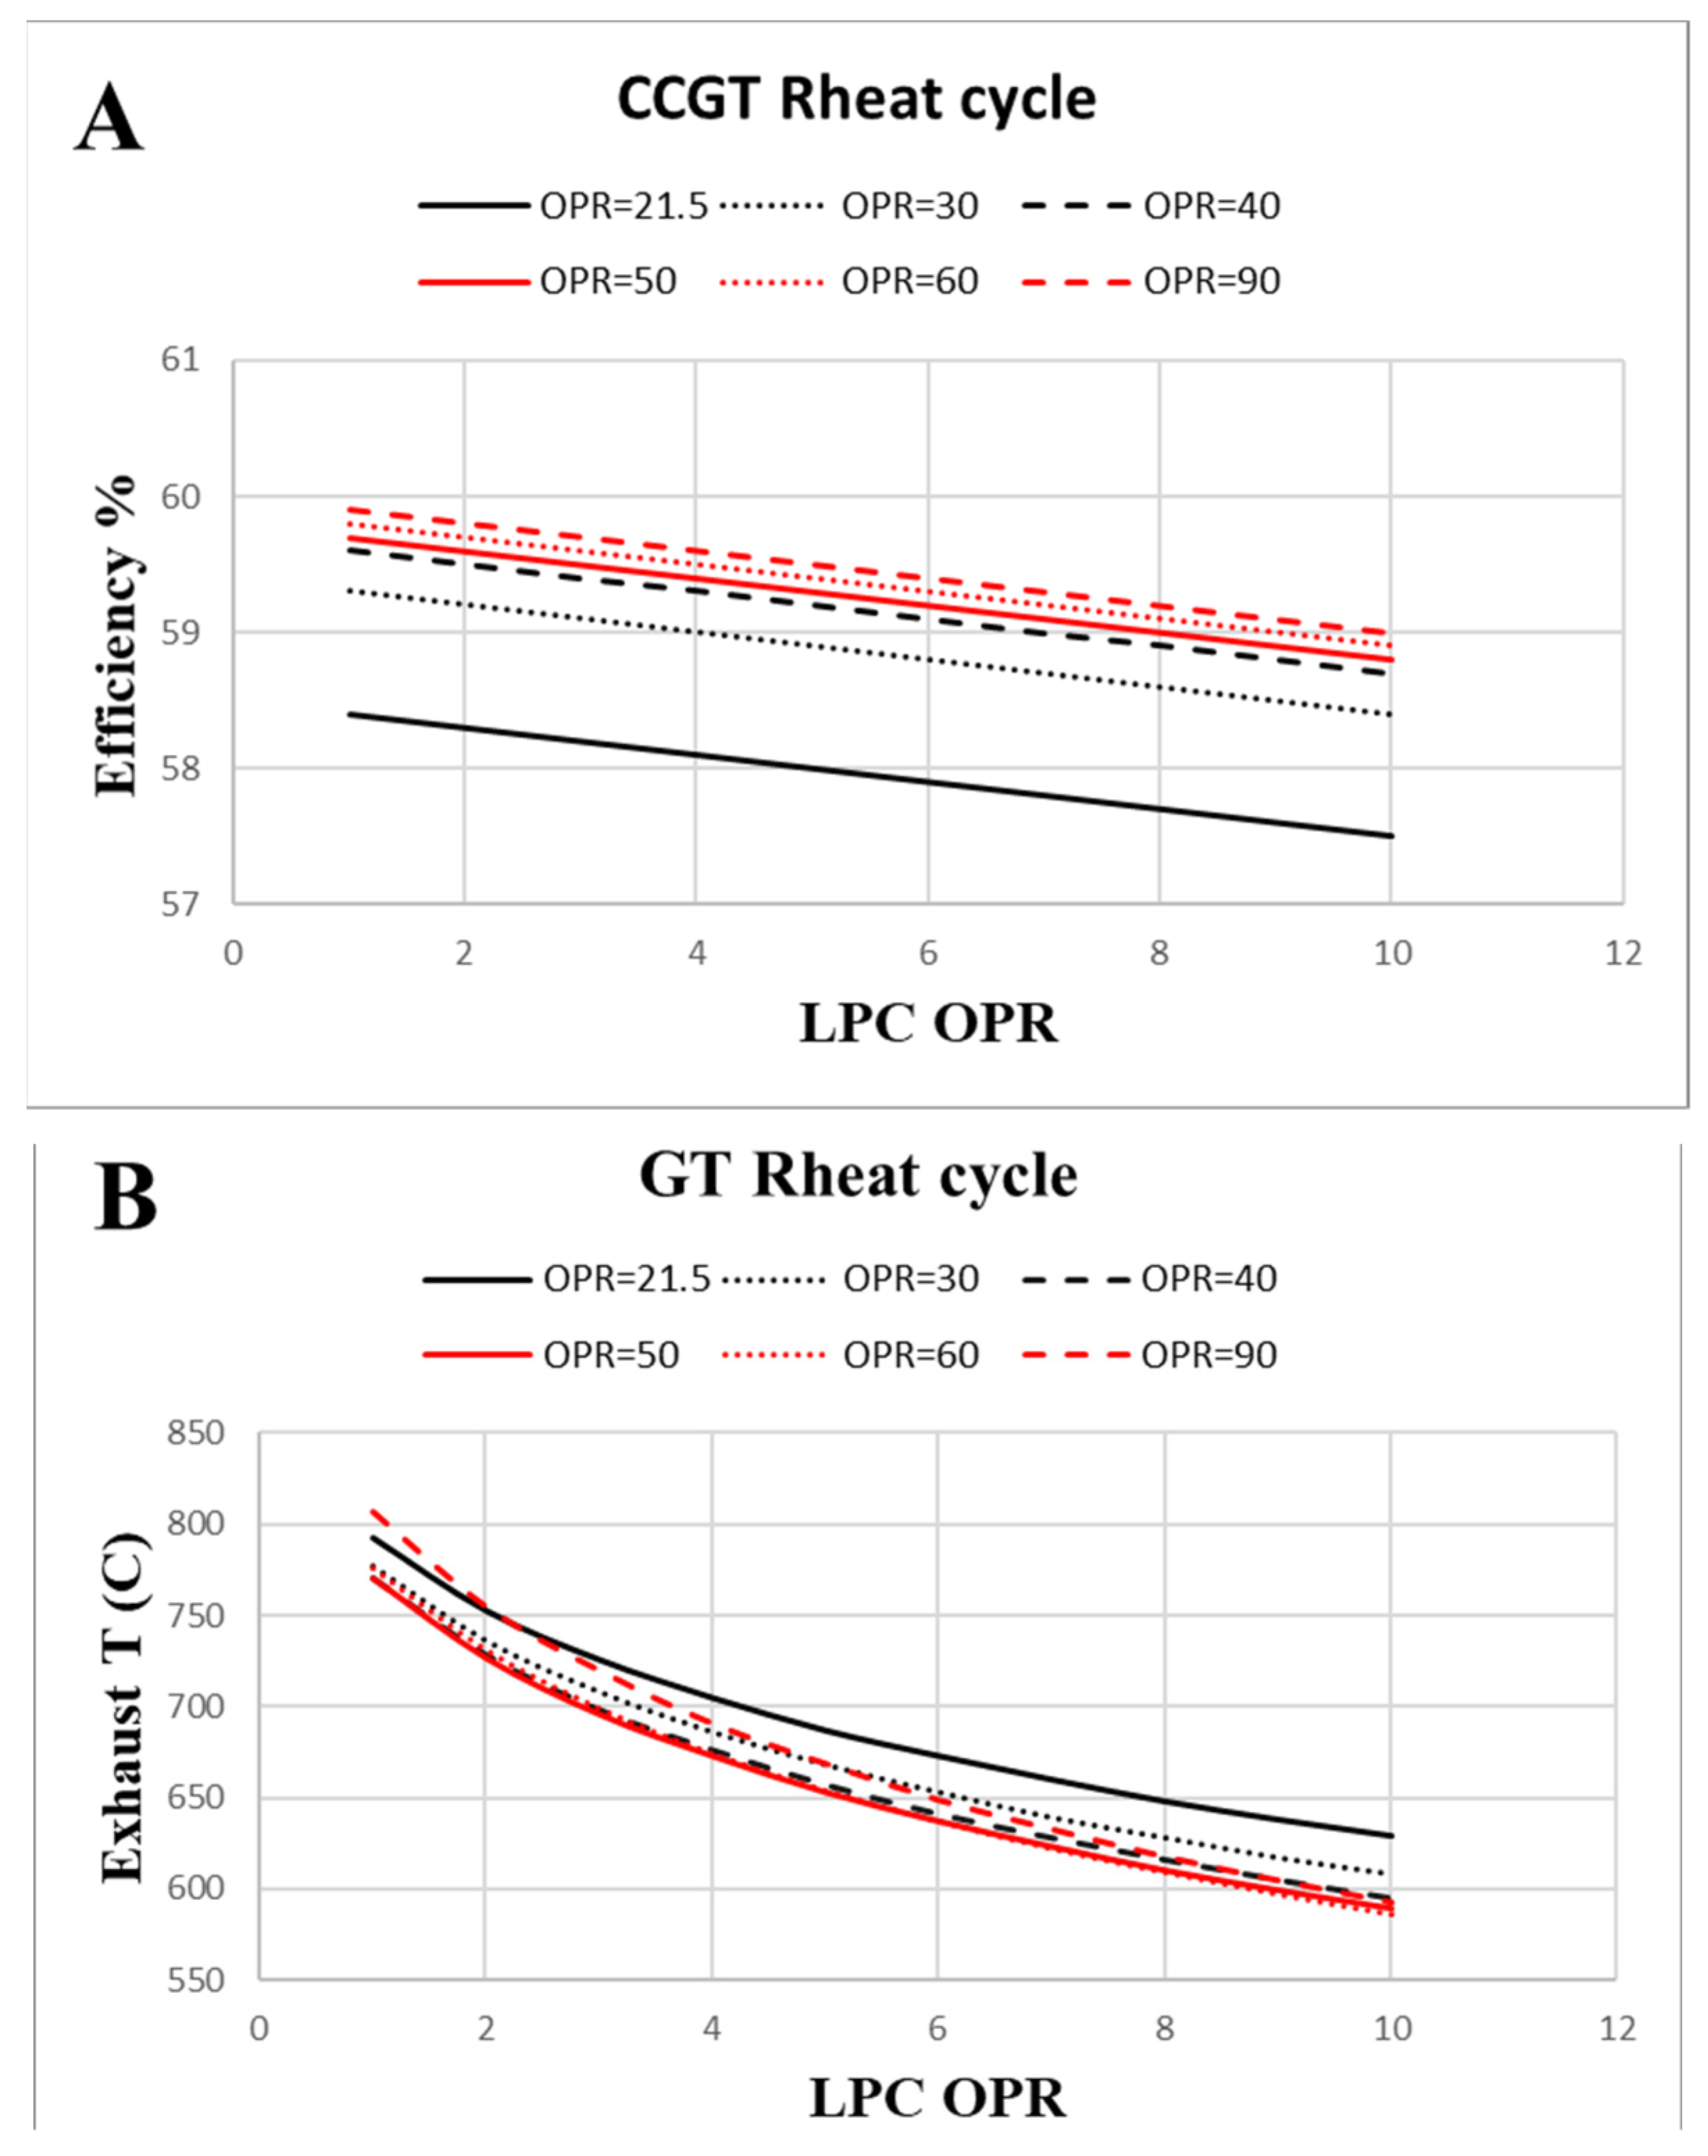
- Combined cycle (CCGT) with a reheat cycle gas turbine
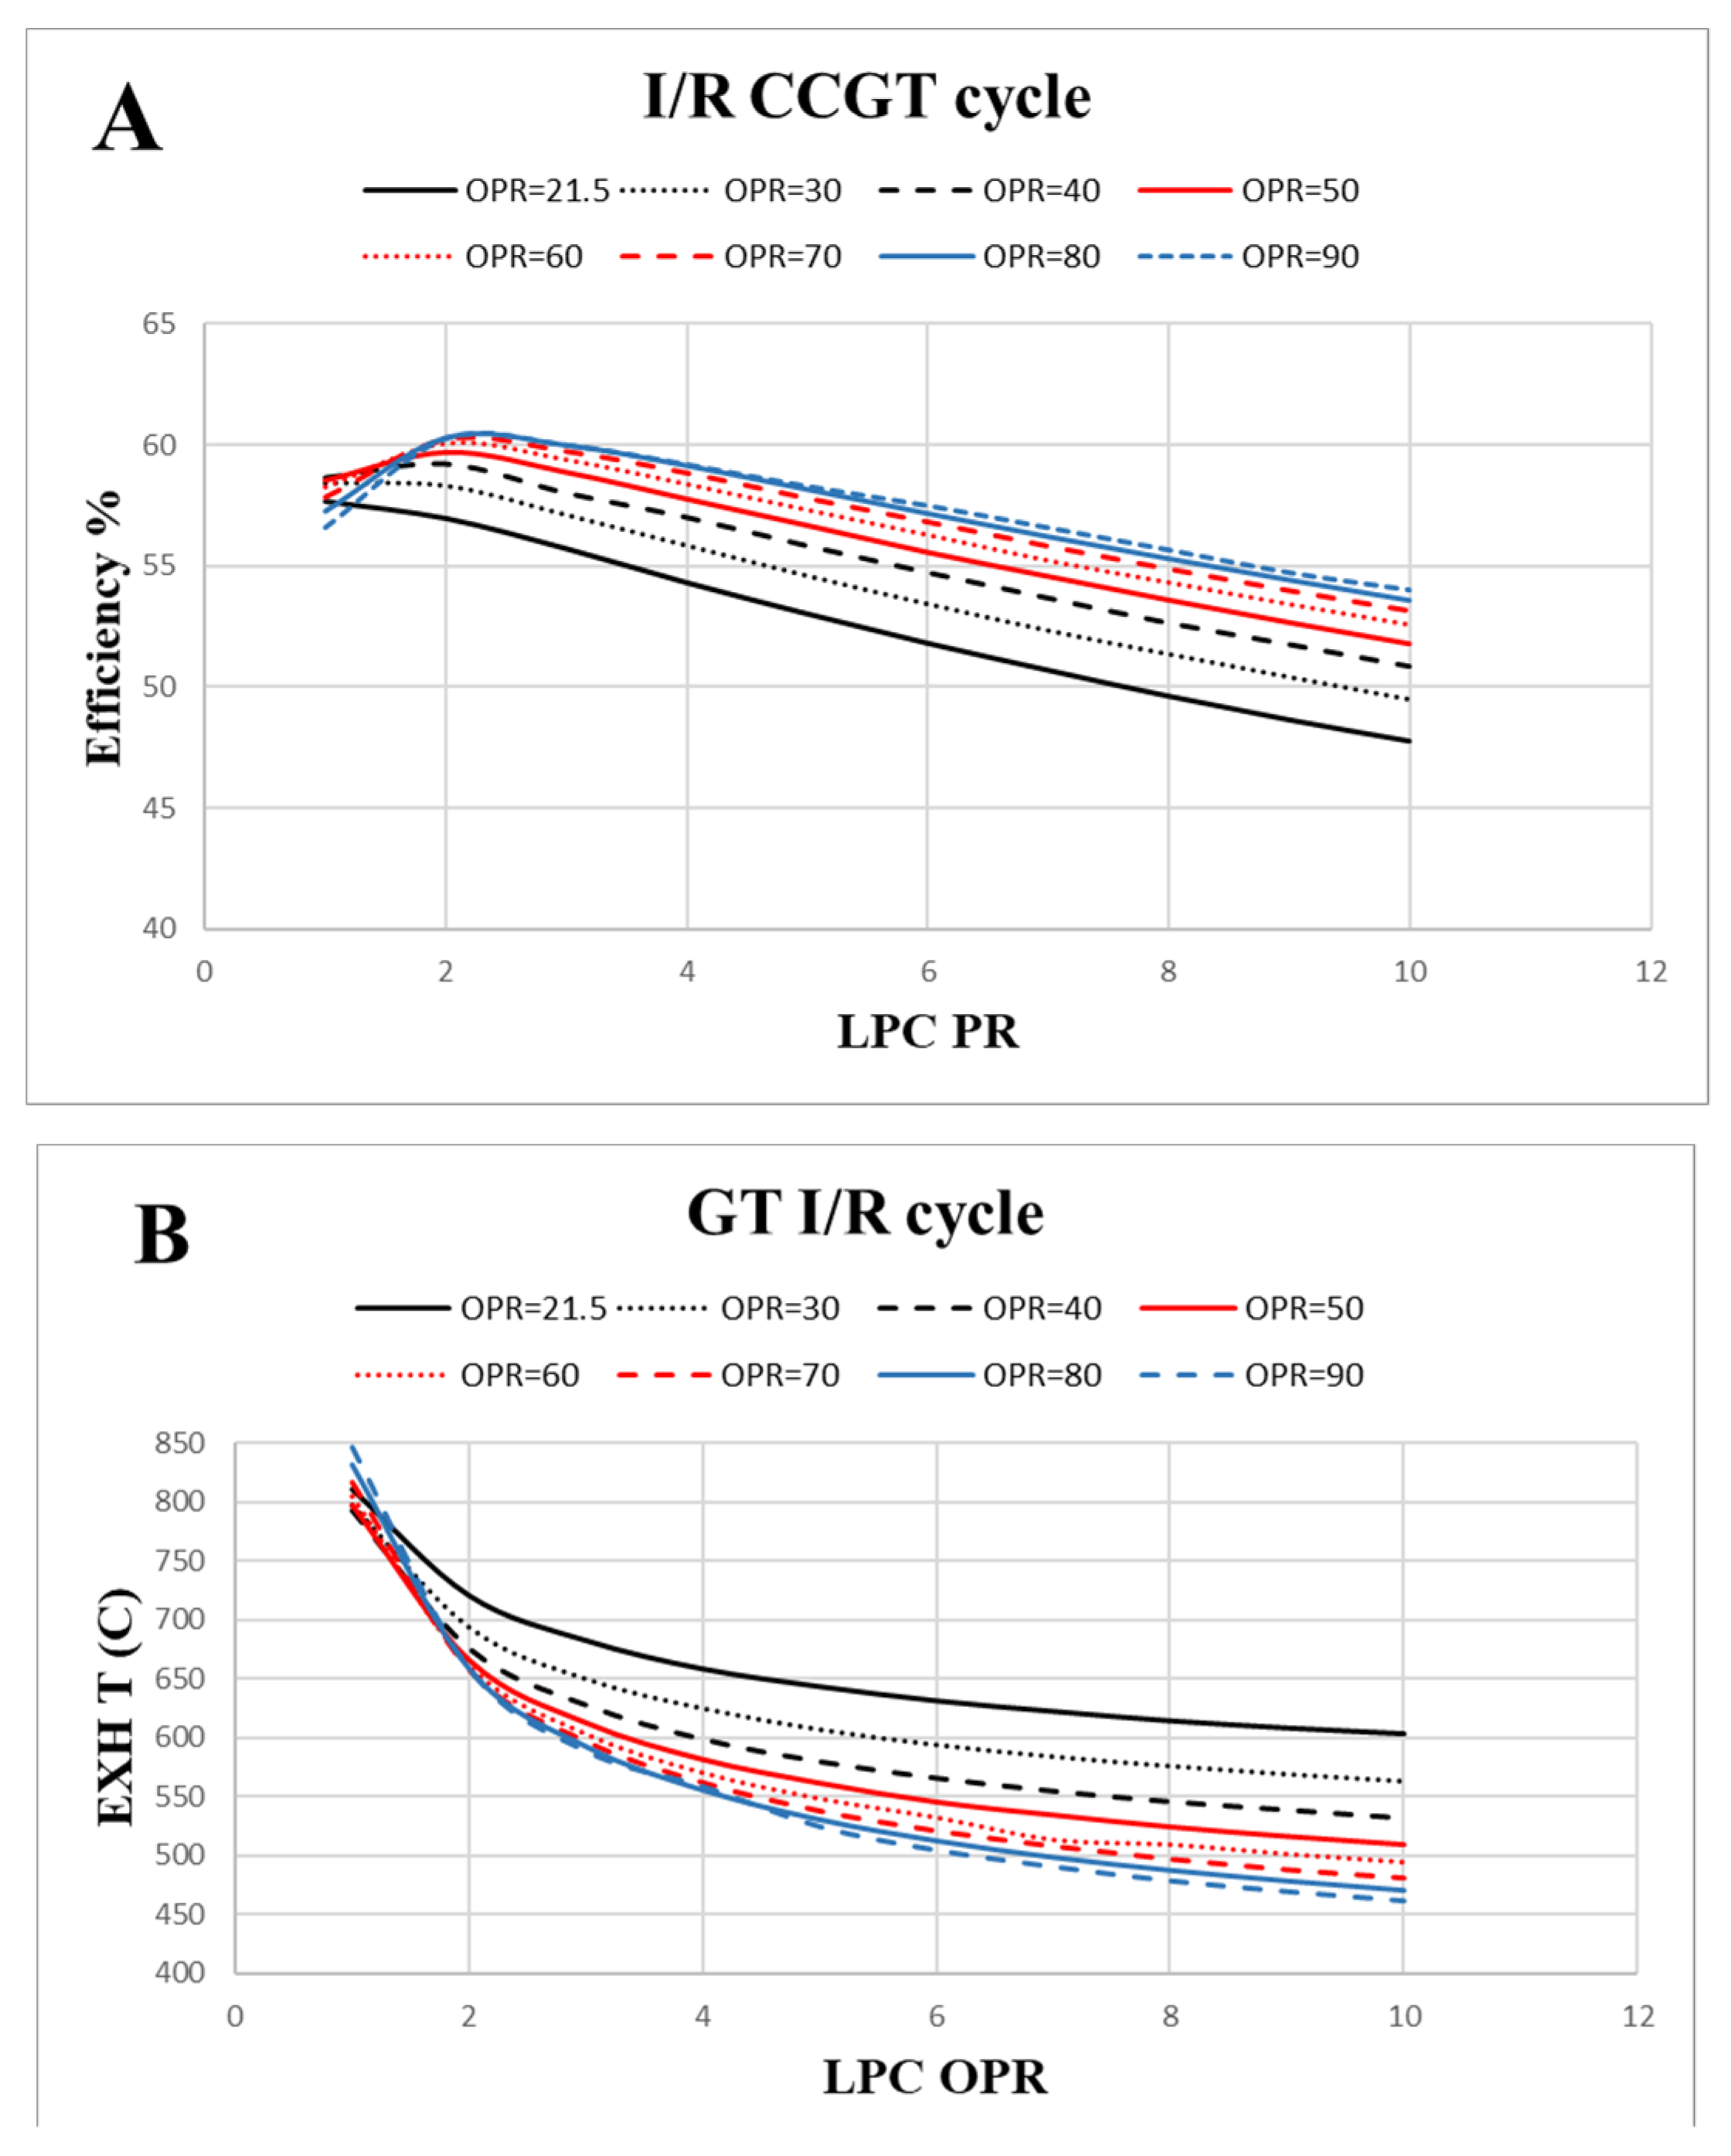
- Combined cycle (CCGT) with an I/R gas turbine
3.1.2. O.D. of CCGT Cycles
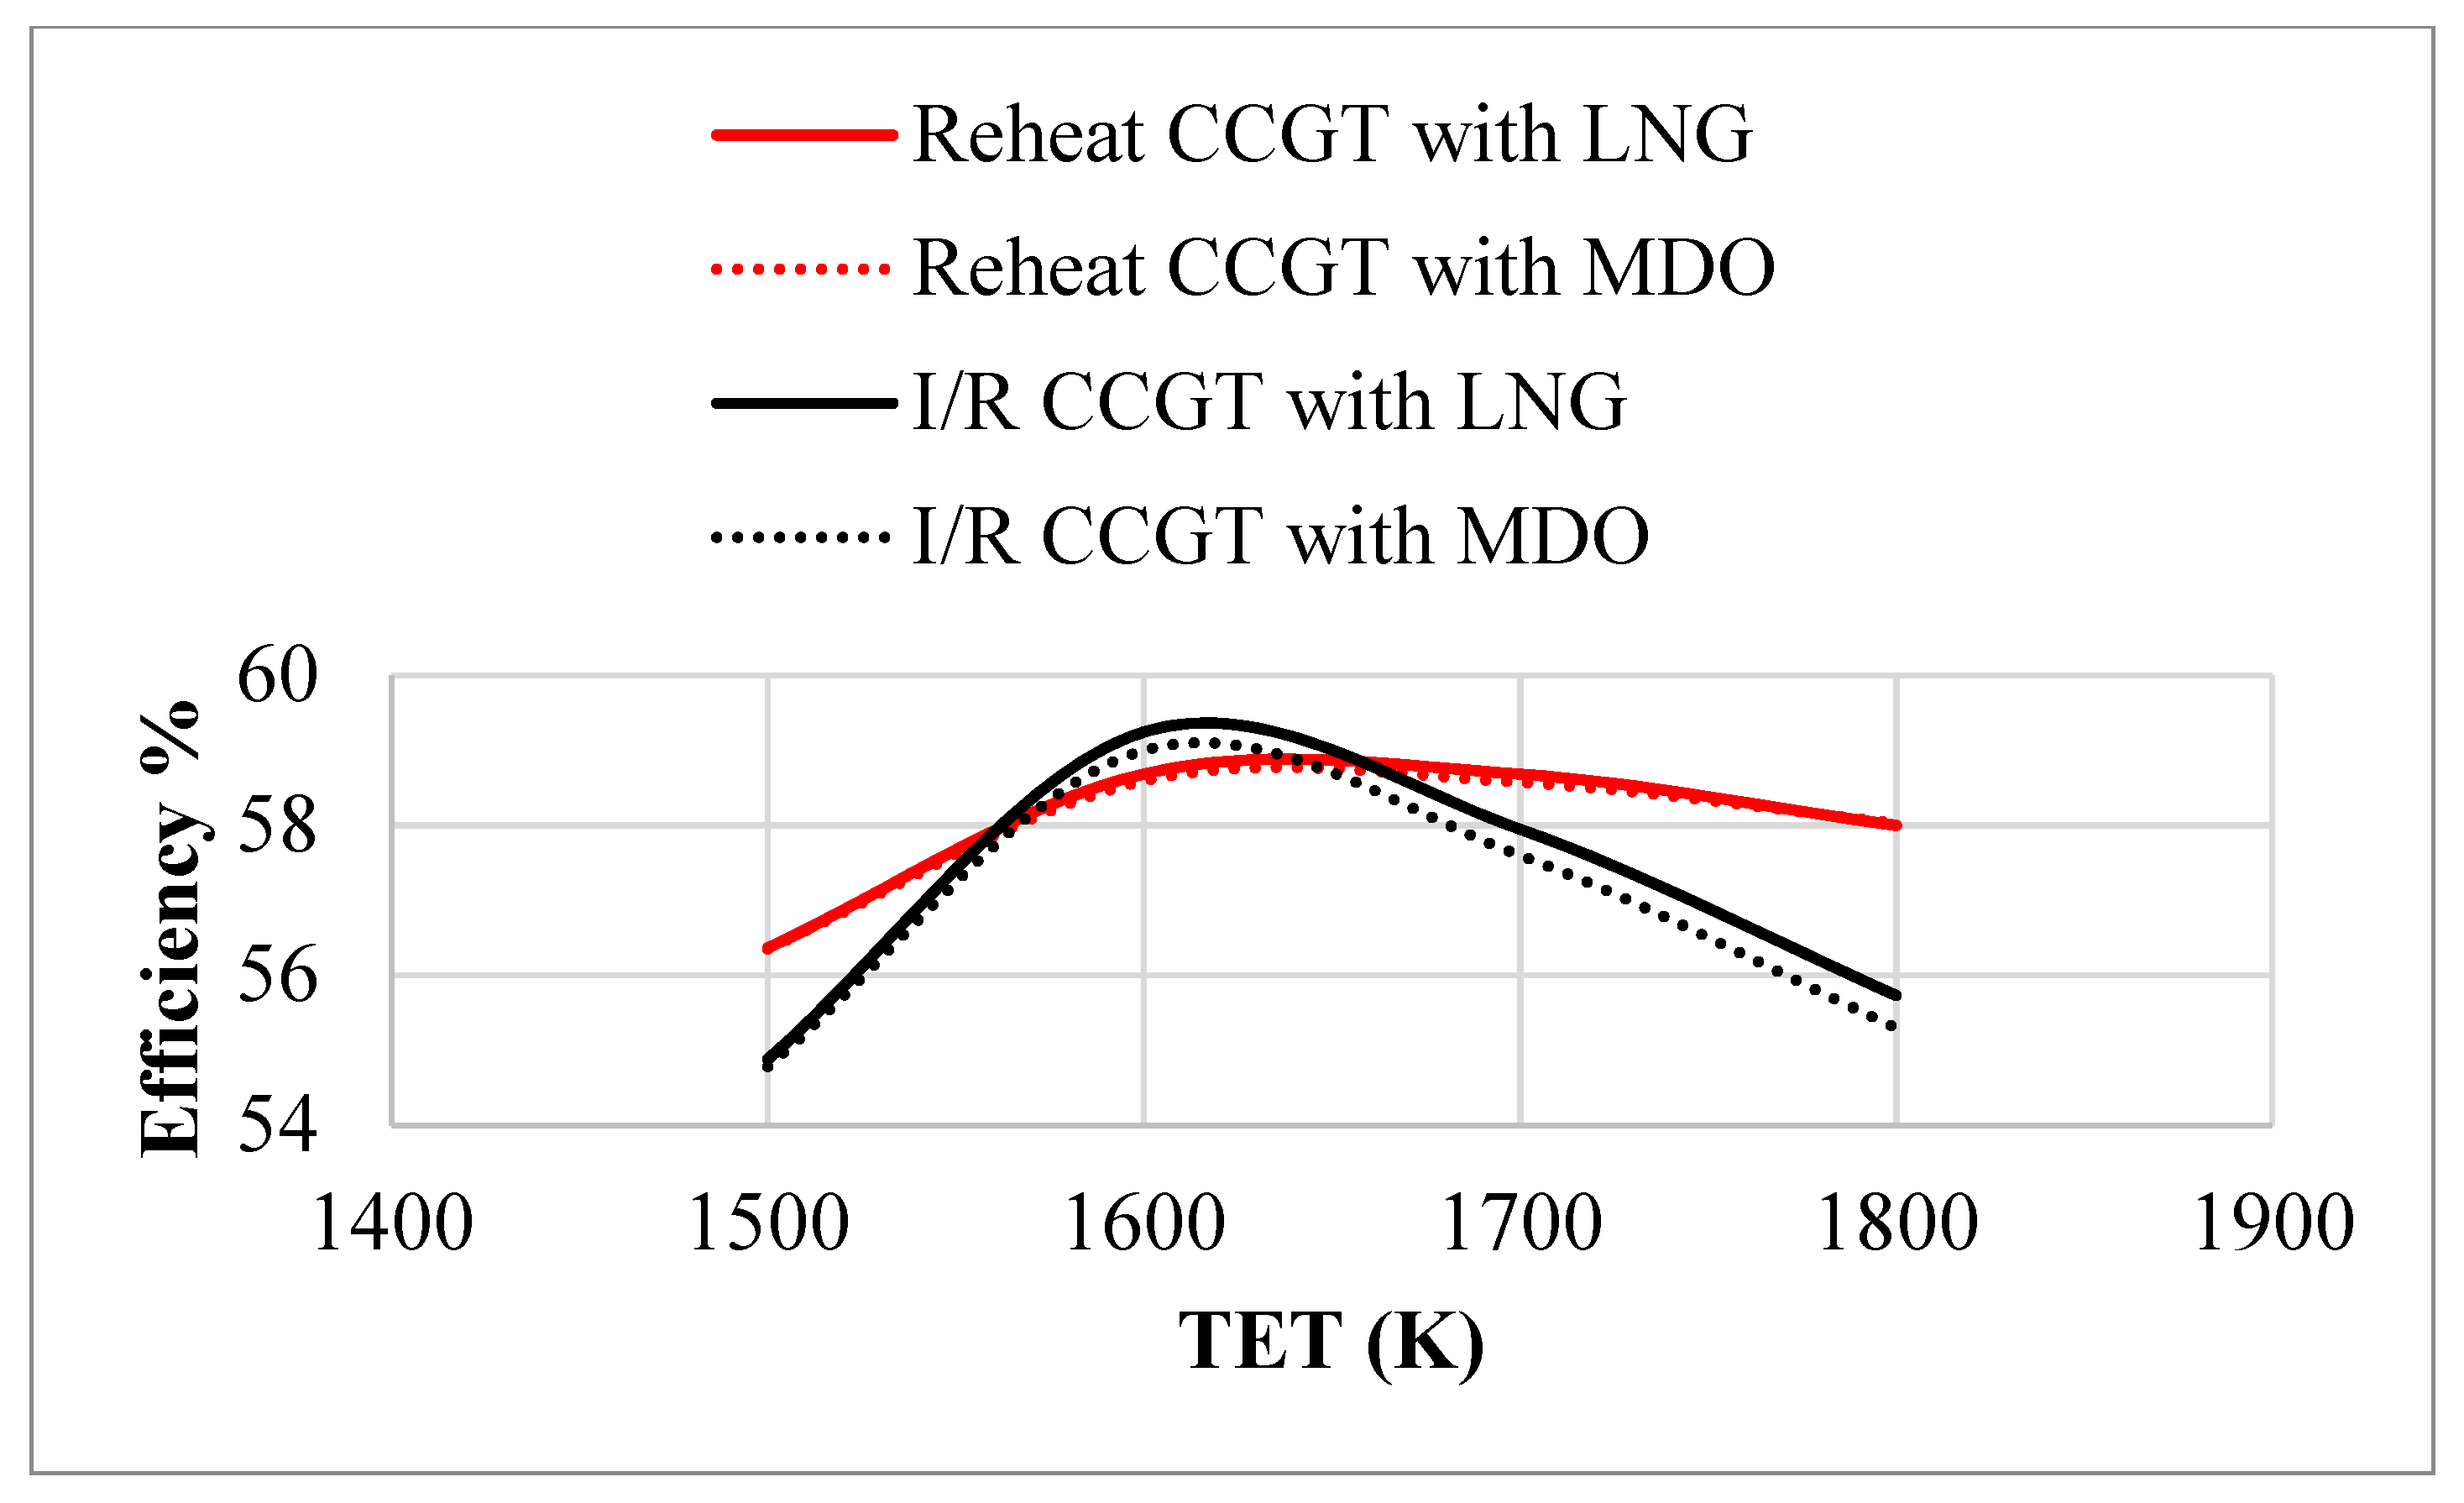
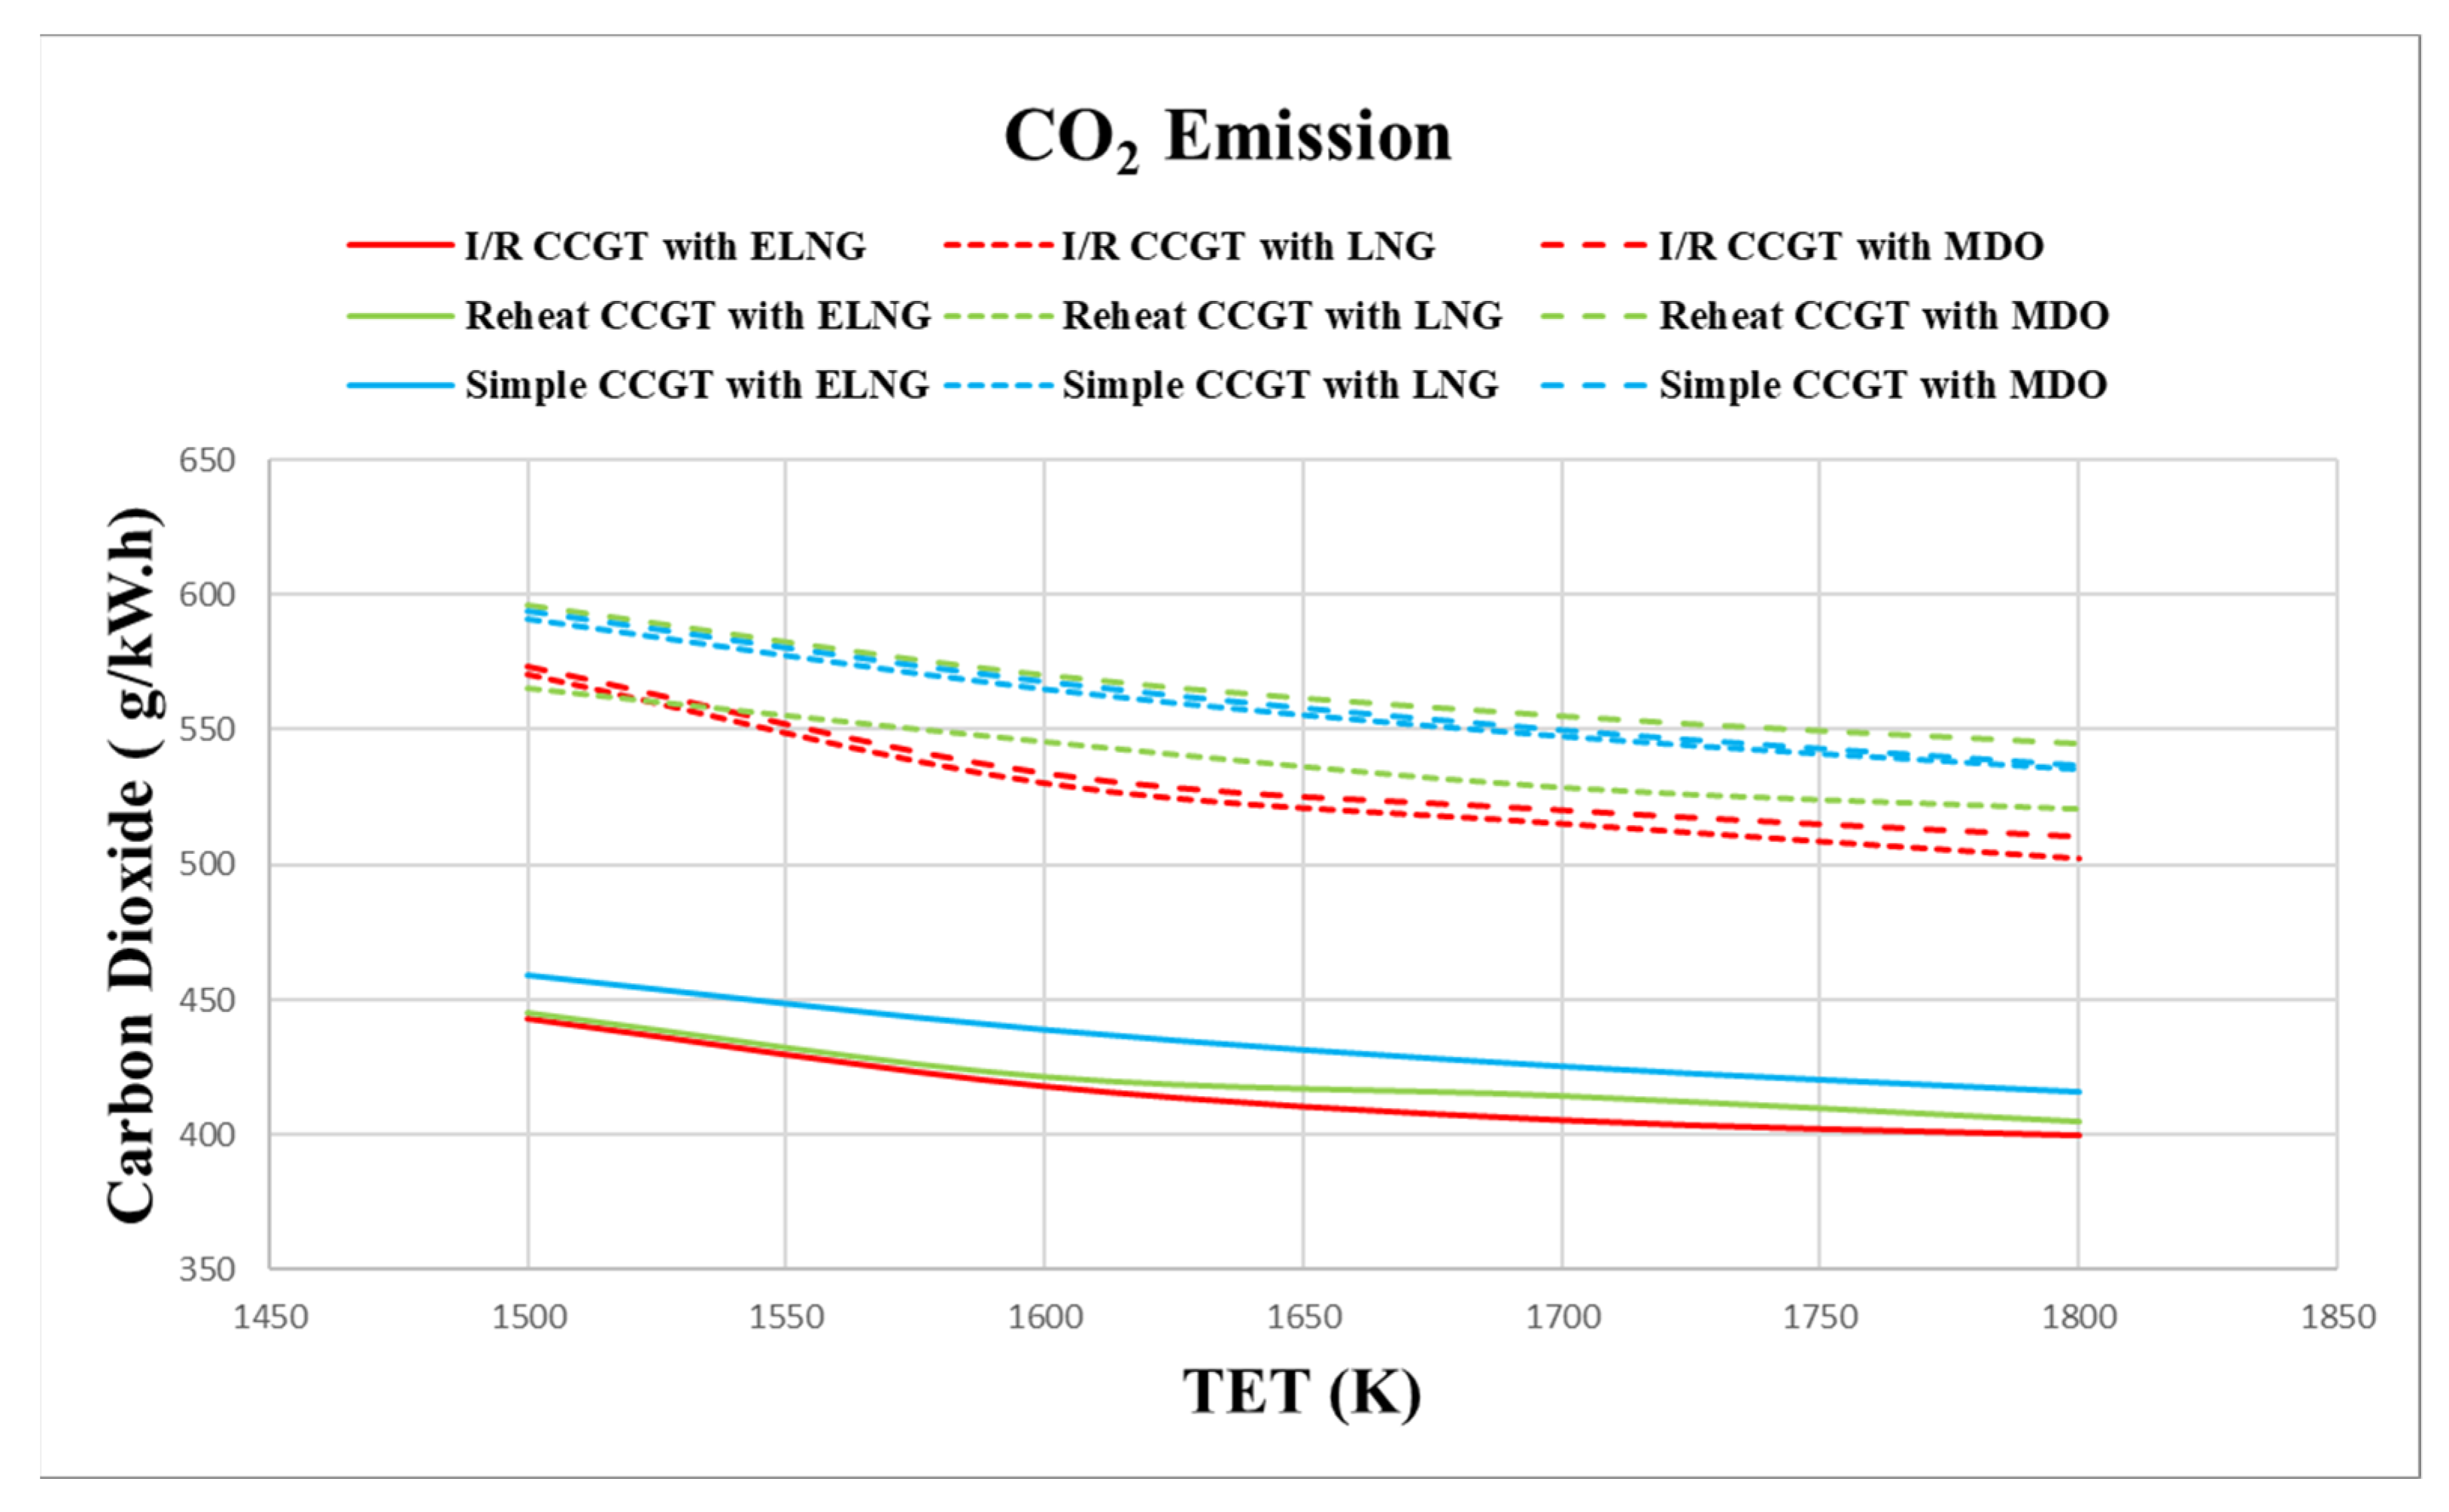
- Effect of TET on CCGT
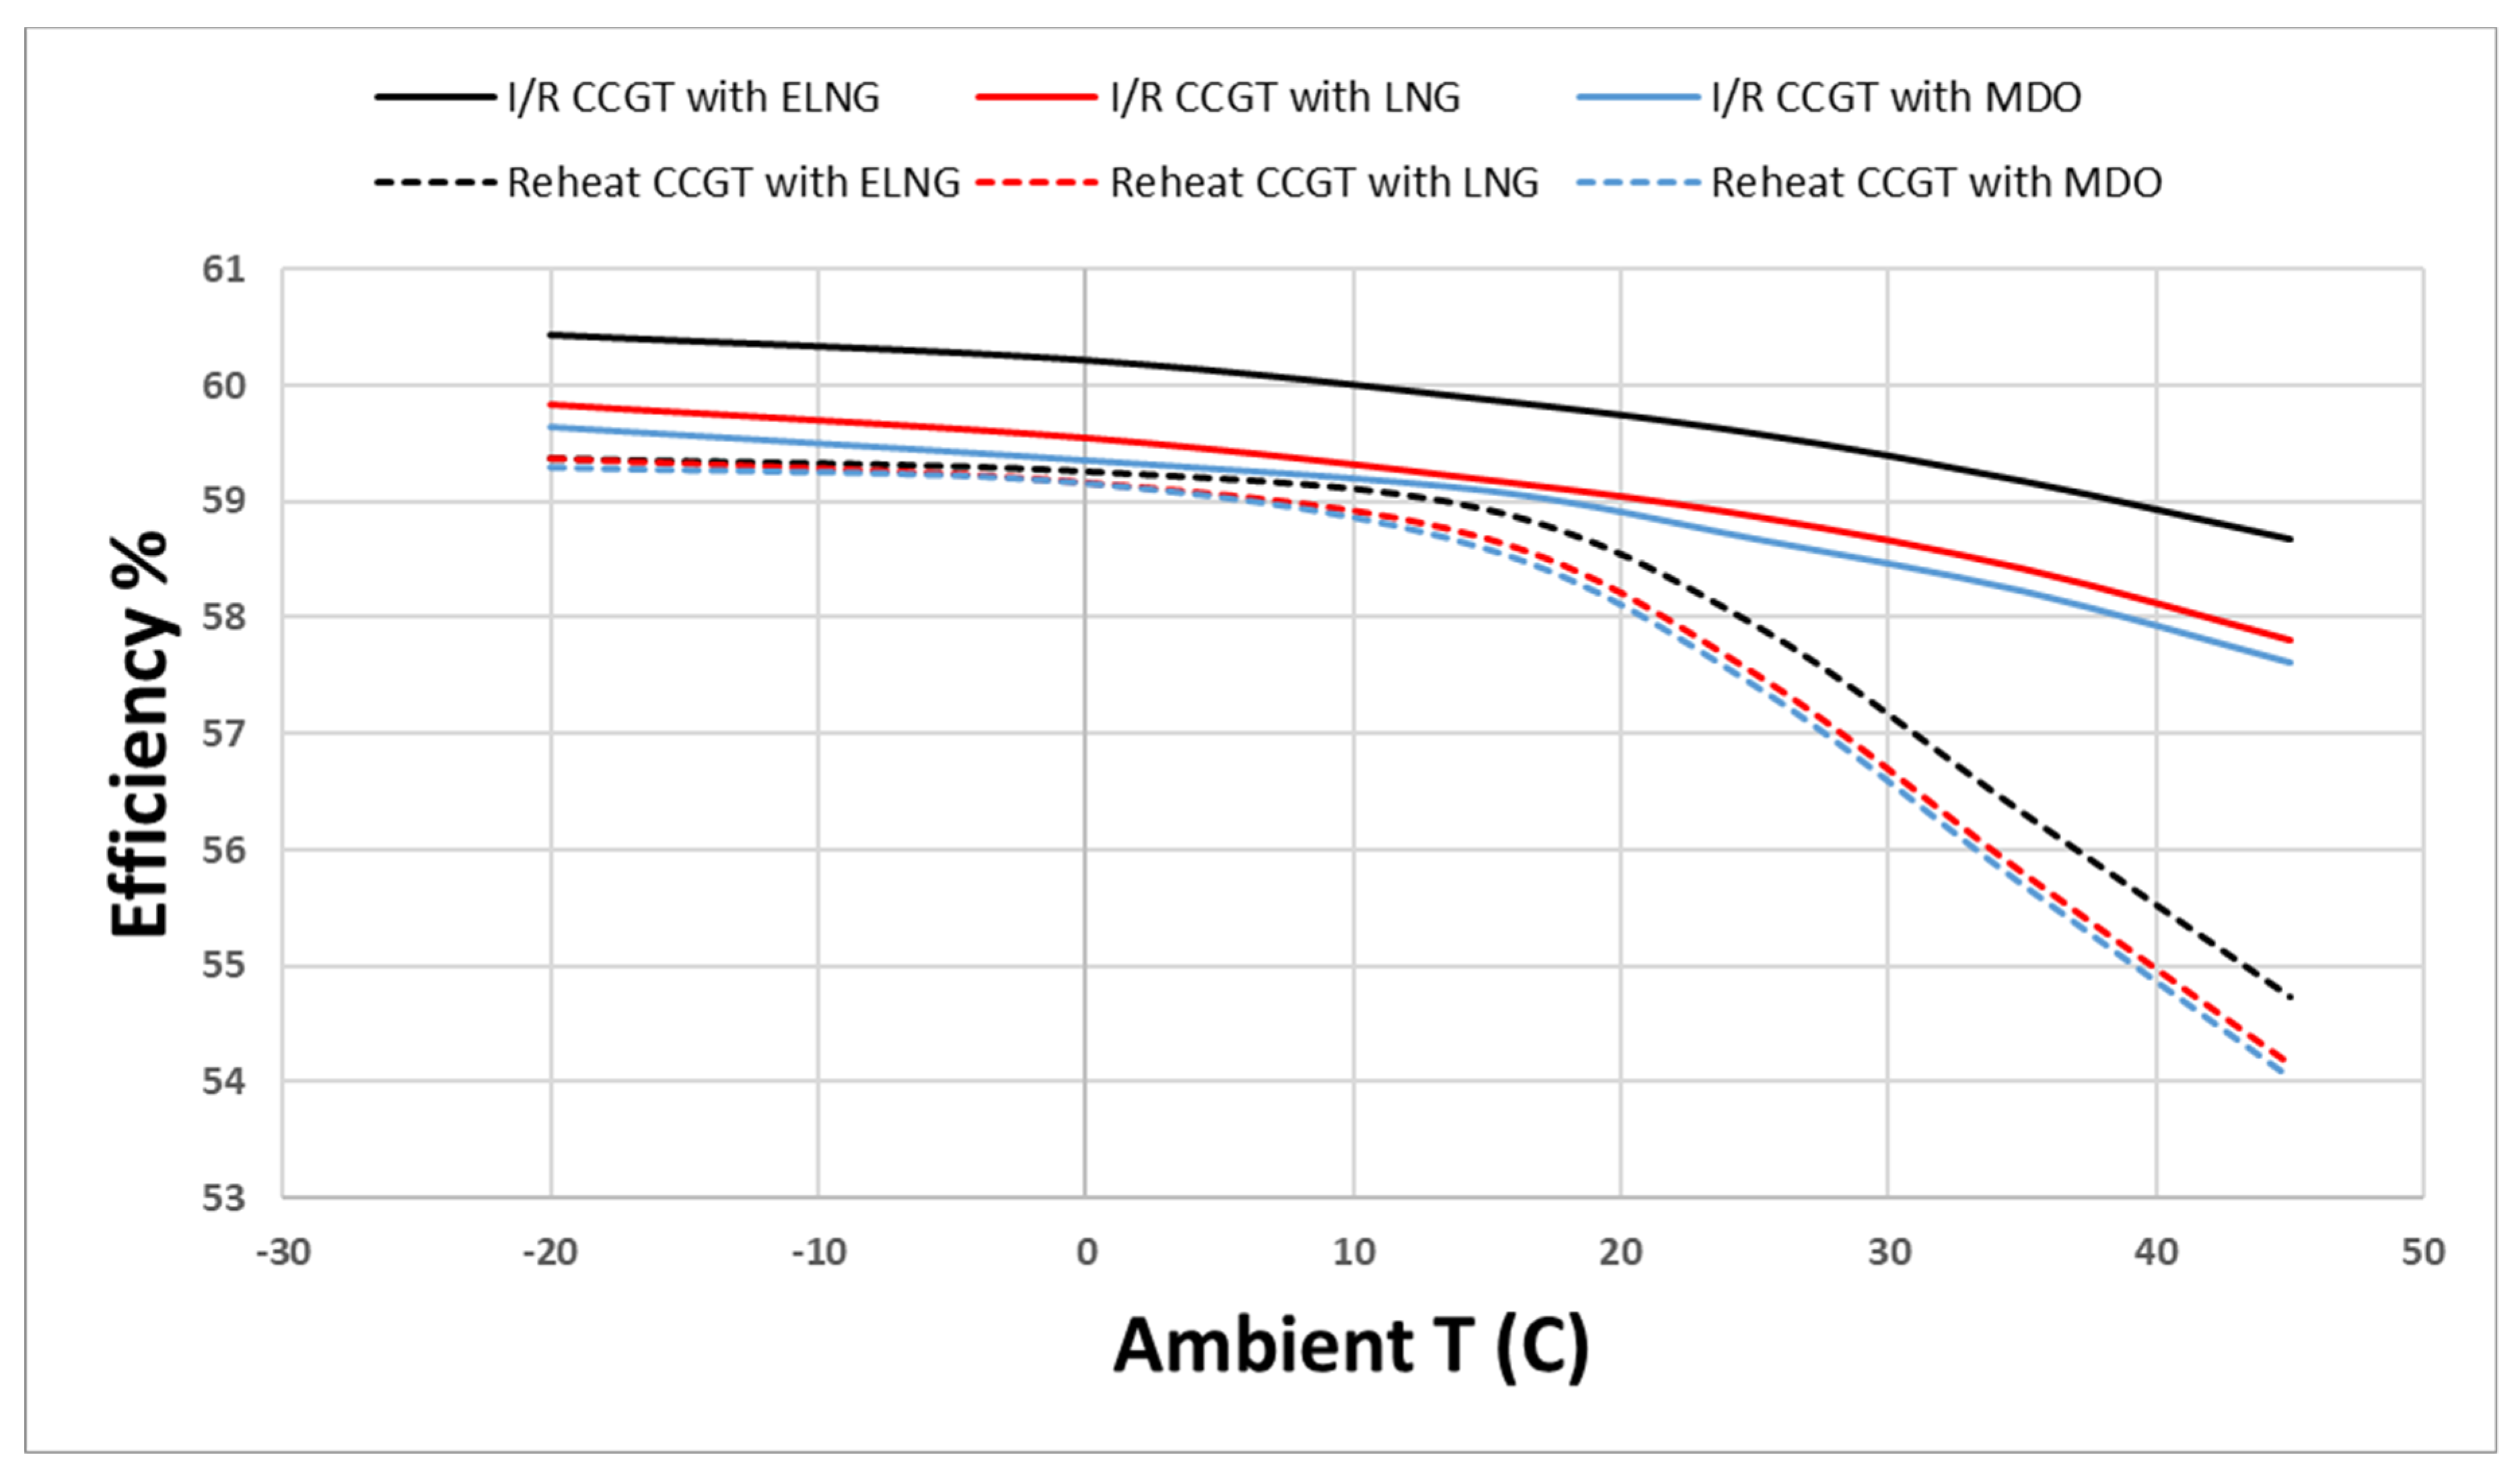
- Effect of ambient temperature on CCGT
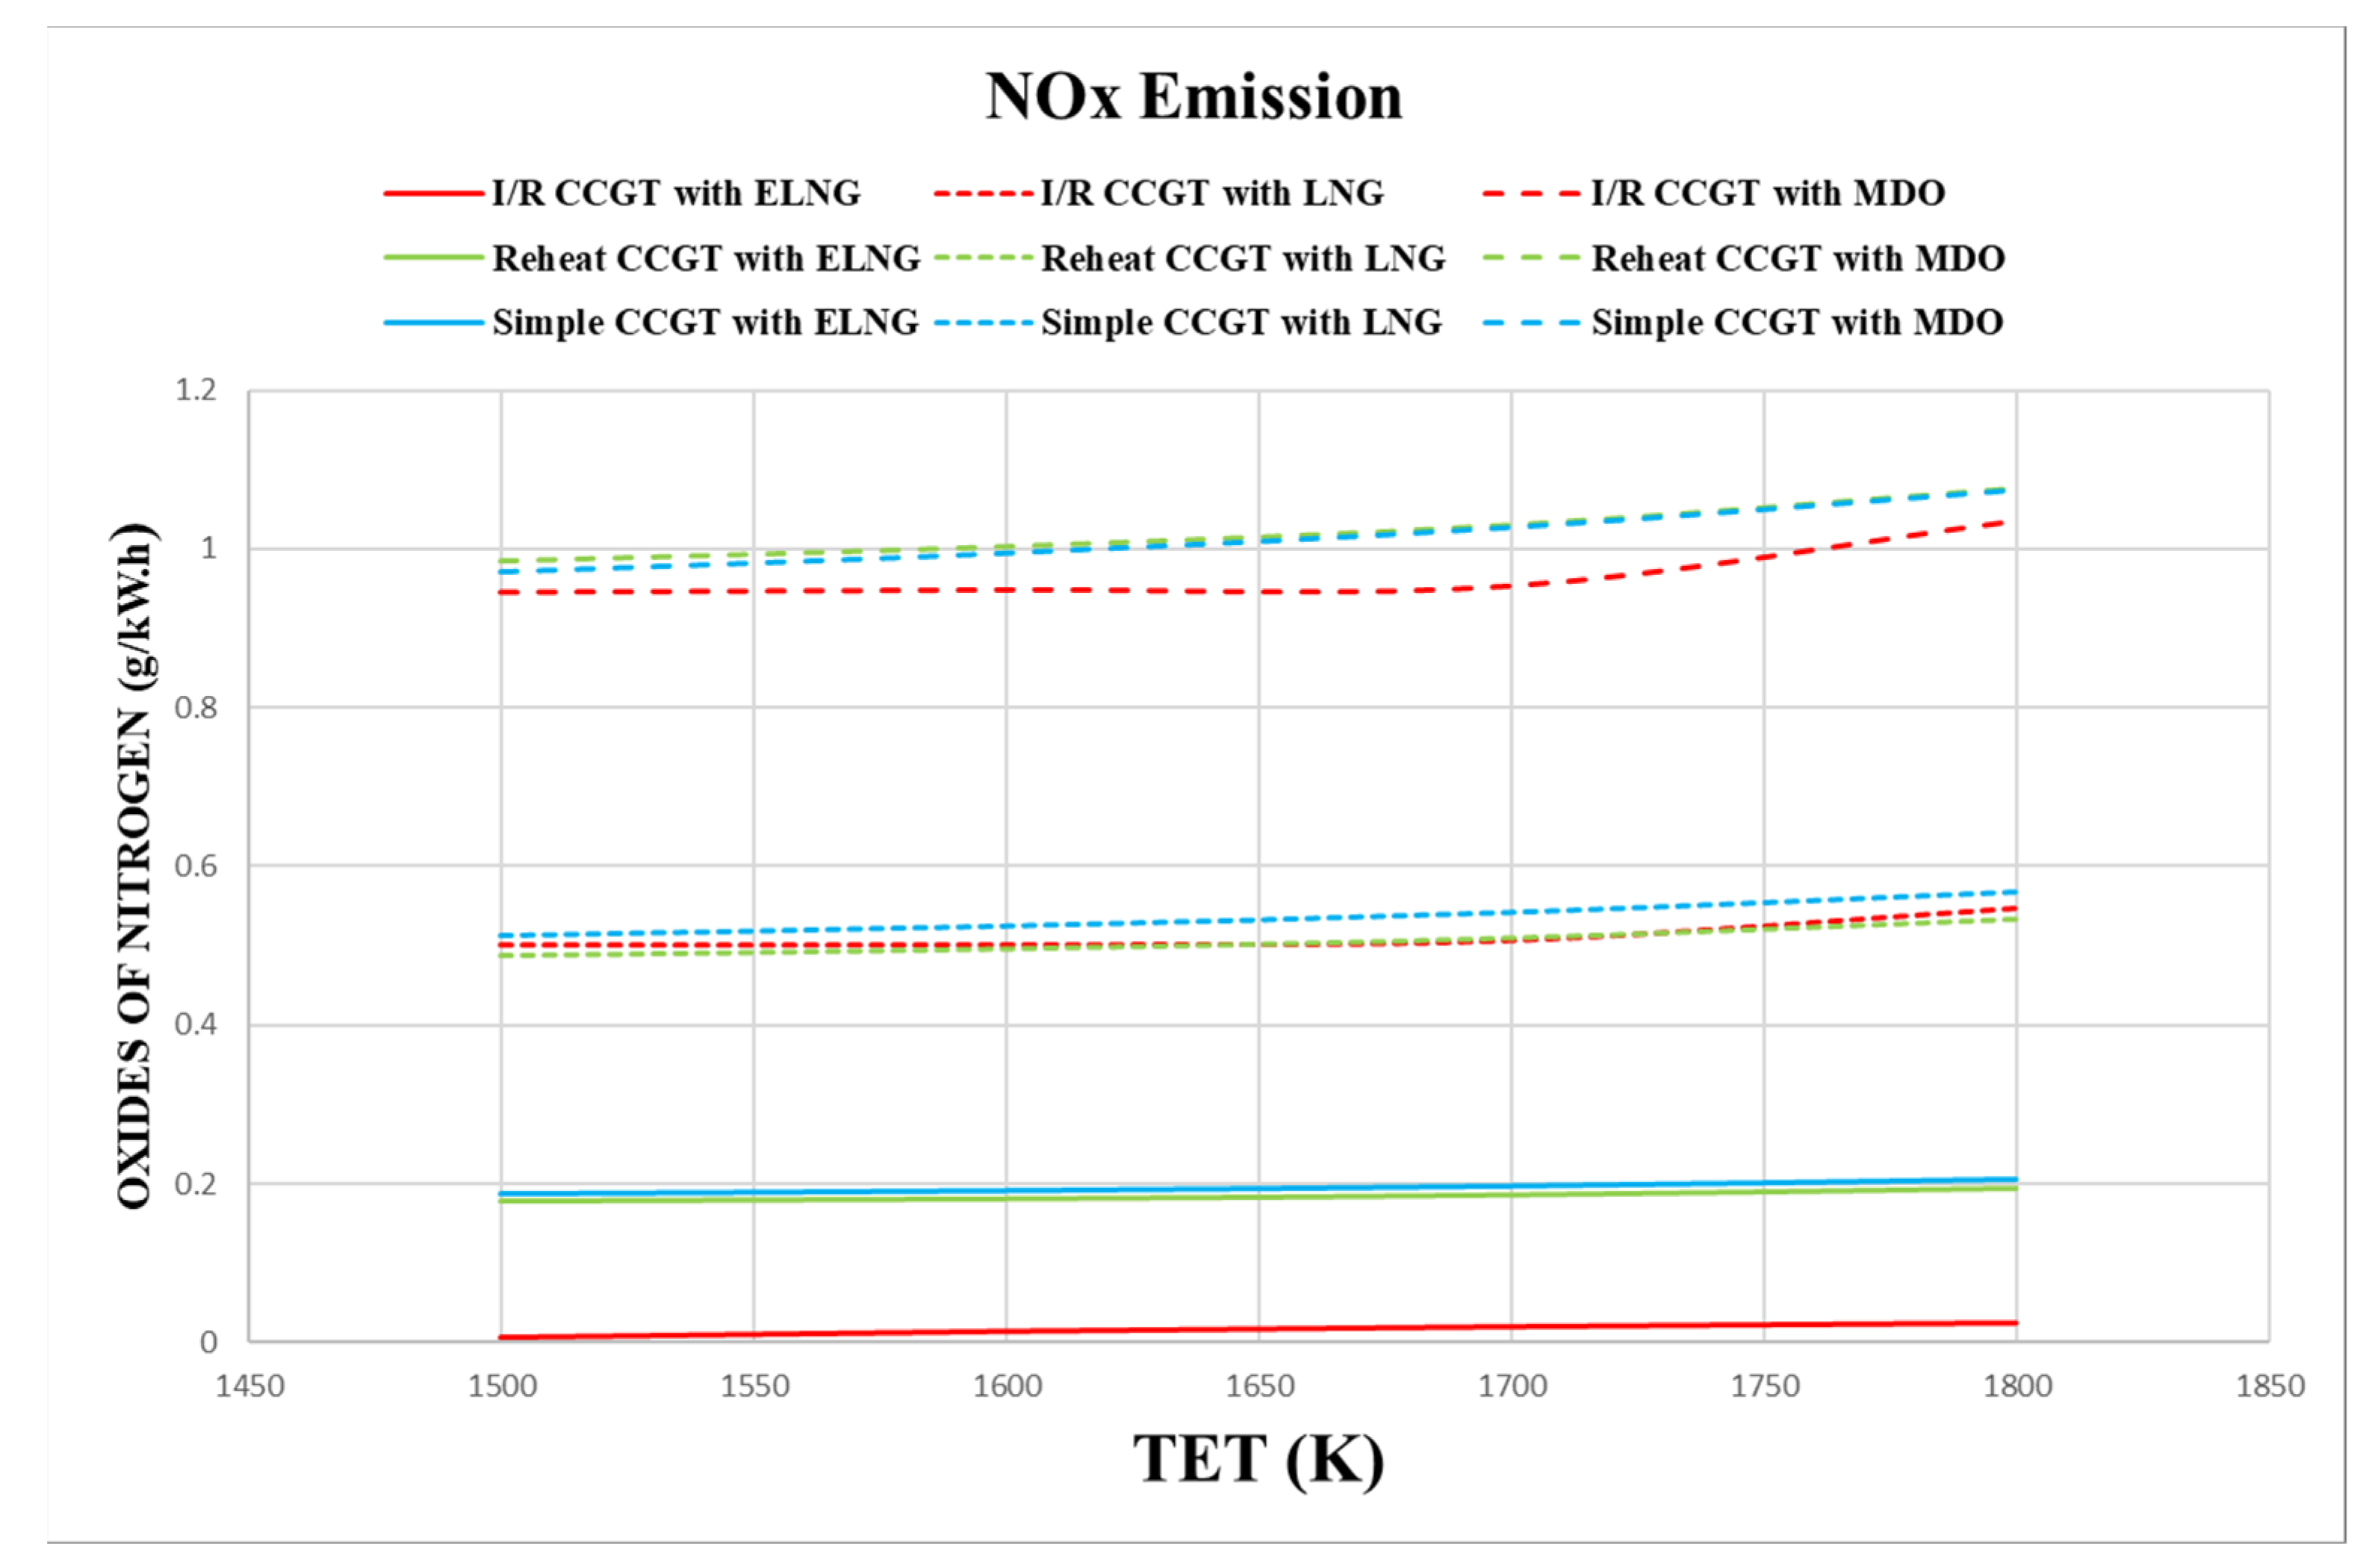
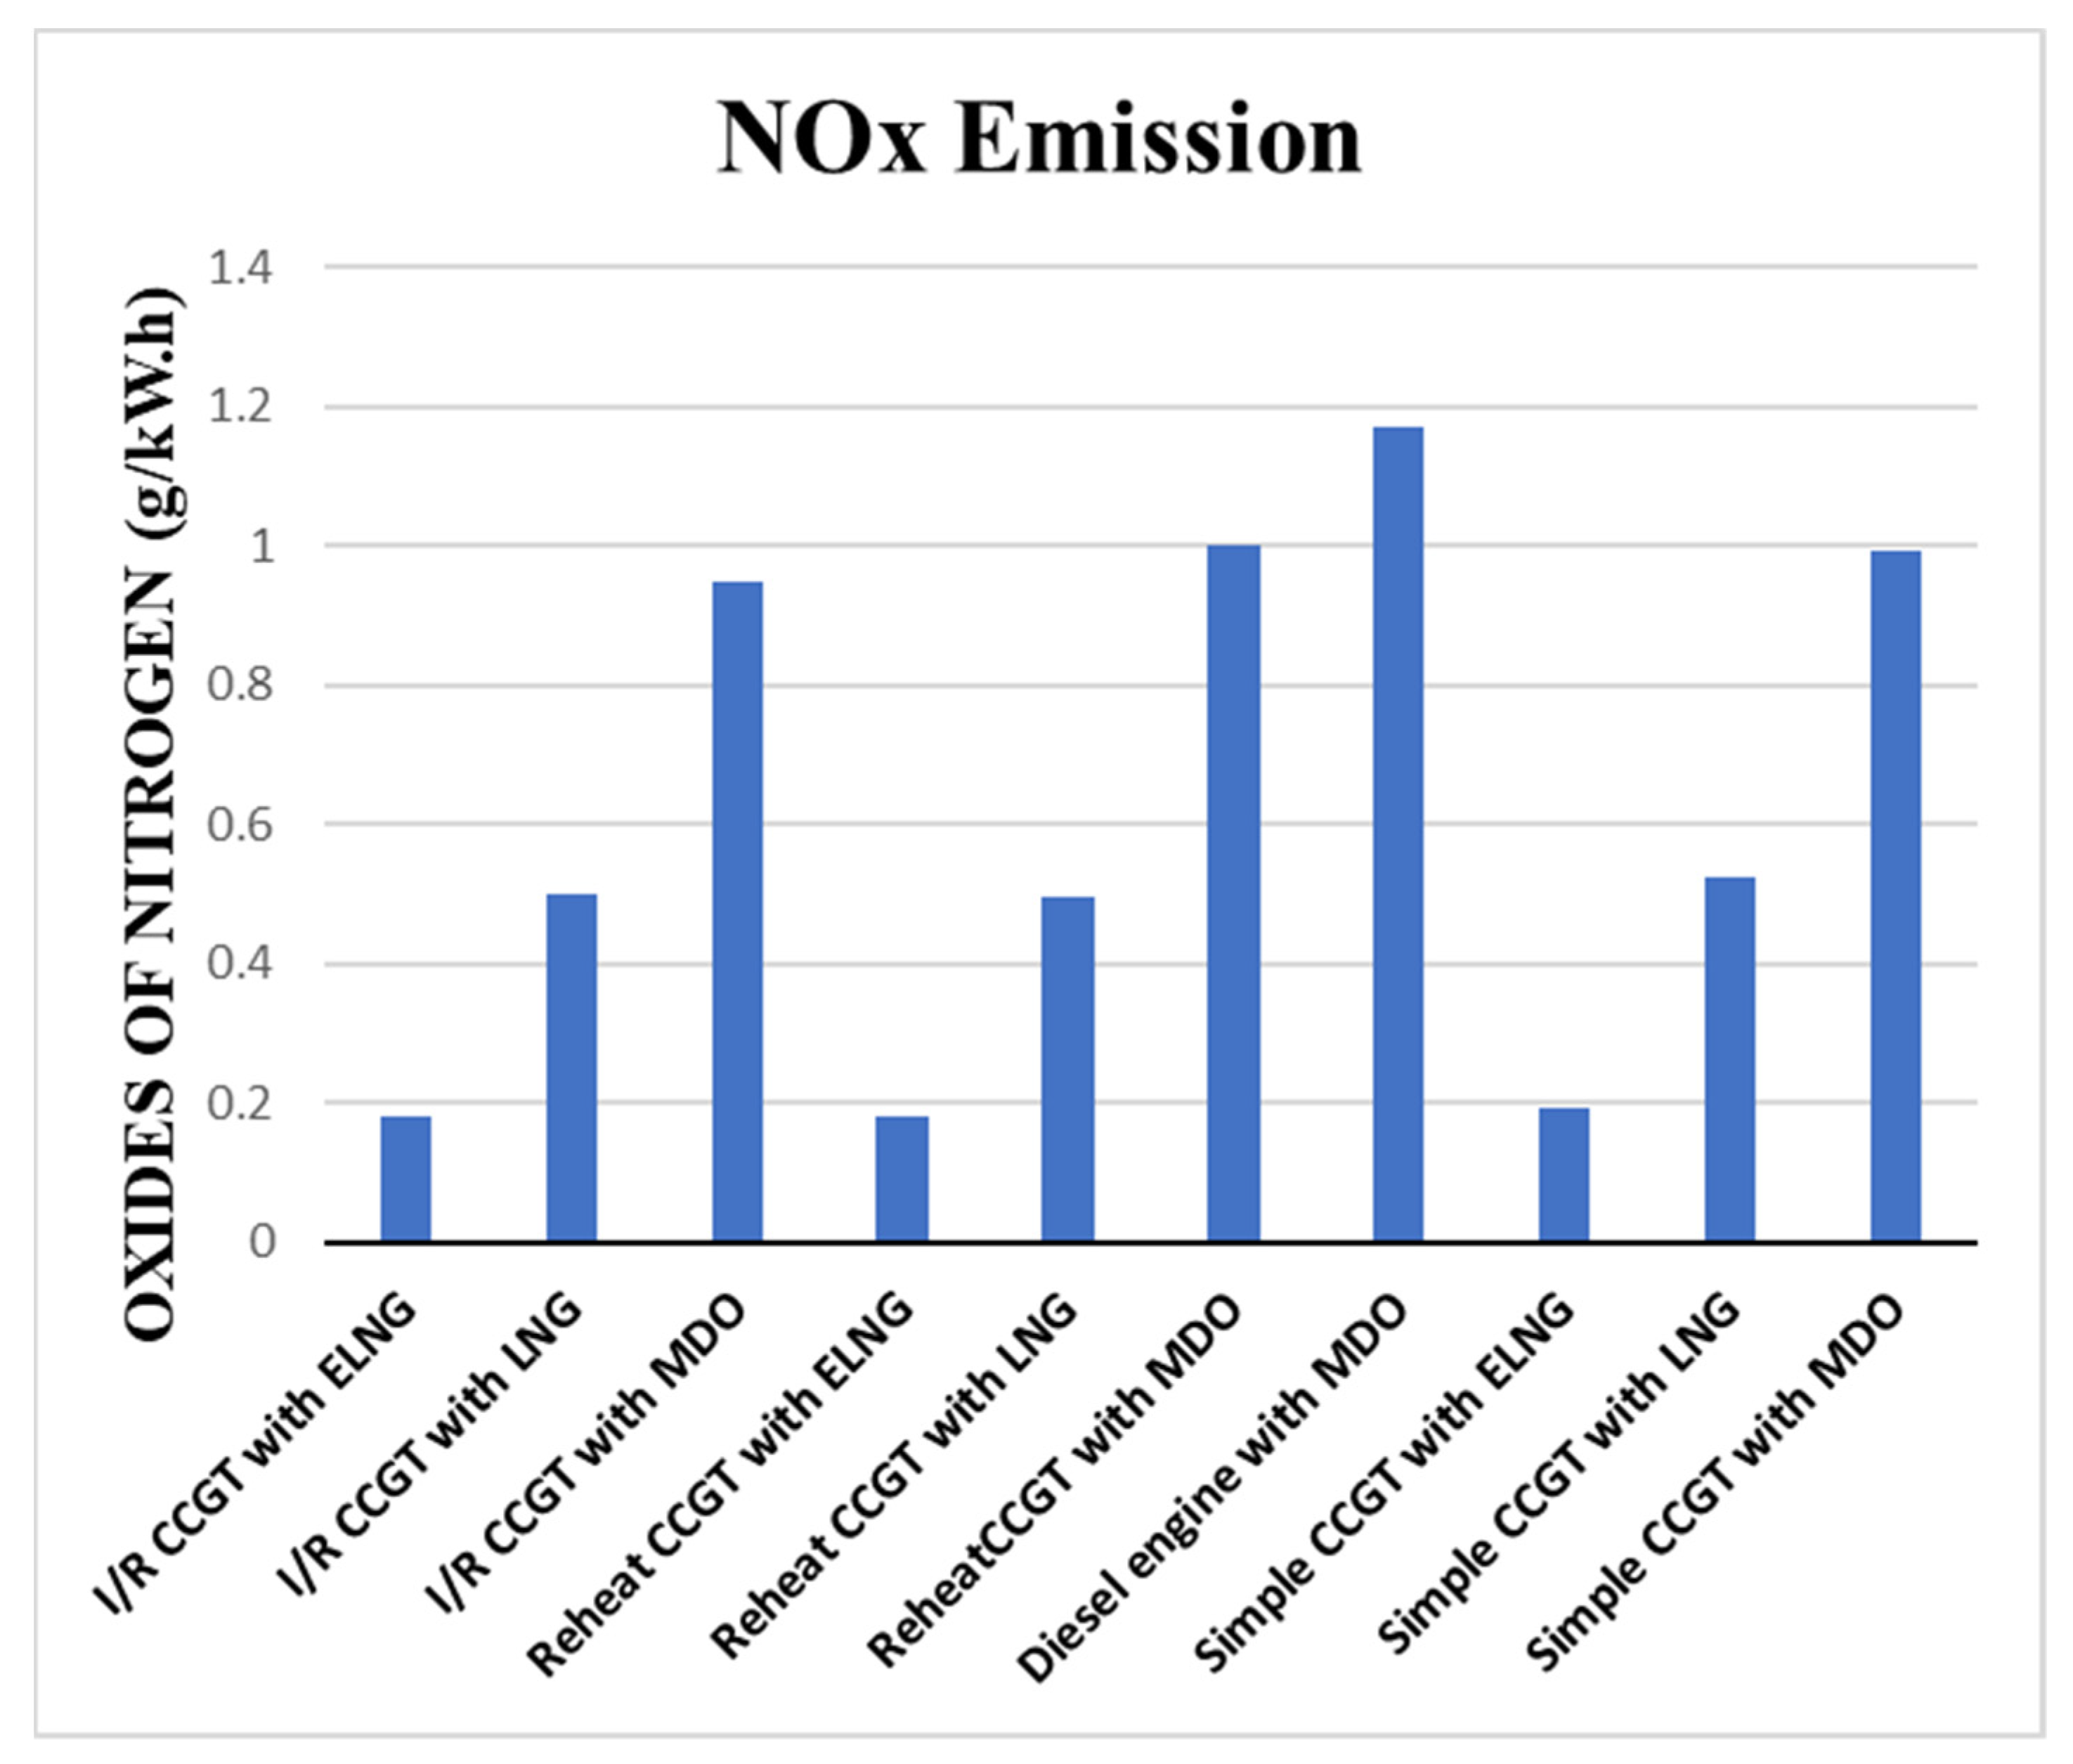
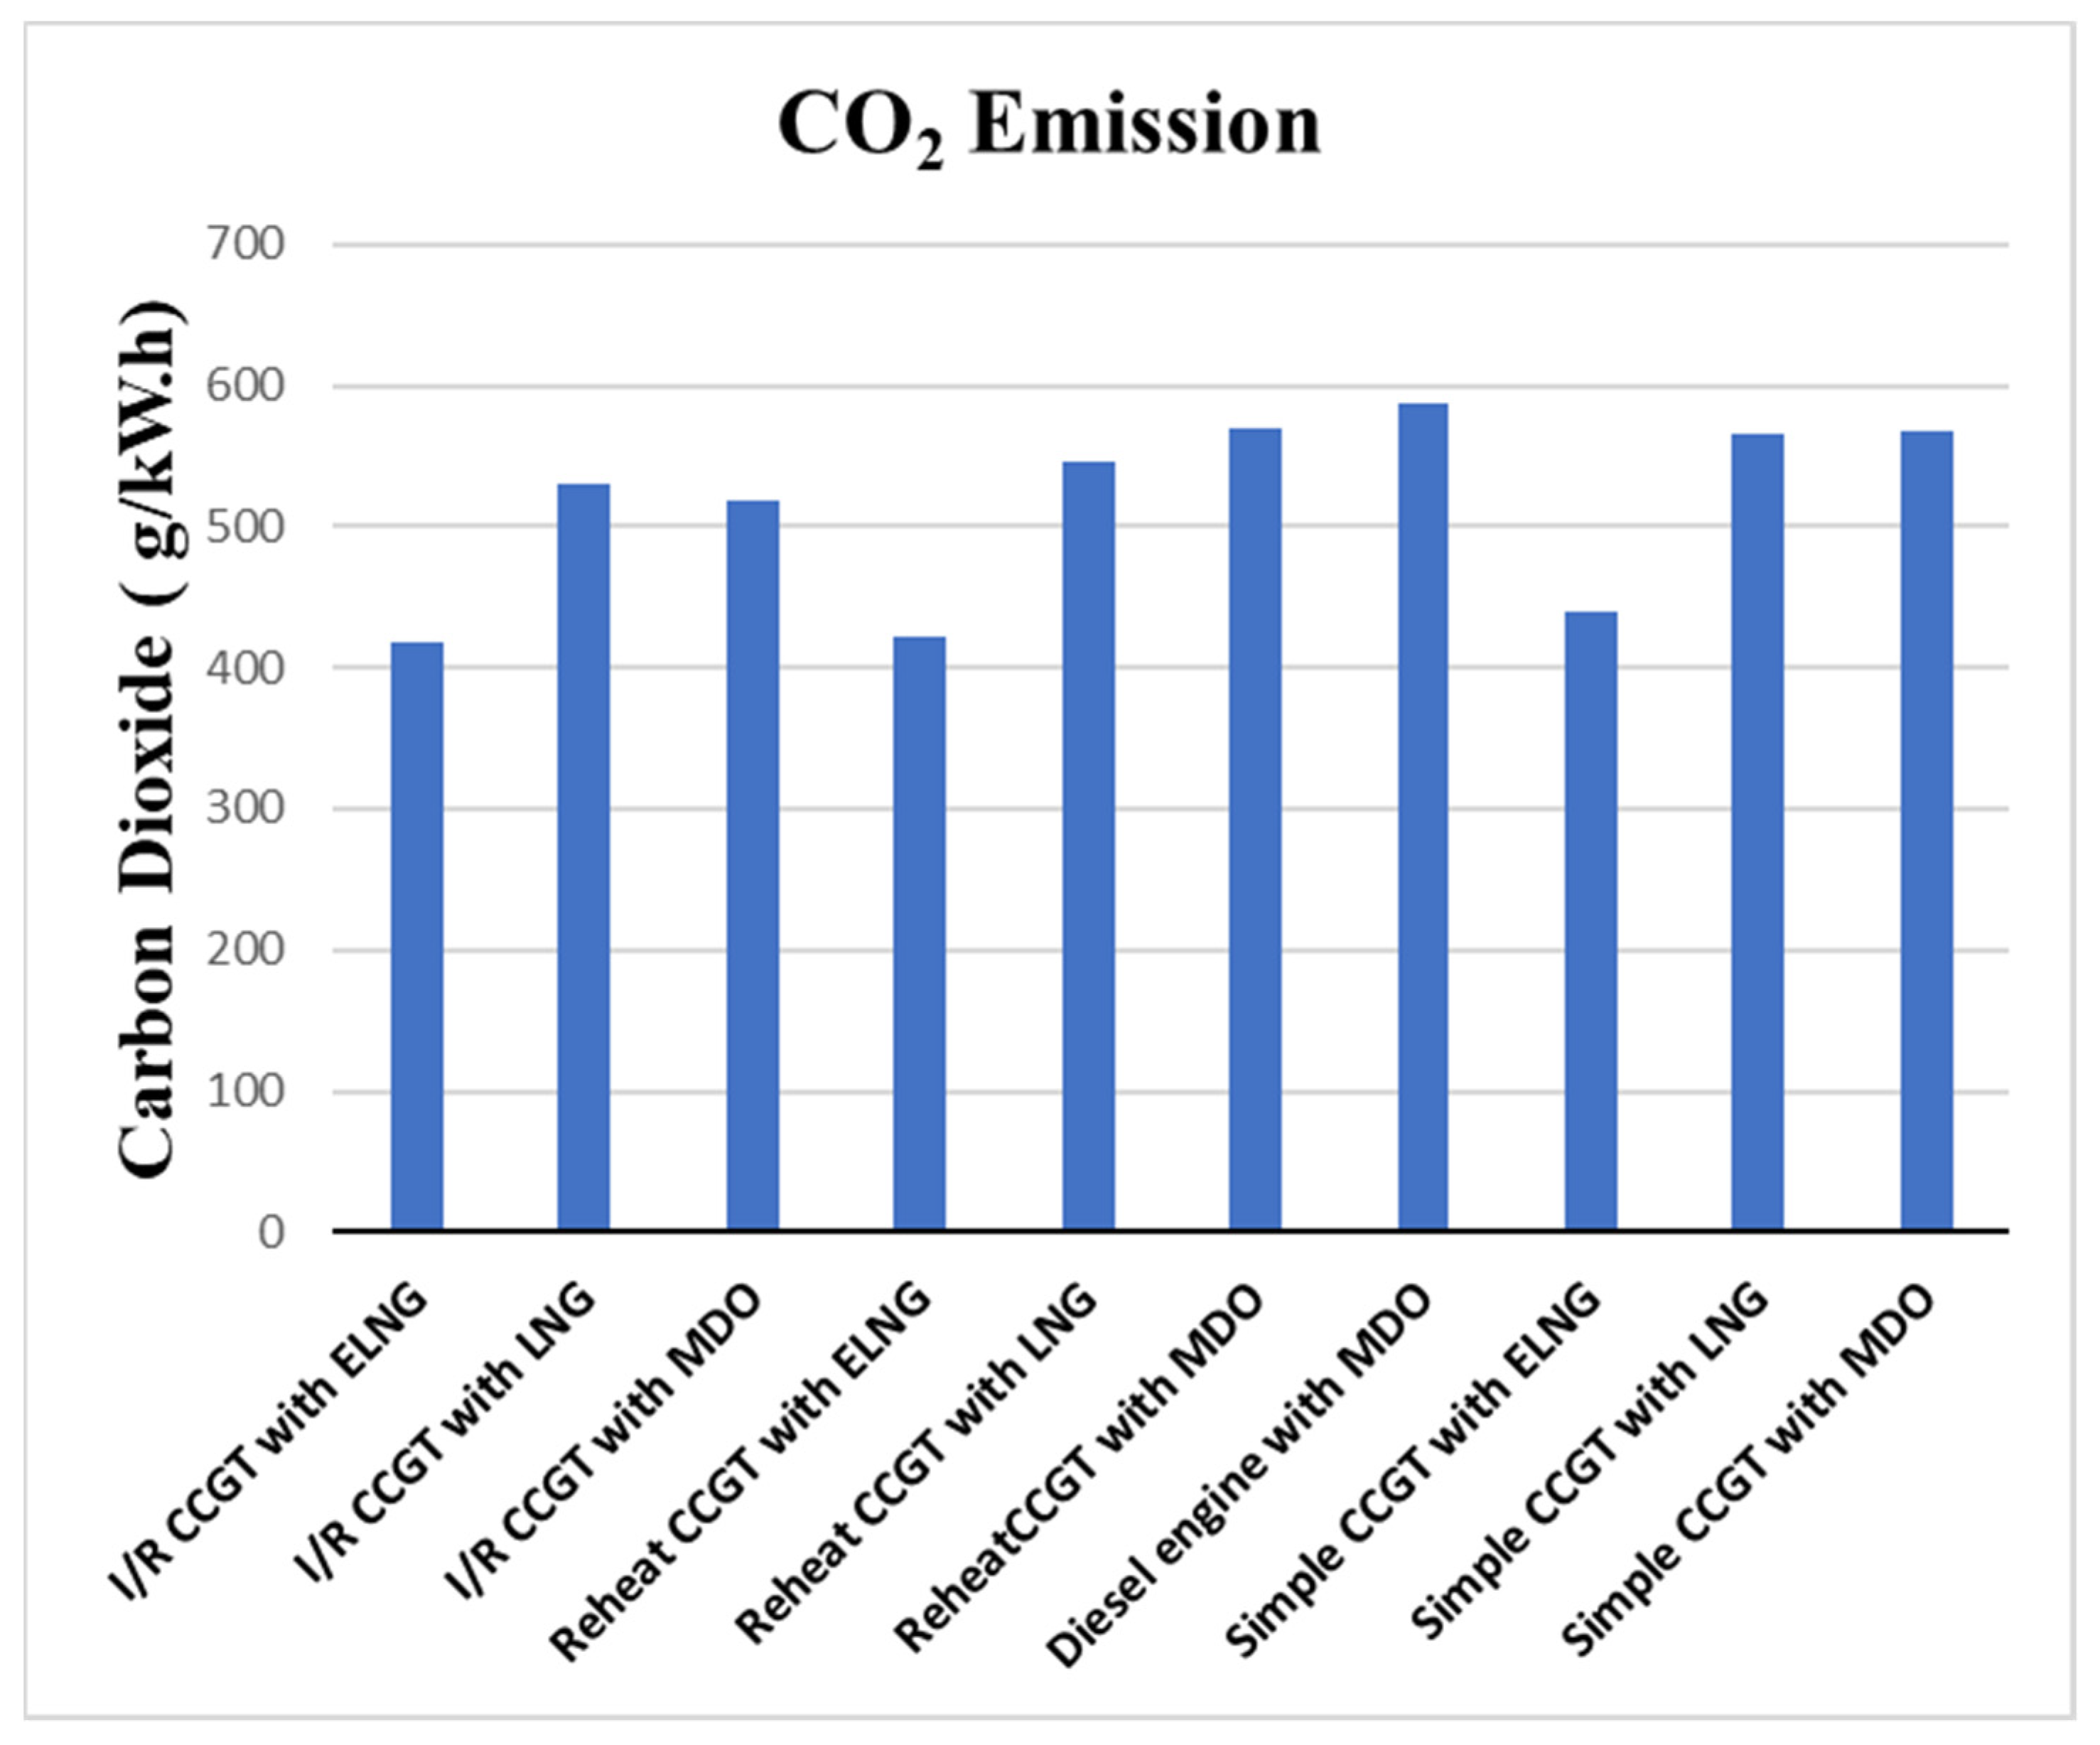
3.2. Environmental Results
3.3. Engine Size and Weight
4. Conclusions
Author Contributions
Funding
Institutional Review Board Statement
Informed Consent Statement
Data Availability Statement
Acknowledgments
Conflicts of Interest
References
- Alrashed, M.; Nikolaidis, T.; Pilidis, P.; Alrashed, W.; Jafari, S. Economic and environmental viability assessment of NASA’s turboelectric distribution propulsion. Energy Rep. 2020, 6, 1685–1695. [Google Scholar] [CrossRef]
- Altosole, M.; Benvenuto, G.; Campora, U.; Laviola, M.; Trucco, A. Waste heat recovery from marine gas turbines and diesel engines. Energies 2017, 10, 718. [Google Scholar] [CrossRef] [Green Version]
- Wiggins, E.G. COGAS propulsion for LNG ships. J. Mar. Sci. Appl. 2011, 10, 175–183. [Google Scholar] [CrossRef]
- Bengtsson, S.; Fridell, E.; Andersson, K. Environmental assessment of two pathways towards the use of biofuels in shipping. Energy Policy 2012, 44, 451–463. [Google Scholar] [CrossRef]
- Benvenuto, G.; Bertetta, D.; Carollo, F.; Campora, U. COGAS plant as possible future alternative to the diesel engine for the propulsion of large ships. Sustain. Marit. Transp. Exploit. SEA Res. 2011, 2, 603–614. [Google Scholar] [CrossRef]
- Benvenuto, G.; Laviola, M.; Campora, U. Assessment of steam cycle layouts for COGAS ship propulsion systems. In Proceedings of the MARTECH (February): 2nd International Conference on Maritime Technology and Engineering, Lisbon, Portugal, 15–17 October 2014; pp. 743–754. [Google Scholar] [CrossRef]
- Brandt, D.G.E. Gas Turbine Philosophy G.E. Power Generation; GE Industrial & Power Systems: Schenectady, NY, USA, 1994. [Google Scholar]
- Brynolf, S.; Fridell, E.; Andersson, K. Environmental assessment of marine fuels: Liquefied natural gas, liquefied biogas, methanol and bio-methanol. J. Clean. Prod. 2014, 74, 86–95. [Google Scholar] [CrossRef]
- Coleman, M.J. Florida State University libraries ship weight reduction and efficiency enhancement through combined power cycles. Energy 2015, 93, 521–533. [Google Scholar] [CrossRef] [Green Version]
- Hallegatte, E.K.L.; Kram, S.; Arnell, T.; Carter, N.W.; Edmonds, T.R.; Kriegler, J.; Mathur, E.; O’Neill, R.; Riahi, B.C.; Winkler, K.; et al. A new scenario framework for climate change research: Background, process, and future directions. Clim. Change 2014, 122, 363–372. [Google Scholar] [CrossRef] [Green Version]
- RGas Turbine engines RB211—Rolls Royce—PDF Catalogs Technical Documentation Brochure. Available online: https://pdf.directindustry.com/pdf/rolls-royce/gas-turbine-engines-rb211/22649-86918.html (accessed on 20 November 2021).
- Emmanuel-Douglas, I. Performance evaluation of combined cycles for cruise ship applications. Proc. ASME Int. Mech. Eng. Congr. Expo. 2009, 8, 183–194. [Google Scholar] [CrossRef]
- Gilbert, P.; Walsh, C.; Traut, M.; Kesieme, U.; Pazouki, K.; Murphy, A. Assessment of full life-cycle air emissions of alternative shipping fuels. J. Clean. Prod. 2018, 172, 855–866. [Google Scholar] [CrossRef]
- Goldstein, L.; Hedman, B.; Knowles, D.; Freedman, S.I.; Woods, R.; Schwizer, T. Gas-Fired Distributed Energy Resource Technology Characterisations; Technical Report; Gas Research Institute and the National Renewable Energy Laboratory (NREL): Golden, CO, USA, 2003; p. 226. Available online: http://www.osti.gov/bridge (accessed on 15 June 2021).
- Project Guide Electronically Controlled Dual Fuel Two-stroke Engines. 2014. Available online: www.mandieselturbo.com (accessed on 20 November 2021).
- Han, E.S.; Goleman, D.; Boyatzis, R.; Mckee, A. Basic Ship Theory, 5th ed.; Butterworth-Heinemann: Oxford, UK, 2001. [Google Scholar]
- International Maritime Organization, Centre MK. International Shipping and World Trade Facts and Figures. 2009. Available online: https://imo.libguides.com/MaritimeFactsandFigures (accessed on 20 November 2021).
- Jefferson, M.; Zhou, P.L.; Hindmarch, G. Analysis by computer simulation of a combined gas turbine and steam turbine (cogas) system for marine propulsion. J. Mar. Eng. Technol. 2003, 2, 43–53. [Google Scholar] [CrossRef]
- Kakaç, S.; Liu, H.; Pramuanjaroenkij, A. Heat Exchangers: Selection, Rating, and Thermal Design, 3rd ed.; CRC Press: Boca Raton, FL, USA, 2012; p. 631. Available online: https://books.google.com/books?hl=en&lr=&id=sJXpvP6xLZsC&pgis=1 (accessed on 10 July 2021).
- Klassen, M. Fuel flexibility for dry low emission gas turbines—Cleanly burning biofuels, coal liquids and petroleum fuels. In Proceedings of the Power Gen International Conference, New Orleans, LA, USA, 10–14 December 2007. [Google Scholar]
- Kumar, J.; Kumpulainen, L.; Kauhaniemi, K. Technical design aspects of harbour area grid for shore to ship power: State of the art and future solutions. Int. J. Electr. Power Energy Syst. 2019, 104, 840–852. [Google Scholar] [CrossRef]
- Mohd Noor, C.W.; Noor, M.M.; Mamat, R. Biodiesel as alternative fuel for marine diesel engine applications: A review. Renew. Sustain. Energy Rev. 2018, 94, 127–142. [Google Scholar] [CrossRef]
- Nalianda, D.K. Impact of Environmental Taxation Policies on Civil Aviation—A Techno-Economic Environmental Risk Assessment Supervisors; Cranfield University: Cranfield, UK, 2012. [Google Scholar]
- Nikolaidis, T. The Turbomatch Scheme for Aero/Industrial Gas Turbine Engine. In Turbomatch Manual; Cranfield University: Cranfield, UK, 2015. [Google Scholar]
- On, S.; Feasibilityuse, T.H.E.; Lng, O.F.; Shipping, F.F.O.R. Safe, Secure and Efficient Shipping on Clean Oceans Studies on the Feasibility and Use of LNG as a Fuel for Shipping. Air Pollution and Energy Efficiency Studies. 2016. Available online: www.imo.org (accessed on 20 July 2021).
- Parks, S. Young carers. Br. J. Gen. Pract. 2014, 64, 616. [Google Scholar] [CrossRef] [PubMed] [Green Version]
- Pilidis, P. Thermal Power Gas Turbine Performance; Cranfield University: Cranfield, UK, 2013; p. 175. [Google Scholar]
- ENTEC. Ship Emissions Final Report. Quantification of ship emissions. Ship Emissions Final Report. 2002, pp. 3–48. Available online: http://ec.europa.eu/environment/air/pdf/chapter2_ship_emissions.pdf (accessed on 10 August 2021).
- Rivera-Alvarez, A.; Coleman, M.J.; Ordonez, J.C. Ship weight reduction and efficiency enhancement through combined power cycles. Energy 2015, 93, 521–533. [Google Scholar] [CrossRef] [Green Version]
- Saravanamuttoo; Rogers, G.F.C.; Cohen, H.; Straznicky, P.V. Gas Turbine Theory. 2017. Available online: http://www.pearson.com/uk (accessed on 10 July 2021).
- Faulkner, L.L. Steam Generators and Waste Heat Boilers for Process and Plant Engineers; Taylor & Francis Group: Abingdon, UK, 2015; pp. 39–89. [Google Scholar] [CrossRef]
- Sayma, A.I. Gas turbines for marine applications. In Encyclopedia of Maritime and Offshore Engineering; John Wiley & Sons: Hoboken, NJ, USA, 2017; pp. 1–10. [Google Scholar] [CrossRef] [Green Version]
- Seebregts, A.J. Gas-fired power. IEA ETSAP—Technology. Brief E02. 2010, pp. 1–5. Available online: http://www.iea-etsap.org/web/E-TechDS/PDF/E02-gas_fired_power-GS-AD-gct.pdf:2010 (accessed on 20 July 2021).
- Spoof-Tuomi, K.; Niemi, S. Environmental and economic evaluation of fuel choices for Short Sea shipping. Clean Technol. 2020, 2, 4. [Google Scholar] [CrossRef] [Green Version]
- Talluri, L.; Nalianda, D.K.; Giuliani, E. Techno economic and environmental assessment of Flettner rotors for marine propulsion. Ocean. Eng. 2018, 154, 1–15. [Google Scholar] [CrossRef] [Green Version]
- Talluri, L.; Nalianda, D.K.; Kyprianidis, K.G.; Pilidis, P. Techno economic and environmental assessment of wind assisted marine propulsion systems. Ocean Eng. 2016, 121, 301–311. [Google Scholar] [CrossRef] [Green Version]
- Tanuma, T. Advances in Steam Turbines for Modern Power Plants; Woodhead Publishing: Cambridge, UK, 2017. [Google Scholar]
- Trozzi, C. Emission Estimate Methodology for Maritime Navigation. 2010. Available online: http://www.epa.gov/ttnchie1/conference/ei19/session10/trozzi.pdf (accessed on 10 September 2021).


| Parameter | Simulated Value | Actual Value | Deviation % |
|---|---|---|---|
| Thermal Efficiency (%) | 38.1 | 38.8 | −0.494 |
| Exhaust Gas Temperature (°C) | 492.83 | 492 | 0.586 |
| Exhaust Mass Flow (kg/s) | 96.066 | 96 | 0.046 |
| Parameter | Value |
|---|---|
| Ambient Conditions | 15 °C = 288 K, |
| 1 atm = 101 kPa | |
| Compressor Isentropic Efficiency (%) | 87 |
| Intercooler Efficiency (%) | 99 |
| LPC = HPC Pressure Ratio for Simple-Cycle Variable | LPC = 4.6368/HPC = 4.6368 |
| Combustor Efficiency (%) | 99 |
| Turbine Isentropic Efficiency (%) | 88.0 |
| Power Turbine Isentropic Efficiency (%) | 88.0 |
| Mass Flow (kg/s) | 106 |
| Combustor Pressure Loss (%) | 5.0 |
| Bleed Air for Turbine Cooling (% of Core Mass Flow) | 10.0 |
| Intake/Nozzle Pressure Loss (%) | 0.0 |
| TET: turbine entry temperature (K) Variable | 1600 |
| Exhaust Pressure Loss(%) | 2 |
| Intercooler Pressure Loss (%) | 2 |
| Humidity (%) | 60 |
| Parameter | Value |
|---|---|
| Steam Turbine Isentropic Efficiency (%) | 88 |
| Output power (MW) | Up to 20 |
| Approach point (C) | 7.5 |
| Pinch point (C) | 20 |
| Steam turbine efficiency | 88.0 |
| Superheated pressure (bar) | 60 |
| Condenser pressure (bar) | 0.06 |
| Pump pressure (bar) | 3 |
| Steam turbine Isentropic Efficiency (%) | 88 |
| Ambient Temperature | Reduction in Ambient Temperature | FAR |
|---|---|---|
| 288 | 269.5 | 0.03211 |
| 298 | 279.5 | 0.03223 |
| 308 | 289.5 | 0.03245 |
| 318 | 299.5 | 0.03284 |
| Emission Factors (g/kWh) | NOx (g/kWh) | CO2 (g/kWh) |
|---|---|---|
| Diesel engine with MDO | 9 | 588 |
| CCGT with MDO | 5.7 | 524 |
| CCGT with LNG | 3.05 | 522 |
| CCGT with ELNG | 1.17 | 412 |
| Gas Turbine Manufacturer & Model Number | Power (MW) | Weight (tonne) | Gas Turbine Manufacturer & Model Number | |
|---|---|---|---|---|
| MT7 | 4.6 | 0.45 | 0.04561 | MT7 |
| RB211-6762 | 30.387 | 22.680 | 0.13545 | RB211-6762 |
| MT30 | 36 | 65 | 0.30092 | MT30 |
| Steam Turbine Manufacturer & Model Number | Power (MW) | Weight (tonne) | Steam Turbine Manufacturer & Model Number | |
|---|---|---|---|---|
| ELLIOT MYR (8-stage) | 7.5 | 7.71 | 0.37488 | ELLIOT MYR (8-stage) |
| ELLIOT MYR 2SQV6 | 11 | 11.5 | 0.3152 | ELLIOT MYR 2SQV6 |
| Siemens SST 300 | 20 | 26 | 0.9206 | Siemens SST 300 |
| Length Overall | 399.67 m |
| Breadth | 58.73 m |
| Depth | 30.5 m |
| Draught | 16 m |
| Engine Power | 56 MW |
| Engine model | 11k98ME7 |
| Gross Tonnage | 187,541 t |
| Net Tonnage | 86,434 t |
| Speed | 23 knots |
| Engine Data | K98ME7.1-TII | Gas Turbine | Steam Turbine | HRSG |
|---|---|---|---|---|
| Length (m) | 27.36 | 4.57 | 12 | 6.33 |
| Height (m) | 19.35 | 2.41 | 5 | 11.7 |
| Breadth (m) | 11.36 | 2.21 | 4 | 6.16 |
| Weight (t) | 2500 | 40.8 | 26 | 197.7 |
| Power (mw) | 56 | 45 | 20 |
| Component | Diesel Engine | Simple CCGT | Reheat CCGT | I/R CCGT | ELNG CCGT |
|---|---|---|---|---|---|
| Diesel engine (t) | 2500 | — | — | — | — |
| Gas turbine (t) | — | 40.8 | 40.8 | 40.8 | 40.8 |
| Steam turbine (t) | — | 26 | 26 | 26 | 26 |
| HRSG (t) | — | 197.7 | 197.7 | 197.7 | 197.7 |
| Condenser (t) | — | 62.7 | 62.7 | 62.7 | 62.7 |
| Pump (t) | — | 13.8 | 13.8 | 13.8 | 13.8 |
| Reduction gear (t) | — | 278 | 278 | 278 | 278 |
| Second combustor (t) | — | — | 5.9 | 5.9 | 5.9 |
| Intercooler (t) | — | — | — | 67.38 | 67.38 |
| Second Pump (t) | — | — | — | — | 8.4 |
| Heat exchanger (t) | — | — | — | — | 111.67 |
| Total weight (t) | 2500 | 619 | 624.9 | 692.28 | 812.39 |
Publisher’s Note: MDPI stays neutral with regard to jurisdictional claims in published maps and institutional affiliations. |
© 2022 by the authors. Licensee MDPI, Basel, Switzerland. This article is an open access article distributed under the terms and conditions of the Creative Commons Attribution (CC BY) license (https://creativecommons.org/licenses/by/4.0/).
Share and Cite
Alzayedi, A.M.T.; Sampath, S.; Pilidis, P. Techno-Environmental Evaluation of a Liquefied Natural Gas-Fuelled Combined Gas Turbine with Steam Cycles for Large Container Ship Propulsion Systems. Energies 2022, 15, 1764. https://0-doi-org.brum.beds.ac.uk/10.3390/en15051764
Alzayedi AMT, Sampath S, Pilidis P. Techno-Environmental Evaluation of a Liquefied Natural Gas-Fuelled Combined Gas Turbine with Steam Cycles for Large Container Ship Propulsion Systems. Energies. 2022; 15(5):1764. https://0-doi-org.brum.beds.ac.uk/10.3390/en15051764
Chicago/Turabian StyleAlzayedi, Abdulaziz M. T., Suresh Sampath, and Pericles Pilidis. 2022. "Techno-Environmental Evaluation of a Liquefied Natural Gas-Fuelled Combined Gas Turbine with Steam Cycles for Large Container Ship Propulsion Systems" Energies 15, no. 5: 1764. https://0-doi-org.brum.beds.ac.uk/10.3390/en15051764