Article

Investigation and Field Measurements for Demand Side Management Control Technique of Smart Air Conditioners located at Residential, Commercial, and Industrial Sites

1
School of Electrical Engineering, Xi’an Jiaotong University, Xi’an 710049, China
2
College of Computer Engineering and Sciences, Prince Sattam Bin Abdulaziz University, Al-Kharj 11942, Saudi Arabia
3
Department of Electrical Engineering Government College University, Lahore 54000, Pakistan
4
Department of Electrical Power Engineering and Mechatronics, Tallinn University of Technology, Ehitajate tee 5, 19086 Tallinn, Estonia
5
Department of Information & Communication Engineering, The Islamia University of Bahawalpur, Bahawalpur 63100, Pakistan
6
Department of Electrical and Electronics Engineering, National Institute of Technology, Delhi 110040, India
7
Department of Information and Communication Engineering, Yeungnam University, Gyeongsan 38541, Korea
8
Faculty of Engineering, Uni de Moncton, Moncton, NB E1A3E9, Canada
9
International Institute of Technology and Management, Libreville BP1989, Gabon
10
Spectrum of Knowledge Production & Skills Development, Sfax 3027, Tunisia
11
School of Electrical Engineering, Department of Electrical and Electronic Engineering Science, University of Johannesburg, Johannesburg 2006, South Africa
*
Authors to whom correspondence should be addressed.
Submission received: 10 January 2022 / Revised: 10 February 2022 / Accepted: 23 March 2022 / Published: 28 March 2022
(This article belongs to the Special Issue Power Transmission and Distribution Equipment and Systems)

Abstract

:
This paper investigates the response and characteristics of the narrowband power line communication (NB-PLC) technique for the effective control of electric appliances such as smart air conditioners (SACs) for demand side management (DSM) services. The expression for temperature sensitivity by examining the influence of atmospheric temperature variations on power consumption profile of all possible types of loads, i.e., residential, commercial, and industrial loads is derived and analyzed. Comprehensive field measurements on these power consumers are carried out in Lahore, Pakistan. The responses of low voltage channels, medium voltage channels, and transformer bridge for a 3–500 kHz NB-PLC frequency range are presented for DSM services. The master control room transmits control commands for the thermostat settings of SACs over power lines, crossing the transformer bridge to reach the SACs of power consumers by using communication protocol smart energy profile 1.0. The comparison of hourly and daily power consumption profiles under evaluation loads, by analyzing typical and variable frequency air conditioners on setting thermostat temperature at 25 °C and 27 °C conventionally and then by using DSM control technique, is analyzed. A prominent reduction in power consumption is found with the implementation of the DSM control technique.

1. Introduction

Research in the power industry has for decades primarily focused on the development of an effective electric power system. Electric power systems and their energy generation, distribution, and management have undergone a significant shift in terms of cost-effectiveness by reducing energy retail prices with the emergence of distributed generation (DG) and smart grid (SG). This will also help reduce fuel costs, which form about 25% of the total revenue of utility companies [1,2]. One approach of efficient operation is to involve consumers in load shaping processes which are not only environment friendly but also help minimize operating expenses (OPEX) and capital expenditures (CAPEX). Research in the last four decades has seen an increased emphasis on DSM, demand response (DR), and load management research; a number of DSM programs with varying degrees of success have been proposed. In developed countries, including the United States, consumers have the facility of remote metering systems, which, if upgraded, can efficiently manage consumption based on dynamic energy retail price provided in real-time by utility companies.
The growing economies and population in the developing countries imitate serious challenges related to the demand and supply management of electrical power. Interconnected traditional and distributed electricity generating stations are used to tackle the growing demand for electricity [3]. A central communication link is used to connect the distribution system with the energy transmission infrastructure. It includes the interconnection of various components of consumers and networks through a smart control center capable of providing reliable and efficient electrical power management. Hence, a new concept of SG is capable of handling the dynamic management of renewable energy systems (RES) by providing options for consumers to return surplus energy to the network and act as "prosumers" [4]. Although several years of research efforts may be required to formulate a comprehensive framework, ongoing research efforts are trying to provide an initial understanding of SG communication technology, its various elements, and possible applications. Several options regarding the mode of communication are available, including both wireless and wired technologies such as optical fibers and power lines. Among them, power lines provide an economical option because of their omnipresence around the world [5]. Power line communication (PLC) technology has evolved over the years from a low frequency to a high-frequency communication capable of handling large data at high speeds.
Electric power line communication exists in many different types, for example, broad-band-based PLC, ultra-narrowband PLC, and narrowband PLC. Each of these communication techniques has its unique frequency of operation, available data rate, and particular application. Broadband-based PLC uses high-speed data rates, and it consists of various applications related to the internet, for example, voice over the internet. Home-based PLC networks are also an example of broadband PLC running at 200 MHz, which is much higher than the 1.8 MHz frequency range. The NB-PLC line uses lower data rates, thus supporting lower data rate applications for example sensing utility applications, remote control, and AMR. The frequency of operations for NB-PLC is below 500 kHz. Smart meters use the NB-PLC to transmit the data of consumption of users’ energy in real-time. In Europe, the NB-PLC uses CENELEC bands that range between 3 kHz and 148.5 kHz. In the United States, the approved band of NB-PLC is in the range of 10 to 490 kHz, whereas the Japanese Association of Radio Industries and Businesses recommends a 10 to 450 kHz band, whereas in China, NB-PLC use a frequency band of 3 to 500 kHz [2,5]. This paper utilizes NB-PLC for the control of various electrical appliances connected with the power grid to provide DSM services. Among such appliances, air conditioners consume a large amount of power in the summer months, which is a point of concern. This research work incorporates NB-PLC control on typical and variable frequency air conditioners and converts them from conventional air conditioners to SACs, which consume power in an optimized way. Moreover, the rapid growth of urbanization has also given rise to the demand of power consumption. This paper proposes a DSM control technique for SACs installed at residential, commercial, and industrial consumer ends to shave the peak power consumption profile. The NB-PLC control command is implemented from a master control room (MCR) towards SACs, and vice versa, by using smart energy profile 1.0 (SEP 1.0) communication protocol [6]. Control commands have the ability to change the temperature of thermostat between 1 C and 2 C in a way that does not cause discomfort but can play an effective role in shaving the peaks.

1.1. Major Contribution

The major objective of this paper is to investigate the energy consumption profiles of commercial, industrial, and residential loads. A sophisticated DSM control technique is proposed, which reduces the power consumption during the peak hours. The characteristics of NB-PLC when it communicates over low voltage (LV) channels, MV channels, and transformer bridge are examined in depth for various types of loads. The influence of rise in temperature on power consumption profile of all three types of consumers is studied and optimally controlled with the DSM control technique, which reduces power consumption, especially during peak hours. A comprehensive comparison of NB-PLC performance on residential, commercial, and industrial sites will help to analyze the feasibility and characteristics of their corresponding power line channels for DSM services. The DSM control technique presented in this paper has been previously investigated in South Asian countries, such as in Pakistan, as per the authors’ knowledge. This research work will facilitate the designers and researchers to evaluate the performance reduction due to mutual interference of coexisting NB-PLC channels. The SNR profiles will help to design the procedures that will improve forward error correction (FEC) when NB-PLC signals pass through transformer bridge and power line channels according to noise types in South Asian countries like Pakistan. The present example shows the improved performance of G3-PLC as compared to PRIME in the presence of transformer bridge and NB-PLC channel noises. However, power spectral density and dynamics of NB-PLC noise in South Asian countries are different from Europe, for which there is a need to improve the FEC codes. Moreover, SNR profiles will help designers to estimate the processing power required for additional codes.

1.2. Paper Structure

This paper consists of six sections. Section 2 provides a comprehensive literature review while Section 3 discusses the modeling of power consumption profile of various types of consumers. The influence of temperature sensitivity, which includes change in temperature and humidity, is derived by presenting the mathematical models. Section 4 elaborates the DSM system under evaluation by carrying out extensive field measurements on residential, commercial, and industrial consumers. Attributes of consumers are discussed and NB-PLC is applied to provide DSM services. The mechanism of multicarrier modulation of NB-PLC systems is also explained. Section 5 explains the field tests conducted on different power lines, transformers, and hybrid system to observe the performance of NB-PLC control. In the second part of Section 5, field tests and a discussion on corresponding results are performed on typical and variable frequency air conditioners by converting them to SACs with the help of DSM control technique. Later, the implementation of the DSM program is discussed, followed by the conclusion in Section 6.

2. Related Work

2.1. Demand Side Management Techniques

DSM can significantly decrease the peak electricity demand by controlling the operations of end user appliances, such as lighting, heating, and laundry devices, etc. [1,7]. It makes the grid more sustainable by decreasing the peak to average ratio (PAR) and increasing the base load. DMS techniques can be categorized as direct and indirect load control methodologies [8]. In the direct load control method, the consumers have direct control over their selected loads and are also offered incentives by the utility companies. These reduced loads regulate frequency and minimize PAR, and OPEX in the grids. On the other hand, the indirect load control method employs advanced metering infrastructure to contribute to the optimization process. The information regarding dynamic energy pricing and load prediction is shared by the grid, hence providing distributed decision markers. The consumers also have access to this information and the option to optimize their benefits.
An efficient DLC scheme for PAR reduction can be executed in a number of ways; the scheduling of direct load control is usually carried out to minimize operation costs and to reduce system peak load [9,10]. Several optimization techniques can be employed to schedule the loads with targets of reducing costs. In order to limit data sharing by consumers, a multilayered iterative genetic algorithm (GA) method is used to obtain sub-optimal scheduling. A comprehensive review of central DSM is undertaken to examine frequency regulation in SG, where spinning reserve and area generation control are absent. Various solutions to this problem have been proposed, e.g., the introduction of highly self-beneficial strategies [11,12] and cooperative methods [13,14] based on gametheoretic framework where consumers can improve load scheduling by sharing their load profile with other agents and a non-cooperative game theoretic approach for energy storage scheduling among a community of prosumers results in good PAR reductions [15]. A GA-based method understands consumer behavior to find a way to increase retailer profit. In [16,17], ways to lower electricity charges are explored, i.e., the charging and discharging of hybrid electric vehicles. In [15], consumers are given the autonomy to dynamically adjust their power consumption with the control centers and other consumers whereas in [18], the consumers can only interact with the control center. The energy pricing information based on customers’ consumption needs and their share of energy requirements is provided by the control center.

2.2. PLC Channel Modeling Techniques

Physical impacts on power line networks such as cable losses and multipath signal propagation are modeled analytically as complex transfer functions in [19]. A small set of parameters are used to formulate a multipath model that can derive the complex frequency response of the PLC channel. The approach is convenient for scenarios where exact network parameters are unknown. This model assumes the propagating signal as an aggregate of all possible forward components in different paths to the destination [20,21,22,23,24]. Transfer functions are evaluated based on the measured values. However, the quality of received signals deteriorate due to reflection and can be expressed as [25]:
H ( f ) = i = 1 N g i A ( f , d i ) e j 2 π f τ i
Here g i represents the reflection attenuation while A ( f , d i ) denotes the line attenuation. N and e j 2 π f τ i represents the number of considered delays due to distance. Impedance mismatch occurrence in the branch lines may result in the traveling waves and their reflections. The traveling wave reflection is given as,
w ( z ) = W 1 e γ z + W 2 e γ z
where W 1 and W 2 represent the forward and reflected waves. The reflection coefficient is defined as
r = W 2 e γ z W 1 e γ z = w k Z 0 I k 2 e γ ( l l ) w k + Z 0 I k 2 e γ ( l l ) = Z k Z 0 Z k + Z 0
where Z k and Z 0 are the load and characteristic impedance, respectively. The wave transmitted part is shown by Equation (4) [26].
T = 1 R
e γ l i represents the attenuation of the line. As the parameters for the power line are not known, then γ can be approximated by using the following equation [26,27].
μ ( f ) = μ 0 + μ 1 f k
whereas the line attenuation can be expressed as
A ( f , l i ) = e μ ( f ) l i = e ( μ 0 + μ 1 f k ) l i
where the constants k, μ 0 , and μ 1 can be estimated by the measurement data.
In the frequency domain, delays in the waves can be represented as e 2 π f τ i . The delay τ i can be calculated by the following equation [27].
τ i = l i ϵ r c 0
where c 0 , l i , and ϵ r represent the speed of light, length of the route, and relative permittivity of the conductor, respectively.
In [25], the bottom up statistical approach is used for PLC channel modeling. Random topology technique is employed to improve the computational efficiencies for producing the transfer function. In the first step, the authors construct a network topology for European homes by employing a statistical approach. For any topology, methodology is proposed in the second step to determine the transfer function between any pair of outlets. Furthermore, a simulator was developed to observe the characteristics of the power line communication channel to evaluate the necessary parameters [26,27].

2.3. Chips and Solutions for Simulation and Field Measurements

An appropriate selection of NB-PLC technology is required to accomplish the task of bi-directional communication in the grid. The selection of a reliable communication method capable of long distance signal transmission is the primary prerequisite of a bidirectional communication setup [28,29,30,31,32]. Different commercial solutions available for the NB-PLC implementation are discussed in this section form the point of view their circuit topologies. NB-PLC modems are categorized as past generation circuits and next generation circuits. Table 1 shows the details and specifications of both generations [33,34,35,36].
Laboratory experiments and field trails are used to evaluate medium voltage power line communication (MVPLC) systems. Power transformer and line-shield configuration are used to model medium voltage PLC channel in [31]. The authors evaluated the performance of PLC by using a medium voltage line coupler and power line transreceiver (ST7540 FSK). Core shield configuration is employed in [37,38] to achieve transmission of signals over power lines. Validation of the developed MVPLC is also provided by the authors by simulating it using ST7540 FSK power-line transceiver and CCD. Similarly, many other studies are also available for measurement-based modeling and simulation [32].
Commercial developer kits and evaluation boards are also widely used. Although the standards adopted in these evaluation boards may vary, however, commonly IEEE 1901.2, G3-PLC, and PRIME standards are employed by many advanced boards.

3. Modeling of Power Consumption Profiles for Residential, Commercial, and Industrial Consumers

Understanding the behavior of the load profile of various types of electricity consumers is an important task for the sophisticated DSM-based load modeling. Atmospheric temperature is one of the key factors that exacerbate electricity consumption, especially in the summer season. In order to deal with the effect of atmospheric temperature on excessive power consumption, a comprehensive study and extensive field measurements is performed to examine the load profiles of residential, commercial and industrial consumers. The effect of temperature sensitivity (TS) is integrated with the actual power consumption of these customers to determine the hourly and daily load profiles of selected sites. The weekly, monthly, and annual data of weather including the humidity and temperature is fetched from national meteorological department, which is incorporated in the power consumption profiles of customers.

3.1. Influence of Temperature Sensitivity on Power Consumption of Consumer

The data of humidity and temperature is gathered from the meteorological department and incorporated TS influence on power consumption by using Pearson correlation [39] given as
ρ = i = 1 n ( x i x ¯ ) ( y i y ¯ ) S x S y ( n 1 )
where n is the number of samples, x ¯ and y ¯ are the mean, while S x and S y are the standard deviations of x and y, respectively.
The above correlation helps to obtain the correlation coefficient of power consumption, humidity, and temperature for commercial, industrial, and residential consumers [40]. A high value of correlation coefficient 0.88 is calculated for temperature versus power consumption, which indicates that the rise in temperature will significantly increase the power consumption. On the the rainy days, a higher level of humidity with low temperature is observed, which is also determined by the correlation coefficient having a negative value for power consumption versus humidity and temperature. Therefore, humidity in rainy weather influences less as compared to high temperature in dry weather. The power consumption of all three classes of consumers as a function of humidity and temperature is calculated by multiple regression analysis by
P ( T n , H n ) = 1.2 1.48 T n 2.53 H n + 0.89 T n 2 + 1.7 T n H n + 1.3 H n
where T n is the normalized temperature, which is a ratio of actual temperature T and mean temperature T m e a n . Similarly, H n is normalized humidity, which is a ratio of actual humidity H and mean humidity H m e a n . The influence of temperature on power consumption profile of consumers is given as
P n = α + β T n + γ T n 2
where P n is the normalized power consumption of consumers, which is the ratio of actual power P and mean power P m e a n . The coefficients of regression model are denoted by α , β , and γ . The discussion on the influence of temperature and humidity on power consumption plots is presented in the results and discussion section of paper. The upper and lower bounds of 96% confidence intervals are given by
P = P n ± t α / 2 s P n
where the standard deviation of P n is denoted by s P n and t α / 2 represent the confidence interval. High fitness of regression model is obtained for temperature and power consumption, with a deterministic coefficient greater than 0.81, thus the t and F tests of α , β , and γ are verified.
The first order derivative for power consumption and temperature effect is applied to determine the TS of power consumption by
TS = P n T n = β + 2 γ T n
The power consumption with 1 degree centigrade rise in temperature is given as
Δ P n = TS × P m e a n × Δ T n T m e a n
where Δ T n is the change in normalized temperature.

3.2. Cumulative Effect of Residential, Commercial, and Industrial Consumers due to Temperature Sensitivity

The temperature rise has a different effect on different classes of consumers, each of which has different load profiles and power consumption criteria on various time instants of 24 h, week, month, and year. Based on power consumption profiles and TS analysis, the power consumption of all three consumer classes are solved by integrating them, given by
Δ P = ( T S R × P R + TS C × P C + TS I × P I ) × Δ T T m e a n
where P R , P C , and P I represent the base power demands of residential, commercial, and industrial consumers, respectively, whereas Δ T is the change in actual temperature.

4. Demand Side Management System under Evaluation

For field measurements, three different sites are selected in Lahore, Pakistan, for comprehensive investigation of the NB-PLC-based DSM control technique. The feasibility analysis of the NB-PLC control signal for DSM services is performed on all the sites while considering all possible types of outdoor power line channels. An important aspect of these field measurements is to include the NB-PLC characteristics during the signal transmission through the LV/MV channel and transformer bridge. Figure 1 shows the measurement setup including the NB-PLC system architecture for the DSM control. The sites under evaluation include various types of electricity consumers, which provides the opportunity to access the type of power line channels, from a simple to a hostile environment for NB-PLC channels including industrial, commercial and industrial loads.
In the following subsection, the key properties for the chosen sites for LV/MV NB-PLC channels are analyzed in detail. Every LV site has an energy meter installed, so that the primary control room receives data from LV sites and stores it. This data is also sent to secondary station MCR, which is present at the primary substation. To make this process efficient, MV couplers enabled with a voltage detection system (VDS) are used. The main reason for using VDS for this purpose is because it decreases voltage fluctuation by employing two series capacitance. Voltage detection system is a very popular method for finding the main voltage by considering the IEC 61234-5 standard [32,33].

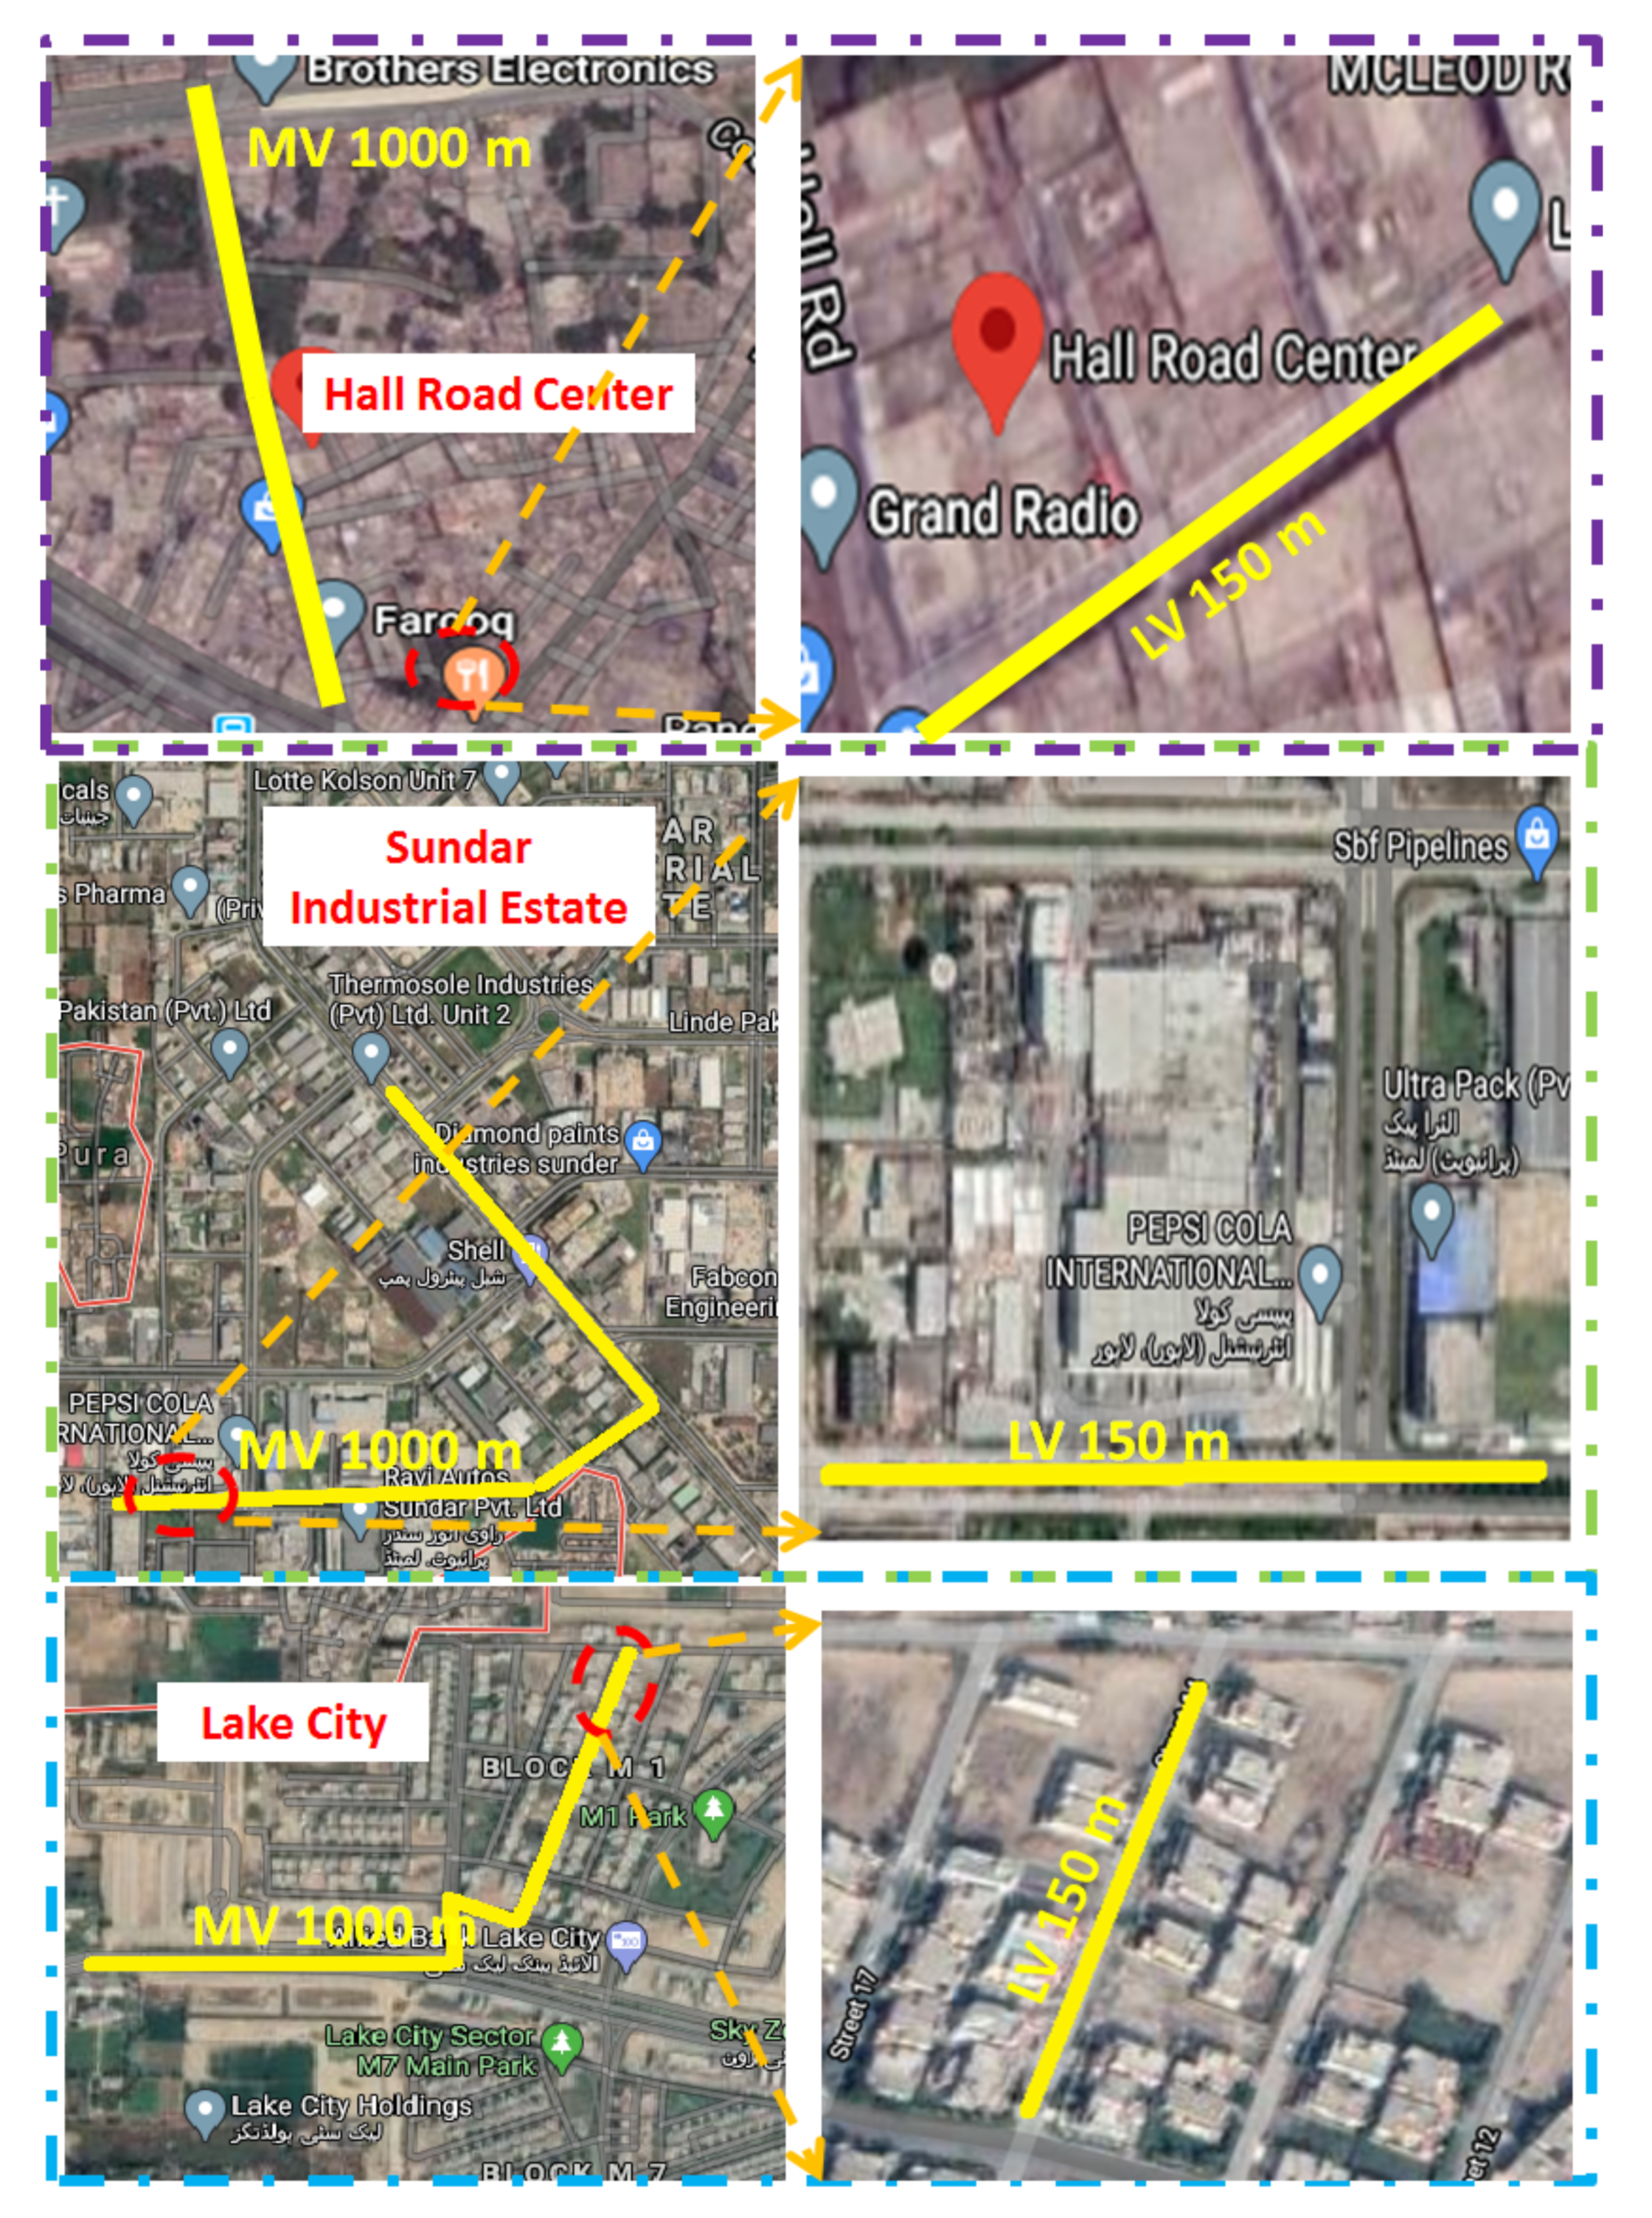
4.1. Attributes of Evaluated Sites

Figure 2 shows the sites chosen for the technical assessment of NB-PLC control signal characteristics and can be classified into residential, commercial, and industrial.

4.1.1. Residential Consumers

Housing societies form the main component for most residential consumers as most of the families are residing there. Lake city housing colony is chosen as a sample for residential consumers. This housing society is newly constructed with recently installed LV/MV power lines. Most of the users in this residential setup use air conditioners, uninterrupted power supplies (UPS), washing machines, lighting loads, refrigerators, switched-mode power supply (SMPS), and motors and resistive load. A small proportion of the consumers in this housing society are using RES-like photovoltaic (PV) sources for their electric demands. This housing society also has one supermarket, which has an electric load for many electrical appliances. The NB-PLC channel is being used to power this supermarket.

4.1.2. Commercial Consumers

For commercial consumers, we have considered the Hall road center, which is a very populated and popular shopping center, especially for electrical appliances. In this shopping center, various small shops are using a large number of inverters, rectifiers, UPS, arcing units, and SMPS. Therefore, it has an NB-PLC line that is full of many types of electrical noises. Moreover, this power delivery structure is quite old i.e., almost 45 years old, with only some minor improvements during this time.

4.1.3. Industrial Consumers

For industrial consumers, we have considered Sundar Industrial Estate as an example. It contains an industrial zone that has many small and large industries. This industrial estate largely consists of industries that produce air conditioners, televisions, motorbikes, and many other home appliances, etc. The induction motor contributes to being a major power load for these factories. Most of the industrial units in Sundar Industrial Estate are producing their own electric power by using DG and RES. A major portion of the load in these industrial units includes induction motors, arcing units, air conditioning, and power electronic-based devices. Therefore, for this type of power delivery, the NB-PLC line will have many types of electrical noises.

4.2. NB-PLC Technique for Demand Side Management

The orthogonal frequency division multiplexing (OFDM) technique is used to improve the proposed NB-PLC-based DSM system [41,42]. OFDM has the ability to provide increased an data rate and enhanced immunity against EMI. The process of OFDM will transform NB-PLC line frequency selection into a flat fading parallel channel using a narrowband. The relationship between frequency domain and time domain for an OFDM system can be seen. Overall, the OFDM systems’s efficiency can be enhanced using signal collision avoidance concept. This process enables the faintest signal in one frequency domain to be the sharpest in another sub-carrier frequency domain. The OFDM spectrum has multiple subcarriers that are orthogonal and can use the methodologies of shift keying of frequency, phase, or amplitude. Each subcarrier can handle a specific amount of data rate, error correction code, and error detection code [39,43]. The receiver filters the OFDM signal to minimize the noise and the original signal is retrieved after demodulation. The modulation of subcarriers is performed by M-phase shift keying (M-PSK) or quadrature amplitude modulation (QAM). The expression for M-PSK is given as
S i t = 2 E s T s cos 2 π f c + 2 π i 1 M 0 t T s i = 1 , 2 , , M
here T S , E S and f c represent guard time, energy, and carrier frequency, respectively. The phase angle of carrier frequencies can be obtained using the following relation.
θ i = 2 i 1 π M i = 1 , 2 , , M .
In QAM, the nth symbol is given by
S n t = 2 E T a n cos 2 π f c t 2 E T b n sin 2 π f c t 0 t T n = 0 , ± 1 , ± 2 ,
where minimum energy of QAM is denoted by E whereas a n and b n represent the nth symbol energy given by
a n , b n = ± a , ± 3 a , , ± log 2 M 1 a .
The electric power lines can be very hostile for NB-PLC systems. Many issues like multipath effect, dispersion, and time and frequency selections with multi-reflections can have an adverse effect on the performance of the NB-PLC communication system [44,45,46]. Especially time and frequency selection and dispersion have an enormous impact on NB-PLC systems, because these are very common issues and are present in every wireless communication system. Time dispersion can impact the NB-PLC system by inducing more delays and phase-shifting duplications. Another important factor affecting the performance of NB-PLC is noise. Noise can be either of two types: background noise and impulsive noise. Both types of noise have a significant impact on the NB-PLC system’s efficiency. Background noise is further categorized into colored and narrowband noise, while the impulsive noise can be divided into mainly two types: periodic (synchronous or asynchronous) and aperiodic. The NB-PLC channels are useless for control signals, especially if the signal power is less than the noise power. Signal to noise ratio (SNR) is used to determine the quality of NB-PLC control signals using the following relation [47].
SNR = 10 log P s P n
where P S represents the power of the signal and P N represents the power of noise.
By considering noise with Gaussian distribution with 0 mean value, the bit error rate (BER) of binary signal can be given as
Q 2 A σ = 2 A 1 2 π σ 2 2 e y 2 2 σ 2 d y
where A is the amplitude and σ denotes the standard deviation. The square root of SNR is represented by 2 A σ therefore bit error rate (BER) of transmitted signal is a function of SNR.
When M bits model is used with the Gaussian distribution noise, then BER is given by
BER = 2 M 1 M log 2 M Q A 2 σ = 2 M 1 M log 2 M Q 3 M 2 1 · 1 r τ eq · SNR 2
where r denotes the data rate and T e q represent the average energy of the transmitted bits given by
τ eq = 12 M 2 1 A 2 E M .

4.3. Communication Module for NB-PLC

The communication module used for field measurements is the Texas Instruments (TI) transceiver with power line modem developer kit (TMDSPLCKIT-V3 C2000), whose specifications are shown in Figure 1 [18]. This transceiver is a state of art communication kit that has an AFE daughter card incorporated in the front end analog PLC (AFE031). This tool kit can use various communication applications such as OFDM, IEEE-1901.2, PRIME, etc. All of these applications can be enabled through SFSK and controlled through PLC software suit. The OFDM communication system effectively utilizes the bandwidth. It also incorporates flexible coding schemes and efficient power management. In fact, the OFDM is a tailormade system for a harsh communication environment. This T1 transceiver uses a frequency band between 3 and 500 kHz with 46 kbps data rate. The transceiver uses the state of art Robust (ROBO) mode and modulation schemes. This makes it work easily for the repetition code with BPSK. The SNR and signal strength at the receiver are key parameters for analyzing the chosen sites. Figure 3 shows the graphical user interface (GUI) of the tool kit. Here we can easily see various metrics associated with network performance including sub-band SNR, bit error rate, and signal strength indicator.

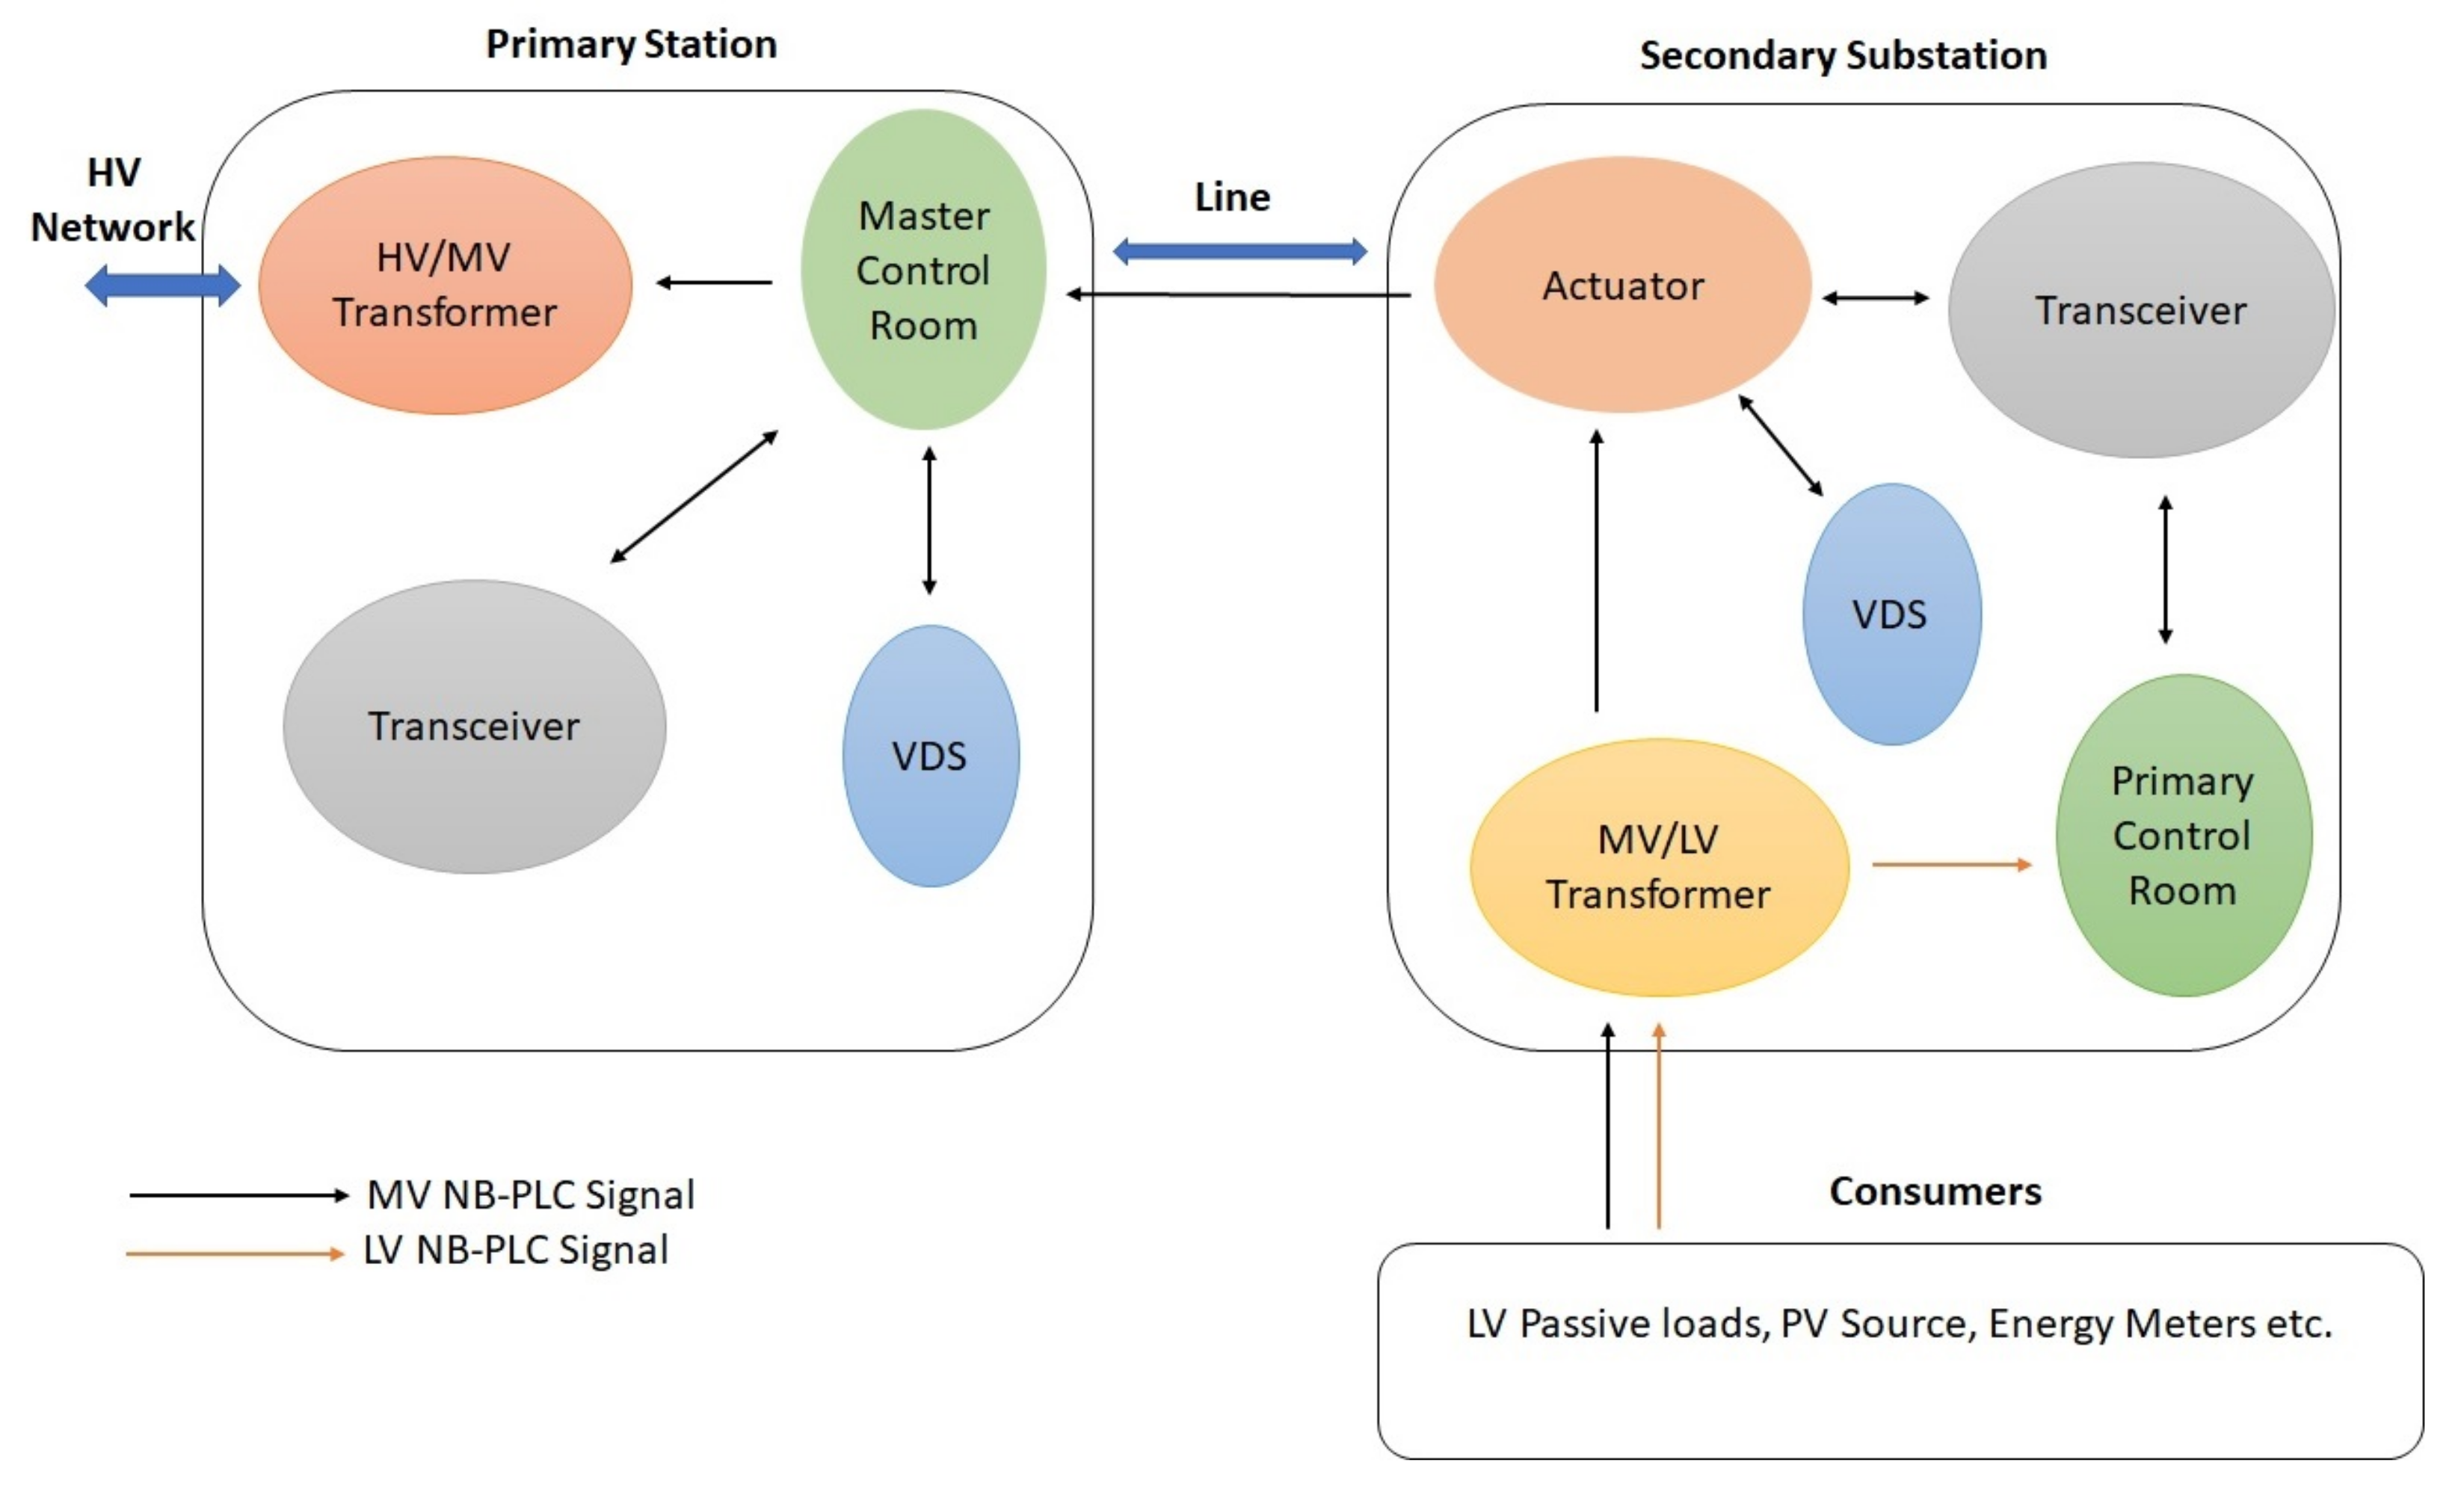
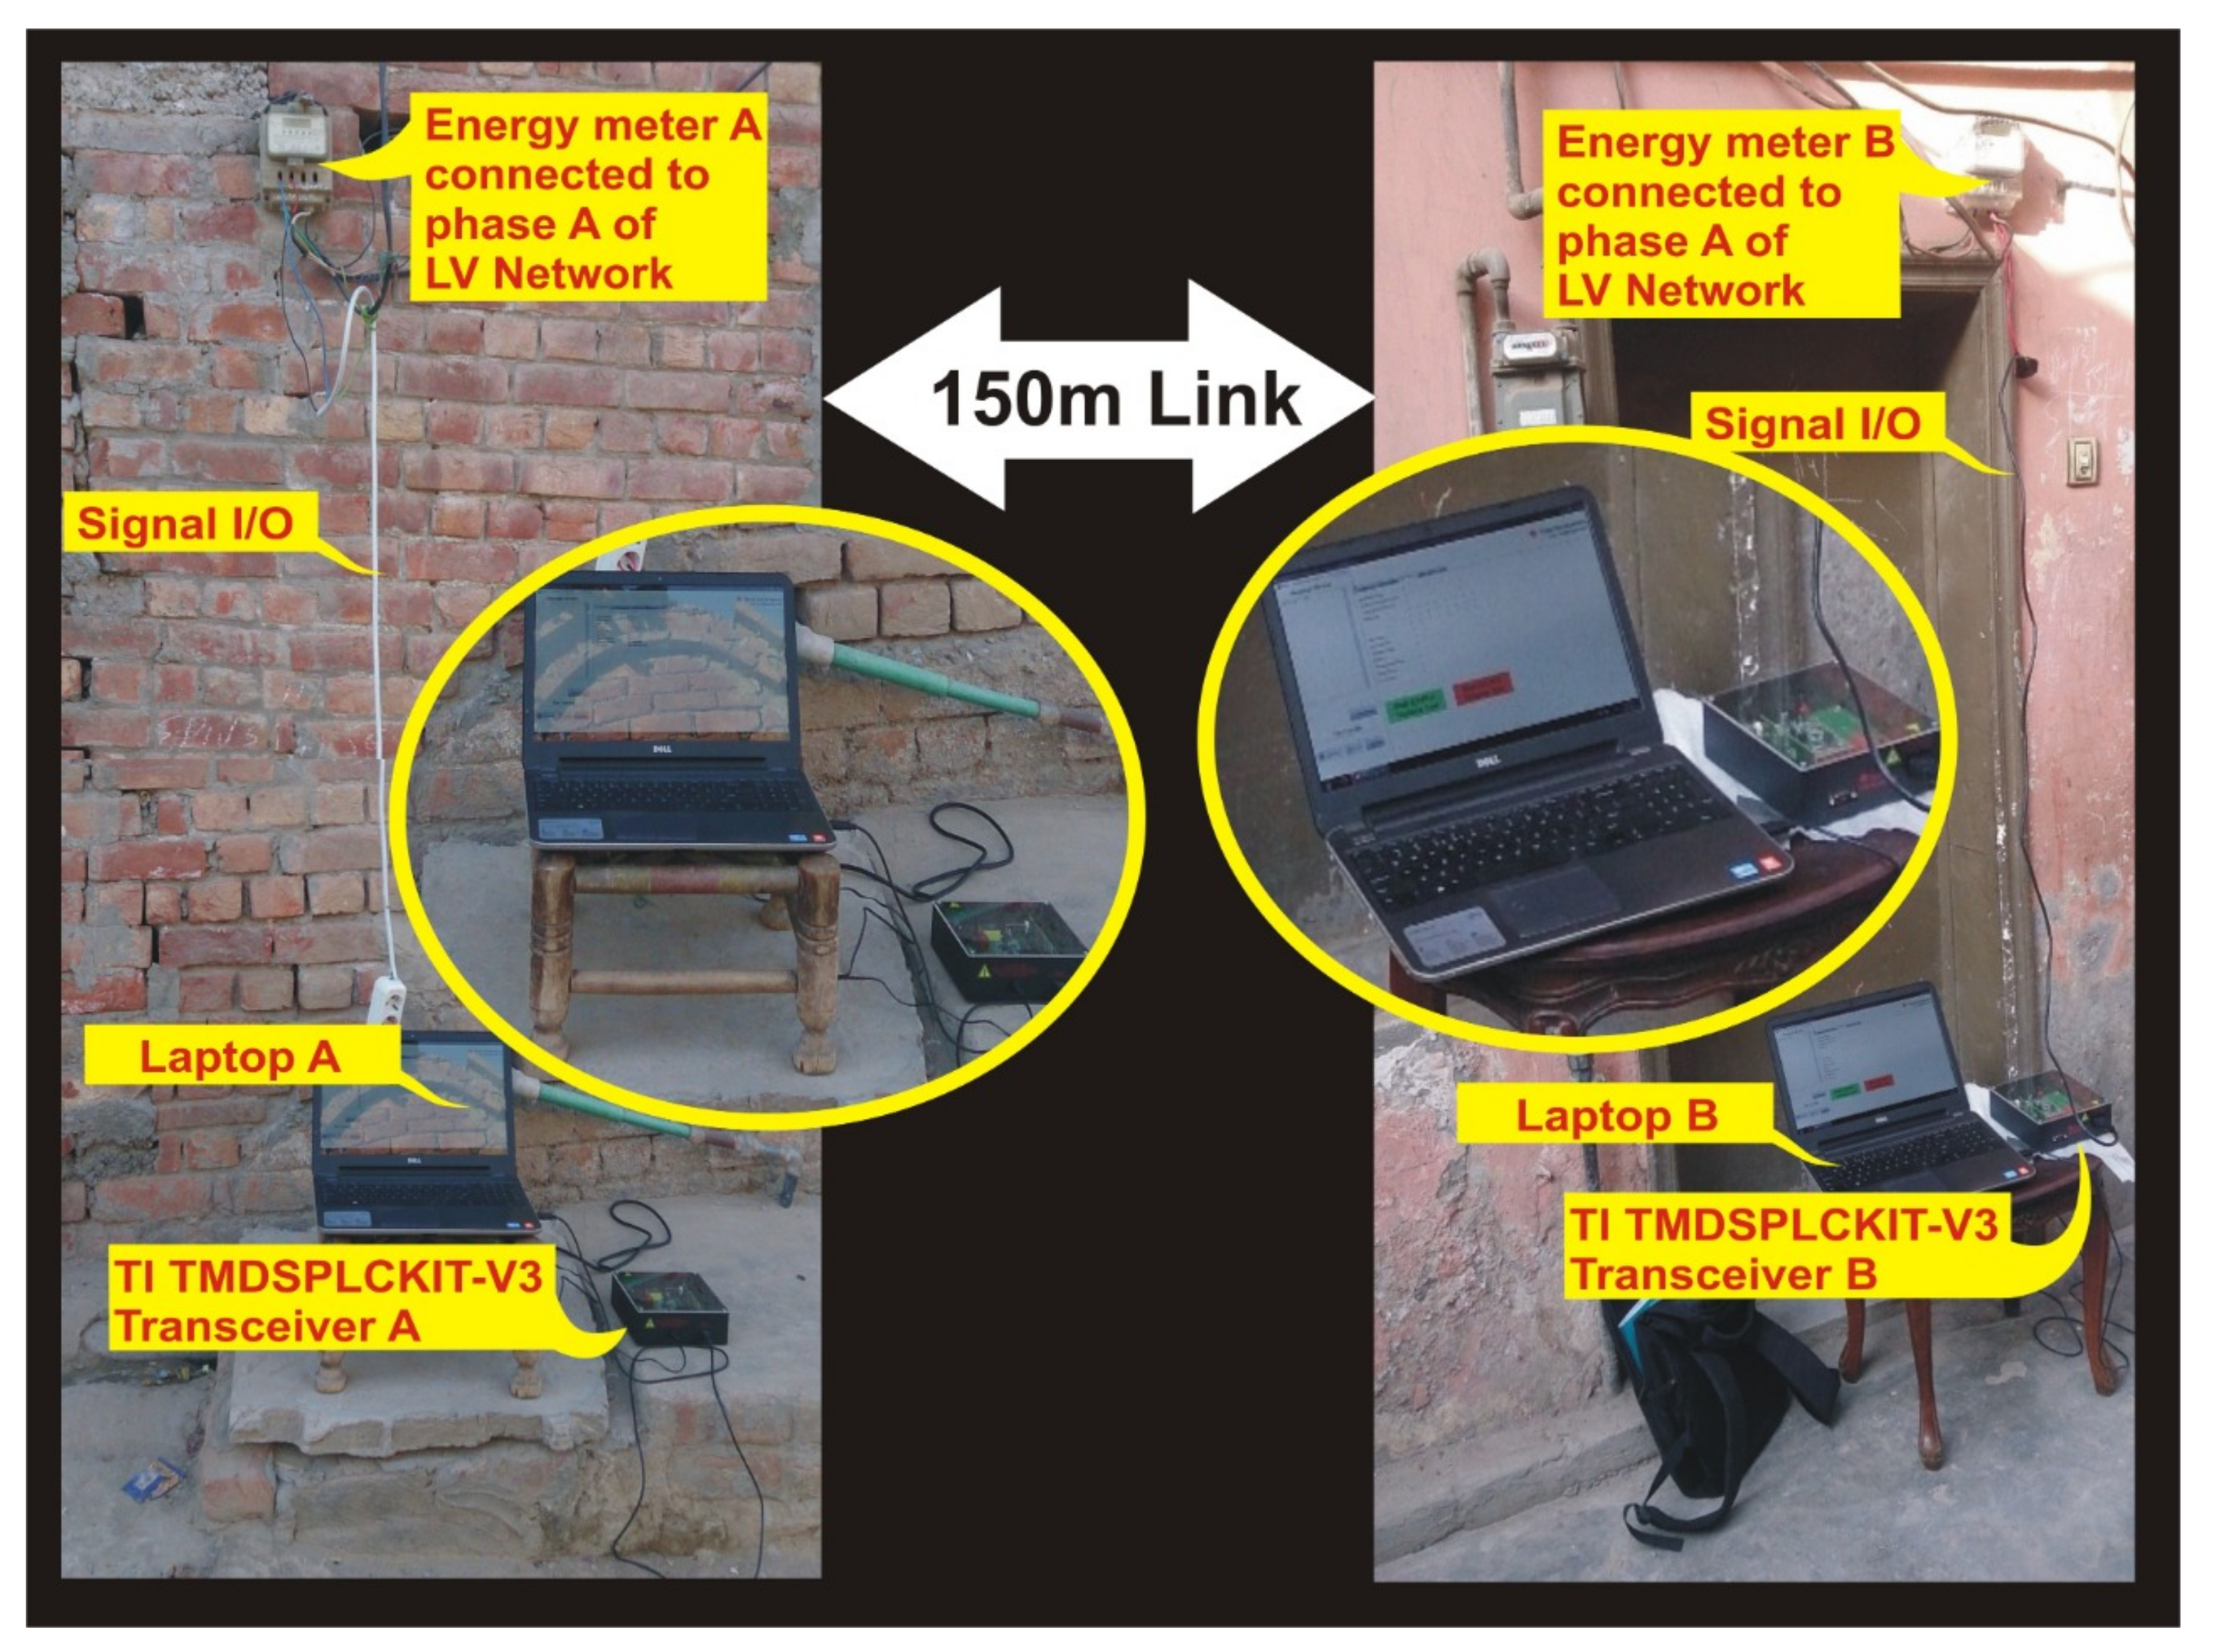
4.4. Test Setup for Demand Side Management Control Technique for Smart Air Conditioners

The test setup for DSM control technique has five main components, as shown in Figure 4, whose functionalities are discussed as follows.

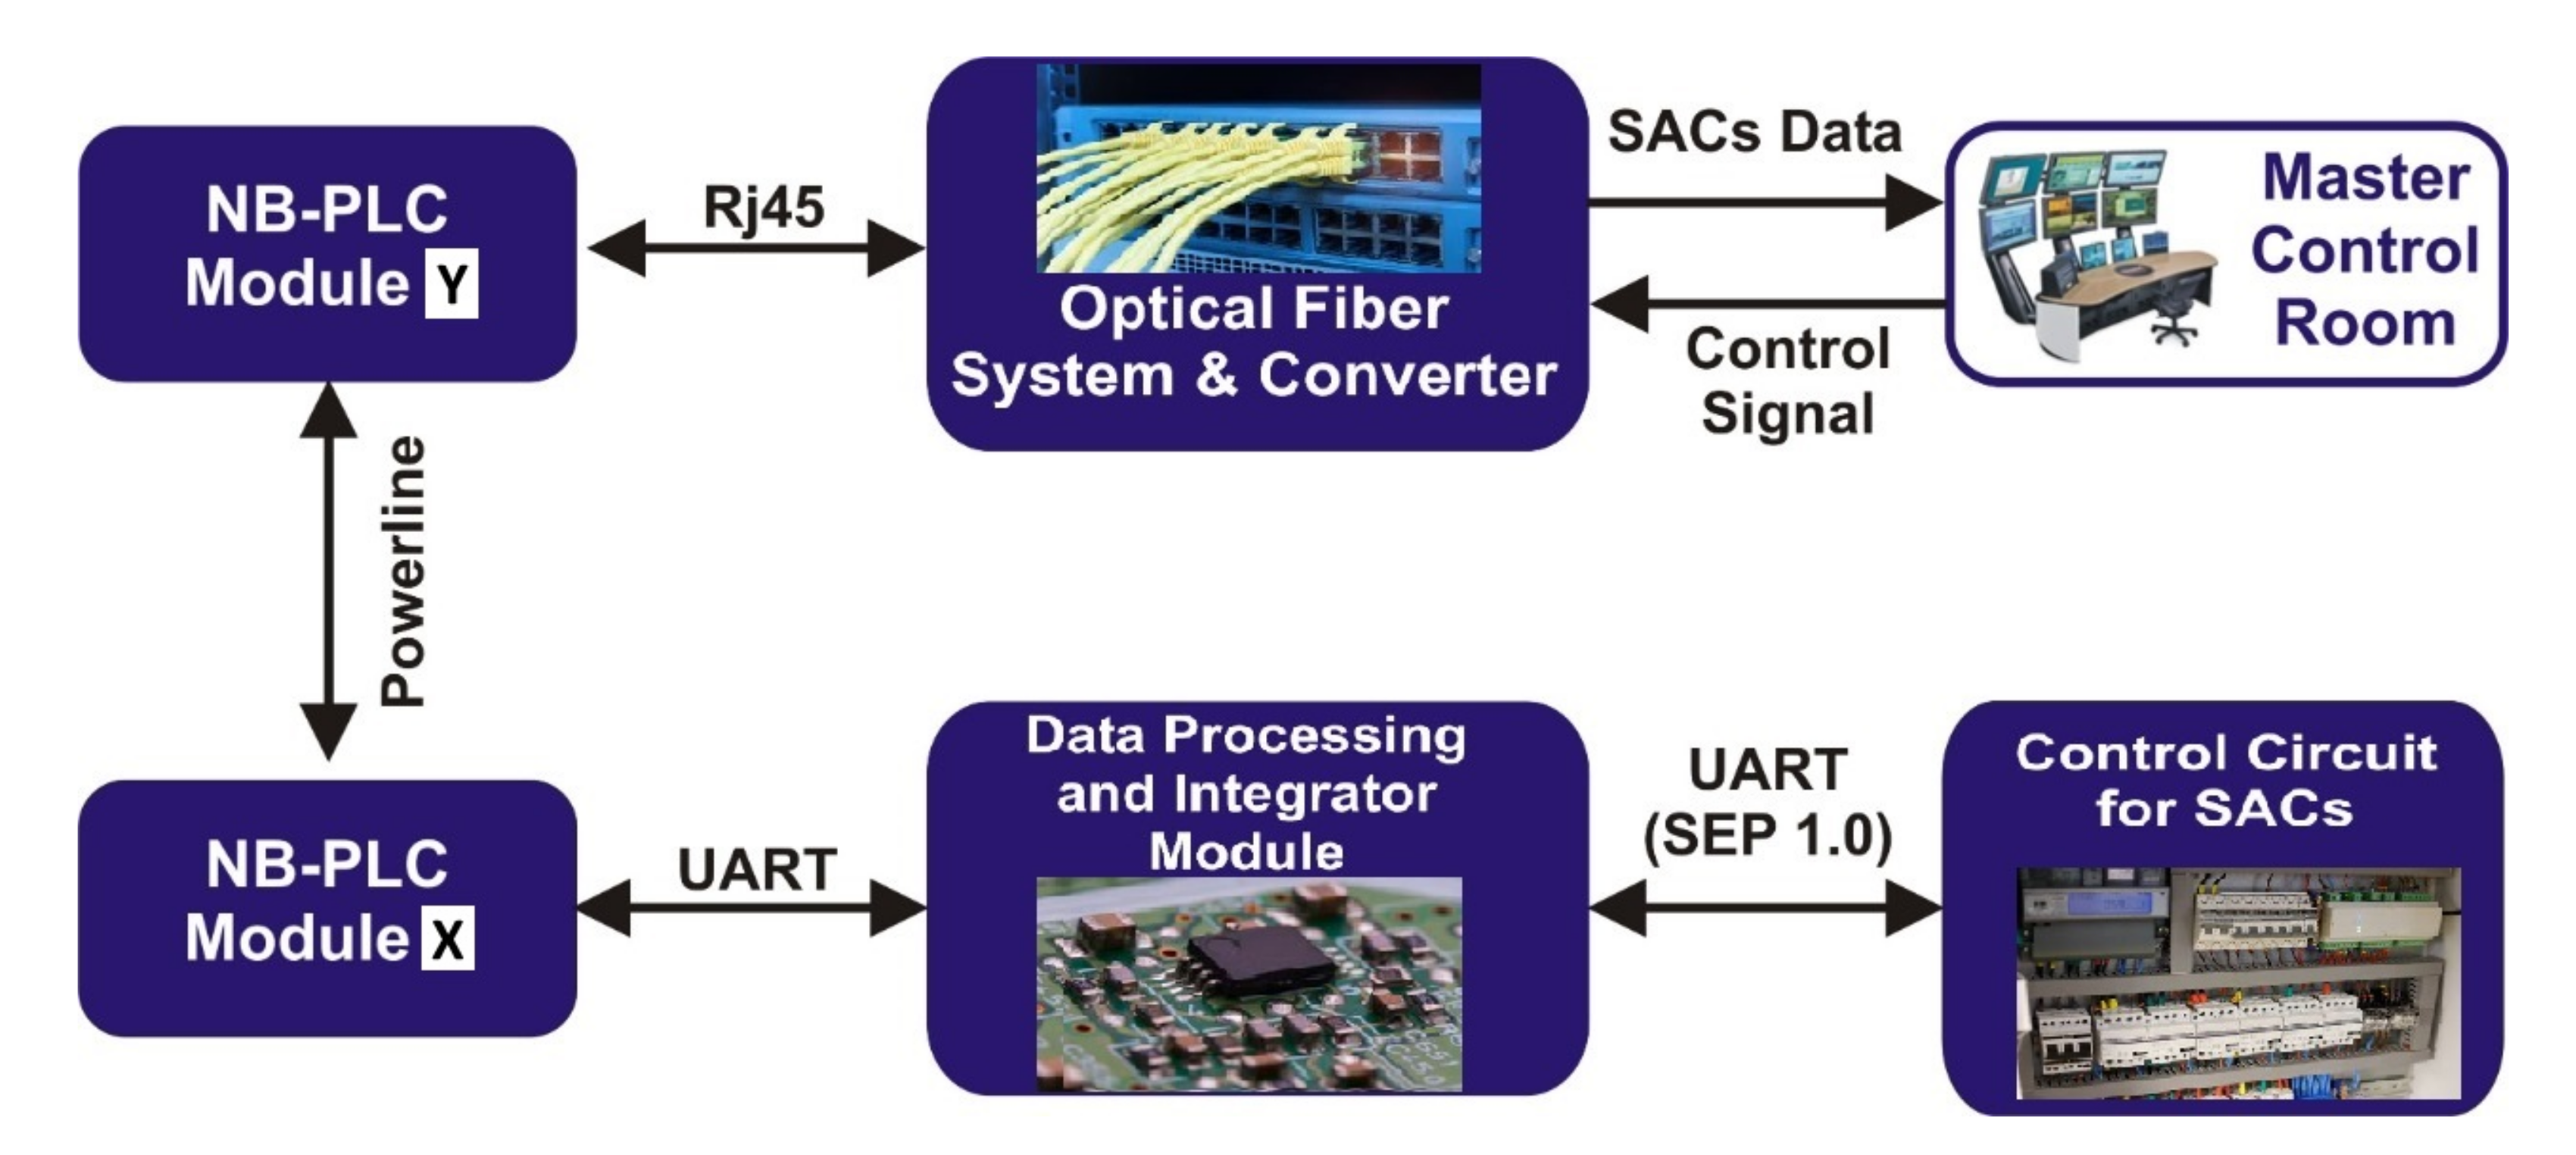
4.4.1. Master Control Room

The MCR is responsible for taking decisions according to the set rules and protocols. It has the ability to send the control commands to the primary control room or to any SAC connected to the LV NB-PLC channel, as shown in Figure 1. The front end of MCR incorporates the optical fiber, and thus sends the control signal to optical fiber system.

4.4.2. Optical Fiber System and Converter

The optical fiber system receives the control signal from MCR and forwards it to the NB-PLC module Y after the conversion of signal format from optical fiber to NB-PLC with the help of the Rj45 connector.

4.4.3. NB-PLC Module

The NB-PLC module Y couple the NB-PLC control signal through a coupler to the LV or MV power line, which is received by the NB-PLC module X, which further sends it to the data processing and integrator module.

4.4.4. Data Processing and Integrator Module

The data processing and integrator module converts the format of the signal according to format SEP 1.0 with the help of UART and directs it towards the destination. On the other hand, this module initializes the NB-PLC module automatically.

4.4.5. Control Circuit for SACs

The control circuit of SACs execute the command sent from MCR to adjust the thermostat. It also stores the daily, weekly, monthly, and annual power consumption profile. Likewise, the reverse process can be used for finding daily, monthly or yearly power consumption through SACs to MCR.

5. Field Tests and Discussion on Results

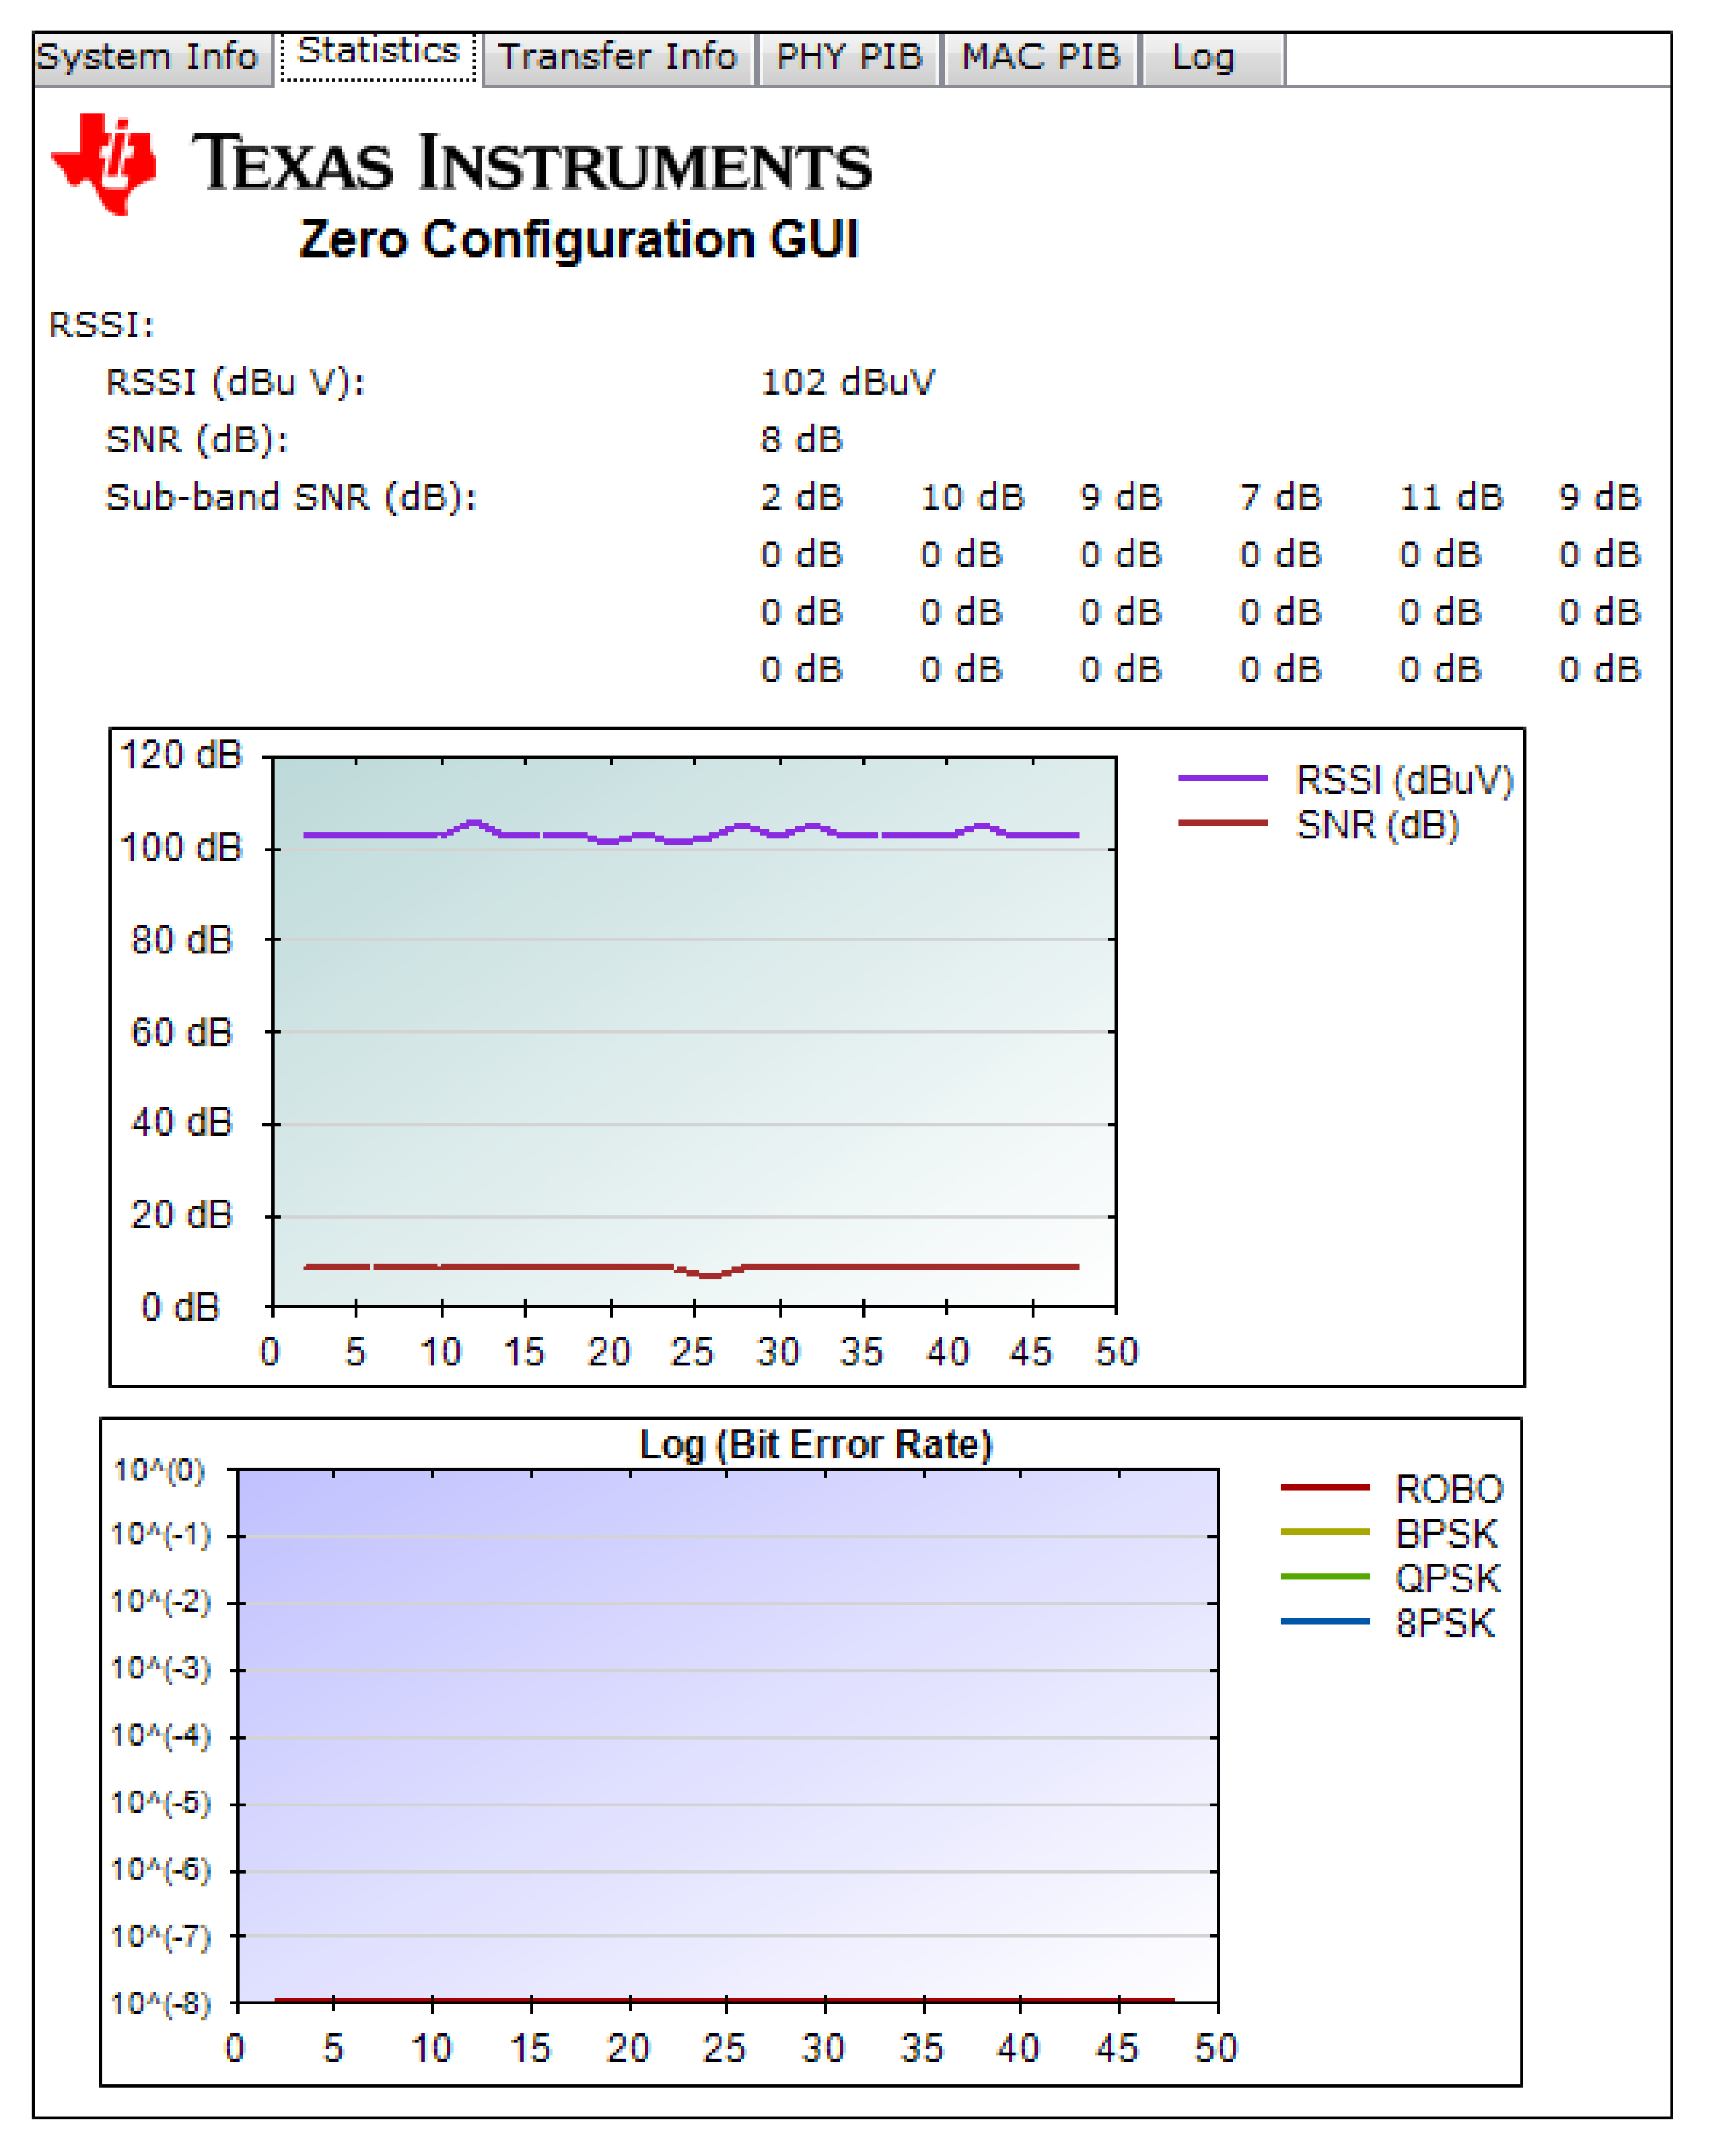
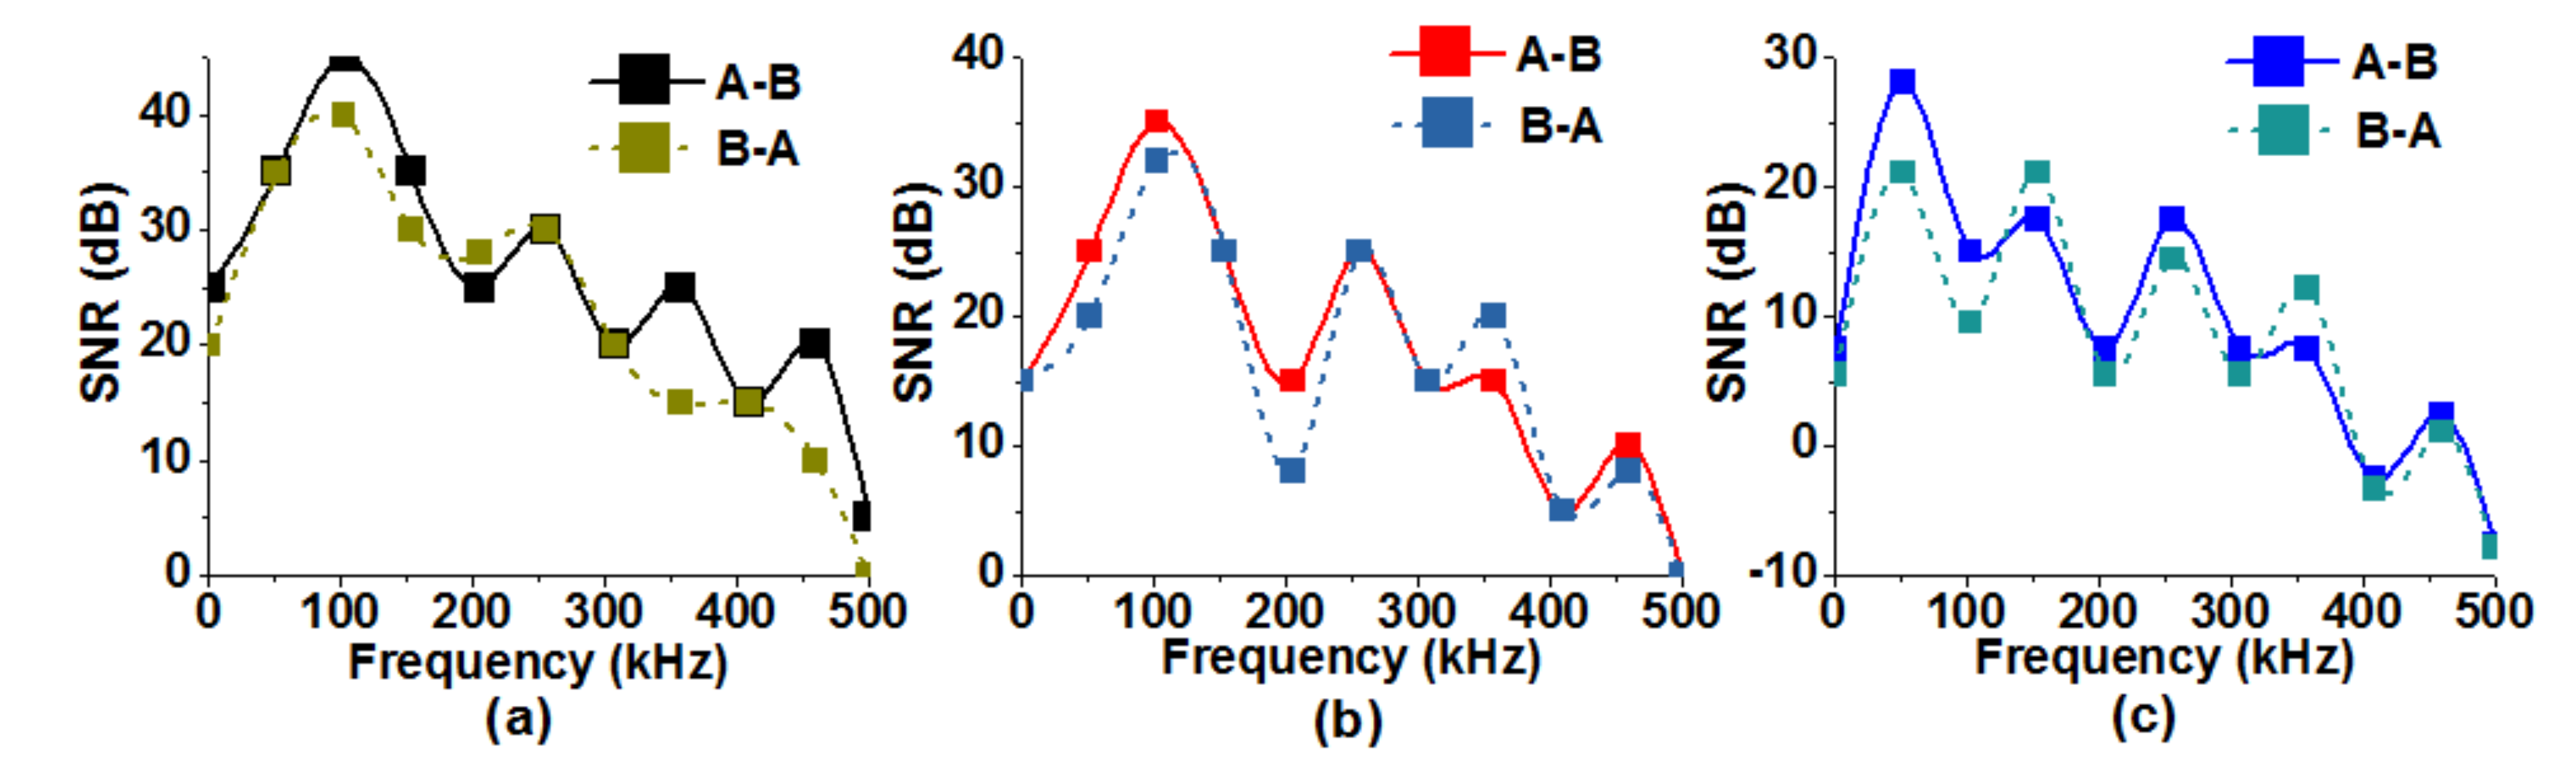
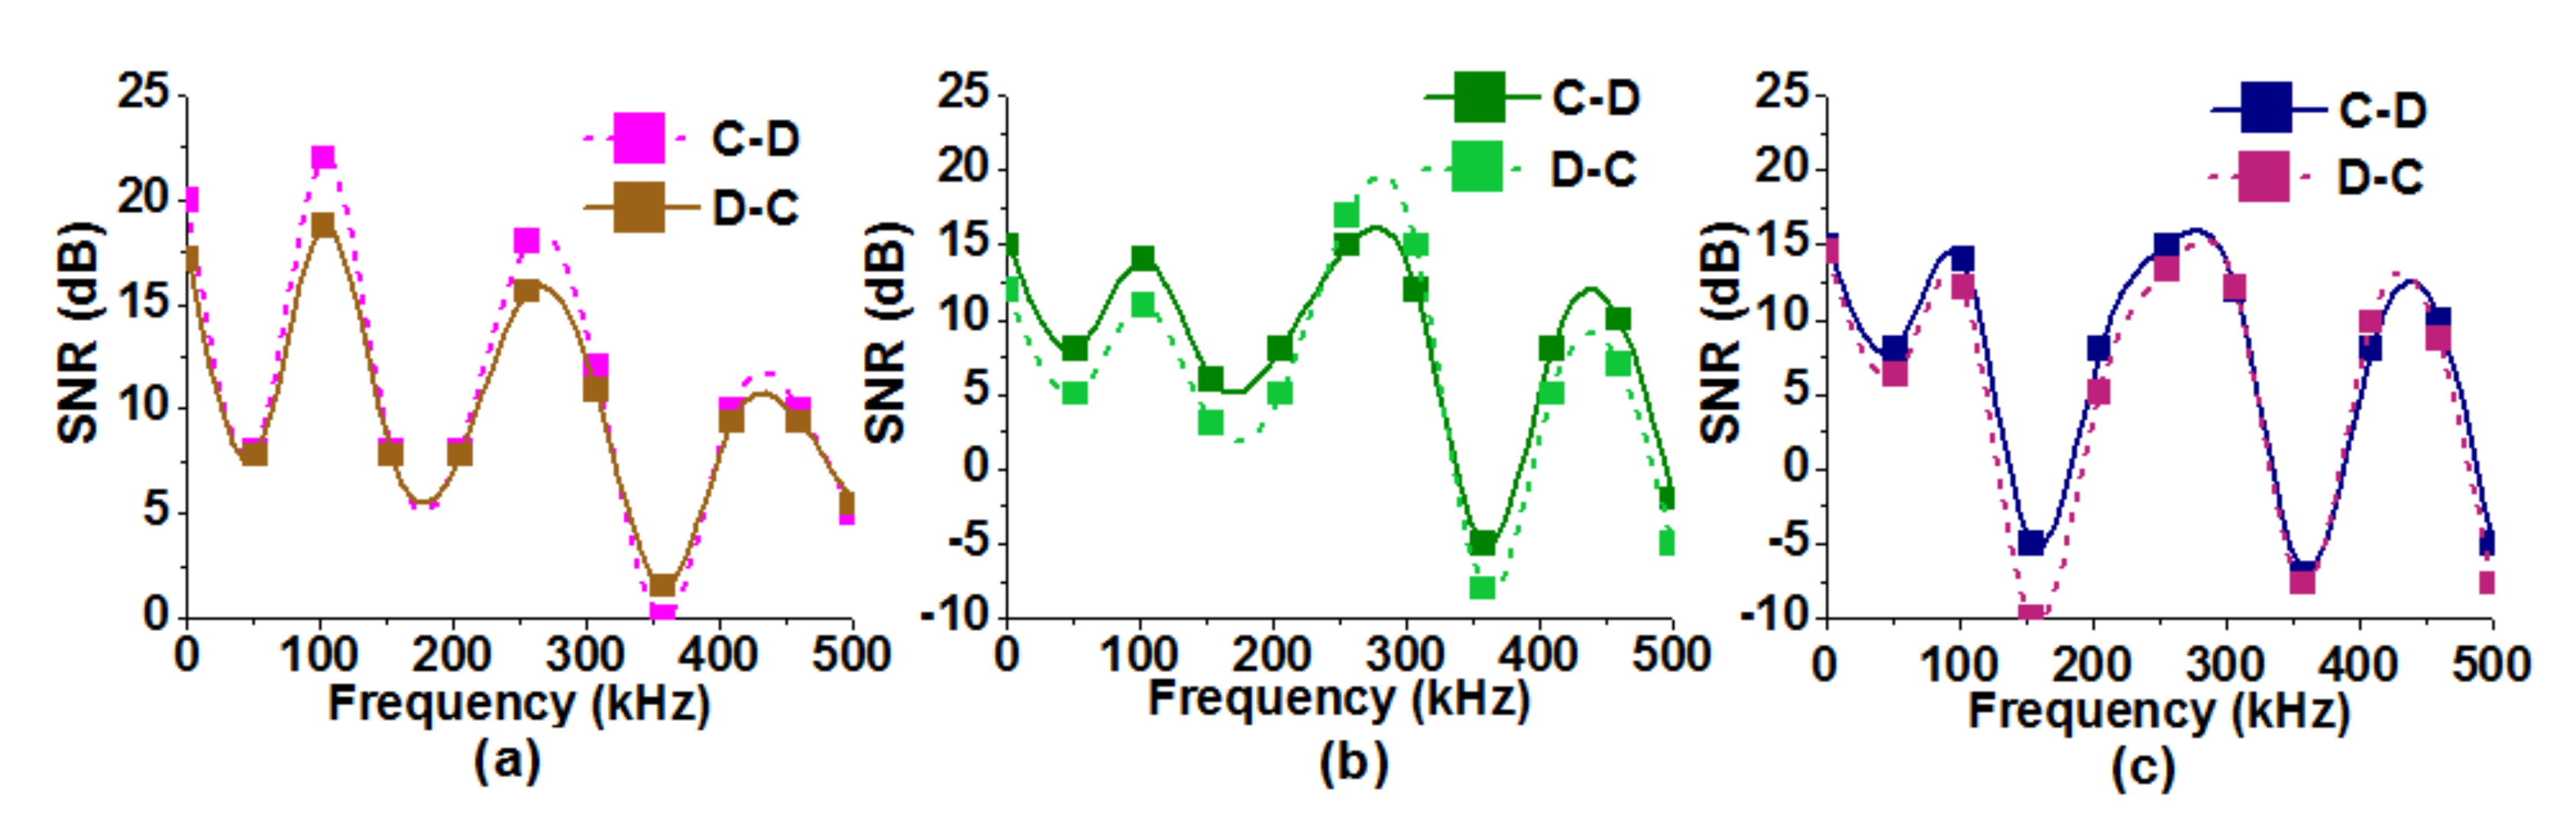
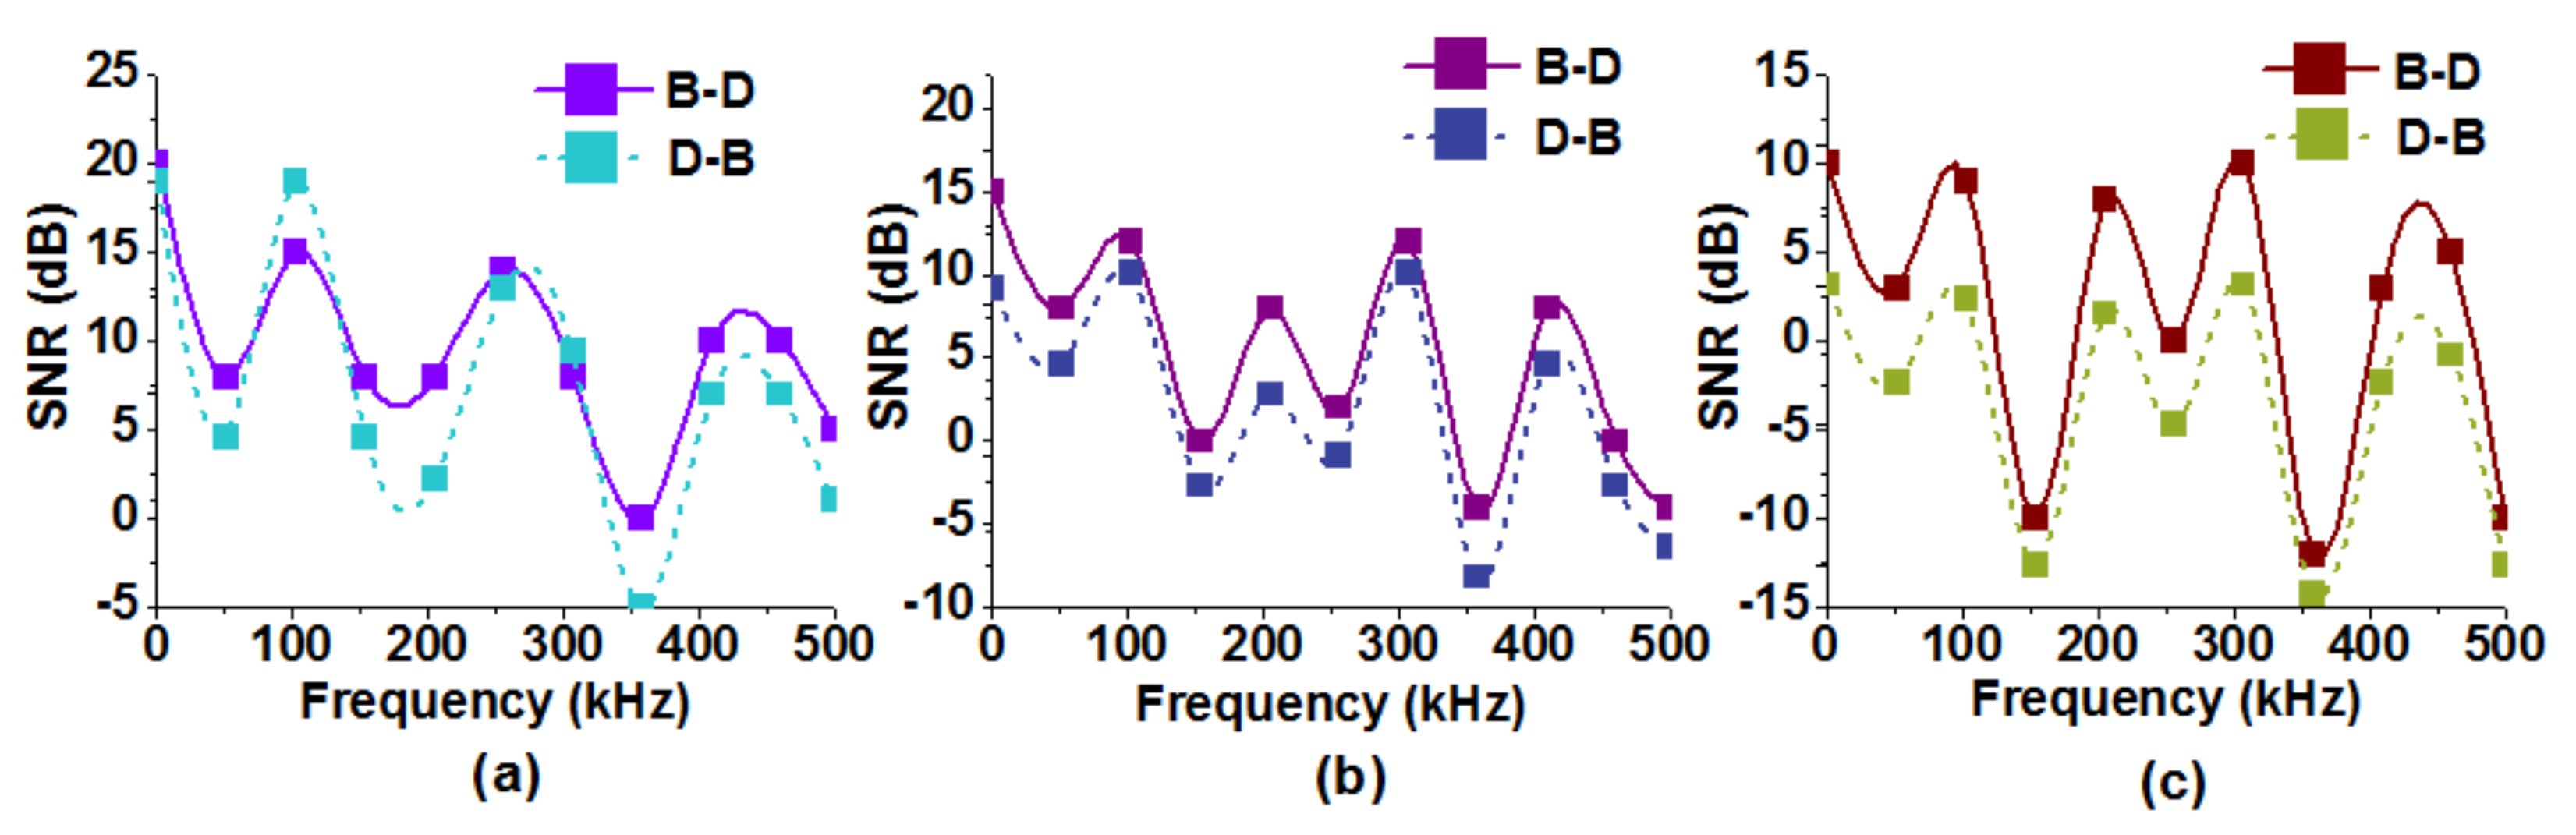
5.1. Field Tests for NB-PLC-Based Demand Side Management System

This part of the paper will explore the characteristics of NB-PLC signals when they pass through LV channels, MV channels, and transformer bridges to provide possible DSM services by presenting the investigation of their corresponding results.

5.1.1. NB-PLC Test over LV Power Lines

The field measurements for the testing of NB-PLC communication for DSM services are carried out on allocated residential, commercial, and industrial sites. The distance between the sending and receiving ends for NB-PLC signal communication is 150 m for each site. The complete experimental setup is depicted in Figure 1 whereas Figure 5 illustrates the elaborated setup for field measurement when communication is performed on a LV NB-PLC network. A signal of 1 V is injected through one energy meter using Laptop A and is received by a different energy meter using Laptop B. It is important to note that the transmission of the signal should be within the same phase for which phase identification is done before investigating the NB-PLC signal characteristics. The USB Emulation/RS232 (SCI-B) port is incorporated in both sending and receiving end transceivers, which make them compatible with the USB port of laptops to display the transmitted and received signal results. External power supplies are given to the transceiver, thus through energy meters the power grid connection port can transmit the signal into the LV network.
Figure 6a–c show the SNR profiles for NB-PLC communication on LV channels of residential, commercial, and industrial consumers. It can be observed that SNR gains vary between −10 dB and 45 dB and are high in the residential channels as compared to commercial and industrial consumers. A difference of 10 to 20 dB can be observed in all three channels. A detailed analysis is presented by box plot analysis in Section 5.4 power consumption of conventional and inverter based air conditioners are compared.

5.1.2. NB-PLC Test over MV Power Lines

Field tests by measuring the SNR profiles of industrial, commercial, and residential MV channels are performed by keeping the MV channel length 1000 m between the two transceivers, sending and receiving data between Laptops C and D, as shown in Figure 1. A signal 1 volt RMS is received and injected on the same phase. Figure 7a–c show the SNR profiles for NB-PLC communication on MV channels for residential, commercial, and industrial consumers respectively. The SNR gains vary between 2 dB and 10 dB, which are high in the residential channels as compared to commercial and industrial consumers. A difference of 10 to 20 dB can be observed in all three channels. The comparatively smaller difference in MV channels as compared to LV channels is due to two factors; (1) ratings of MV/LV transformer are kept similar and (2) the transformer acts as a bridge between high voltage, 50 Hz LV, and MV networks as compared to very low voltage, high frequency NB-PLC signal, and thus resist to transfer the low frequency signals between the two networks. A detailed analysis is presented by box plot analysis in Section 5.4.

5.1.3. Field Test for Hybrid Systems

The field test for the hybrid system includes both types, i.e., LV and MV channels along with the transformer bridge. Laptop B is used to inject the 1V RMS signal located on the energy meter of the LV channel and is received with Laptop D at the same phase but with the MV channel. It is noticeable that the signal has to pass through the transformer bridge while reaching its destination. The length of the hybrid NB-PLC channel is 1100 m. Figure 1 illustrates the locations and measurement setup of hybrid communication system. Figure 8a–c elucidates the SNR profiles for hybrid communication system of residential, commercial, and industrial consumers, respectively. The variations in SNR gains are from −15 dB to 20 dB, which are high in residential consumers, however, the lowest gains can be seen for industrial consumers, whose details are discussed in Section 5.4.

5.1.4. NB-PLC Test across Transformer

The signal is injected from Laptop 1 and is received at Laptop 2. Laptop 1 is injecting the data stream through the transceiver connected with phase A of transformer LV side and is received from Laptop 2 through the transceiver connected to the same phase on the MV side and vice versa. Figure 9a–c illustrate the SNR profiles of transformer bridge for residential, commercial, and industrial consumers, respectively. The variations in SNR gains are from −20 dB to 30 dB for residential consumers. Two deep nulls at 150 kHz and 350 kHz are worth noticing, which are due to resonance phenomenon in the transformer.

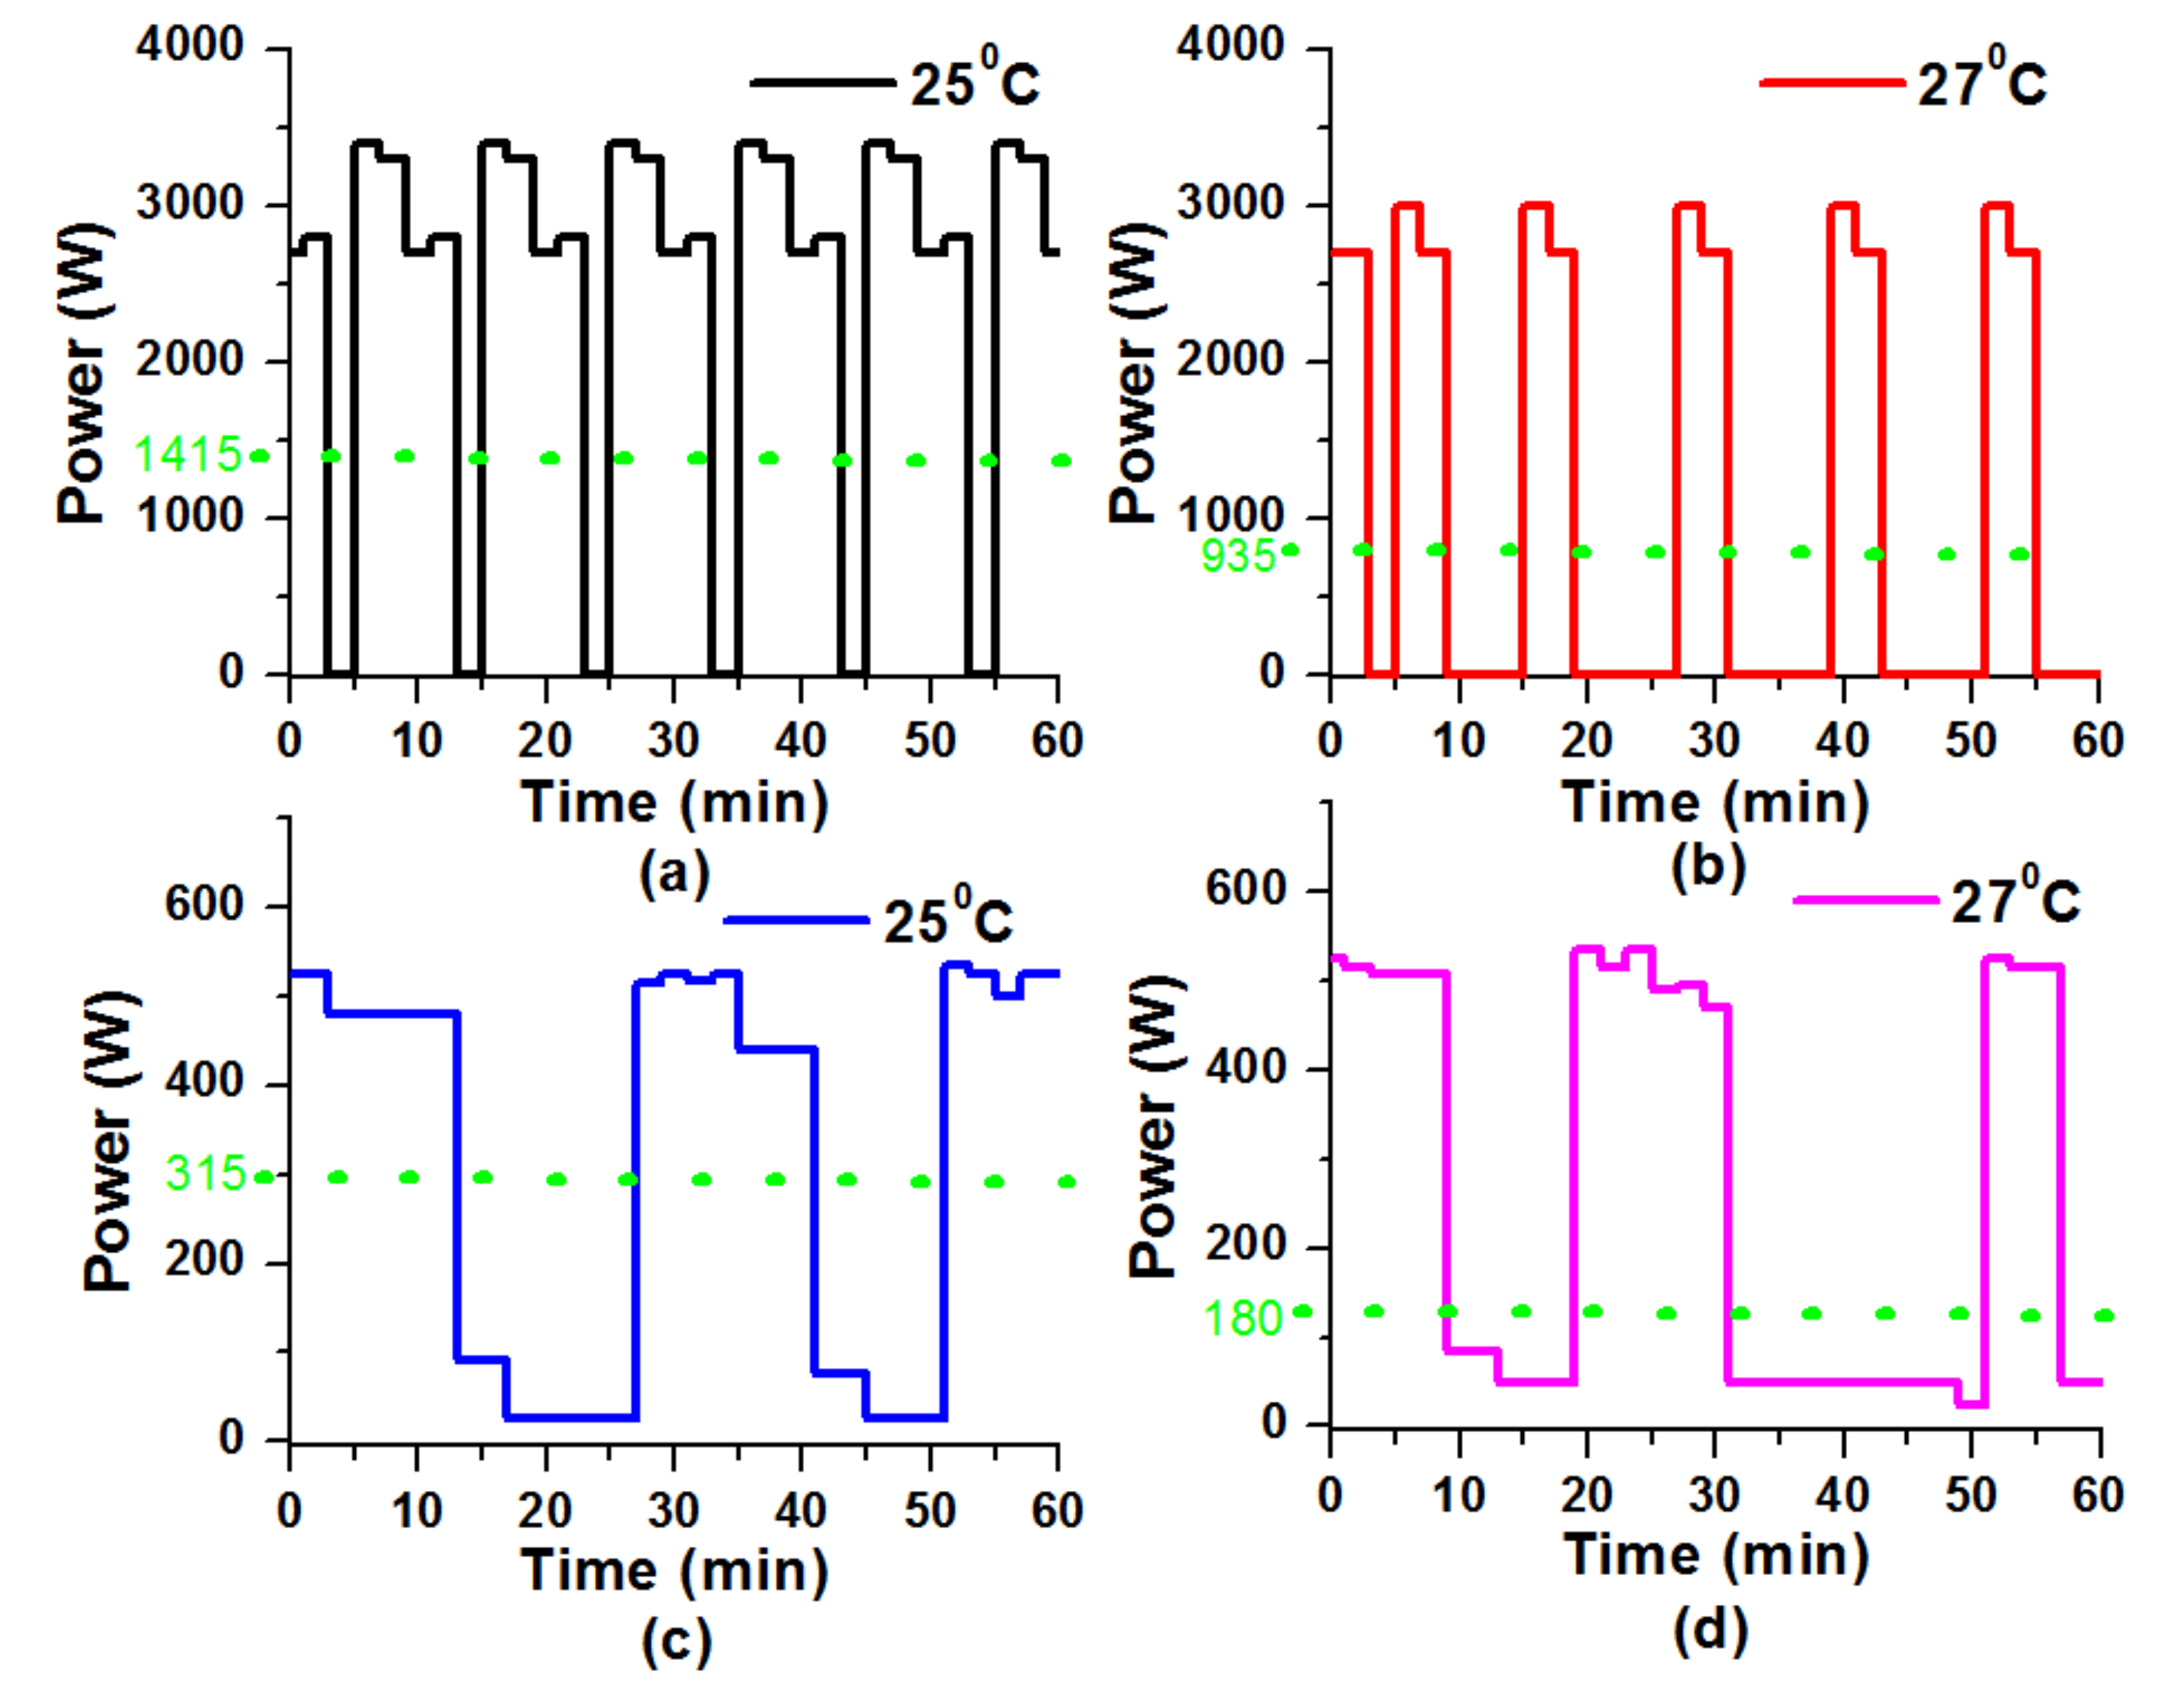
5.2. Field Test of NB-PLC-Based SACs on Conventional and Inverter Based Air Conditioners

The field tests on both conventional- and inverter-based air conditioners by sending NB-PLC control signals for DSM are performed. The ratings of both types of air conditioners considered for field tests are 1.5 tons. The main difference between both types of air conditioners is; unlike conventional air conditioners, inverter-based air conditioners are operated by a variable frequency drive, which keeps on regulating the compressor’s motor speed, making it an energy-efficient machine.

5.2.1. Response of Typical Air Conditioners

The DSM control technique is applied to typical SACs by setting the thermostats at temperature values 25 C and then 27 C . The measured results of hourly power consumption profile are shown in Figure 10a,b at 25 C and 27 C , respectively. The displayed results show that when the temperature was 25 C then the average power consumption was 1415 watts, but when the setting of temperature increases to 27 C then average power consumption reduces to 935 watts with 33.92% power saving.

5.2.2. Response of Variable Frequency Air Conditioners

Similarly, DSM control technique showed energy-efficient and cost-saving performance when applied on variable frequency SACs by setting the thermostat values to 25 C and then to 27 C . The hourly power consumption profile is shown in Figure 10c,d where the temperature change from 25 C to 27 C decreases the average power consumption from 315 watts to 180 watts with 42.85% power saving.

5.3. Implementation of the DSM Program

Testing for the implementation of the DSM program is carried out by involving residential, commercial, and industrial consumers. Before their inclusion into the DSM program, their willingness was taken. SACs’ thermostat settings were set at 25 C and 27 C for 9 and 5.5 min, respectively. In phase I of this setup, five conventional and nine inverter-based air conditioners were used. The daily load profiles of each type of consumer are discussed in the subsequent subsection.

Comparison of Power Consumption Profiles of Residential, Commercial, and Industrial Consumers with Actual and Demand Side Management Control Technique

The daily power consumption profiles of residential, commercial, and industrial consumers by considering actual power consumption profile, with a 3 C temperature rise and then after implementing the DSM program, are investigated. Results illustrated in Figure 11, Figure 12 and Figure 13 show three types of load profile plots: typical power consumption profile, influence of 3 C temperature rise, and after the implementation of the DSM program. It can be clearly observed that a rise in temperature causes an increase in power consumption for all three types of consumers. It is also evident from the results that the DSM program reduces the daily power consumption profiles quite effectively. The attributes of three types of consumers are given as,
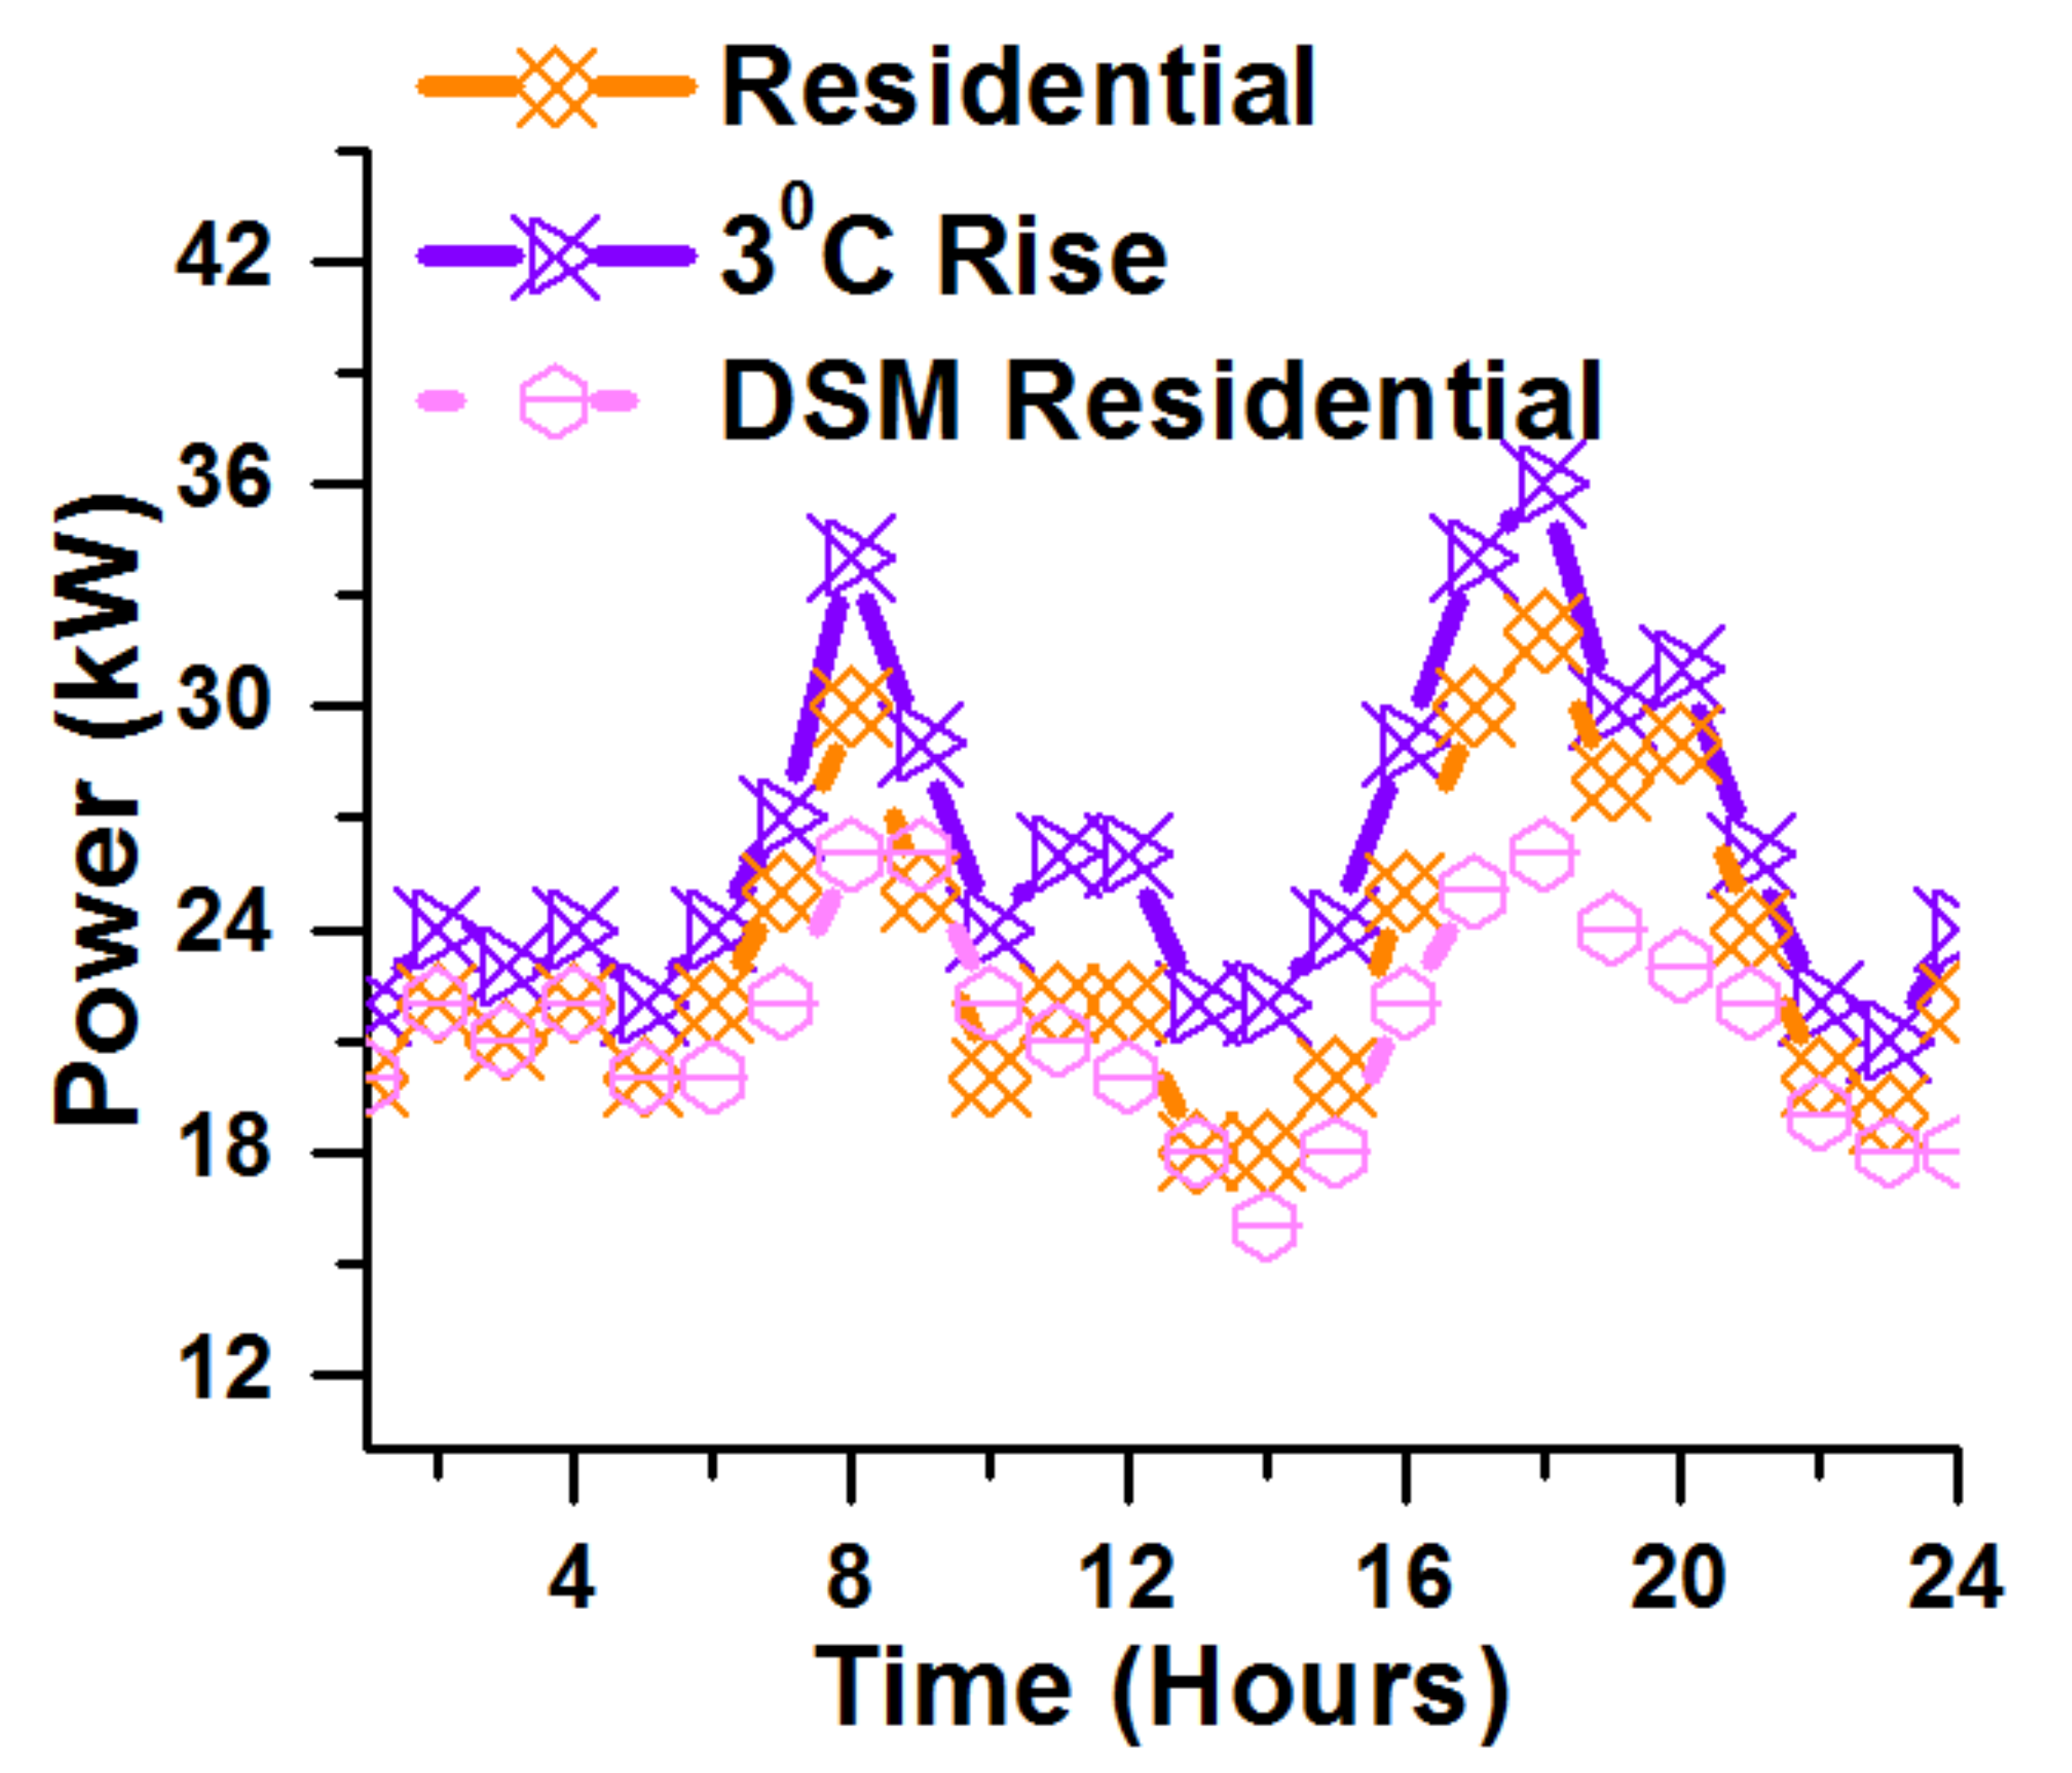
  • Residential Consumers: The daily load profile of transformer supplying power to residential consumers is shown in Figure 11. The peak hours of residential consumers are in the morning time with a peak at 8 AM due to preparation of professionals for offices and kids for schools. The second peak is in the evening time between 5 and 8 PM due to the availability of all residents in their homes. The implementation of DSM program reduces the overall power consumption to 19.23% with 33% during the peak hours;
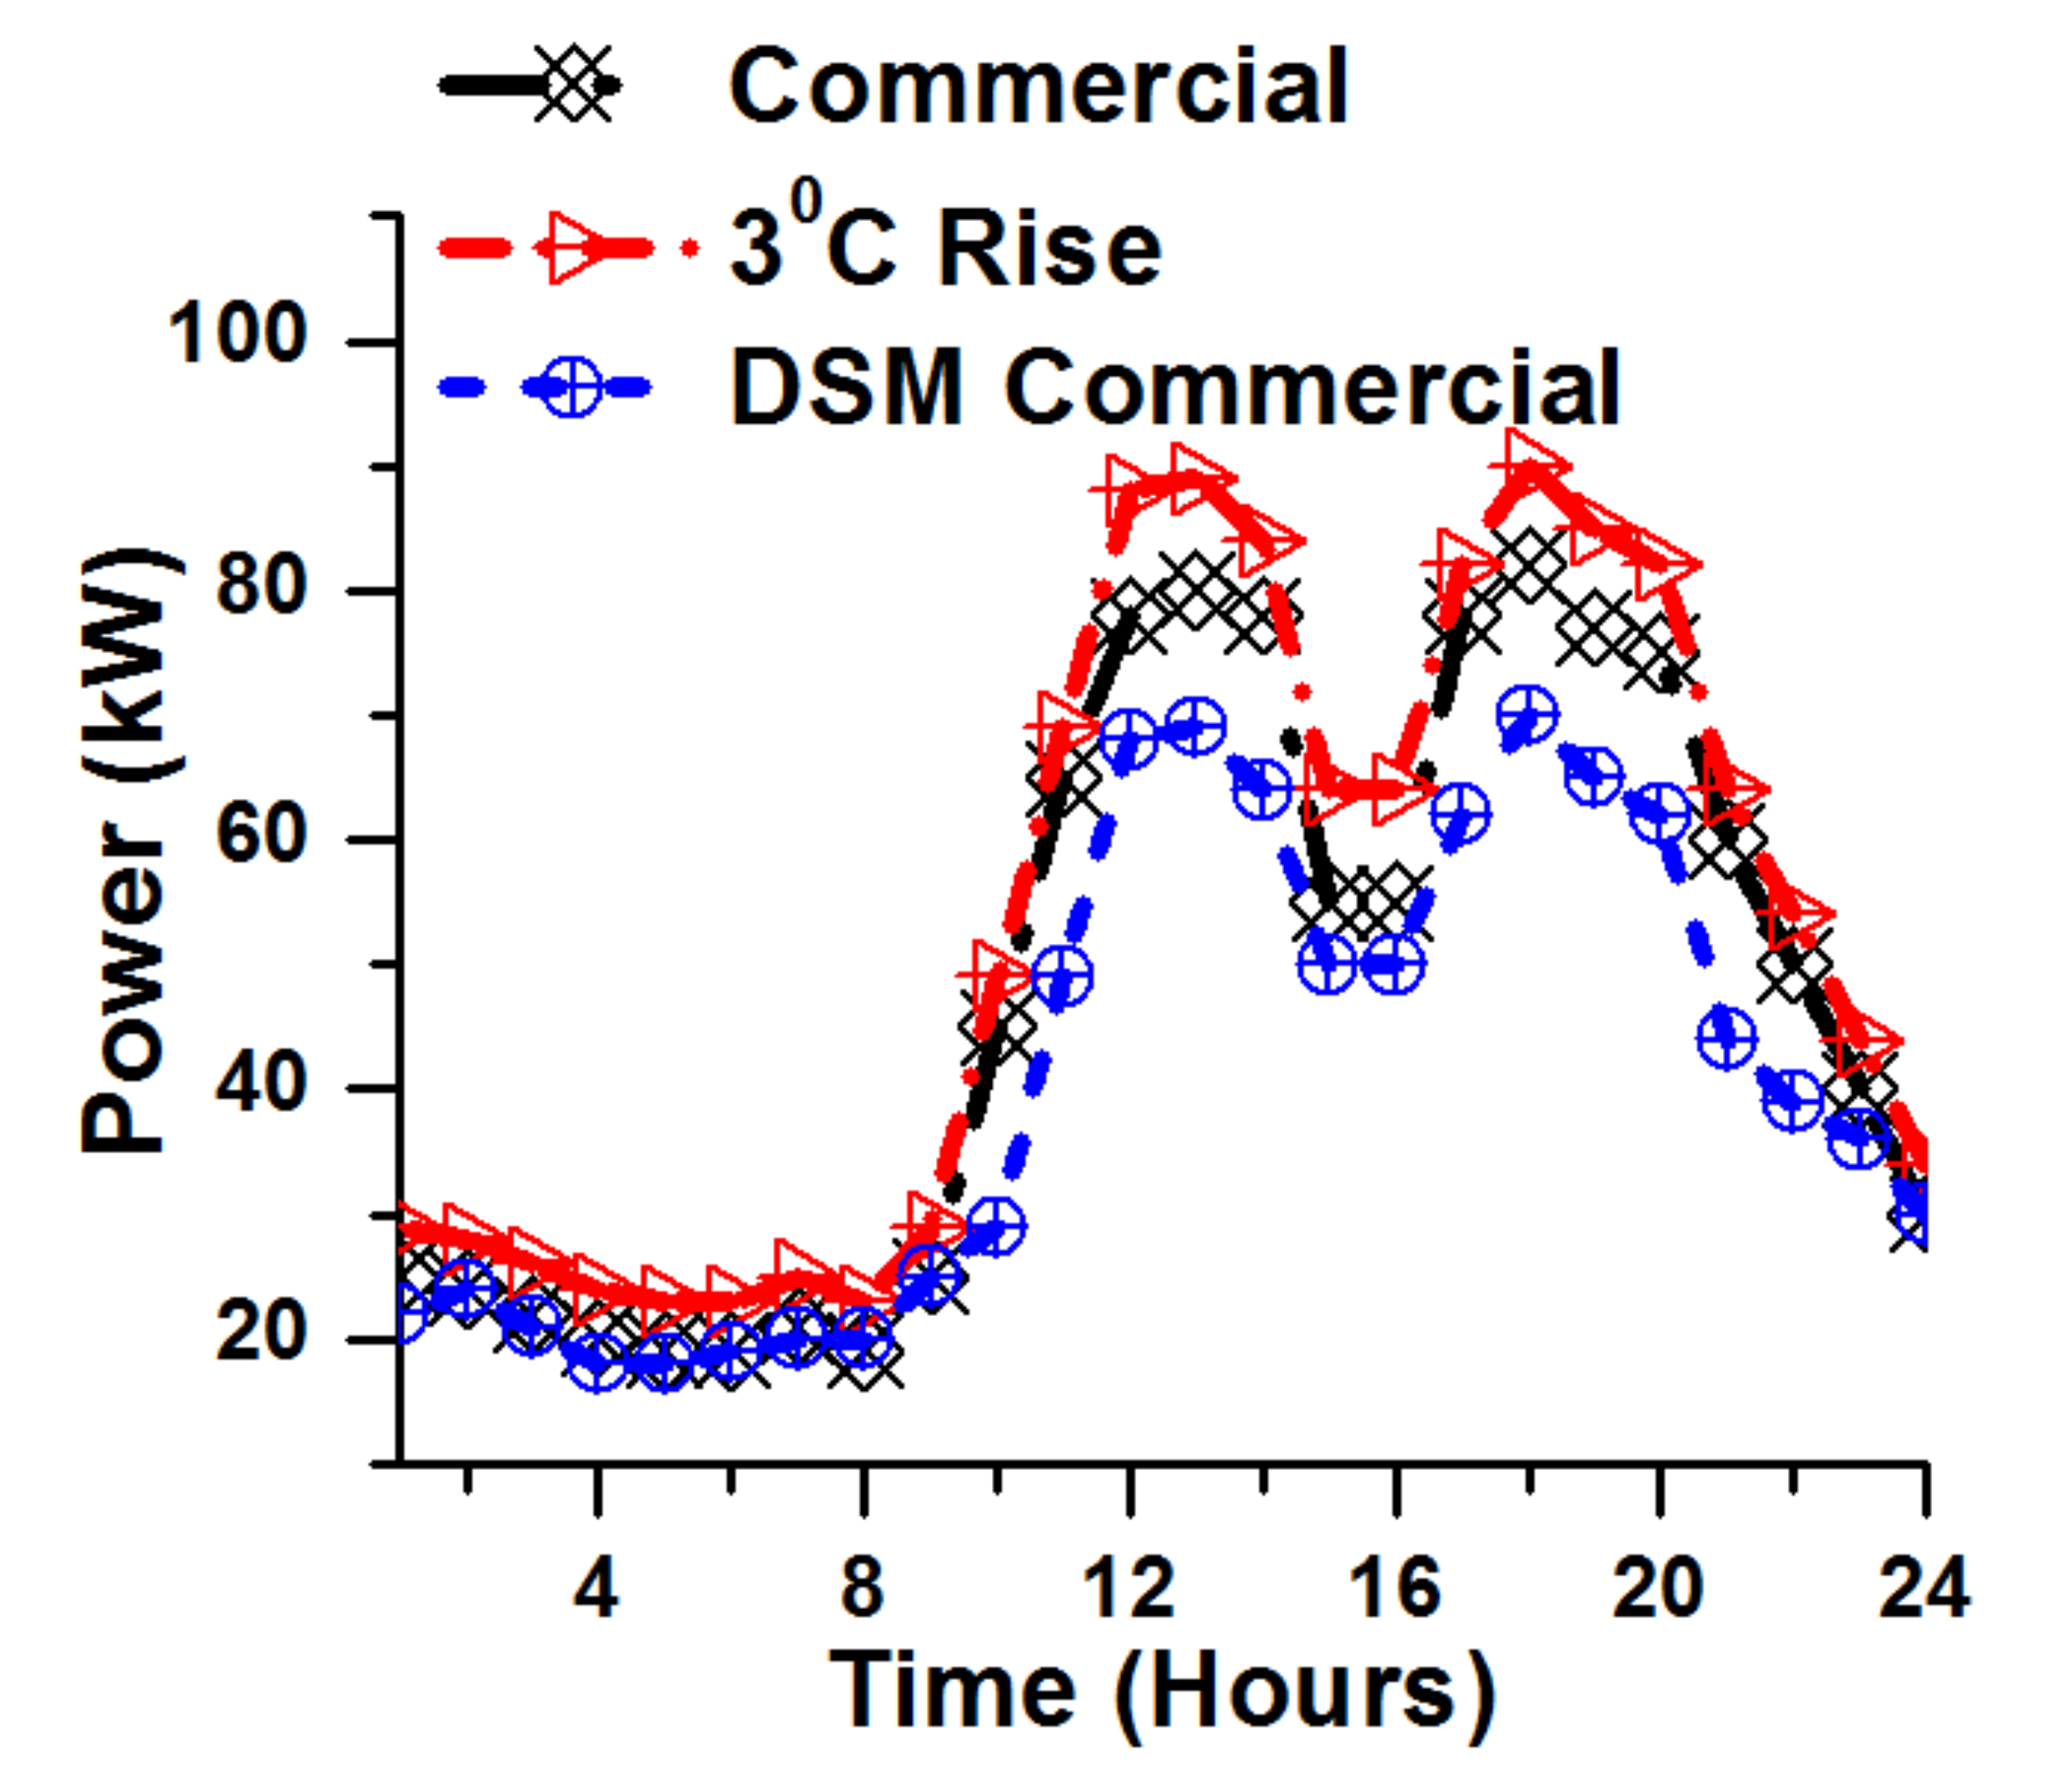
  • Commercial Consumers: The daily load profile of transformer supplying power to commercial consumers is shown in Figure 12. The peak hours of commercial consumers are between 1 PM and 6 PM due to the opening of commercial shops. The implementation of the DSM program reduces the overall power consumption to 14.71% with 22.22% during the peak hours;
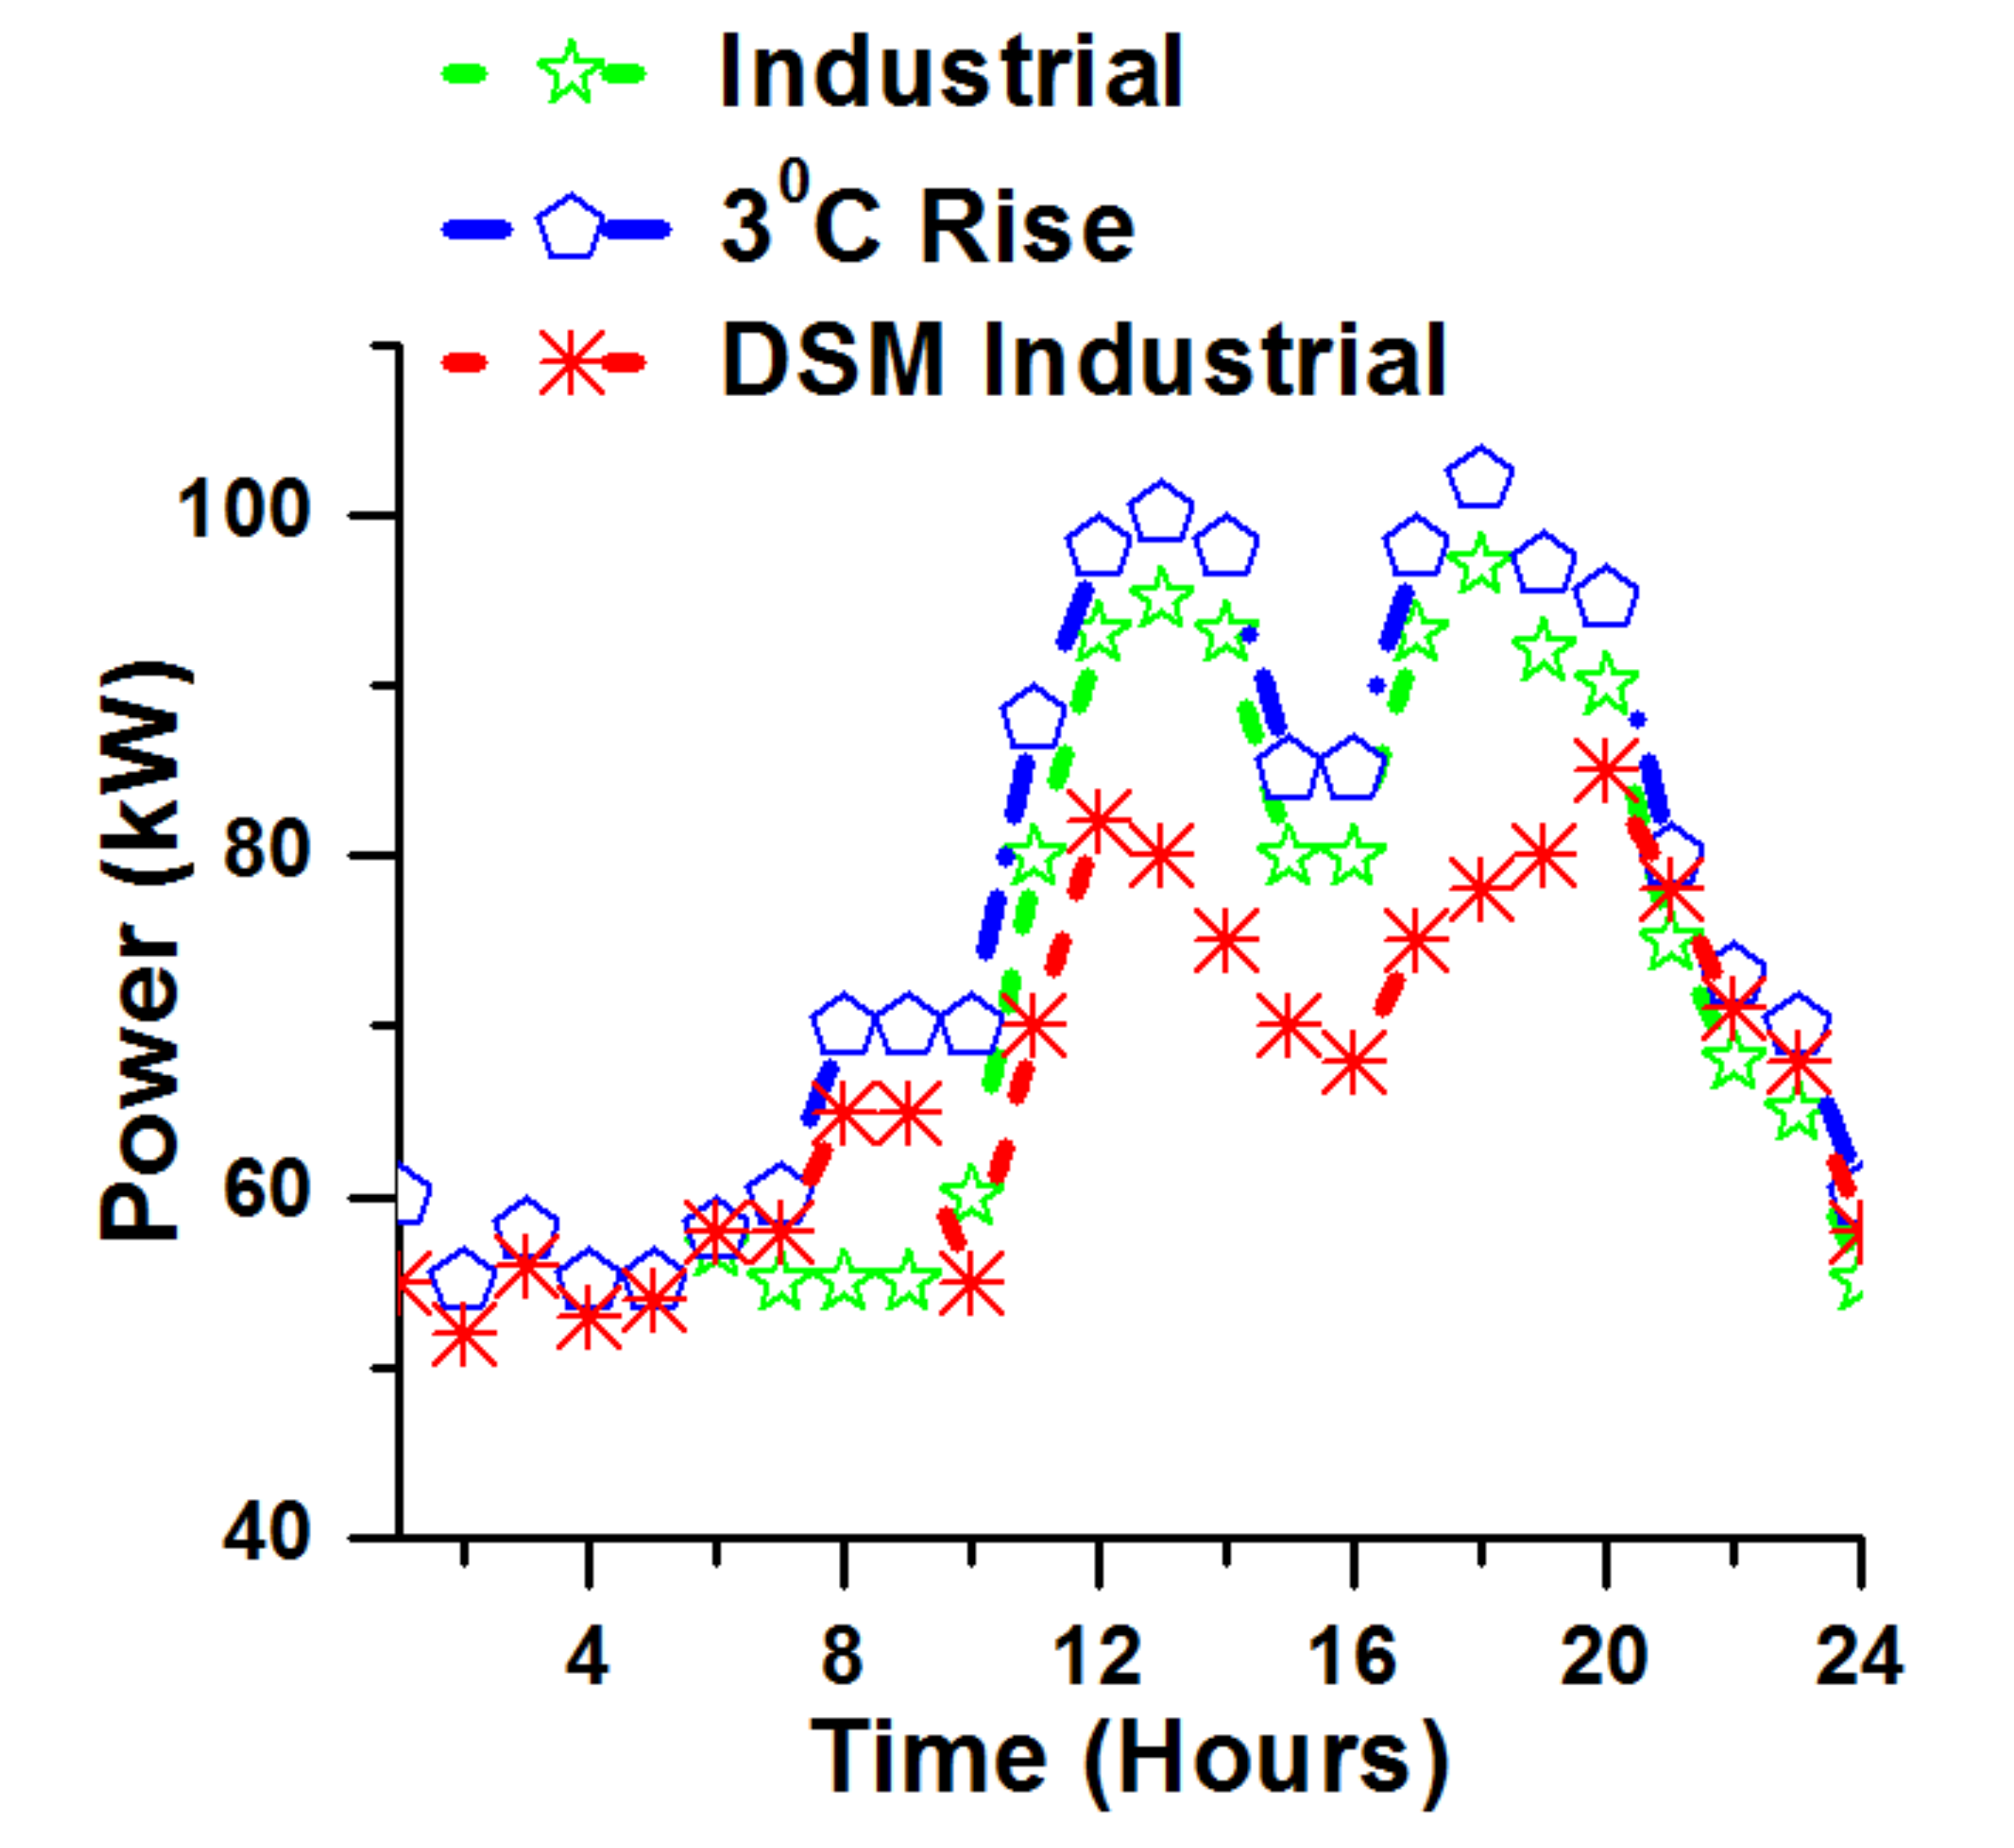
  • Industrial Consumers: The daily load profile of transformer-supplying power to industrial consumers is shown in Figure 13. The peak hours of industrial consumers are between 1 PM and 6:30 PM due to operation of the working units. The implementation of DSM program reduces the overall power consumption to 10.5% with 20% during the peak hours.

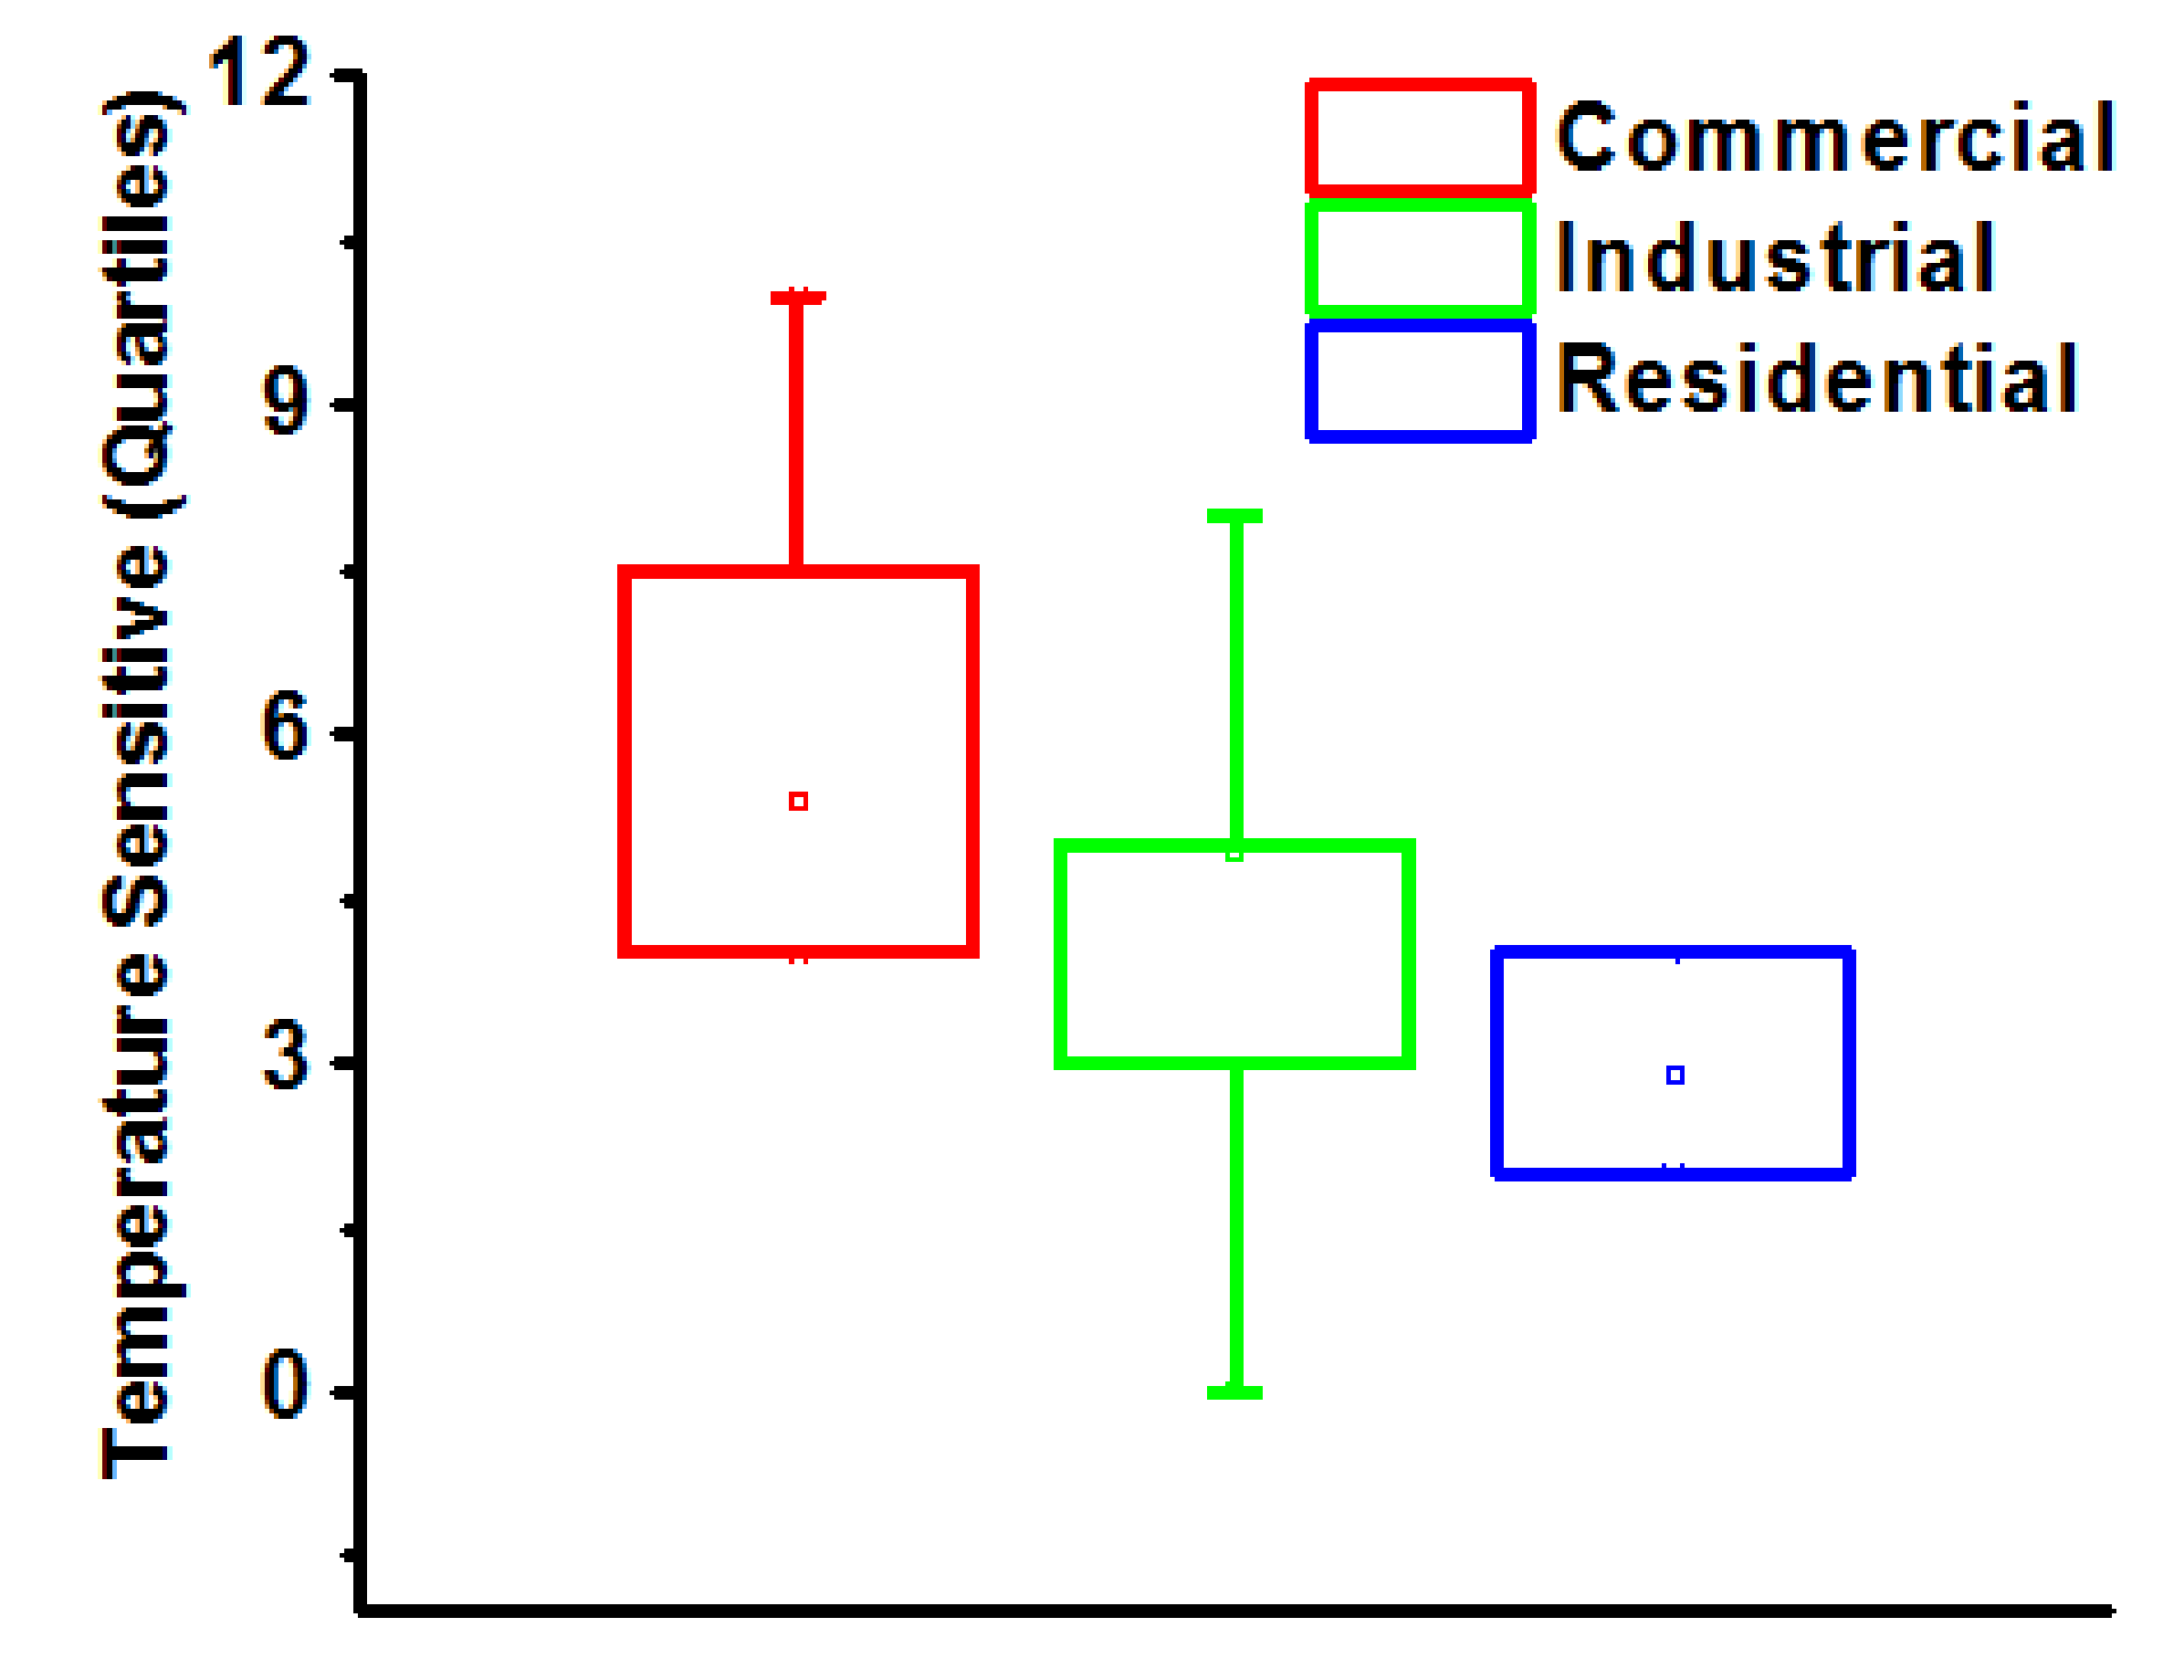
5.4. Box Plot Analysis for SNR and Temperature Sensitivity Profiles

A detail of LV channels, MV channels, and transformers’ SNR gain profiles for NB-PLC-based DSM are summarized using a box plot, as shown in Figure 14. The frequency band of 3 to 500 kHz is of great interest for residential (denoted by subscript R), commercial (denoted by subscript C), and industrial (denoted by subscript I) NB-PLC channels and transformers, as shown in Figure 14. The box plot for TS analysis is shown in Figure 15 where the influence of TS on the power consumption profile of residential, commercial, and industrial transformers is presented.
The box plot can be used to find out the intrinsic statistical gain of the channel, and with the transmitted data set it can also be used for finding minimum and maximum values with the overall gain trends. From the box plot, the SNR values for residential channels and transformers yield good SNR profiles. It is important to note that commercial and industrial channels and transformers’ gains are located on the lower sides of the box plot. However, box plots for TS are unveiling the fact that the rise in temperature affects more commercial consumers as compared to industrial and residential consumers.

6. Conclusions

This paper presents a DSM control technique by incorporating NB-PLC on residential, commercial, and industrial loads. The DSM is applied to SACs by using SEP 1.0. Temperature sensitivity analyses are presented to help understand the influence of atmospheric temperature variations on power consumption profiles of various types of consumers. The characteristics of NB-PLC are investigated for LV and MV networks in detail using the measurements taken at LV channels, MV channels, hybrid channels (involving transformer bridge), and solely transformer responses. The presented SNR profiles will help to assess the feasibility and performance of NB-PLC over LV channels, MV channels, and transformer bridge. It is verified from field test results that the implementation of DSM control technique significantly reduces the power consumption in peak hours. The control commands can be sent by MCR to adjust the thermostat temperature of SACs. Similarly, SACs can send daily, weekly, monthly, and annual power consumption profiles to MCR. The setup of proposed system is compatible with various other appliances in context of future smart homes. This research is novel in the sense that it assesses the feasibility of DSM services using NB-PLC in South Asian countries like Pakistan.

Author Contributions

Conceptualization, B.M. and S.G.; methodology, B.M., M.S. and J.N.; validation, M.N.I., A.U.R. and I.R.; data curation, M.B., M.S., J.N. and H.H.; investigation, M.B., M.N.I., I.R. and H.H.; writing—original draft preparation, B.M., A.U.R. and J.N.; writing—review and editing, M.N.I., A.U.R., S.G. and I.R.; visualization, H.H., M.B. and M.S.; supervision, S.G.; Funding acquisition, H.H. All authors have read and agreed to the published version of the manuscript.

Funding

This research received no external funding.

Institutional Review Board Statement

Not applicable.

Informed Consent Statement

Not applicable.

Data Availability Statement

Data is contained within the article.

Acknowledgments

The authors extend their appreciation to the Deputyship for Research & Innovation, Ministry of Education in Saudi Arabia for funding this research work through the project number (IF–PSAU–2021/01/18103). The authors also thank Natural Sciences and Engineering Research Council of Canada (NSERC) and New Brunswick Innovation Foundation (NBIF) for the financial support of the global project. These granting agencies did not contribute in the design of the study and collection, analysis, and interpretation of data.

Conflicts of Interest

The authors declare no conflict of interest.

Abbreviations

SymbolDescription
g i reflection attenuation
A ( f , d i ) line attenuation
N and e j 2 π f τ i number of delays due to distance
W 1 forward waves
W 2 reflected waves
Z k load impedance
Z o characteristic impedance
e γ l I attenuation of the line
k v constant
μ o constant
μ 1 constant
c 0 speed of light
l i length of the route
ϵ r relative permittivity of conductor
nnumber of samples
x and yMeans
S x and S y Standard deviations
T n Normalized temperature
TActual temperature
T m e a n Mean temperature
H n Normalized humidity
HActual humidity
H m e a n Mean humidity
P n Normalized power consumption of consumers
PActual power
P m e a n Mean power
α , β , and γ Coefficients of regression model
t α / 2 r Confidence interval
T n Change in normalized temperature
P R Base power demands of residential
P C Base power demands of commercial
P I Base power demands of industrial consumers
T Change in actual temperature.
T S Guard time
E S Guard energy
F c Carrier frequency
S N R Signal to noise ratio
P S Power of the signal
P N The power of noise
AAmplitude
σ Standard deviation
eData rate
T e q Average energy of transmitted bits
B E R Bit error rate
C A P E X Capital expenditures
C C D Charged-coupled device
D G Distributed generation
D L C Direct load control
D R Demand response
D S M Demand side management
E M I Enhanced immunity
F E C Forward error correction
G 3 P L C Genetic algorithm
G A Genetic algorithm
G U I Graphical user interface
L V Low voltage
M C R Master control room
M V P L C Medium voltage power line communication
M P S K M-phase shift keying
M C R Master Control Room
M V Medium voltage
N B P L C Narrow band power line communications
O P E X Operating expenses
O F D M Orthogonal frequency division multiplexing
P L C Power line communication
P A R Peak to average ratio
Q A M Quadrature amplitude modulation
P V Photovoltaic
R E S Renewable energy systems
S A C S Smart Air Conditioners
S F S K Spaced Frequency Shift Keying
S M P S Switched-mode power supply
S N R Signal to noise ratio
S G Smart grid
S A C s Smart air conditioners
T I Texas Instruments
T S Temperature sensitivity
U P S Uninterrupted power supplies
V D S Voltage detection system
S N R Signal to noise ratio

References

  1. Althaher, S.; Mancarella, P.; Mutale, J. Automated Demand Response From Home Energy Management System Under Dynamic Pricing and Power and Comfort Constraints. IEEE Trans. Smart Grid 2015, 6, 1874–1883. [Google Scholar] [CrossRef]
  2. Masood, B.; Baig, S. Standardization and deployment scenario of next generation NB-PLC technologies. Renew. Sustain. Energy Rev. 2016, 65, 1033–1047. [Google Scholar] [CrossRef]
  3. Smith, R.; Meng, K.; Dong, Z.; Simpson, R. Demand response: A strategy to address residential air-conditioning peak load in Australia. J. Mod. Power Syst. Clean Energy 2013, 1, 223–230. [Google Scholar] [CrossRef] [Green Version]
  4. Yan, H.; Li, B.; Chen, S.; Zhong, M.; Li, D.; Jiang, L.; He, G. Future evolution of automated demand response system in smart grid for low-carbon economy. Energyo 2018, 3, 72–81. [Google Scholar] [CrossRef] [Green Version]
  5. Masood, B.; Usman, M.; Gul, M.U.; Khan, W.A. Measurements and characterization of power transformer and low voltage access network for NB-PLC. Int. J. Commun. Syst. 2017, 30, e3344. [Google Scholar] [CrossRef]
  6. ZigBee Smart Energy Overview. Available online: http://www.zigbee.org/Standards/ZigBeeSmartEnergy/Overview.aspx (accessed on 6 August 2021).
  7. Sharma, S.K.; Chandra, A.; Saad, M.; Lefebvre, S.; Asber, D.; Lenoir, L. Voltage Flicker Mitigation Employing Smart Loads With High Penetration of Renewable Energy in Distribution Systems. IEEE Trans. Sustain. Energy 2016, 8, 414–424. [Google Scholar] [CrossRef]
  8. Deng, R.; Yang, Z.; Chow, M.-Y.; Chen, J. A Survey on Demand Response in Smart Grids: Mathematical Models and Approaches. IEEE Trans. Ind. Inform. 2015, 11, 570–582. [Google Scholar] [CrossRef]
  9. Yao, L.; Chang, W.-C.; Yen, R.-L. An Iterative Deepening Genetic Algorithm for Scheduling of Direct Load Control. IEEE Trans. Power Syst. 2005, 20, 1414–1421. [Google Scholar] [CrossRef]
  10. Pourmousavi, S.A.; Nehrir, M.H. Real-Time Central Demand Response for Primary Frequency Regulation in Microgrids. IEEE Trans. Smart Grid 2012, 3, 1988–1996. [Google Scholar] [CrossRef]
  11. Meng, F.-L.; Zeng, X.-J. A Profit Maximization Approach to Demand Response Management with Customers Behavior Learning in Smart Grid. IEEE Trans. Smart Grid 2016, 7, 1516–1529. [Google Scholar] [CrossRef]
  12. Wang, H.; Huang, J.; Lin, X.; Mohsenian-Rad, H. Proactive Demand Response for Data Centers: A Win-Win Solution. IEEE Trans. Smart Grid 2016, 7, 1584–1596. [Google Scholar] [CrossRef]
  13. Forouzandehmehr, N.; Esmalifalak, M.; Mohsenian-Rad, H.; Han, Z. Autonomous Demand Response Using Stochastic Differential Games. IEEE Trans. Smart Grid 2014, 6, 291–300. [Google Scholar] [CrossRef]
  14. Mohsenian-Rad, A.H.; Wong, V.W.S.; Jatskevich, J.; Schober, R. Optimal and autonomous incentive-based energy consumption scheduling algorithm for smart grid. In Proceedings of the 2010 Innovative Smart Grid Technologies (ISGT), Gaithersburg, MD, USA, 19–21 January 2010; pp. 1–6. [Google Scholar]
  15. Pilz, M.; Al-Fagih, L. A Dynamic Game Approach for Demand-Side Management: Scheduling Energy Storage with Forecasting Errors. Dyn. Games Appl. 2020, 10, 897–929. [Google Scholar] [CrossRef] [Green Version]
  16. Nguyen, H.K.; Song, J.B. Optimal charging and discharging for multiple PHEVs with demand side management in vehicle-to-building. J. Commun. Netw. 2012, 14, 662–671. [Google Scholar] [CrossRef]
  17. Sortomme, E.; El-Sharkawi, M.A. Optimal Charging Strategies for Unidirectional Vehicle-to-Grid. IEEE Trans. Smart Grid 2011, 2, 131–138. [Google Scholar] [CrossRef]
  18. Gatsis, N.; Giannakis, G.B. Residential Load Control: Distributed Scheduling and Convergence With Lost AMI Messages. IEEE Trans. Smart Grid 2012, 3, 770–786. [Google Scholar] [CrossRef]
  19. Zimmermann, M.; Dostert, K. A multipath model for the powerline channel. IEEE Trans. Commun. 2002, 50, 553–559. [Google Scholar] [CrossRef] [Green Version]
  20. Zimmermann, M.; Dostert, K. Analysis and modeling of impulsive noise in broad-band powerline communications. IEEE Trans. Electromagn. Compat. 2002, 44, 249–258. [Google Scholar] [CrossRef]
  21. Philipps, H. Modelling of Powerline Communication Channels. In Proceedings of the 3rd International Symposium on Powerline Communications and Its Applications, Lancaster, UK, 30 March–1 April 1999; pp. 14–21. [Google Scholar]
  22. Matthias, G.; Rapp, M.; Dostert, K. Power line channel characteristics and their effect on communication system design. IEEE Commun. Mag. 2004, 42, 78–86. [Google Scholar]
  23. Masood, B.; Usman, M.; Din, F.U.; Haider, A. Effect of transient and non-transient models on the performance of PLC. Telecommun. Syst. 2016, 65, 55–64. [Google Scholar] [CrossRef]
  24. Masood, B.; Baig, S. Channel modeling of NB-PLC for Smart Grid. In Proceedings of the 2015 IEEE Symposium on Computers and Communication (ISCC), Larnaca, Cyprus, 6–9 July 2015; pp. 745–750. [Google Scholar]
  25. Tonello, A.M.; Versolatto, F. Bottom-Up Statistical PLC Channel Modeling–Part I: Random Topology Model and Efficient Transfer Function Computation. IEEE Trans. Power Deliv. 2011, 26, 891–898. [Google Scholar] [CrossRef]
  26. Tonello, A.M.; Versolatto, F. Bottom-Up Statistical PLC Channel Modeling—Part II: Inferring the Statistics. IEEE Trans. Power Deliv. 2010, 25, 2356–2363. [Google Scholar] [CrossRef]
  27. Tonello, A.M.; Versolatto, F. New Results on Top-down and Bottom-up Statistical PLC Channel Modeling. In Proceedings of the Third workshop on Power Line Communications, Udine, Italy, 1–2 October 2009. [Google Scholar]
  28. Benato, R.; Caldon, R. Frequency Characteristics Measurement of Overhead High-Voltage Power-Line in Low Radio-Frequency Range. IEEE Trans. Power Deliv. 2007, 22, 575–583. [Google Scholar] [CrossRef]
  29. Cataliotti, A.; Cara, D.D.; Fiorelli, R.; Tine, G. Power-Line Communication in Medium- Voltage System: Simulation Model and Onfield Experimental Tests. IEEE Trans. Power Deliv. 2012, 27, 1. [Google Scholar] [CrossRef]
  30. Artale, G.; Cataliotti, A.; Cosentino, V.; Di Cara, D.; Russotto, P.; Fiorelli, R.; Tine, G. Secondary substation power line communications for medium voltage smart grids. In Proceedings of the 2012 IEEE International Workshop on Applied Measurements for Power Systems (AMPS) Proceedings, Aachen, Germany, 26–28 September 2012; pp. 1–6. [Google Scholar]
  31. Cataliotti, A.; Cosentino, V.; Di Cara, D.; Tine’, G. Simulation and Laboratory Experimental Tests of a Line to Shield Medium-Voltage Power-Line Communication System. IEEE Trans. Power Deliv. 2011, 26, 2829–2836. [Google Scholar] [CrossRef]
  32. Kim, I.H.; Kim, W.; Park, B.; Yoo, H. Channel measurements and field tests of narrowband power line communication over Korean underground LV power lines. In Proceedings of the 18th IEEE International Symposium on Power Line Communications and Its Applications, Glasgow, UK, 30 March–2 April 2014; pp. 132–137. [Google Scholar]
  33. Masood, B.; Guobing, S.; Naqvi, R.A.; Rasheed, M.B.; Hou, J.; Rehman, A.U. Measurements and channel modeling of low and medium voltage NB-PLC networks for smart metering. IET Gener. Transm. Distrib. 2021, 15, 321–338. [Google Scholar] [CrossRef]
  34. Masood, B.; Khan, M.A.; Baig, S.; Song, G.; Rehman, A.U.; Rehman, S.U.; Asif, R.M.; Rasheed, M.B. Investigation of Deterministic, Statistical and Parametric NB-PLC Channel Modeling Techniques for Advanced Metering Infrastructure. Energies 2020, 13, 3098. [Google Scholar] [CrossRef]
  35. Rabia, K.; Ayesha, K.; Jehangir, A.; Ateeq, U.R.; Abdul, R.; Anand, P. Analysis on Optimal Location of Centralized Generation and Storage in DC Microgrids for Rural Electrification. In Proceedings of the 17th International Conference on Multimedia Information Technology and Applications (MITA 2021), Jeju, Korea, 5–7 July 2021. [Google Scholar]
  36. Khan, F.; Siddiqui, M.A.B.; Rehman, A.U.; Khan, J.; Asad, M.T.S.A.; Asad, A. IoT Based Power Monitoring System for Smart Grid Applications. In Proceedings of the 2020 International Conference on Engineering and Emerging Technologies (ICEET), Lahore, Pakistan, 22–23 February 2020; Institute of Electrical and Electronics Engineers (IEEE): Piscataway, NJ, USA; pp. 1–5. [Google Scholar]
  37. Cataliotti, A.; Cosentino, V.; Di Cara, D.; Tine’, G. Measurement Issues for the Characterization of Medium Voltage Grids Communications. IEEE Trans. Instrum. Meas. 2013, 62, 2185–2196. [Google Scholar] [CrossRef]
  38. Galli, S.; Banwell, T. A Novel Approach to the Modeling of the Indoor Power Line Channel—Part II: Transfer Function and Its Properties. IEEE Trans. Power Deliv. 2005, 20, 1869–1878. [Google Scholar] [CrossRef]
  39. Hsieh, S.-C.; Ku, T.-T.; Chen, C.-S.; Lin, C.-H.; Tsai, J.-C. Broadcasting Control of Intelligent Air Conditioners Using Power-Line-Carrier Technology. IEEE Trans. Ind. Appl. 2014, 51, 1890–1896. [Google Scholar] [CrossRef]
  40. Afshari, F.; Sahin, B.; Khanlari, A.; Manay, E. Experimental optimization and investigation of compressor cooling fan in an air-to-water heat pump. Heat Transf. Res. 2020, 51, 319–331. [Google Scholar] [CrossRef]
  41. Baig, S.; Mughal, J. Multirate Signal Processing Techniques for High-speed Communication over Power Lines. IEEE Commun. Mag. 2009, 47, 70–76. [Google Scholar] [CrossRef]
  42. Baig, S.; Gohar, N.D. Discrete Multitone Transceiver at the heart of PHY Layer of an In-Home Powerline Communication Local Area Network. IEEE Commun. Mag. 2003, 41, 48–53. [Google Scholar] [CrossRef]
  43. Daniel, K.; Kütt, L.; Iqbal, M.N.; Shabbir, N.; Rehman, A.U.; Shafiq, M.; Hamam, H. Current Harmonic Aggregation Cases for Contemporary Loads. Energies 2022, 15, 437. [Google Scholar] [CrossRef]
  44. Sharma, H.; Mishra, S.; Dhillon, J.; Sharma, N.K.; Bajaj, M.; Tariq, R.; Rehman, A.U.; Shafiq, M.; Hamam, H. Feasibility of Solar Grid-Based Industrial Virtual Power Plant for Optimal Energy Scheduling: A Case of Indian Power Sector. Energies 2022, 15, 752. [Google Scholar] [CrossRef]
  45. Khalid, A.; Jaffery, M.H.; Javed, M.Y.; Yousaf, A.; Arshad, J.; Rehman, A.U.; Haider, A.; Althobaiti, M.M.; Shafiq, M.; Hamam, H. Performance Analysis of Mars-Powered Descent-Based Landing in a Constrained Optimization Control Framework. Energies 2021, 14, 8493. [Google Scholar] [CrossRef]
  46. Yousaf, A.; Asif, R.M.; Shakir, M.; Rehman, A.U.; Alassery, F.; Hamam, H.; Cheikhrouhou, O. A Novel Machine Learning-Based Price Forecasting for Energy Management Systems. Sustainability 2021, 13, 12693. [Google Scholar] [CrossRef]
  47. Draper, N.R.; Smith, H. Applied Regression Analysis; John Wiley & Sons, Inc.: New York, NY, USA, 1966. [Google Scholar]
Figure 1. Architecture of field measurements of NB-PLC system for DSM using LV and MV channels.
Energies 15 02482 g001
Figure 2. Chosen sites for measurements i.e., commercial, industrial, and residential.
Energies 15 02482 g002
Figure 3. GUI of transceiver.
Energies 15 02482 g003
Figure 4. Signal communication in DSM control technique for SACs.
Energies 15 02482 g004
Figure 5. Setup for field measurement of LV NB-PLC network.
Energies 15 02482 g005
Figure 6. SNR profiles of NB-PLC. (a) Communication on LV channel for residential consumers. (b) Communication on LV channel for commercial consumers. (c) Communication on LV channel for industrial consumers.
Energies 15 02482 g006
Figure 7. SNR profiles of NB-PLC. (a) Communication on MV channel for residential consumers. (b) Communication on MV channel for commercial consumers. (c) Communication on MV channel for industrial consumers.
Energies 15 02482 g007
Figure 8. SNR profiles of NB-PLC. (a) Communication on hybrid channels for residential consumers. (b) Communication on hybrid channels for commercial consumers. (c) Communication on hybrid channels for industrial consumers.
Energies 15 02482 g008
Figure 9. SNR profiles of NB-PLC. (a) Communication over the transformer bridge for residential consumers. (b) Communication over the transformer bridge for commercial consumers. (c) Communication over the transformer bridge for industrial consumers.
Energies 15 02482 g009
Figure 10. Hourly power consumption profiles. (a) Typical air conditioner at 25 C . (b) Typical air conditioner at 27 C . (c) Variable frequency air conditioner at 25 C . (d) Variable frequency air conditioner at 27 C .
Energies 15 02482 g010
Figure 11. Daily load profile of transformer supplying to residential consumers.
Energies 15 02482 g011
Figure 12. Daily load profile of transformer supplying to commercial consumers.
Energies 15 02482 g012
Figure 13. Daily load profile of transformer supplying to industrial consumers.
Energies 15 02482 g013
Figure 14. Summary of channels’ gains.
Energies 15 02482 g014
Figure 15. Percentage (%) deviation of power consumption with 3 C temperature rise of residential, commercial, and industrial transformers.
Energies 15 02482 g015
Table 1. The past and next generation of PLC methods.
Sr. No.Chips MethodCircuits GenerationCarrier FrequencyData RatesModulation SchemesDescriptionReferences
1.AS5501/02Past Generations Circuit64–140 (kHz)600, 1200, 2400 bpsFrequency-shift keyingHalf duplex dommunication mode with qn asynchronous information transmitting mode [32]
2.AMIS-49587Past Generations Circuit9–95 (kHz)300, 600, 1200, 2400 bpsSpread-frequency-shift keyingDynamic communication method [33]
3.ST7538/40Past Generations Circuit50–150 (kHz)4800 bpsFrequency-shift keyingBoth data transmission approaches followed, i.e., synchronous/asynchronous, using CENELEC EN-50065 [34]
4.TDA5051Past Generations Circuit95–148.5 (kHz)95–148.5 bpsAmplitude shift KeyingOnly half duplex communication mode supported with CENELEC EN-50065-1 [35]
5.ST7570Next Generation CircuitUp to 148.5 (kHz)2.4 kbpsSpread-frequency-shift keyingImproved signal to noise ratio [36]
6.ST7580Next Generation CircuitUp to 250 (kHz)9.6 kbps, 28.8 kbpsBinary phase-shift keying, quadrature phase shift keying and 8-phase shift keyingMostly used for FCC part 15, EN50065, and ARIB-based methods
7.ST7590Next Generation Circuit9–95 (kHz)128 kbpsDifferential binary phase shift keying, differential quadrature phase shift keying and differential-8-phase shift keying96-sub-carriers using OFDM, improved signal to noise ratio and convolutional coding method also using Vetarbi decoding
8.IT700Next Generation CircuitCENELEC bands, ARIB and FCC2.5 kbpsDifferential code shift keyingDynamic communication method
9.IT900Next Generation CircuitDCSK TURBO CENELEC-A band, ARIB and FCC1.25–500 kbpsDifferential code shift keyingRe-configurable data rate
10.LinkSprite spyderNext Generation Circuit144–262 (kHz)30 kbpsFrequency-shift keyingCan be used for AC and DC Lines
11.MAX2992Next Generation Circuit34–90 (kHz)300 kbpsDifferential binary phase shift keying, Differential quadrature phase shift keying and differential-8-phase shift keyingUses only half duplex communication with asynchronous mode and G3-PLC
Publisher’s Note: MDPI stays neutral with regard to jurisdictional claims in published maps and institutional affiliations.

