
Optimization and Control of Renewable Energy Integrated Cogeneration Plant Operation by Design of Suitable Energy Storage System


Abstract
:1. Introduction
- To investigate the challenge of achieving full capacity utilization of RE integrated with existing industrial cogeneration.
- To establish a Breakeven Point (BEP) beyond which RE utilization becomes inefficient by developing an algorithm using a suitable heuristic technique.
- To establish a comparative analysis of RE storage options available and determine suitable technique to store RE beyond the BEP.
- To develop and Simulate Mathematical modeling using MATLAB to balance energy flows including energy storage and discharge devices to maximize RE capacity utilization.
2. Methods and Materials
2.1. Methodology
2.2. Description of Identified Renewable Energy Integrated Cogeneration Plant
2.3. Operational Constraints Developed after Integration of Renewable Energy
- (a)
- To maintain no export or import condition, with an increase in solar, the power export/import controller reduces the TG generation. For reducing the power generation from the TGs, the HP control valve goes to a close position, but to maintain constant HP extraction pressure, the LP control valve closes, thereby pressurizing the HP chamber. To maintain LP steam pressure, a control valve external to the turbine adjusts until the margin is available. The reverse phenomenon happens with the reduction of solar generation.
- (b)
- When TG inlet flow declines, the main steam header pressure controller controls the coal feeder speeds to reduce the boiler steam generation. With coal flow variations, the primary air flow varies. Correspondingly the total airflow to the furnace also gets reduced to maintain the flue gas oxygen levels. Hence, furnace disturbances and unburnt residues increase. This increases the system inefficiencies and furnace stability problems.
- (c)
- SG and TG parameter variations are closed cycles in nature. Thus, the cogeneration plant, which was operating very steadily before the integration with the solar plant become unstable and introduced inefficiencies after integration.
- Power loss reduction due to reduction of HP and LP extraction flows (X) + throttling loss in PRDS of HP/LP steam, say 2% of X < 0.35% of solar incremental power i.e., if 1.02 X < 0.35% of solar incremental power.
- Steam flow with SG > minimum threshold value.
2.4. Estimation of Breakeven Point through Practical Experimentation
2.5. Estimation of Breakeven Point through Mathematical Modeling and Forward Approach Algorithm
2.6. Techno-Economic Analysis of Energy Storage Technologies for Selection of Suitable Storage Device
2.6.1. Description of Available Energy Storage Technologies
- (1).
- Electrochemical storage
- Lithium-ion battery
- Nickel Cadmium (Ni-Cd) battery
- Sodium sulfur battery
- Lead-acid battery
- Redox flow battery
- (2).
- Mechanical storage
- Compressed air energy storage
- Pumped hydro energy storage
- Flywheel energy storage
- (3).
- Mechanical storage
- Hydrogen
- Methane
- (4).
- Thermal storage
- Sensible heat storage
- Latent heat storage
- Thermo-chemical energy storage
- (5).
- Electrical storage
- Electrostatic energy storage including capacitors and supercapacitors
- Magnetic/current energy storage including SMES
2.6.2. Electrochemical Energy Storage (ECES)
Lithium-Ion Batteries (LIB)
Nickel Cadmium
Sodium Sulphur Batteries (SSB)
Lead-Acid Batteries
Redox Flow Batteries (RFB)
Technical Characteristics of Electrochemical Storage Systems
2.6.3. Mechanical Storage
Compressed Air Energy Storage (CAES)
Pumped Hydro Energy Storage (PHES)
Flywheel
Technical Characteristics of Mechanical Storage Systems
2.6.4. Chemical Storage
Hydrogen
Methane
Technical Characteristics of Chemical Storage Systems
2.6.5. Thermal Storage
Sensible Heat Storage (SHS)
Latent Heat Storage (LHS)
Thermo-Chemical Energy Storage (TCES)
Technical Characteristics of Thermal Storage Systems
2.6.6. Electrical storage
Capacitors
Supercapacitors (Ultracapacitor)
Superconducting Magnetic Energy Storage Systems (SCMESS)
Technical Characteristics of Electrical Storage Systems
2.6.7. Economic Characteristics of Energy Storage Systems
CR.a = CRF × ∑ (1 + i)−kt × [(CR × h)/ηsys] (€/kW-year.)
K = 1
3. Results
3.1. Practical Experimental Results to Estimate BEP
3.1.1. Cost-Benefit Analysis When Full Solar Plant in Operation
3.1.2. Cost-Benefit Analysis When the Part Solar Plant in Operation
3.2. Mathematical Modeling Results to Estimate BEP
3.3. Determination of Suitable Storage Device Based on Techno-Economic Analysis of Storage Systems
3.3.1. Selection of Hydrogen or Batteries for Energy Storage—Net Energy Analysis
3.3.2. Selection of Battery Storage Device Based on Techno-Economic Analysis
3.4. Design of Storage System to Optimize Renewable Energy Integrated Cogeneration Plant
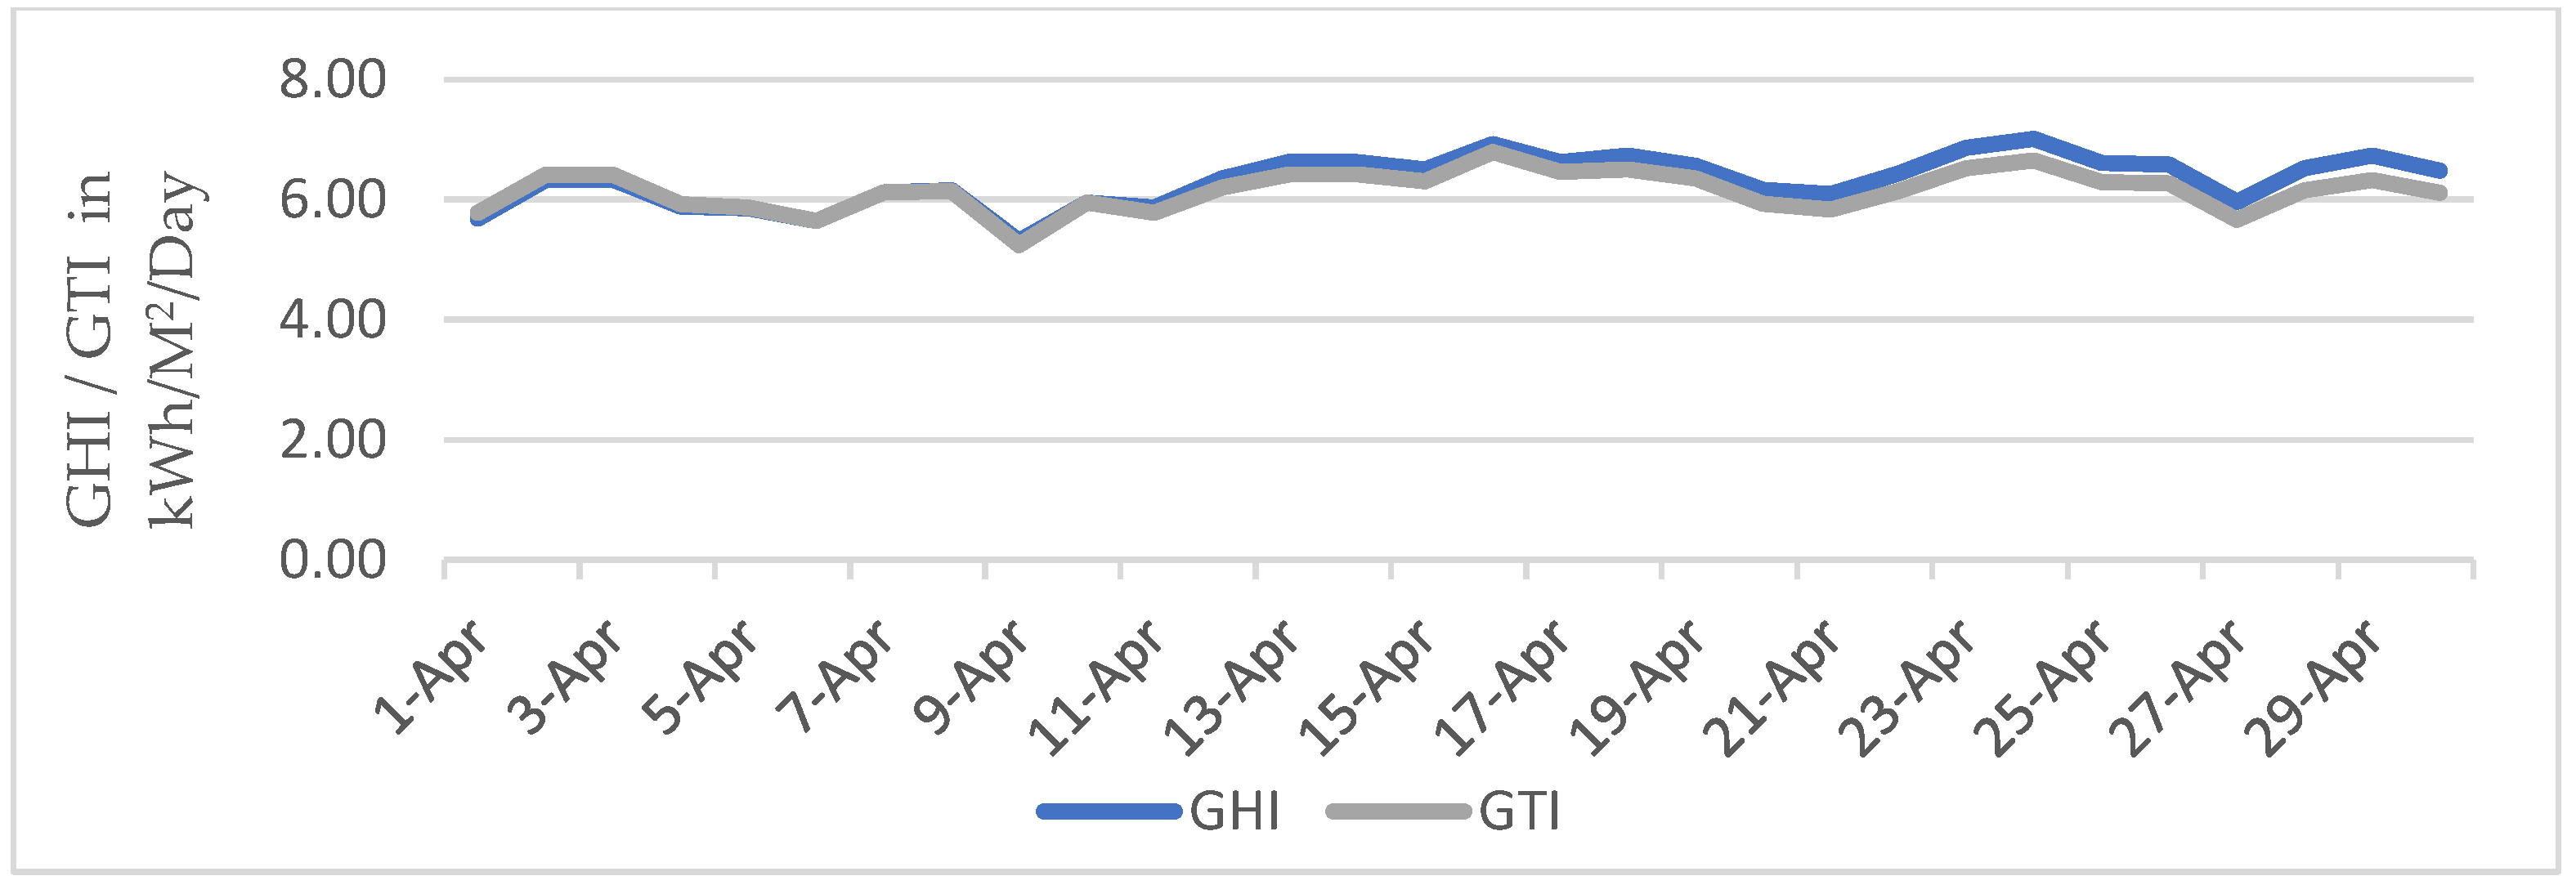
3.4.1. PV Output Power Estimation using GHI/GTI
3.4.2. Control of Storage System
4. Discussion
5. Conclusions
Author Contributions
Funding
Institutional Review Board Statement
Informed Consent Statement
Data Availability Statement
Conflicts of Interest
References
- Manikyala Rao, A.; Singh, A.K.; Mrudula, A.S. Case study on Renewable energy integration (Solar) challenges with Captive/Cogeneration plants and optimization of plant operation. In Proceedings of the 3rd International Conference on Intelligent Circuits and Systems, (ICICS 2020), Punjab, India, 26–27 June 2020; pp. 11–19. [Google Scholar]
- Shao, C.; Li, C.; You, X.; Wu, H.; Zhang, J.; Ding, Y.; Song, Y. Optimal coordination of CHP plants with renewable energy generation considering substitutability between electricity and heat. Energy Procedia 2016, 103, 100–105. [Google Scholar] [CrossRef]
- Abdollahi, E.; Wang, H.; Rinne, S.; Lahdelma, R. Optimization of energy production of a CHP plant with heat Storage. In Proceedings of the IEEE Green Energy and Systems Conference (IGESC 2014), Long Beach, CA, USA, 24 November 2014; pp. 30–34. [Google Scholar]
- Kahlert, S.; Spliethoff, H. Investigation of different operation strategies to provide Balance Energy with an Industrial Combined Heat and Power Plant using Dynamic Simulation. J. Eng. Gas Turbines Power 2017, 139, 011801-1–011801-8. [Google Scholar] [CrossRef]
- Werner, F.; Burtseva, L.; Sotskov, Y.N. Special Issue on Exact and Heuristic Scheduling Algorithms. Algorithms 2020, 13, 9. [Google Scholar] [CrossRef] [Green Version]
- Cagri, K.; Eren, O.; Saadettin, E.K.; Zeynel, A.C.; Suleiman, M. Forward supply chain network design problem: Heuristic approaches. Pamukkale Univ. J. Eng. Sci. 2018, 24, 749–763. [Google Scholar]
- Saxena, D.; Malik, N.K.; Singh, V.R. A cognitive approach to solve water jugs problem. Int. J. Comput. Appl. 2015, 124, 45–54. [Google Scholar] [CrossRef]
- Kumar, J.N.; Suryanarayanan, R.; Chitra, P.; Dharmalingam, P.; Prabhu, H.R.; Velayutham, V. Co-generation. In Guidebook 2 for National Level Certification Examination for Energy Managers and Energy Auditors—Energy Efficiency in Thermal Utilities, 4th ed.; Bureau of Energy Efficiency: New Delhi, India, 2015; Chapter 7; pp. 189–214. [Google Scholar]
- Kumar, J.N.; Suryanarayanan, R.; Chitra, P.; Dharrmalingam, P.; Prabhu, H.R.; Velayutham, V. Energy performance assessment of cogeneration systems. In Guidebook 4 for National Level Certification Examination for Energy Managers and Energy Auditors—Energy Performance Assistance for Equipment and Utility Systems, 4th ed.; Bureau of Energy Efficiency: New Delhi, India, 2015; Chapter 3; pp. 41–52. [Google Scholar]
- Rout, I.S.; Gaikwad, A.; Verma, V.K.; Tariq, M. Thermal Analysis of Steam Turbine Power Plants. IOSR J. Mech. Civ. Eng. 2013, 7, 28–36. [Google Scholar] [CrossRef]
- Sumanta Basu. Modeling of Steam Turbine Generators from Heat Balance Diagram and determination of frequency response. Control Sci. Eng. 2018, 2, 1–15. [Google Scholar] [CrossRef]
- More, P.S.; Aijaz, A. Thermal Analysis of Energy and Exergy of Back Pressure Steam Turbine in Sugar Cogeneration Plant. Int. J. Emerg. Technol. Adv. Eng. 2014, 4, 674–682. [Google Scholar]
- Kumar, J.N.; Suryanarayanan, R.; Chitra, P.; Dharmalingam, P.; Prabhu, H.R.; Velayutham, V. Financial Management. In Guidebook 1 for National Level Certification Examination for Energy Managers and Energy Auditors—General Aspects of Energy Management and Energy Audit, 4th ed.; Bureau of Energy Efficiency: New Delhi, India, 2015; Chapter 7; pp. 163–188. [Google Scholar]
- Pascual, N.; Sison, A.M.; Gerardo, B.D.; Medina, R. Calculating Internal Rate of Return (IRR) in Practice using improved Newton Raphson’s Algorithm. Philipp. Comput. J. 2018, 13, 17–24. [Google Scholar]
- Gustavsson, J. Energy Storage Technology Comparison—A Knowledge Guide to Simplify Selection of Energy Storage Technology. Bachelor’s Thesis, KTH School of Industrial Engineering and Management Energy Technology, Stockholm, Sweden, 2016; pp. 1–36. [Google Scholar]
- Sharma, S.S.; Kumar, V.; Joshi, R.R. An Overview on Energy Storage Options for Renewable Energy Systems. In Proceedings of the National Conference, ITM, Bhilwara, Rajasthan, 10–11 September 2010. [Google Scholar]
- Hussein, I.; Adrian, I. Techno Economic Analysis of Different Energy Storage Technologies. In Energy Storage-Technologies and Applications; Intech Open: London, UK, 2013; Chapter 1; pp. 1–40. [Google Scholar] [CrossRef] [Green Version]
- Bartek, A.G.; Emma, S.H. Energy Storage Technology for Decentralized Energy Management: Future Prospects. In Energy Management of Distributed Generation Systems; Intech Open: London, UK, 2016; Chapter 8; pp. 183–200. [Google Scholar] [CrossRef] [Green Version]
- Grigorios, L.K.; Garyfallos, A. Electrical energy storage systems in electricity generation: Energy policies, innovative technologies, and regulatory regimes. Renew. Sustain. Energy Rev. 2016, 56, 1044–1067. [Google Scholar] [CrossRef]
- Annette, E.; Vladimir, S.; Tim, J.E. Assessment of utility energy storage options for increased renewable energy penetration. Renew. Sustain. Energy Rev. 2012, 16, 4141–4147. [Google Scholar] [CrossRef]
- Surender, R.S.; Chan-Mook, J. Comparative analysis of storage techniques for a grid with renewable energy sources. Int. J. Eng. Technol. 2018, 7, 970–976. [Google Scholar] [CrossRef]
- Ghenai, C.; Janajreh, I. Comparison of energy storage options and determination of suitable technique for solar power systems. In Proceedings of the SASEC2015 Third Southern African Solar Energy Conference, Skukuza, South Africa, 11–13 May 2015; pp. 204–210. [Google Scholar]
- Henok, A.B.; Maarten, M.; Thierry, C.; Maitane, B.; Kinde, A.F.; Abraham, A.K.; Joeri, V.M. A Review of Energy Storage Technologies Application Potentials in Renewable Energy Sources Grid Integration. Sustainability 2020, 12, 10511. [Google Scholar] [CrossRef]
- Dimitris, K.; Irini, D. Comparing electricity storage technologies for small insular grids. Sci. Direct Energy Procedia 2019, 159, 84–89. [Google Scholar]
- Upendra Roy, B.P.; Rengarajan, N. Feasibility study of an energy storage system for distributed generation system in islanding mode. J. Energy Resour. Technol. 2017, 139, 011901. [Google Scholar] [CrossRef]
- Behnam, Z.; Sanna, S. Electrical energy storage systems: A comparative life cycle cost analysis. Renew. Sustain. Energy Rev. 2015, 42, 569–596. [Google Scholar]
- Patrik, L.; Philip, B. Cost models for Battery Energy Storage Systems. Bachelor’s Thesis, KTH School of Industrial Engineering and Management Energy Technology, Stockholm, Sweden, 2018; pp. 1–28. [Google Scholar]
- Pellow, M.A.; Emmott, C.J.; Barnhart, C.J.; Benson, S.M. Hydrogen or batteries for grid storage? A net energy analysis. Energy Environ. Sci. R. Soc. Chem. 2015, 8, 1938–1952. [Google Scholar] [CrossRef] [Green Version]
- Barnhart, C.J.; Dale, M.; Brandt, A.R.; Benson, S.M. The energetic implications of curtailing versus storing solar and wind generated electricity. Energy Environ. Sci. 2013, 6, 2804–2810. [Google Scholar] [CrossRef] [Green Version]
- Moien, A.O.; Marwan, M.M. Design and Simulation of a PV System Operating in Grid-Connected and Stand-Alone Modes for Areas of Daily Grid Blackouts. Int. J. Photo Energy 2019, 2019, 5216583. [Google Scholar] [CrossRef]
- Purnima, P.; Ravendra, G.; Srinivas, J. Power and Energy Rating Considerations in Integration of Flow Battery with Solar PV and Residential Load. Batteries 2021, 7, 62. [Google Scholar] [CrossRef]
- Chung, M.H. Estimating Solar Insolation and Power Generation of Photovoltaic Systems Using Previous Day Weather Data. Adv. Civ. Eng. 2020, 2020, 8701368. [Google Scholar] [CrossRef]
- Nurul, A.; Naamandadin; Chew, J.M.; Wan, A.; Mustafa. Relationship between Solar Irradiance and Power Generated by Photovoltaic Panel: Case Study at UniCITI Alam Campus, Padang Besar, Malaysia. J. Adv. Res. Eng. Knowl. 2018, 5, 16–20. [Google Scholar]
- Akif, K.; Harun, O.; Metin, K. Temperature and Solar Radiation Effects on Photovoltaic Panel Power. J. New Results Sci. 2016, 12, 48–58. [Google Scholar]
- Nahidul, H.S.; Norhafizan, B.A.; Imtiaz, A.C.; Zahari, B.T. Modeling, Control, and Simulation of Battery Storage Photovoltaic-Wave Energy Hybrid Renewable Power Generation Systems for Island Electrification in Malaysia. Sci. World J. 2014, 2014, 436376. [Google Scholar]
- Aastha, K.; Sharma, A. Optimal Charge/Discharge Scheduling of Battery Storage Interconnected with Residential PV System. IEEE Syst. J. 2019, 14, 3825–3835. [Google Scholar]
- Ayman, B.A.; Adam, V. Operation and Control of a Hybrid Power Plant with the Capability of Grid Services Provision. Energies 2021, 14, 3928. [Google Scholar] [CrossRef]
- Imene, Y.; Natalia, V.D.L.P. Energy Management Strategy for an Autonomous Hybrid Power Plant Destined to Supply Controllable Loads. Sensors 2022, 22, 357. [Google Scholar] [CrossRef]
- Sercan, T.; Mesut, E.B.; Subhashish, B.; Alex, Q.H. Rule-Based Control of Battery Energy Storage for Dispatching Intermittent Renewable Sources. IEEE Trans. Sustain. Energy 2010, 1, 117–124. [Google Scholar]


| Variables | Constants |
|---|---|
| SGFi = Steam Generator Flow at instant i TGFi = Turbo Generator Flow at instant i HRi = Heat Rate of a system at instant i SRi = Steam Rate of a system at instant i HPEXFi = HP Extraction Flow through turbine at instant i LPEXFi = LP Extraction Flow through turbine at instant i HPPRDSFi = HPPRDS Flow at instant i LPPRDSFi = LPPRDS Flow at instant i HPPSFi = HP Part Steam flow of a turbine at instant i LPPSFi = LP part Steam flow of a turbine at instant i PLHPXi = Power Loss in Mw due to steam flow through HPPRDS PLLPXi = Power Loss in Mw due to steam flow through LPPRDS PLTXi = Total Power loss in Mw due to steam flow through HP & LP PRDS HPSPPi = HP Steam to Process Plant at 32 kg/cm2, 238 °C LPSPPi = LP Steam to Process Plant at 8 kg/cm2, 178 °C DMWFi = DM Water Flow to deaerator BEP = Breakeven Point GIMi = Grid Import at instant i EGi = Electrical Generation in MW BFWFi = Boiler Feed Water Flow at instant i | TGE =Turbo Generator inlet steam Enthalpy at 100 kg/cm2, 480 °C = 794 kcal/kg HPSE = Turbo Generator HP Extraction Steam Enthalpy at 32 Kg/cm2, 347 °C = 747 kcal/kg LPSE = Turbo Generator LP Extraction Steam Enthalpy at 8 Kg/cm2, 238 °C = 694 kcal/kg 1 Kwh = 860 Kcal DMWE = DM Water Enthalpy = 33 kcal/kg HPRCF = HP Return Condensate Flow =150 MT/h. LPRCF = LP Return Condensate Flow =20 MT/h. HPRCE = HP Return Condensate Flow Enthalpy = 235 kcal/kg LPRCE = LP Return Condensate Flow Enthalpy = 100 kcal/kg DMWE = DM Water Enthalpy = 33 kcal/kg BFWE = Boiler Feed Water Enthalpy = 158 kcal/kg X = Renewable Energy installed capacity in Mw = 12 |
| Technical Characteristic | Li-Ion | Ni-Cd | Sodium Sulfur | Lead-Acid | Redox Flow |
|---|---|---|---|---|---|
| Capacity [MWh] | 0.25–25 [15] | - | ≤300 [15] | 0.25–50 [15] | ≤10 [15] |
| Power rating [MW] | 0.001–0.1 [15] | 0–40 [17] | 1–50 [15] | 0–40 [15] | 0.03–7 [15] |
| Discharge time | Minutes-hours [17] | Seconds-hours | Seconds-hours | Seconds-hours | Seconds-hours |
| Energy density [Wh/kg] | 75–200 [17] | 50–75 [17] | 150–240 [17] | 30–50 [17] | 10–30 [17] |
| Power density [W/kg] | 150–315 [17] | 150–300 [17] | 150–230 [17] | 75–300 [17] | - |
| Efficiency [%] | 85–100 [15] | - | 75–90 [15] | 70–90 [15] | 75–85 [15] |
| Lifetime [Years] | 5–15 [17] | 10–20 [17] | 10–15 [17] | 5–15 [17] | 5–10 [17] |
| Cycle life [cycles] | 1000–4500 [15] | 2000–2500 [17] | 2500 [15] | 500–1000 [15] | 12,000 [15] |
| Self-discharge per day | 0.1–0.3% [17] | 0.2–0.6% [17] | ≈20% [17] | 0.1–0.3% [17] | Small [17] |
| Storage duration | Minutes-Days [17] | Minutes-Days | Seconds-hours | Minutes-Days | Hours-months [17] |
| Response time | 20 ms-s [23] | 20 ms-s [23] | 1 ms-s [23] | 5–10 ms [23] | s [23] |
| Discharge duration at max. power | 1–8 h [16] | 1–8 h [16] | 1–8 h [16] | 1–8 h [16] | 1–8 h [16] |
| Maturity | Commercialized | Very mature | Commercialized | Mature | Demo [15] |
| Operating temperature | - | - | - | High 0–100 °F [4] | - |
| Environment influence | - | - | - | Negative [17] | Negative [17] |
| Technical Characteristic | Compressed Air Storage | Pumped Hydro Storage | Fly Wheel Storage |
|---|---|---|---|
| Capacity [MWh] | ≤250 [15] | ≤5000–140,000 [15] | |
| Power rating [MW] | 5–300[15] | <3100 [15] | 0–0.25 [17] |
| Discharge time | 1–24 h [17] | 1–24 h [17] | ms–15 min [17] |
| Energy density Wh/kg] | 30–60 [17] | 0.5–1.5 [17] | 10–30 [17] |
| Power density [W/kg] | - | - | 400–1500 [17] |
| Efficiency [%] | 60–79 [15] | 65–82 [15] | 93–95 [20] |
| Lifetime [Years] | 20–40 [17] | 40–60 [17] | ≈ 15 [17] |
| Cycle life [cycles] | 8000–12,000 [15] | 10,000–30,000 [15] | |
| Self-discharge per day | Small [17] | Very small [17] | 100%[17] |
| Storage duration | Hours-months [17] | Hours-months [17] | Seconds-minutes [17] |
| Response time | 1–15 min [23] | s-min [23] | <4 ms-s [23] |
| Discharge duration at max. power | 4–24 h [16] | 12 h [16] | Minutes–1 h [16] |
| Maturity | Demo [15] | Mature | Commercializing [23] |
| Operating temperature | Normal atm [16] | Normal atm [16] | Normal atm [16] |
| Environment influence | Negative [17] | Negative [17] | Almost none [17] |
| Technical Characteristic | Hydrogen Storage Fuel Cell | Methane Storage |
|---|---|---|
| Capacity [MWh] | Varies [15] | Varies [15] |
| Power rating [MW] | Varies [15] | Varies [15] |
| Discharge time | Seconds–24 h | - |
| Energy density Wh/kg] | 800–10,000 [17] | - |
| Power density [W/kg] | 500+ [17] | - |
| Efficiency [%] | 20–50 [15] | 28–45 [15] |
| Lifetime [Years] | 5–15 [17] | - |
| Self-discharge per day | Almost zero [17] | - |
| Storage duration | Hours-months [17] | Hours-months [17] |
| Response time | Good < 1 s [20] | - |
| Discharge duration at max. power | Hours as needed [16] | Hours as needed |
| Maturity | Commercializing [23] | Demo [15] |
| Operating temperature | 50–120 °C [16] | - |
| Environment influence | Benign [17] | - |
| Technical Characteristic | Sensible Heat Storage | Latent Heat Storage | Thermo-Chemical Storage |
|---|---|---|---|
| Power rating [MW] | 0.001–10 [15] | 0.001–1 [15] | 0.01–1 [15] |
| Discharge time | 1–8 h [17] | 1–24 h [17] | 1–8 h [17] |
| Energy density Wh/kg] | 80–120 [17] | 80–200 [17] | 150–250 [17] |
| Power density [W/kg] | - | - | 10–30 [17] |
| Efficiency [%] | 50–90 [15] | 75–90 [15] | 75–100 [15] |
| Lifetime [Years] | 10–20 [17] | 5–15 [17] | 20–40 [17] |
| Self-discharge per day | 0.5% [17] | 0.5–1.0% [17] | 0.5–1.0% [17] |
| Storage duration | Minutes-Days [17] | Minutes-months [17] | Minutes-Days [17] |
| Maturity | Commercialized [15] | Commercialized [15] | Commercialized [15] |
| Environment influence | Small [17] | Small [17] | - |
| Technical Characteristic | Capacitors Storage | Super Capacitors Storage | Super Conducting Magnetic Storage |
|---|---|---|---|
| Power rating [MW] | 0–0.05 [17] | 0–0.3 [17] | 0.1–10 [17] |
| Discharge time | Milliseconds-60 min [17] | Ms–60 min [17] | Milliseconds–8 s [17] |
| Energy density Wh/kg] | 0.05–5 | 20+ [17] | 0.5–5 [17] |
| Power density [W/kg] | ≈100,000[17] | 100,000+ [17] | 500–2000 [17] |
| Efficiency [%] | 60–65 [20] | 90–95 [20] | 95–98 [20] |
| Lifetime [Years] | ≈5 [17] | 10–30 [17] | 20+ [17] |
| Cycle life [cycles] | 50,000+ [17] | 100,000+ [17] | 100,000+ [17] |
| Self-discharge per day | 40% [17] | 20–40% [17] | 10–15% [17] |
| Storage duration | Seconds-hours [17] | Seconds-hours [17] | Minutes-hours [17] |
| Response time | Very fast [20] | 8 ms [23] | <100 ms [23] |
| Maturity | Developed [20] | Commercializing [23] | Commercializing [23] |
| Environment influence | Small [17] | Small [17] | Negative [17] |
| S. No | Electrical Energy Storage System | TCC * (Average Value) €/kW | Fixed O & M Costs Average €/kW-Year. | CO&M.a (Average Value) €/MWh. | CR.a €/kWh | ALCC ** €/kW-Year. | (LCOE) €/ MWh |
|---|---|---|---|---|---|---|---|
| 1 | PHS | 1406 | 4.6 | 0.22 | - | 239 | 120 |
| 2 | CAESunder above | 893 1315 | 3.9 2.2 | 2.2 3.1 | - | 269 319 | 134 159 |
| 3 | Fly wheel | 867 | 5.2 | 2.0 | - | - | |
| 4 | Lead acid | 1923 | 3.4 | 0.37 | 172 | 646 | 323 |
| 5 | NaS | 2254 | 3.6 | 1.8 | 180 | 487 | 244 |
| 5 | Li-ion | 1160 | 6.9 | 2.1 | 369 | 493 for T & D | 617 for T & D |
| 6 | VRFB | 2512 | 8.5 | 0.9 | 130 | 706 | 353 |
| 7 | Ni cd | 1093 | 10.9 | 11 | 525 | 842 | 421 |
| 8 | Super capacitors | 229 | - | - | - | - | - |
| 9 | SMES | 218 | - | - | - | - | - |
| 10 | Hydrogen Fuel cell | 3243 | 25.1 | - | - | 385 for T& D | 481 |
| 11 | Hydrogen GT | 1570 | 34.7 | - | - | 333 for T & D | 416 |
| S. No | Description | Data Prior to Solar | Data with Full Solar Plant | Data with Solar 6.3 Mw |
|---|---|---|---|---|
| (i) | 2 SGstotal steam generation | 330 MT/h | 300 MT/h (SG 1/2 165/135 MT/h) | 317 MT/h |
| (ii) | 2 TGS total generation | 31 MW | 19 MW (TG 1/215.5/3.5 MW) | 25.5 MW(TG 1/2 13.0/12.5) |
| (iii) | Auxiliary TG generation | 4 MW | 4 MW | 3.5 |
| (iv) | HP PRDS opening | Nil | 105 MT/h | Nil |
| (v) | LP PRDS opening | Nil | 10 MT/h | 7.2 MT/h |
| (vi) | HP steam before/after de-superheating | 210/245 MT/h | 210/245 MT/h (TG 1 105 MT/h PRDS 105 MT/h) | 210/245 MT/h (TG 1& TG2 105 MT/h each) |
| (vii) | LP steam before/after de-superheating | 20/25 MT/h. | 20/25 MT/h(TG 1 10 MT/h LP PRDS 10 MT/h) | 20/25 MT/h (TG 1 10 MT/hTG 2 8 MT/h LPPRDS 7 MT/h) |
| (viii) | Condensate flow | 85 MT/h | 70 MT/h | 70 MT/h |
| S. No | Solar Generation in MW | Total Steam Generation in MT/h | Steam Reduction on SGs with Solar in MT/h | Cost Saving Due to Steam Reduction in Rs |
|---|---|---|---|---|
| 1 | 6.3 | 317 | 13 | 9100 |
| 2 | 6.0 | 320 | 10 | 7000 |
| 3 | 5.5 | 321.6 | 8.4 | 5880 |
| 4 | 5.0 | 319 | 11 | 7700 |
| 5 | 4.5 | 321 | 9 | 6300 |
| 6 | 4.0 | 323.8 | 6.2 | 4340 |
| Parameters | EGi | GIMi | TGFi | HPEXFi | LPEXFi | HPPRDSFi | LPPRDSFi | LPPSFi |
|---|---|---|---|---|---|---|---|---|
| Unit | Mw | Mw | MT/h | MT/h | MT/h | MT/h | MT/h | MT/h |
| Initial values | 31 | 0 | 330 | 210 | 35 | 0 | 0 | 120 |
| Parameters | N = 0 | N = 1 | N = 2 | N = 3 | N = 4 | N = 5 | N = 6 | N = 7 |
|---|---|---|---|---|---|---|---|---|
| SGFi | 330 | 328.6202 | 327.2553 | 325.8673 | 324.4363 | 322.9539 | 321.4145 | 319.8127 |
| TGFi | 330 | 328.6202 | 326.7955 | 324.7311 | 322.5367 | 320.2426 | 317.8540 | 315.3673 |
| HPPSFi | 330 | 328.6202 | 326.7955 | 324.7311 | 322.5367 | 320.2426 | 317.8540 | 315.3673 |
| LPPSFi | 120 | 115.1708 | 113.6863 | 111.7538 | 109.5725 | 107.2534 | 104.8272 | 102.2987 |
| HPEXFi | 210 | 210 | 210 | 210 | 210 | 210 | 210 | 210 |
| LPEXFi | 35 | 35 | 34.3431 | 33.3769 | 32.2863 | 31.1267 | 29.9136 | 28.6494 |
| DMWFi | 50.2500 | 53.8029 | 53.5650 | 53.5372 | 53.6314 | 53.7676 | 52.9207 | 52.4836 |
| HPPRDSFi | 0 | 0 | 0 | 0 | 0 | 0 | 0 | 0 |
| LPPRDSFi | 0 | 0 | 0.6569 | 1.6231 | 2.7137 | 3.8733 | 5.0864 | 6.3506 |
| DOHPPRDSFi | 0 | 0 | 0 | 0 | 0 | 0 | 0 | 0 |
| DOLPPRDSFi | 0 | 0 | 0.6569 | 0.9662 | 1.0907 | 1.1595 | 1.2131 | 1.2643 |
| EGi | 31 | 30 | 29 | 28 | 27 | 26 | 25 | 24 |
| GIMi | 0 | 1 | 2 | 3 | 4 | 5 | 6 | 7 |
| LPSTC/CEPFi | 85 | 80.1708 | 79.3431 | 78.3769 | 77.2863 | 76.1267 | 74.9136 | 73.6493 |
| BFWFi | 331.65 | 330.2633 | 329.0886 | 327.9835 | 326.8726 | 325.7306 | 324.5475 | 321.7179 |
| PLHPXi | 0 | 0 | 0 | 0 | 0 | 0 | 0 | 0 |
| PLLPXi | 0 | 0 | 0.0777 | 0.1143 | 0.1290 | 0.1372 | 0.1435 | 0.1496 |
| PLTXi | 0 | 0 | 0.0777 | 0.1143 | 0.1290 | 0.1372 | 0.1435 | 0.1496 |
| DPSFi | 26.4000 | 26.2896 | 26.1804 | 26.0694 | 25.9549 | 25.8363 | 25.7132 | 25.5850 |
| HRi | 2.1731 × 10³ | 2.2203 × 10³ | 2.2687 × 10³ | 2.3214 × 10³ | 2.3775 × 10³ | 2.4369 × 10³ | 2.4999 × 10³ | 2.5750 × 10³ |
| SRi | 3.4494 | 3.5243 | 3.6012 | 3.6847 | 3.7737 | 3.8681 | 3.9681 | 4.0873 |
| S.No | Energy Storage System | Life Cycle λ | DOD (D) | Cradle-to-Gate Electrical Embodied Energy εe | ESOIe λ D/εe |
|---|---|---|---|---|---|
| 1 | Lithium-ion battery | 6000 | 80 | 136 | 35 |
| 2 | Sodium sulfur battery | 4750 | 80 | 146 | 26 |
| 3 | Lead acid battery | 700 | 80 | 96 | 5.8 |
| 4 | Redox flow battery | 2900 | 100 | 208 | 14 |
| 5 | Zinc bromide battery | 2750 | 80 | 151 | 15 |
| S. No | Period | Total Solar Radiation (kWh/M2/Month) | Average Radiation (GHI) (kWh/M2/Day) | Average Radiation (GTI) (kWh/M2/Day) | |
|---|---|---|---|---|---|
| (GHI) | (GTI) | ||||
| 1 | April 2019 | 189.46 | 184.57 | 6.315 | 6.152 |
| 2 | May 2019 | 181.78 | 167.01 | 5.864 | 5.387 |
| 3 | June 2019 | 147.79 | 133.77 | 4.926 | 4.459 |
| 4 | July 2019 | 127.77 | 112.5 | 3.928 | 3.629 |
| 5 | August 2019 | 111.57 | 106.44 | 3.597 | 3.434 |
| 6 | September 2019 | 118.21 | 118.90 | 3.940 | 3.963 |
| 7 | October 2019 | 144.66 | 157.02 | 4.666 | 5.065 |
| 8 | Novembr 2019 | 142.86 | 170.06 | 4.762 | 5.669 |
| 9 | December 2019 | 125.76 | 153.57 | 4.057 | 4.957 |
| 10 | January 2019 | 135.53 | 163.92 | 4.372 | 5.288 |
| 11 | February 2019 | 148.82 | 167.96 | 5.132 | 5.792 |
| 12 | March 2019 | 181.11 | 190.10 | 5.842 | 6.132 |
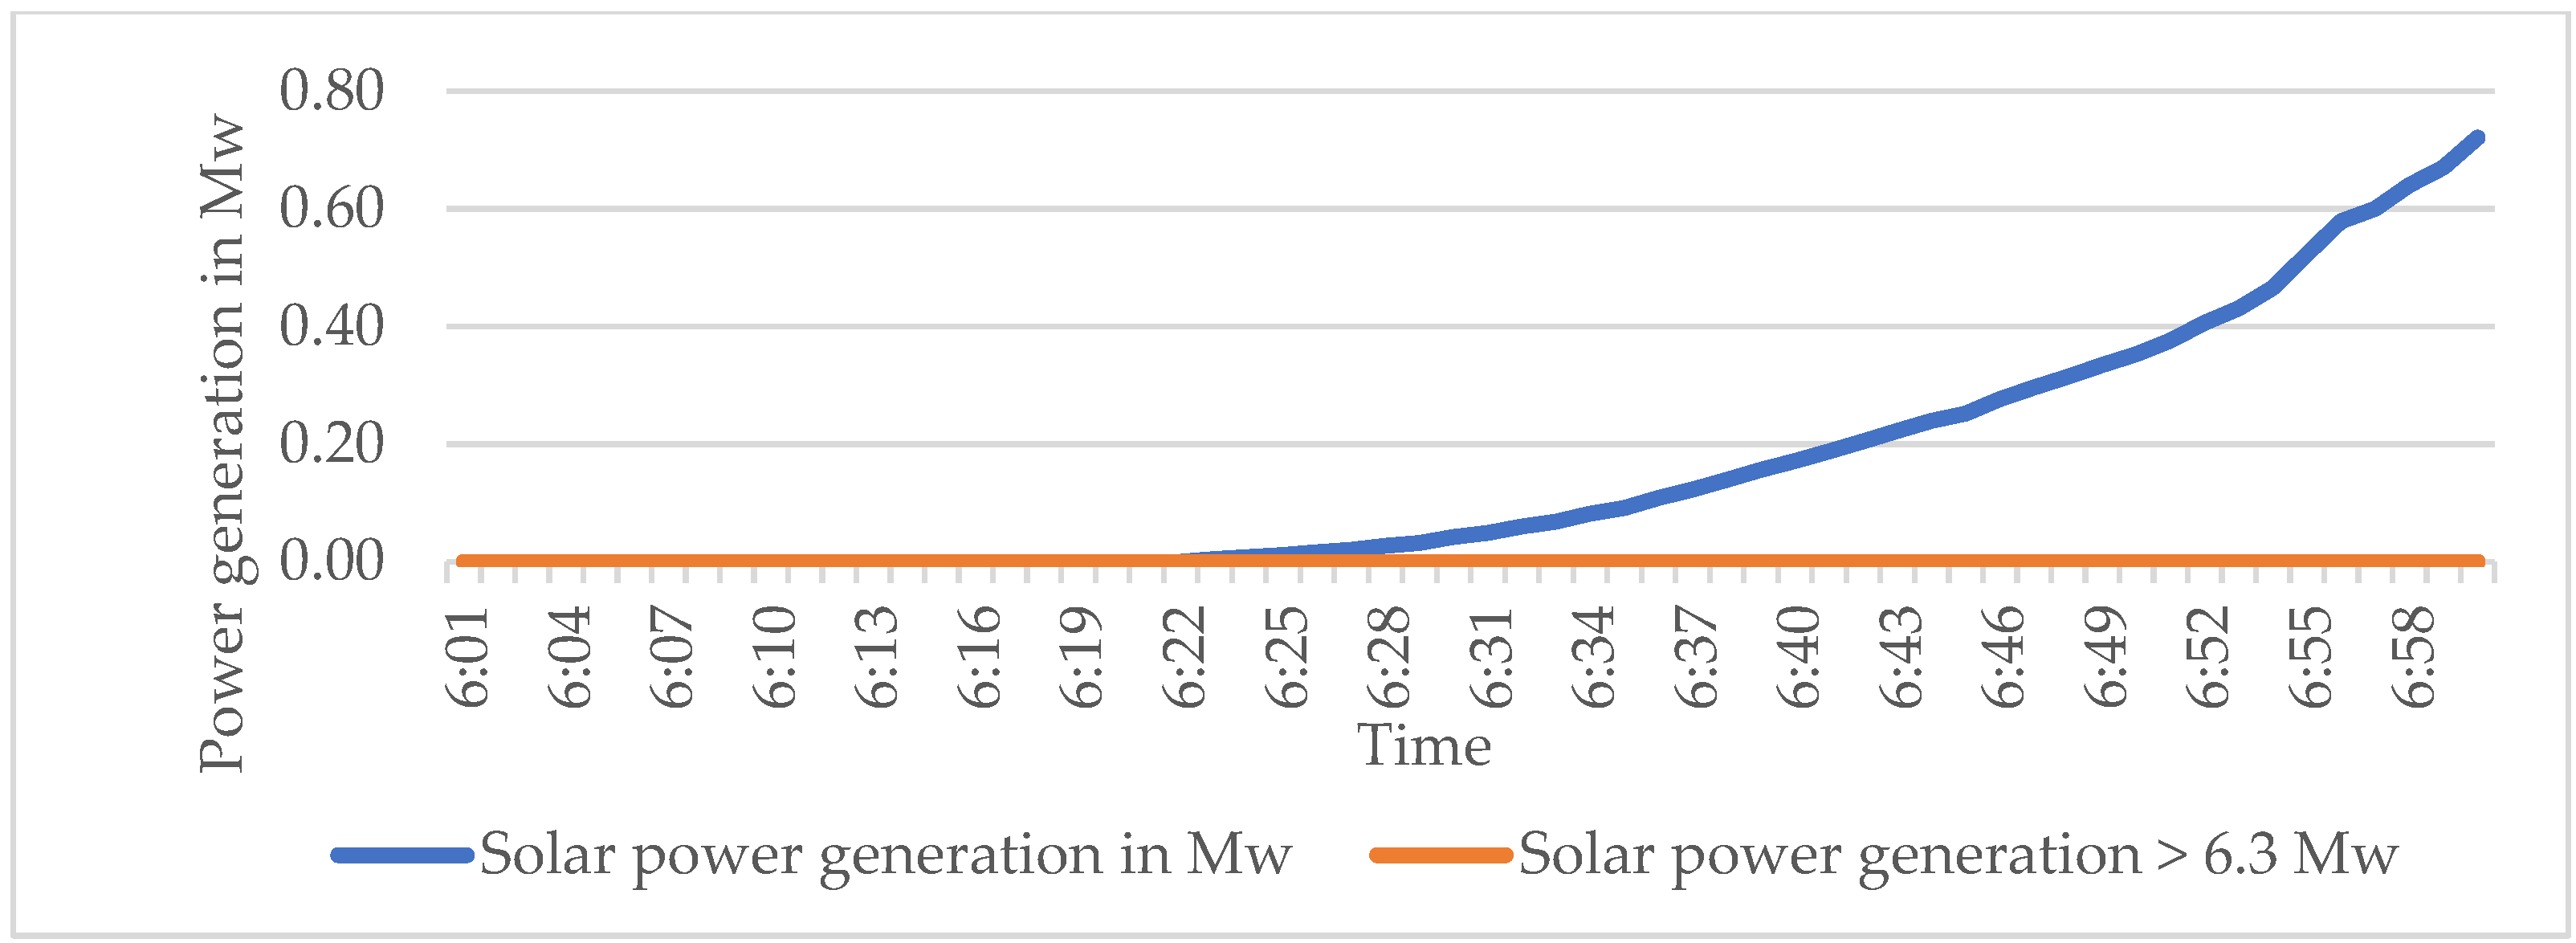
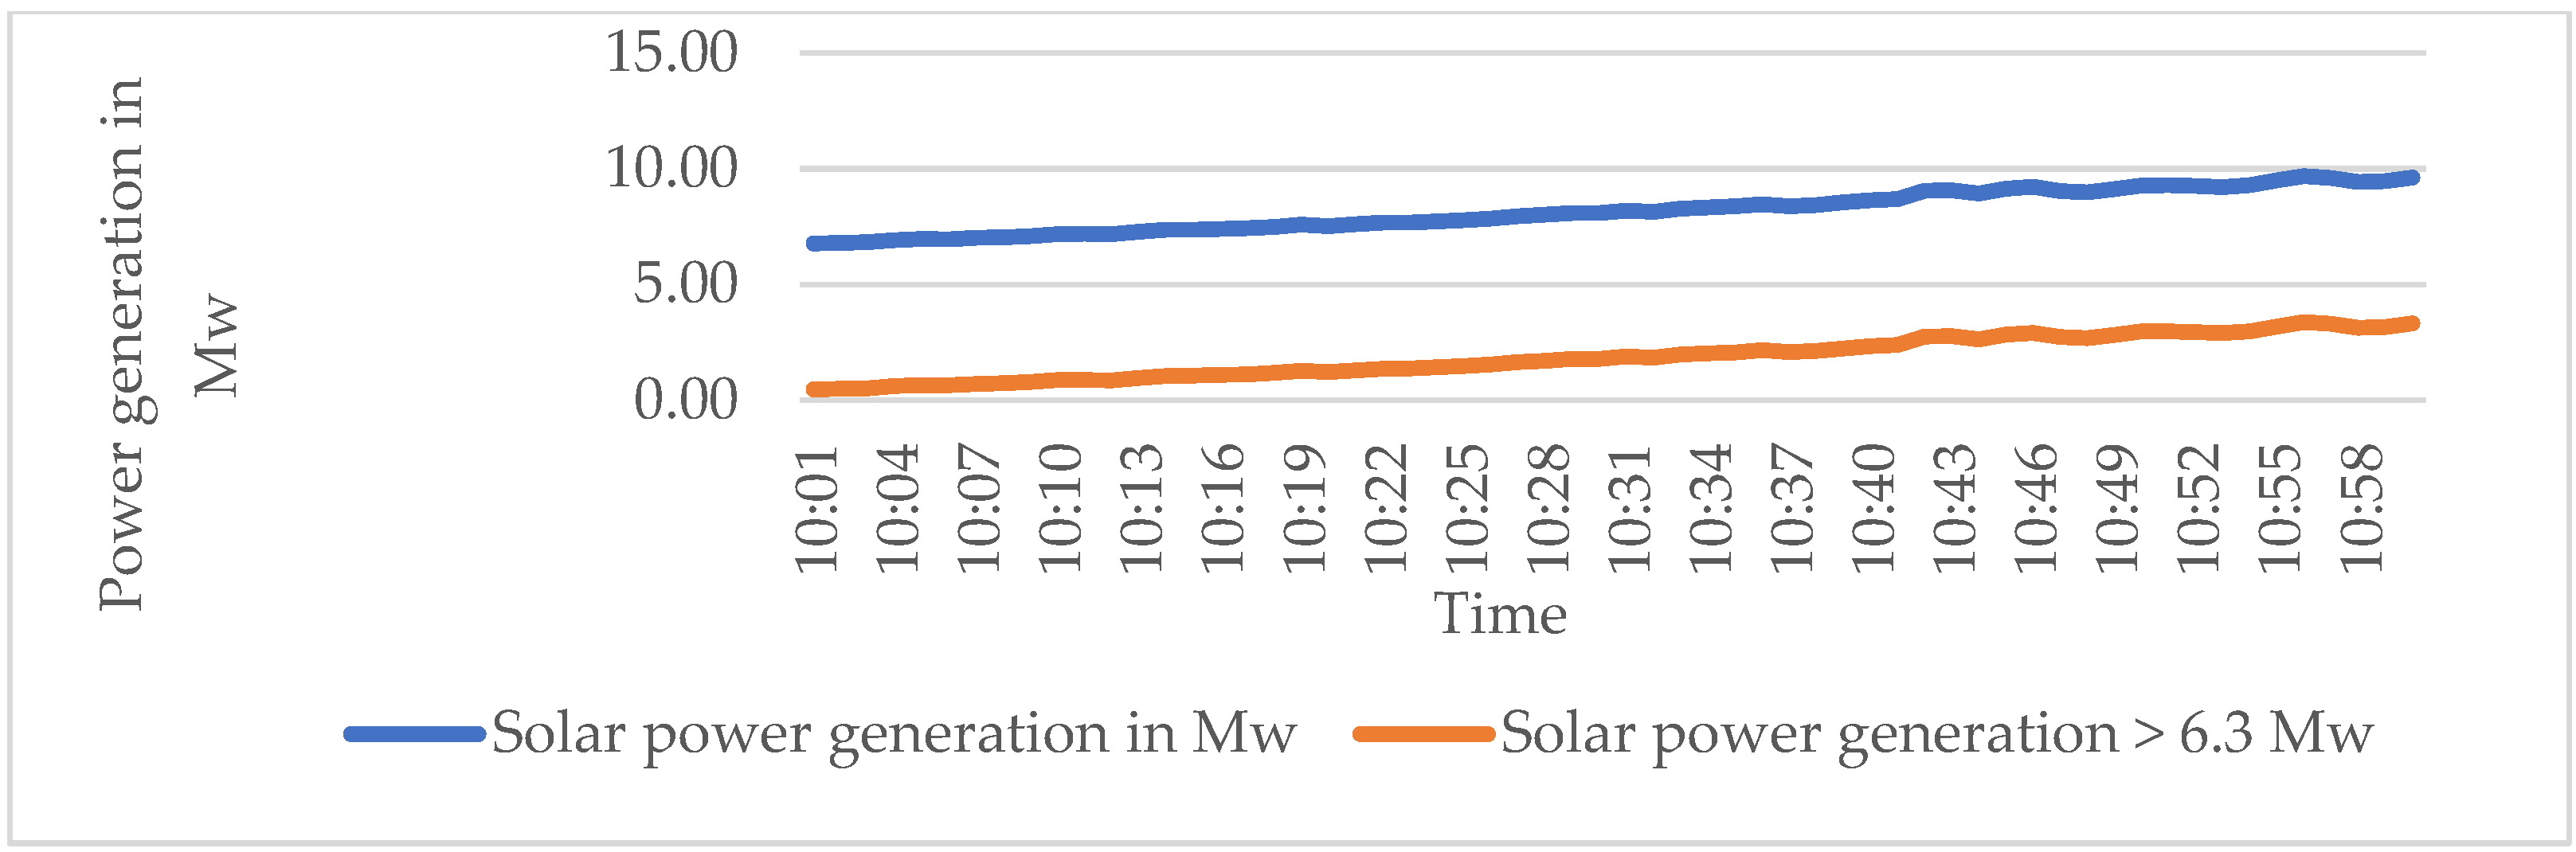
| S. No | Time | GHI (Wh/m2) | GTI (Wh/m2) | Average Temperature in °C | Estimated Solar Hourly Average Power in Mwh | Estimated Solar Hourly Average Power in Mw > BEP (6.3 Mw) |
|---|---|---|---|---|---|---|
| 1 | 6.01 a.m.–7.00 a.m. | 11.16 | 12.44 | 13.88 | 0.16 | 0 |
| 2 | 7.01 a.m.–8.00 a.m. | 130.41 | 163.14 | 19.5 | 1.99 | 0 |
| 3 | 8.01 a.m.–9.00 a.m. | 345.78 | 421.08 | 33.18 | 4.88 | 0 |
| 4 | 9.01 a.m.–10.00 a.m. | 583.51 | 586.41 | 43.55 | 6.55 | 0.258 |
| 5 | 10.01 a.m.–11.00 a.m. | 741.26 | 753.43 | 50.84 | 8.17 | 1.87 |
| 6 | 11.01 a.m.–12.00 a.m. | 809.46 | 983.85 | 51.94 | 10.63 | 4.33 |
| 7 | 12.01 a.m.–1.00 p.m. | 881.64 | 1029.49 | 52.31 | 11.11 | 4.8 |
| 8 | 1.01 p.m.–2.00 p.m. | 846.55 | 974.78 | 52.23 | 10.52 | 4.22 |
| 9 | 2.01 p.m.–3.00 p.m. | 721.06 | 827.71 | 50.03 | 9.01 | 2.71 |
| 10 | 3.01 p.m.–4.00 p.m. | 516.76 | 617.24 | 47.21 | 6.79 | 0.61 |
| 11 | 4.01 p.m.–5.00 p.m. | 283.37 | 354.91 | 39.54 | 4.02 | 0 |
| 12 | 5.01 p.m.–6.00 p.m. | 56.93 | 69.65 | 29.57 | 0.81 | 0 |
| Total | 5927.89 | 6794.13 | - | 74.64 | 18.798 | |
| S. No | Parameter | Unit | Comparison | |
|---|---|---|---|---|
| MATLAB Interpolation Data | Practical Experimentation Data | |||
| At 6.3 Mw | At 6.3 Mw | |||
| 1 | SG Flow | MT/h | 320.9340 | 317 |
| 2 | HP Extraction Flow | MT/h | 210 | 210 |
| 3 | LP Extraction Flow | MT/h | 29.5343 | 27.8 |
| 4 | HPPRDS Flow | MT/h | 0 | 0 |
| 5 | LPPRDS Flow | MT/h | 5. 7 | 7.2 |
| 6 | TG generation | Mw | 24.7 | 25.5 |
| 7 | Import/RE generation | Mw | 6.3 | 6.3 |
| 8 | Breakeven Point | Mw | 6.8718 | 6.3 |
Publisher’s Note: MDPI stays neutral with regard to jurisdictional claims in published maps and institutional affiliations. |
© 2022 by the authors. Licensee MDPI, Basel, Switzerland. This article is an open access article distributed under the terms and conditions of the Creative Commons Attribution (CC BY) license (https://creativecommons.org/licenses/by/4.0/).
Share and Cite
Manikyala Rao, A.V.R.N.B.; Singh, A.K. Optimization and Control of Renewable Energy Integrated Cogeneration Plant Operation by Design of Suitable Energy Storage System. Energies 2022, 15, 4590. https://0-doi-org.brum.beds.ac.uk/10.3390/en15134590
Manikyala Rao AVRNB, Singh AK. Optimization and Control of Renewable Energy Integrated Cogeneration Plant Operation by Design of Suitable Energy Storage System. Energies. 2022; 15(13):4590. https://0-doi-org.brum.beds.ac.uk/10.3390/en15134590
Chicago/Turabian StyleManikyala Rao, Ankem V. R. N. B., and Amit Kumar Singh. 2022. "Optimization and Control of Renewable Energy Integrated Cogeneration Plant Operation by Design of Suitable Energy Storage System" Energies 15, no. 13: 4590. https://0-doi-org.brum.beds.ac.uk/10.3390/en15134590