Article

Energy Management for an Air Conditioning System Using a Storage Device to Reduce the On-Peak Power Consumption

by
Wunvisa Tipasri
1,2,
Amnart Suksri
2,
Karthikeyan Velmurugan
1,2 and
Tanakorn Wongwuttanasatian
1,2,*
1
Department of Mechanical Engineering, Faculty of Engineering, Khon Kaen University, 123 Mittrapharp Rd., Khon Kaen 40002, Thailand
2
Centre for Alternative Energy Research and Development, Khon Kaen University, 123 Mittrapharp Rd., Khon Kaen 40002, Thailand
*
Author to whom correspondence should be addressed.
Submission received: 27 October 2022 / Revised: 24 November 2022 / Accepted: 24 November 2022 / Published: 25 November 2022

Abstract

:
To reduce the on-peak electrical power consumption, storage devices are widely performed with the help of an energy management system. According to IEA, residential air conditioning consumes 70% of the electricity, increasing by 4% every year. To minimize peak power consumption, thermal energy storage (TES) can be used to store cooled water for the air conditioning system. An efficient chilled water tank was designed and computationally investigated. Three-dimensional cylindrical tanks were simulated with seven different heights to diameter (H:D) ratios. At first, the temperature changes in a chilled water tank during discharging and charging periods were studied. An 11-h charging period was carried out during the off-peak time at night, while the discharging period was 13 h during the daytime. Under time constraints regarding peak and off-peak periods, a tank with an H:D = 2.0 can only be used for 13-h discharging. Then the chilled water was simulated with a set temperature of 4 °C during the charging. This resulted in the system being usable for six days, after which it had to be stopped for longer charging. A storage tank with an H:D ratio of 2.0 was found to be suitable for an air conditioning system. If six days of operations (one day off) were used, it could save 15.38% of electrical energy consumption and 51.65% of electricity cost. This saving leads to a 5.55-year payback period.

1. Introduction

Urbanization and digitalization increase global power consumption, and most nations depend on the conventional power-generating methods [1,2]. Non-renewable-based power generation techniques are economically reliable though it increases global warming and depletion of natural resources [3,4,5]. Pollutions from conventional power generation techniques majorly increase global temperatures and climate change [6]. Several nations are encouraging to implement the renewable-based power generation techniques to minimize the consumption of fossil fuels [7,8,9]. However, replacing conventional power generators is always a difficult option, especially for developing countries [10,11]. The initial investment in replacing conventional power generator with renewable energy systems is comparatively high; considering this issue, several nations are providing subsidies to promote renewable energy [12,13].
For developing countries, peak demand is an energy difficulty facing a higher peak every year. Well-planned peak demand must be carefully emphasized. For example, in 2019, Thailand expected 197,335 GWh electricity consumption (4.5% increase) and about 32,000 MW peak demand [14]. Climate change is one of the reasons causing higher peak demand. For Thailand, the average temperature is predicted to increase by 1.74–3.43 °C by 2080. This would result in a 1.5–3.1%, 3.7–8.3%, and 6.6–15.3% increase in peak demand in 2020, 2050, and 2080, respectively [15]. Based on recorded data, peak demand is increased by approximately 3% per year leading to 3 new power plants installed during 2019–2024. Thus, peak demand management must be a concern [16].
Air conditioning systems cause a large portion of electricity consumption, as high as 60% of the bill, for business sectors such as hotels, hospitals, and buildings [17]. Thermal energy storage (TES) technology has been integrated with air condition systems to reduce peak demand. The air conditioning system is operated during off-peak times, while the TES is used to cool the loads during peak times. This means that the electrical demand is switched to off-peak time. In addition, the electricity cost is cheaper during off-peak times than during peak times. Thus, not only is peak demand reduced, but the cost of electricity is lower too [18,19,20].
TES is classified as latent heat storage and sensible heat storage. For air conditioning applications, the TES possibilities are chilled water storage, ice storage, and phase change material (PCM) storage [21,22,23]. In 1989, Kubaha [24] studied the potential of using 200-m3 chilled water storage with an air conditioning system in a 380-room hotel. By operating with full storage mode, a savings of 5600 USD/year was obtained, giving a 9.1-year payback period. In 2010, Boonnasa and Namprakai [25] optimized chilled water storage in combination with an air conditioning system. They concluded that a 5175 m3 chilled water tank combined with two 450-TR chillers could reduce the peak demand by 31.2%. In total, 35.7% of the energy consumption was moved from peak to off-peak time. This change gave a payback period, internal rate of return, and the net present value of 10 years, 21% and USD 834,000, respectively. Zhang et al. [26] reported that a new naturally stratified chilled water storage tank (13,249 m3 volume), used as energy storage for four buildings, can save USD 907,231 on the electrical bill, and the simple payback period was 12.5 years. In 2013, Lin et al. [27] confirmed that chilled water storage as TES in conjunction with an air conditioning system could save 15–20% of the energy cost. In 2014, Sukha [28] used ice storage with an air conditioning system in a greenhouse. The system could keep the greenhouse temperature in the 15.1–20.4 °C range. A 36% energy savings was then gained. Similarly, in 2016, Yan et al. [29] reported using ice and chilled water storage to achieve 40% energy savings for an air conditioning system.
Additionally, chilled water storage was studied to handle cooling loads under hot and humid conditions. Scenarios of full loads and partial loads of two chillers were proposed. The author concluded that cold water storage could reduce about 30% of peak demand and prolong the life cycle of the chillers due to steady operation during the off-peak period [30]. Similarly, thermal storage tanks were studied in conjunction with chillers aiming to reduce peak demand and electricity costs. The peak demand was moved to the off-peak period during the night. Optimization of the chiller’s operations was made to handle the cooling loads and maintain the chiller’s performance at a high level. However, as the cold water could not serve the cooling loads for a whole day, operations of chillers were optimized under many assumptions, such as adiabatic and lossless TES, and an identical chiller’s COPs. The authors finally concluded that TES is a promising way to reduce the peak load and electrical cost with a reasonable investment [31]. In 2017, Gabriele Comodi et al. [32] reported the use of cold thermal storage integrated with air conditioning system. The authors concluded that partial operation of the cold-water storage could improve the efficiency of the cooling system. The limitation of cold water in a specific size of tank forced the partial operation mode. The sizing of the tank to be suitable for full-mode operation must be optimized. Moreover, thermal ice storage was computationally studied with an air conditioning system in order to reduce electricity consumption for a building in a tropical climate. Full and partial operations using the ice storage were investigated to serve the cooling loads. The authors concluded that under ideal specific assumptions, thermal ice storage could reduce electrical consumption by 11.83% and 10.23% as well as electrical costs by 32.65% and 13.45% for full and partial operation modes, respectively, due to shifting demand from peak to off-peak period [33]. Analysis of using thermal ice storage with an air conditioning system has also been reported by Na Luo et al. The authors found that ice storage could reduce electrical consumption and cost since the demand was shifted to the off-peak period with the time of use tariff. They also noted that the limitation of ice discharging during high cooling could result in the incapability of full operation mode. Thus, discharging and charging had to be optimized to achieve the best performance of the system [34].
Cold energy storage (CES) with various PCMs was investigated to use in conjunction with the condenser of an air conditioning unit. The aim was to use CES to cool the condenser and was expected to improve the air conditioning system performance. It was concluded that the system performance was improved, giving a power saving of 8–10% depending on the type of PCM, ambient temperature, and inlet air velocity [35]. In 2019, packed bed cold thermal storage was studied for use with an air conditioning system. The PCM balls filled with a selective mixture were placed in a cold TES and recommended to be used for storing energy from renewable sources as a microthermal grid. This suggestion can help to stabilize the grid disturbed by renewable sources [36]. In 2020, PCM-based TES was proposed to improve air conditioning performance in an automotive application. The compact finned box was designed and tested. The authors claimed that with the designed PCM-based TES, outlet air temperature could be kept around 18 °C for an hour, providing a backup or emergency service [37]. Moreover, these authors extended the heat transfer enhancement for both the air side and PCM side of the designed TES on a larger scale used in a building. Various finned surfaces were experimentally tested and showed a good guideline for TES used in air conditioning system [38].
It has been known that the storage tank plays an important role in a combined TES and air conditioning system. The size and dimensions of the tank can result in different temperature profiles for the working fluid inside the tank. They also affect using TES in a proper mode. There have been some studies related to the physical dimensions of energy storage tanks.
In 1999, Nelson et al. [39] recommended that the height-to-diameter ratio (H:D) of the tank should be 3, whereas the height-to-wall thickness was more than 200 to improve the TES efficiency. Osman et al. [40] investigated the relationship between tank size, H:D ratio, inlet Reynolds number, and thermal stratification. They found that a medium H:D ratio (2.0–4.0) gave the best thermocline inside the tank. In 2011, Khalifa et al. [41] carried out experiments to study the effect of the H:D ratio on thermal stratification inside the TES tank. They found that as H:D increased, the thermal stratification was improved, and they recommended H:D = 2 for the best thermal stratification. Yaici et al. [42] reported that the H:D ratio, position of the inlet port, and flow rate were important for the design of hot water storage tanks used in a solar thermal system. They recommended that H:D = 3.5 was most suitable for their case. Milare et al. [43] and Remesh et al. [44] found that during discharging cold water, the remaining cold water in the tank depended on H:D and other parameters, i.e., initial temperature difference; flow rate; tank geometry; tank size; tank material and dimensionless numbers such as the Reynolds, Richardson and modified Biot numbers. Guo and Goumba [45] also concluded that H:D affected the thermocline of the working fluid inside the tank and the heat loss from the tank walls. They found that H:D = 1 would need the least insulation. In 2018, Kursun and Okten [46] studied the effect of tank angle and D:H ratio on thermal stratification inside a rectangular hot water tank. They found that with a 45° tilted tank and a D:H ratio of 0.5, the temperature differences between the top and bottom of the tank were a maximum. In 2018, Karim et al. [47] revealed that the thermal stratification of a storage tank depended on the temperature and velocity of incoming water and the H:D ratio of the tank.
In addition, Homan and Soo [48] suggested that lower flow rates at the inlet and outlet of the tank could give better thermal stratification in a chilled water tank. Bahnfleth and Song [49] studied the temperature distributions at constant flow with a double-ring slotted diffuser in a chilled water tank. They found that the double-ring slotted diffuser could accelerate the charging period and improve the charging efficiency. Moreover, they concluded that the incoming water flow rate had a strong effect on the thermocline. In 2008, Chung et al. [50] described that Reynolds number and diffuser configuration had a strong influence on the thermocline of the working fluid in a rectangular storage tank. In 2010, Castell et al. [51] concluded that the Richardson number was the best dimensionless parameter used to characterize thermal stratification in a water storage tank. This dimensionless number could characterize the flow rate and temperatures in a water tank. Karim [52] found that increasing the water flow rate could decrease thermal stratification efficiency. The inlet port position had a strong effect on the thermocline. In 2014, Mira-Hernandez et al. [53] numerically studied the thermocline in two TES tanks used for concentrating solar power plants. One tank had molten salt with quartzite rock filler, and the other had no filler. They preliminarily reported the pro and cons of tanks with and without the filler. The tank without filler showed a slightly better performance. Abdelhak et al. [54] simulated the temperature changes in a domestic hot water tank during charging and discharging for both vertical and horizontal tanks. They suggested using a vertical tank for better thermal stratification. In 2016, Yang et al. [55] studied the effect of water tank shapes on thermal stratification. They concluded that sphere and barrel tanks gave the highest storage capacities, and a tank with sharp corners showed the highest degree of thermal stratification. In 2017, Estevea et al. [56] computationally studied the effect of a storage tank inlet port and concluded that a sintered bronze conical inlet resulted in slower mixing of hot and cool water, giving a better thermal stratification compared with a conventional bronze elbow inlet. In 2017, Fang et al. [57] studied using PCM in tube-in-tank storage. They found that latent heat storage (PCM) had higher capacity effectiveness and heat transfer effectiveness than water. In 2018, Song et al. [58] optimized ice storage capacities for four applications: hotels, restaurants, malls, and offices. They introduced the ice storage rate and electric price ratio to imply the various ice storage capacities and different electric tariffs. They finally concluded that there is an optimal ice storage rate for a minimum chiller capacity and economic index value. In 2018, Fang et al. [59] introduced an index of effective energy storage ratio to characterize the performance of latent heat energy storage using PCM. Their analysis provided suggestions for the optimal design of latent heat storage.
The above literature and Table 1 show that a TES in the form of a chilled water tank combined with an air conditioning system is of interest. Several studies show that chilled water tanks can efficiently minimize the conventional load by charging the water during the off-peak period and utilizing the stored cold energy during the peak period. Mostly, tropical countries consume a higher cooling load due to industrial pollution and higher ambient temperature for throughout the years. In particular, in Thailand, fluctuations in ambient temperature are lower between summer and winter, resulting cooling load demand being high in both seasons. From the literature, it is found that to extend the cooling period for the entire day, it is necessary to optimize the volume and dimensions of the storage tank. Full operation mode requires a larger volume than partial operation mode. In addition, when using the chilled water tank during charging and discharging, a deep understanding of the temperature changes in the water is required. In particular, the physical dimensions of the tank affecting the thermal stratification of the fluid inside the tank would lead to a negative impact on the operation mode of this combined TES and air conditioning system. It is obvious that previous works are still doubtful about TES optimization in terms of sizing and operation with full or partial mode. A deep understanding of storage tank sizing and operation mode is required. In particular, when utilizing TES with an air condition system in full operation mode to handle cooling loads which are varied as full or partial loads, optimization of the storage size must be precisely determined. Simulation results can be a preliminary guideline for a better design of storage systems. All previous works have covered the use of storage water tanks with some modifications such as PCM added. However, it has been recognized that sizing the storage tank has been an issue related to the investment cost. It is well known that an increase in the storage tank can withstand the discharging period for longer. However, it will increase the complexity of maintenance and investment.
On the other hand, a small tank can only serve the system in partial operation mode resulting in less benefit from the system, and the conventional cooling load will be increased. Therefore, the sizing of the tank has been of great interest to this work.
Thus, in this work, temperature distributions in the chilled water tank were simulated for different H:D ratios during a 13-h discharging and 11-h charging time cycle. This was with the aim of switching the energy consumption from peak (daytime) to off-peak (night-time) for a location in Thailand. Specific conditions were set: a chiller providing the 5 °C water would be operated at night (10 p.m.–9 a.m.), and chilled water would be used to handle cooling during the daytime (9 a.m.–10 p.m.). A number of operation cycles were investigated for a selected H:D ratio. The suggestion of a proper H:D ratio for a specific storage volume can be achieved. This would be useful in the design of a real system. Obtained results from the simulation study were used to calculate the real-time energy savings under a grid tariff rate of Thailand’s electricity board. Further study will be carried out to verify the suggestion made by the simulation.

2. Materials and Methods

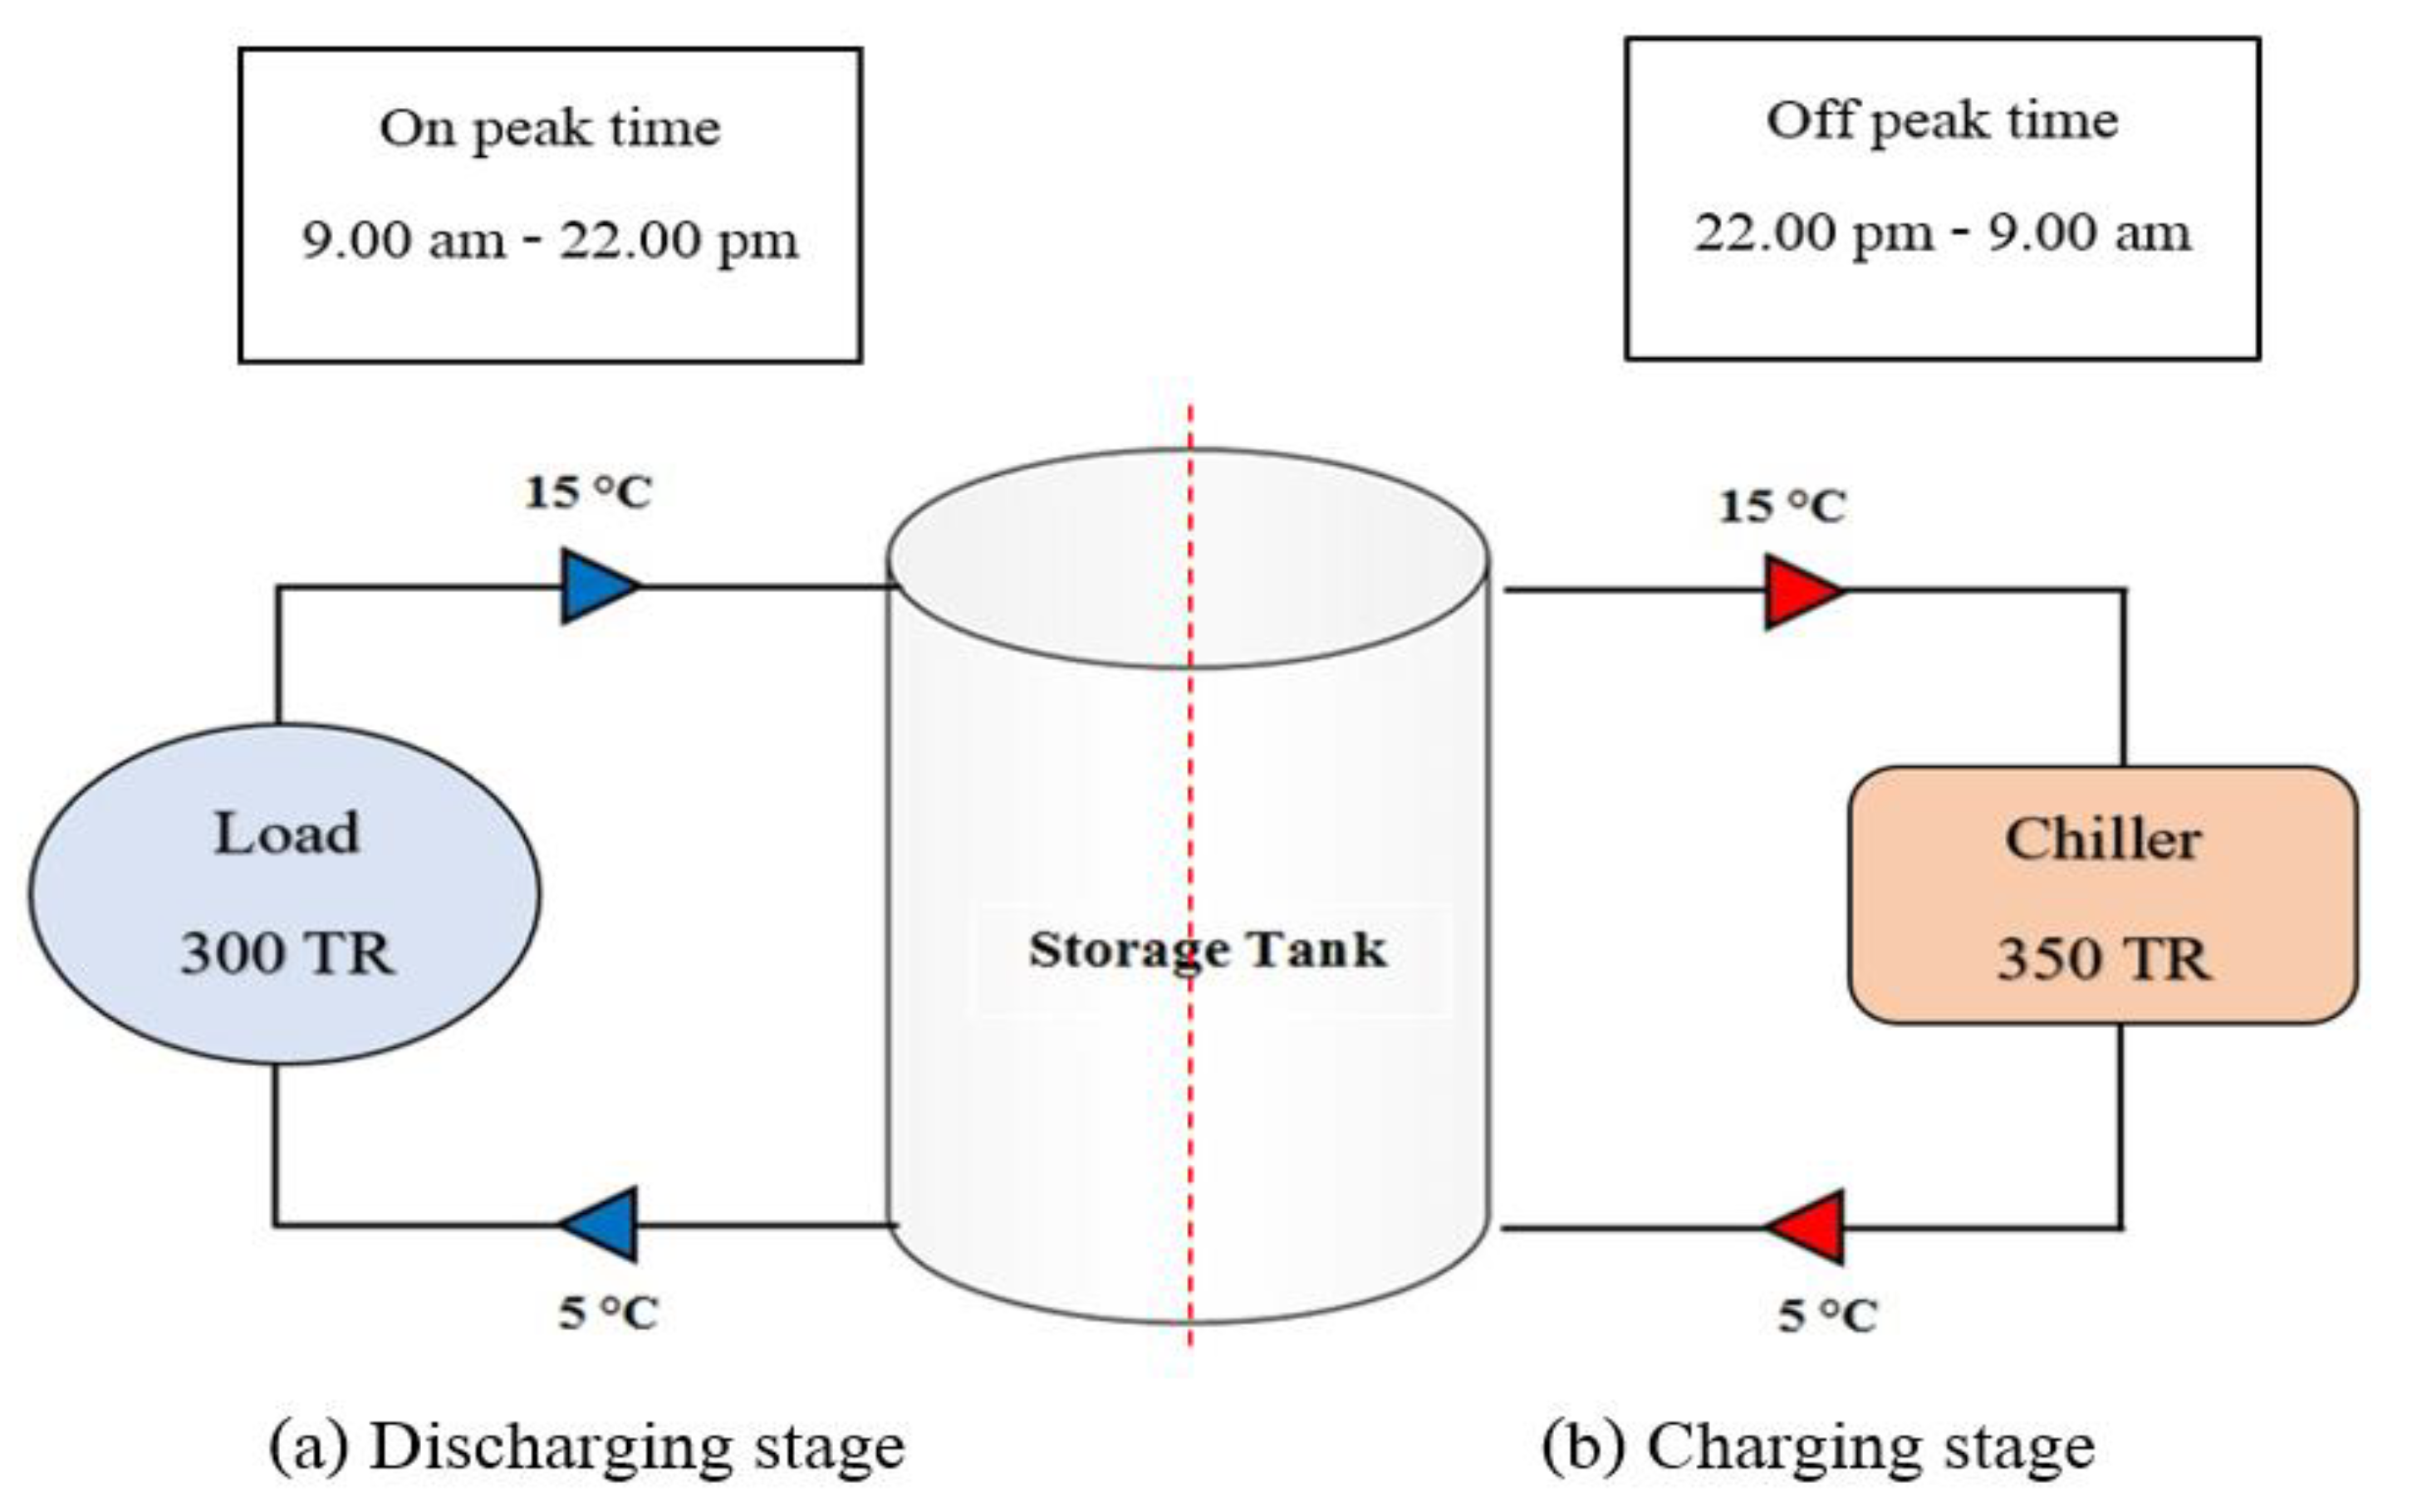
2.1. Concept of TES in Conjunction with an Air Conditioning System

In this study, a chiller water tank was used with a 300-TR air conditioning system that required 25 kg/s of 5 °C cold water, and the returned water to a chiller was at 15 °C. This meant that a 350-TR capacity chiller was needed to service this cooling load. This load and related parameters were chosen regarding the real application in a hospital where the actual system will be made after the simulation. The schematic of this system is shown in Figure 1. Full operation mode was simulated under maximum cooling loads for a whole day to evaluate the capability of a selected cold storage tank. It was believed that if the storage could handle this situation, in real practice with variable cooling loads, the system could be easily covered.
During peak times, the 5 °C chilled water was circulated to serve the cooling loads, called the discharging period, and sent back to the storage tank. At nighttime (off-peak time), the water in the storage tank was cooled by the chiller to obtain 5 °C chilled water, called the charging stage, for use on the next day. The temperature changes of the water inside the storage tank during the discharging and charging stages were computationally determined. This conceptual operation was aimed at reducing the peak demand during the daytime. The discharging period was set to be 13 h, and the charging period was set to 11 h at off-peak. This corresponded to the electrical tariff called TOU (Time of Use).

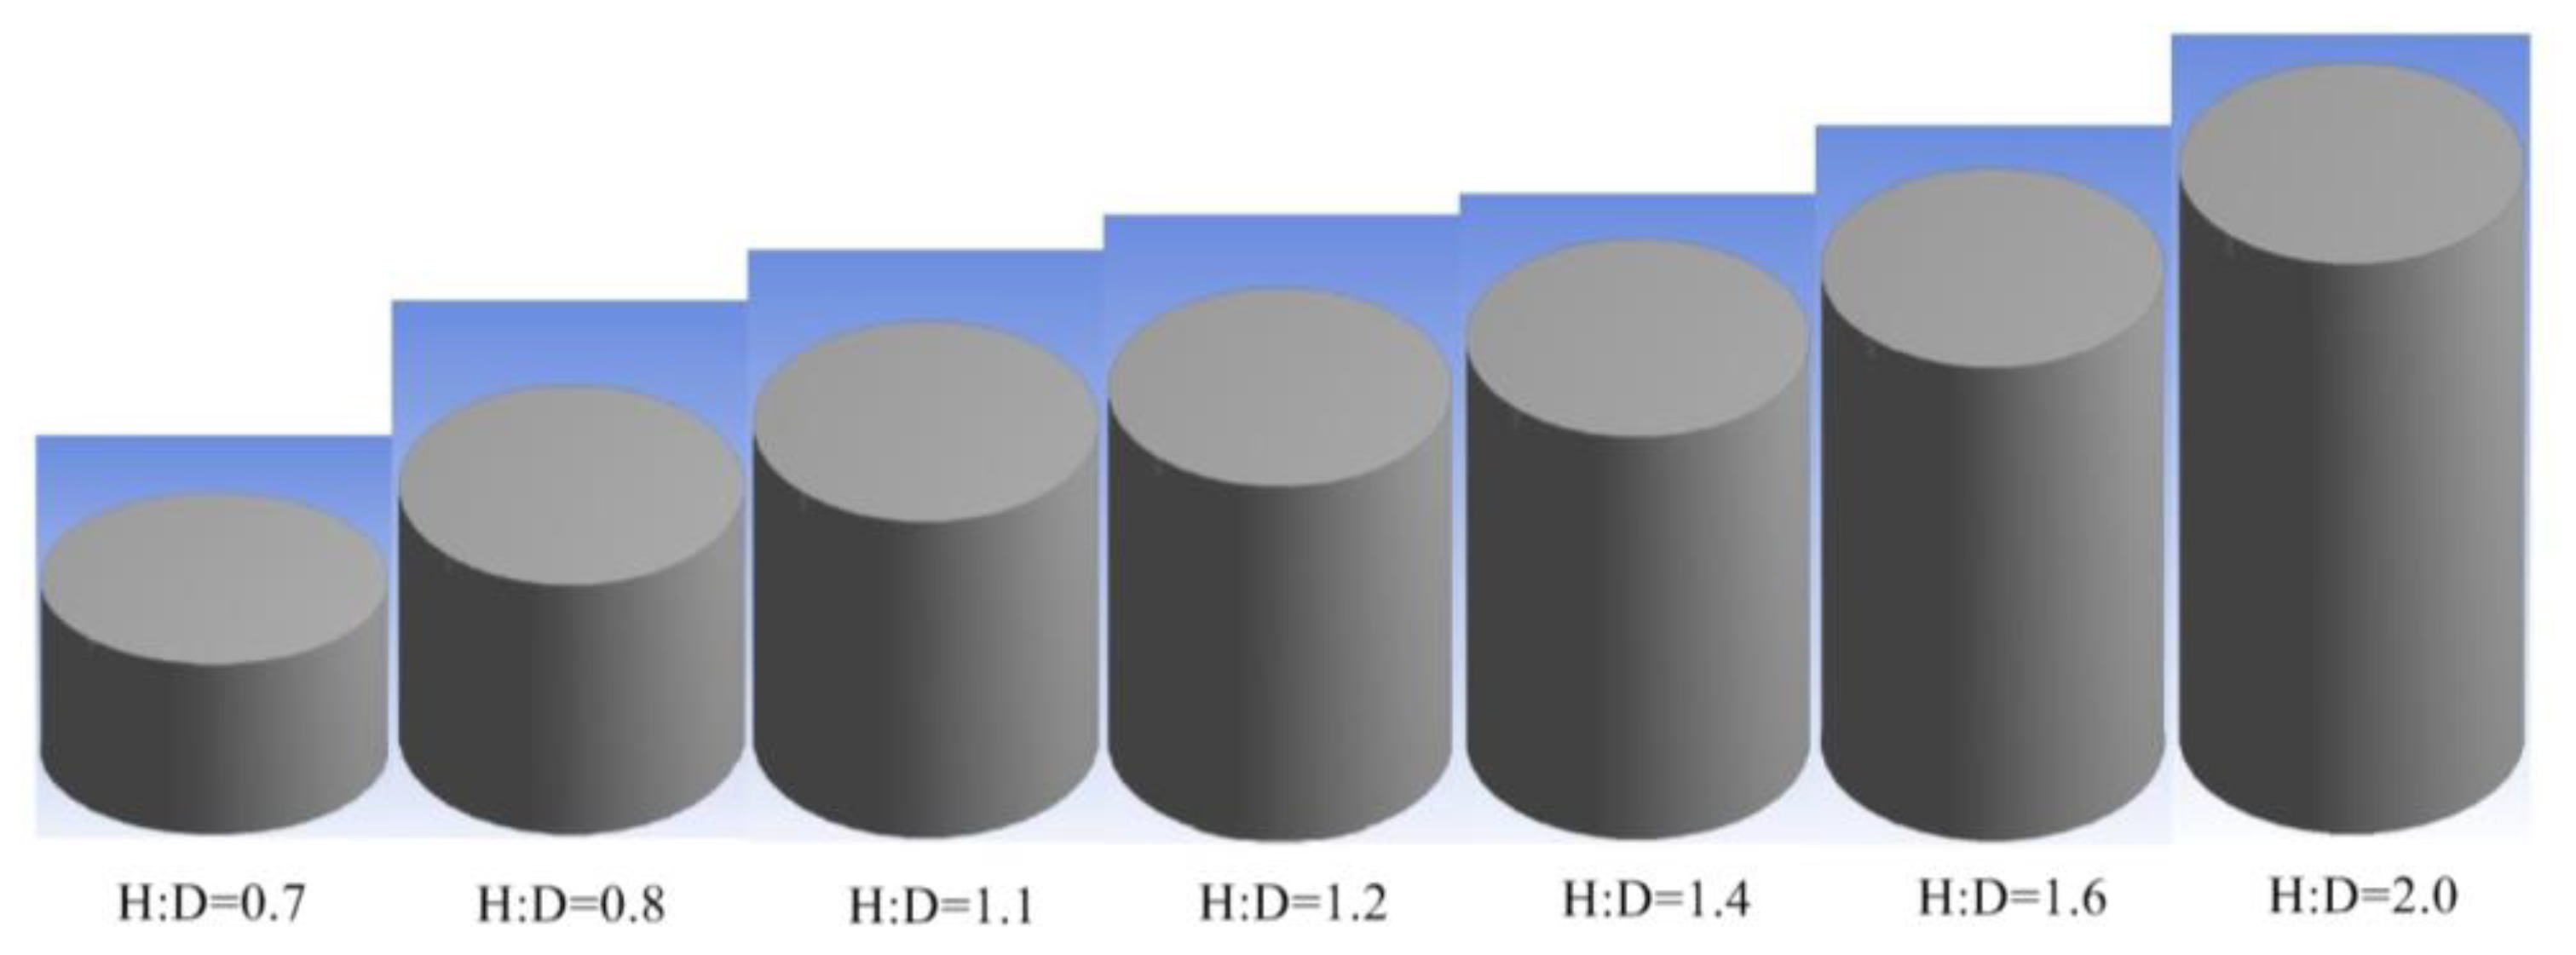
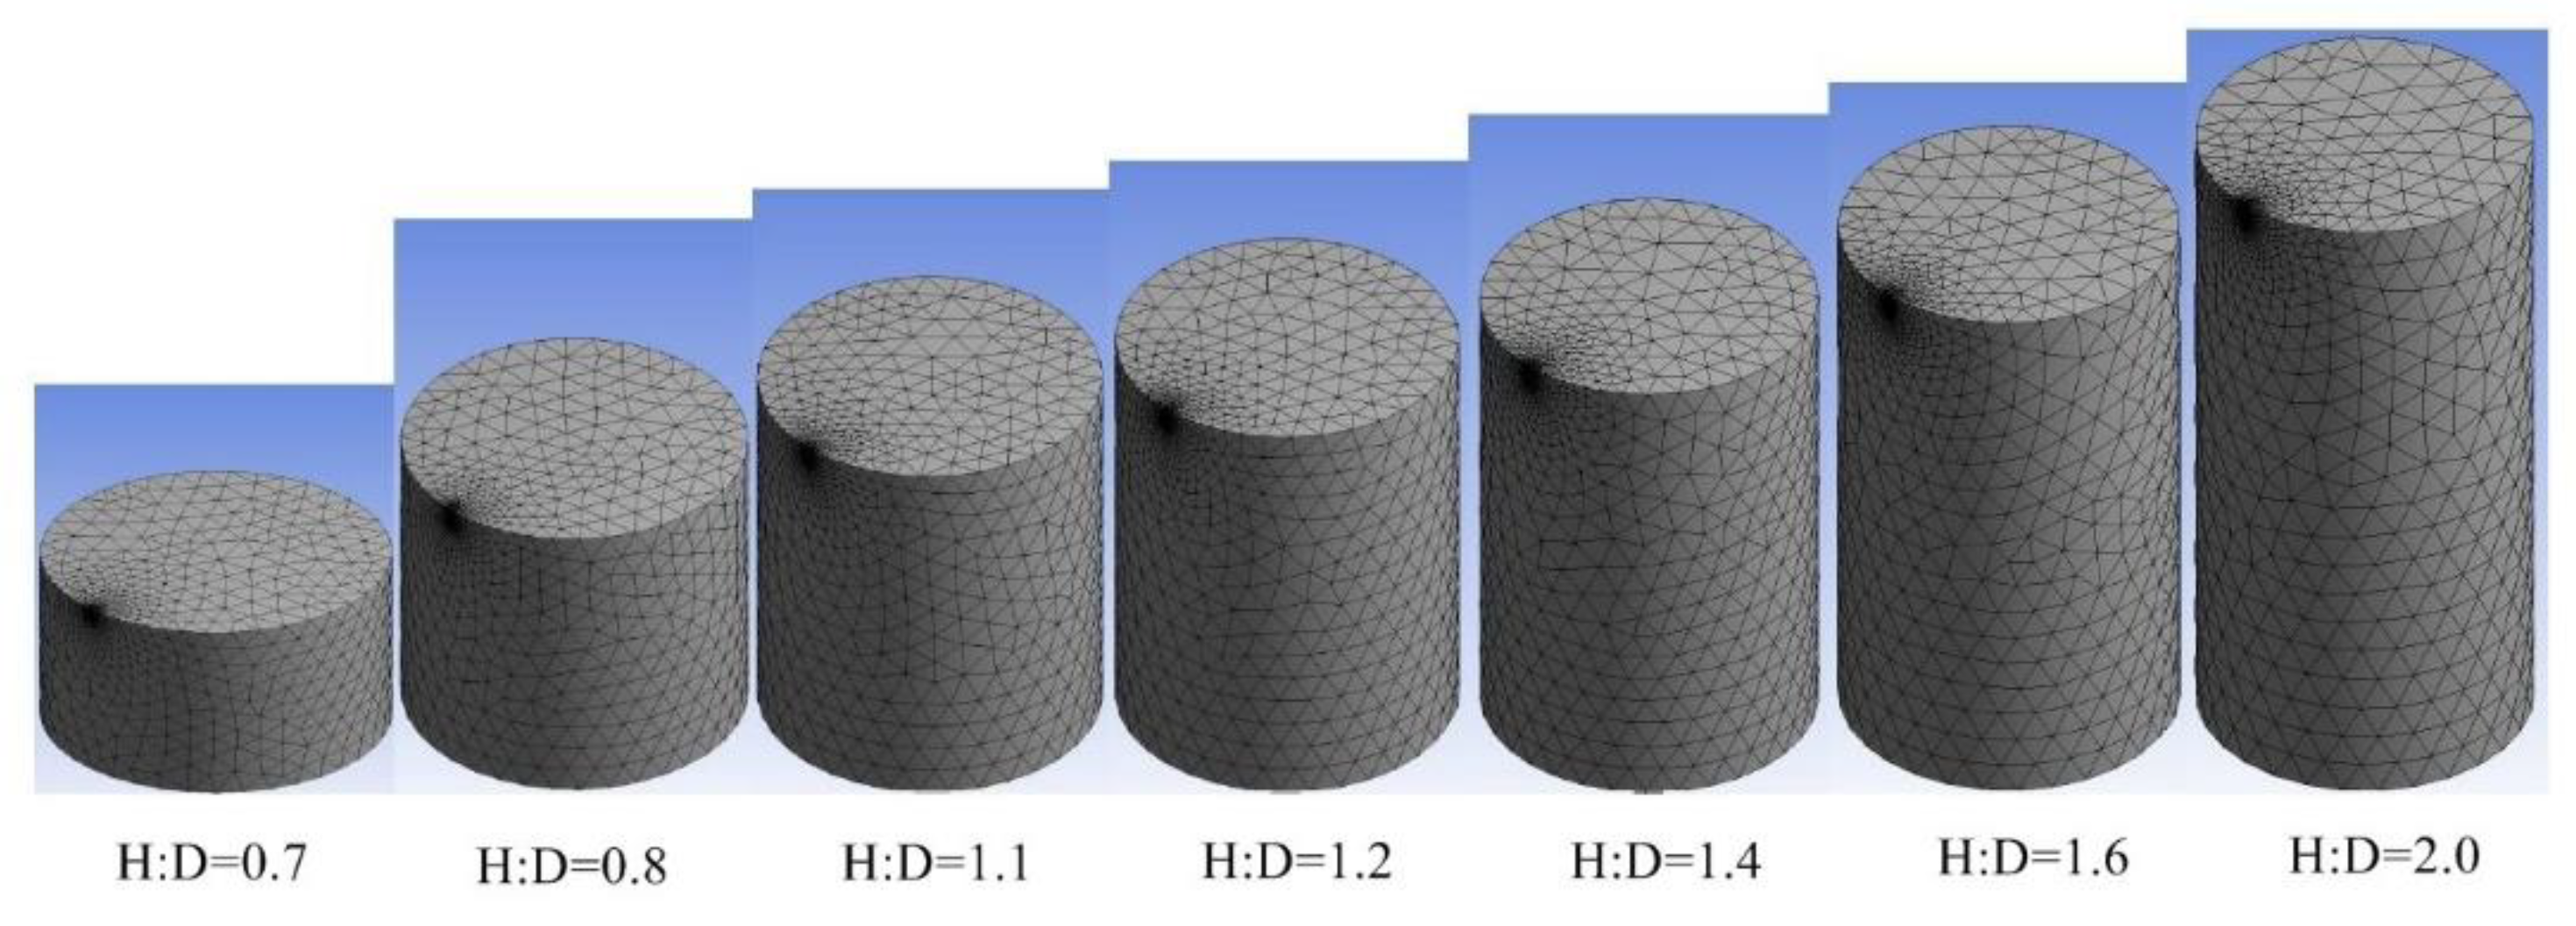
2.2. Simulation of the Chilled Water Tank

As mentioned earlier, the simulation was carried out to optimize the tank dimension regarding the real system in a hospital before the actual tank will be built. Thus, the tank to be modeled was a cylinder with a constant volume of 1755 m3 and Height:Diameter (H:D) ratios as listed in Table 2. This volume is enough to handle the load described in Section 2.1. There were inlet and outlet ports with diameters of 0.254 m at the top left and bottom center. The inlet ports were two ports as they gave a better thermal stratification, as seen in Figure 2. The inlet water velocity was 0.247 m/s, and the outlet was assigned to be a pressure outlet boundary condition when discharging, while inlet water was 0.572 m/s when charging. Figure 3 depicts the 3D tank shapes for the various H:D ratios. The modeling was performed in version 15.0 of ANSYS Fluent with 38,000–42,000 tetrahedral mesh elements using the transient mode, as shown in Figure 4.

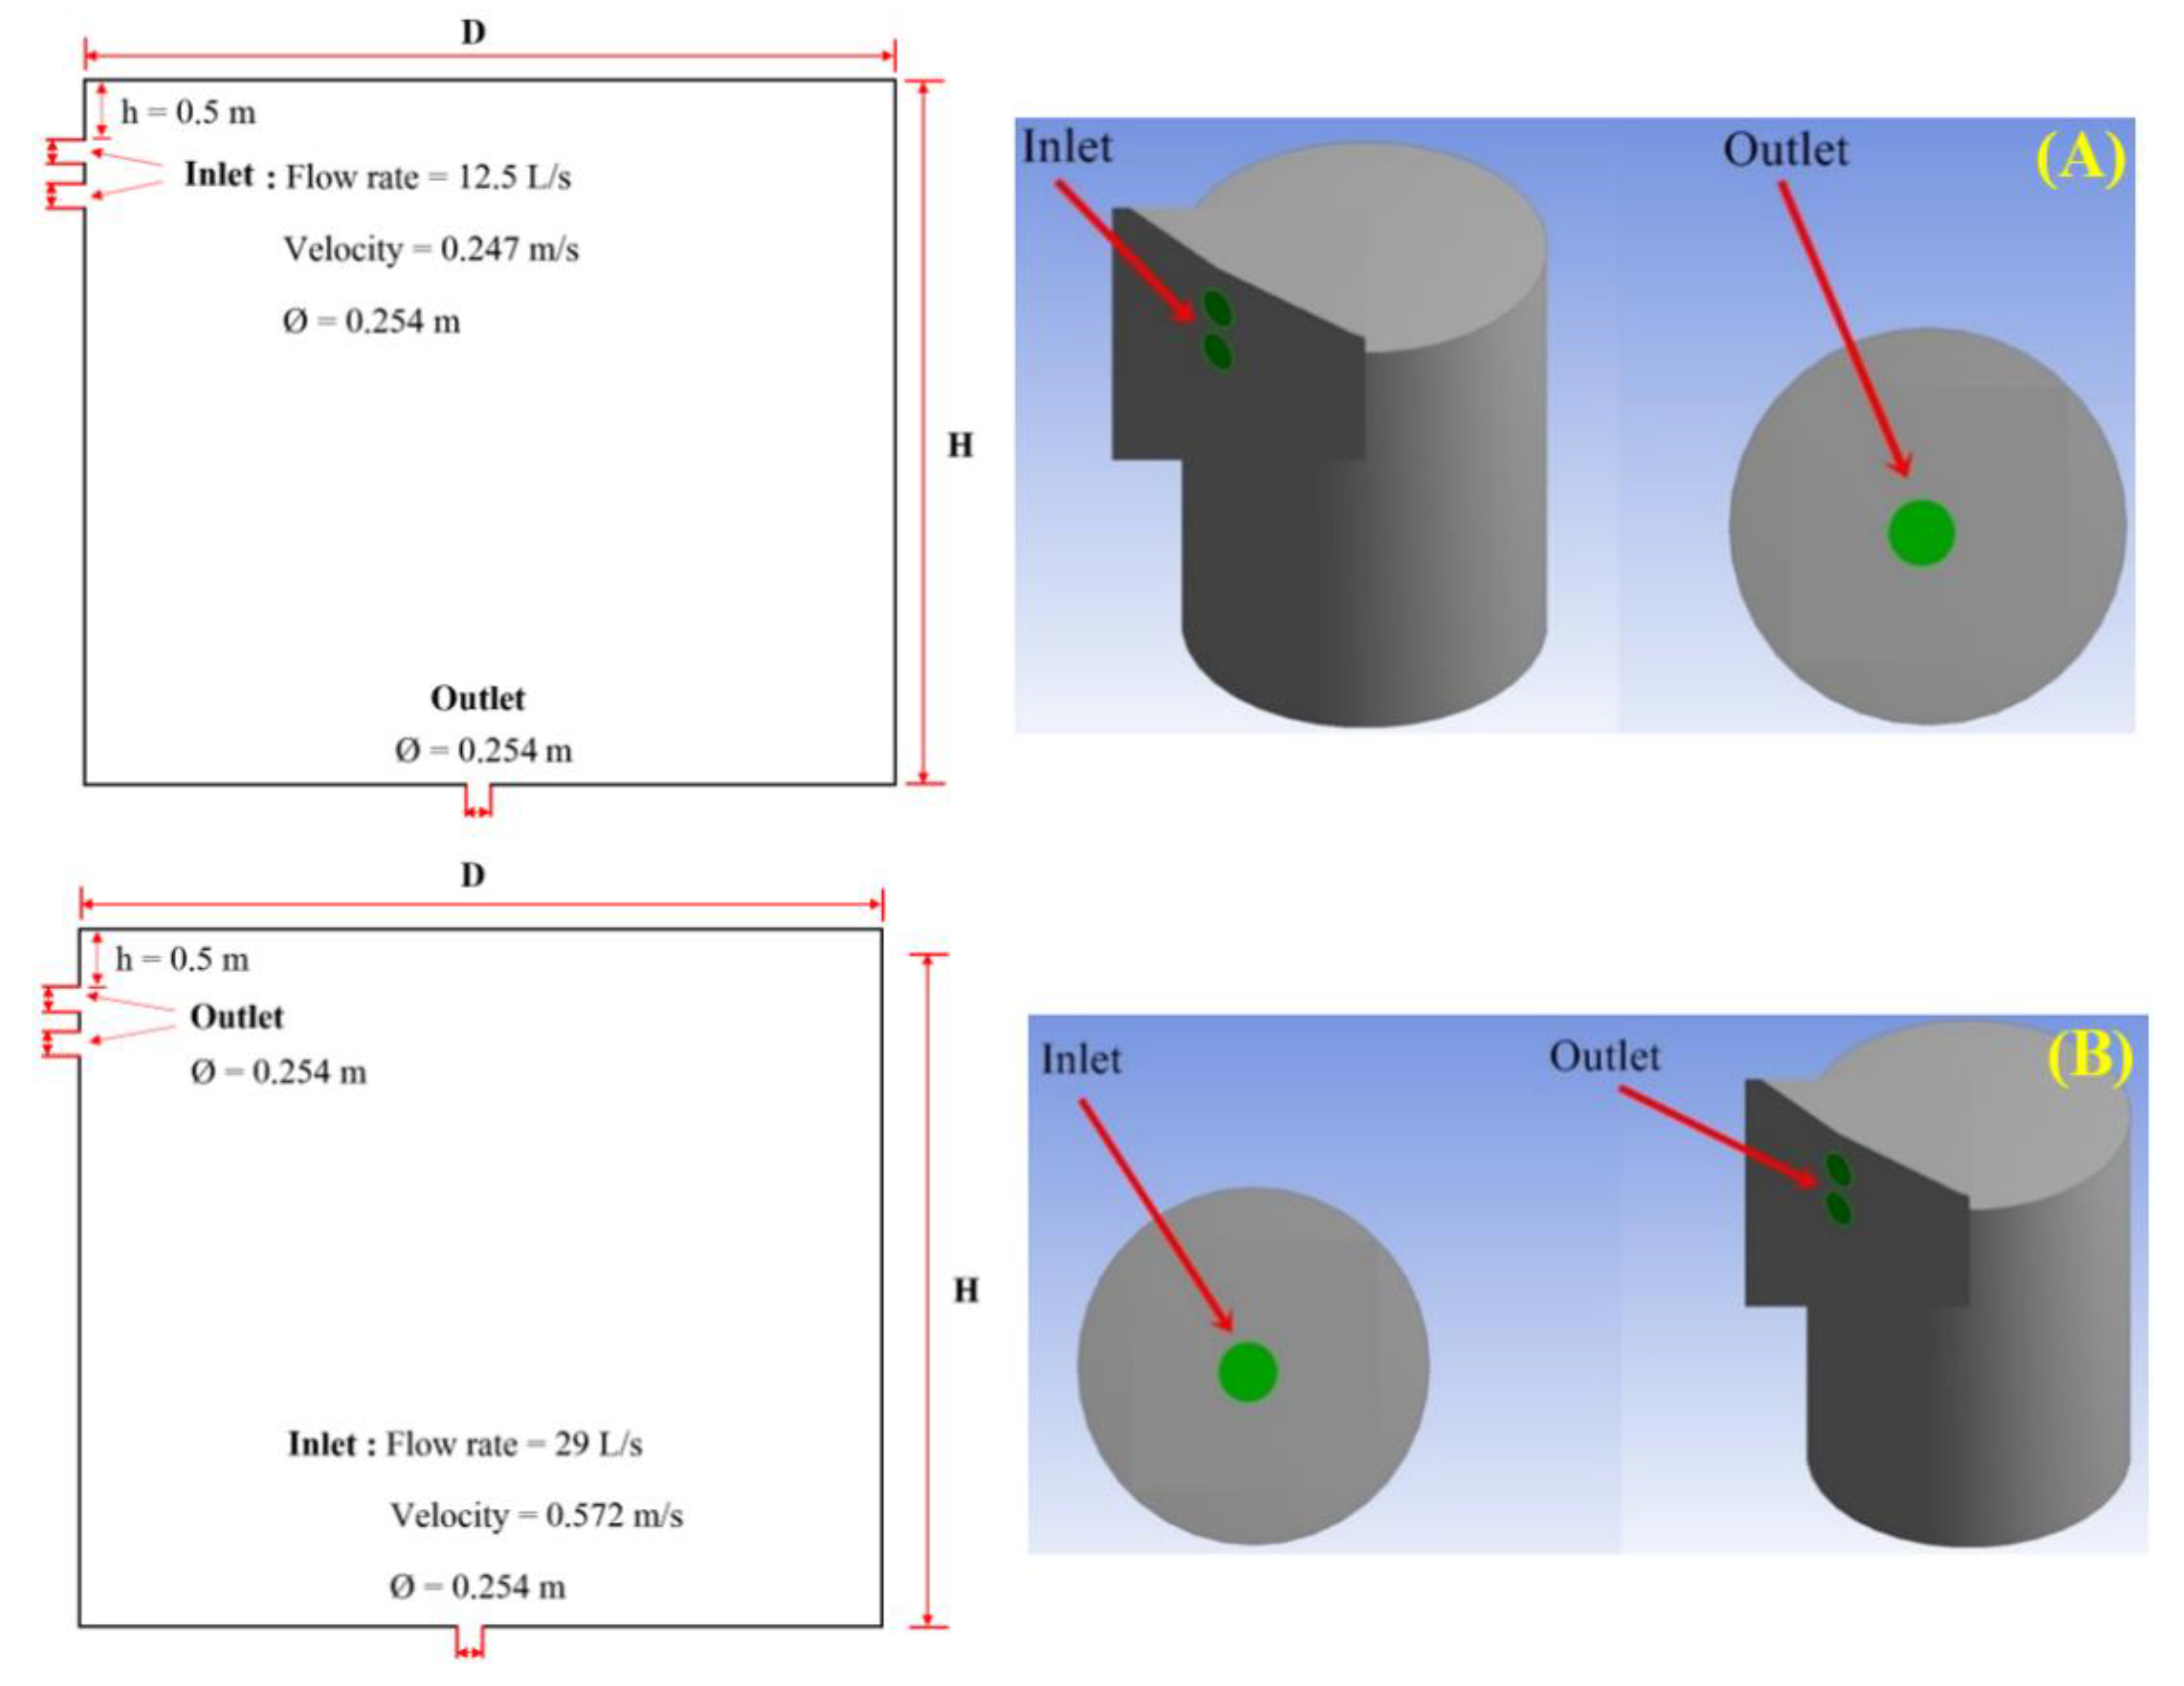
2.3. Relations and Specific Boundaries of the Simulation

The temperature changes of the chilled water in the cylindrical tank were simulated using the Navier–Stokes equations. Three main governing equations with consideration of gravity effect in 3D form were expressed as follows:
Conservation of mass:
u = 0
Conservation of momentum:
ρ u t + ( ρ u ) u = p + . τ ρ β ( T T r e f ) g
Conservation of energy:
ρ C P T t + ρ C P u T = ( k T )
Adiabatic tank wall during the process of charging and discharging was set by zero heat flux with full insulation at the outer surface. In addition, all surface walls with no slip were applied meaning that water velocity at the walls was zero.
u = v = w = 0
At the adiabatic sidewalls:
u = v = w = 0   and   T r = 0   at   r = D 2   and   0 y H
At the adiabatic top and bottom surfaces:
u = v = w = 0   and   T r = 0   at D 2 r D 2 ,   y = 0   and   y = H
where u , v and w are water velocity at x, y and z direction (m/s).
Models of transient-laminar flow were set with the following initial conditions. The water flows at both inlet and outlet were Newtonian fluid. For the discharging stage, the initial temperature was 5 °C for the whole tank, the flow rate was 25 L/s, the flow in was at 15 °C, and the flow out was at 5 °C. For the charging stage, the flow rate was 29 L/s, the flow in was at 5 °C, and the flow out was at 15 °C.
The model was validated with lab-scale apparatus (1-m height, 0.5 m diameter), giving a good agreement as shown in Table 3. The higher temperature difference (ΔT) of charging and discharging between simulation and experimental results were found to be 0.7 °C and 1.3 °C. In addition, the model was compared with similar previous works [41,42]. It was found that results agreed well with those works with less than 10% deviations.

2.4. Economic Analysis

As mentioned above, under a maximum cooling load for a whole day, if the cold thermal storage can be fully operated, in practice, where cooling loads will vary as partial loads during the day, the storage can handle this real situation. The following economic analysis is applied under this assumption giving maximum savings which could be achieved. It is noted that under the real situation, which is harder to predict, lower savings can be expected.
When the energy consumption was moved from peak to off-peak, there were two savings gained (1) two hours reduction in chiller operation and (2) cheaper electricity cost in the off-peak. Regarding the TOU tariff in Thailand, the costs of electricity are 0.14 and 0.08 USD/kWh for on-peak and off-peak, respectively.
Without storage, the chiller would be operated during the daytime (13 h), and energy consumption and cost were calculated by
Cost per year = (0.14 US$/kWh) × (kW) × (13 h/day) × number of operating days
With the chilled water storage tank, the chiller was switched to the off-peak time (11 h), thus
Cost per year = (0.08 US$/kWh) × (kW) × (11 h/day) × number of operating days
Then, estimation of energy savings, cost reduction and the “simple payback period” can be determined.

3. Results and Discussion

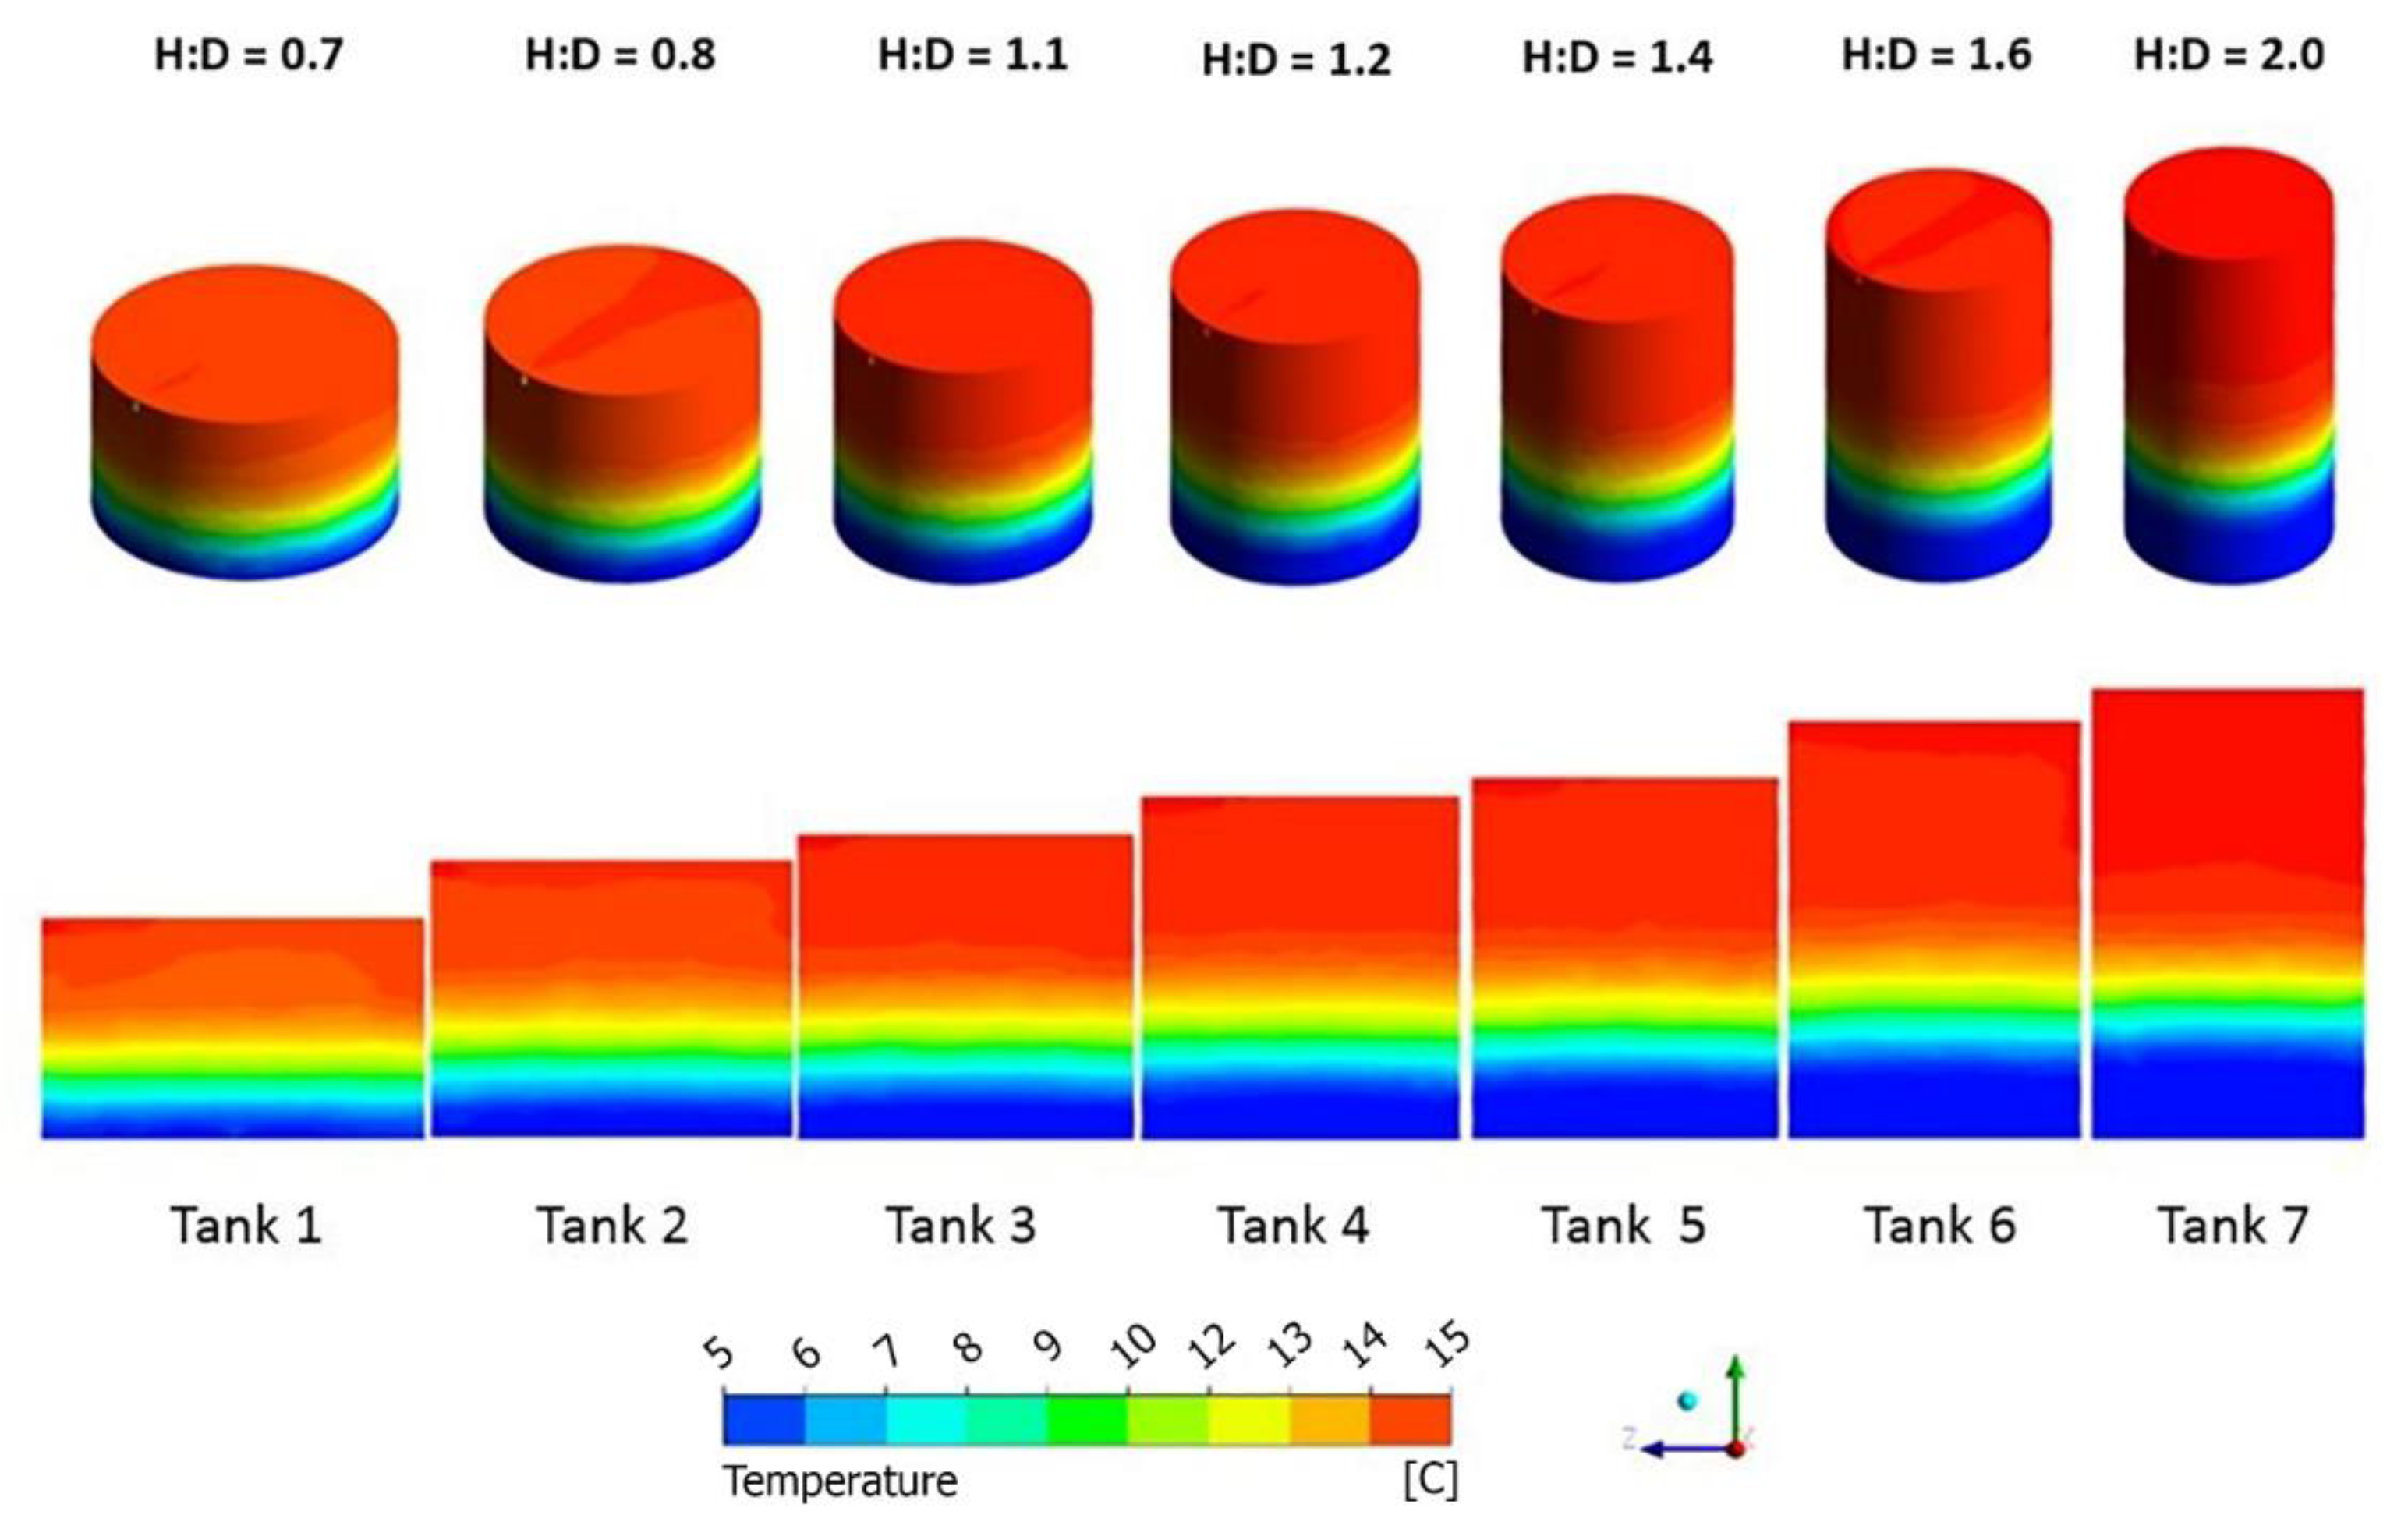
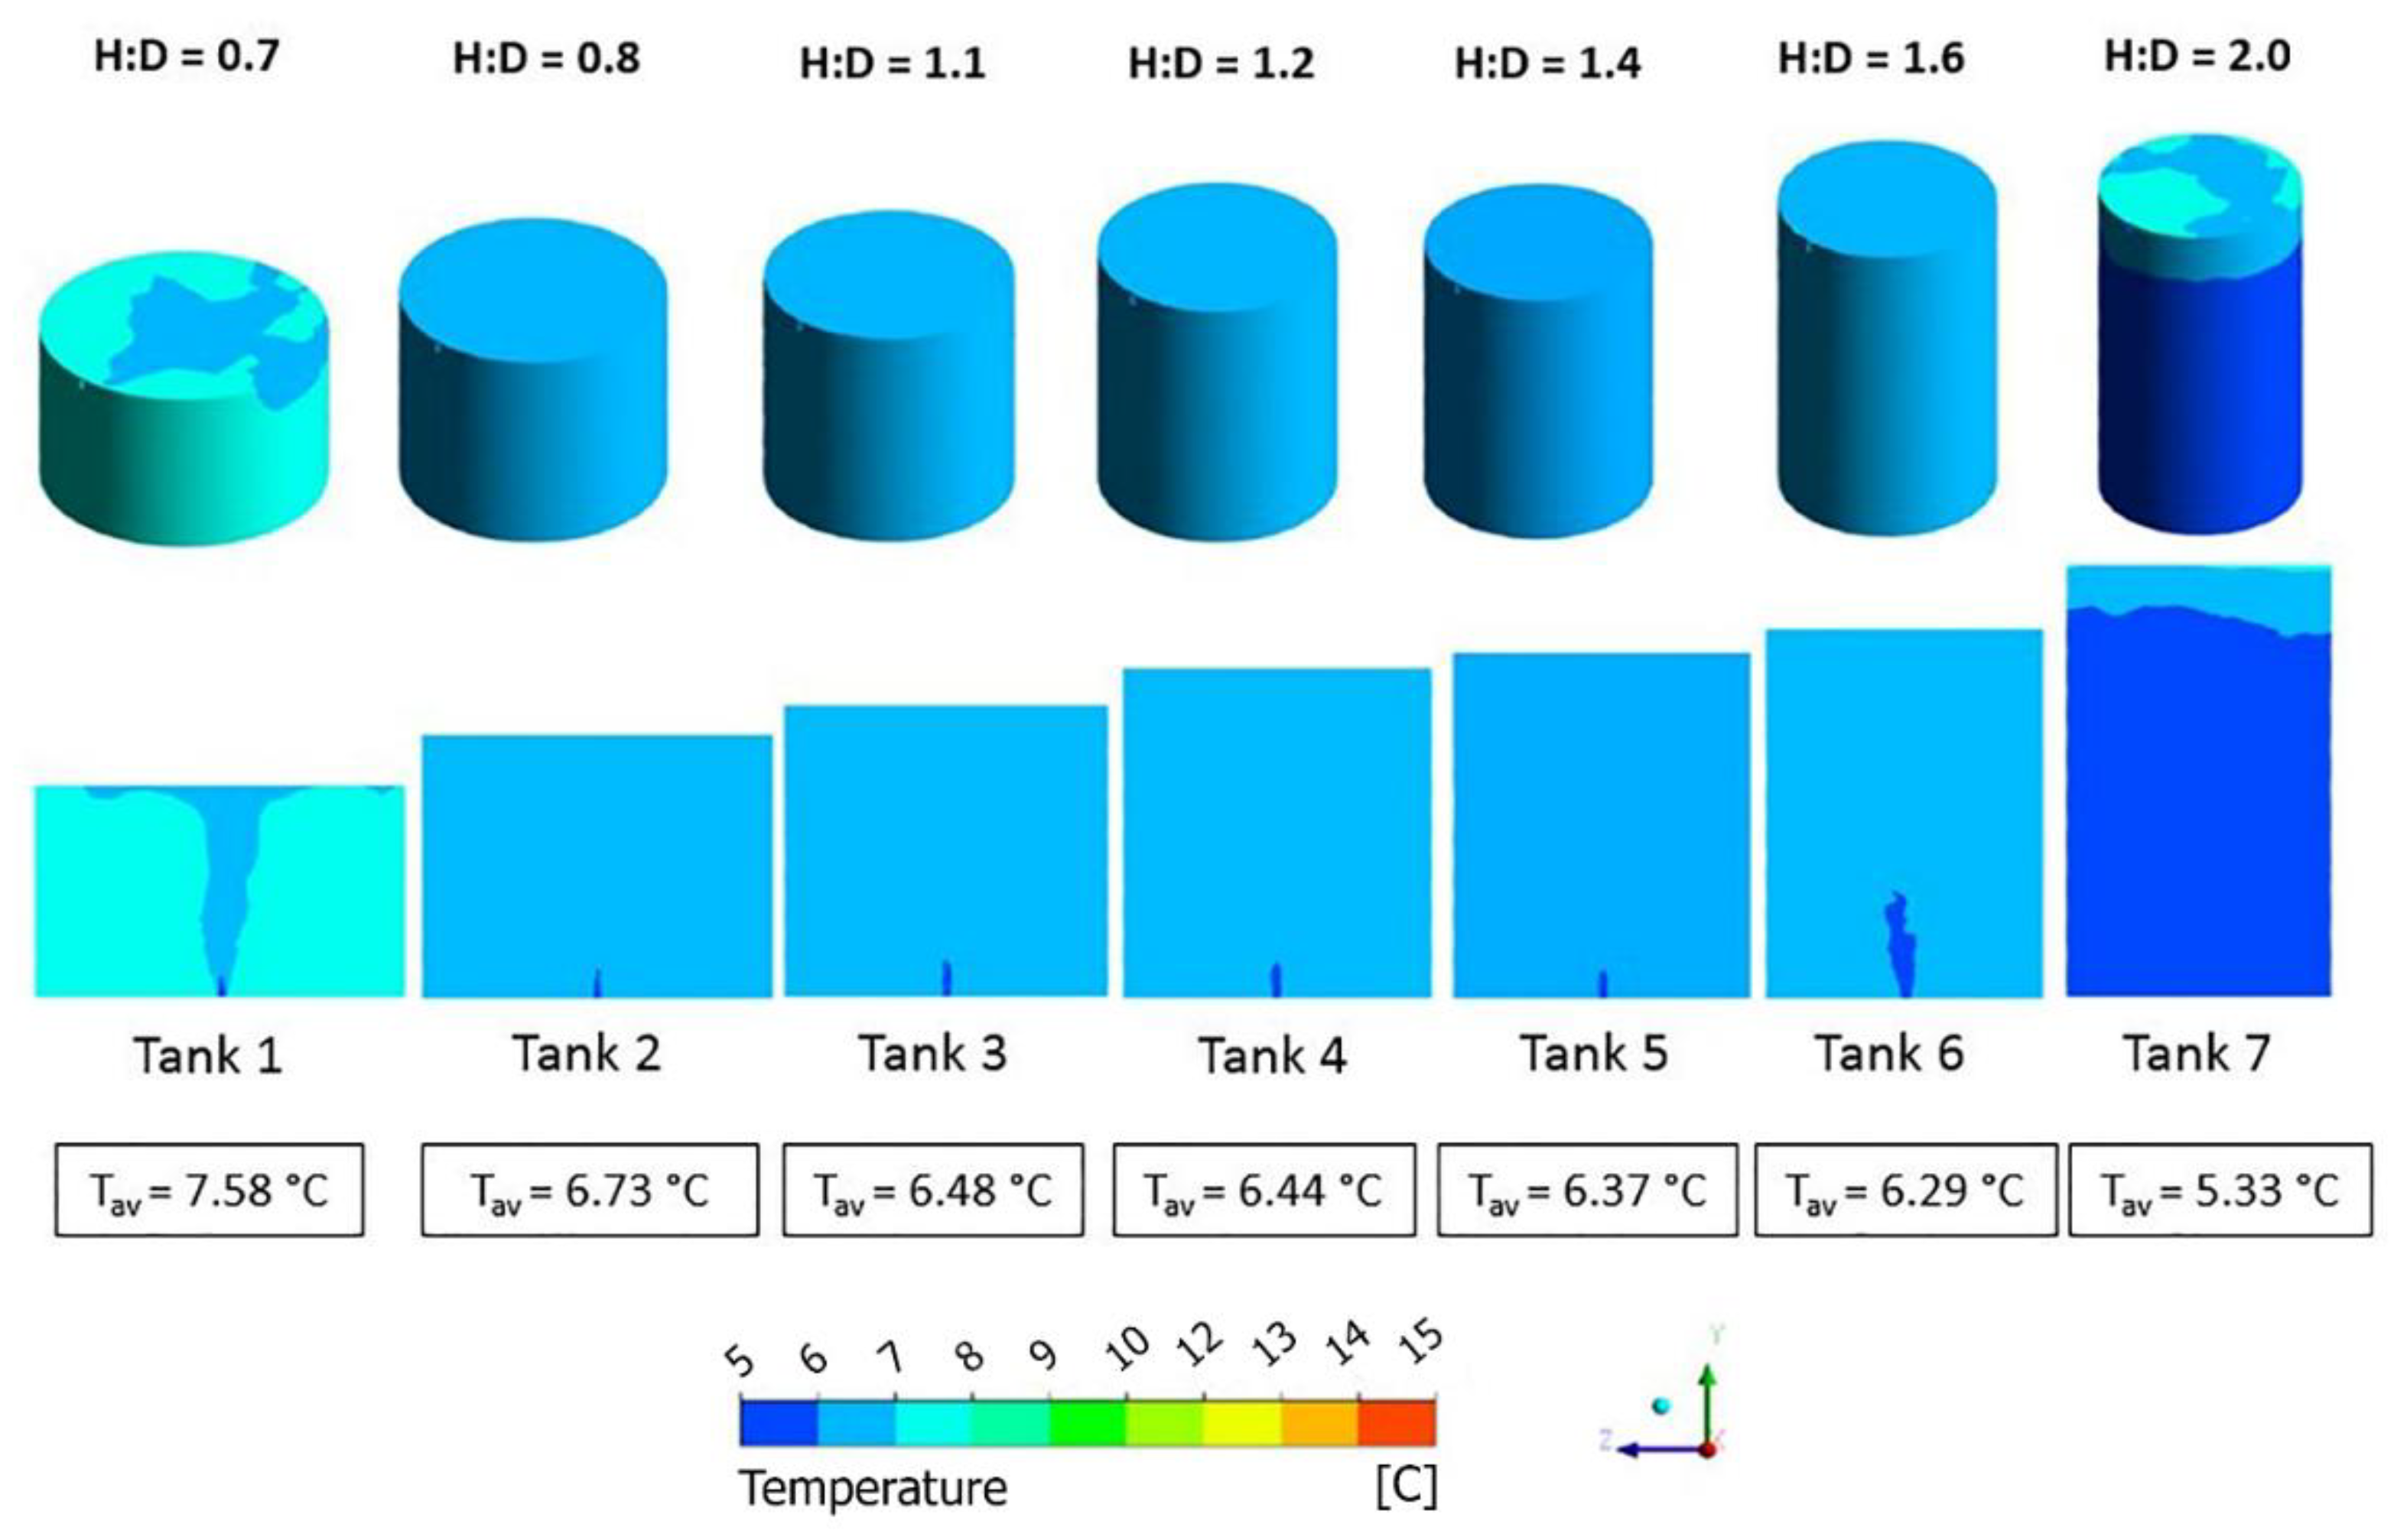
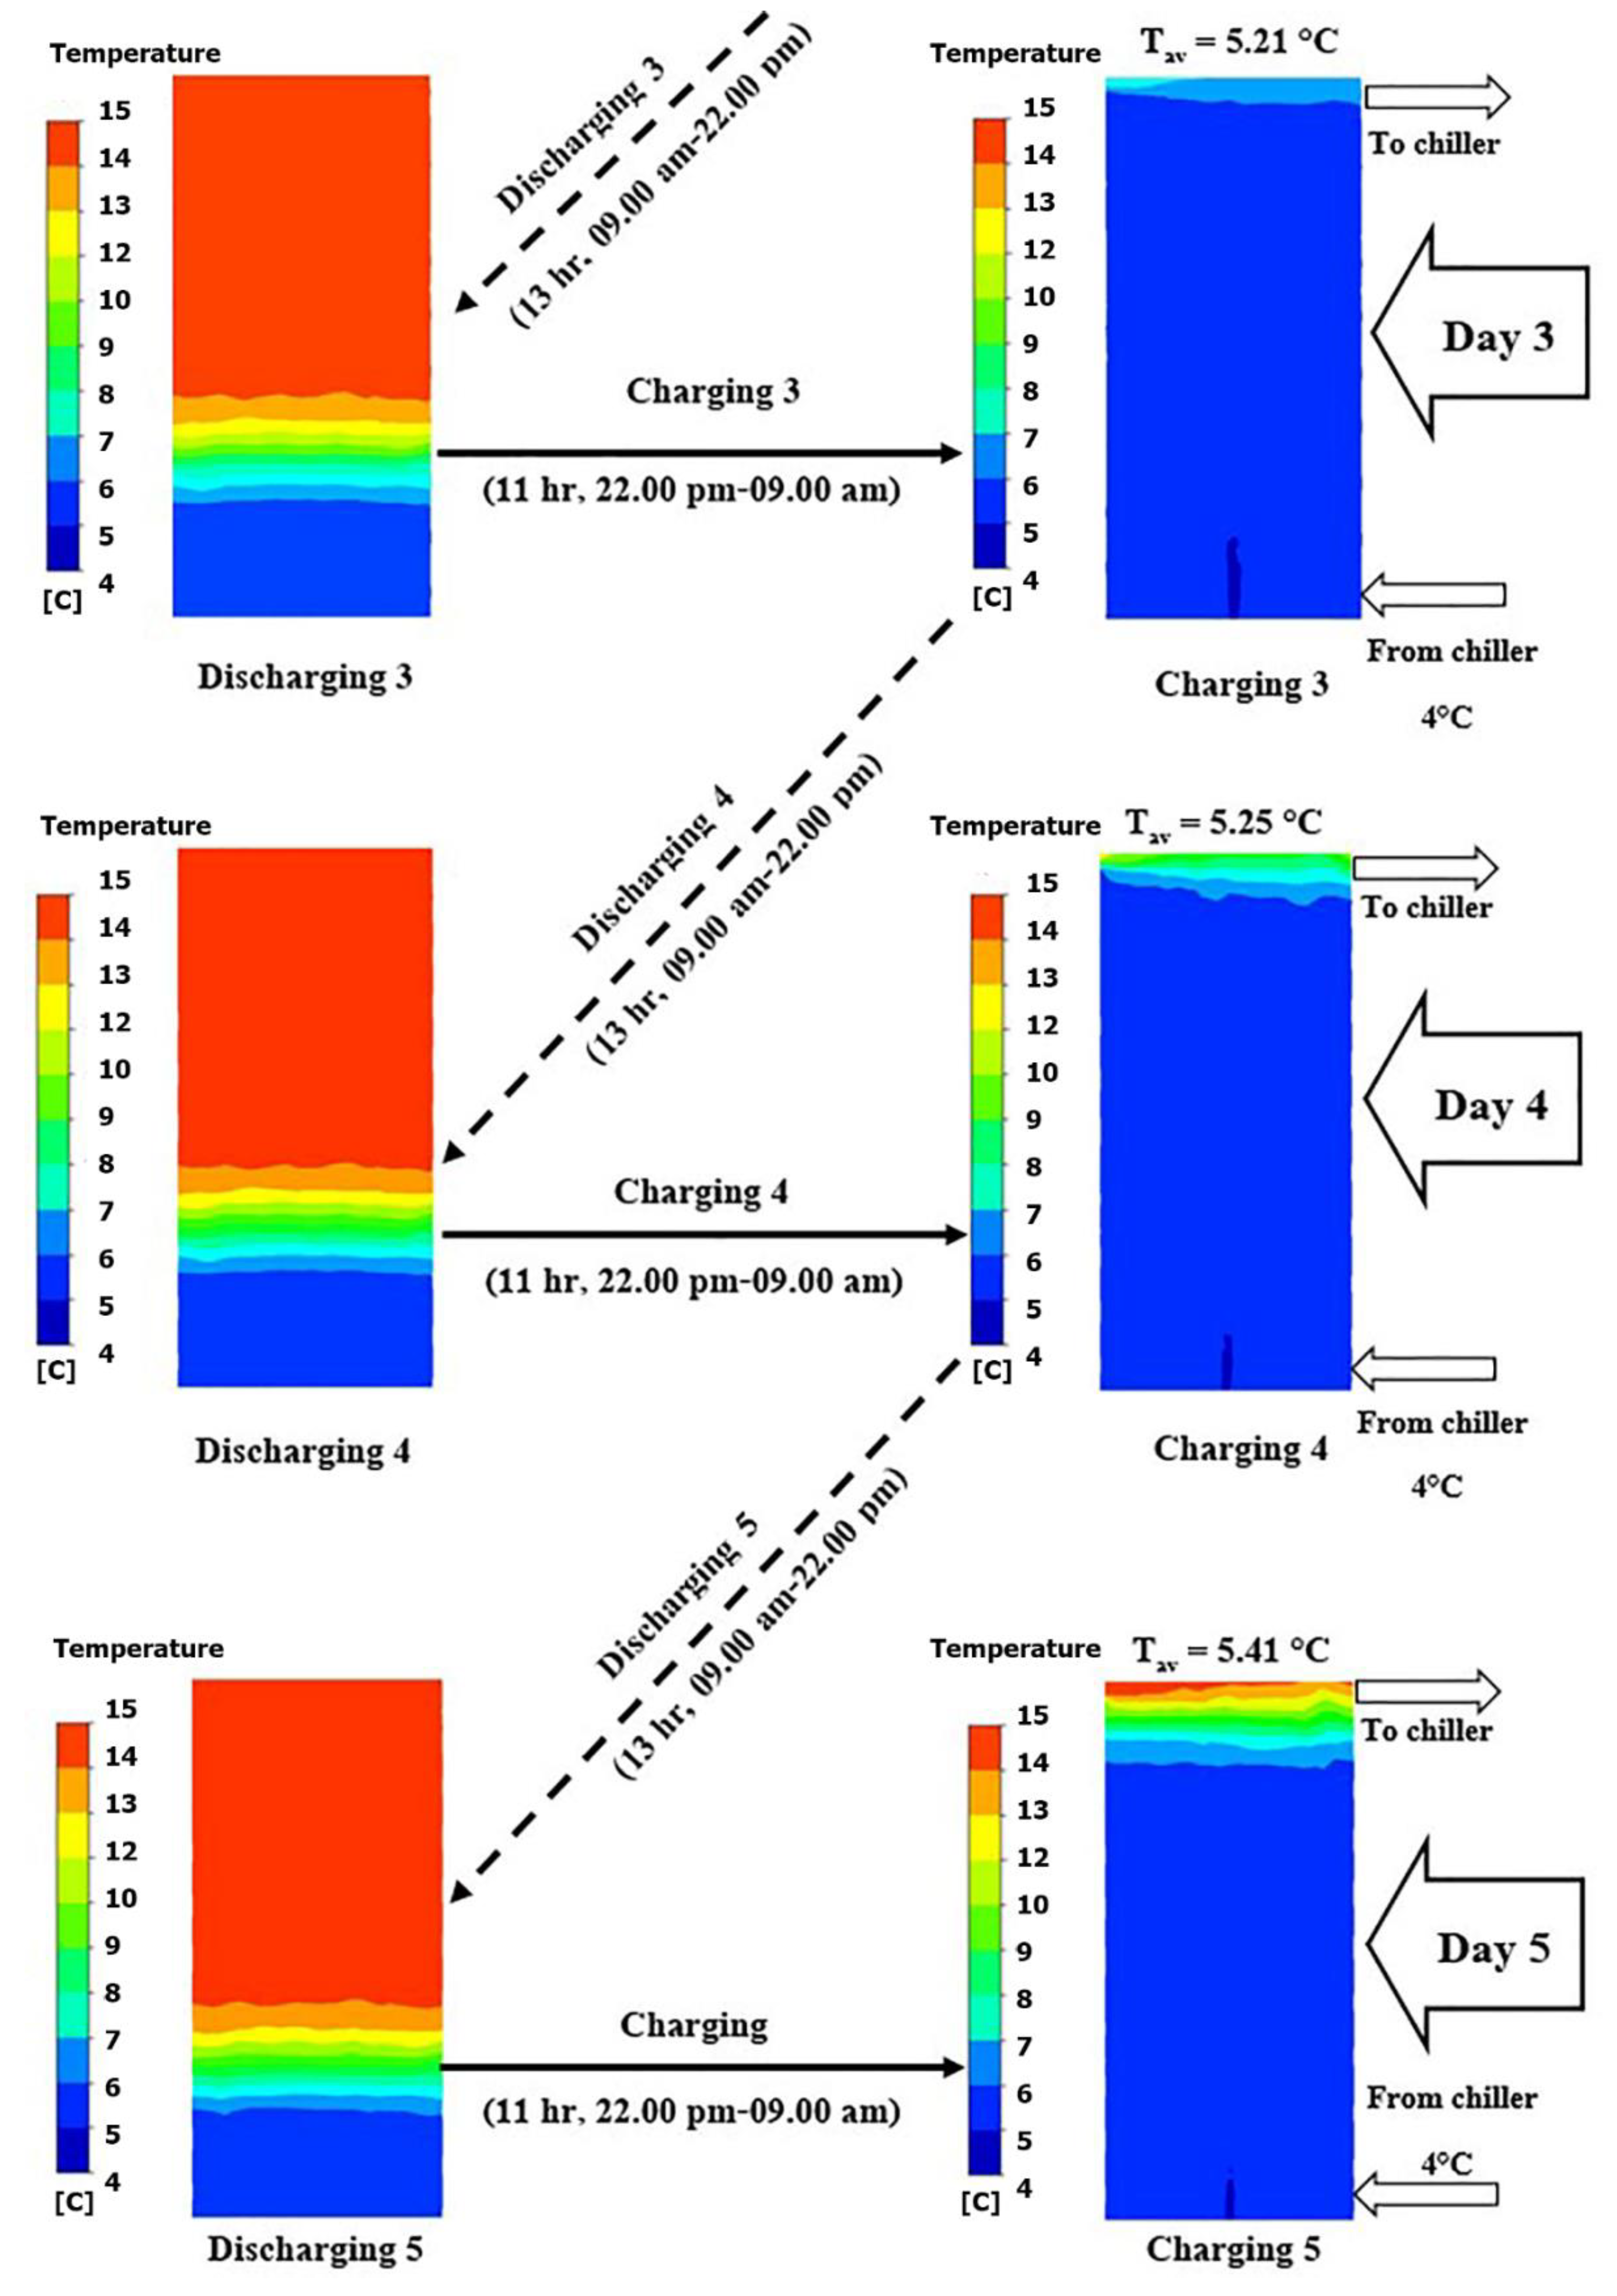
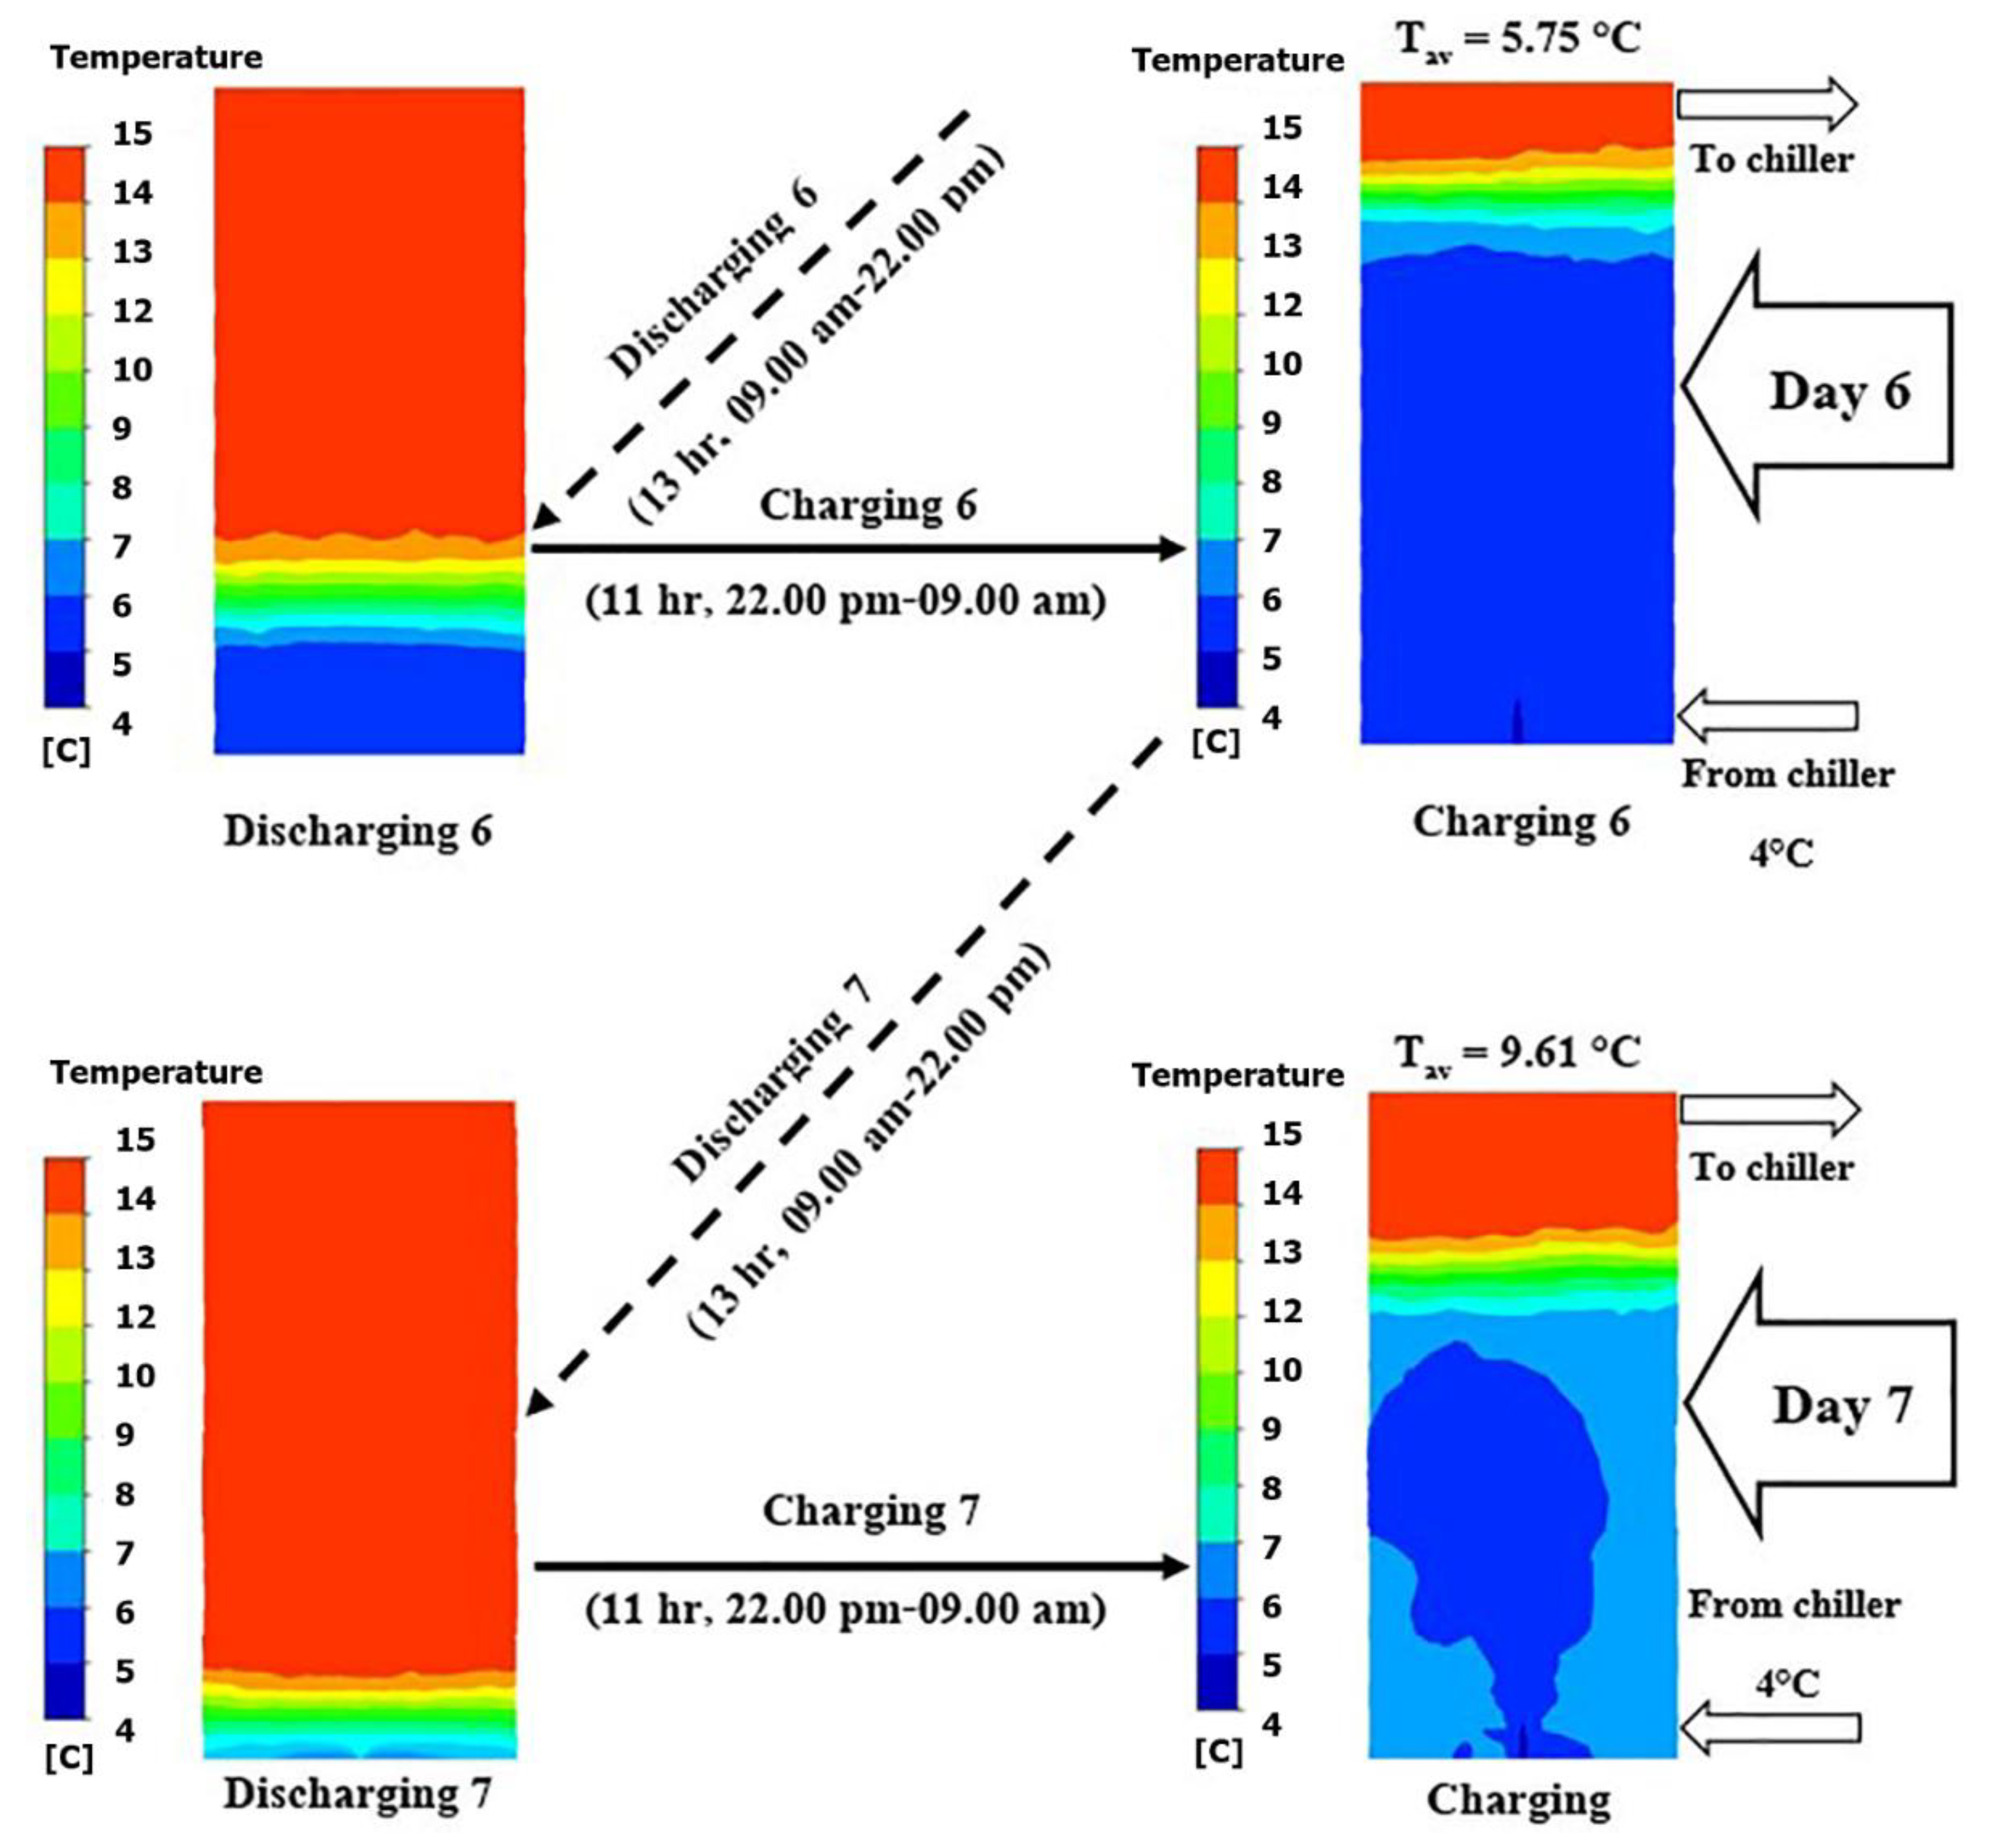
3.1. Temperature Changes in Storage Tanks during Discharging and Charging Stages

Figure 5 shows how the tank H:D ratio affected the change of temperature in the tank following 13 h of cooling discharge. Higher H:D ratios, with lower surface areas for a given volume, resulted in lower heat transfer and improved thermal stratification in the tank. Transfer of heat from returned water at 15 °C to 5 °C water gave rise to a slower thermocline in the tank. Because heat transfer is directly proportional to the surface area, higher H:D ratios resulted in increased amounts of remaining 5 °C water, shown in dark blue. In contrast, with the lowest H:D ratio of 0.7, the 5 °C water was almost exhausted after 13 h, and insufficient remained for further use.
Table 4 shows that a tank with an H:D ratio of 2.0 had 21.35% more 5 °C water remaining after 13 h discharging than a tank with an H:D ratio of 0.7. The more chilled water remains, the longer the air conditioning system can be served.
Figure 6 shows the strong effect of the H:D ratio on temperature distribution. For all H:D ratios lower than 2.0, the air conditioning system with TES would only operate for a single day. Only an H:D ratio of 2.0 could make 11 h of charging to produce an average temperature of 5.33 °C, which was sufficiently low for a subsequent 13-h day of cooling. In this case, the lowest area of thermal layers resulted in the slowest heat transfer by natural convection in the discharging and charging stages. An H:D ratio of 2.0 was optimized considering the longer period of operation. Therefore, it was selected for further simulation.

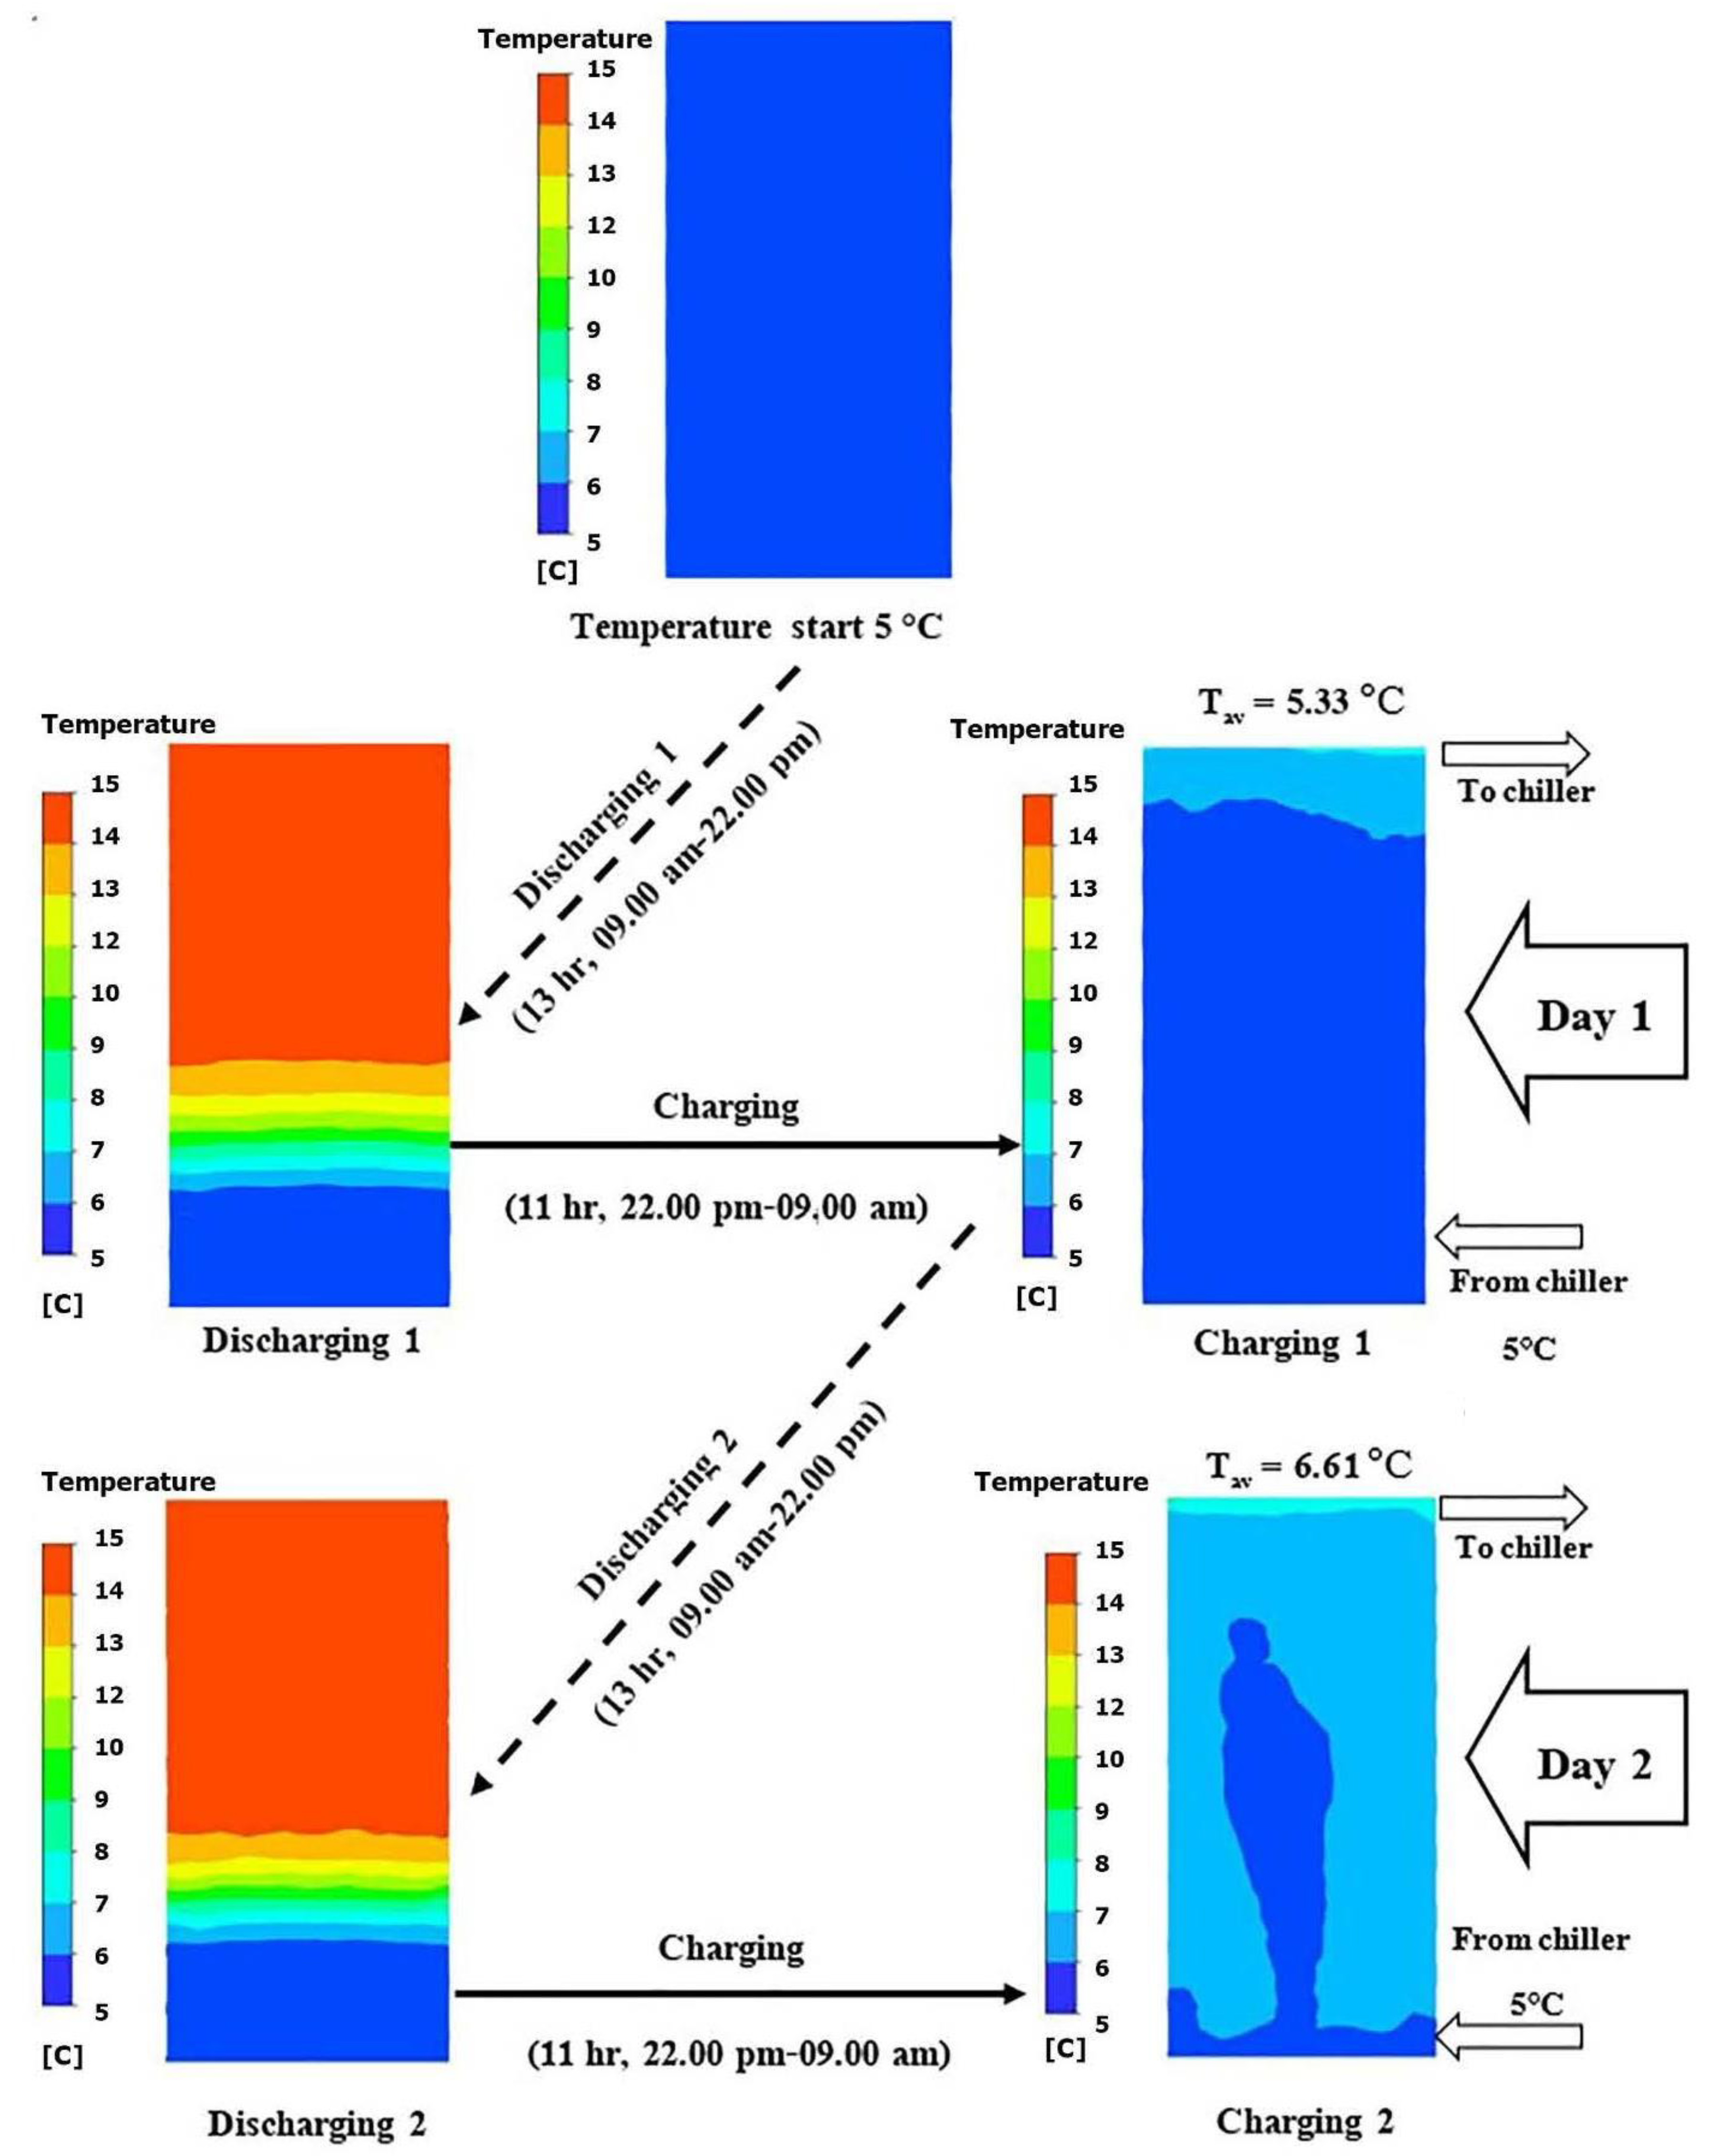
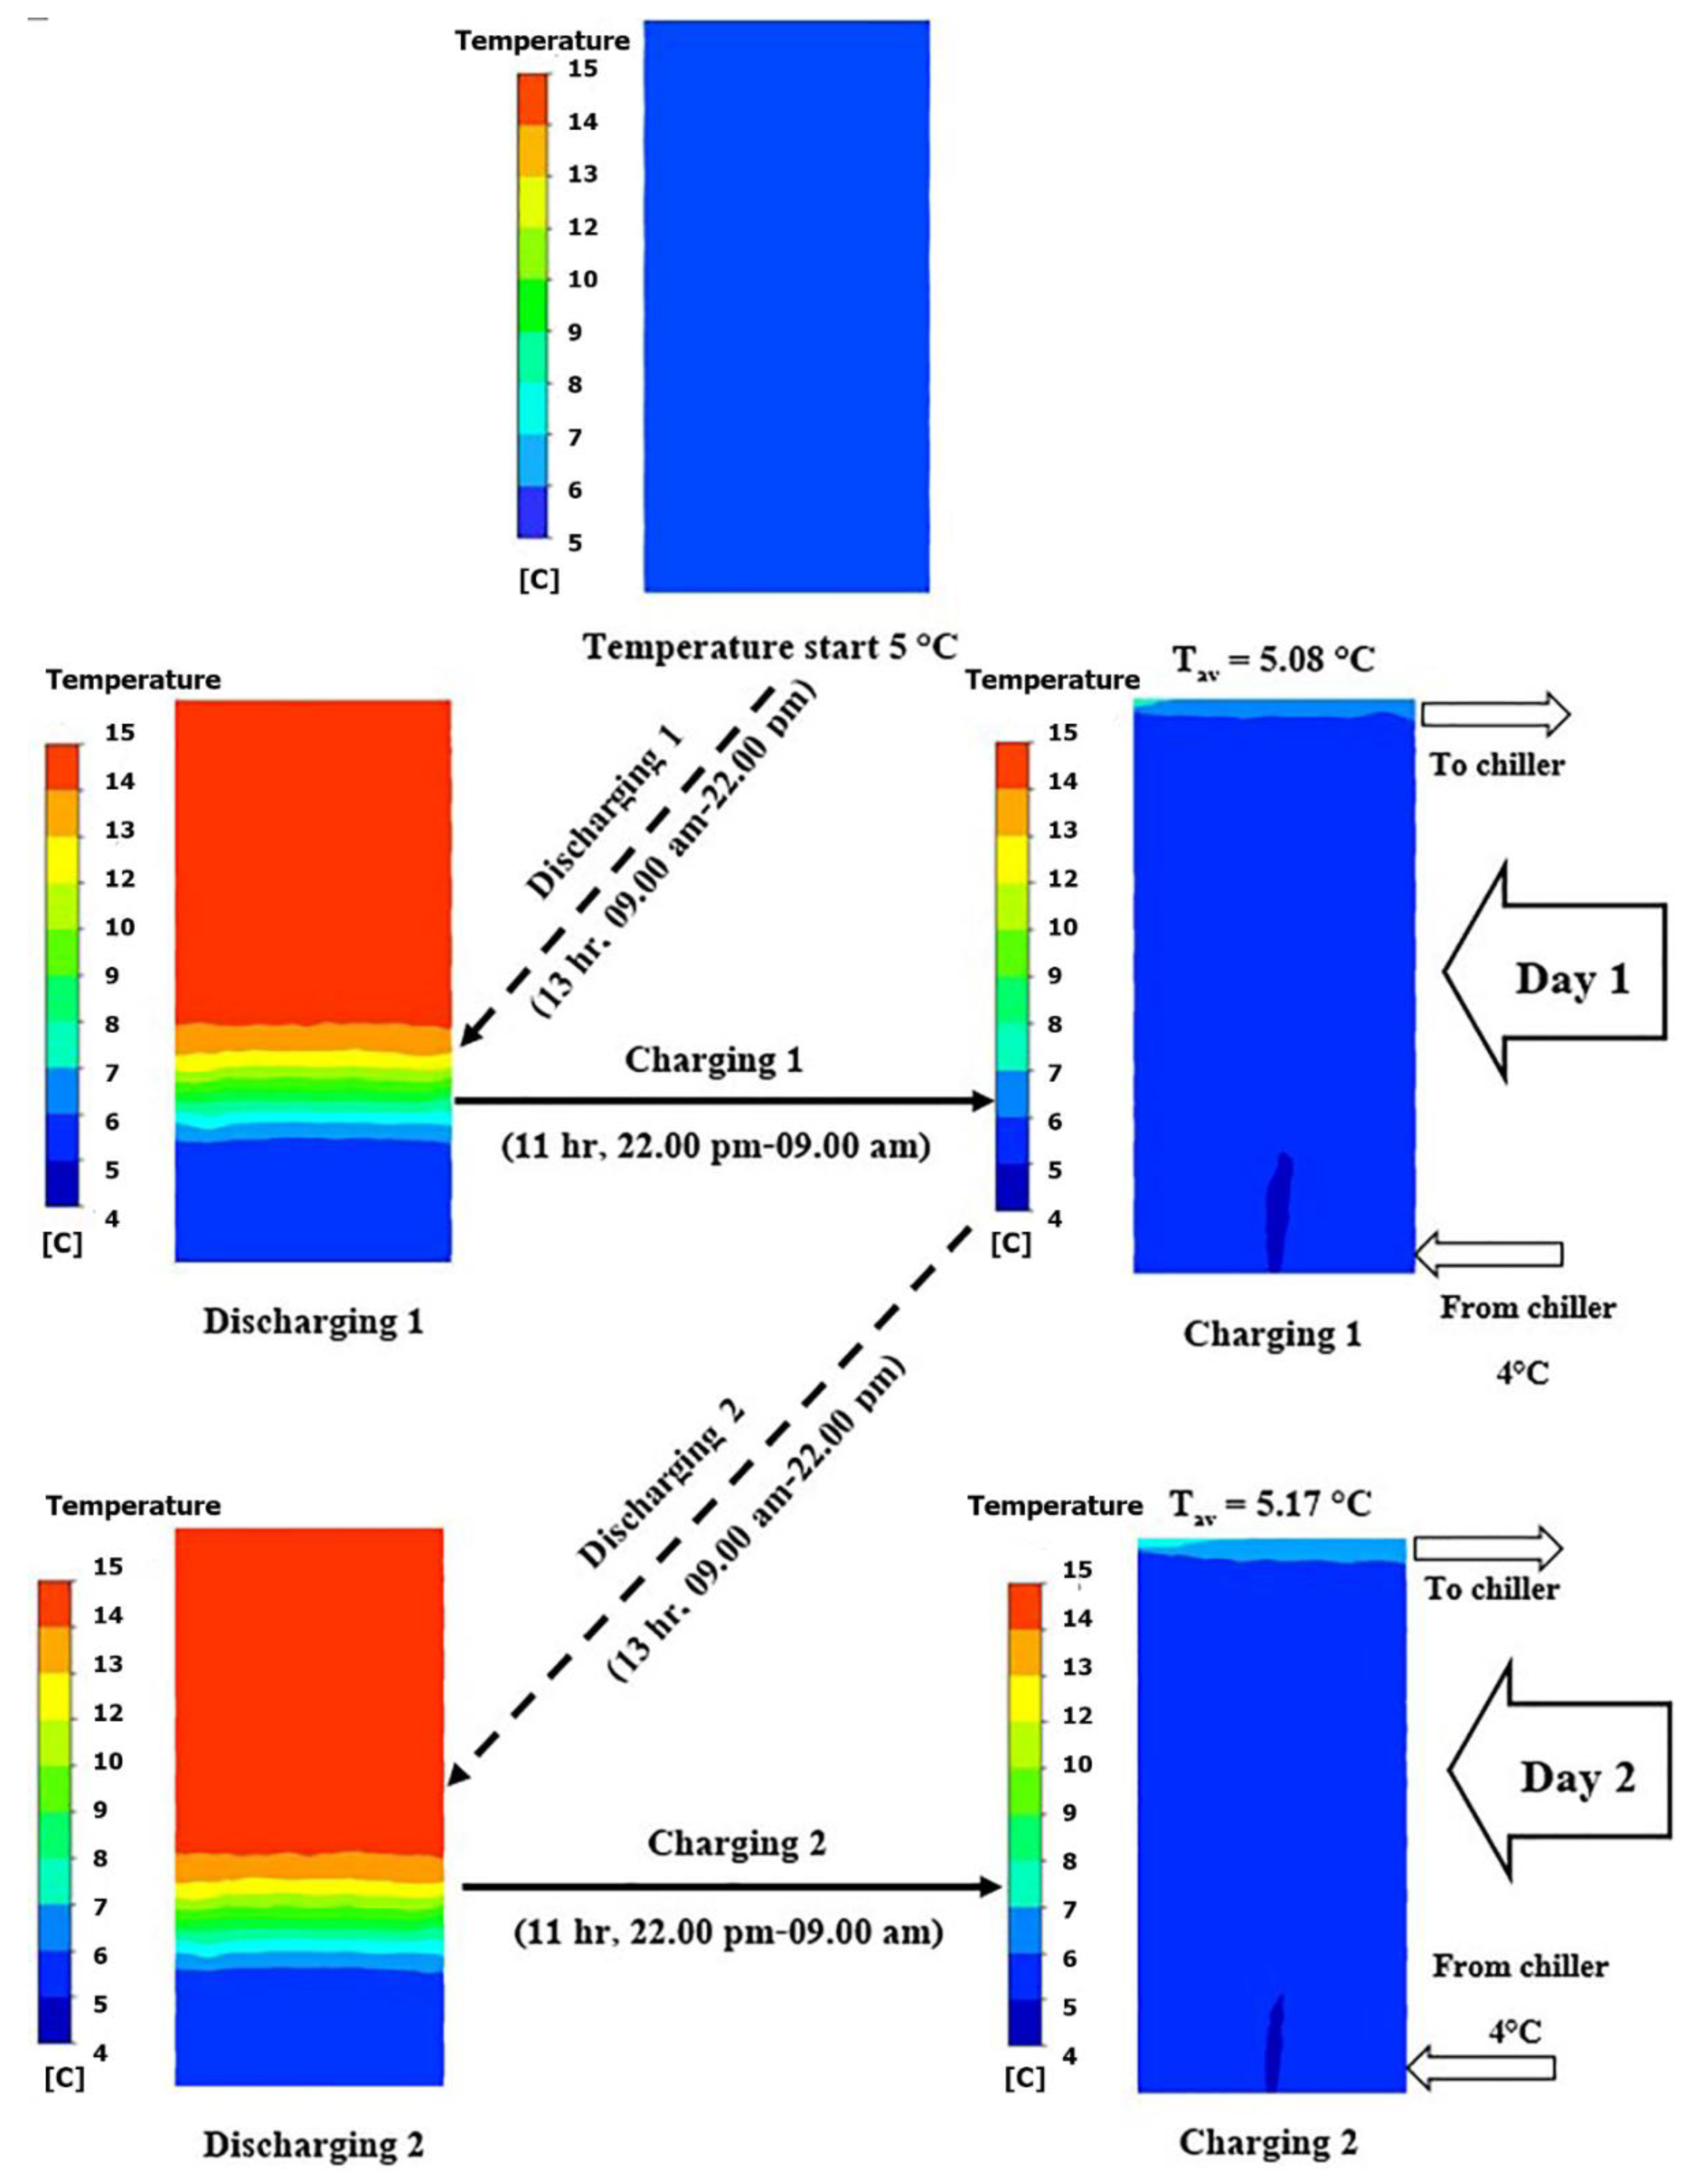
3.2. Operation Cycle of the Air Conditioning System with the TES Tank (H:D = 2)

3.2.1. When Chilled Water Was 5 °C from the Chiller

As mentioned above, the H:D ratio of 2 was selected for further analysis. As seen in Figure 7, the storage tank fully contained 5 °C water at the beginning. Then, the chilled water was discharged to serve the cooling loads for 13 h, resulting in the temperature profile in “discharging 1”. After charging for 11 h, the temperature inside the tank was as shown in “charging 1”. This was the end of the first day’s operation. On the next day, the chilled water having the profile in charging 1 (Tav = 5.33 °C) was further used during the daytime, giving the temperature changes seen in “discharging 2”. During the second night, the chiller could not cool the water back to 5 °C for the next day’s cooling (Tav = 6. 61 °C, as shown in “charging 2”). Therefore, the air conditioning system with TES could only be operated for two days of cooling and had to be charged for a longer time on the second night. This led to a reduction in temperature setpoint to 4 °C from the chiller in the charging stage, as presented in the next section.

3.2.2. When the Chilled Water Was 4 °C from the Chiller

In the charging stage, the chilled water from the chiller was set to 4 °C, and it was expected that the temperature profile during charging would be improved and able to serve the cooling loads for more cycles than that discussed in Section 3.2.1. As depicted in Figure 8, more operation cycles were achieved. The air conditioning system with TES could fully serve the loads for six days. On the seventh day, during the discharging stage, chilled water might not be enough for 13 h of service time. Moreover, at nighttime, the charging stage could not be completed with 5 °C water (Tav = 9.61 °C). Therefore, the operation cycle of the system was improved by decreasing the chilled water temperature from the chiller during the charging stage. This was more practical since the system could operate for six days and had to be stopped for a longer charging time on the seventh day, which means that for one week, the system could be on duty from Monday to Saturday and out of service on Sunday.

3.3. Economic Analysis

According to the move of peak demand from daytime to night-time, savings in energy consumption and energy cost were obtained as described in Section 2.4. The 350-TR chiller consumed 356.2 kW. For the one-week operation cycles (six days of operation with TES integrated system and one day off), the economic analysis is summarized in Table 5. It was noted that for a fair comparison, the system without TES was also calculated for six days of operation per week.
From Table 5, a 15.38% (222,268.8 kWh/year) energy savings was achieved when TES was used in conjunction with the air conditioning system. Based on the TOU tariff, the electrical bill could be reduced by 51.65% (approximately 0.1 million USD/year). In addition, the estimated construction cost of the TES tank was USD 579,396.26, giving a 5.55-year simple payback period.

4. Conclusions

This work was mainly focused on using TES integrated with an air conditioning system. The chilled water tank as TES was investigated for a suitable H:D ratio, which strongly influenced the temperature changes during discharging and charging stages. Regarding the temperature changes, the operating cycle of the air conditioning with TES was simulated. The results showed that the chilled water tank with an H:D ratio of 2 gave the best thermocline during both discharging and charging periods. Then, the operating cycle of the system was found to be only two days when 5 °C chilled water was returned from the chiller because on the second night; the chiller could not cool the water back to 5 °C for the next day’s service. Thus, the system could not handle the cooling on the third day. Hence, the water temperature from the chiller was decreased to 4 °C, and simulations were carried out to determine the temperature changes during discharging and charging stages for seven days of operation. The TES could repeatedly work with the air conditioning system for six days and was incapable of handling the cooling loads on the 7th day. This result means that the charging time needed to be prolonged on the 6th night. It was then recommended that this combined system should be used for six days (Monday to Saturday) and stopped for longer charging on the 7th day (Sunday). Finally, an economic analysis was determined for energy consumption and cost savings. Savings of 15.38% in energy consumption (222,268.8 kWh/year) were accomplished when TES was used in conjunction with the air conditioning system. Based on the TOU tariff, 51.65% of the electrical bill could be saved (approximately 0.1 million USD/year). In addition, the estimated construction cost of the TES tank was USD 579,396.26, reflecting a 5.55-year simple payback period. Finally, the dimensionless parameter (H:D) could be useful and applicable in design for any specific volume of a storage tank. In practice, when the volume of a tank is estimated for the load, the geometry of the tank is recommended for H:D = 2, as concluded from this study.

Author Contributions

T.W.: conceptual work, methodology, analysis of data, writing and proof of manuscript; W.T.: simulation works, analysis of data, drafting manuscript; A.S.: analysis of data, proof of manuscript; K.V.: drafting manuscript, analysis of data. All authors have read and agreed to the published version of the manuscript.

Funding

The APC was supported by the Centre for Alternative Energy Research and Development.

Data Availability Statement

Not applicable.

Acknowledgments

The authors would like to acknowledge the Centre of Alternative Energy Research and Development, Khon Kaen University for providing facilities and supports.

Conflicts of Interest

The authors declare no conflict of interest.

References

  1. Madurai Elavarasan, R.; Pugazhendhi, R.; Irfan, M.; Mihet-Popa, L.; Khan, I.; Campana, P. State-of-the-art sustainable approaches for deeper decarbonization in Europe—An endowment to climate neutral vision. Renew. Sustain. Energy Rev. 2022, 159, 112204. [Google Scholar] [CrossRef]
  2. Madurai Elavarasan, R.; Mudgal, V.; Selvamanohar, L.; Wang, K.; Huang, G.; Shafiullah, G.; Markides, C.; Reddy, S.; Nadarajah, M. Pathways toward high-efficiency solar photovoltaic thermal management for electrical, thermal and combined generation applications: A critical review. Energy Convers. Manag. 2022, 255, 115278. [Google Scholar] [CrossRef]
  3. Irfan, M.; Elavarasan, R.M.; Hao, Y.; Feng, M.; Sailan, D. An assessment of consumers’ willingness to utilize solar energy in China: End-users’ perspective. J. Clean. Prod. 2021, 292, 126008. [Google Scholar] [CrossRef]
  4. Nuvvula, R.S.S.; Devaraj, E.; Elavarasan, R.M.; Taheri, S.I.; Irfan, M.; Teegala, K.S. Multi-objective mutation-enabled adaptive local attractor quantum behaved particle swarm optimisation based optimal sizing of hybrid renewable energy system for smart cities in India. Sustain. Energy Technol. Assess. 2022, 49, 101689. [Google Scholar] [CrossRef]
  5. Miyahara, A.A.L.; Paixão, C.P.; Santos, D.R.d.; Pagin-Cláudio, F.; da Silva, G.J.; Bertoleti, I.A.F.; de Lima, J.S.; da Silva, J.L.; Candido, L.F.; Siqueira, M.C.; et al. Urban dendrochronology toolkit for evidence-based decision-making on climate risk, cultural heritage, environmental pollution, and tree management—A systematic review. Environ. Sci. Policy 2022, 137, 152–163. [Google Scholar] [CrossRef]
  6. Jaeseok, C.; Kwang, Y.L. Best Generation Mix Considering Air Pollution Constraints. In Probabilistic Power System Expansion Planning with Renewable Energy Resources and Energy Storage Systems; IEEE: Manhattan, NY, USA, 2022; pp. 111–126. [Google Scholar]
  7. Elavarasan, R.M. The motivation for renewable energy and its comparison with other energy sources: A review. Eur. J. Sustain. Dev. Res. 2019, 3, em0076. [Google Scholar] [CrossRef] [PubMed] [Green Version]
  8. Gangatharan, S.; Rengasamy, M.; Elavarasan, R.M.; Das, N.; Hossain, E.; Sundaram, V.M. A Novel Battery Supported Energy Management System for the Effective Handling of Feeble Power in Hybrid Microgrid Environment. IEEE Access 2020, 8, 217391–217415. [Google Scholar] [CrossRef]
  9. Mulopo, J. A mini-review of practical interventions of renewable energy for climate change in Sub-Saharan Africa in the last decade (2010–2020): Implications and perspectives. Heliyon 2022, 8, e11296. [Google Scholar] [CrossRef] [PubMed]
  10. Shafiullah, G.; Masola, T.; Samu, R.; Elavarasan, R.M.; Begum, S.; Subramaniam, U.; Romlie, M.F.; Chowdhury, M.; Arif, M.T. Prospects of hybrid renewable energy-based power system: A case study, post analysis of Chipendeke Micro-Hydro, Zimbabwe. IEEE Access 2021, 9, 73433–73452. [Google Scholar] [CrossRef]
  11. Martinot, E.; Chaurey, A.; Lew, D.; Moreira, J.R.; Wamukonya, N. Renewable energy markets in developing countries. Annu. Rev. Energy Environ. 2002, 27, 309–348. [Google Scholar] [CrossRef]
  12. Elavarasan, R.M.; Pugazhendhi, R.; Jamal, T.; Dyduch, J.; Arif, M.T.; Kumar, N.M.; Shafiullah, G.; Chopra, S.S.; Nadarajah, M. Envisioning the UN Sustainable Development Goals (SDGs) through the lens of energy sustainability (SDG 7) in the post-COVID-19 world. Appl. Energy 2021, 292, 116665. [Google Scholar] [CrossRef]
  13. Sarita, K.; Kumar, S.; Vardhan, A.S.S.; Elavarasan, R.M.; Saket, R.; Shafiullah, G.; Hossain, E. Power enhancement with grid stabilization of renewable energy-based generation system using UPQC-FLC-EVA technique. IEEE Access 2020, 8, 207443–207464. [Google Scholar] [CrossRef]
  14. Electricity Generating Authority of Thailand. Peak Demand. 2016. Available online: https://www.egat.co.th/en/news-announcement/news-406release/peakdemand-forecast-to-occur-during-march-may-2016-due-to-the-hot-weather (accessed on 9 November 2019).
  15. Parkpoom, S.; Harrison, G.P. Analyzing the Impact of Climate Change on Future Electricity Demand in Thailand. IEEE Trans. Power Syst. 2008, 23, 1441–1448. [Google Scholar] [CrossRef] [Green Version]
  16. Turner, J.H. Theoretical Sociology: A Concise Introduction to Twelve Sociological Theories; SAGE Publications: London, UK, 2014. [Google Scholar]
  17. Rehman, A.U.; Wadud, Z.; Elavarasan, R.M.; Hafeez, G.; Khan, I.; Shafiq, Z.; Alhelou, H.H. An Optimal Power Usage Scheduling in Smart Grid Integrated with Renewable Energy Sources for Energy Management. IEEE Access 2021, 9, 84619–84638. [Google Scholar] [CrossRef]
  18. Saffari, M.; de Gracia, A.; Fernández, C.; Belusko, M.; Boer, D.; Cabeza, L.F. Optimized demand side management (DSM) of peak electricity demand by coupling low temperature thermal energy storage (TES) and solar PV. Appl. Energy 2018, 211, 604–616. [Google Scholar] [CrossRef] [Green Version]
  19. Elavarasan, R.M.; Shafiullah, G.M.; Padmanaban, S.; Kumar, N.M.; Annam, A.; Vetrichelvan, A.M.; Mihet-Popa, L.; Holm-Nielsen, J.B. A Comprehensive Review on Renewable Energy Development, Challenges, and Policies of Leading Indian States with an International Perspective. IEEE Access 2020, 8, 74432–74457. [Google Scholar] [CrossRef]
  20. Kumar, N.M.; Chopra, S.S.; Chand, A.A.; Elavarasan, R.M.; Shafiullah, G.M. Hybrid Renewable Energy Microgrid for a Residential Community: A Techno-Economic and Environmental Perspective in the Context of the SDG7. Sustainability 2020, 12, 3944. [Google Scholar] [CrossRef]
  21. Elavarasan, R.M.; Singh, P.; Leoponraj, S.; Khanna, S.; Chandran, M. Solar Photovoltaics Integrated With Hydrated Salt-Based Phase Change Material. J. Sol. Energy Eng. 2022, 144, 051004. [Google Scholar] [CrossRef]
  22. Velmurugan, K.; Elavarasan, R.M.; De, P.V.; Karthikeyan, V.; Korukonda, T.B.; Dhanraj, J.A.; Emsaeng, K.; Chowdhury, M.S.; Techato, K.; el Khier, B.S.A.; et al. A Review of Heat Batteries Based PV Module Cooling—Case Studies on Performance Enhancement of Large-Scale Solar PV System. Sustainability 2022, 14, 1963. [Google Scholar] [CrossRef]
  23. Singh, P.; Elavarasan, R.M.; Kumar, N.M.; Khanna, S.; Becerra, V.; Newar, S.; Sharma, V.; Radulovic, J.; Khusainov, R.; Hutchinson, D. Photovoltaic Thermal Collectors with Phase Change Material for Southeast of England; Springer: Berlin/Heidelberg, Germany, 2020; pp. 1425–1430. [Google Scholar]
  24. Kubaha, K. A Feasibility Study on the Use of Cool Storage for Air-Conditioning in a Hotel. Master’s Thesis, King Mongkut’s University of Technology Thonburi, Bangkok, Thailand, 1989. [Google Scholar]
  25. Boonnasa, S.; Namprakai, P. The chilled water storage analysis for a university building cooling system. Appl. Therm. Eng. 2010, 30, 1396–1408. [Google Scholar] [CrossRef]
  26. Zhang, Z.; Turner, W.D.; Chen, Q.; Xu, C.; Deng, S. Tank size and operating strategy optimization of a stratified chilled water storage system. Appl. Therm. Eng. 2011, 31, 2656–2664. [Google Scholar] [CrossRef]
  27. Lin, H.; Li, X.H.; Cheng, P.S.; Xu, B.G. A New Air-Conditioning System with Chilled Water Storage. Appl. Mech. Mater. 2013, 405–408, 2964–2968. [Google Scholar]
  28. T, S. Design and Development of Ice Thermal Energy Storage System for Air Conditioning in a Greenhouse. Master’s Thesis, Chiang Mai University, Chiang Mai, Thailand, 2014. [Google Scholar]
  29. Yan, C.; Shi, W.; Li, X.; Zhao, Y. Optimal design and application of a compound cold storage system combining seasonal ice storage and chilled water storage. Appl. Energy 2016, 171, 1–11. [Google Scholar] [CrossRef]
  30. Al Quabeh, H.; Saab, R.; Ali, M.I.H. Chilled Water Storage Feasibility with District Cooling Chiller in Tropical Environment. J. Sustain. Dev. Energy Water Environ. Syst. 2020, 8, 132–144. [Google Scholar] [CrossRef]
  31. Soler, M.S.; Sabaté, C.C.; Santiago, V.B.; Jabbari, F. Optimizing performance of a bank of chillers with thermal energy storage. Appl. Energy 2016, 172, 275–285. [Google Scholar] [CrossRef]
  32. Comodi, G.; Carducci, F.; Nagarajan, B.; Romagnoli, A. Application of cold thermal energy storage (CTES) for building demand management in hot climates. Appl. Therm. Eng. 2016, 103, 1186–1195. [Google Scholar] [CrossRef]
  33. Sanaye, S.; Hekmatian, M. Ice thermal energy storage (ITES) for air-conditioning application in full and partial load operating modes. Int. J. Refrig. 2016, 66, 181–197. [Google Scholar] [CrossRef] [Green Version]
  34. Luo, N.; Hong, T.; Li, H.; Jia, R.; Weng, W. Data analytics and optimization of an ice-based energy storage system for commercial buildings. Appl. Energy 2017, 204, 459–475. [Google Scholar] [CrossRef] [Green Version]
  35. Said, M.A.; Hassan, H.H. A study on the thermal energy storage of different phase change materials incorporated with the condenser of air-conditioning unit and their effect on the unit performance. Energy Build. 2019, 202, 109353. [Google Scholar] [CrossRef]
  36. Narayanasamy, R.; Vellaichamy, P.; Ram, M.; Ramalingam, V. Experimental investigation on packed bed cool storage system for supply-demand management in building air-conditioning system suitable for micro thermal grid. Therm. Sci. 2019, 265. [Google Scholar] [CrossRef] [Green Version]
  37. Nie, B.; She, X.; Zou, B.; Li, Y.; Li, Y.; Ding, Y. Discharging performance enhancement of a phase change material based thermal energy storage device for transport air-conditioning applications. Appl. Therm. Eng. 2020, 165, 114582. [Google Scholar] [CrossRef]
  38. Nie, B.; Du, Z.; Zou, B.; Li, Y.; Ding, Y. Performance enhancement of a phase-change-material based thermal energy storage device for air-conditioning applications. Energy Build. 2020, 214, 109895. [Google Scholar] [CrossRef]
  39. Nelson, J.E.B.; Balakrishnan, A.R.; Murthy, S.S. Experiments on stratified chilled-water tanks: Expériences menées avec des reservoirs d’accumulation d’eau glacée à stratification. Int. J. Refrig. 1999, 22, 216–234. [Google Scholar] [CrossRef]
  40. Osman, K.; al Khaireed, S.M.N.; Ariffin, M.K.; Senawi, M.Y. Dynamic modeling of stratification for chilled water storage tank. Energy Convers. Manag. 2008, 49, 3270–3273. [Google Scholar] [CrossRef]
  41. Jabbar, A.; Khalifa, N.; Mustafa, A.T.; Khammas, F.A. Experimental Study of Temperature Stratification in a Thermal Storage Tank in the Static Mode for Different Aspect Ratios. J. Eng. Appl. Sci. 2011, 6, 53–60. [Google Scholar]
  42. Yaïci, W.; Ghorab, M.; Entchev, E.; Hayden, S. Three-dimensional unsteady CFD simulations of a thermal storage tank performance for optimum design. Appl. Therm. Eng. 2013, 60, 152–163. [Google Scholar] [CrossRef]
  43. Milaré, M.M.; Rocha, M.d.S.; Simões-Moreira, J.R. Hydrodynamic considerations on the performance of chilled water thermal storage tanks in the discharge cycle. J. Braz. Soc. Mech. Sci. Eng. 2015, 37, 285–296. [Google Scholar] [CrossRef]
  44. Ramesh, V.; Vishwakarma, S.; Roy, A.; Shendage, D. Analytical and experimental analysis of thermo-cline thermal energy storage tank. Int. Eng. Res. J. 2016, 1058–1068, ISSN: 2395-1621. [Google Scholar]
  45. Guo, X.; Goumba, A. Process Intensification Principles Applied to Thermal Energy Storage Systems—A Brief Review. Front. Energy Res. 2018, 6, 17. [Google Scholar] [CrossRef] [Green Version]
  46. Kurşun, B.; Ökten, K. Effect of rectangular hot water tank position and aspect ratio on thermal stratification enhancement. Renew. Energy 2018, 116, 639–646. [Google Scholar] [CrossRef]
  47. Karim, A.; Burnett, A.; Fawzia, S. Investigation of Stratified Thermal Storage Tank Performance for Heating and Cooling Applications. Energies 2018, 11, 1049. [Google Scholar] [CrossRef] [Green Version]
  48. Homan, K.O.; Soo, S.L. Laminar flow efficiency of stratified chilled-water storage tanks. Int. J. Heat Fluid Flow 1998, 19, 69–78. [Google Scholar] [CrossRef]
  49. Bahnfleth, W.P.; Song, J. Constant flow rate charging characteristics of a full-scale stratified chilled water storage tank with double-ring slotted pipe diffusers. Appl. Therm. Eng. 2005, 25, 3067–3082. [Google Scholar] [CrossRef]
  50. Chung, J.D.; Cho, S.H.; Tae, C.S.; Yoo, H. The effect of diffuser configuration on thermal stratification in a rectangular storage tank. Renew. Energy 2008, 33, 2236–2245. [Google Scholar] [CrossRef]
  51. Castell, A.; Medrano, M.; Solé, C.; Cabeza, L.F. Dimensionless numbers used to characterize stratification in water tanks for discharging at low flow rates. Renew. Energy 2010, 35, 2192–2199. [Google Scholar] [CrossRef]
  52. Karim, M.A. Experimental investigation of a stratified chilled-water thermal storage system. Appl. Therm. Eng. 2011, 31, 1853–1860. [Google Scholar] [CrossRef]
  53. Mira-Hernández, C.; Flueckiger, S.M.; Garimella, S.V. Numerical Simulation of Single- and Dual-media Thermocline Tanks for Energy Storage in Concentrating Solar Power Plants. Energy Procedia 2014, 49, 916–926. [Google Scholar] [CrossRef] [Green Version]
  54. Abdelhak, O.; Mhiri, H.; Bournot, P. CFD analysis of thermal stratification in domestic hot water storage tank during dynamic mode. Build. Simul. 2015, 8, 421–429. [Google Scholar] [CrossRef]
  55. Yang, Z.; Chen, H.; Wang, L.; Sheng, Y.; Wang, Y. Comparative study of the influences of different water tank shapes on thermal energy storage capacity and thermal stratification. Renew. Energy 2016, 85, 31–44. [Google Scholar] [CrossRef]
  56. Moncho-Esteve, I.J.; Gasque, M.; González-Altozano, P.; Palau-Salvador, G. Simple inlet devices and their influence on thermal stratification in a hot water storage tank. Energy Build. 2017, 150, 625–638. [Google Scholar] [CrossRef]
  57. Fang, Y.; Niu, J.; Deng, S. Optimizing LHS system using PCM in a tube-in-tank design for emergency cooling. Energy Procedia 2017, 142, 3381–3387. [Google Scholar] [CrossRef]
  58. Song, X.; Zhu, T.; Liu, L.; Cao, Z. Study on optimal ice storage capacity of ice thermal storage system and its influence factors. Energy Convers. Manag. 2018, 164, 288–300. [Google Scholar] [CrossRef]
  59. Fang, Y.; Niu, J.; Deng, S. Numerical analysis for maximizing effective energy storage capacity of thermal energy storage systems by enhancing heat transfer in PCM. Energy Build. 2018, 160, 10–18. [Google Scholar] [CrossRef]
  60. Sun, Q.; Wang, H.; Dong, K.; Lv, T.; Kang, Z. Experimental study on the thermal performance of a novel physically separated chilled water storage tank. J. Energy Storage 2021, 40, 102628. [Google Scholar] [CrossRef]
  61. Sebzali, M.J.; Ameer, B.; Hussain, H.J. Comparison of energy performance and economics of chilled water thermal storage and conventional air-conditioning systems. Energy Build. 2014, 69, 237–250. [Google Scholar] [CrossRef]
  62. Majid, M.A.A.; Hui, P.S.; Soomro, A.A. Performance assessment of stratified chilled water thermal energy storage tank at district cooling plant. IOP Conf. Ser. Mater. Sci. Eng. 2020, 863, 012032. [Google Scholar] [CrossRef]
  63. Shakerin, M.; Eikeskog, V.; Li, Y.; Harsem, T.T.; Nord, N.; Li, H. Investigation of Combined Heating and Cooling Systems with Short- and Long-Term Storages. Sustainability 2022, 14, 5709. [Google Scholar] [CrossRef]
  64. Shin, D.U.; Ryu, S.R.; Kim, K.W. Simultaneous heating and cooling system with thermal storage tanks considering energy efficiency and operation method of the system. Energy Build. 2019, 205, 109518. [Google Scholar] [CrossRef]
  65. Kurşun, B. Thermal stratification enhancement in cylindrical and rectangular hot water tanks with truncated cone and pyramid shaped insulation geometry. Sol. Energy 2018, 169, 512–525. [Google Scholar] [CrossRef]
  66. Karim, A. Performance evaluation of a stratified chilled-water thermal storage system. World Acad. Sci. Eng. Technol. 2009, 53, 326–334. [Google Scholar]
  67. Abd Majid, M.A.; Muhammad, M.; Hampo, C.C.; Akmar, A.B. Analysis of a Thermal Energy Storage Tank in a Large District Cooling System: A Case Study. Processes 2020, 8, 1158. [Google Scholar] [CrossRef]
  68. Hassan, F.M.; Theeb, M.A. Effect of Diffuser Height on Thermocline in Stratified Chilled Water Storage Tank. J. Appl. Fluid Mech. 2020, 14, 429–438. [Google Scholar]
  69. Tipasri, W.; Wongwuttanasatian, T. Effect of height to diameter ratio of chilled water storage tank on temperature gradient during discharging. Energy Procedia 2019, 156, 254–258. [Google Scholar] [CrossRef]
Figure 1. An air conditioning system operating with a chilled water tank.
Energies 15 08940 g001
Figure 2. Details of the modeled tank. (A) discharging (B) charging.
Energies 15 08940 g002
Figure 3. 3D shapes with different H:D ratios.
Energies 15 08940 g003
Figure 4. Unstructured grid of 3D shapes with different H:D ratios.
Energies 15 08940 g004
Figure 5. Variations of water temperature inside tanks after 13 h of discharging [69].
Energies 15 08940 g005
Figure 6. Variations of water temperature inside tanks after 11 h of charging.
Energies 15 08940 g006
Figure 7. Temperature profiles during discharging and charging stages with 5 °C chilled water.
Energies 15 08940 g007
Figure 8. Temperature profiles during discharging and charging stages when chilled water was 4 °C.
Energies 15 08940 g008aEnergies 15 08940 g008bEnergies 15 08940 g008c
Table 1. Literature study of heating and cooling thermal energy storage technique.
AuthorsApplication TypeStudy EnvironmentLocationTank Size H × D (m)/H:DMethods and Outcome
Sun et al. [60]CoolingStatic and dynamic experimentsChina1.2 × 1.6
  • Hot and cold water is separated in the storage tank compared with the conventional tanks to minimize operational difficulties.
  • Increase in water flow rate maintains the lower temperature difference for both charging and discharging cycles.
  • Figure of merit and percent cold recoverable reached 93.2% and 91%, respectively.
Sebzali et al. [61]CoolingBuilding energy simulation programKuwait-
  • Simulation is performed to minimize the peak power consumption from the grid between 11:00 and 15:00. Charging period of chilled water is started at 18:00, considering the low peak demand.
  • Different types of load optimization techniques are examined using real-time load meteorological data.
  • Using the cold-water storage tank, a maximum of 87.5% peak power consumption is minimized compared with the conventional systems.
Majid and Soomro [62]CoolingExperimentMalaysia15 × 22.3
  • Historical data of district cooling plant is taken to evaluate the figure of merit and operation of the plant in turns of charging and discharging nature.
  • Half-cycle figure of merit is found to be 0.97 for the year 21–30 January 2016 (10 days average).
  • Noticeable variation in thermocline is noted between 2016 and 2017.
  • Over the operation of the plant, tank performance deteriorated due to poor maintenance.
Shakerin et al. [63]Cooling, heating and free coolingMATLAB simulationNorway-
  • A short-term hot water storage system simulation is performed using a storage tank and a long-term storage system simulation is performed using a borehole technique considering the cost effective.
  • Simulation is performed for military base and hospital in Norway to optimize the size of the storage tank.
  • Over the period of operation, short-term storage system efficiency deterioration is less than the long-term storage system.
Shin et al. [64]Cooling and heatingTRNSYS simulationRepublic of Korea-
  • Simulation is performed for Korean winter climatic conditions where the heating and cooling load can be utilized in the same day.
  • Radiating heating and cooling technique achieve a higher system performance with a minimal rate of heat loss compared withthe conventional methods.
  • Developed geothermal-based heating and cooling system significantly reduces the conventional load to maximum of 49.03%.
Bai et al. [65]Heating and coolingSimulation and experimentChina1:10, 1:5, 1:1, 5:1, 10:1
  • A H:D = 1:1 attains less heat loss compared with the other models due to less surface area, increase in H:D gradually minimizes the efficiencies.
  • Over the extend period of operation, H:D = 10:1 exhibits lower efficiency and exergy compared with the H:D.
  • Entropy generation is inversely proportional to the energy and exergy profile.
  • The highest and lowest temperature difference over the extended period of operation attaine for 10:1 and 5:1, respectively, compared with others.
Karim et al. [66]CoolingSimulationAustralia-
  • During off-peak demand, water in the storage tank is charged and utilized for the daytime 8:00–17:00.
  • Using a chilled water storage tank, 90% of conventional thermal load is minimized during the peak load demand.
  • Increase in flow rate of water adverse to the overall efficiency, a higher flow rate of 8 L/minimized the 8% efficiency compared with 4.2 L/min.
Majid et al. [67]CoolingSimulation and experimentMalaysia27.8 × 24.5
  • Cold energy is charged during the off-peak period from 22:00 to 08:00 and discharging cycle performed during the sunshine hours where the higher cooling demand occurred generally.
  • During January, higher thermocline attained than October indicating the thermal energy storage performs well in minimizing the conventional cooling load.
  • Half figure of merit for January and October are obtained as 0.96 and 0.98, respectively.
Hasan and Theeb [68]CoolingExperimentIraq1.1 × 0.4
  • Four elbow-type diffusers are placed in the cold-water region to analyse the performance of the discharge rate at different height of outlet.
  • Extraction of cold energy from the diffuser closer to the bottom surface of the storage tank is higher than the top diffuser.
Table 2. Dimensions of the modeled tanks at various H:D ratios.
ModelHeight (m)Diameter (m)H:D Ratio
Tank 110.2914.750.7
Tank 212.0013.640.8
Tank 314.0012.601.1
Tank 415.2012.101.2
Tank 516.6011.601.4
Tank 618.3811.001.6
Tank 720.7510.302.0
Table 3. Simulation validation with lab-scale experiment at 1 h.
Temperature MeasurementDischarging (°C)Charging (°C)
SimulationExperimentΔTSimulationExperimentΔT
T11516.11.16.57.20.7
T21516.31.36.57.10.6
T31515.90.955.30.3
T41516.11.155.40.4
T513.514.81.355.60.6
T613.514.61.155.30.3
T755.70.755.50.5
T855.50.555.40.4
Table 4. Amount of remaining 5 °C water in the tanks after 13 h of discharge.
ModelH:DVolume of Cold Water (m3)Cold Water (m3)Cold Water (%)
Tank 10.71755--
Tank 20.81755277.4915.81
Tank 31.11755304.0817.33
Tank 41.21755330.6518.84
Tank 51.41755342.7619.53
Tank 61.61755358.0920.40
Tank 72.01755374.7621.35
Table 5. Economic analysis summary.
AnalysisResults
electricity power of 350-TR chiller356.2 kW
TOU tariff (on-peak)
TOU tariff (off-peak)
0.14 USD/unit
0.08 USD/unit
Without TES system
Period of operation per day13 h
electricity charge per day (TOU Rate)356.2 × 13 × 0.14 = 648.28 USD/Day
electricity charge per week (6 days operation) 648.28 × 6 = 3889.70 USD/week
electricity charge per year year 3889.70 × 52 = 202,264.61 USD/year
energy consumption per year356.2 × 13 × 6 × 52 = 1,444,747.2 kWh/year
With TES integrated system
Period of operation per day (h)11 h
electricity charge per day (TOU Rate)356.2 × 11 × 0.08 = 313.46 USD/Day
electricity charge per week 313.46 × 6 = 1880.76 USD/week
electricity charge per year 1880.76 × 52 = 97,799.52 USD/year
energy consumption per year356.2 × 11 × 6 × 52 = 1,222,478.4 kWh/year
Savings
electrical energy (kWh/year) saving222,268.8 kWh/year or 15.38%
electrical cost (US$/year) saving104,465.09 USD/year or 51.65%
Payback period5.55 years
Publisher’s Note: MDPI stays neutral with regard to jurisdictional claims in published maps and institutional affiliations.

