1. Introduction
The building sector is considered to be a significant consumer of energy. The operation of buildings—including services such as heating, ventilation and air conditioning (HVAC systems)—accounts for 30% of global total energy consumption [
1]. Moreover, nowadays people tend to spend up to ca. 90% of their time indoors [
2,
3] and expect satisfactory indoor environmental conditions that would ensure the overall comfort and well-being of room users. However, this might require energy input for proper air treatment processes. Finding a solution to providing acceptable indoor environments for the people while keeping the building’s energy demand low is an issue of utmost importance.
An indoor environment assessment is performed in order to determine human subjective responses. These responses depend on a number of physical parameters within rooms such as ambient and radiation temperature, air movement, relative humidity, carbon dioxide concentration, etc. [
4], as well as outdoor air parameters [
5]. However, there are also variables that can affect differences in the perception of individuals present in the same room. People from different backgrounds and locations can experience indoor environments differently [
6,
7]. Montazami et al. [
8] revealed a relation between children’s socio-economic background and their perception of thermal comfort in classrooms. The age of the respondents also plays a role. According to [
9], older people have different comfort needs in relation to their younger counterparts, but the differences are not so big. In [
10], it was reported that younger people (below 25 y.o.) expressed comfort at a slightly but not significantly higher temperature than older ones. Indraganti and Rao [
11] observed a considerable but poor correlation between age and thermal sensation as well as overall comfort. On the other hand, an important factor affecting subjective human responses is gender. It proved to be a significant aspect in the thermal comfort study [
7] with female respondents having a narrower neutral temperature range and adjusting their clothing level more swiftly as temperature changes. The study [
11] revealed that women showed slightly higher thermal sensation, with a preference for a warmer environment. At the same time their thermal acceptance was higher than that in men. Statistically significant gender differences were confirmed in [
10], regarding comfort temperature, thermal acceptability as well as regarding the use of controls such as windows. Karjalainen [
12] reported that women were less satisfied with thermal environments than men and felt both cold and hot more often than men. According to [
13], thermal comfort temperature was significantly higher for women than for men (overall 24.0 °C and 23.2 °C, respectively). A study conducted by Parsons [
14] for identical clothing and activity confirmed the differences in thermal responses for both genders. The author concluded that women tend to be cooler than men in cool conditions. Moreover, Luo et al. [
15] pointed out that pregnancy and menopause status could influence thermal sensations in rooms. Additionally, individual preferences can have an impact on the subjective assessment. It needs to be noted, however, that many of the above-mentioned factors might be of less importance to the final results when studies are conducted with a large number of participants.
The studies of indoor environment assessment are conducted either in actual rooms of residential, office or public utility buildings (e.g., field—based studies) or in simulated conditions of climate chambers.
Fang et al. [
16] carried out field-based experiments into thermal comfort in classrooms of the City University of Hong Kong. The comfort range was found to be within the temperature values of 21.56–26.75 °C. A study [
17] of thermal indoor environments in Italian university classrooms showed that the students expressed “very satisfactory” thermal responses for the air temperature values of 20.9–26.4 °C. However, in a later paper [
18] the same authors reported different thermal sensation votes for various classrooms. Krawczyk et al. [
19] focused on comfort perceptions expressed in the questionnaires accompanied by temperature and humidity measurements at Polish and Spanish universities. It was reported that the optimal temperature values depended on the location (for Polish students it was 21.7–22.3 °C, while for the Spanish students it was 23.3–24.8 °C). Similarly, Sakellaris et al. [
20] confirmed that relations between indoor environment and users’ comfort depend upon the socio-cultural context, as well as personal and building features. Their digital questionnaire survey covered over 7400 workers in almost 170 office buildings in eight European countries. Kim et al. [
21] carried out field-based tests in a university building in the United Arab Emirates. With regards to the overall indoor environmental quality, over half of the respondents felt uncomfortable and the remaining ones felt neutral. These unfavourable sensations resulted mostly from cold and stuffy air conditions as well as draught. Altomonte et al. [
22] indicated that there are some crucial physical factors that influence overall comfort (namely lighting conditions, temperature, sound and air quality), but other (non-physical) factors can play a role, too. Moreover, Göçer et al. [
23] reported that indoor and outdoor noise, restricted access to daylight as well as to the outside view, building/work aesthetics and personal control over building systems might have an impact on the occupants’ satisfaction. The overall satisfaction can also be influenced by indoor air quality, which is usually associated with the carbon dioxide concentration. Thus, guidelines regarding limiting values of CO
2 are proposed [
24,
25]. Vilcekova et al. [
26] studied indoor air quality in Slovak primary school classrooms. It was reported that some 53% of the students rated the air quality as acceptable while almost 73% rated it as stuffy. Furthermore, they regarded poor air quality as the most significant problem. Aguilar et al. [
27] indicated the presence of poor air quality in Spanish university classrooms, where the carbon dioxide level exceeded the allowable limit. However, Kim et al. [
21] reported that even at a low CO
2 concentration, the respondents assessed the indoor air quality as low (with 63% of the respondents feeling uncomfortable). A lack of operable windows might have been a source of this problem. Similarly, inadequate ventilation proved to be a problem (to be addressed using different techniques [
28,
29,
30,
31]); however, it is not so prevalent and/or serious, especially in modern intelligent buildings [
32] or even in public utility buildings located in a tropical climate [
33]. Despite the wealth of research results supporting the claim that air quality is related to the carbon dioxide concentration, Clements et al. [
34] reported poor user satisfaction despite low carbon dioxide concentration, which might have been caused by the absence of natural light and the presence of noise, rather than a consequence of air quality degradation. Similarly, people who studied at an elevated temperature of 30 °C considered the air quality to be worse in relation to a thermal environment of 22 °C, as reported in [
35].
The tests in simulated conditions are typically conducted for much smaller numbers of participants. Geng et al. [
36] carried out research in a 35 m
2 room at Tsinghua University in Beijing (China) with an adjusted indoor atmosphere, in which 21 people participated. The biggest overall dissatisfaction was observed at the air temperature of 16.2 °C (about 70% were dissatisfied), while the air temperature of 24 °C proved to be most favourable. The study also showed that air quality satisfaction was as a result of the air temperature (with the biggest satisfaction observed for the lowest air temperature of 16.2 °C and the biggest dissatisfaction observed for 22 °C and 24 °C), which supports the claims presented in [
34,
35] regarding the fact that CO
2 levels might not be the only source of poor-quality sensations.
Climate chamber experiments enable experiments to be carried out in a broad range of indoor environmental parameters. Yang et al. [
37] conducted tests in a climate chamber in China and collected 440 thermal responses from eighty students (22 thermal conditions were created in the chamber with an ambient temperature that varied from 26 to 32 °C and a relative humidity that varied from 40 to 90%). The authors proved the inaccuracy of the selected thermal comfort model. Ji et al. [
38] performed thermal comfort tests in a climate chamber in order to determine how the previous thermal environment may influence the present sensations. The authors claimed that humans’ evaluations may be considered a combination of both past and present feelings. Zhang et al. [
39] studied the sensations of 60 people in the climate chamber at temperatures of 20–32 °C and humidity from 50% to 70% in order to determine if there is any difference between the responses of the respondents from buildings equipped with a centralised air conditioning system (half of the group) and with a split-type air conditioner (the other half of the group). The results showed that there were differences in the mean skin temperature values, but no significant differences were observed for other physiological responses. Similarly, both groups reported the same neutral temperatures (almost 27 °C). Soebarto et al. [
40] compared the thermal responses of 22 older and 20 younger people. Four test conditions were set in the environmental chamber. The authors found no considerable differences between the thermal sensations and the comfort of older vs. younger subjects. Chen et al. [
41] used a climatic chamber for investigations of the thermal responses of 26 elderly Nordic people. It was reported that the neutral temperature of these elderly respondents from Northern Europe was 26 °C, while their preferred temperature was 26.5 °C. Jian et al. [
42] studied the thermal sensations of 29 people from China in a climate chamber. The authors reported that the sensations changed even after the ambient temperature became stable, which is an important finding that should be considered during the analysis of climate chamber test results. Ahmad et al. [
43] conducted tests in a climate chamber with temperatures in the range of 19–29 °C. An air temperature of 23 °C proved to be most satisfactory. The authors found a linear correlation between overall thermal comfort and thermal sensations. Dong et al. [
44] analysed the thermal responses of 22-year-old migrants in China in the climate chamber. The air temperature varied from 18 to 33 °C, while relative humidity varied from 42 to 52%. The subjective thermal sensation vote ranged from −2.8 (at 18 °C) to +2.7 (at 33 °C). The most favourable value of 0.1 was obtained at 26 °C. In the study, thermal comfort was also tested as well as skin temperature as a marker of thermal adaptation. In [
45], climate chamber tests on 20 walking men were presented. The operative temperature ranged from 23 to 29 °C, while the air velocity ranged from 0.05 to 0.82 m/s. Increased velocity values led to improved thermal comfort in the simulated summer conditions. Very recently, Upadhyay et al. [
46] examined the influence of relative humidity and air velocity on thermal sensation, comfort and preferences in a sub-tropical climate. The tests were carried out in a controlled climate chamber. Sixteen people took part in it, while each underwent one hundred and forty experimental sets covering the temperature range of 20–40 °C, relative humidity of 30–70% and air velocity of 0.25–2.0 m/s. The comfort temperature was found to vary from 25.7 to 32.9 °C. On the other hand, Yang et al. [
47] aimed to determine thermal responses at high temperature values (29–40 °C), resembling those encountered in a spinning workshop. Forty students participated in the tests. They were exposed to over a hundred state points in a controlled climate chamber. Temperatures above 38 °C were considered to be unacceptable.
Indoor environment studies are conducted either in actual rooms of residential, office or public utility buildings or in simulated conditions of climate chambers. However, people only live in “real” buildings. Thus, the question arises if data obtained in climate chambers can be used in practice (for example, for the design of heating and air conditioning systems, or for developing reliable models of thermal comfort). There is a question if building standards, which were developed based on climate chamber data, can provide accurate results regarding people’s sensations in actual rooms of various buildings. This issue was raised by de Dear [
48] who claimed that climate chambers have certain constraints in relation to field-based studies such as sample size, demographics, measurement procedures, questionnaires, clothing resistance, etc. Thus, the test results obtained in climate chamber experiments might have limited application to the development of guidelines and the possibility of reaching a conclusion about the nature of indoor environment assessment by the respondents in actual rooms. What is more, psychological aspects related to the fact that respondents are situated in a closed space of a chamber might also play a role. Consequently, there might be differences between the results obtained in the actual and simulated conditions. Moreover, Sakellaris et al. [
20] confirmed that room users’ perceptions depend upon their socio-cultural context, as well as personal and building features. Thus, in the present study all the experimental conditions are the same for both environments tested. The current paper is focused on the comparison of human responses regarding the overall comfort, air quality and humidity assessment in these two different environments with the same experimental conditions (regarding measurement methodology, demographics, etc.). Typically, studies are conducted either in actual rooms or in simulated conditions of climate chambers. A direct comparison of the data for these two environments might be practically impossible or at least very challenging due to differences in the study groups and experimental conditions. The present study is free from these limitations. It provides experimental data of a uniform nature for both environments. Such a study has not been found in the literature and the present paper aims to bridge this research gap.
2. Materials and Methods
This study took place in the field-based environment of educational rooms (lecture/classrooms) located in five university buildings in Kielce (central Poland), as well as in the climate chamber, which is also situated in one of the buildings.
Figure 1a presents two out of the five buildings, where the tests occurred, while
Figure 1b shows the climate chamber (located in the laboratory hall behind the buildings shown in
Figure 1a).
The experimental procedure consisted of conducting direct measurements of the physical parameters within each educational room and the climate chamber. The following values were recorded with the use of a microclimate meter: air and globe temperature, air speed, relative humidity and CO2. At the same time, anonymous questionnaires containing questions about the subjective assessment of sensations regarding the indoor environment were handed over to the occupants who completed them within a few minutes.
The microclimate meter recorded the environment parameters at the rate of one second. However, an analysis of the data was conducted for the values of these parameters as they were at the moment of completing the questionnaires by the respondents. The changes of these parameters within this short period of time were well within the error bands of the measuring system.
Table 1 shows the basic technical data of the testing device (a system consisting of the microclimate meter with the probes).
The measuring system consisting of the microclimate meter with adequate probes was mounted on the tripod and placed as close as possible to the area where the occupants were seated in the educational rooms (most often in the centre of these rooms) and in the centre of the climate chamber.
Figure 2 presents the microclimate meter situated in a lecture room of the “Energis” building.
During this study, the respondents filled in anonymous questionnaires containing questions on their subjective assessment of the environmental conditions within the rooms. In total, 1302 questionnaire forms were collected in 92 educational rooms of the 5 university buildings. The tests in the climate chamber produced 480 questionnaires covering 60 datasets (with 10 values of air temperature and 3 values of relative humidity for 2 types of clothing: summer and winter).
The number of people in each educational room ranged from 10 to 56. The surface area of the rooms varied from 24.5 m
2 to 461.6 m
2, while their cubature varied from 68.5 m
3 to 1430.9 m
3. The details of the geometry of the educational rooms are provided in
Table S1 of the
Supplementary Material, together with time and weather details at the moment of conducting the measurements. The area of the climate chamber equaled 4.05 m
2, while its cubature was 9.3 m
3. The participants in both of the environmental conditions were students, the average age and BMI (body mass index defined as a ratio of weight in kilograms divided by height in meters squared) of the respondents in the field-based tests were 22.4 y.o. and 23.3 kg/m
2, while in the climate chamber they were 25.8 y.o. and 23.4 kg/m
2, respectively. The average clothing thermal insulation was 0.59 clo in the case of the field-based tests and 0.65 clo in the climate chamber tests. All the respondents were Polish and came from the same cultural background. Thus, the physical parameters were similar and despite a large sample size, there should be no significant differences between the respondents participating in this study in both indoor environments (educational rooms and the climate chamber). The total share of women and men was very similar in the educational rooms and amounted to 49% of women and 51% of men, while in the climate chamber experiments it was 62% and 38%, respectively.
The selection of the participants was based on their consent to complete the questionnaires and thus take an active part in this study. Random sampling was impossible due to the low total number of students. The study group covered the students typically in their twenties. The sample group in each case was a regular student group, consequently a diverse and proper representation of the total population of this age group was considered to be achieved. The minimal number of people in the group was set at 10 persons, while the maximum amounted to 56. Naturally, the increase in the number of students in each group leads to improved sampling validity, but this is limited these days due to low enrollment. The test results for each group formed a set of two types of data: objective properties of the indoor environment and subjective assessment of the features of this environment (expressed as average values of the answers provided in the questionnaires). Consequently, possible cause–effect relations can be analysed.
The design of the questionnaire form was influenced by the standards observed in [
50,
51] as well as journal papers [
10,
52,
53].
3. Results and Discussion
During this study, the physical parameters of the indoor environment were recorded simultaneously to the process of completing the questionnaire forms. Air temperature ranged from 20.0 to 29.7 °C in the educational rooms and from 19.0 to 28.3 °C in the climate chamber. The respective ranges of relative humidity in both environments were 19.7–65.8% and 18.6–74.3%.
The subjective assessment considers all the conditions within rooms that affect human beings is commonly referred to as “occupants’ satisfaction” [
21,
23], “overall comfort sensation” [
54], “overall indoor environmental comfort” [
55] or “overall comfort” (which seems to be most commonly used in the literature, e.g., in [
20]). In the present study, the last term will be used in the analysis.
The assessment of the overall comfort of room users was carried out by the respondents providing an answer to the question “How do you rate your overall comfort?” The answers to choose from varied from “very good” (+2) through “good” (+1), “neutral” (0), “bad” (−1) to “very bad” (−2).
Figure 3 presents the distribution of the votes (as the frequency count) for the climate chamber and for the educational rooms. The data regarding the educational rooms have been analysed by the authors in [
56] separately for the intelligent and traditional buildings.
The majority of the respondents (in both environments) felt fine and marked the “neutral” or “good/very good” answers. The proportion of “good” and “bad” answers were very similar in both room types. The largest difference was observed for the response “+2”—the students felt very good in the climate chamber in comparison with the educational rooms, which might be attributed to some other factors such as stress during the classes. In both cases, the share of very negative responses was marginal. In fact, a similar percentage share of the negative sensations (“−1” and “−2”) was recorded for both environments, which might disagree with the findings in [
23] that restricted access to daylight as well as to the outside view might have an impact on the occupants’ satisfaction.
The overall comfort might depend on a number of factors; however, indoor air temperature seems to be one of the most important parameters.
Figure 4 presents the relation between the average values of the overall comfort (OC) for each room in the educational buildings and in the climate chamber, and the air temperature (T).
The most favourable range of air temperature for both environments seems to be from 20.5 to 23 °C, which is in agreement with data presented in [
19], where the comfort temperatures for the Polish students ranged from 21.7 to 22.3 °C, as well as in agreement with [
43], where the temperature of 23 °C was reported as most satisfactory. However, data for Chinese people of a similar age presented in [
26] showed that a higher air temperature value of 24 °C proved to be most favourable. On the other hand, elderly Nordic people expressed an even higher preferred temperature of 26.5 °C [
41].
An important finding is that the overall comfort for the climate chamber was typically higher than that for the educational rooms at the same air temperature values. This might be related to the influence of other factors such as the lack of stress in the chamber as opposed to students’ participation that is required in a lecture/classrooms.
The most satisfactory air temperature value in the climate chamber experiments was ca. 20.7 °C, while in the educational rooms it was ca. 22.3 °C. This shift can be explained by the presence of increased air movement (often caused by draughts) in the lecture/classrooms, especially in the summer season due to open windows.
The obtained polynomial correlations for the data recorded in the climate chamber (subscript “1”) and the educational rooms (subscript “2”) are as follows:
Air temperature might indeed have an impact on the overall comfort of room users; however—due to the highly subjective perception of temperature and the individual thermal preferences—it might be vital to study not only the influence of the temperature, but the correlation between the subjective assessment of thermal sensations and overall comfort.
The question in the questionnaire related to thermal sensations was “How do you assess your current thermal sensation”. The respondents could choose from the following: “too hot” (+3), “too warm” (+2), “pleasantly warm” (+1), “neutral” (0), “pleasantly cool” (−1), “too cool” (−2), “too cold” (−3).
Figure 5 presents the relation between average values of thermal sensations (Thermal Sensation Vote—TSV) and overall comfort (OC) for each of the 92 rooms of the university buildings and 60 sessions in the climate chamber.
The obtained polynomial correlations for the data recorded in the climatic chamber (subscript “1”) and the educational rooms (subscript “2”) are as follows:
As opposed to the findings of Ahmad et al. [
43], who found a linear correlation between overall thermal comfort and thermal sensations in the climate chamber experiments, the curves in the present study are polynomials (similar to the findings of Majewski et al. [
57]). The second order polynomial trend line is much more understandable due to the fact that the optimal/most favourable set of parameters for the respondents must exist. These most preferable conditions seem to be at TSV = −0.4: “pleasantly slightly cool” (for the climate chamber) and TSV = +0.2: “neutral/pleasantly slightly warm” (for the educational rooms). This shift—as already mentioned in
Figure 4—can be explained by elevated air movement in the lecture/classrooms during their normal operation. At the same time, it needs to be added that OC data for the climate chamber tests are typically higher than that for the educational rooms. This phenomenon can be attributed to other unfavourable factors present in the lecture/classrooms such as increased stress levels.
Overall comfort might also be influenced by indoor air quality. The respondents were asked to assess the quality of air during this study. They marked the following answers in the questionnaire regarding this feature: “v. good” (+2), “good” (+1), “neither good nor bad” (0), “bad” (−1), “v. bad” (−2).
Figure 6 presents the dependence between the mean values of the subjective assessment of air quality (Indoor Air Quality Vote—IAQV) in the rooms and the overall comfort experienced by the people in these rooms (also as mean values of the answers provided in the questionnaires). The data regarding the educational rooms have been analysed by the authors in [
56]; however, they have the addition of a distinction regarding the type of building.
The obtained linear correlations for the data recorded in the climate chamber (subscript “1”) and the educational rooms (subscript “2”) are quite strong and the equations take the following form:
As can be seen in the figure, both red and blue trend lines are close to each other, which proves that the correlation between overall comfort and indoor air quality might not depend on the type of environment (actual vs. simulated). It needs to be emphasised that the red trendline (representing a large dataset of 1302 questionnaires from the educational rooms) provides an almost ideal representation of this phenomenon: if the air quality is good (IAQV = 1), overall comfort is also fine (OC = 1). If the air quality is perceived as neutral (IAQV = 0), the mean value of overall comfort is also close to zero. Data for the climate chamber seem to show a little divergence, which might be caused by the smaller sample size. However, the character of the changes is the same.
A dependence of perceived air quality vs. carbon dioxide concentration was also tested by the authors, but no correlation was found (the regression coefficients for both environments’ data were close to zero). This disagrees with data presented in [
27]; however, a number of other researchers (e.g., [
28,
34,
36]) claim that the perception of room users might be shaped by other factors (such as the presence of odours [
36] or the absence of natural light [
34]).
Overall comfort should also depend on relative humidity; however, this parameter is often neglected in the analyses found in the literature. In the present study, the respondents were asked to assess the humidity within rooms based on the 5-point scale: “too humid” (+2), “quite humid” (+1), “pleasantly” (0), “quite dry” (−1), “too dry” (−2).
Figure 7 presents the distribution of the Humidity Assessment Votes—HAV (as the frequency count), for the climate chamber and for the educational rooms.
The figure clearly shows that the relative humidity was found to be satisfactory (answer “0”) by about half of the respondents both in the climate chamber and in the educational rooms. Similarly, about the same share of the respondents (ca. 33%) in both environments also considered the indoor air to be too dry (“−1”). This might suggest that human perceptions regarding humidity in both of the analysed environments are very similar.
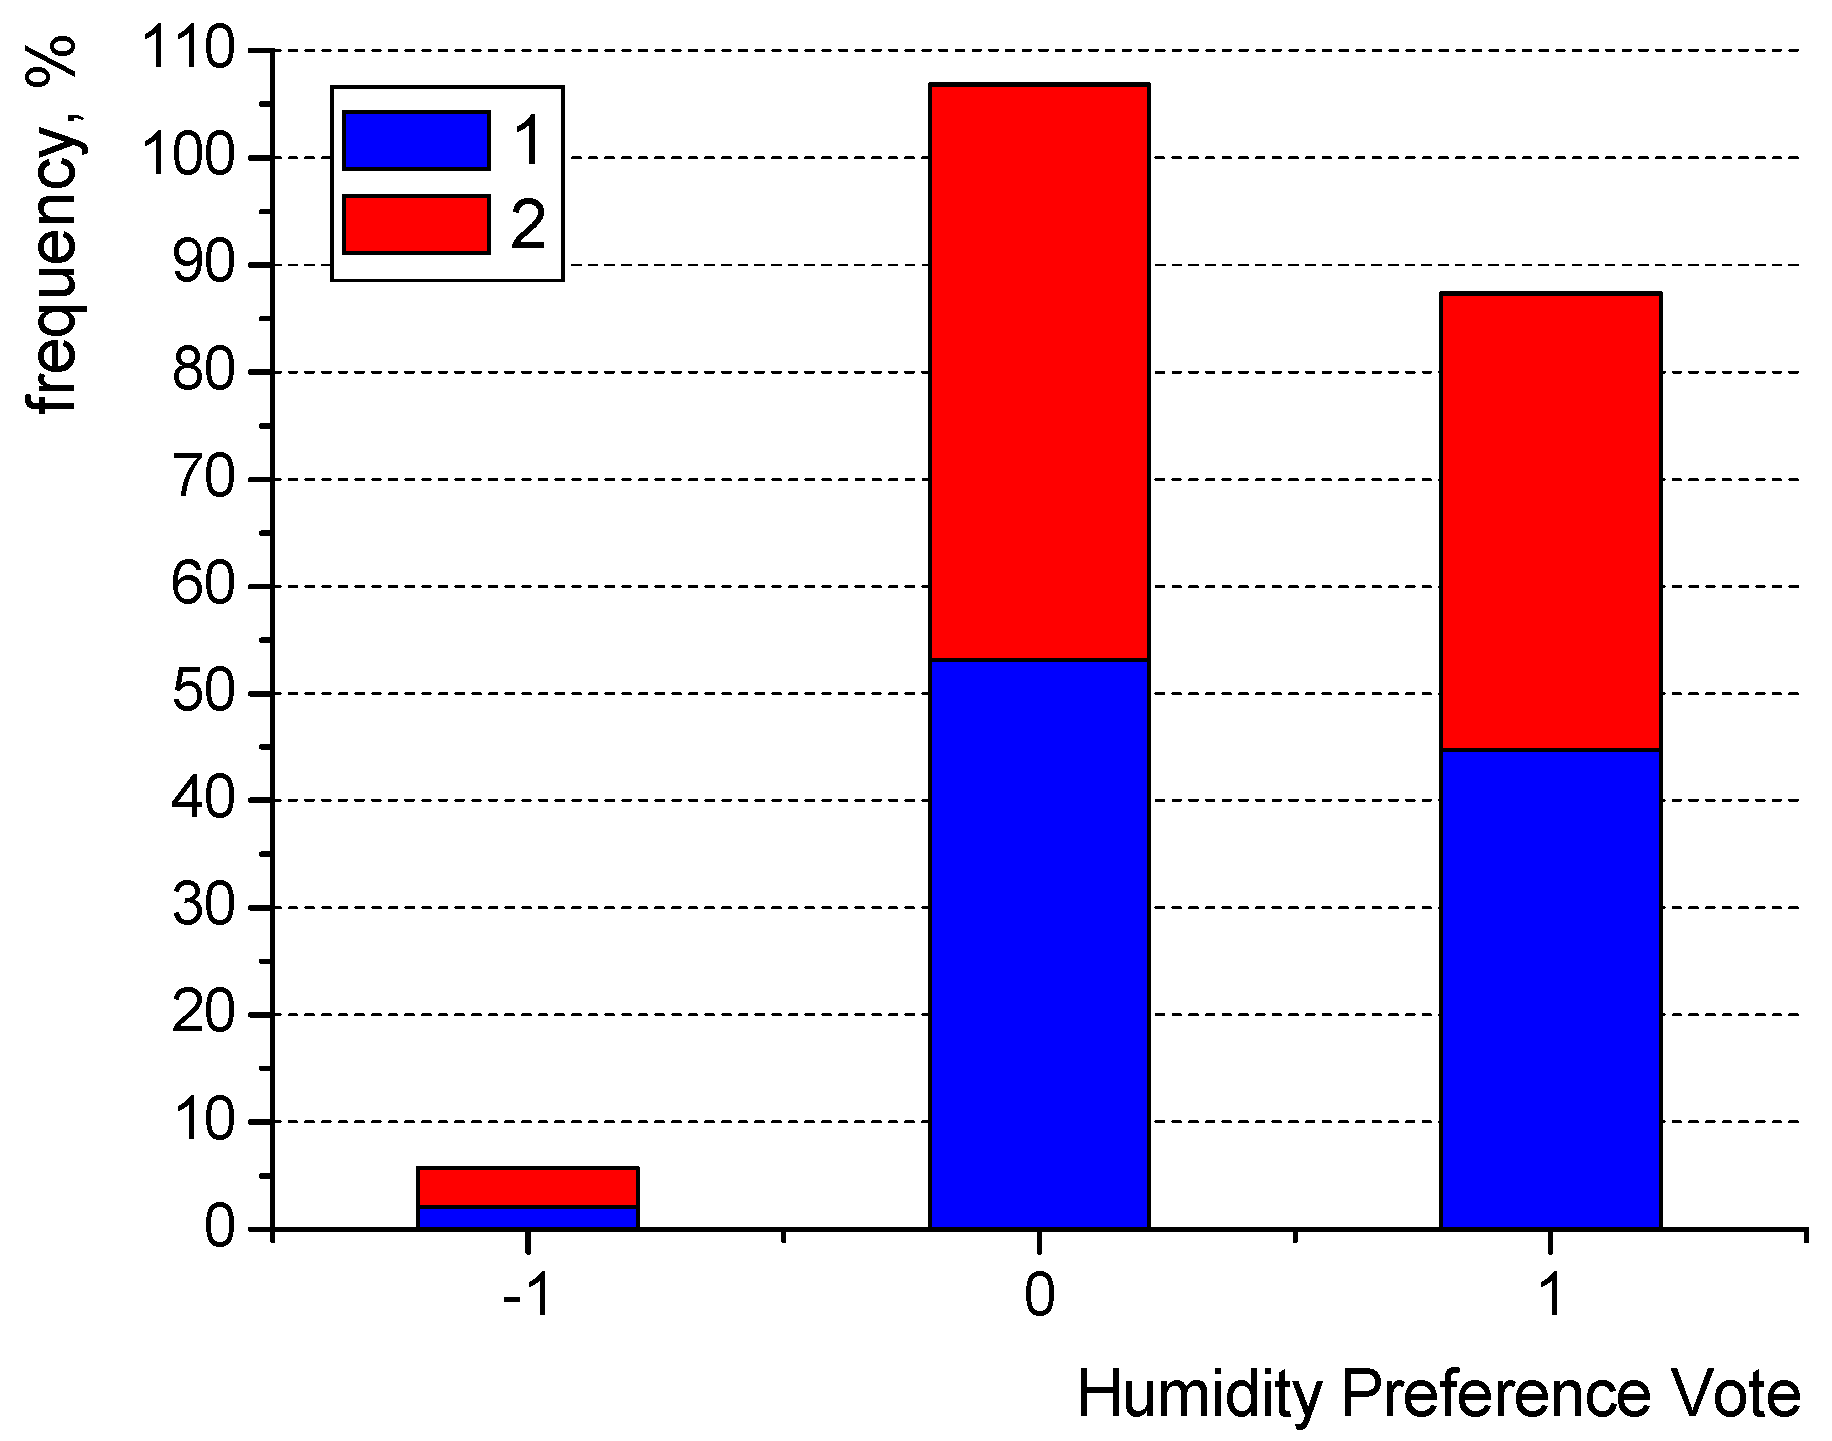
The next question dealt with individual preferences (called Humidity Preference Vote—HPV) and read “How would you like to change the air humidity?”. The possible answers were “more humid” (+1), “no change” (0) and “drier” (−1).
Figure 8 shows the distribution of the votes (as the frequency count) for the climate chamber and for the educational rooms.
As can be seen, the largest share of the respondents did not want any change with regards to air humidity for both of the considered environments. However, many opted for a more humid condition. Both figures (
Figure 7 and
Figure 8) seem to show the same character of human response for significantly different environment types (lecture/classrooms in university buildings and the climate chamber), but for a similar range of relative humidity variations. Confirmation of the same character of human perception can be found in
Figure 9, where the relation between the mean Humidity Assessment Vote for each room has been shown against the mean Humidity Preference Vote.
As could be anticipated if the respondents felt that the air was too dry (marked as “−1” in the questionnaire regarding humidity assessment HAV), they would also prefer the air to be more humid (“+1” in the questionnaire regarding HPV).
Figure 9 shows this clearly with both the red and blue trend lines present at point (1.0; −1.0). Similarly, if the respondents felt fine (HAV = 0), they would not welcome any change to the air humidity and would keep it unchanged (HPV = 0). This is clearly visible for the educational buildings (as in
Figure 6), but the data for the climate chamber show some deviation. This might also be explained by a large number of people occupying the educational rooms (1302 questionnaires collected there), whereas the data for the climate chamber may simply be less accurate due to the sample size. This assumption is backed by a lower value for the coefficient of determination for climate chamber data (as given below). However, this graph seems to properly describe the relative interconnection between the considered humidity sensations. The linear correlation equations for the data from the climatic chamber (subscript “1”) and the educational rooms (subscript “2”) are as follows:
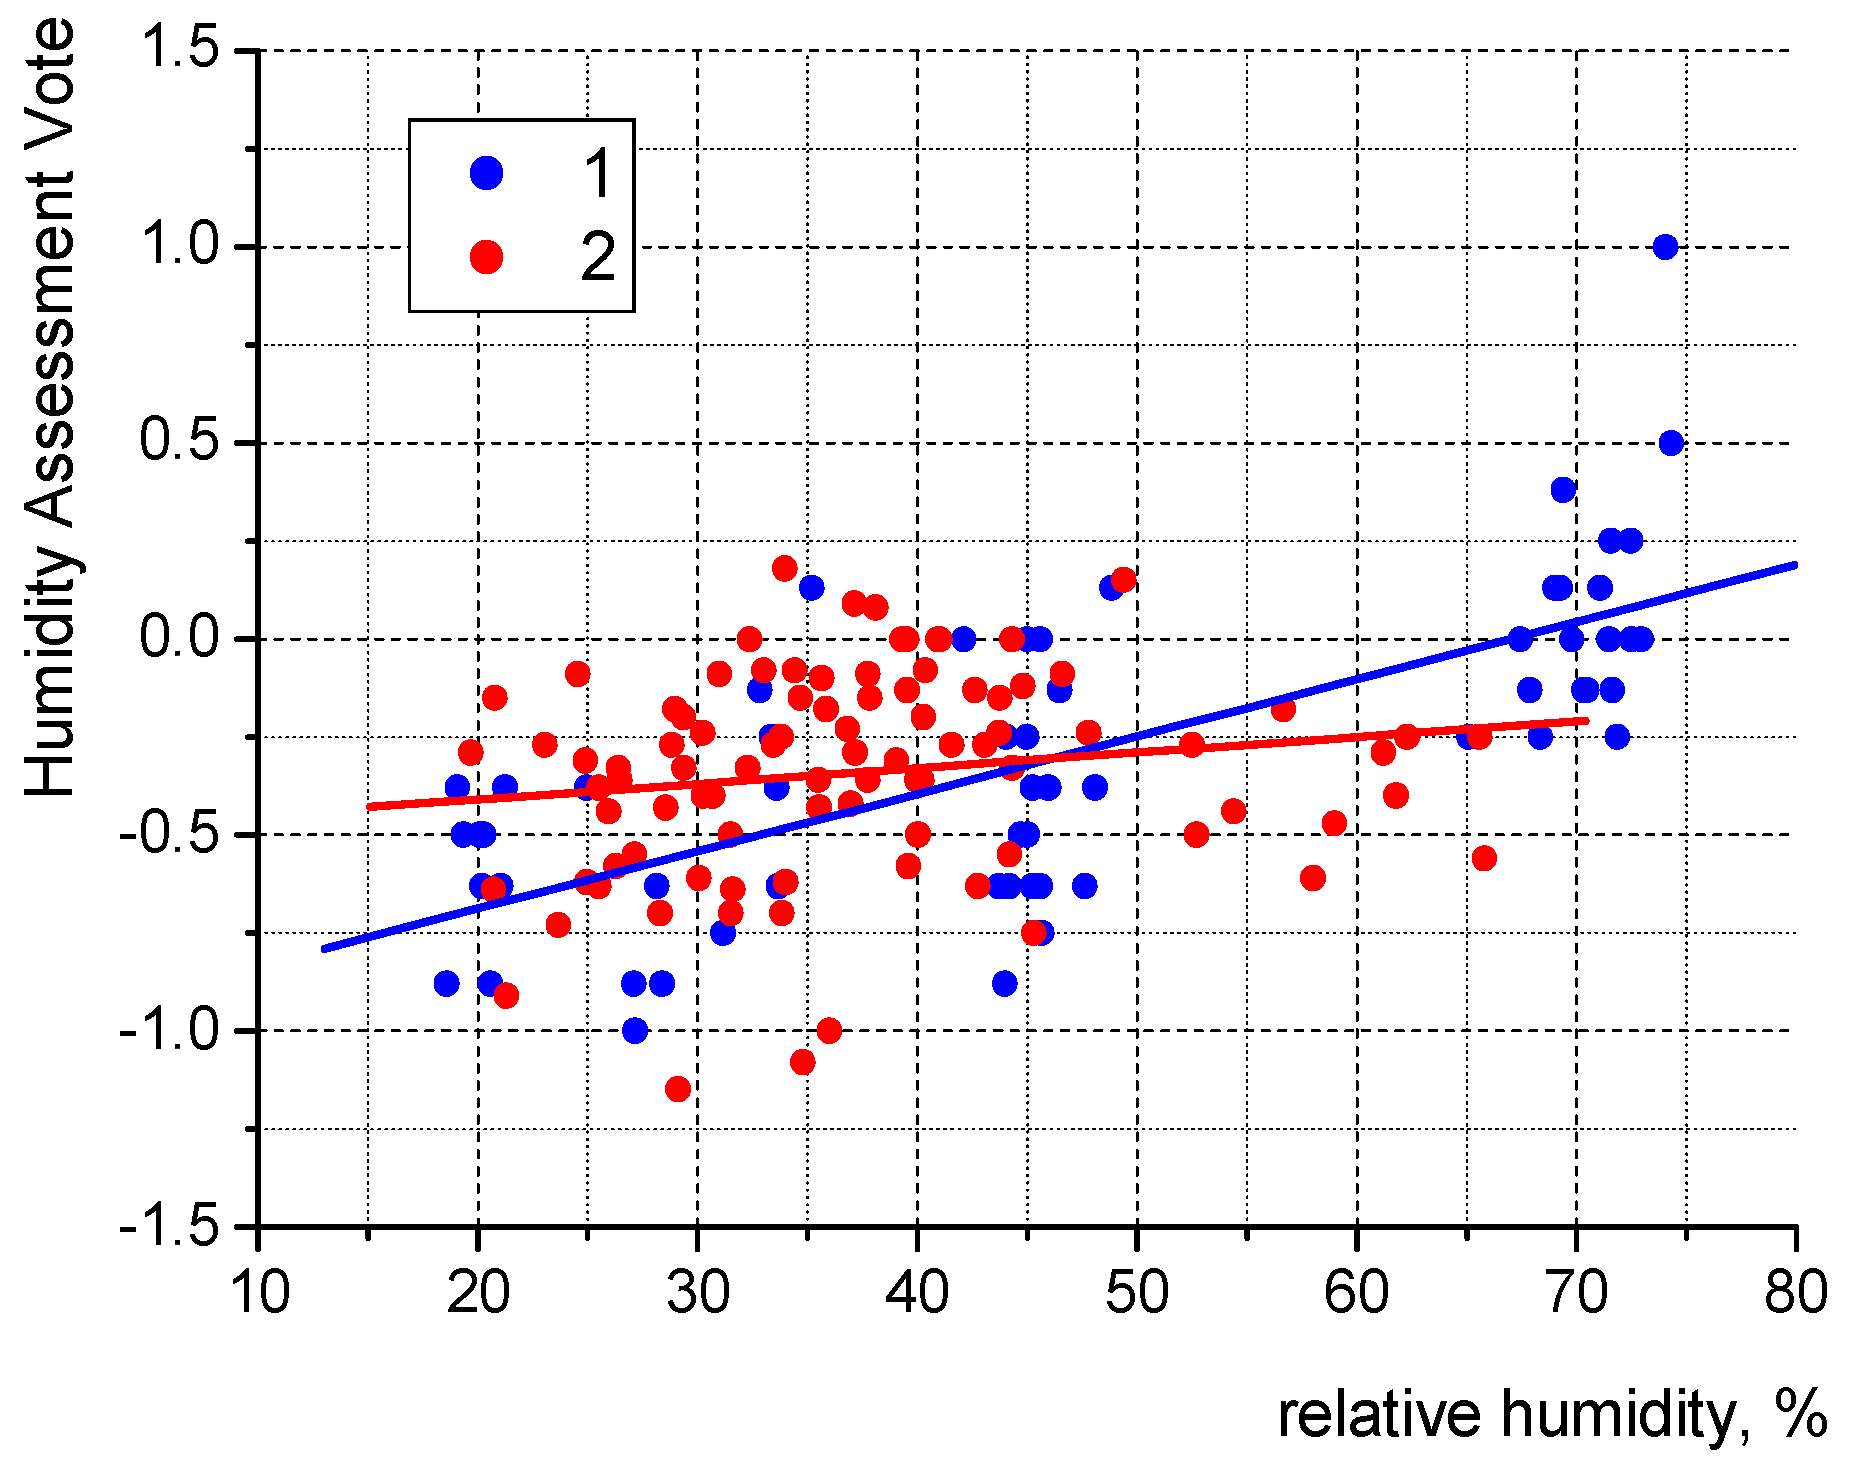
The perception of air humidity (AHV) is undoubtedly influenced by the values of relative humidity in the closed spaces. However, the dependence turned out not to be quite as straightforward as has been presented below in
Figure 10. Both the environments were tested in similar humidity conditions: the relative humidity values varied from 19.7 to 65.8% in the educational buildings, while in the climate chamber values varied from 19.0 to 73.4%.
The rise in relative humidity typically led to elevated HAV values; however, the clear trend can only be noticed in the case of the climate chamber tests. In the case of the educational rooms, the dependence is not so obvious. It might be linked with a large number of other parameters of the indoor air of the rooms, which were not considered in the analyses. The coefficient of determination of the linear correlation for the data from the educational rooms was only 0.02, thus the equation is not presented; however, this coefficient amounted to 0.50 in the case of the climatic chamber experiments with the following equation of the linear fit (the blue line in
Figure 10):
The lack of correlation regarding the educational buildings (where relative humidity did not exceed 66%) might be in agreement with data presented by Kong et al. [
58], who reported almost no or very marginal interconnection between mean humidity sensation vote and air humidity in the range of 20–70% in their tests carried out in China. The strong impact of humidity can be observed beyond the value of 70% [
58,
59], especially at high indoor air temperatures. In the present study, such values were recorded in the climate chamber and the influence of these data points on the trend line can be seen in
Figure 10.
As discussed earlier, the overall comfort of room users was quite well correlated with thermal and air quality assessment (
Figure 5 and
Figure 6). It needs to be verified if the same holds true for indoor air humidity.
Figure 11 presents a relation between overall comfort vs. Humidity Assessment Vote of the respondents—the data points represent the mean values of the questionnaire surveys in both analysed environments, namely the climate chamber (represented as “1” in the figure) and the educational rooms (represented as “2”).
It seems that the character of the interconnection between overall comfort and humidity assessment is very similar for both environments (actual and simulated). The linear fittings of the data show the same trend (although the coefficients of determination in both cases are low and amount to R2 = 0.148 for the climate chamber experiments and R2 = 0.156 in the case of the educational rooms) and the majority of the data points for both environments fall in the range of −0.75 < HAV < +0.25 when the respondents experienced positive overall comfort (OC > 0). This further supports the claim that the sensations in the educational rooms and the climatic chamber are of the same nature.


 ,
, 


