Article

Modeling of Forest Ecosystem Degradation Due to Anthropogenic Stress: The Case of Rohingya Influx into the Cox’s Bazar–Teknaf Peninsula of Bangladesh

1
Key Laboratory of Digital Earth Sciences, Aerospace Information Research Institute, Chinese Academy of Sciences, No. 9 Dengzhuang South Road, Beijing 100094, China
2
Aerospace Information Research Institute, University of Chinese Academy of Sciences (UCAS), Beijing 100049, China
3
Key Laboratory of Earth Observation of Hainan Province, Sanya 572029, China
4
Department of Geography and Environment, Faculty of Life and Earth Sciences, Jagannath University, Dhaka 1100, Bangladesh
*
Author to whom correspondence should be addressed.
Submission received: 29 July 2021 / Revised: 26 September 2021 / Accepted: 1 October 2021 / Published: 4 November 2021

Abstract

:
Overdependence and cumulative anthropogenic stresses have caused world forests to decrease at an unprecedented rate, especially in Southeast Asia. The Cox’s Bazar–Teknaf Peninsula of Bangladesh is not an exception and follows the global deforestation trend. Despite being one of the country’s richest forest ecosystems with multiple wildlife sanctuaries, reserve forests, and influential wildlife habitats, the peninsula is now providing shelter for nearly one million Rohingya refugees. With the global deforestation trend coupled with excessive anthropogenic stresses from the Rohingya population, the forests in the peninsula are continuously deteriorating in terms of quality and integrity. In response to deforestation, the government invested in conservation efforts through afforestation and restoration programs, although the peninsula faced a refugee crisis in August 2017. The impact of this sudden increase in population on the forest ecosystem is large and has raised questions and contradictions between the government’s conservation efforts and the humanitarian response. Relocation of the refugees seems to be a lengthy process and the forest ecosystem integrity needs to be preserved; therefore, the degree of stresses, level of impacts, and pattern of deforestation are crucial information for forest conservation and protection strategies. However, there are a lack of quantitative analyses on how the forest ecosystem is deteriorating and what future results would be in both space and time. In this study, the impact of the sudden humanitarian crisis (i.e., Rohingya refugees) as anthropogenic stress in Cox’s Bazar–Teknaf peninsula has been spatiotemporally modeled and assessed using Sentinel-2 satellite imagery and other collateral data. Using the density and accessibility of the Rohingya population along with the land cover and other physiographic data, a multi-criteria evaluation (MCE) technique was applied through the Markov cellular automata technique to model the forest vegetation status. The impact of deforestation differs in cost due to variability of the forest vegetation covers. The study, therefore, developed and adopted three indices for assessment of the forest ecosystem based on the variability and weight of the forest cover loss. The spatial severity of impact (SSI) index revealed that out of 5415 ha of total degraded forest lands, 650 ha area would have the highest cost from 2017 to 2027. In the case of the ecosystem integrity (EI) index, a rapid decline in ecosystem integrity in the peninsula was observed as the integrity value fell to 1190 ha (2019) from 1340 ha (2017). The integrity is expected to further decline to 740 ha by 2027, if the stress persists in a similar fashion. Finally, the findings of ecosystem integrity depletion (EID) elucidated areas of 540 and 544 hectares that had a severe EID score of (−5) between 2017 and 2019 and 2017 and 2027, respectively. The displacement and refugee crisis is a recurrent world event that, in many cases, compromises the integrity and quality of natural space. Therefore, the findings of this study are expected to have significant global and regional implications to help managers and policymakers of forest ecosystems make decisions that have minimal or no impact to facilitate humanitarian response.

1. Introduction

Since 1990, the world’s natural forest cover has declined annually by 3.1%, and Southeast Asia has experienced an even larger downward trend [1,2]. Anthropogenic-activity-induced stresses trigger the decline, fragmentation, and thinning of the forest [3], which has been a major research focus in terms of climate change and biodiversity [4,5]. In specific terms, forest degradation is the detained succession bound by anthropogenic stresses that restrict the natural ecological processes and forest dynamics [6]. The world’s displaced population reached 82.4 million in 2020, up from 40 million in 1990 [7], which is more than double. When a displaced population takes refuge in a new location, the forest and natural resources receive little attention, thus imposing negative impacts on the host environment [8]. Cumulative stresses from the host and the newly arrived refugees in terms of makeshift construction and resource extraction create extra pressure on forest resources [8] that increase forest degradation. In the case of our study, although the Rohingya refugee crisis has historical roots reaching back to 1942 [9], the major influx occurred in August 2017, when nearly one million Rohingya refugees took shelter in Cox’s Bazar–Teknaf Peninsula [10,11]. Due to the dense population versus the limited forested area, the refugee crisis resulted in multifaceted impacts on the forest of Cox’s Bazar–Teknaf Peninsula [12].
The Cox’s Bazar–Teknaf Peninsula is crucial for much endangered flora and fauna [13,14], which provide livelihoods for many people nearby [15]. The government of Bangladesh declared this whole peninsula an Ecologically Critical Area (ECA) in 1999 [16,17], and within this peninsula there are three environmentally significant forests, i.e., Teknaf Wildlife Sanctuary [18], Inani Reserve Forest, and Himchari National Park [19], which are under stress due to the growing population and dependency on natural resources. The government declared the above-mentioned three natural forests in Cox’s Bazar–Teknaf Peninsula as reserves and restricted access to protect these forests. However, the Teknaf Wildlife Sanctuary (TWS) alone has lost 46% (3304 ha to 1794 ha) of its forest area in 20 years from 1989 to 2009 [20], and the shrub-type forest increased by 25% (6263 ha to 7824 ha) [21]. In terms of the faunal population, the number of wild animals has dropped precipitously, including the flagship species, the Asian elephant (Eliphus Maximus) [22]. The forest has also degraded in terms of its vegetation density and many of the native tree species are endangered, including the country’s tallest tree species, Boilam (Anisoptera Scaphula) [23]. When the government took the initiative to conserve and restore the forest [24] through various policies and actions [25], the country then faced the challenge of a Rohingya refugee influx, following the violence in Myanmar’s Rakhine State [26]. Nearly one million forcibly displaced Rohingya (a Muslim minority population in Myanmar) have taken shelter in Cox’s Bazar–Teknaf Peninsula [27,28], which is now the largest refugee camp in the world [29,30]. Around 24% of the livelihood activities of the Rohingya population come from the cutting of fuelwood from the forest and selling the wood in markets [31,32]. Around 38% of the population of the Teknaf peninsula is poor [33], and they directly and indirectly rely on forest resources [15]. In addition, the stress of the Rohingya population has also added to the forest degradation process. The forest of the Teknaf peninsula once had a rich stock of tall, mixed evergreen trees [31], with the dominant species Garjan (Dipterocarpus spp.) [34]. However, the tall canopy trees have been significantly reduced, and the hills have been denuded [15,35]. Although these forests are Protected Areas and within the ECA, the reckless clearing of the forest is leading to severe impacts on the overall ecosystem functions and services (e.g., biodiversity) [36] which include the stock of biomass and carbon [31], hampering the country’s REDD+ programs. In a nutshell, the excessive pressure of the Rohingya population has placed three of the important forests within the Cox’s Bazar–Teknaf peninsula in extreme threat of deterioration which, if continues, will eliminate many of the already threatened wildlife species that are only found in this peninsula, making them extinct [34].
The impact of Rohingya refugees on the forest ecosystem has multifaceted and multi-dimensional (e.g., human activity, environmental condition) characteristics which require assessment of the problem and proper intervention for the sustainable conservation and management of the forest ecosystem [37]. The applied remote-sensing-based satellite and Big Earth Data have opened the door to understand and project the future based on the trends facilitated by the information provided by the past and present [38,39,40,41]. In the management of disasters and responses to the crisis in terms of both natural and anthropogenic dimensions, the remotely sensed geo-information system addresses both spatial and temporal dimension and has been proven advantageous [42,43,44]. Despite the large-scale and frequent refugee and displacement crises around the world (41.3 million people are displaced to date) [45,46], comparatively very few studies have been conducted using remote sensing [47].
In Bangladesh, little work has been conducted to assess the past and present condition of the forest using remote sensing after the influx of Rohingya [48], which only presents loss of the forest due to the Rohingya influx without the indication of the direction of degradation, detailed factors, future projections, etc. However, a recent study by Hasan et al. [12] predicted the future extent of the degradation and emphasized the loss of ecosystem functions due to the Rohingya influx. An application of remote sensing to assess and project the severity of the impact of the refugee camp in terms of the variation and structure of the forest has not yet been performed. Moreover, forest ecosystem integrity deterioration based on the dynamic modeling and historical pattern [49,50] has also not been assessed, which is crucial to managers and policymakers for their planning and management decisions [51,52,53,54].
This study, therefore, envisages to investigate and answer the two key questions, i.e., (i) whether the impact of the Rohingya population has variability in terms of forest structure and vegetation class, and (ii) what would be the future dimension of the impact on the peninsula if the crisis persists as the same? In congruence with the research question above, the study aimed to address two key objectives, i.e., (i) scoping the forest cover data to estimate and quantify the spatial variability of the impact based on multiple indices, and (ii) assess the severity of the Rohingya influx in three temporal windows (present, past, and future).

2. Materials and Method
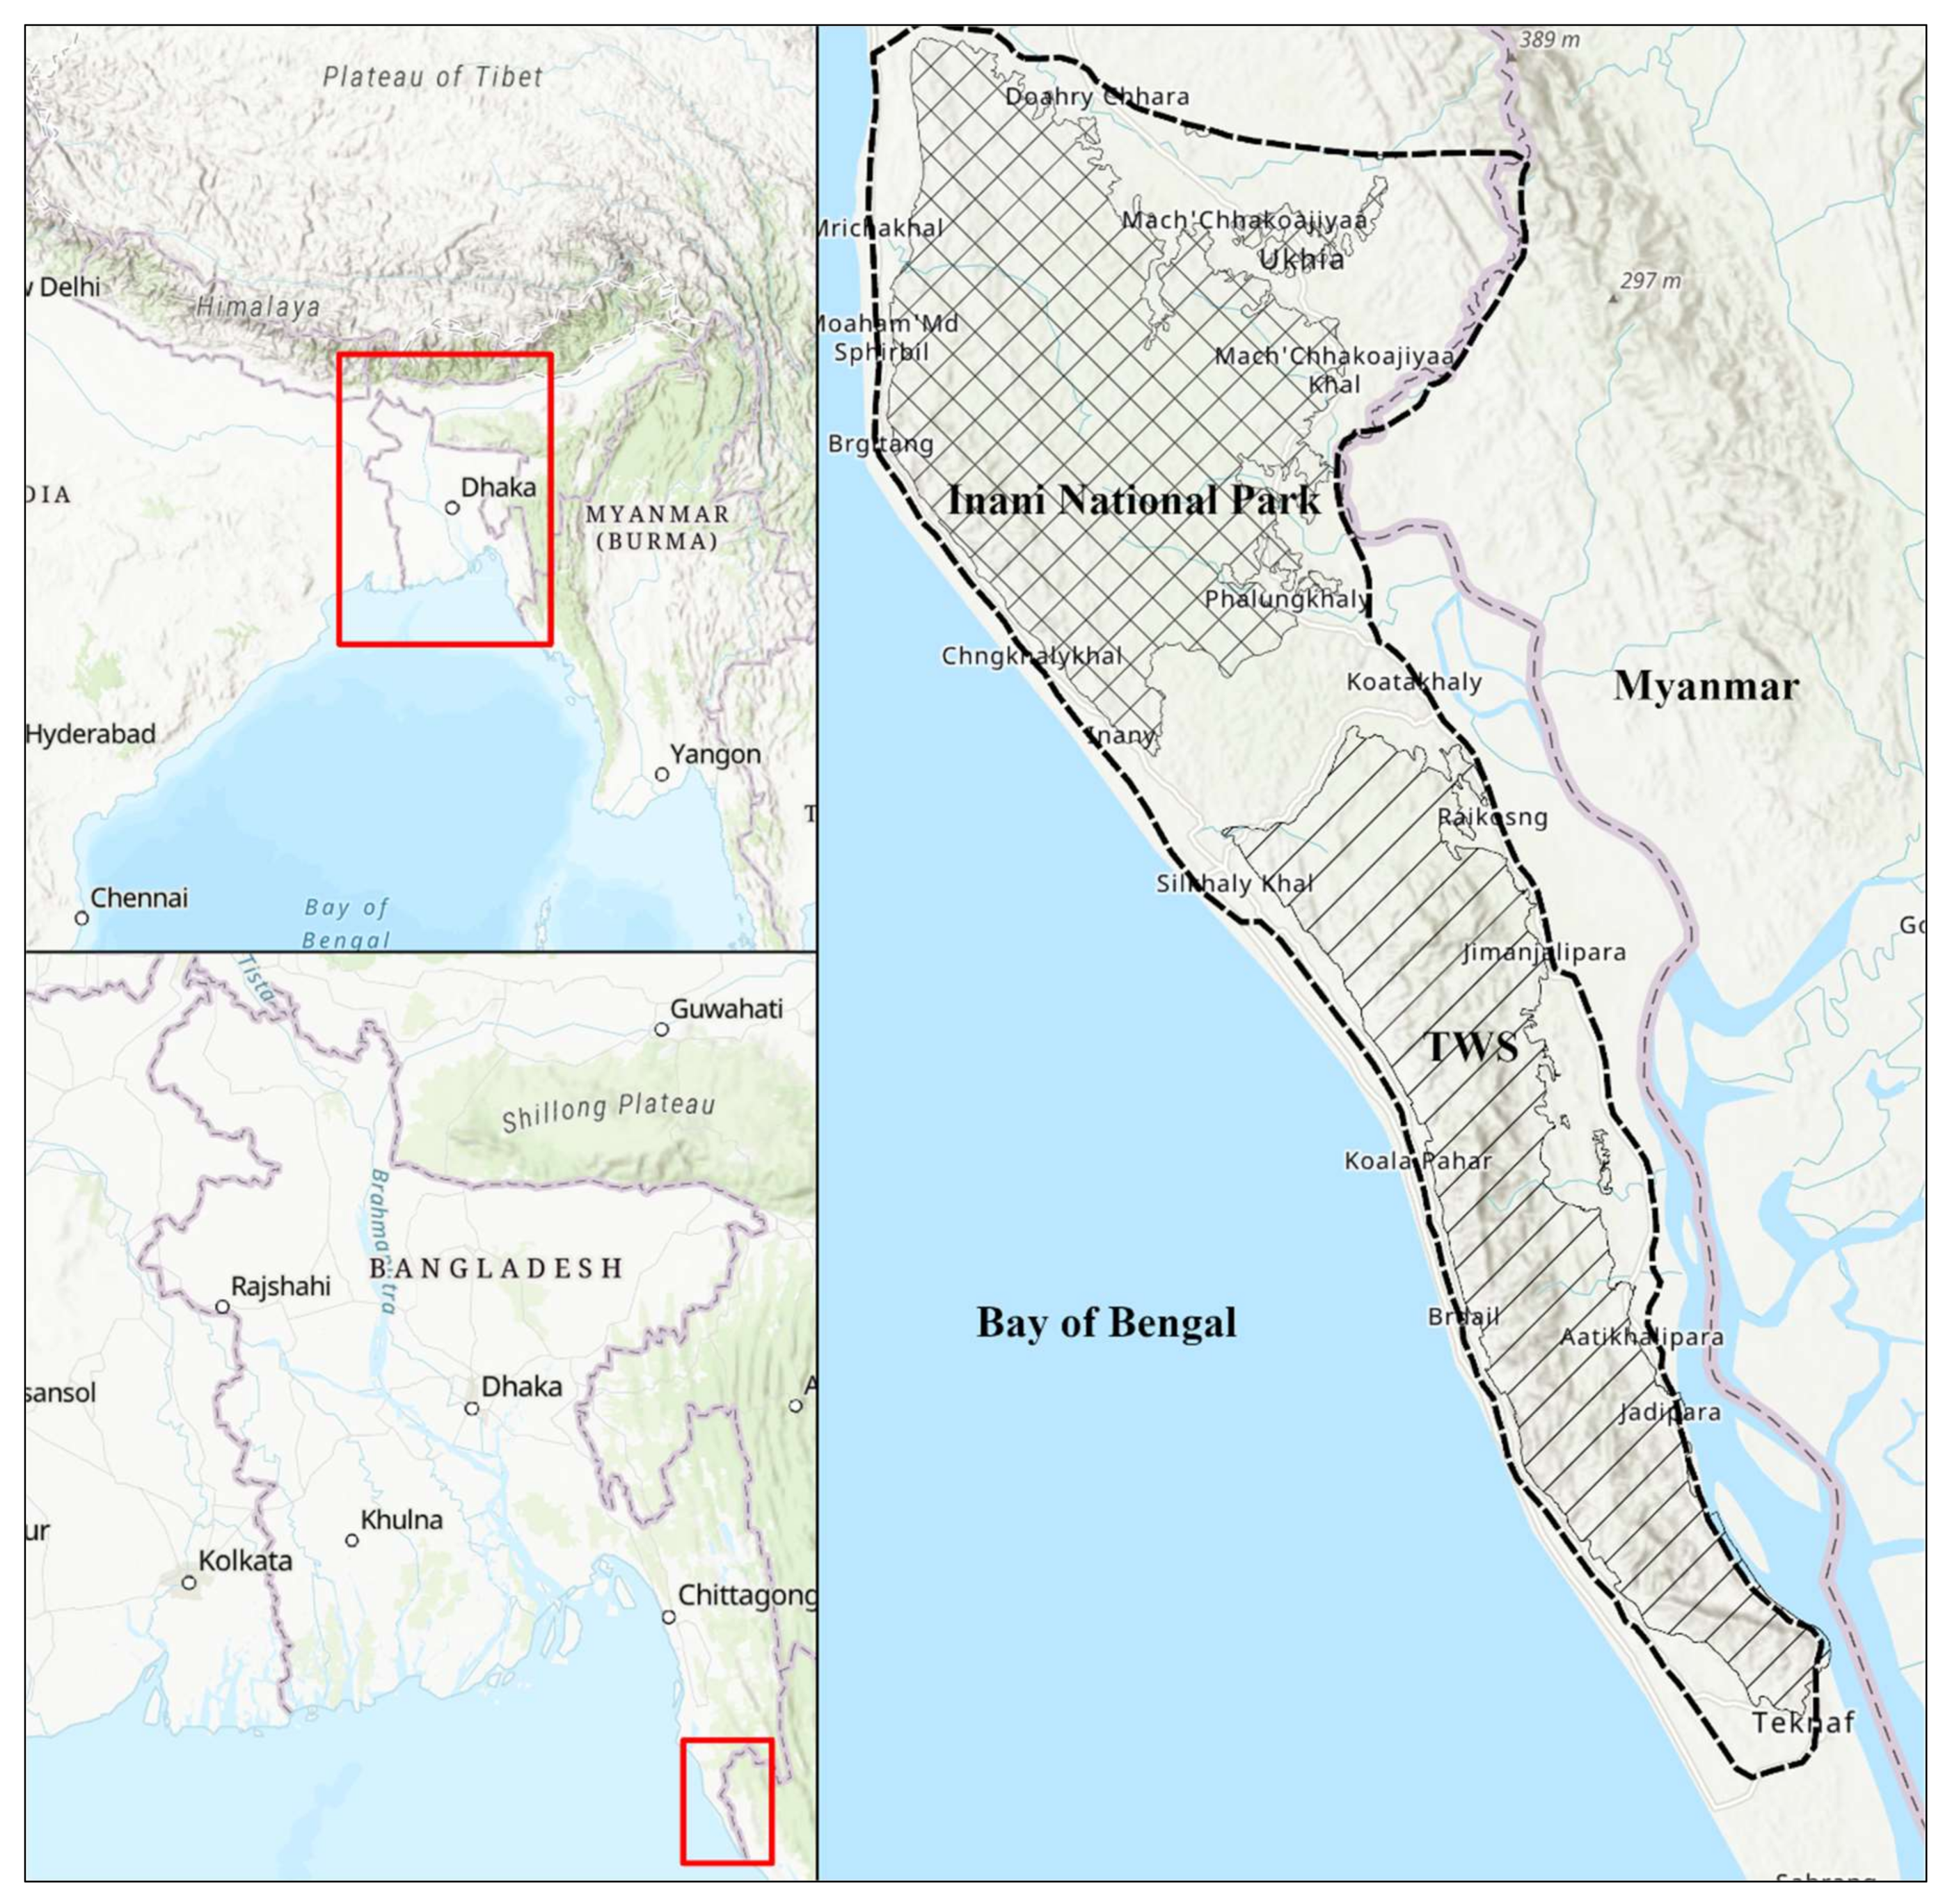
2.1. Study Area

The study focused on the impact of anthropogenic stress (i.e., Rohingya influx) over the forest; therefore, the administrative boundaries of the Bangladesh Forest Department (BFD) were considered. The Rohingya refugee camps have been built mostly in Cox’s Bazar South Forest Division among its two forest divisions, i.e., Cox’s Bazar North and South [13]. The study considered 23 Beats based on the impacted area by the Rohingya camps. Additionally, some portion of the Naikhongchari Beat (delineation of the Naikhongchari Beat has not yet been performed by Bangladesh) of the Bandarban Forest Division was considered for projecting the future status of the forest ecosystem. The addition of this Beat is implied to investigate the future impact of the Rohingya refugee in all directions from the camps. Finally, the selected study area covered three Upazilas and 24 Beats from Bangladesh and BFD administrative units, respectively (Figure 1).
Geographically, the study area extended between 92°17′3.152″ E, 20°50′57.562″ N (southwest) to 92°12′30.276″ E, 21°19′58.168″ N (northeast). The maximum elongation from the north to south direction was 54 km and from the east to the west was 20 km. The total finalized study area encompassed 41,162 ha of land which included diverse land uses and land covers. Irrespective of the Bangladesh and BFD administrative boundaries, environmentally, the study area fell within the very sensitive areas that cover ecosystems which are influential to both natural and anthropogenic environments. The study area consisted of Teknaf Wildlife Sanctuary, declared in 2010 [55,56] and formerly known as Teknaf Game Reserve (TGR) after the 1983 declaration through the Bangladesh Wildlife Act [55,57]. In addition, the proposed Inani National Park was included [19,58], which has been a reserve forest from 1907 [59,60] and is managed under the jurisdiction of the Bangladesh Forest Department [13].
In terms of climate, similar to Bangladesh, the Cox’s Bazar–Teknaf Peninsula falls within the subtropical monsoon climate, with wide seasonal variations characterized by the climatic factors of rainfall anomalies, moderately warm to hot temperatures, and high humidity [13,61]. Hot and humid climatic characteristics are the best combination for the thriving biodiversity [62] in the Cox’s Bazar–Teknaf Peninsula. As a tropical semi-evergreen forest, the study area serves as the habitat of a wide variety of flora and fauna that harbors 55 mammals, around 280 birds, 56 reptiles, 13 amphibians, and 290 plant species [13,14,19]. This peninsula is also known as the home of the critically endangered flagship species, Asian elephants (Elephus Maximus) [63]. As of 2016, around 63 elephants were living within the habitat with active movement into adjacent territories [22]. In the forested study area, there are various non-timber forest products (NTFPs) that include bamboo, canes, sun grass, and medicinal plants [15]. These NTFPs attract the local people to enter the forest for their livelihood and economic activities.

2.2. Data Acquisition and Preparation

The study considered spatial, non-spatial, and other ancillary data from multiple sources (Table 1)
In general, it is a prerequisite to perform several image preparations exercises before image processing. However, Sentinel level 2A images are geometrically corrected by the ESA [64] and have an acceptable level of accuracy. Therefore, only atmospheric corrections were conducted by the SEN2COR toolkit to convert top-of-atmosphere (TOA) values to surface reflectance [65,66,67]. Other associate data, e.g., World View-2 and UAV, were corrected by source (Table 1), and the RapidEye imagery was corrected using a set of ground control points (GCPs) using global positioning systems (GPS) in the fieldwork.

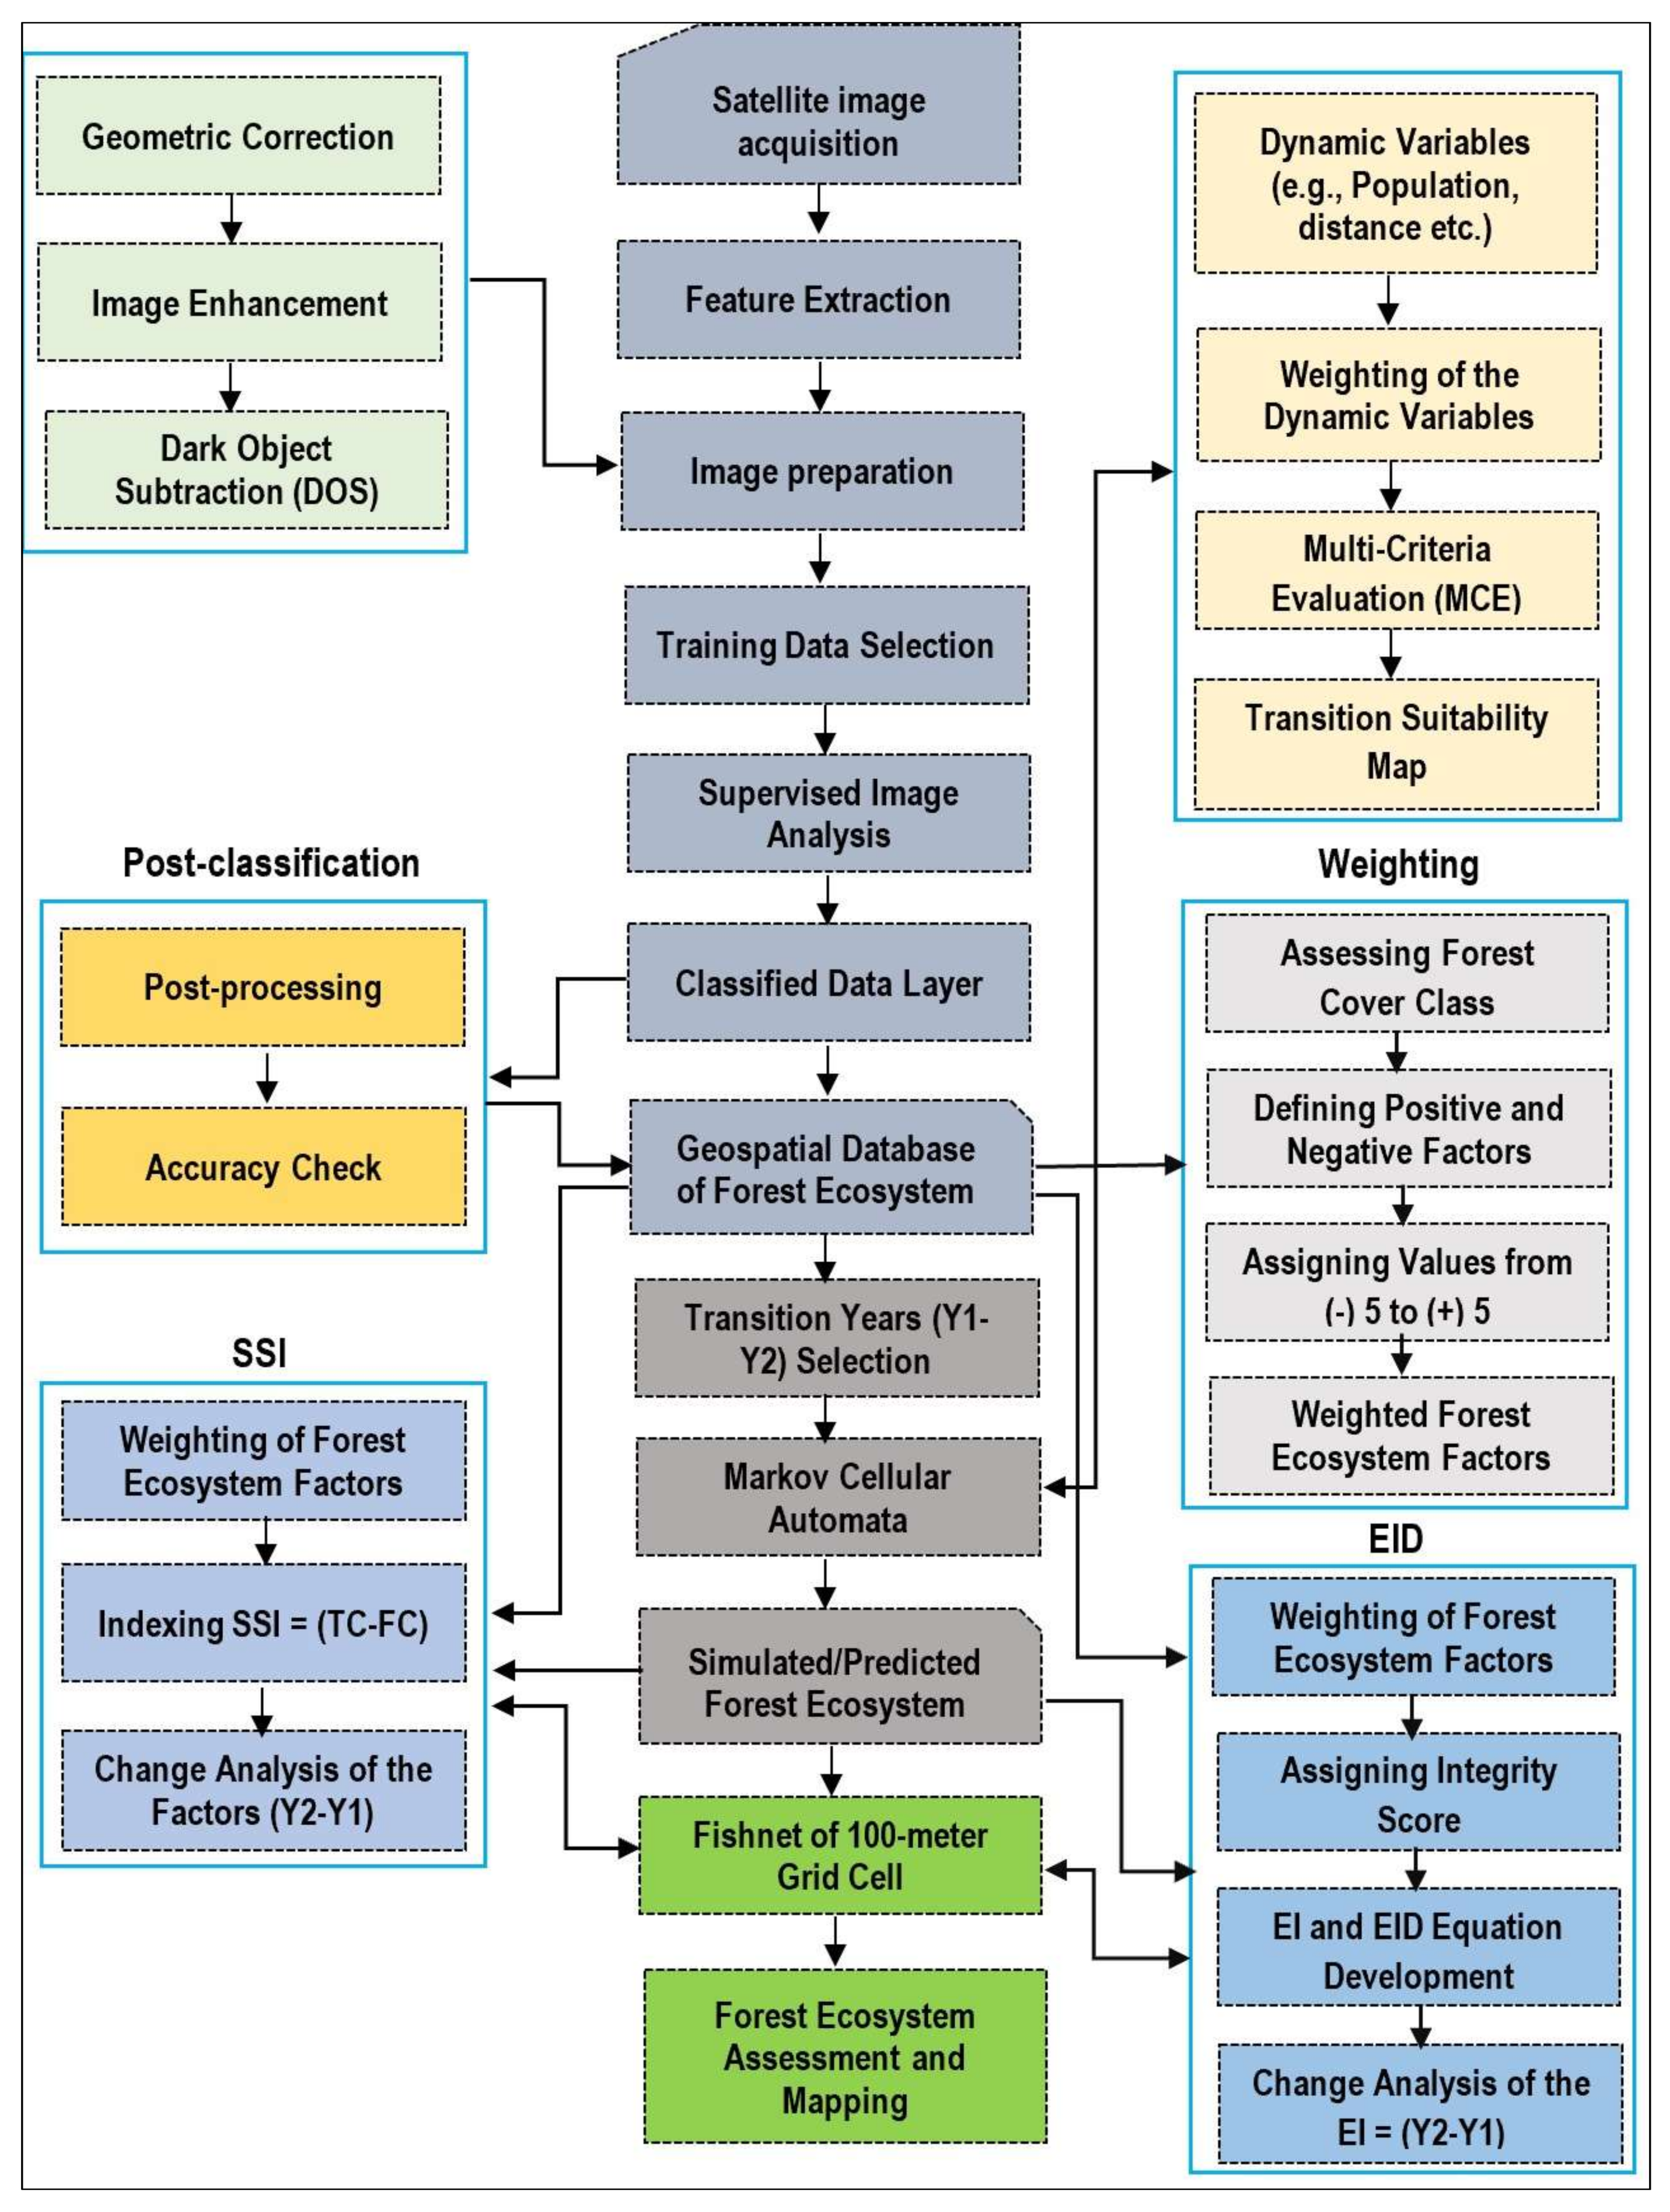
2.3. Preparation of the Forest Cover Data through Image Processing

The forest cover data from satellite imagery were the center of the study; the spatio-temporal forest cover data were applied to assess the forest ecosystem over three years. Therefore, the study used Sentinel 2A satellite images for the years of 2017 (before the influx), 2018, and 2019 (after the influx) to monitor and project the impact and assess the future scenario in 2023 and 2027 (Figure 2, Figure 3 and Figure 4), based on the methodology adopted from Hasan et al. [12] (Figure 5). The satellite imagery was collected from the ESA websites maintaining the same season (winter, February) and preparation for image classification, i.e., dark object subtraction (DOS) [68,69]. In addition, the study prepared reference data to be used in the classification process as training data and for accuracy checks in the post-classification accuracy assessment procedure [40,70]. The study mainly focused on extracting the forest cover, but at the same time, emphasized other associated land uses in and around the forest ecosystem. Therefore, the study adopted the modified version of the Anderson Level-1 classification system [71] that included Agriculture (AC), Saltpan (SP), Urban Center (UB), Homestead Vegetation (HS), Brick Kiln (BK), Shrub-Dominated Area (SH), Mixed Height Forest (MF), Plantation/Young Trees/Forest (PT), Canopy Forest (CF), Casuarina (CR), Rohingya Camp (CA), Degraded Forest Land (DD), Creeks (CK) and Waterbodies (WB). The study used the standard pixel-based supervised image classification techniques applying maximum likelihood classification rules [12,48,72,73,74,75], and prepared the forest cover dataset for the years 2017, 2018 and 2019. The study also applied different post-classification rules, as well as a direct method, i.e., recoding to minimize missed classes [72]. The forest cover classes were obtained from satellite imagery with the maintenance of overall accuracy within 86% to 91% for all three satellite imageries (Appendix A). Overall image classification was followed by the steps that are detailed in the flowchart (Figure 5). The image classification exercise resulted in the land use and forest cover data (Figure 4) which is very crucial for the prediction and development of indexes to assess the impact of the Rohingya influx in the peninsula.

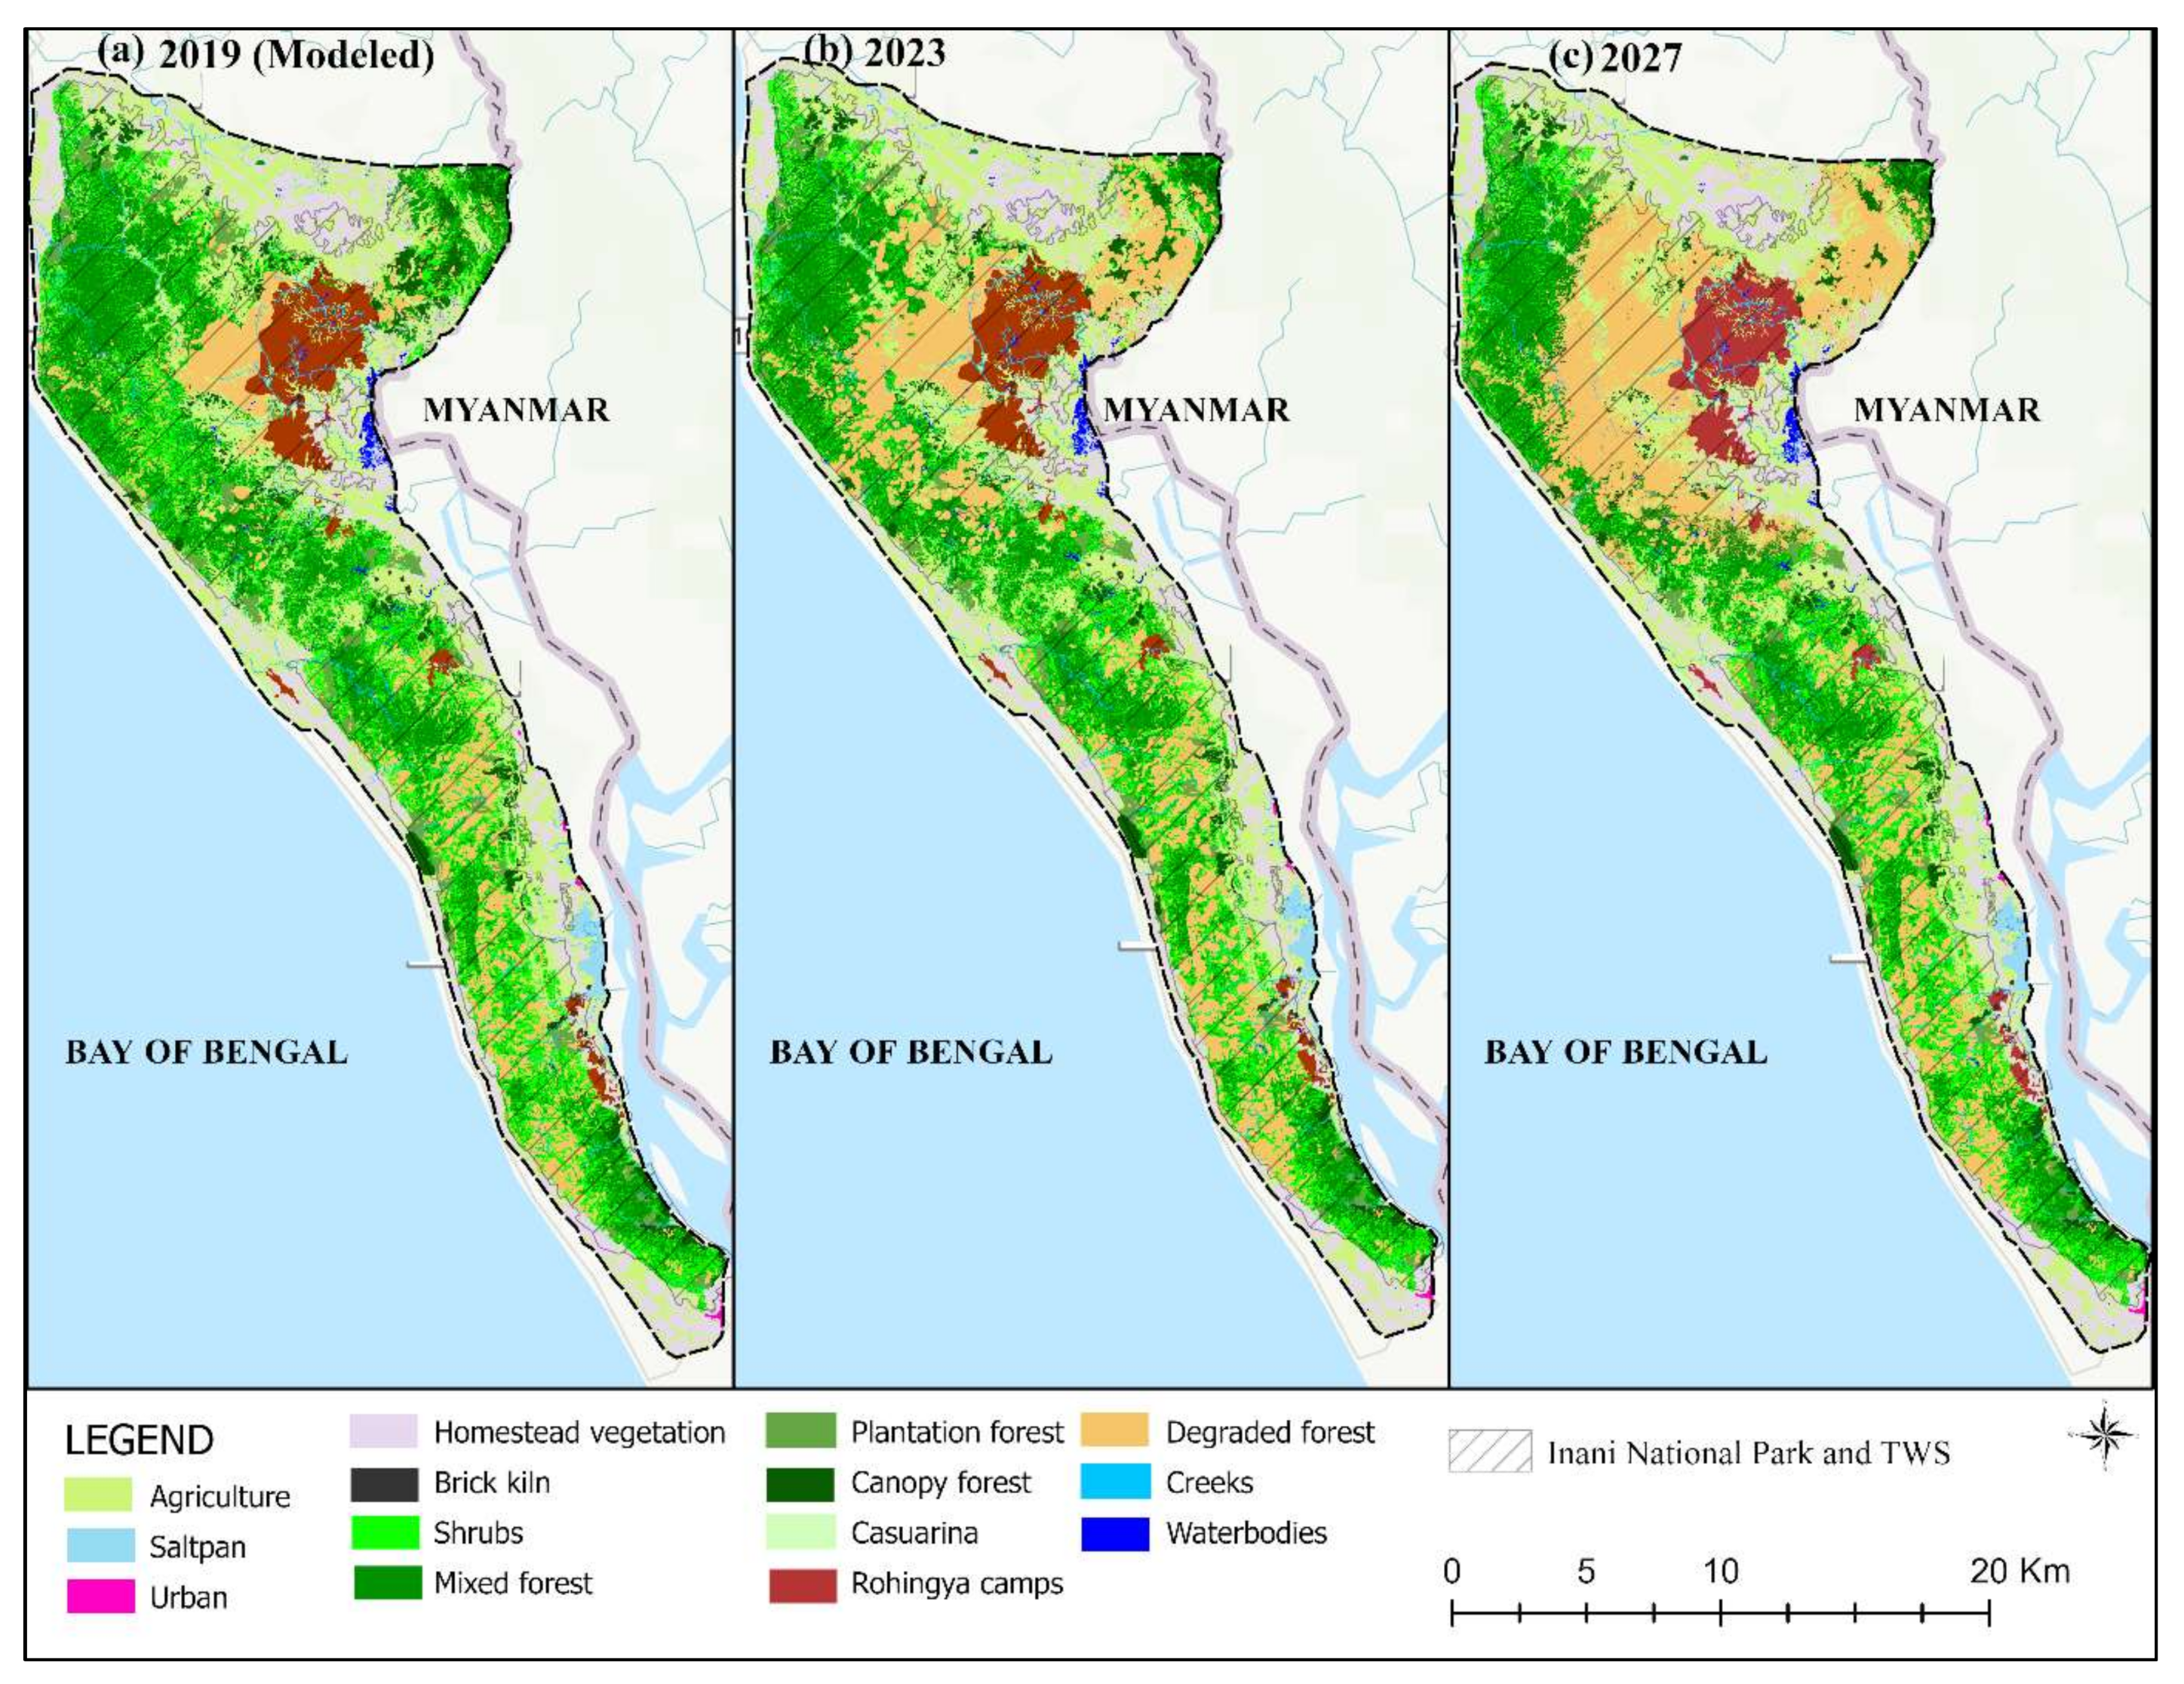
2.4. Prediction of the Forest Cover Data

The satellite image classification provided the past and present scenario of the forest cover of the study area; however, as this study emphasized the future forest ecosystem assessment, it required projected future land use and forest cover data. The study applied the widely used Markov cellular automata model with user-defined multi-criteria evaluation (MCE) data to dynamically project future land use and forest cover (Figure 5). The study included population density, the distance of the forest from the camp, human trails and other anthropogenic datasets to dynamically model the future land use and forest cover data varying from a ‘business as usual’ situation [12]. At first, the land use and land cover datasets of 2017 and 2018 were used to model 2019, which was then compared with the existing 2019 land use and forest cover dataset to verify the model’s performance. Finally, the model used the 2017 and 2019 datasets to project the land use and forest cover in 2023 and 2027, following the modeling process and steps presented in Figure 5. The modeling exercise data are presented in Figure 4.

2.5. Assessment of the Spatial Severity Impact (SSI)

The Rohingya population is engaged in different types of degradation processes through their deforestation activities, e.g., fuelwood collection, tree felling, etc. Moreover, the governments, NGOs, and other development partners are facilitating the building and extension of Rohingya camps, which also severely triggers deforestation processes. Even though the deforestation area is the same, the degree of the impact is dependent upon the forest class that has been cleared. The conservation decision is of high priority and the spatial severity of the impact data could help the decision-makers to make appropriate decisions to priority interventions. Therefore, an index was developed based on the score of the positive and negative factors that represent the impact (Table 2). The positive and negative factors have been distributed from −5 to 5, where −5 represents the maximum negative factors, and 5 represents the maximum positive factors. The change in these factors between two temporal years provides the severity of the impact triggered by deforestation activities through anthropogenic disturbances. The spatial severity of impact (SSI) was measured from a change analysis map of two temporal years based on the following formula shown as Equation (1):
SSI = (TC − BC)
where SSI is the spatial severity of impact, TC is the score of transformed class in the change analysis/detection map, and BC is the score of base class in the change analysis/detection map.
The index was assumed to provide a maximum negative value of −10 and a maximum positive value of 10, representing the severity of the impact.

2.6. Assessment of the Forest Ecosystem Integrity (EI) and Ecosystem Integrity Deterioration (EID)

The integrity of the ecosystem is dependent on so many factors. However, the study considered the forest structure (forest covers), stressors, and stimuli to study the forest ecosystem integrity. The area that is occupied with the best forest covers (e.g., canopy trees) was assumed to possess a high integrity score, and the area that is occupied with the high anthropogenic disturbance (e.g., Rohingya camps) was assumed to possess a negative integrity value, which refers anthropogenic infrastructure (non-forested area). The assessment process started by allocating scores to the LULC classes as per their importance to the forest ecosystem (Table 2). Spatial analysis of the tabulated area was performed to aggregate the total area of each LULC class in a 100 m by 100 m grid cell (10 times bigger than the spatial resolution of the Sentinel 2 images) for easy and meaningful data visualization for continuous, spatially adjustable and conditioned information [38,76]. The total area of each of the classes was then multiplied by the LULC class score and aggregated into each of the grid cells to derive the integrity value. The whole process was performed with the following formula [46] shown in Equation (2):
E I = i = 1 n = A i C i
where EI is the ecosystem integrity value, in are LULC categories, Ai is the area of each of the LULC classes, and Ci is the class score/weighting value.
The integrity value was then rescaled into 10 classes to present the ecosystem integrity from good to poor. Assessment of the ecosystem integrity was performed for the five temporal years that included 2017–2019 (time series data) and 2023 and 2027 (predicted forest cover data). The ecosystem integrity depletion (EID) was measured with the EI value of the multi-temporal time series (2017–2019) and modeled data (2023–2027) based on Equation (3):
EID = EIL − EIB
where EID is the ecosystem integrity deterioration, EIL is the ecosystem integrity of the later image, and EIB is the ecosystem integrity of the baseline image.

3. Results

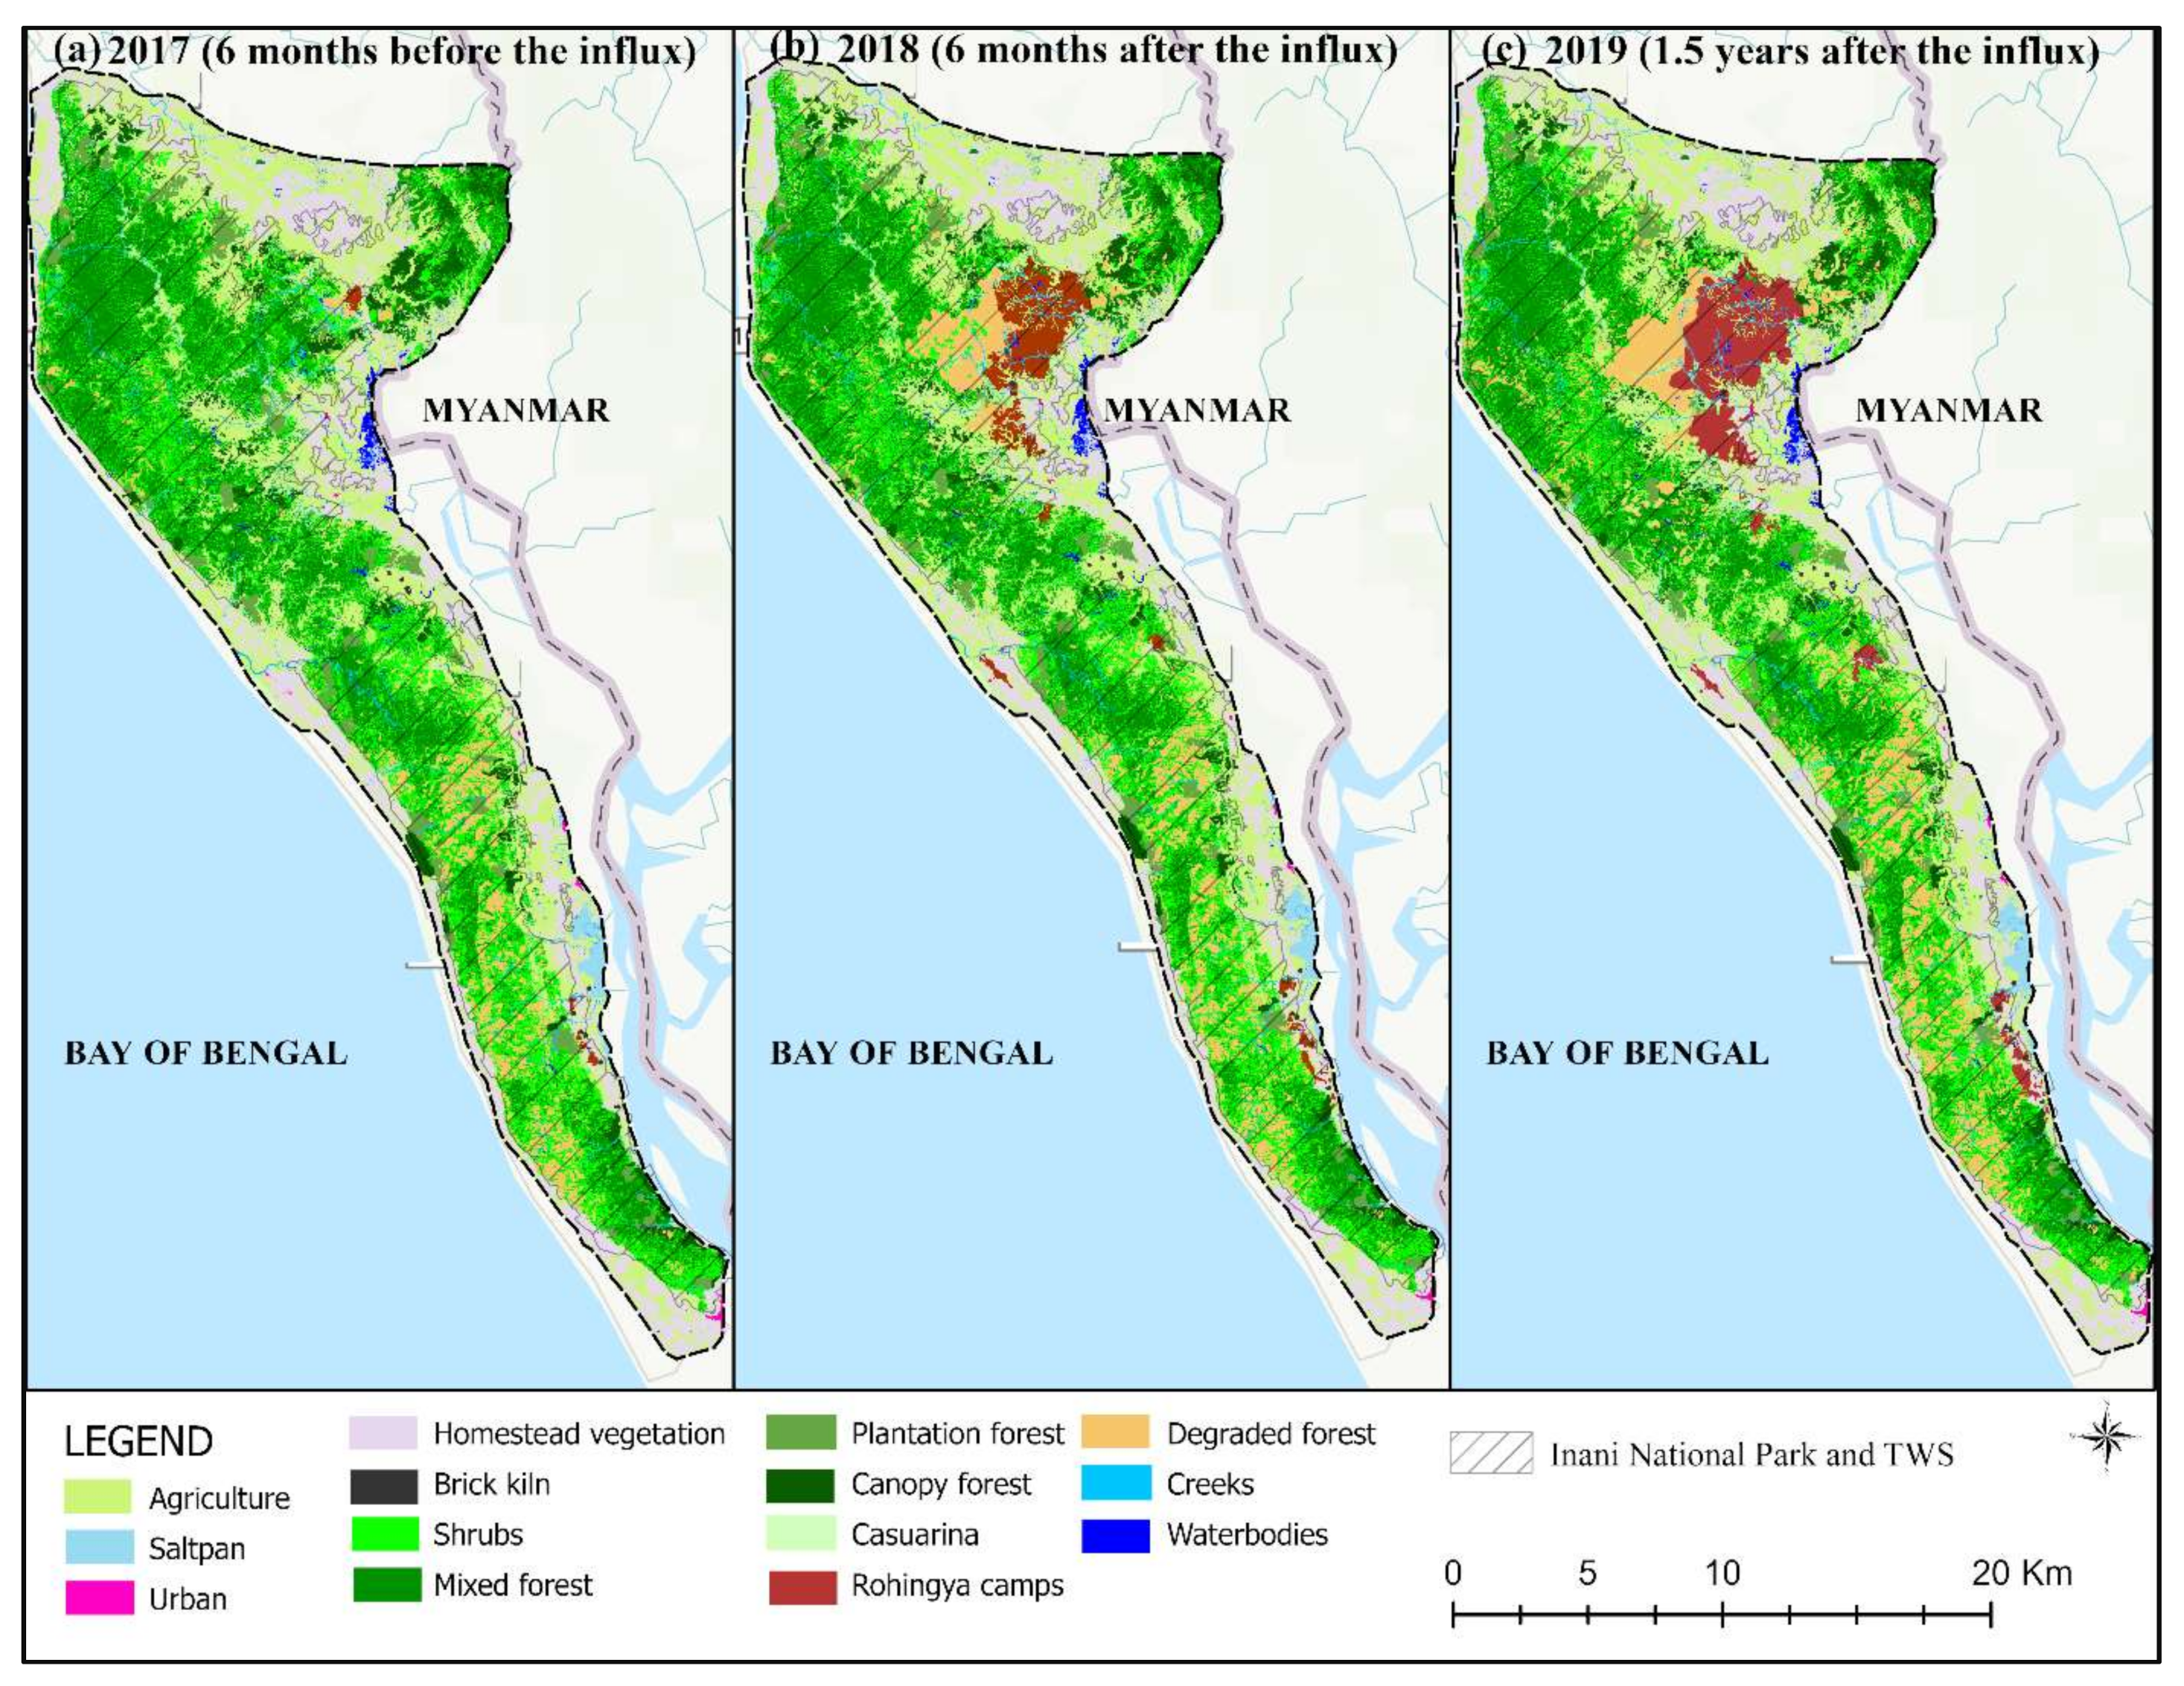
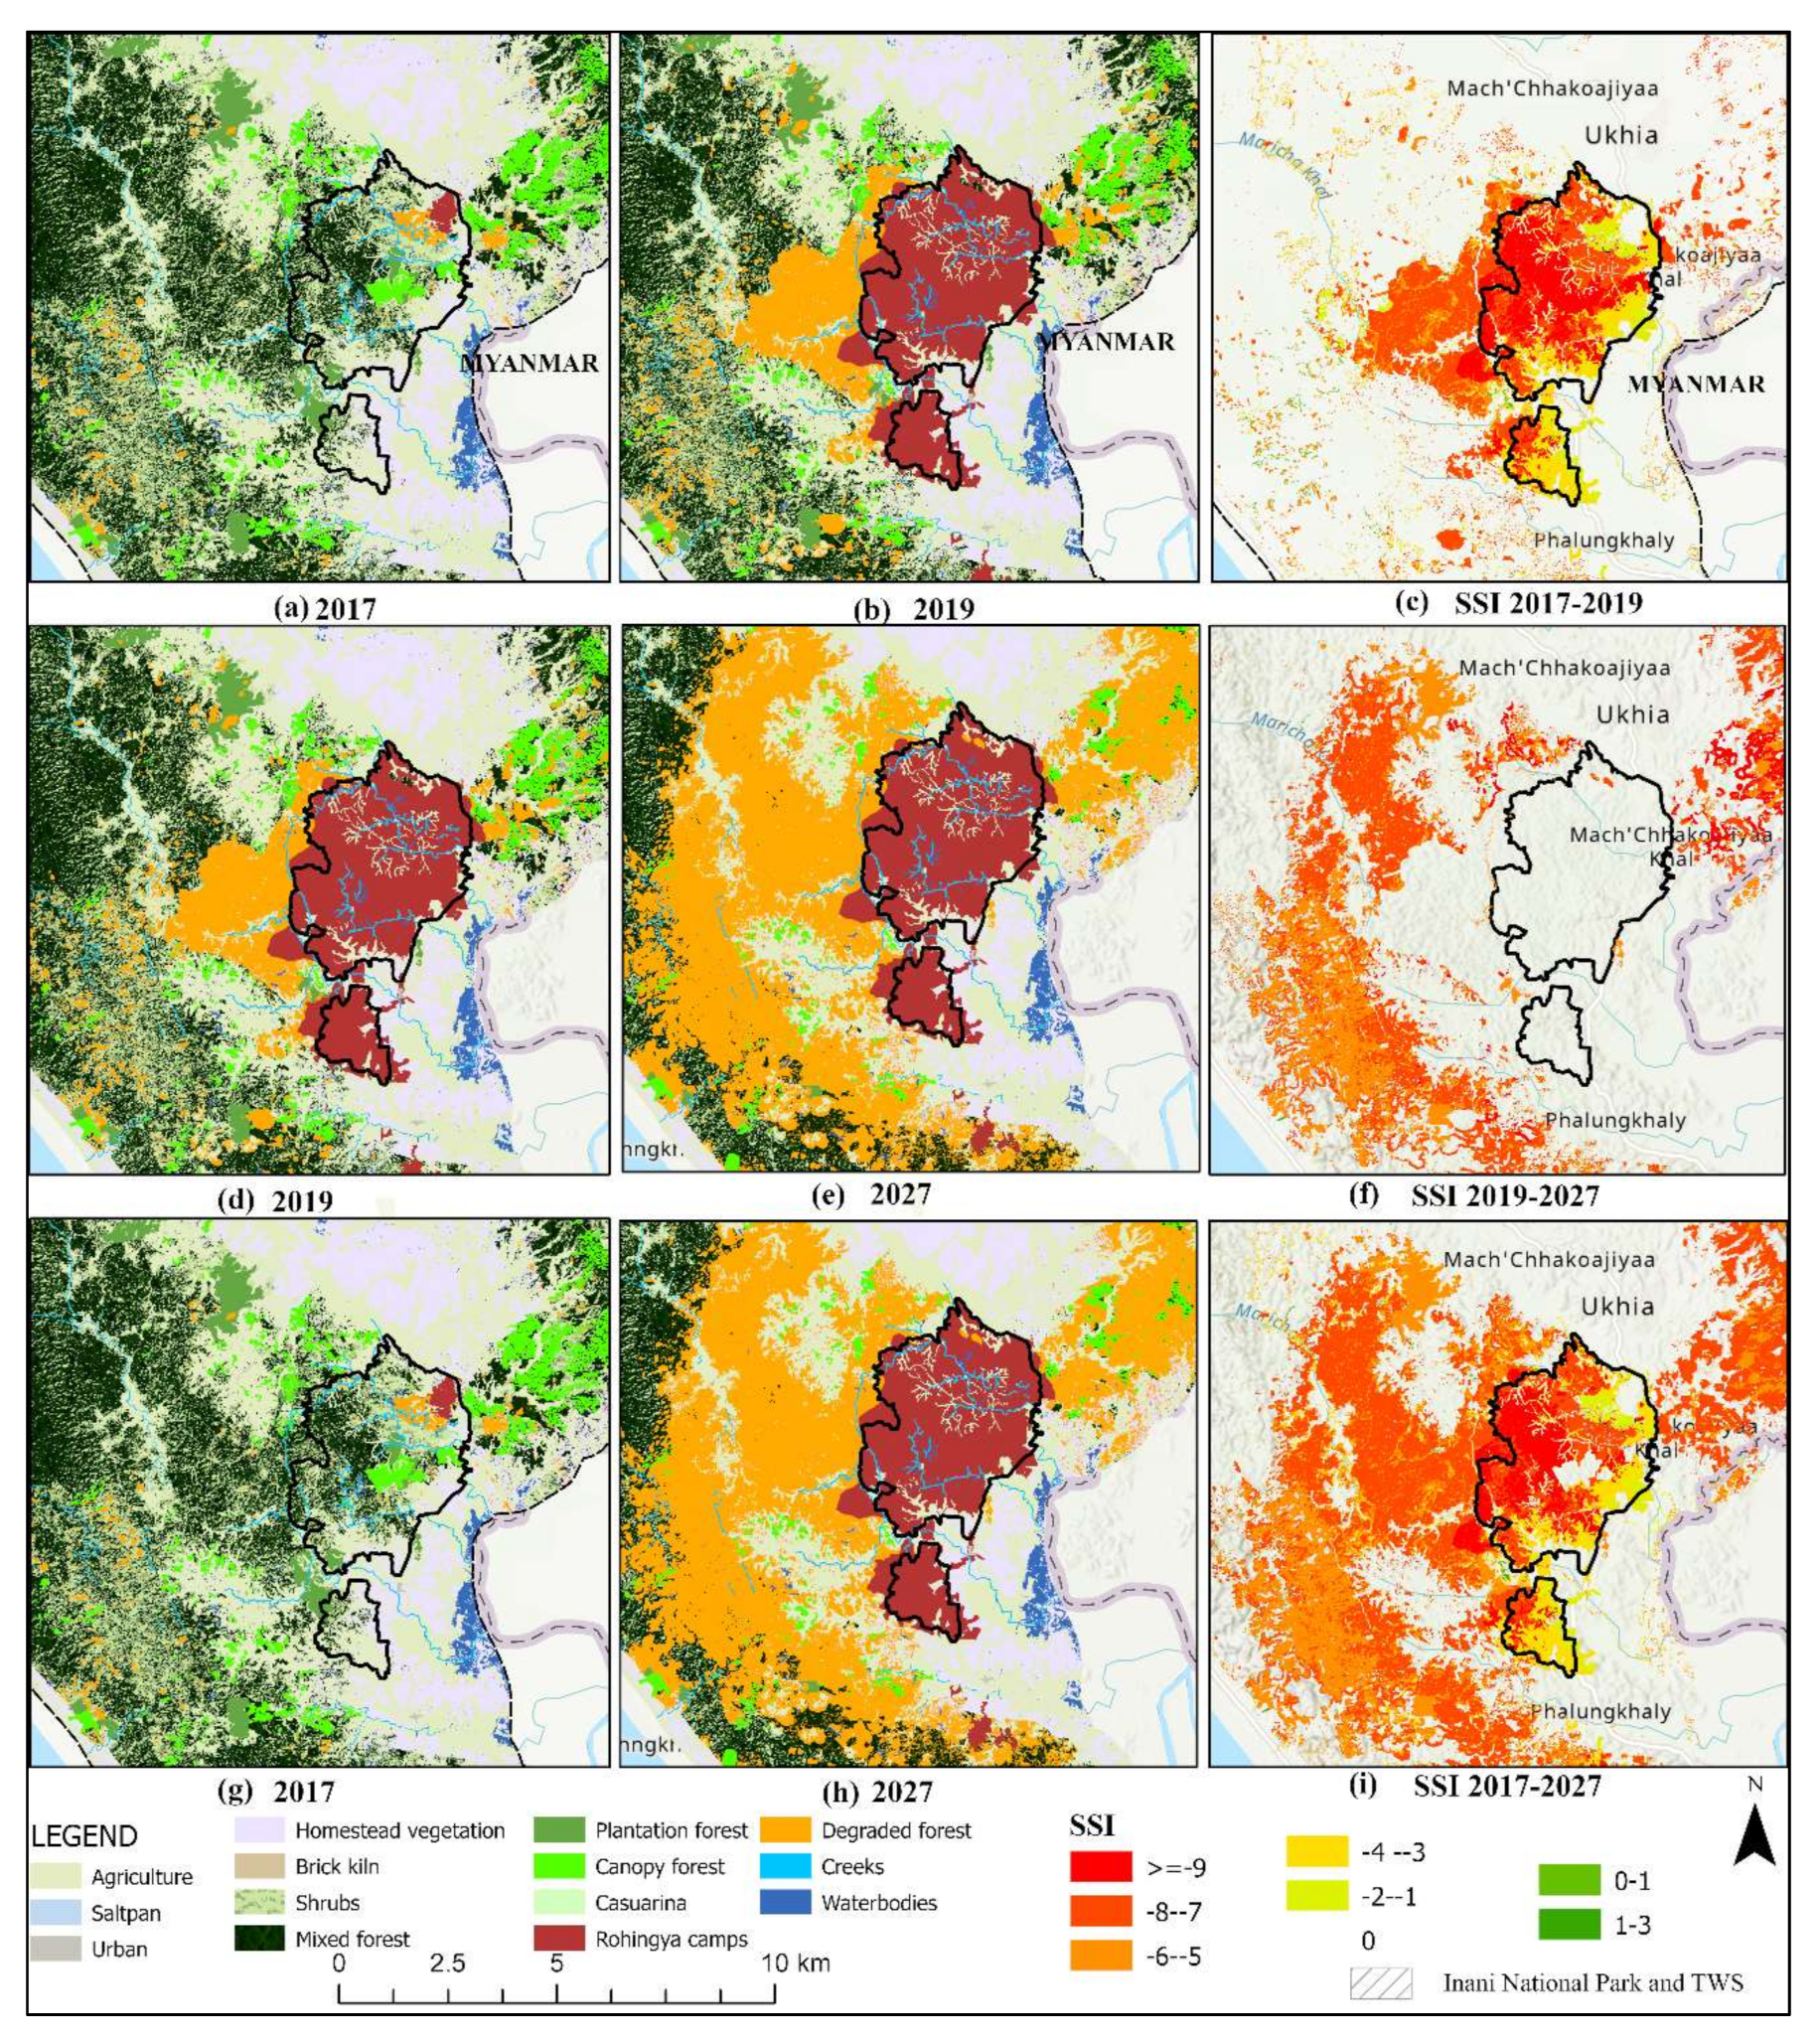
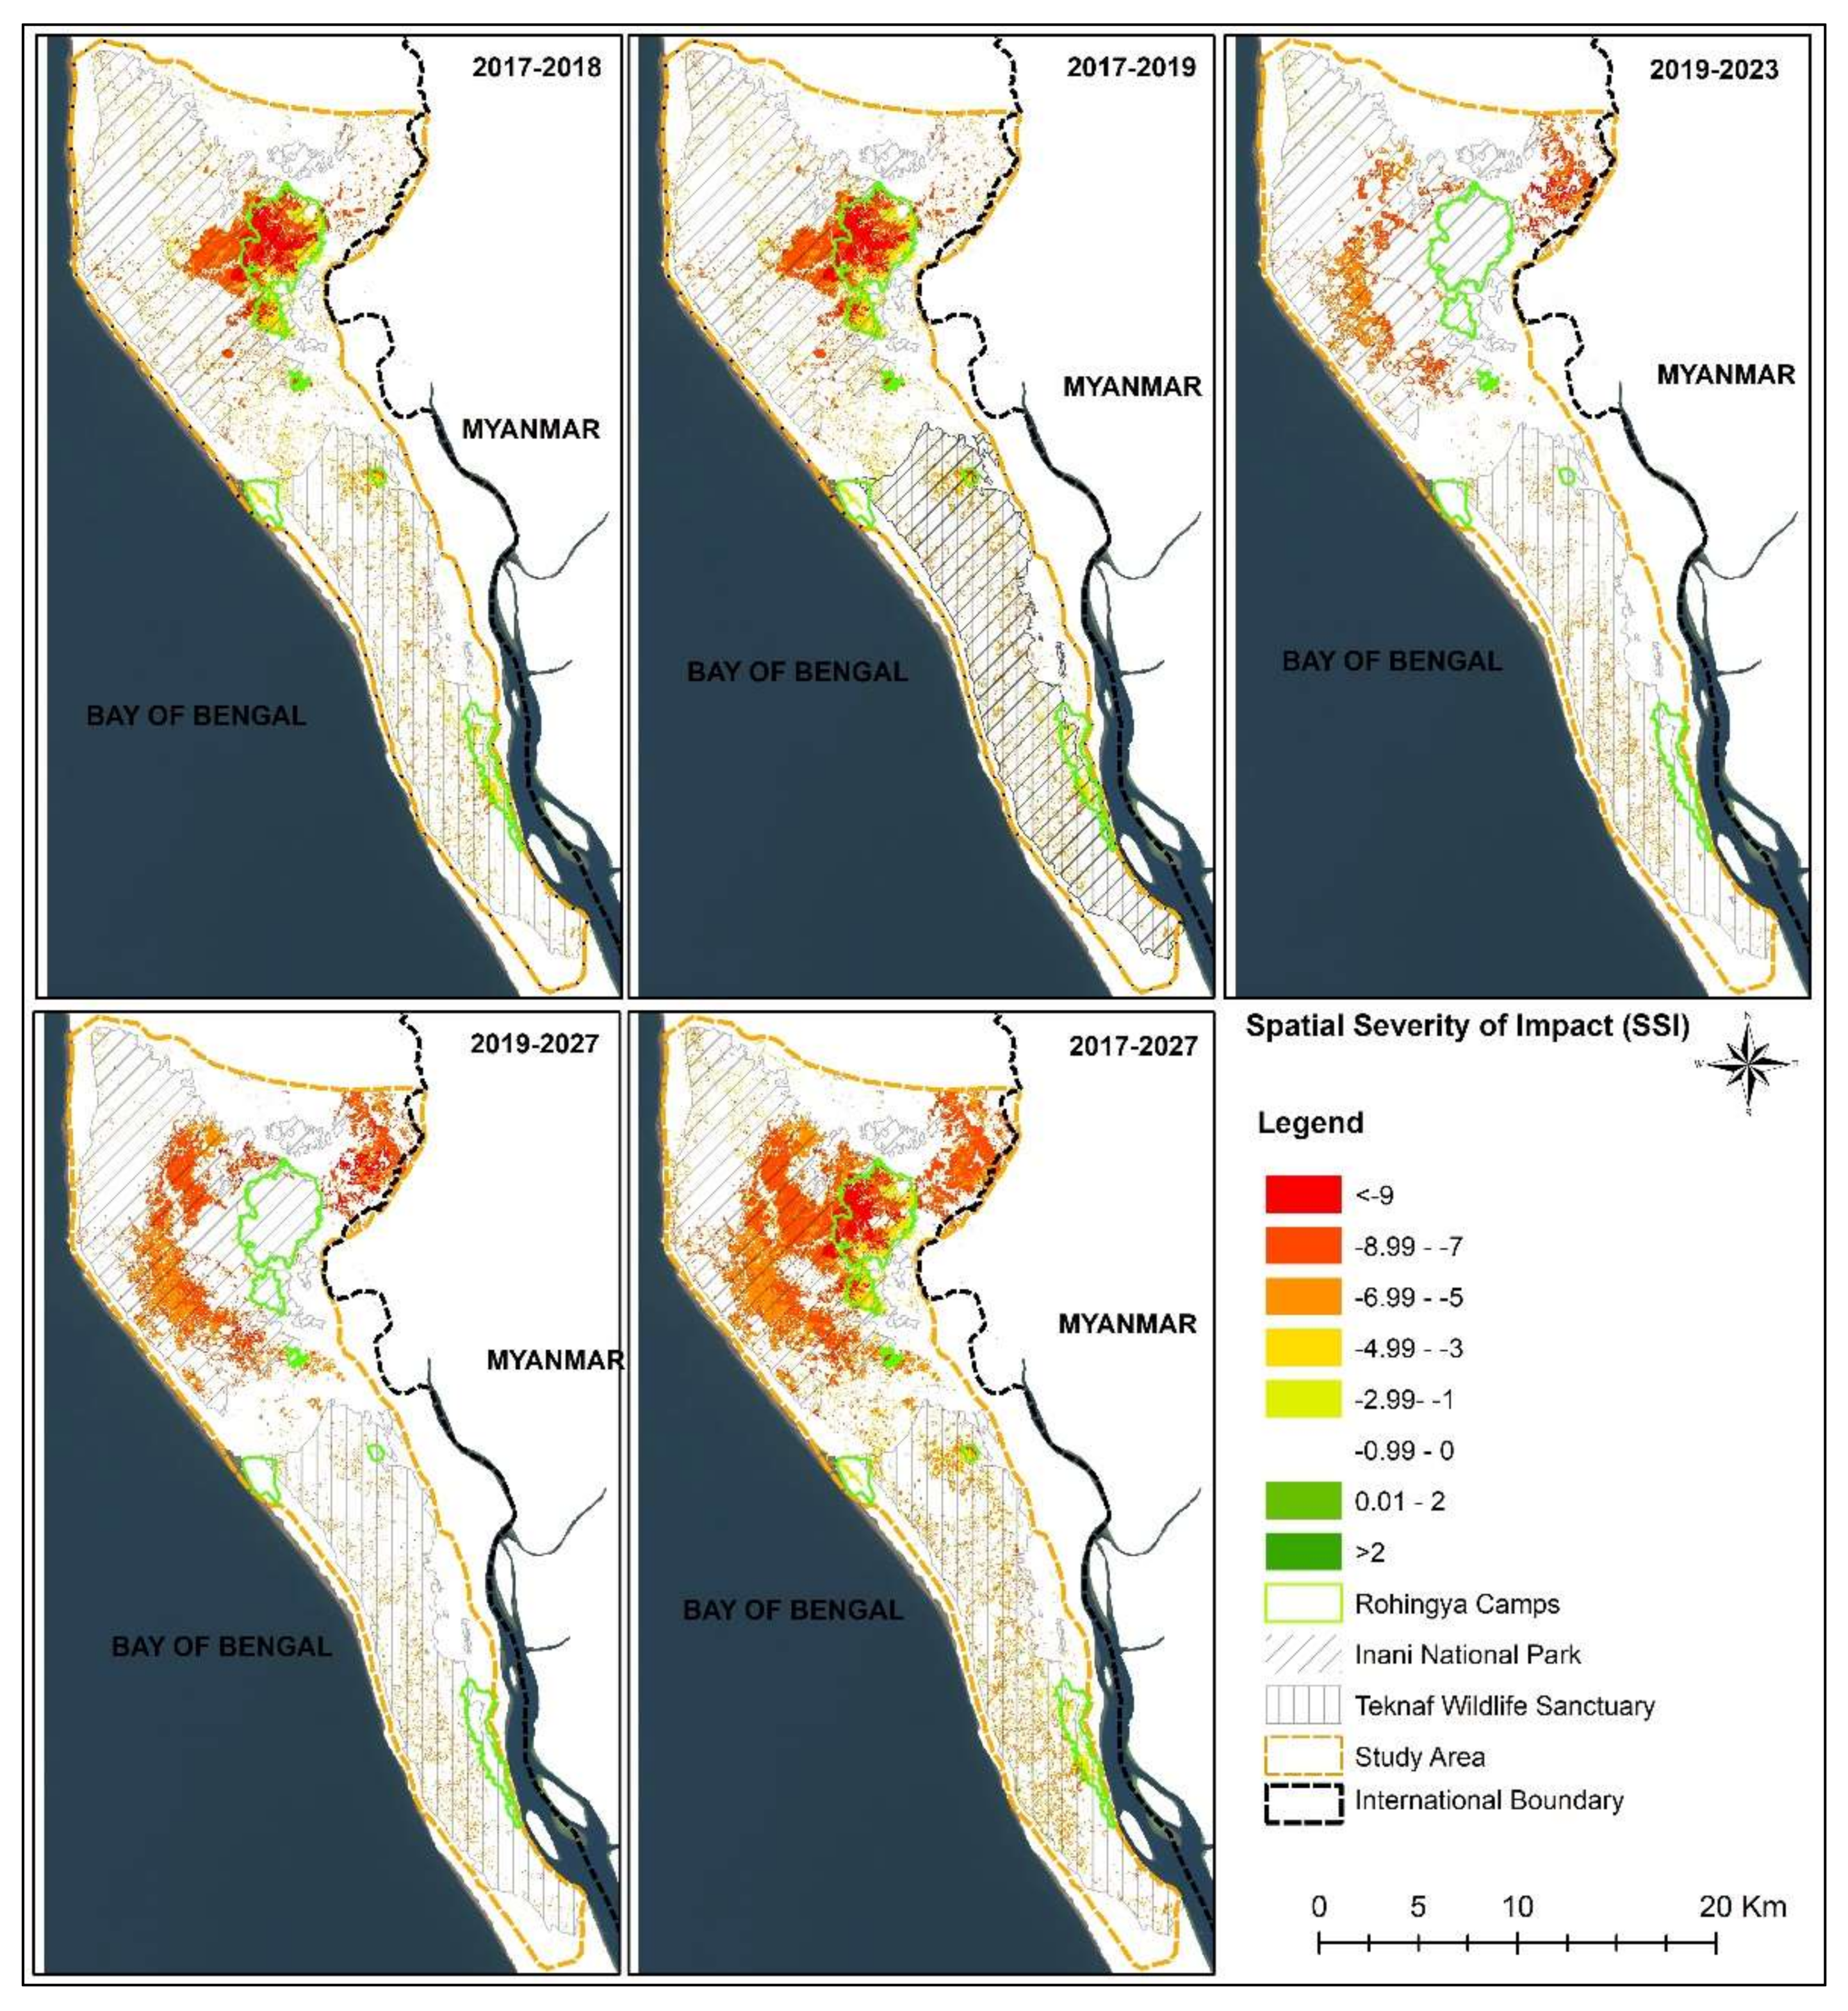
3.1. Spatial Severity of Impact (SSI) of Rohingya Influx on the Forest Ecosystem

The previous sections demonstrated the trends and predicted conditions of the forest ecosystem of the Cox’s Bazar–Teknaf peninsula based on areal changes in the key LULC classes. However, understanding of the overall impact of the Rohingya influx is dependent on the weighted value of the LULC classes in terms of the forest ecosystem. The result shows that, during 2017–2019, out of 41,242 hectares of land, 5591 hectares of land have experienced changes, where 5415 hectares of land have transformed in a way that has a negative impact on the forest ecosystem. Figure 6a–c demonstrate the process of the negative impact of anthropogenic stresses through SSI. The overall picture of the SSI for the whole study area is provided in Appendix B. In terms of the severity, around 650 hectares of land have been transformed from good forest condition to extreme deforestation. Figure 6 (Appendix B for the whole study area) shows the close-up view of the SSI value in color gradients, where red depicts the maximum negative impacts of Rohingya refugee on the forest ecosystem. Investigation of the map reveals that around the camp in the study area exhibited the maximum negative SSI value, which suggests that the area used to have comparatively good forest resources (e.g., a canopy forest) before the Rohingya influx. If the rate of forest degradation remains the same, then for the predicted period of 2019–2027, around 5208 hectares of land out of 41,242 hectares will be impacted, of which 5136 hectares of land will be negatively impacted (Appendix B). Figure 6d–f illustrate the process of impact assessment for future forest ecosystem conditions influenced by the projected anthropogenic stresses, and Appendix B illustrates the overall scenario for the study area. Similarly, Figure 6g,h also show the zoomed-in view of the spatial severity of the Rohingya influx between 2017 and 2027, where the extent of the severity is clearly illustrated. In similar fashion, from before the Rohingya influx (2017) to the future modeled year (2027), the overall SSI condition is presented in Appendix B.

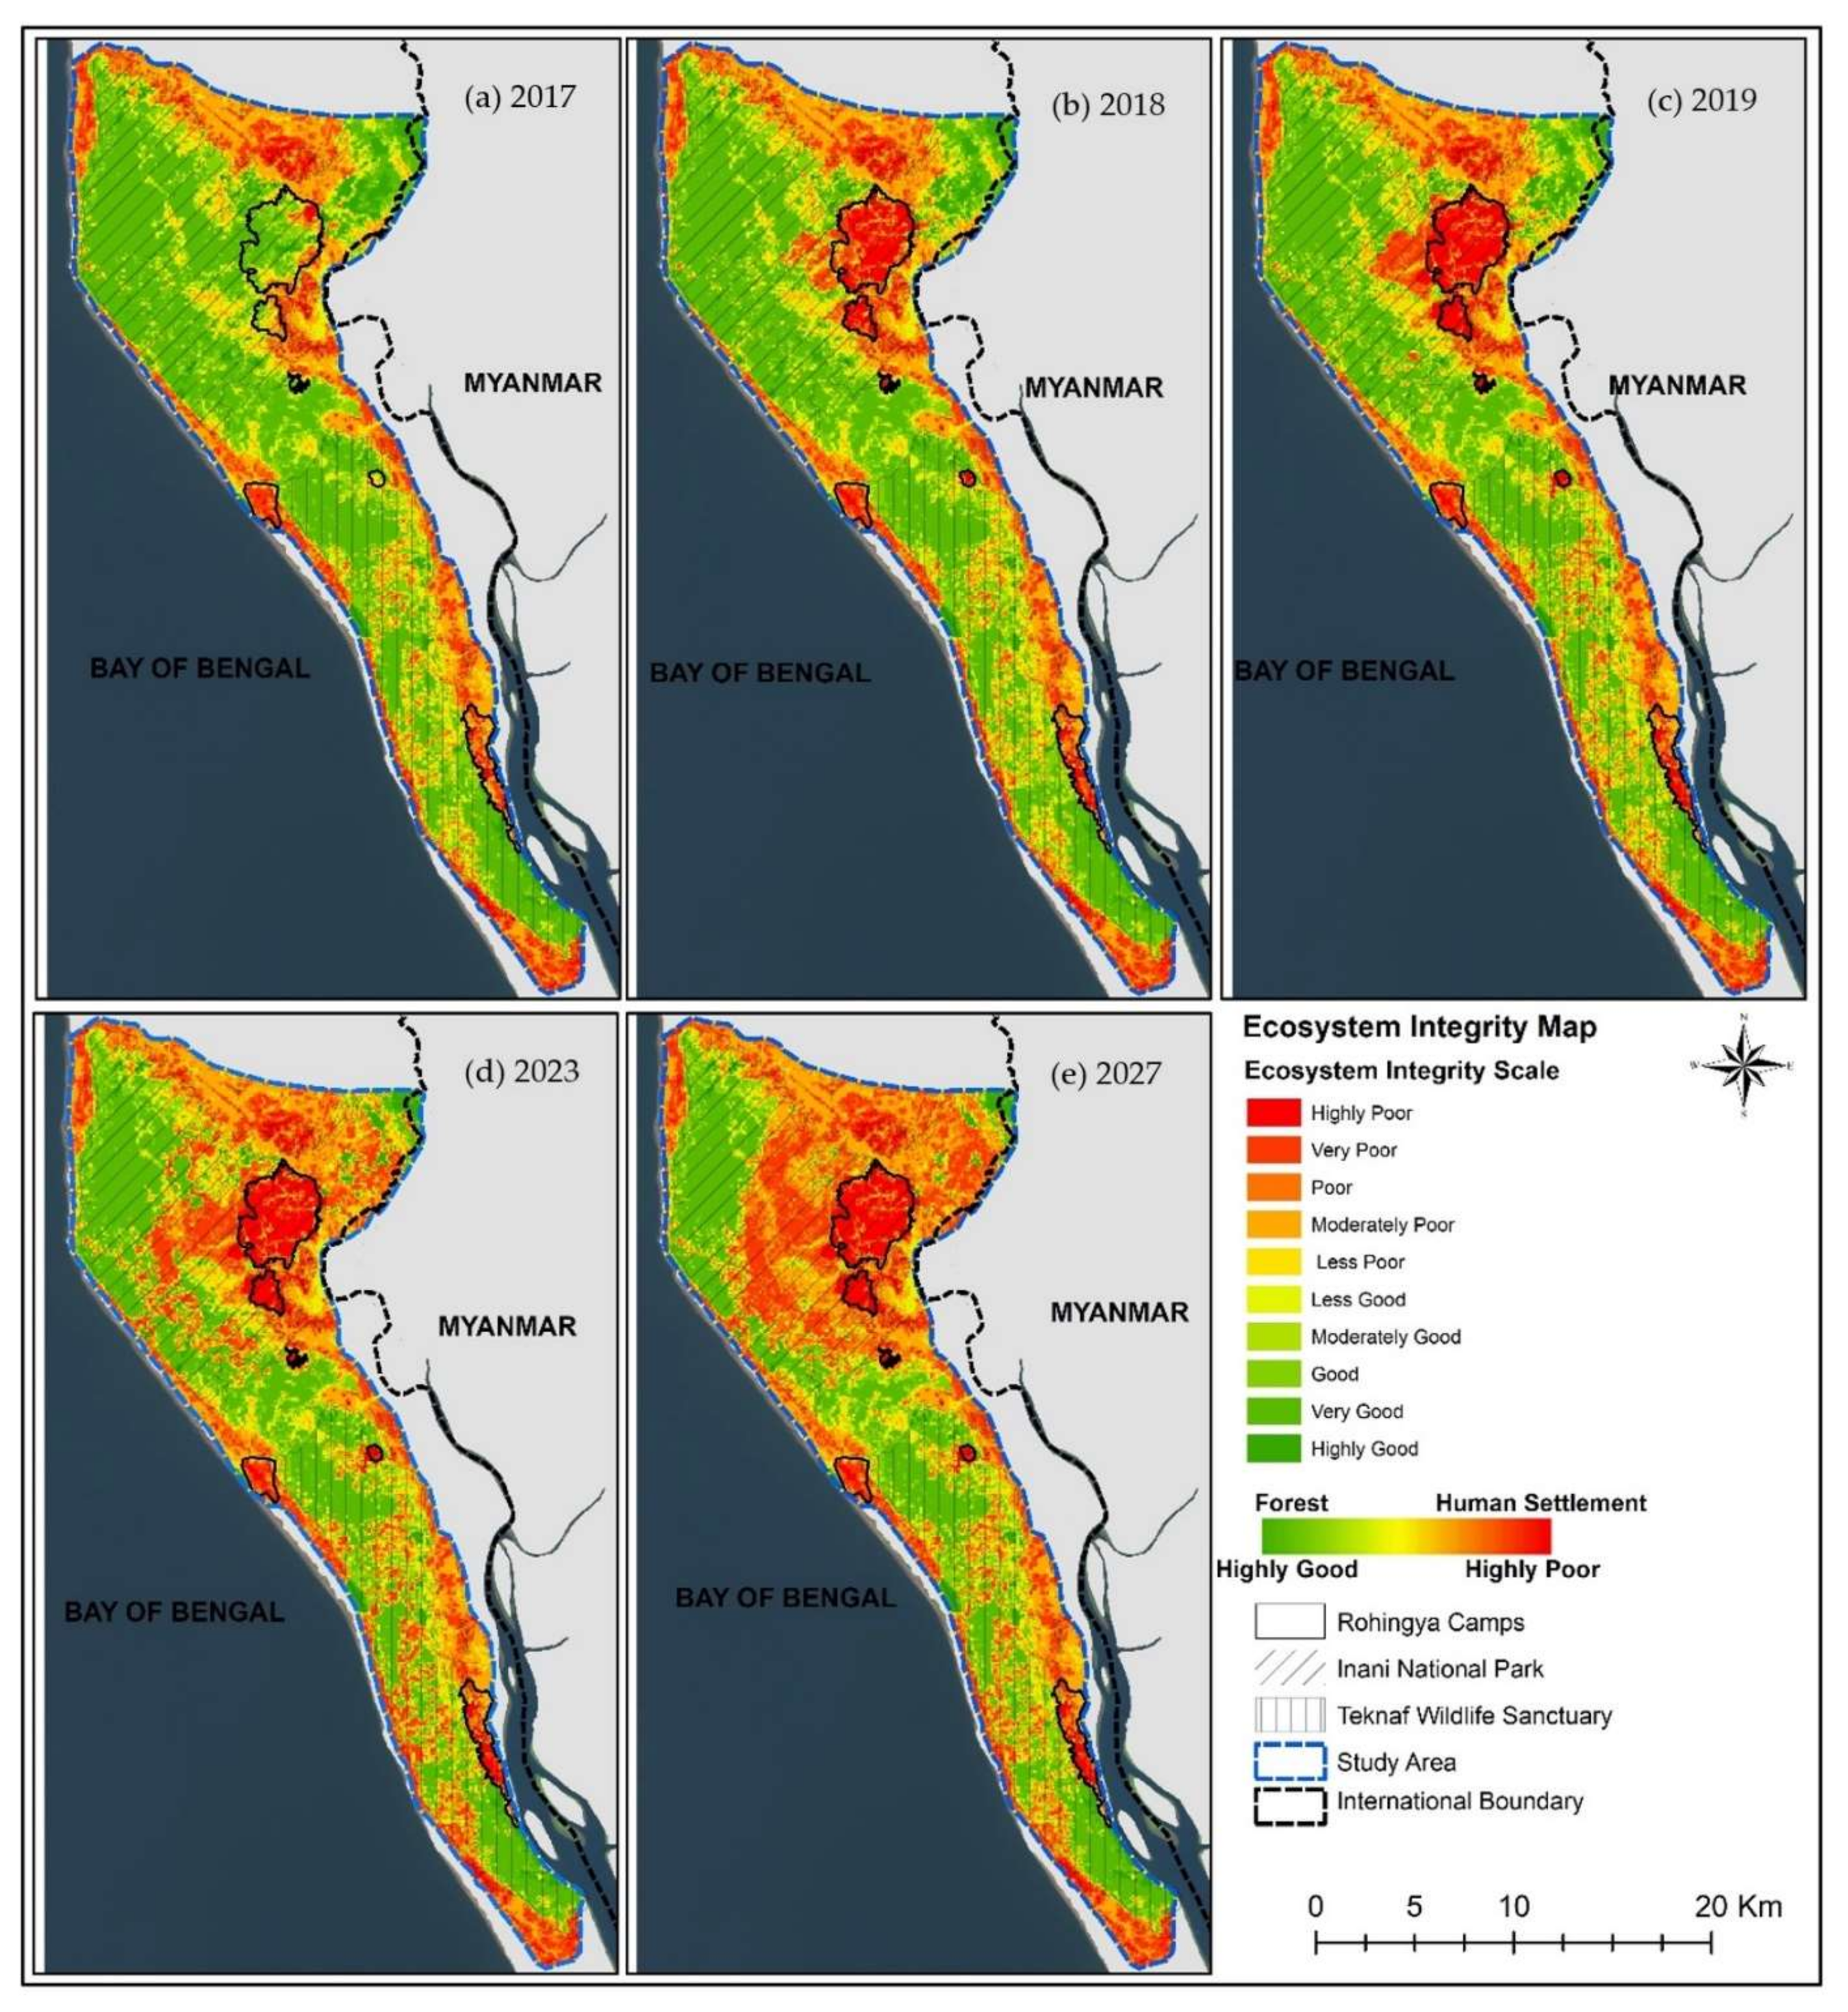
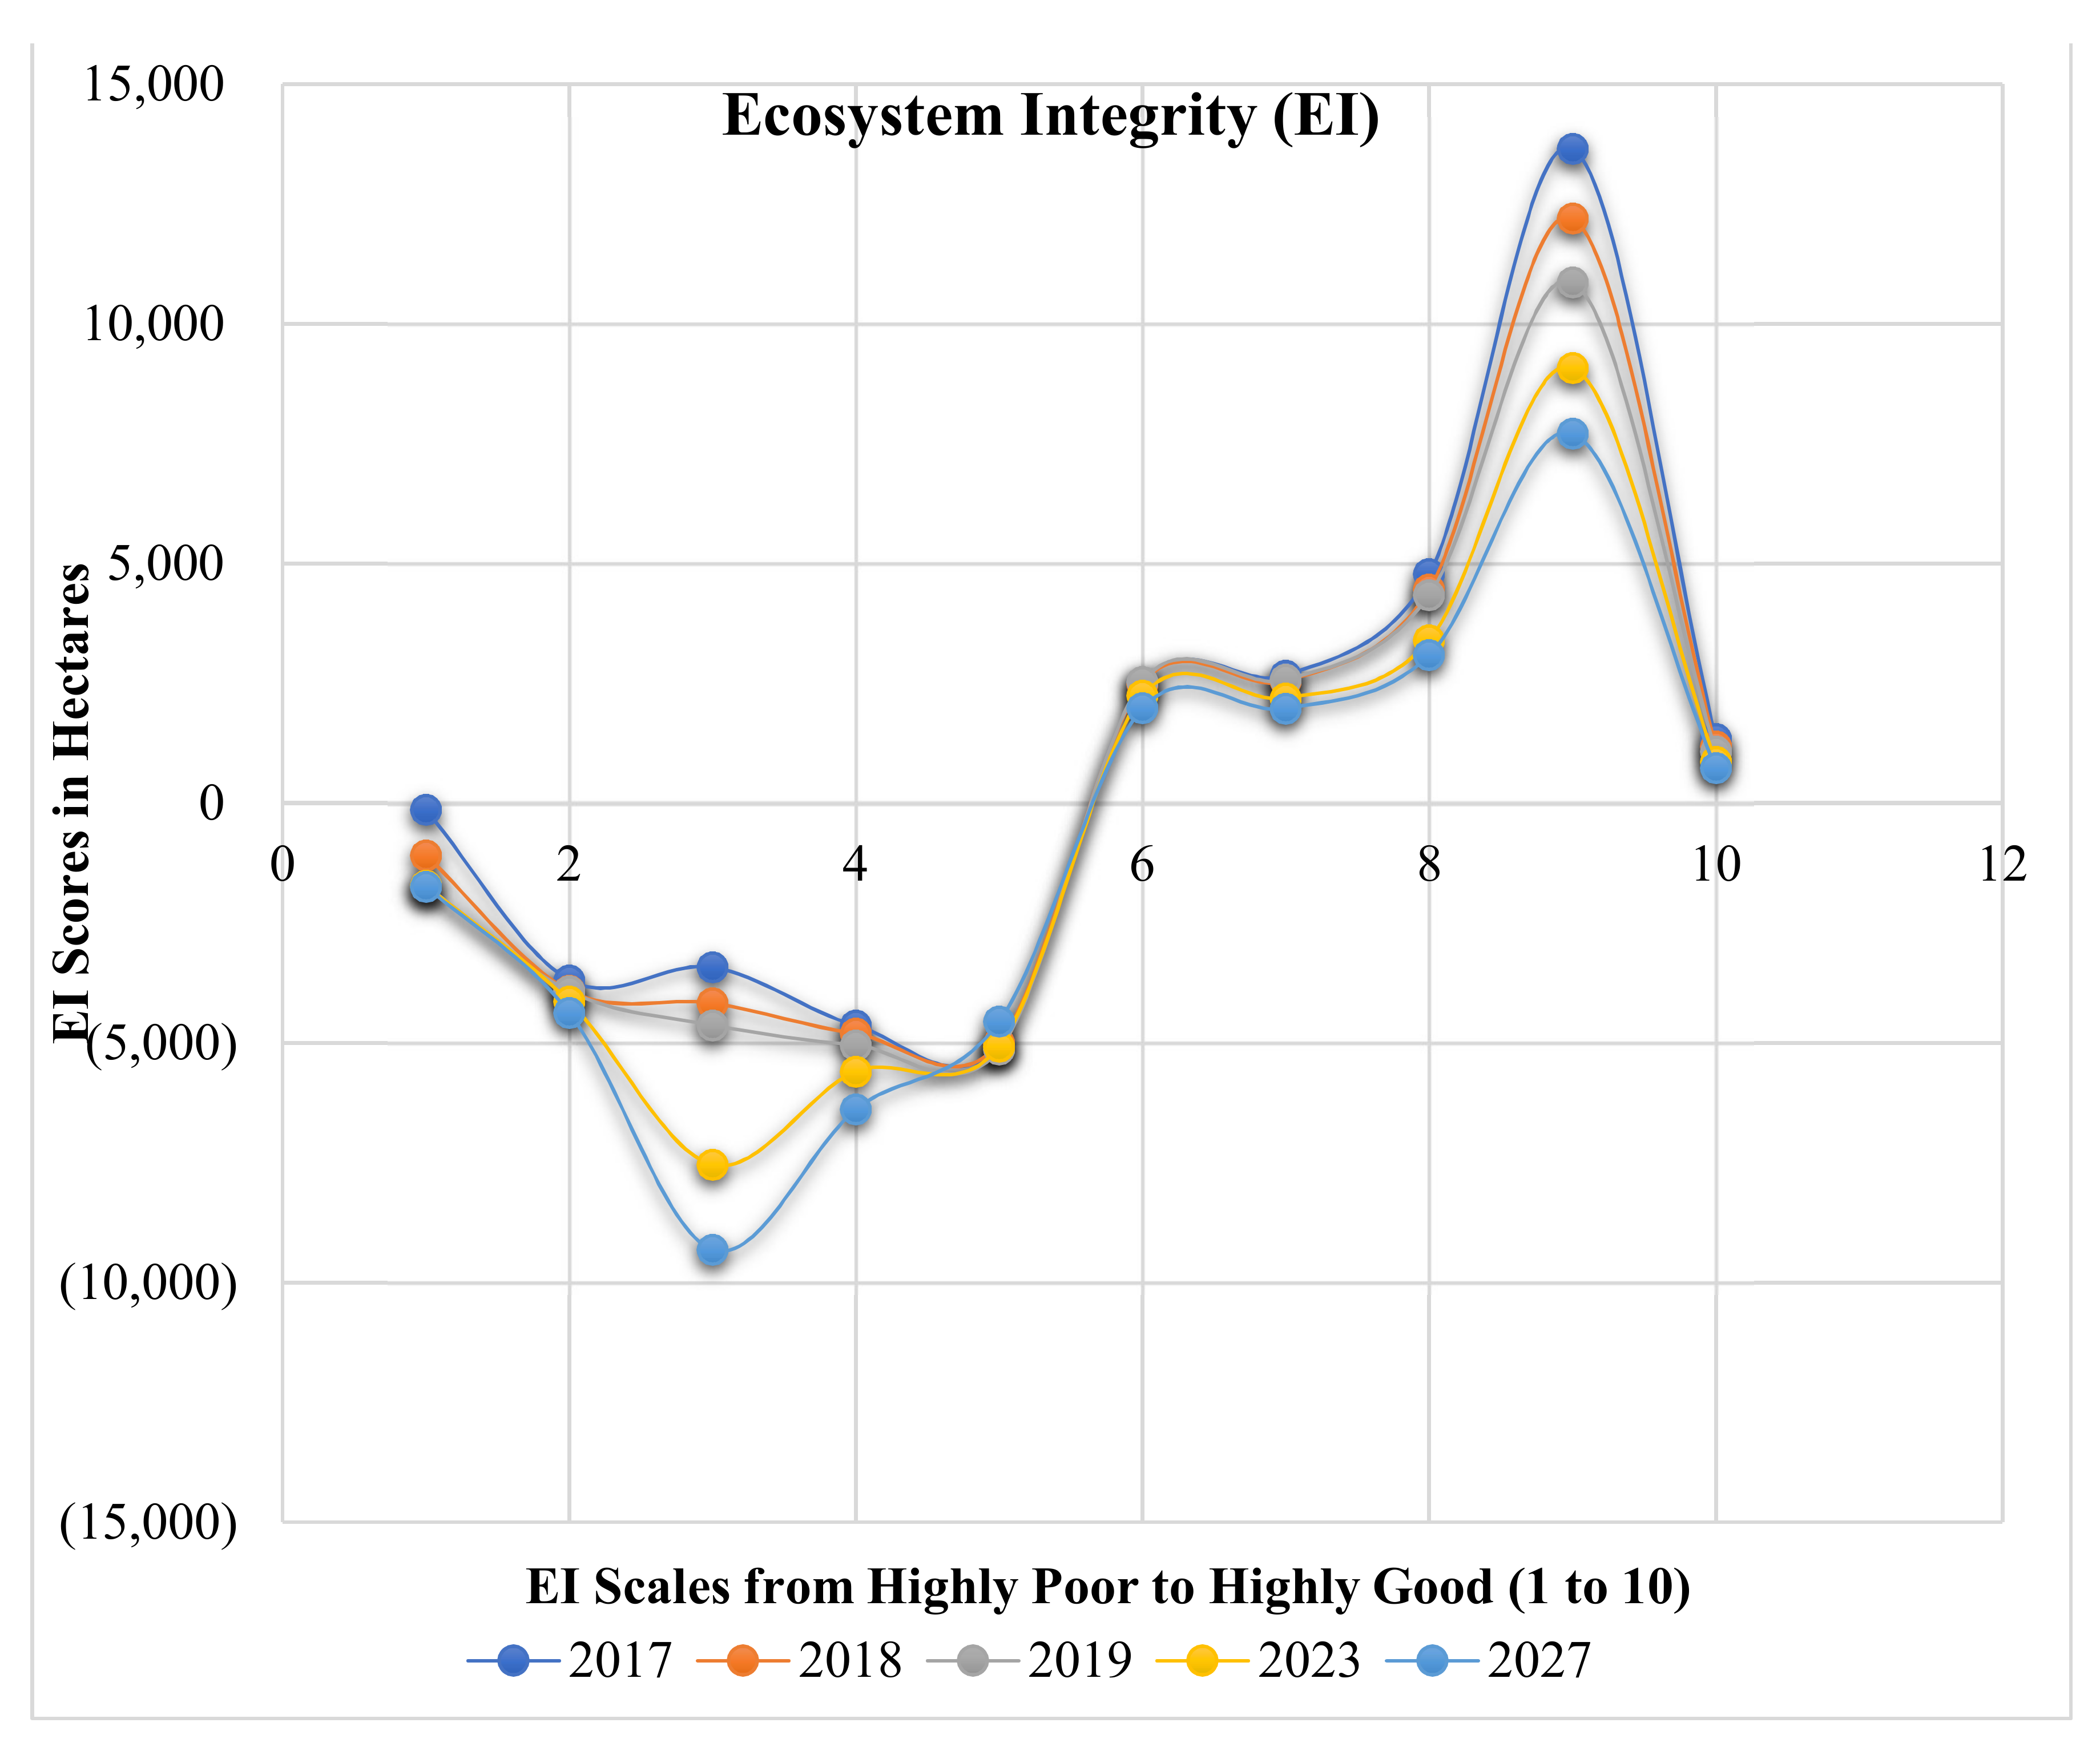
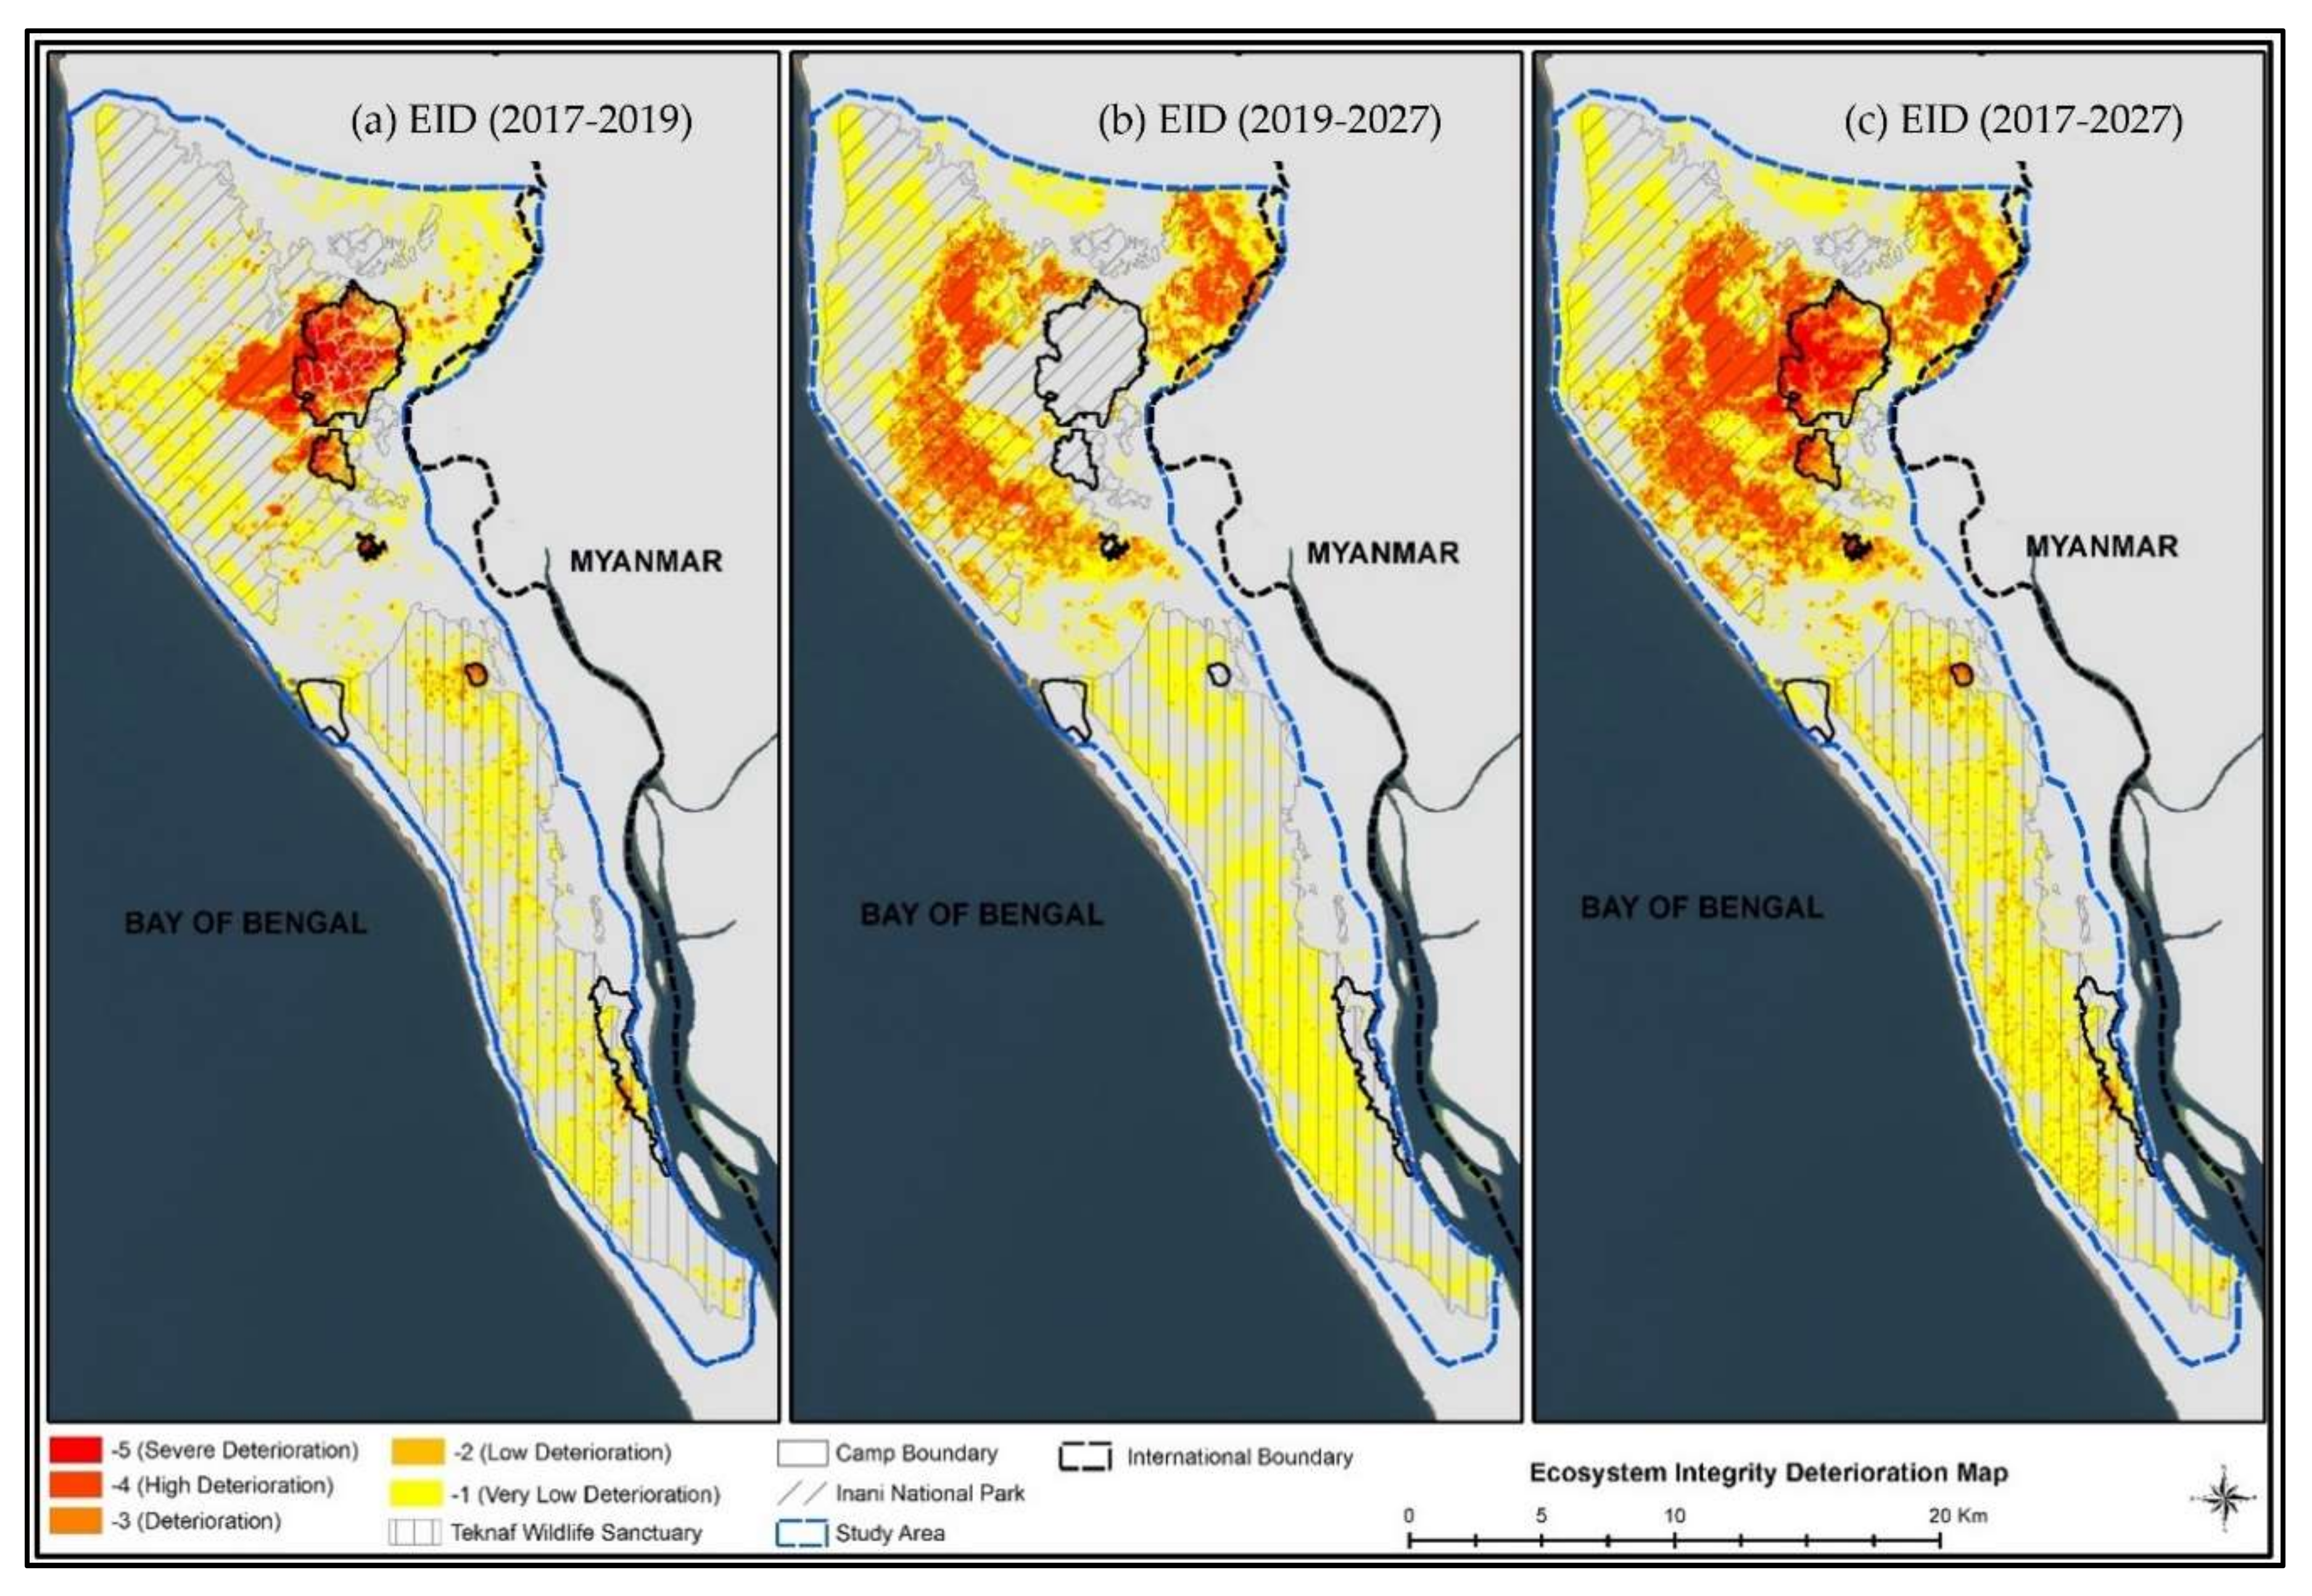
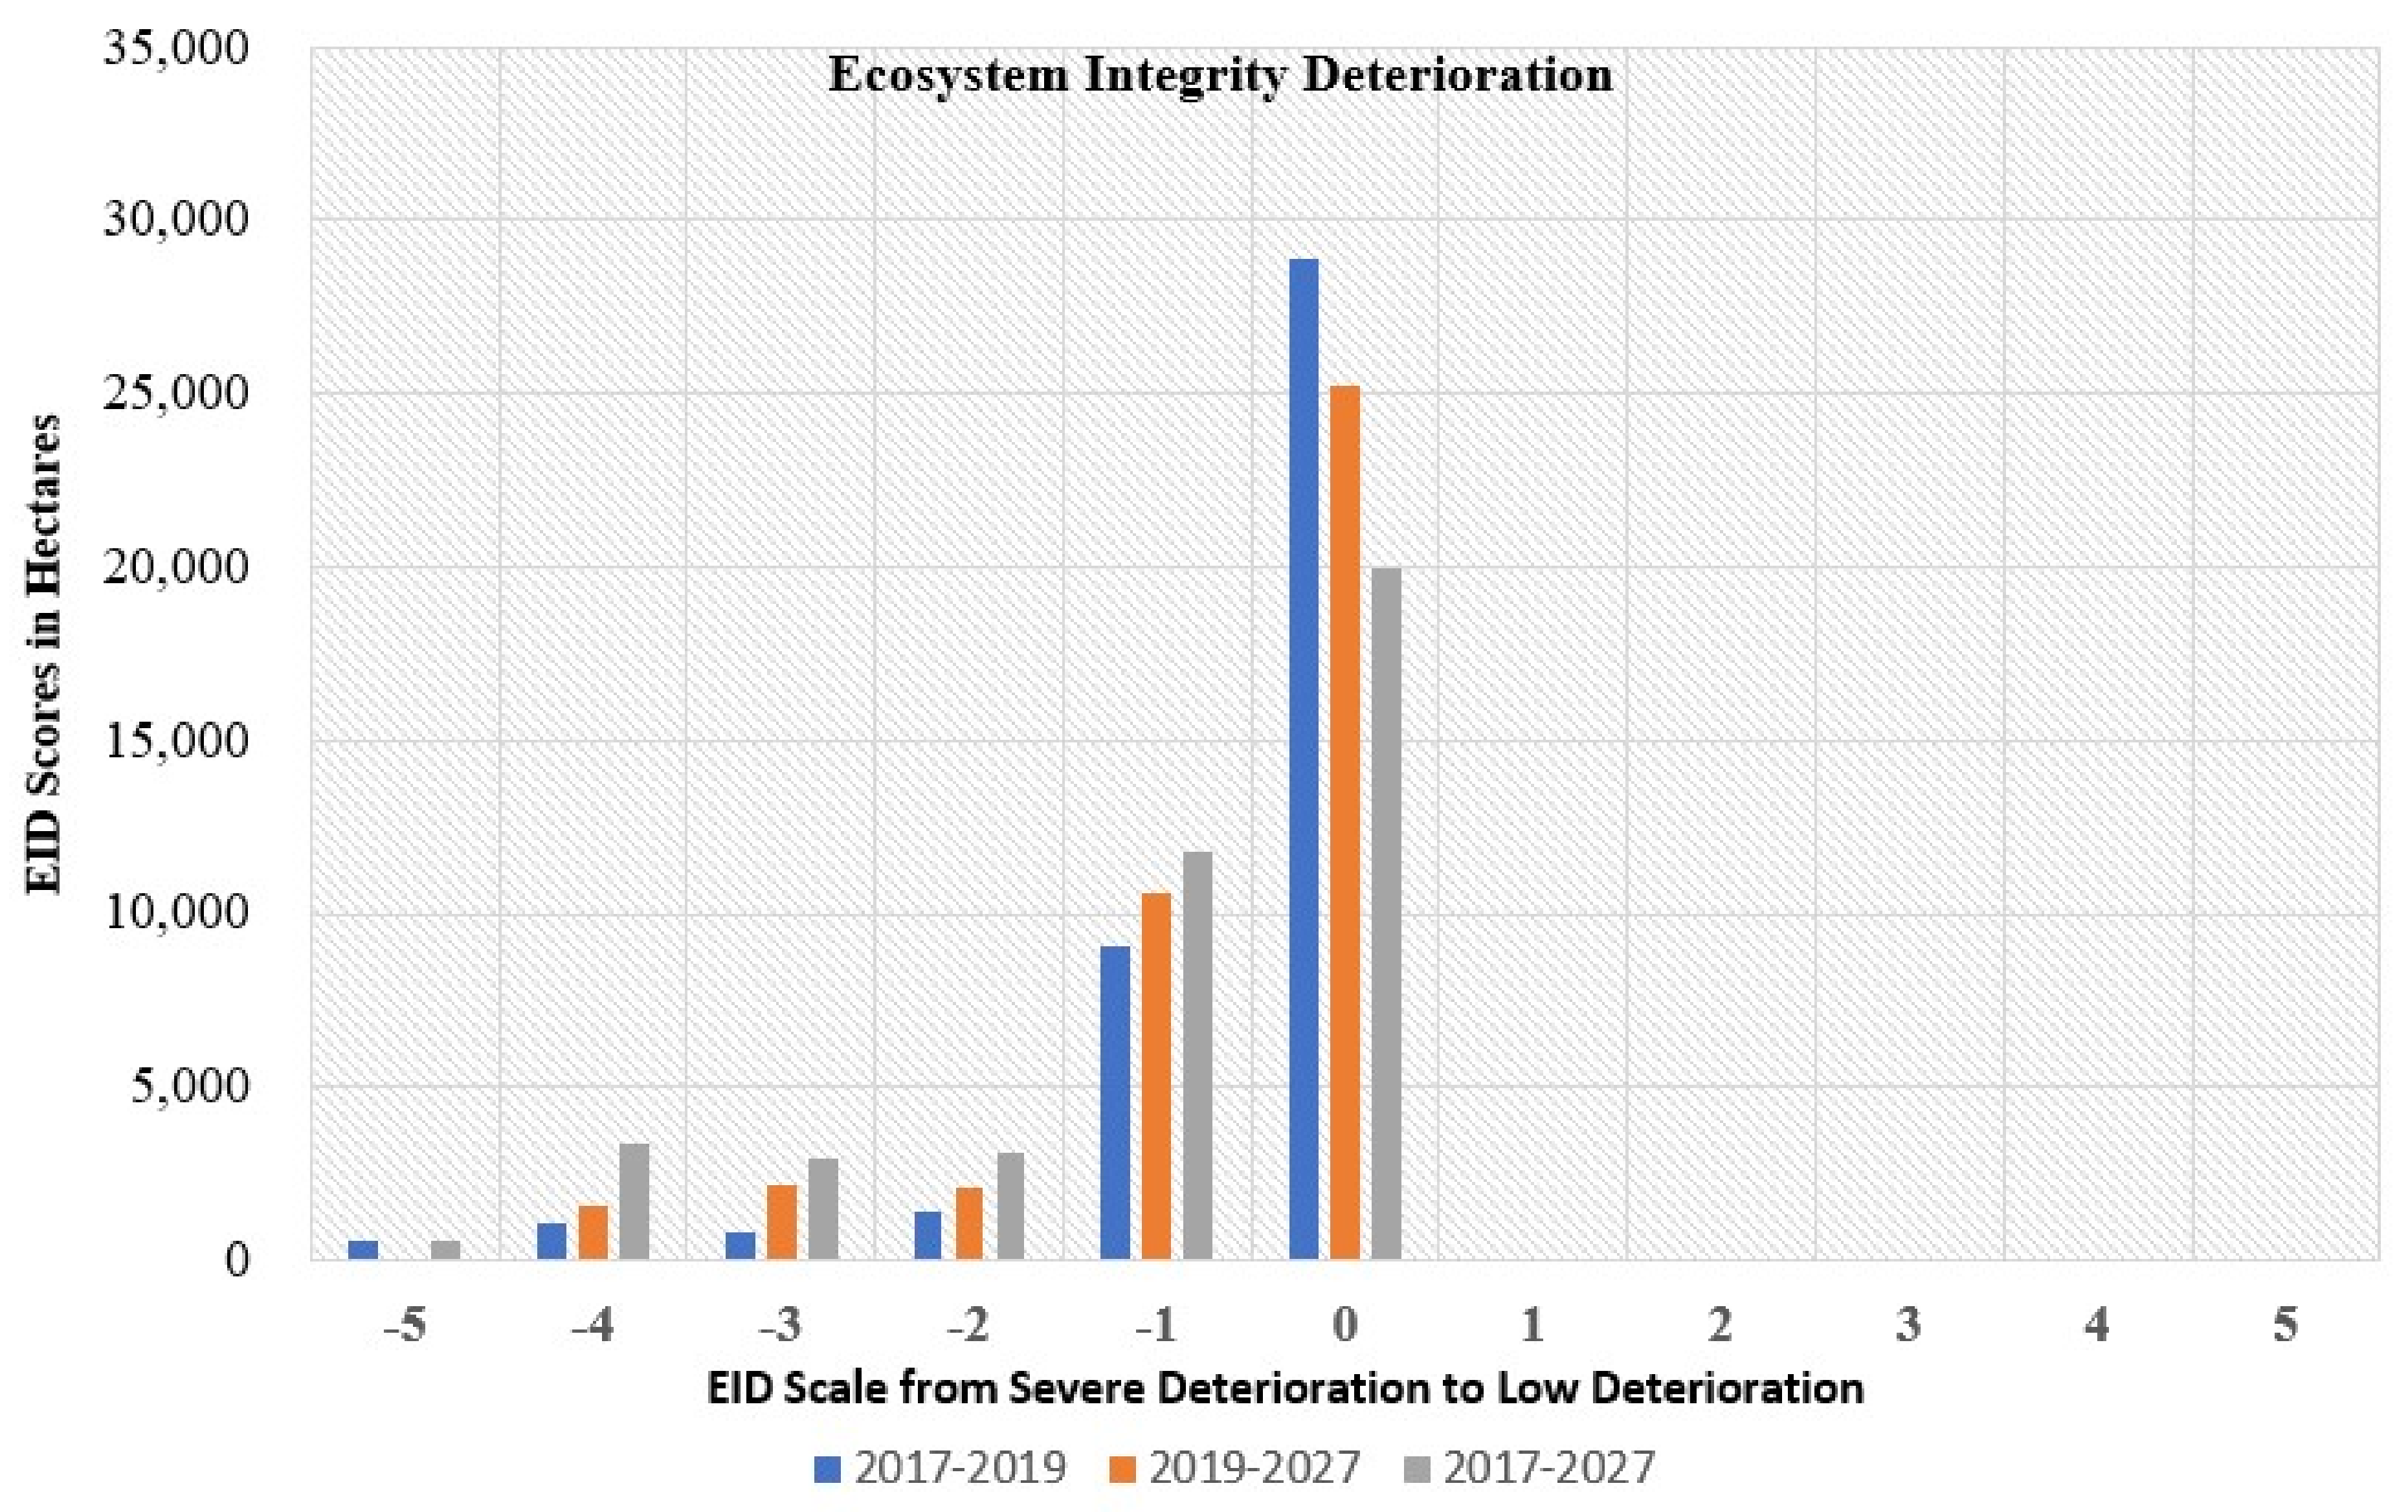
3.2. Assessment of Ecosystem Integrity (EI) and Ecosystem Integrity Deterioration (EID)

Although the pre-influx forest covers were not adequate for a healthy ecosystem, the study considered 2017 as the baseline for comparing the ecosystem integrity (EI) based on the forest structure, stressors, and stimulus. Figure 7 elucidates the integrity of the ecosystem from 2017 (before the Rohingya influx) to 2019 (after the settled Rohingya influx), as well as 2023 and 2027 as the predicted scenario. It was observed in 2017 shown in Figure 7a, that although there were sparse anthropogenic disturbances, the integrity was relatively good in forested lands (i.e., Teknaf Wildlife Sanctuary and Inani National Park). The integrity statistics of 2017 revealed that around 1340 hectares of land had a very good integrity value (i.e., canopy forest cover), and around 131 hectares of lands scored a very poor integrity value (Figure 7a and Figure 8), which refers to complete deforestation (e.g., camp area). The scenario in 2019 (Figure 7c and Figure 8) revealed that the very good ecosystem integrity value dropped down to 1189 hectares, whereas the very poor EI value rose to 1082 hectares. If the trend in Rohingya’s influence continues in this manner, the EI will be much worse in 2023 and 2027. As for 2027, the very good EI would further drop down to 738 hectares and the very poor EI value would be 1736 hectares (Figure 7e and Figure 8). In comparison to 2019, there is notable variation in the very good EI, but the areas with a very poor EI value are almost the same. This happened because the camp was no longer substantially expanding due to no mentionable Rohingya influx after 2019 (building camps require complete deforestation which incurs the maximum negative EI value). The data also reveal that out of 41,162 hectares, only a few hectares of land underwent extreme negative EI, although the camp area itself was around 2000 hectares in 2019. This also indicated that the ecosystem was not at its highest integrity level in most of the study areas. The EI however, underwent substantial variations for the case of ‘very good’, where the EI dropped to 12,196, 10,869, 9087, and 7712 hectares from 13,653 (2017) for 2018, 2019, 2023, and 2027, respectively. These numbers also reveal the ecosystem structure to mostly be Mixed Forest (MF) and Shrub-Dominated areas (SH). In other cases with a positive EI scale (i.e., Good, Moderately Good, and Less Good), we also observed a decreasing trend in EI, which indicated the ecosystem was deteriorating as time elapsed. In reverse, high variation was observed in the ‘Poor’ EI scale rather than the ‘Very Poor’ EI scale, where the ‘Poor’ rose to 4174, 4631, 7536, and 9317 hectares from 3420 (2017) for 2018, 2019, 2023, and 2027, respectively.
These areas represent the degraded forest areas transformed mostly from Mixed Forest (MF) and Shrub-Dominated Area (SH). In the case of the ‘Moderately Poor’ and ‘Less Poor,’ the EI value also rose, which meant a depletion of the ecosystem integrity. The positive and negative EI scores suggest a loss of ecosystem integrity due to the Rohingya influx. However, the magnitude of the EI loss is well understood from the quantitative findings of the ecosystem integrity depletion (EID) scores (Figure 9 and Figure 10).
The findings of the EID elucidate that in the case of ecosystem integrity depletion (EID), areas of 540, 0 and 544 hectares exhibited severe EID scores (−5) between 2017 and 2019, 2019–2027 and 2017–2027. The reason behind the 0 scores during 2019–2027 suggests that after 2019 within the influenced area there would only be degradation other than complete deforestation as the camp size remains stable. The findings of the EID scores for the severe scale of 2027 also suggest the same as there is no significant increased area under the severe EID category. Variations in EID score were strongly observed between the EID scale of ‘High’, ‘Deterioration’ and ‘Low’, and between 2017 and 2027, EID scores were 3399, 2965, and 3162 hectares, respectively. These EID areas are marked in mars red, fire red, and electron gold in the map. Spatially, the maps show that the EID score is high around the camps, strongly confirming the Rohingya impacts on the forest ecosystem. The maps and statistics do not show any influential level of positive EID scores, which means that no influential improvement from deforestation and degradation took place.

4. Discussion

The protection, conservation and sustainable management of forests are often challenging [77], especially for developing countries such as Bangladesh where there is high population density [31], and most of these population is marginal and depends on natural resources for their livelihood [15,78,79] which often leads to degradation and deforestation of the forest [24]. The Cox’s Bazar–Teknaf Peninsula is an Ecologically Critical Area [16,17], with including three reserve forests [18,19]. Research conducted by CEGIS [20] and the Arannayk Foundation [21] represents the forest loss of this area, although the government has declared these forests as reserves and restricted them to protect these forests. Due to the sudden influx of the Rohingya population, at least 1650 hectares of forest lands were cleared alone in 2017 to establish camps for the refugees [11,12,48] and a total number of 1970 hectares of forest and agricultural lands have been occupied until now, based on the GIS estimations of the camp boundaries [27,30]. The SSI, EI, and EID indexes of the study estimated and quantified the ecosystem status in different spatio-temporal aspects of the study area, which coincided with previous studies. The indexes portrayed the rapid and sudden impact of the influx in 10 m spatial resolutions. This study is the first attempt to assess not only the forest loss, but also explore the spatio-temporal patterns of forest loss as well as forest degradation due to the Rohingya influx with dynamic modeling of future projections. The findings of this study, based on the spatial severity index (SSI), have shown that around 13% of the forest in the Teknaf peninsula was negatively transformed from 2017 to 2019, which was previously a good forest resource before the Rohingya influx. Prediction of SSI on forest areas indicate that more forest areas will be degraded, and there seems to have been no sign of improvement in the predicted year. The impact, integrity, and deterioration of the study area through the degradation and loss of biomass and carbon stock is also contributing to the acceleration process of climate change [12]. The process of degradation of forest triggered by severe fuelwood collection and logging by the Rohingya population [31,32,78] is justified, because the SSI, EI, and EID values portrayed the scenario especially during 2017–2019 and 2017–2027. The fuelwood collection process has now been so extensive that areas nearby the camps have been completely cleared of vegetation, and topsoil has been severely exposed. Additionally, the soil has been dug open to uncover and remove the plant’s remnants, especially the roots of trees, which is consistent with the findings of Moslehuddin et al. [15], Hasan et al. [12], and the UNDP [35]. The rapid loss of vegetation and anthropogenic weathering affect the topsoil, which is being removed and washed away, which will eventually disturb the nutrient cycle of the forest ecosystem [80]. The most alarming fact revealed by this study is that cleared forest lands due to Rohingya influx include the newly planted forests which were established under the CRPARP project between 2014 and 2016. Alongside CRPARP, a total of 709 ha of plantations have been completely chopped down as a result of the building of makeshift shelters and camps. The forest ecosystem of the Cox’s Bazar–Teknaf peninsula has always been compromised to satisfy human needs through resource extraction, and also serves (before August 2017) as a home for diverse plant and wildlife communities. The loss of the flagship species of the Asian elephant (Eliphus Maximus) [22], and the countries tallest tree species, Boilam (Anisoptera Scaphula) [23], resembles the deteriorated ecosystem integrity, which is similar to these study findings of the declining trend in ecosystem integrity value after the Rohingya influx, which will continue to drop in the future according to the projections drawn in this study if no preventive measures are taken. The extensive clearance of forest vegetation has resulted in the fragmentation of a forest which was once almost continuous, with diverse vegetation [11]. The fragmentation of forests has severely hampered the habitat of many wildlife species, include the Asian elephant [81]. Before the influx of the Rohingya, there were two active elephant corridors within the Cox’s Bazar–Teknaf Peninsula, including multiple routes for movement within this habitat [22]. Therefore, the elephants can no longer move between the adjacent habitats of ‘Teknaf-Shilkhali-Whykheong-Inani-Ukhia-Ghundhum-Myanmar’ and ‘Dhoapalong-Himchari-Panerchara-Rajarkul- Naikhongchari’ [22]. Therefore, thirty-eight elephants have become trapped inside the Cox’s Bazar–Teknaf peninsula [81], which often results in human–elephant conflicts [82]. The human–elephant conflict has elevated to the point where 13 people have been killed so far through multiple incidents after August 2017 [12,81,82,83,84]. The increase in fuel consumption again decreases fodder species for the elephants [81] which is the utmost sign of deterioration of the overall ecosystem health. This study found that areas which represent the degraded forest have been transformed mostly from Mixed Forest (MF) and Shrub-Dominated area. The government of Bangladesh has launched several initiatives, programs and projects to protect, conserve and restore the forest [24] in terms of REDD+, and UN-SDG that require huge investments of finance and labor [25]. The Climate Resilient Participatory Afforestation and Restoration Project (CRPARP) was one such strategy that aimed to restore the forest through planting in degraded forest areas [85,86].
This study systematically assayed the status of the forest ecosystem of the peninsula with the aid of remote sensing and GIS techniques. However, it is also imperative to concede that there are some limitations and uncertainties regarding satellite-derived forest cover data derivation and subsequent modeling, especially due to erroneous visual interpretation [87]. Moreover, the change in the policy of the government (e.g., relocation of Rohingya) and modality of aid (e.g., an alternative fuel supply such as LPG) can significantly affect the modeling result. However, the accuracy of the forest cover classification was given utmost care through expertise visual interpretation, and on average, the accuracy was maintained at around 90%. Therefore, the study envisages vital universal implications which may help concerned authorities to sustainably plan for plantation programs based on a future scenario of forest degradation and deforestation projected in this study through dynamic modeling. Moreover, considering the displacement as a recurrent phenomenon, the methods and findings of the study could have significant implications in other contexts around the world.

5. Conclusions

This study has considered multiple issues and factors that added in-depth characteristics of the impacts. In general, although existing studies have focused on the amount of area deforested, in this study, we also focused on the previous quality of deforested and degraded lands. Other than only focusing on spatio-temporal forest losses due to the Rohingya influx, this study has applied three different techniques (i.e., spatial severity of impact, ecosystem integrity, and ecosystem integrity depletion) to understand the nature of the impact in detail with both qualitative and quantitative results. In addition, the findings of this study could be easily integrated with the spatial wildlife database to understand the magnitude of the impact on wildlife habitats, e.g., the blocking of elephant corridors, reducing elephant habitat area and movement paths. However, these findings can be deemed useful to prepare plantation suitability maps utilizing the spatio-temporal ecosystem integrity and ecosystem integrity depletion data through prioritization. The Rohingya situation is a political problem, and with the recent denial of the Rohingya people to return to their country, the camps and people will remain in the forest areas for long periods. Therefore, an integrated monitoring and management system of the forest would be very useful to conserve and manage the forest ecosystem. In this study, the severity of impact and ecosystem integrity was calculated from a general perspective, but individual researchers can use the technique for the assessment of specific targets (e.g., impact on elephant habitat, routes or corridors) by altering the weighing scales. This study also reveals that, although Teknaf Wildlife Sanctuary and Inani National Park are two protected areas, these forests have also deteriorated at almost the same scale. This situation indicates poor forest protection strategies which should be strengthened for forest conservation. The predicted results of this study have sufficient evidence to prioritize allocation from GoB and the Bangladesh Forest Department for plantation and protection of the forest. Moreover, the study also concentrated not only on the refugees’ problem, but also on the conservation of the ecosystem of the host country. Fuelwood collection is one of the key factors; therefore, development partners could arrange supplies of alternative fuel such as liquefied petroleum gas (LPG) for all refugee households and organize awareness programs. In addition, the regeneration of shrubs could be another important factor to consider while predicting future forest loss; this requires data from the monsoon season. Finally, the integrity of the forest ecosystem is linked with many factors other than the forest vegetation condition. Depending only on the vegetation status, stressors and stimuli was one of the limitations of the study. Therefore, the addition of some meaningful ecosystem integrity factors along with vegetation class would be worthwhile for future investigations.

Author Contributions

Conceptualization, M.E.H.; methodology, M.E.H.; software, M.E.H. and R.M.; validation, M.E.H., G.L. and R.M.; formal analysis, M.E.H.; investigation, M.E.H. and R.M.; resources, L.Z. and H.G.; data curation, M.E.H. and G.L.; writing—original draft preparation, M.E.H.; writing—review and editing, L.Z., M.E.H. and G.L.; visualization, M.E.H. and R.M.; supervision, L.Z. and H.G.; project administration, L.Z. and M.E.H.; funding acquisition, L.Z. All authors have read and agreed to the published version of the manuscript.

Funding

The study was supported by the Strategic Priority Research Program of the Chinese Academy of Sciences (Grant No. XDA19030302) and the National Natural Science Foundation of China (Grant No. 41771392) and the CAS-TWAS President’s Fellowship-2017 (No. 2017CTF099) awarded by the University of the Chinese Academy of Sciences (UCAS) for a Ph.D Program.

Informed Consent Statement

Not applicable.

Acknowledgments

The authors express their gratitude to the European Space Agency (ESA) and USGS for freeware Sentinel 2 satellite imagery and SRTM Digital Elevation Model. The authors are also thankful to IUCN Bangladesh, UNHCR, IOM, and Bangladesh Forest Department for the UAV imagery, forest administrative boundaries, and other spatial and non-spatial data.

Conflicts of Interest

The authors declare no conflict of interest.

Appendix A

Table A1. Accuracy assessment for forest cover classification for the years of 2017, 2018, 2019 and 2019 (modeled).
SLClass NameProducer’s AccuracyUser’s AccuracyOverall AccuracyKhat
2017201820192019 Modeled2017201820192019 Modeled2017: 86.85%
1Agriculture85.4088.8990.9893.8887.9783.5890.9888.46
2Saltpan92.0089.4793.1895.4597.8794.4497.6297.67
3Urban Area90.0096.0891.4391.49100.0094.2396.9793.48
4Homestead Vegetation89.0588.8197.6088.3982.4388.1985.9286.84
5Brick Kiln100.00100.00100.00100.00100.00100.00100.00100.000.86
6Shrub-Dominated Forest82.4087.4088.4676.1577.4482.2283.3379.052018: 89.12%0.88
7Mixed Forest82.1989.5888.4175.2183.3384.8788.4181.482019: 91.45%0.91
8Young Planted Forest88.1689.3386.2179.6384.8190.5493.7587.762019_M: 86.21%0.85
9Canopy Forest86.4490.8383.3376.1991.8996.1293.2290.57
10Casuarina Patches100.00100.00100.00100.00100.00100.00100.00100.00
11Rohingya Camps83.7883.7091.9693.2275.6187.5094.5084.62
12Degraded Forest Land86.9687.3193.8783.3394.3495.9095.6375.47
13Creeks and Streams90.0091.9493.9092.7791.8495.0098.7298.72
14Waterbodies92.8688.2493.9492.5488.1486.5489.8692.54

Appendix B

Figure A1. The complete scenario of the SSI for the whole study area.
Environments 08 00121 g0a1

References

  1. Richards, D.R.; Friess, D.A. Rates and drivers of mangrove deforestation in Southeast Asia. Proc. Natl. Acad. Sci. USA 2016, 113, 334–349. [Google Scholar] [CrossRef] [PubMed] [Green Version]
  2. Friess, D.A.; Rogers, K.; Lovelock, C.E.; Krauss, K.W.; Hamilton, S.E.; Lee, S.Y.; Lucas, R.; Primavera, J.; Rajkaran, A.; Shi, S. The state of the world’s mangrove forests: Past, present, and future. Annu. Rev. Environ. Resour. 2019, 44, 89–115. [Google Scholar] [CrossRef] [Green Version]
  3. Dutta, S.; Sahana, M.; Guchhait, S.K. Assessing anthropogenic disturbance on forest health based on fragment grading in Durgapur Forest Range, West Bengal, India. Spat. Inf. Res. 2017, 25, 501–512. [Google Scholar] [CrossRef]
  4. Foley, J.A.; DeFries, R.; Asner, G.P.; Barford, C.; Bonan, G.; Carpenter, S.R.; Chapin, F.S.; Coe, M.T.; Daily, G.C.; Gibbs, H.K.; et al. Global consequences of land use. Science 2005, 309, 570–574. [Google Scholar] [CrossRef] [Green Version]
  5. Lambin, F.E.; Geist, J.H.; Lepers, E. Dynamics of land-use and land-cover change in tropical regions. Annu. Rev. Environ. Resour. 2003, 28, 205–241. [Google Scholar] [CrossRef] [Green Version]
  6. Ghazoul, J.; Burivalova, Z.; Garcia-Ulloa, J.; King, L.A. Conceptualizing forest degradation. Trends Ecol. Evol. 2015, 30, 622–632. [Google Scholar] [CrossRef]
  7. UNHCR Global Trends 2020; United Nations High Commissioner for Refugees: Geneva, Switzerland, 2021.
  8. Kc, B.; Nagata, S. Refugee impact on collective management of forest resources: A case study of Bhutanese refugees in Nepal’s Eastern Terai region. Int. J. For. Res. 2006, 11, 305–311. [Google Scholar] [CrossRef]
  9. Burmese Refugees in Bangladesh: Still No Durable Solution; Human Rights Watch: New York, NY, USA, 2000; Volume 12, Available online: https://www.hrw.org/reports/2000/burma/index.htm (accessed on 8 January 2018).
  10. UNOCHA. Rohingya Refugee Crisis. Available online: https://www.unocha.org/rohingyarefugee-crisis (accessed on 8 January 2018).
  11. Report on Environmental Impact of Rohingya Influx; UNDP and UN Woman: Dhaka, Bangladesh, 2018.
  12. Hasan, M.E.; Zhang, L.; Dewan, A.; Guo, H.; Mahmood, R. Spatiotemporal pattern of forest degradation and loss of ecosystem function associated with Rohingya influx: A geospatial approach. Land Degrad. Dev. 2021, 32, 3666–3683. [Google Scholar] [CrossRef]
  13. BFD. Management Plans for Teknaf Game Reserve, Nishorgo Supported Project, Bangladesh; Bangladesh Forest Department: Dhaka, Bangladesh, 2006.
  14. Khan, M.M.H. Protected Areas of Bangladesh—A Guide to Wildlife; Bangladesh Forest Department: Dhaka, Bangladesh, 2008.
  15. Moslehuddin, A.Z.M.; Rahman, M.A.; Ullah, S.M.A.; Moriyama, M.; Tani, M. Physiography, forests, and people in Teknaf. In Deforestation in the Teknaf Peninsula of Bangladesh—A Study of Political Ecology; Tani, M., Rahman, M., Eds.; Springer: Singapore, 2018. [Google Scholar]
  16. DoE. Bangladesh Environment and Climate Change Outlook (ECCO) 2012; Department of Environment, Government of Bangladesh: Dhaka, Bangladesh, 2013.
  17. DoE. Community Based Ecosystem Conservation and Adaptation in Ecologically Critical Areas of Bangladesh: Responding to Nature and Changing Climate; Department of Environment, Government of Bangladesh: Dhaka, Bangladesh, 2015.
  18. Islam, K.N.; Rahman, M.M.; Jashimuddin, M.; Islam, K.; Zhang, Y. Impact of co-management on tree diversity and carbon sequestration in protected areas: Experiences from Bangladesh. Trees For. People 2020, 20, 100033. [Google Scholar] [CrossRef]
  19. Nishorgo. 2019. Available online: http://nishorgo.org/project/inani-rf/ (accessed on 7 February 2020).
  20. CEGIS. Geospatial Database; Center for Environment and Geographic Information System: Dhaka, Bangladesh, 2011. [Google Scholar]
  21. Arannayk Foundation. Biodiversity of Protected Areas of Bangladesh, 1st ed.; The Arannayk Foundation: Dhaka, Bangladesh, 2013. [Google Scholar]
  22. Motaleb, M.A.; Ahmed, M.S. Status of Asian Elephants in Bangladesh; International Union for Conservation of Nature: Dhaka, Bangladesh, 2016. [Google Scholar]
  23. Ly, V.; Nanthavong, K.; Pooma, R.; Luu, H.T.; Nguyen, H.N.; Barstow, M.; Vu, V.D.; Hoang, V.S.; Khou, E.; Newman, M.F. Anisoptera scaphula. In The IUCN Red List of Threatened Species; International Union for Conservation of Nature: Dhaka, Bangladesh, 2017. [Google Scholar]
  24. Alam, S.; Misbahuzzaman, K.; Rahman, M.; Kabir, M. Threats to the Teknaf Wildlife Sanctuary of Bangladesh. J. Environ. Sci. Nat. Resour. 2015, 7, 233–239. [Google Scholar] [CrossRef] [Green Version]
  25. Ministry of Environment, Forest and Climate Change (MoEFCC). The Submission of Bangladesh’s Forest Reference Level for REDD+ under the UNFCCC; Government of the People’s Republic of Bangladesh (GoB): Dhaka, Bangladeh, 2018.
  26. Amnesty International. Myanmar: Security Forces Target Rohingya during Vicious Rakhine Scorched-Earth Campaign. 2016. Available online: https://www.amnesty.org/en/latest/news/2016/12/myanmar-security-forces-target-rohingya-viscious-scorched-earth-campaign/ (accessed on 23 September 2019).
  27. UNHCR. Statelessness and the Rohingya Crisis; United Nations High Commissioner for Refugees: Geneva, Switzerland, 2017; Available online: https://www.refworld.org/pdfid/5a05b4664.pdf (accessed on 7 October 2019).
  28. IOM. Rohingya Humanitarian Crisis Response; International Organization for Migration: Dhaka, Bangladesh, 2019; Available online: https://www.iom.int/sites/default/files/situation_reports/file/iom_rohingya_crisis_response-external_sitrep-july2019.pdf (accessed on 10 September 2019).
  29. Kolstad, K. Cox’s Bazar: The World’s Largest Refugee Settlement; Norwegian Refugee Council: Geneva, Switzerland, 2018. [Google Scholar]
  30. IOM. NPM 6 Report. 2017. Available online: https://www.iom.int/sites/default/files/country/docs/bangladesh/NPM-Round6-Report-Oct2017.pdf (accessed on 24 January 2018).
  31. IOM; FAO. Assessment of Fuel Wood Supply and Demand in Displacement Settings and Surrounding Areas in Cox’s Bazaar District; International Organization for Migration (IOM): Belgrade, Serbia; Food and Agriculture Organization (FAO): Dhaka, Bangladesh, 2017. [Google Scholar]
  32. Rahman, M.Z. Livelihoods of Rohingyas and their impacts on deforestation. In Deforestation in the Teknaf Peninsula of Bangladesh—A Study of Political Ecology; Tani, M., Rahman, M., Eds.; Springer: Singapore, 2018; pp. 113–125. [Google Scholar]
  33. Quader, M.A.; Dey, H.; Malak, M.A.; Sajib, A.M. Rohingya refugee flooding and changes of the physical and social landscape in Ukhiya, Bangladesh. Environ. Dev. Sustain. 2020, 23, 1–25. [Google Scholar] [CrossRef]
  34. IUCN. Bio-Ecological Zones of Bangladesh; International Union for Conservation of Nature: Dhaka, Bangladesh, 2002. [Google Scholar]
  35. ReliefWeb. 2018. Available online: https://reliefweb.int/report/bangladesh/impacts-rohingya-refugee-influx-host-communities (accessed on 13 November 2020).
  36. Foley, J.A.; Asner, G.P.; Costa, M.H.; Coe, M.T.; DeFries, R.; Gibbs, H.K.; Howard, E.A.; Olson, S.; Patz, J.; Ramankutty, N.; et al. Amazonia revealed: Forest degradation and loss of ecosystem goods and services in the Amazon Basin. Front. Ecol. Environ. 2007, 5, 25–32. [Google Scholar] [CrossRef]
  37. Wolfslehner, B.; Vacik, H. Evaluating sustainable forest management strategies with the Analytic Network Process in a Pressure-State-Response framework. J. Environ. Manag. 2008, 88, 1–10. [Google Scholar] [CrossRef]
  38. Lang, S.; Tiede, D.; Hölbling, D.; Füreder, P.; Zeil, P. Earth observation (EO)-based ex post assessment of IDP camp evolution and population dynamics in Zam Zam, Darfur. Int. J. Remote Sens. 2010, 31, 5709–5731. [Google Scholar] [CrossRef]
  39. Aschbacher, J. Monitoring environmental treaties using earth observation. VERTIC Verif. Yearb. 2002, 2002, 171–186. [Google Scholar]
  40. Hasan, M.E.; Nath, B.; Sarker, A.H.M.R.; Wang, Z.; Zhang, L.; Yang, X.; Suza, M. Applying Mul-ti-Temporal Landsat Satellite Data and Markov-Cellular Automata to Predict Forest Cover Change and Forest Degradation of Sundarban Reserve Forest, Bangladesh. Forests 2020, 11, 1016. [Google Scholar] [CrossRef]
  41. Zhang, L.; Gu, Y.; Metternicht, G.; Yan, M.; Sen, B.; Hasan, M.E. Spatial Structure and Relationship between Ports and Port Cities along the Maritime Silk Road. In Proceedings of the IGARSS 2019-2019 IEEE International Geoscience and Remote Sensing Symposium 2019, Yokohama, Japan, 28 July–2 August 2019. [Google Scholar] [CrossRef]
  42. Tiede, D.; Lang, S.; Füreder, P.; Hölbling, D.; Hoffmann, C.; Zeil, P. Automated damage indication for rapid geospatial reporting. An operational object-based approach to damage density mapping following the 2010 Haiti earthquake. Photogramm. Eng. Remote Sens. 2011, 77, 933–942. [Google Scholar] [CrossRef]
  43. Joyce, K.E.; Belliss, S.E.; Samsonov, S.V.; McNeill, S.J.; Glassey, P.J. A review of the status of satellite remote sensing and image processing techniques for mapping natural hazards and disasters. Prog. Phys. Geogr. 2009, 33, 183–207. [Google Scholar] [CrossRef] [Green Version]
  44. Voigt, S.; Kemper, T.; Riedlinger, T.; Kiefl, R.; Scholte, K.; Mehl, H. Satellite image analysis for disaster and crisis-management support. IEEE Trans. Geosci. Remote Sens. 2007, 45, 1520–1528. [Google Scholar] [CrossRef]
  45. IDMC. Global Report on Internal Displacement; Internal Displacement Monitoring Centre: Geneva, Switzerland, 2019; Available online: https://www.internaldisplacement.org/sites/default/files/publications/documents/2020-IDMC-GRID.pdf (accessed on 1 January 2021).
  46. Hagenlocher, M.; Lang, S.; Tiede, D. Integrated assessment of the environmental impact of an IDP camp in Sudan based on very high resolution multi-temporal satellite imagery. Remote Sens. Environ. 2012, 126, 27–38. [Google Scholar] [CrossRef]
  47. Hagenlocher, M. Assessing the impact of IDP/refugee camps on the state of the environment—An indicator-based approach utilizing high-resolution satellite image time series of Zam Zam, northern Darfur. In Geospatial Crossroads GI_Forum ’11, Proceedings of the Geoinformatics Forum, Salzburg, Austria, 5–8 July 2011; Car, A., Griesebner, G., Strobl, J., Eds.; VDE–Verlag: Berlin, Germany, 2011. [Google Scholar]
  48. Hassan, M.; Smith, A.; Walker, K.; Rahman, M.; Southworth, J. Rohingya refugee crisis and forest cover change in Teknaf, Bangladesh. Remote Sens. 2018, 10, 689. [Google Scholar] [CrossRef] [Green Version]
  49. Rogan, J.; Chen, D. Remote sensing technology for mapping and monitoring land-cover and land-use change. Prog. Plann. 2004, 61, 301–325. [Google Scholar] [CrossRef]
  50. Wu, Q.; Li, H.; Wang, R.; Paulussen, J.; He, Y.; Wang, M.; Wang, B.; Wang, Z. Monitoring and predicting land use change in Beijing using remote sensing and GIS. Landsc. Urban Plan. 2006, 78, 322–333. [Google Scholar] [CrossRef]
  51. Morales-Hidalgo, D.; Oswalt, S.N.; Somanathan, E. Status and trends in global primary forest, protected areas, and areas designated for conservation of biodiversity from the Global Forest Resources Assessment 2015. For. Ecol. Manag. 2015, 352, 68–77. [Google Scholar] [CrossRef] [Green Version]
  52. Romijn, E.; Lantican, C.B.; Herold, M.; Lindquist, E.; Ochieng, R.; Wijaya, A.; Murdiyarso, D.; Verchot, L. Assessing change in national forest monitoring capacities of 99 tropical countries. For. Ecol. Manag. 2015, 352, 109–123. [Google Scholar] [CrossRef] [Green Version]
  53. Guan, D.; Li, H.; Inohae, T.; Su, W.; Nagaie, T.; Hokao, K. Modeling urban land use change by the integration of cellular automaton and Markov model. Ecol. Modell. 2011, 222, 3761–3772. [Google Scholar] [CrossRef]
  54. UNHCR. Key Principles for Decision-Makin: Refugee Operations and Environmental Management; United Nations High Commissioner for Refugees: Geneva, Switzerland, 2000; Available online: http://www.unhcr.org/3b03b24d4.html (accessed on 12 March 2018).
  55. Government of Bangladesh. Government of Bangladesh Gazette Notification No. 2009. Available online: Pabama/parisha-4/nishorgo/105/sting/2006/398dt.23/11/2009 (accessed on 1 January 2021).
  56. BFD. Wildlife Sanctuary: Protected Areas of Bangladesh; Bangladesh Forest Department: Dhaka, Bangladesh, 2014. Available online: http://www.bforest.gov.bd/index.php/protected-areas (accessed on 1 January 2021).
  57. Alam, M.F.; Uddin, M.Z.; Hasan, M.A. Evaluation of Plant Biodiversity in Teknaf Wildlife Sanctuary, Bangladesh; LAP LAMBERT Academic Publishing: Saarbrücken, Germany, 2012. [Google Scholar]
  58. Ullah, S.M.A.; Asahiro, K.; Moriyama, M.; Tani, M. Socioeconomic Status Changes of the Host Communities after the Rohingya Refugee Influx in the Southern Coastal Area of Bangladesh. Sustainability 2021, 13, 4240. [Google Scholar] [CrossRef]
  59. Belal, M.A.H. Effectiveness of co-management committees in Teknaf Wildlife Sanctuary. In Connecting Communities in Conservation: Co-Management Initiatives Implemented by IPAC in Wetlands and Forests of Bangladesh; Fox, J., Mutafa, M.G., Bushley, B.R., Brennan, S.M., Durand, L., Eds.; USAID: Dhaka, Bangladesh, 2013. [Google Scholar]
  60. Chowdhury, F.I.; Islam, K.; Faroque, M.A.; Islam, K.N.; Rahman, M.F.; Arif, M.T.A.; Nath, T.K.; Jashimuddin, M. Assessing the impacts of co-management on protected area landscape under socio-imagery lens: Evidence from Bangladesh. J. Sustain. For. 2020, 12, 1–20. [Google Scholar] [CrossRef]
  61. Khatun, M.A.; Rashid, M.B.; Hygen, H.O. MET Report: Climate of Bangladesh; Bangladesh Meteorological Department: Dhaka, Bangladesh, 2016.
  62. Butler, R.A. Rainforest Diversity: Role of Climate in Rainforest Biodiversity. 2012. Available online: https://rainforests.mongabay.com/0302.htm (accessed on 8 September 2019).
  63. Khan, A. Elephas maximus. In IUCN Bangladesh. Red List of Bangladesh; International Union for Conservation of Nature: Dhaka, Bangladesh, 2015; Volume 2, p. 65. [Google Scholar]
  64. European Space Agency. Available online: https://sentinels.copernicus.eu/web/sentinel/technical-guides/sentinel-2-msi/level-2a-processing (accessed on 1 January 2021).
  65. Braun, A.; Fakhri, F.; Hochschild, V. Refugee camp monitoring and environmental change assessment of Kutupalong, Bangladesh, based on radar imagery of sentinel-1 and ALOS-2. Remote Sens. 2019, 11, 2047. [Google Scholar] [CrossRef] [Green Version]
  66. Main-Knorn, M.; Pflug, B.; Louis, J.; Debaecker, V.; Müller-Wilm, U.; Gascon, F. Sen2Cor for Sentinel-2. SPIE. Proc. Image Signal Process. Remote Sens. XXIII 2017, 10427. [Google Scholar] [CrossRef] [Green Version]
  67. Quintano, C.; Fernández-Manso, A.; Fernández-Manso, O. Combination of Landsat and Sentinel-2 MSI data for initial assessing of burn severity. Int. J. Appl. Earth Obs. Geoinf. 2018, 64, 221–225. [Google Scholar] [CrossRef]
  68. Chavez, P.S., Jr. An improved dark-object subtraction technique for atmospheric scattering correction for multispectral data. Remote Sens. Environ. 1988, 24, 459–479. [Google Scholar] [CrossRef]
  69. Song, C.; Woodcock, C.E.; Seto, K.C.; Lenney, M.P.; Macomber, S.A. Classification and change detection using Landsat TM data: When and how to correct atmospheric effects. Remote Sens. Environ. 2001, 75, 230–244. [Google Scholar] [CrossRef]
  70. Yuan, F.; Bauer, M.E.; Heinert, N.J.; Holden, G. Multi-level land cover mapping of the Twin Cities (Minnesota) metropolitan area with multi-seasonal Landsat TM/ETM+data. Geocarto. Int. 2005, 20, 5–14. [Google Scholar] [CrossRef]
  71. Anderson, R.; Hardy, E.E.; Roach, J.T.; Witmer, R.E. A Land Use and Land Cover Classification System for Use with Remote Sensor Data; USGS Professional Paper 964; United States Government Printing Office: Washington, DC, USA, 1976.
  72. Dewan, A.M.; Yamaguchi, Y. Land use and land cover change in Greater Dhaka, Bangladesh: Using remote sensing to promote sustainable urbanization. Appl. Geogr. 2009, 29, 390–401. [Google Scholar] [CrossRef]
  73. Omo-Irabor, O.; Oduyemi, K.O.K. A hybrid image classification approach for the systematic analysis of land cover (LC) changes in the Niger Delta Region. In Proceedings of the 5th International Symposium on Spatial Data Quality (ISSDQ), Enschede, The Netherlands, 13–15 June 2007. [Google Scholar]
  74. Chowdhury, M.; Hasan, M.E.; Abdullah-Al-Mamun, M.M. Land use/land cover change assessment of Halda watershed using remote sensing and GIS. Egypt. J. Remote Sens. 2020, 23, 63–75. [Google Scholar] [CrossRef]
  75. Roy, S.; Mahmood, R. Monitoring shoreline dynamics using Landsat and hydrological data: A case study of Sandwip island of Bangladesh. Pa. Geogr. 2016, 54, 20–41. [Google Scholar]
  76. Mahmood, R.; Ahmed, N.; Zhang, L.; Li, G. Coastal vulnerability assessment of Meghna estuary of Bangladesh using integrated geospatial techniques. Int. J. Disaster Risk Reduct. 2020, 42, 101374. [Google Scholar] [CrossRef]
  77. Siry, J.P.; Cubbage, F.W.; Ahmed, M.R. Sustainable forest management: Global trends and opportunities. In Proceedings of the XII World Forestry Congress, Québec City, QC, Canada, 21–28 September 2003. [Google Scholar]
  78. Tani, M. Forest Dwellers and Encroachers in Teknaf. In Deforestation in the Teknaf Peninsula of Bangladesh—A Study of Political Ecology; Tani, M., Rahman, M.A., Eds.; Springer International Publishing AG: Singapore, 2018. [Google Scholar]
  79. Mahmood, R.; Mahbub, A.Q.M. Building vulnerable islander resilience to natural hazard: A participatory approach. In Handbook of Climate Change Resilience; Leal Filho, W., Ed.; Springer: Cham, Switzerland, 2018. [Google Scholar] [CrossRef]
  80. Chen, X.; Li, B.L. Change in soil carbon and nutrient storage after human disturbance of a primary Korean pine forest in Northeast China. For. Ecol. Manag. 2003, 186, 197–206. [Google Scholar] [CrossRef]
  81. National Geographic. 2018. Available online: https://www.nationalgeographic.com/animals/2018/11/rohingya-refugee-crisis-elephants-bangladesh/ (accessed on 25 September 2019).
  82. UNHCR; IUCN. Elephant Movement and Possible Intervention Sites in and around Nayapara, Leda, Chakmarkul, Shamlapur, Unchiprang, Jadimura and Eastern Side of Kutupalong Camps, Cox’s Bazar (Draft); United Nations High Commissioner for Refugees and International Union for Conservation of Nature: Dhaka, Bangladesh, 2018. [Google Scholar]
  83. McVeigh, K.; Peri, D. Fatal Elephant Attacks on Rohingya Refugees Push Bangladesh to Act. The Guardian. 28 May 2009. Available online: www.theguardian.com/global-development/2018/may/09/fatal-elephant-attackes-on-rohingya-refugees-push-Bangladesh-to-act (accessed on 9 May 2018).
  84. REUTERS. Bangladesh Carving Out Forest Land to Shelter Desperate Rohingya. Available online: https://www.reuters.com/article/us-myanmar-rohingya/bangladesh-carving-out-forest-land-toshelter-desperate-rohingya-idUSKBN1CA0ZN (accessed on 4 February 2018).
  85. The World Bank. 2017. Available online: http://documents.worldbank.org/curated/en/223981499717230448/pdf/ICR00004026-06302017.pdf (accessed on 10 May 2019).
  86. GoB. Final Report on Technical Study for Land Use Mapping, Assessment and Monitoring of Proposed Afforestation and Reforestation Sites; Government of the People Republic of Bangladesh: Dhaka, Bangladesh, 2016.
  87. Brus, J.; Pechanec, V.; Machar, I. Depiction of uncertainty in the visually interpreted land cover data. Ecol. Inform. 2018, 47, 10–13. [Google Scholar] [CrossRef]
Figure 1. The study area (Cox’s Bazar–Teknaf peninsula) is situated in the southeast corner of Bangladesh. The study area consists of Teknaf Wildlife Sanctuary (TWS, shown as a simple hatch line on the map) and Inani National Park (INP, shown as a crosshatch line on the map).
Environments 08 00121 g001
Figure 2. Time series (2017–2019) land use and forest cover map of the study area. (a) presents the scenario of the study area before the latest Rohingya influx (August 2017), where very few areas are observed as makeshift camps. (b) shows the scenario of the study area six months after the Rohingya influx (February 2018), where huge areas are observed as makeshift camps. Finally, (c) presents the scenario of the study area after one and half years of the influx (February 2019), where the growing trend in makeshift camps is observed.
Environments 08 00121 g002
Figure 3. Predicted land use and forest cover of the study area. (a) is the experimentally modeled map derived from the land use and forest cover data of 2017 and 2018. (b) and (c) are the predicted land use and forest cover maps for 2023 and 2027, respectively, derived from land use and forest cover maps of 2017 and 2019.
Environments 08 00121 g003
Figure 4. Spatiotemporal forest cover status in Cox’s Bazar–Teknaf peninsula before and after severe anthropogenic stresses caused by the Rohingya influx.
Environments 08 00121 g004
Figure 5. Methodological flowchart for the derivation of land use and forest cover, modeling of the forest ecosystem, and assessment of the forest ecosystem degradation and depletion based on the anthropogenic stress.
Environments 08 00121 g005
Figure 6. Spatial severity of impact of anthropogenic stresses (Rohingya influx) on the forest ecosystem. The figure is a close-up demonstration of the process of SSI to assess the severity of the impact on the study area after the Rohingya influx.
Environments 08 00121 g006
Figure 7. Spatio-temporal changes in ecosystem integrity for three temporal windows (present, past, and future).
Environments 08 00121 g007
Figure 8. Ecosystem integrity based on the time series and predicted ecosystem functions (e.g., vegetation condition).
Environments 08 00121 g008
Figure 9. Ecosystem integrity depletion status of the Cox’s Bazar–Teknaf Peninsula for three different temporal intervals.
Environments 08 00121 g009
Figure 10. Areas depleted from different ecosystem integrity levels.
Environments 08 00121 g010
Table 1. Types of data used in this study.
Data TypeYearSpatial ResolutionSource
Satellite data (represent the winter season and pre- and post-influx of Rohingya)Sentinel 2A201910 mhttps://scihub.copernicus.eu/dhus/#/home (accessed on 7 October 2021)
2018
2017
RapidEye2015–20165 mBangladesh Forest Department (BFD)
World View-22011–20132 mUSAID
Google Earth images 2017–2019<2 mGoogle Earth Pro
Unmanned Aerial Vehicle (UAV) images 2017–201910 cmUnited Nations High Commissioner for Refugees (UNHCR)
Shuttle Radar Topography Mission (SRTM) 200030 mUnited States of Geological Survey (USGS)
Vector dataNational administration boundaryN/ANASurvey of Bangladesh (SOB)
Forest administration boundary2015NABangladesh Forest Department (BFD)
Refugee camps 2019NAUnited Nations High Commissioner for Refugees (UNHCR)
Human trails2017–2019<30 cm, <2 mUnmanned Aerial Vehicle (UAV) image, Google Earth
Population dataPopulation data of each camp2019NAFamily Counting Number (FCN)–United Nations High Commissioner for Refugees (UNHCR) and Needs and Population Monitoring (NPM)–International Organization for Migration (IOM).
Field dataState of the environmental condition2018NAField survey using observational technique along with the photographic method
Table 2. Index of positive and negative factors of influence on forest ecosystem. Here, the color gradient from gold accent towards red depicts negative weingting score, whereas from green accent towards green represent positive weigting score.
Negative FactorsPositive Factors
LULC CLASSCABKUBHSDDSPACWBCKSHPTMFCRCF
WEIGHT−5−4−3−1123345
Publisher’s Note: MDPI stays neutral with regard to jurisdictional claims in published maps and institutional affiliations.

