
Visual Behaviour and Cognitive Preferences of Users for Constituent Elements in Forest Landscape Spaces

Landscape Planning Laboratory, Forestry College, Shenyang Agricultural University, No. 120 Dongling Road, Shenyang 110161, China
*
Author to whom correspondence should be addressed.
Forests 2022, 13(1), 47; https://0-doi-org.brum.beds.ac.uk/10.3390/f13010047
Submission received: 7 December 2021
/
Revised: 21 December 2021
/
Accepted: 23 December 2021
/
Published: 2 January 2022
(This article belongs to the Special Issue Landscape and Urban Planning-Sustainable Forest Development)
Abstract
:Background: Elements of forest landscape spaces are important media through which landscape information is conveyed. Therefore, it is very important for designers and managers of forests to explore the relationship among visual behaviour, landscape preferences, and element characteristics. Purpose: This study took forest landscape spaces as the subject, discussed the characteristics of visual behaviour and cognitive preferences for landscape elements, and analysed the relationship among element characteristics, visual behaviour, and cognitive preferences in forest landscape spaces. The findings will help designers better plan the spatial composition of forest landscapes. Methods: We collected data from 53 graduate and undergraduate students and then used Spearman’s rho correlation analysis and multiple linear regressions to analyse the experimental data. Main results: 1. As the composition of forest landscape spaces varies and landscape elements are combined in different ways, visual behaviour towards landscape elements also differs. 2. People are easily attracted by highly fascinating landscape elements, but they will spend more time on low fascinating landscape elements. 3. Element characteristics significantly affect visual behaviour and cognitive preferences. Elements with high complexity or a large proportion of elements take more time for the participants to recognize, which reduces the evaluation of satisfaction.
1. Introduction
1.1. Aesthetic Evaluation of Forest Landscape
With the increasing demand for forest landscapes, providing high-quality forest landscape spaces for tourists is a very important research topic for landscape designers and forest park managers [1]. In China, in 2019, the number of forest tourists reached 1.8 billion, creating a comprehensive social output value of 1.75 trillion RMB [2]. In the second half of 2020, despite the influence of COVID-19, forest tourism recovered strongly, with the total number of tourists reaching 84.2% of that in 2019. It has effectively promoted the development of forest tourism destinations and correspondingly triggered the pursuit of high-quality forest landscape [3].
Therefore, to understand the present situation of forest landscape quality and put forward corresponding landscape optimization measures, it is essential to evaluate forest landscapes. There have been many surveys and analyses on the cognitive evaluation of forest landscapes that have been based mainly on psychophysical methods. The evaluation of forest landscapes has been analysed through on-site experience or photograph observation combined with questionnaires [4,5,6,7,8,9,10,11,12,13]. The results indicate that the types and structures of forest landscape spaces and demographic characteristics can affect the evaluation of forest landscape spaces to varying degrees [14,15,16,17,18].
However, there are two main problems with psychophysical methods. First, they are highly subjective, as they are based on people’s subjective feelings and therefore lack objective measurement standards. Second, they can be used only to compare the evaluation of the space as a whole or some landscape elements and do not further our understanding of features of landscape elements affecting people’s aesthetic preferences [16].
Therefore, previous studies indicate that in order to reduce the subjectivity of personal evaluation, we need to introduce a more objective evaluation method for evaluating forest landscapes. Eye-tracking technology can not only analyse eye movement when observing forest landscapes to reflect their psychological activity but also determine which local forest landscape elements they are paying more attention to [19,20,21]. Analysing the influence of basic landscape components on visual perception can help us better understand the interactive mechanism between landscape and cognitive decision-making and help designers better plan and design such spaces.
1.2. Application of Eye-Tracking Technology in Landscape Assessment
At present, research on eye-tracking technology has focused mainly on the evaluation of urban public green spaces. Researchers have also proven that it is feasible to use eye-movement analysis methods to evaluate landscape visual quality [22,23,24,25,26,27,28,29]. For example, Franěk analysed the differences in visual behaviour when viewing photographs of natural scenes and urban scenes and analysed the differences in cognitive efforts in different scenes [30]. Zhang evaluated landscape quality by using the scenic beauty method and eye-tracking technology for landscape structural characteristics and seasonal features and analysed the influence of landscape features on landscape quality [18].
These studies reveal that eye-tracking technology, as a mature technology, has been recognized by experts and used in landscape research. However, in the field of forest landscape evaluation, eye-tracking technology is still a new research method. As Barnes pointed out, there has always been a lack of scientific quantitative methods to address the basic question of “what people look at and how to look at” forest landscapes [16]. From the perspective of forest resource management and evaluation, only by understanding people’s perceptions and observations of the landscape can designers obtain public feedback to better plan and manage such landscapes. Eye-tracking technology is a useful tool for detecting people’s observations of landscapes [31]. Therefore, introducing eye-tracking technology into the field of forest landscape evaluation from the perspective of user feedback is an important research approach that is worthy of discussion.
Although we can understand visual behaviour in a landscape through eye-tracking technology, the reasons for specific visual behaviours need to be further studied. To clarify the interaction mechanism between human visual behaviour and cognitive processes, experts have further analysed visual behaviour in combination with a psychological perception evaluation questionnaire.
For example, from the perspective of visual behaviour and spatial preference, Sun analysed the relationship between visual behaviour and preference evaluation in relation to urban water space [32]. Gao used eye-tracking technology and cognitive questionnaires to analyse the characteristics and differences in vision and cognition when participants viewed various forest spaces [1]. The results showed that the eye-movement indicators of the average lateral visual span, average portrait visual span, and average pupil diameter were significantly correlated with the participants’ psychological cognitive evaluations. When the landscape photographs contained much information, users tended to view the whole from the perspective of the local space and paid more attention to interesting objects; the overall preference evaluation of the space was also high. Huang analysed the influence of landscape preference on observation behaviour based on the diversity of landscape colours [33]. The results showed that photographs with complex colour changes received more attention, and a magenta mountain landscape (the landscape in the photograph appeared in magenta) was the most noticed. Moreover, cognitive preferences for landscape affected visual behaviour, which showed that there was a certain relationship between cognitive preferences and visual behaviour.
Hands found that the level of visual preference was positively correlated with the variety of colours and the number of artificial elements that elicit positive emotions [34]. However, landscapes with less ground cover led to lower visual preference. In addition, Glaholt, Cottet, and others found that eye-movement indicators (fixation duration, fixation counts, etc.) were positively correlated with a preference for landscapes and had strong consistency [25,35,36,37].
In addition to a preference evaluation, Berto found that visual preference was related to the restoration rating [38]. When people viewed a natural landscape with a high restoration rating, their visual behaviour was significantly different than when they viewed an urban scene with a low restoration rating. When they viewed a natural scene, their fixation number was lower, and they expended less effort. This finding supported Kaplan’s hypothesis that when people view natural scenes, their visual behaviour is based on interest rather than forced attention. This visual behaviour pattern is less likely to cause mental fatigue; thus, natural scenes are highly restorative.
1.3. Visual Behaviour Characteristics and Evaluation of Landscape Elements
At present, most studies on forest landscape evaluation start from the whole space [1]. However, according to picture-bottom relationship theory [39], people have different priorities for the cognition of landscape elements in different compositions [40]. Some elements are identified first, while others become the background. The visual characteristics of landscape elements influence cognition and then affect cognitive preference.
For example, Rahnema analysed residents’ perceptions of and preferences for various landscape elements in park green spaces in two Iranian cities and found that the subjects preferred streams and fountains, followed by plants, animals, and gardens [41]. Taking walking spaces in urban parks as an example, Amati used videos to analyse the relationship between attention to different landscape elements and landscape evaluation [22]. The results showed that there were significant differences in the fixation time on various landscape elements. The participants spent the longest time viewing vegetation areas of interest (AOIs) in the form of bushes or trees and less time viewing artificial structures and the sky. Although the proportion of artificial structures was small, the relative fixation duration on these was the longest. At the same time, the evaluation of parks was related to the fixation duration on certain landscape elements.
Li found that the proportion of various landscape elements affected the evaluation of landscape spaces [23]. The higher the proportion of a certain landscape element, the faster and longer people focused on it. Among all landscape elements, trees had the greatest positive impact on evaluation scores, followed by shrubs and aquatic plants, while herbaceous plants had less impact. In addition, water had a positive impact on the evaluation scores. Khachatryan found that the proportion of landscape elements can also affect visual behaviour [42]. Their study pointed out that the ratio of lawn and ornamental plants is very important in courtyard design. People preferred landscape spaces with even proportions of ornamental plants and lawns, and there were more attention points in these landscapes.
Through the review of the above research, we found that many researchers have discussed and analysed the influence of landscape space on visual behaviour and cognitive preferences. However, landscape elements are important media through which people recognize landscapes and act as carriers for designers to express ideas. Especially in forest landscape spaces, landscape elements are not only a simple means of information transmission but also an important factor determining spatial characteristics. Why do people focus on certain landscape elements during landscape perception? What are the characteristics of the landscape elements that affect cognition? These questions are very important in forest landscape cognition research but have not been definitively answered.
Forest recreation accounts for an increasing proportion of leisure time. Therefore, understanding visual and psychological evaluation feedback after viewing forest landscapes can help forest planners better manage resources and adjust plans. However, at present, feedback on cognitive preferences for forest landscapes is based mainly on the overall landscape space, while the relationship between element composition characteristics, visual behaviour, and cognitive preferences need to be further analysed and discussed.
Our research took forest landscape spaces as the object, analysed the characteristics of visual behaviour, and cognitive preferences for elements in various forest landscape spaces, and considered the interactions among element characteristics, visual behaviour and cognitive preferences. The findings will help designers better plan the spatial composition of forest landscapes and the layout of various landscape elements.
The main research contents are as follows:
- (1)
- Characteristics of and differences in visual behaviour for various elements in forest landscape spaces;
- (2)
- Characteristics of cognitive preferences for various elements in forest landscape spaces;
- (3)
- Relationship among element characteristics, cognitive preferences and visual behaviour.
2. Methods
2.1. Study Area
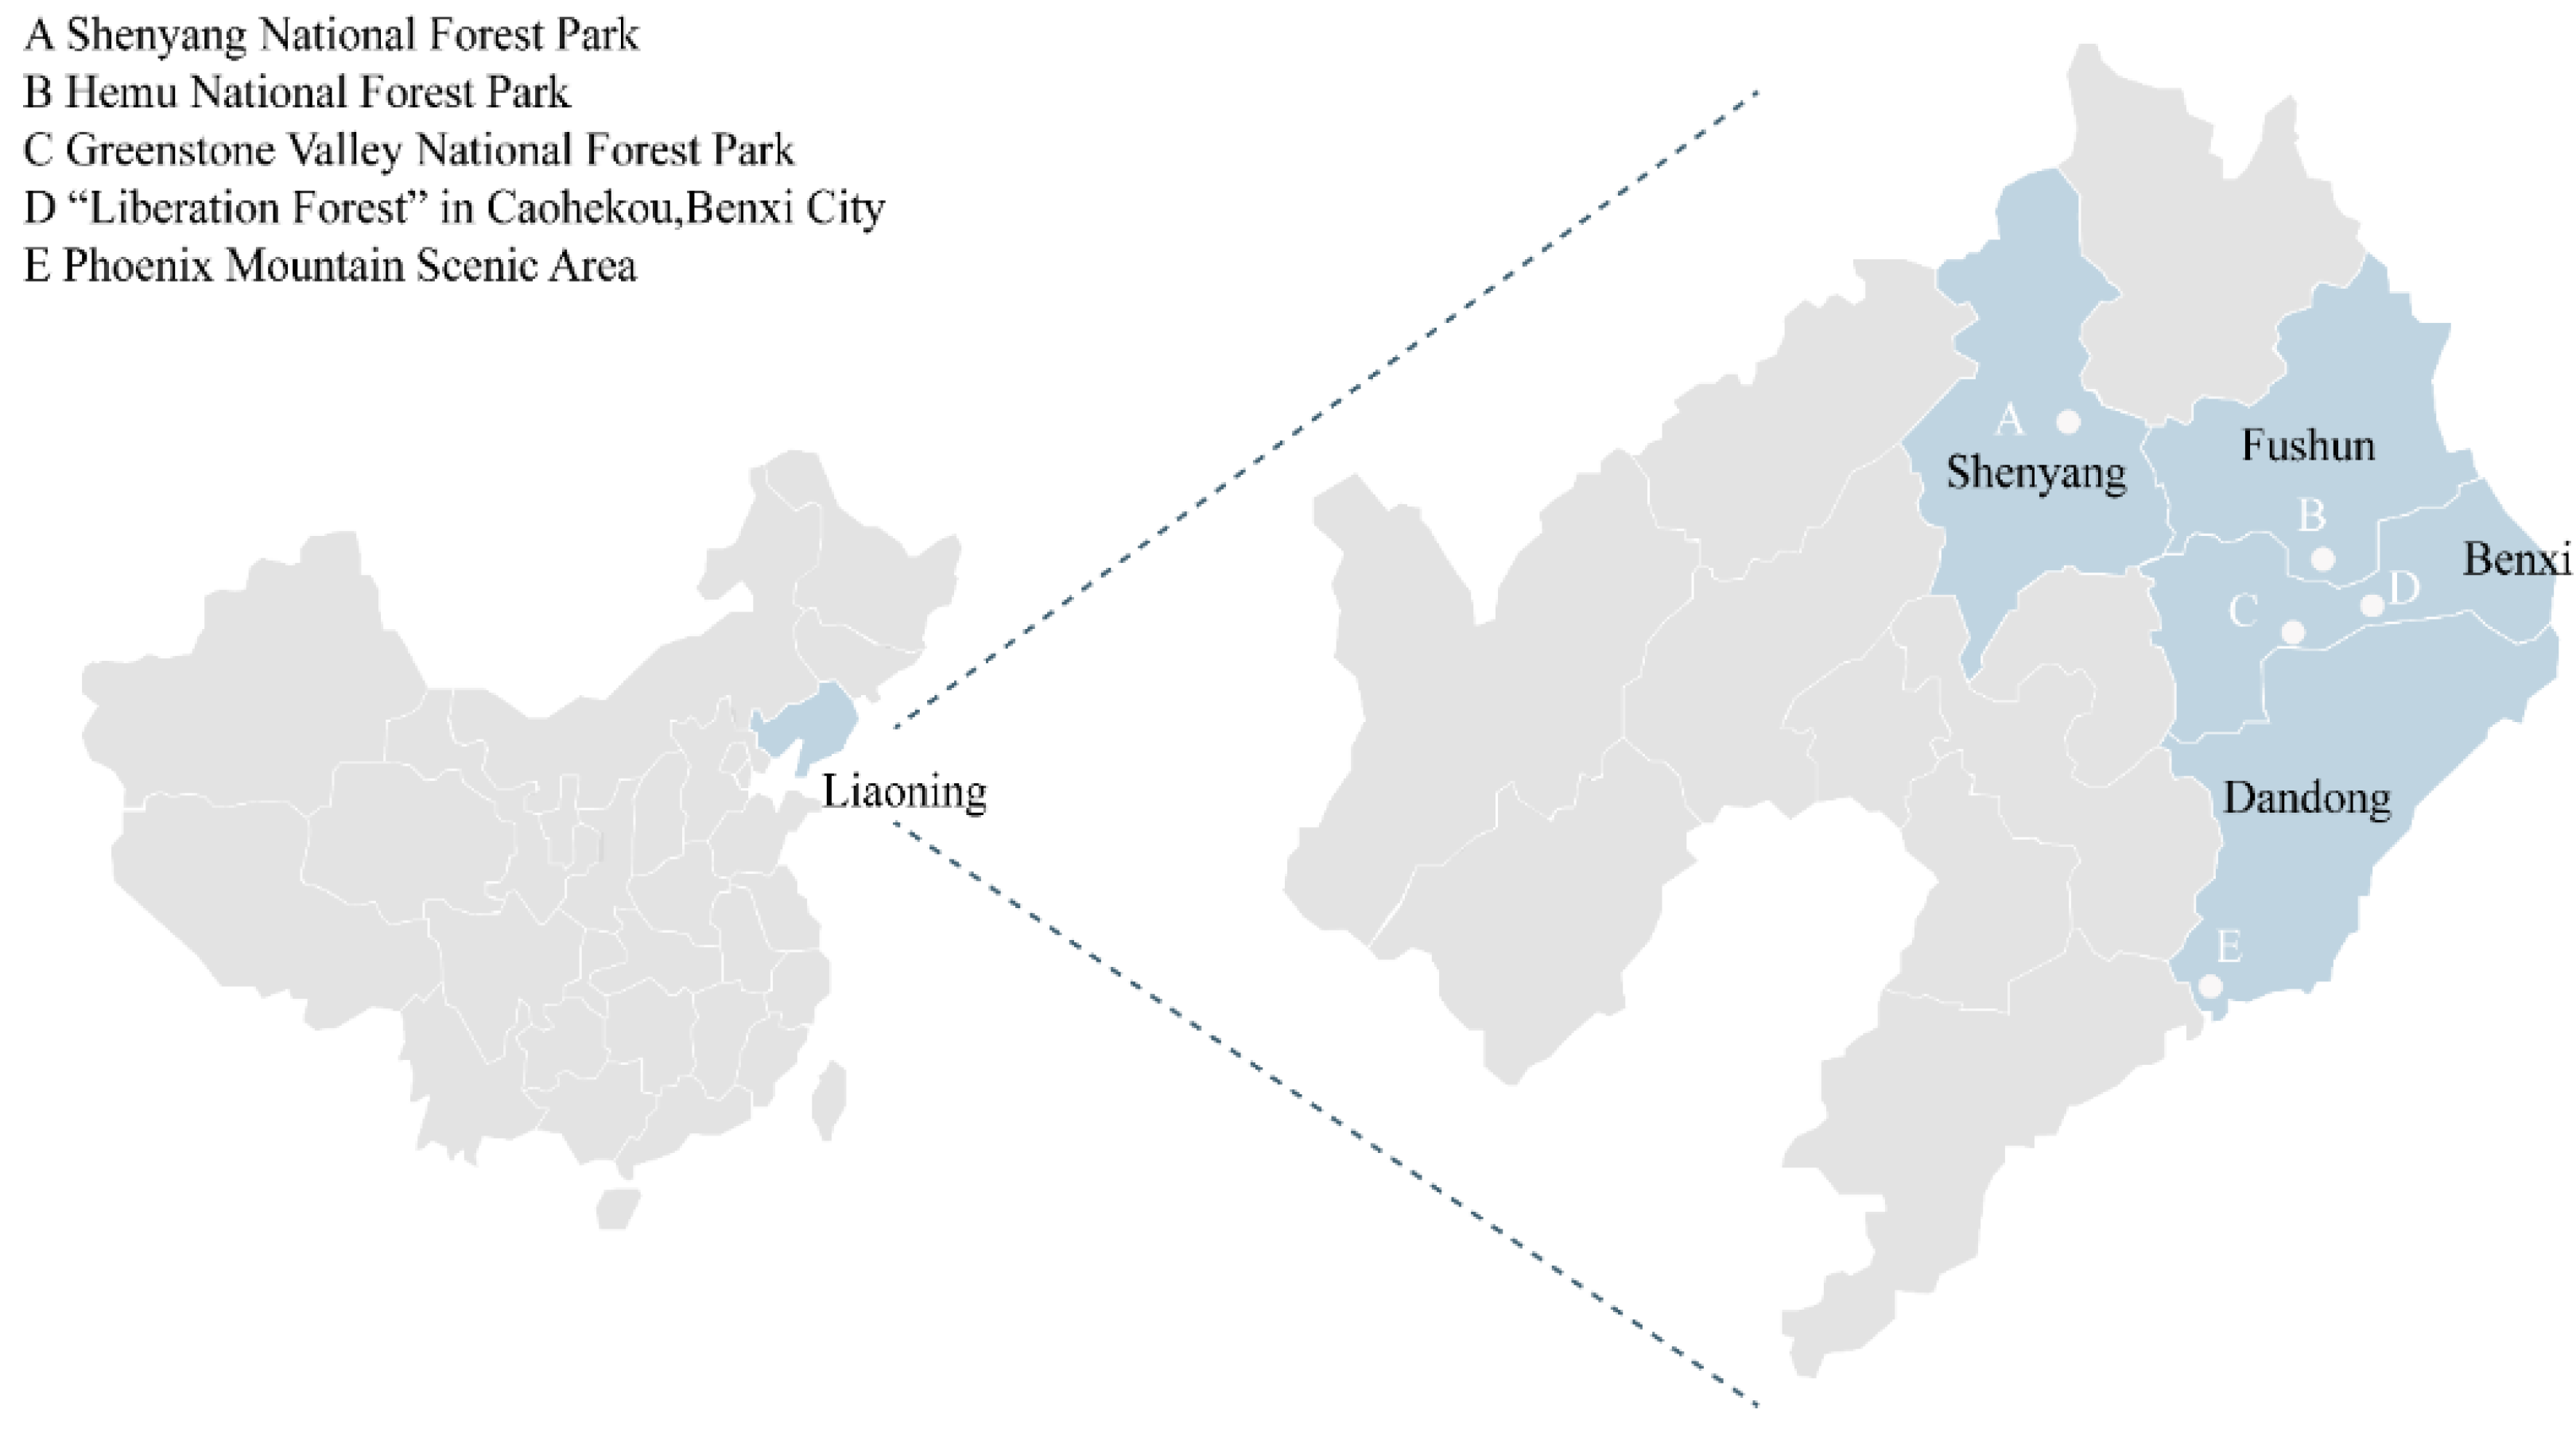
Three kinds of forest landscapes were selected as sample plots: water landscapes, lookout landscape (scenic viewpoint), and in-forest landscapes. The water landscapes were divided into dynamic water landscapes and static water landscapes. The in-forest spaces were divided into broadleaved forest landscapes, coniferous forest landscapes, and mixed forest landscapes. After on-site investigation and exploration, five forest parks of Liaoning Province in northeastern China were selected as research sample plots (Figure 1).
In the early stage, we selected 24 sample plots in five forest parks. After screening by 10 experts and 20 nonexperts, we ultimately selected 6 sample plots that best represent the forest landscape of northern China. Among them, a dynamic water landscape and lookout landscape are located in Phoenix Mountain Scenic Area, a static water landscape is located in Greenstone Valley National Forest Park, a broadleaved forest landscape is located in Hemu National Forest Park, a coniferous forest landscape is located in Liberation Forest, and a mixed forest landscape is located in Shenyang National Forest Park.
2.2. Collection of Experimental Materials
2.2.1. Photograph Acquisition
Previous studies have shown that landscape spatial photographs can effectively replace on-site investigation of the environment [20,43]. In addition, previous studies have pointed out that using photographs as experimental samples for eye-movement cognition surveys is a credible approach [44,45]. Field experiments, especially controlled experiments, have some shortcomings because certain objective factors, such as weather conditions, temperature, and sound, can affect the research results [25,46]. Therefore, in this study, landscape photographs were used as experimental materials for the eye-movement experiment.
Second, we wanted to capture the view of the landscape in real life to the greatest extent possible. Edited images or simulated landscape images may result in different eye movements. Therefore, we used original images rather than edited images.
Autumn is the peak time for people to visit forest parks [47]. Because of temperature differences and other factors, people tend to favour the typical colour changes in autumn forest landscapes [16]. All landscape photographs were taken with an Olympus EM5 SLR camera at a distance of 10 metres and a height of 170 cm from the edge of the object space [32]. The photographs were taken from 1 to 3 October 2017, from 10:00 a.m. to 11:00 a.m. in sunny conditions.
A total of 50 pictures were taken in this field survey, and 10 experts and 20 nonexperts selected 6 photographs that were ornamental and could represent one type of landscape as the final experimental materials. Each picture corresponded to a specific kind of forest landscape.
2.2.2. Eye-Movement Data Acquisition
We used a German head-mounted SMI Glass2 eye tracker to record the participants’ eye movements when viewing the landscape pictures (Figure 2).
2.2.3. Questionnaire Data Collection
After the eye-tracking experiment, the experimental materials were displayed again, and the participants were asked to complete the questionnaire on cognitive perception (including satisfaction) for each landscape photograph. To avoid confusion, we numbered the photographs and questionnaires so that they corresponded one to one. All questions were scored using a seven-point answer scale, where 1 indicated the worst and 7 the best. The participants also reported the landscape elements they liked in the landscape space.
2.3. Participants
Our aim is to improve the visual quality of forest landscapes and optimize existing forest landscapes based on visual and cognitive feedback. The participants needed to be able to judge the visual quality of forest landscape spaces accurately. Therefore, we chose undergraduates and postgraduates in various majors at Shenyang Agricultural University as the research participants.
As experimental subjects, the participants were representative [24,32]. They had basic abilities of aesthetic appreciation and judgement and could accurately express their cognitive preferences when observing the forest landscape pictures. Moreover, the fact that the students were in different majors could help us understand the cognition of subjects with different professional backgrounds.
All participants volunteered for the study. Our procedures and requirements for recruiting these volunteers fully comply with the ethical standards of the College of Forestry, Shenyang Agricultural University, China (CF-EC-021-002). We only used the eye-movement data and preference assessment books of the subjects for academic research, not for any commercial activities. Their vision was normal or corrected to normal, and they had no eye problems such as colour blindness, strabismus, or astigmatism.
For our survey, we recruited 60 undergraduates and postgraduates aged between 18 and 24, including students in landscape architecture, forestry, economic management, and horticulture. Final valid data were acquired for 53 participants (28 men and 25 women). The ratio of landscape professionals to non-landscape professionals was 1:0.83.
2.4. Experimental Design
The experiment was divided into two parts: an eye-tracking experiment and a cognitive evaluation experiment. The experiment was conducted in the Ecological Landscape and Environment Laboratory of the College of Forestry, Shenyang Agricultural University, from December 2018 to September 2019.
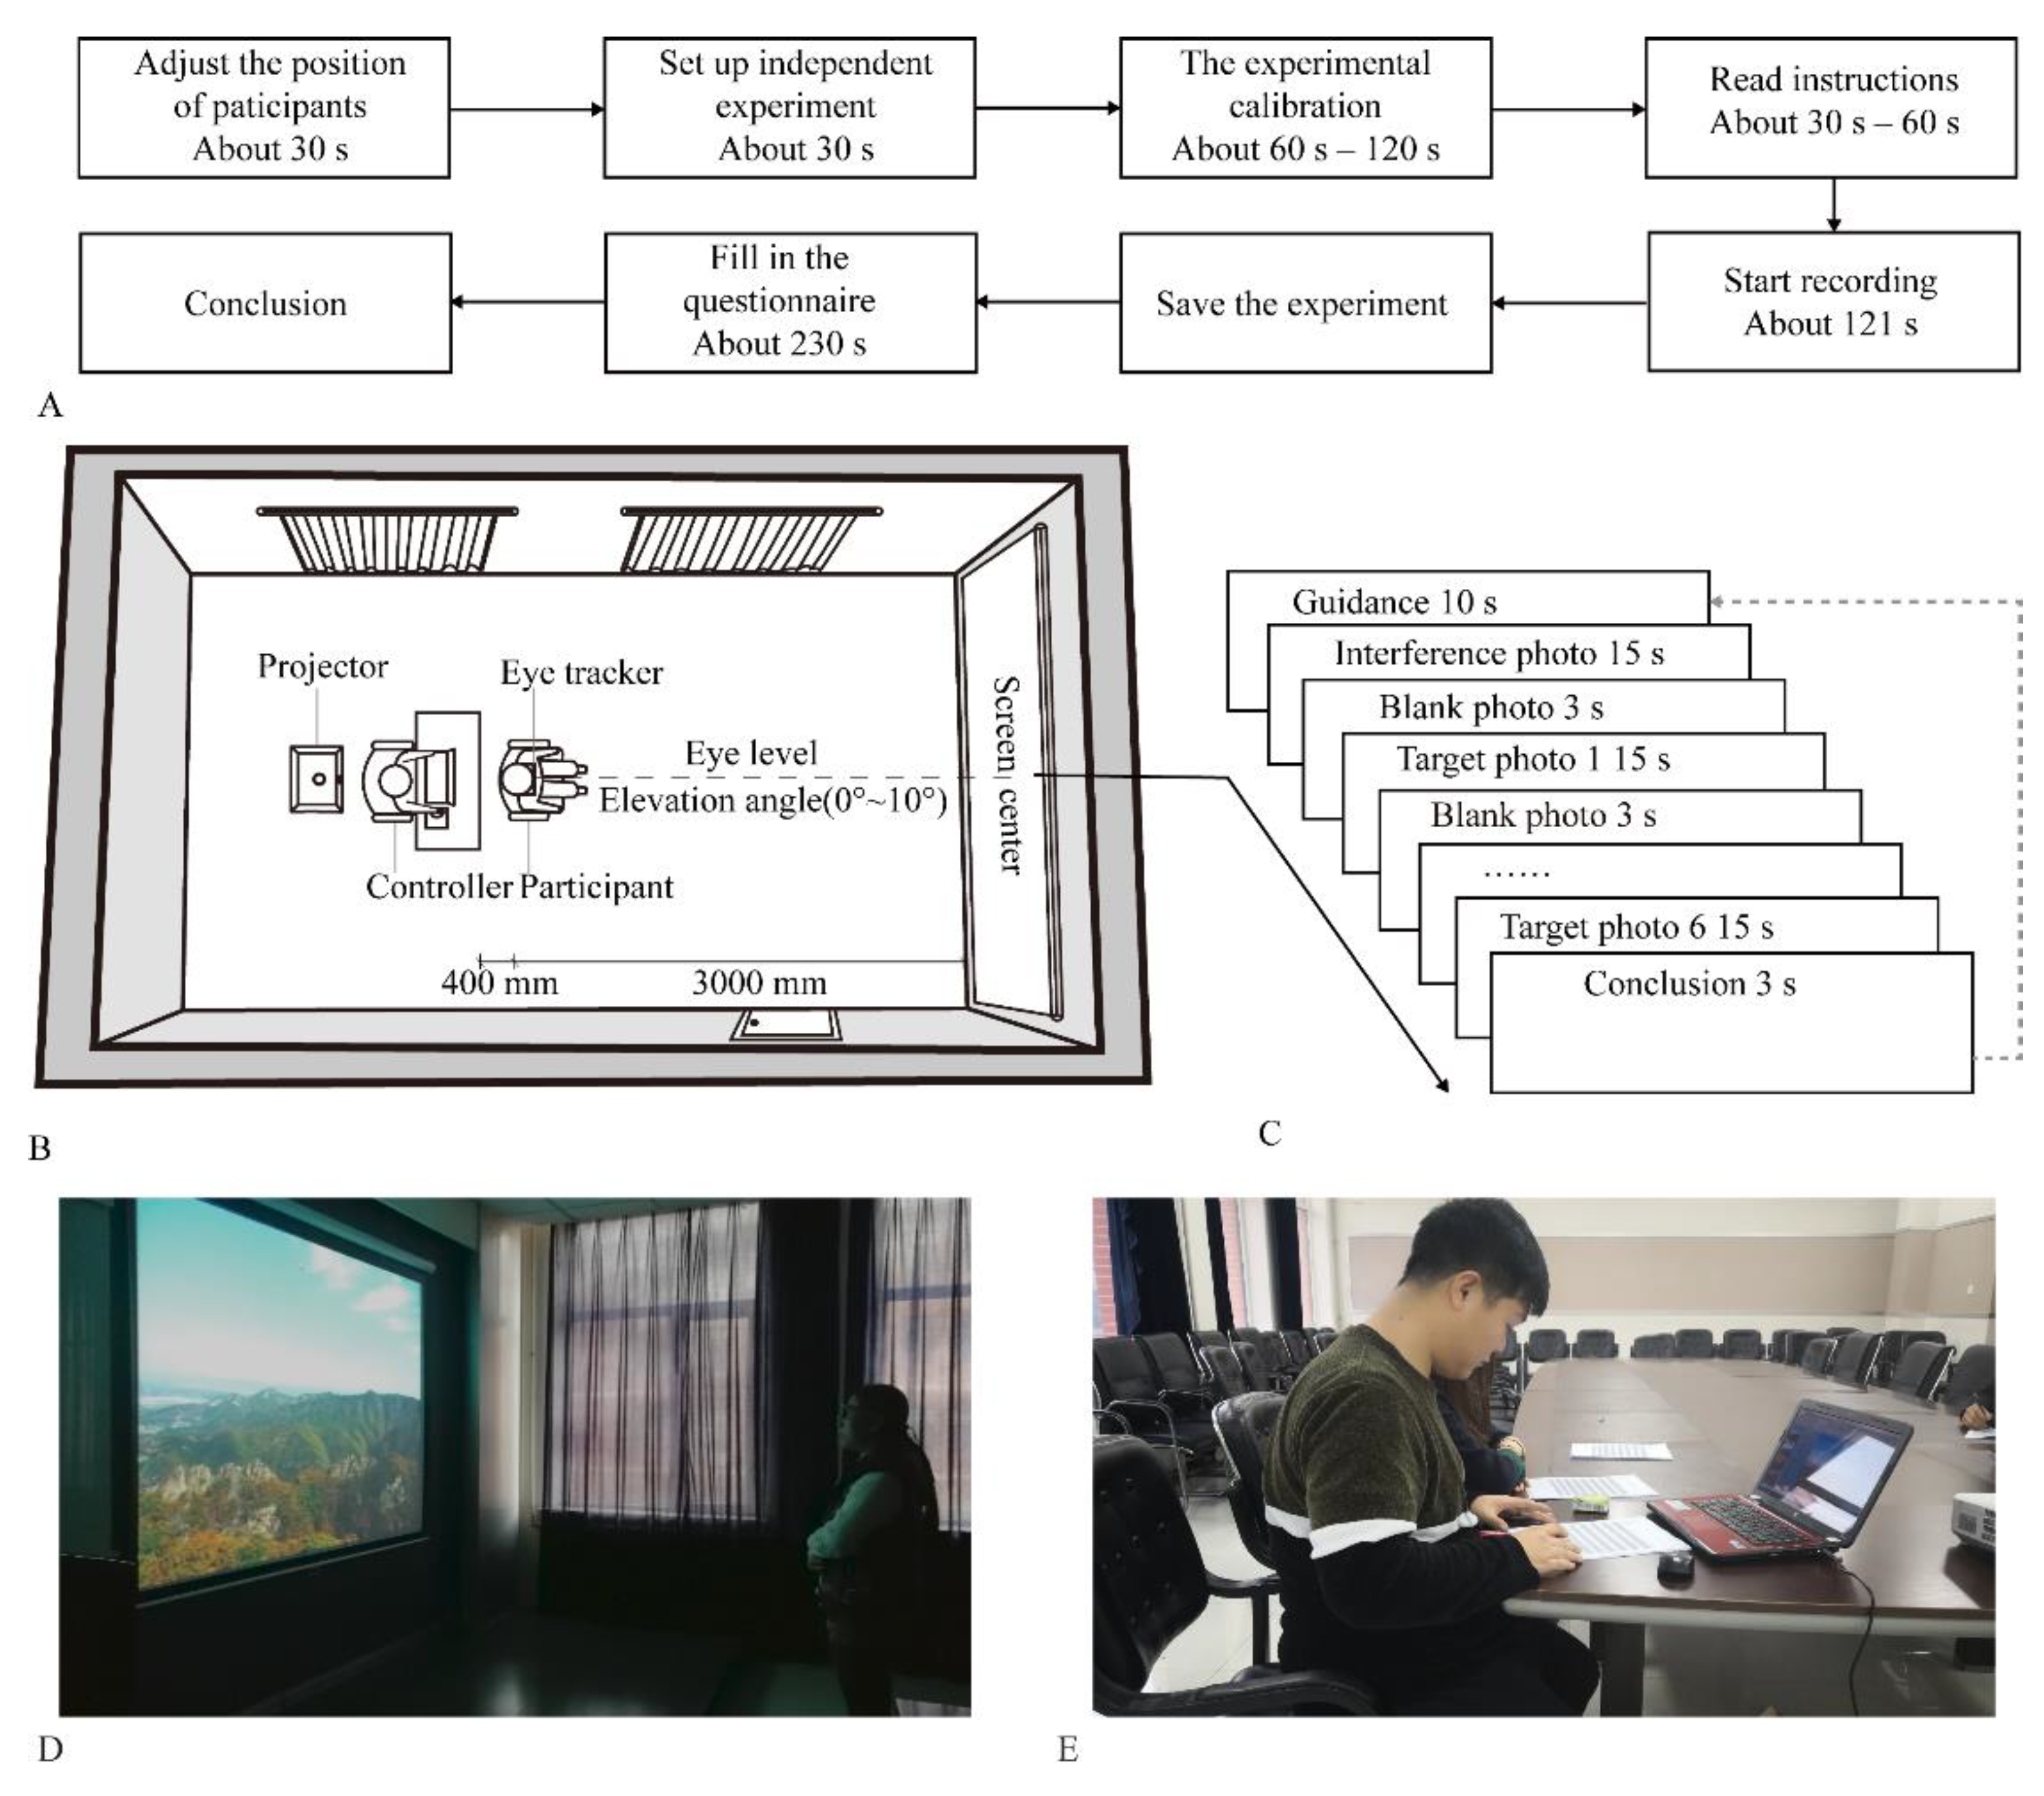
First, we conducted the eye-tracking experiments in batches in laboratory A, which was soundproof and had weak light, and collected relevant experimental data. In laboratory A, we used an EPSONXGA2800 projector with a resolution of 1024 × 768 to project the landscape pictures onto a 140 × 190 cm screen. After entering laboratory A, the participants were asked to sit 3 m away from the screen and listen to the instructions. Then, they put on a head-mounted German SMI Glass2 eye tracker with a sampling frequency of 120 Hz/s, and 3-point calibration was performed. Because the cognition of space is a process that takes time to understand [48], we referred to previous studies [49] and set the observation time for each experimental picture to 15 s. The participants viewed six experimental pictures and five blank pictures, and each data acquisition period lasted approximately 120 s.
After the eye-movement experiment, the participants were led to laboratory B to fill out the cognitive evaluation questionnaire. Each photograph corresponded to a question with an answer scale of 7, with 1 being the worst and 7 being the best. The cognitive evaluation period for each landscape photograph was approximately 40 s, and the entire experiment lasted approximately 230 s.
The layout of laboratory A and the experimental process are shown in Figure 2.
2.5. Selection of Indicators
2.5.1. Selection of Eye-Movement Indicators
To analyse the participants’ visual behavioural characteristics when viewing each AOI, we combined the results of previous studies to select seven eye-movement indicators, including time to first fixation, first fixation duration, regression count, number of fixation points, percentage of fixation duration, regression time, and average pupil diameter [20,23,27,33]. The meanings of the eye-movement indicators are shown in Table 1 [48].
2.5.2. Selection of Cognitive Perception Evaluation Indicators
To understand the participants’ cognitive perception evaluations of the entire landscape spaces and landscape elements, we divided the AOIs according to the types of landscape elements and chose satisfaction with the entire space and AOI preferences as cognitive preference evaluation indicators. The meanings of the cognitive perception evaluation indicators are shown in Table 2. We used a 7-point answer scale to evaluate satisfaction with the whole landscape space, and AOI preferences were based on the favourite landscape constituent elements written down by the participants. The favourite constituent elements were recorded as 1 point, and those not mentioned were recorded as 0 points. Finally, we obtained the level of satisfaction with different landscape elements.
2.6. Analysis and Statistics
We used BeGaze 3.7 eye-tracking software to process the original data and analysed them with SPSS Statistics 23.0 (IBM Inc., Armonk, NY, USA) to view visual behaviour and cognitive preferences when viewing various elements in a forest landscape space (Figure 3).
The specific analysis steps are as follows:
- (1)
- One sample Kolmogorov–Smirnov test was used to determine whether the overall data were normally distributed and to determine the appropriate analysis and difference test methods.
- (2)
- After confirming that all data were normally distributed, we used a factor analysis to calculate the visual behaviour scores (VBSs) for each space.
- (3)
- One-way ANOVA was used to analyse the eye-movement behavioural differences among the participants when viewing various landscape elements in various types of spaces.
- (4)
- Spearman’s rho analysis was used to analyse whether there was a correlation between the characteristics of constituent elements, the participants’ visual behaviour and cognitive preferences for each AOI.
- (5)
- Multiple linear regression was used to establish the regression equation models of the characteristics of landscape elements, the participants’ visual behaviour, and cognitive preferences for different AOI types. We analysed how the three factors influenced each other with this model.
2.7. Composition Characteristics of Elements in Each Space
2.7.1. Classification of Constituent Elements
First, based on research by Lin, we divided the forest waterscape space and the in-forest space into plants, terrains, waterscapes, and structures (landscape architecture, stones, and tourists) [50]. Second, the plant elements of the in-forest landscape space were further divided into trees, bushes, and ground cover. Due to the particularity of the lookout landscape, according to the Kyoto Landscape Protection Plan and research by Liu et al., we divided the lookout landscapes into foreground and distant views [51,52]. See Table 3 for the elements of the various forest landscapes.
We used BeGaze 3.7 to divide each AOI according to the types of landscape elements and studied the effects of the landscape elements on the participants’ eye-movement behaviours.
2.7.2. Quantification of the Characteristics of Constituent Elements
The constituent element forms varied with the landscape space. To understand how the constituent elements affect visual behaviour, we quantified the complexity, proportion of the elements, and the VBS for each constituent element as follows:
- (1)
- Complexity (CO): Xu pointed out that the complexity of an image can be measured by its colour complexity [53]. Therefore, we measured complexity by calculating the colour complexity of each element in the forest landscape space. The HSV colour model was adopted as the quantitative model [54]. The calculation formula is as follows:where C represents the complexity of an image, m represents the number of different colour types, i represents the kind of colour, n represents the number of pixels in one kind of colour, N represents the total number of pixels in an image, k represents the number of different connected domains of one colour in the image, j represents the kind of connected domain, and h represents the number of pixels of one connected domain.
- (2)
- Proportion of elements (POE): The proportion of elements is also an important attribute of landscapes [44]. In this study, the proportion of elements in the entire picture is the proportion of pixels in the entire picture. The calculation formula is as follows:where P represents the proportion of the element, E represents the total number of pixels in the image, and e represents the number of pixels of the element.
- (3)
- Visual behaviour score: The VBS associated with eye-movement indicators is representative and reflects people’s visual attention when viewing an AOI [18,31]. Factor analysis in SPSS 23.0 was used to reduce the dimension of each eye movement index and to obtain the variance contribution rate of each eye-movement index for each common factor. Then, the comprehensive score of each landscape element was calculated by a formula in which the variance contribution rate corresponding to each eye movement index collected was the weight. The calculation formula is as follows:where V is the VBS, n is the kind of eye-movement indicator, Fx is the factor score of an eye-movement indicator, and Vx is the variance contribution rate of this eye-movement indicator after factor analysis.
3. Results
3.1. Visual Behaviour Scores and Characteristics of Landscape Elements in Different Forest Spaces
By dividing the AOIs and performing complexity calculations and factor analyses, we obtained complexity, proportion and VBS for each AOI (Table 4).
Generally, plant elements have the largest proportion in a forest landscape space, and their complexities and VBSs are also higher than those of other elements (Table 4).
In the water landscape space, the landscape elements near the waterscape obtained more VBSs than the waterscape itself (trees in the dynamic water landscape scored 0.742, and terrain in the static water landscape scored 0.341). Obviously, the combination of landscape elements near a waterscape attracts more visual attention than the waterscape.
In the lookout landscape, the foreground had the highest proportion and complexity, and the VBS was also the highest (0.700).
In the in-forest landscape, the complexity and proportion of plants were higher than those of other elements, and trees obtained high scores (trees scored 0.359 in the broadleaved forest landscape, 0.322 in the coniferous forest landscape, and 0.556 in the mixed forest landscape).
The AOI visual behaviour scores varied with the type of forest landscape space. We also found an interesting phenomenon: in the landscapes that contained tree elements, the VBSs for trees were all higher, which is consistent with the conclusion of Nordh and Amati [22,24].
In addition, we found that the complexity and proportion of elements affected visual behaviour scores. For example, ground cover elements in the broadleaved forest landscape had higher visual behaviour scores, while those in the coniferous and mixed forest landscapes had lower visual behaviour scores. This may be due to the low complexity and proportion of ground cover in the coniferous and mixed forests landscapes.
3.2. Visual Behavioural Characteristics and Variation in Elements with Forest Landscape Space
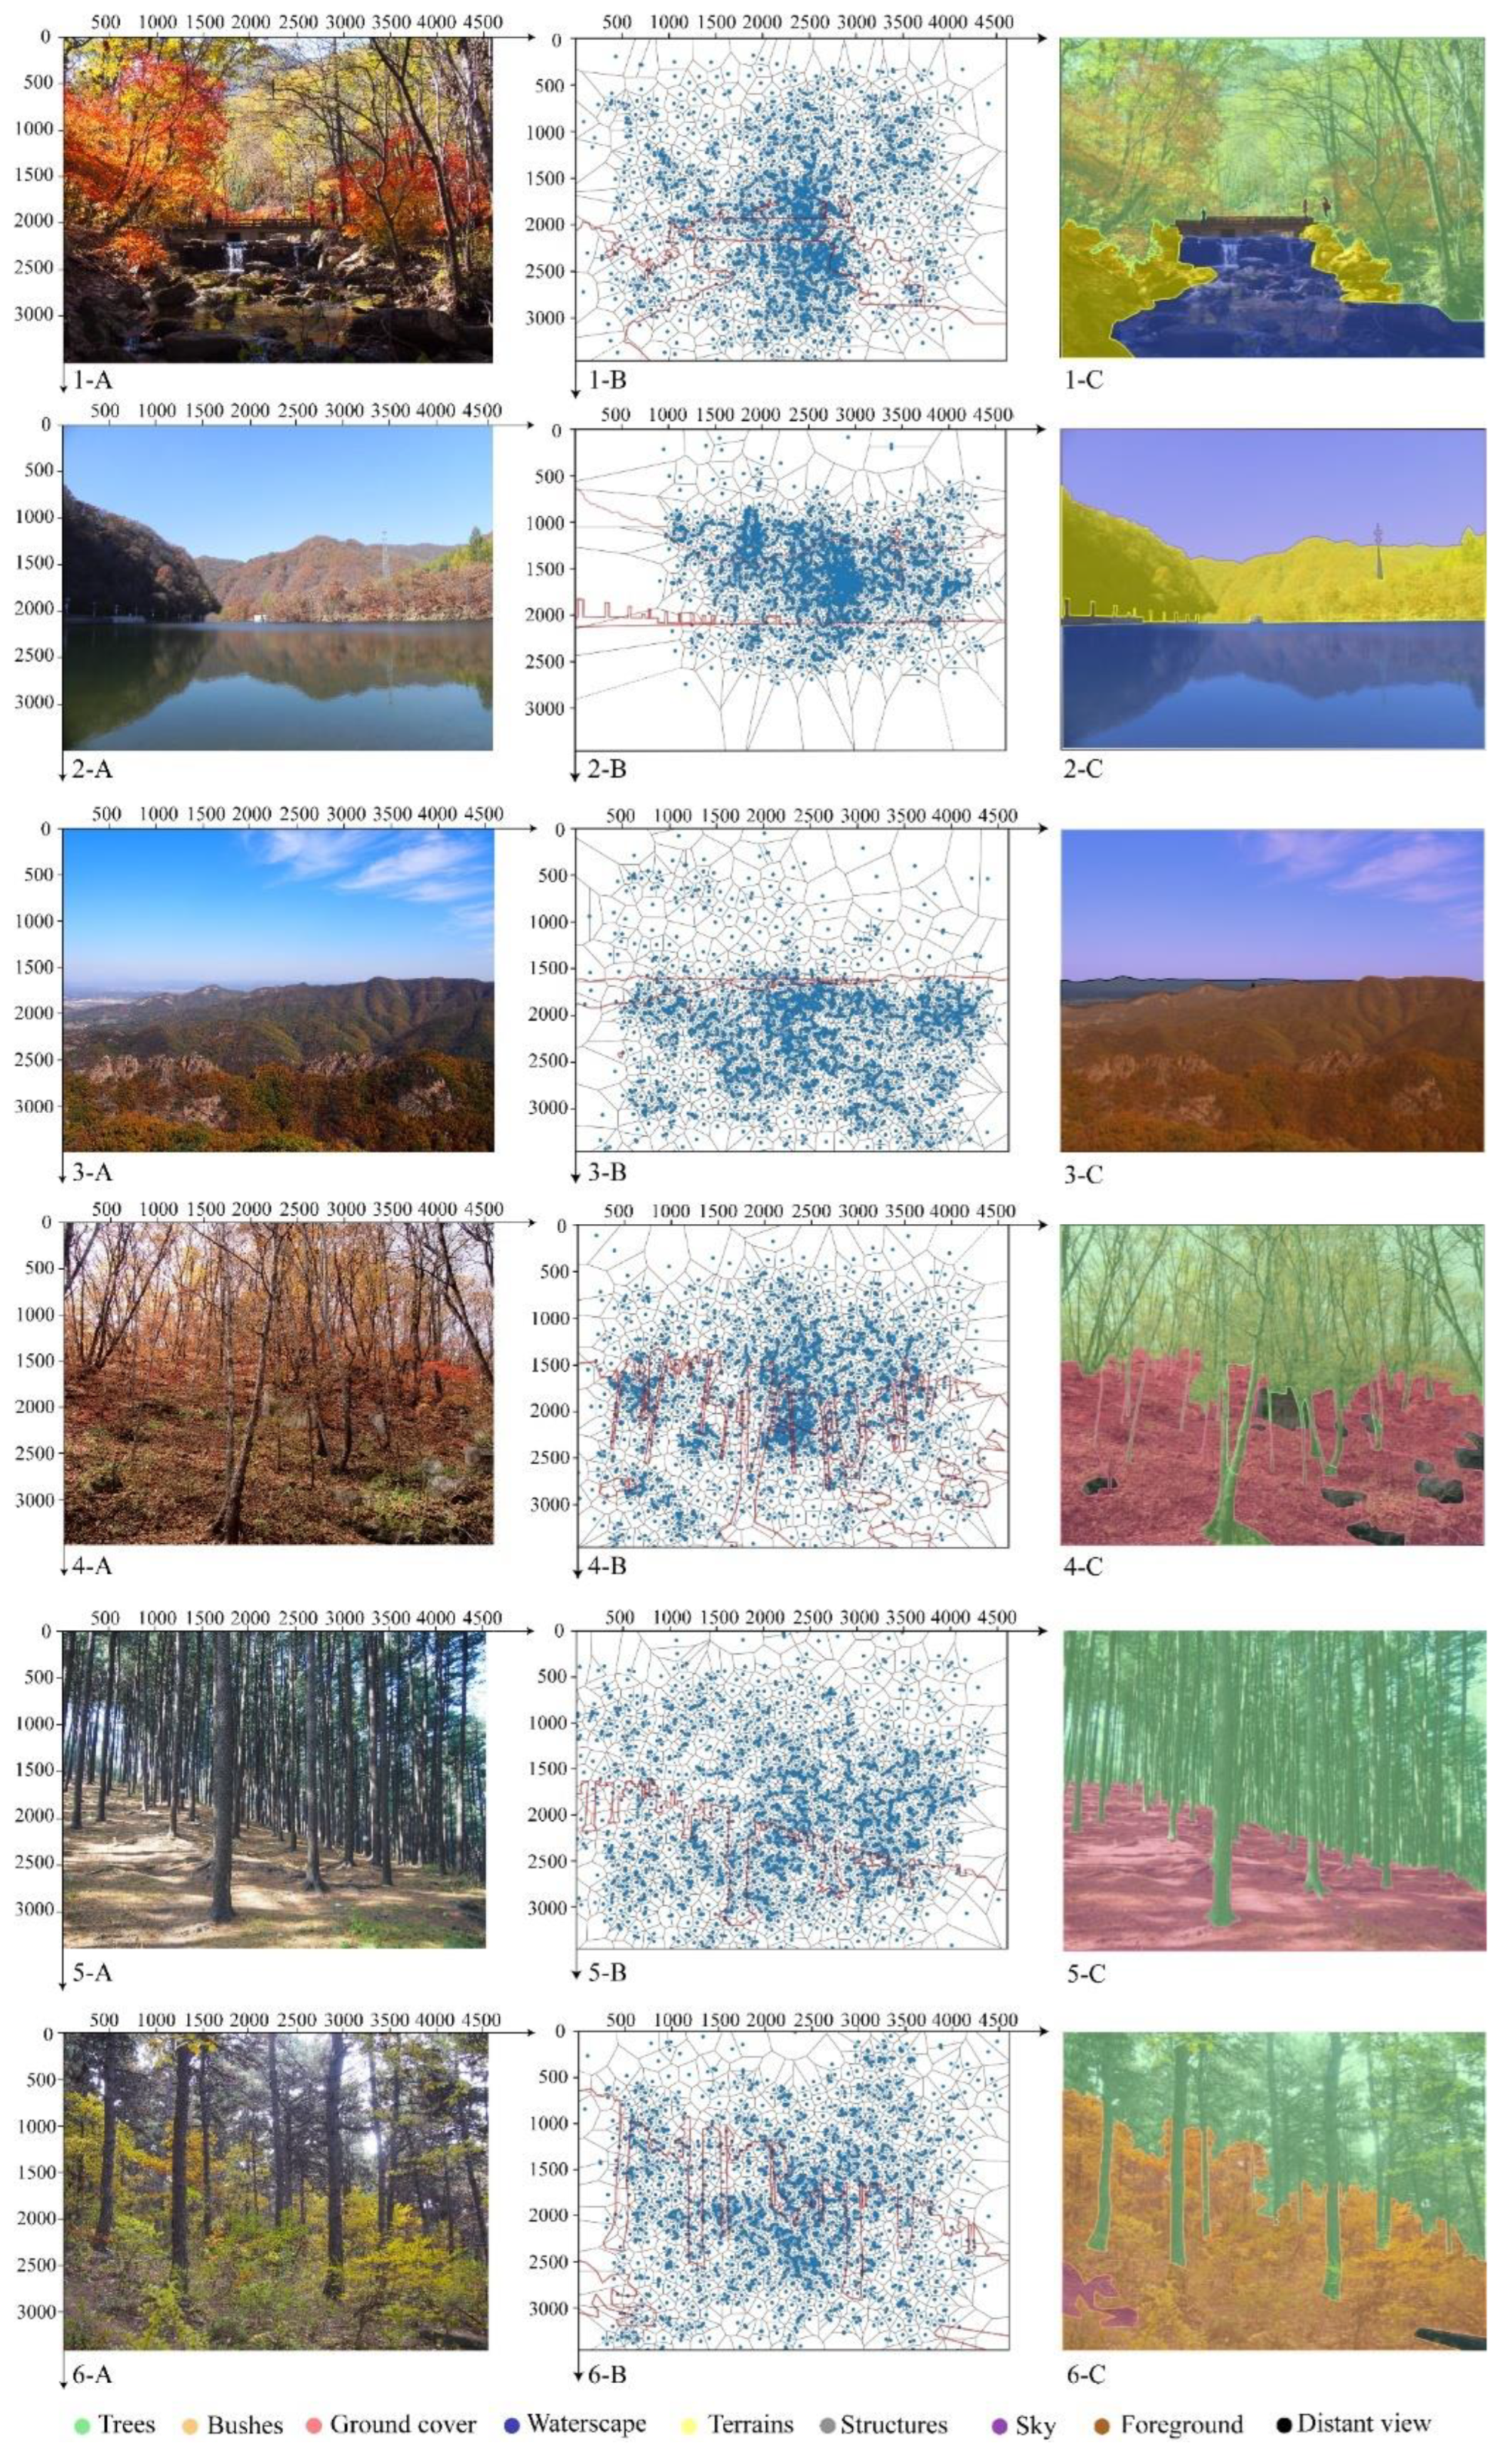
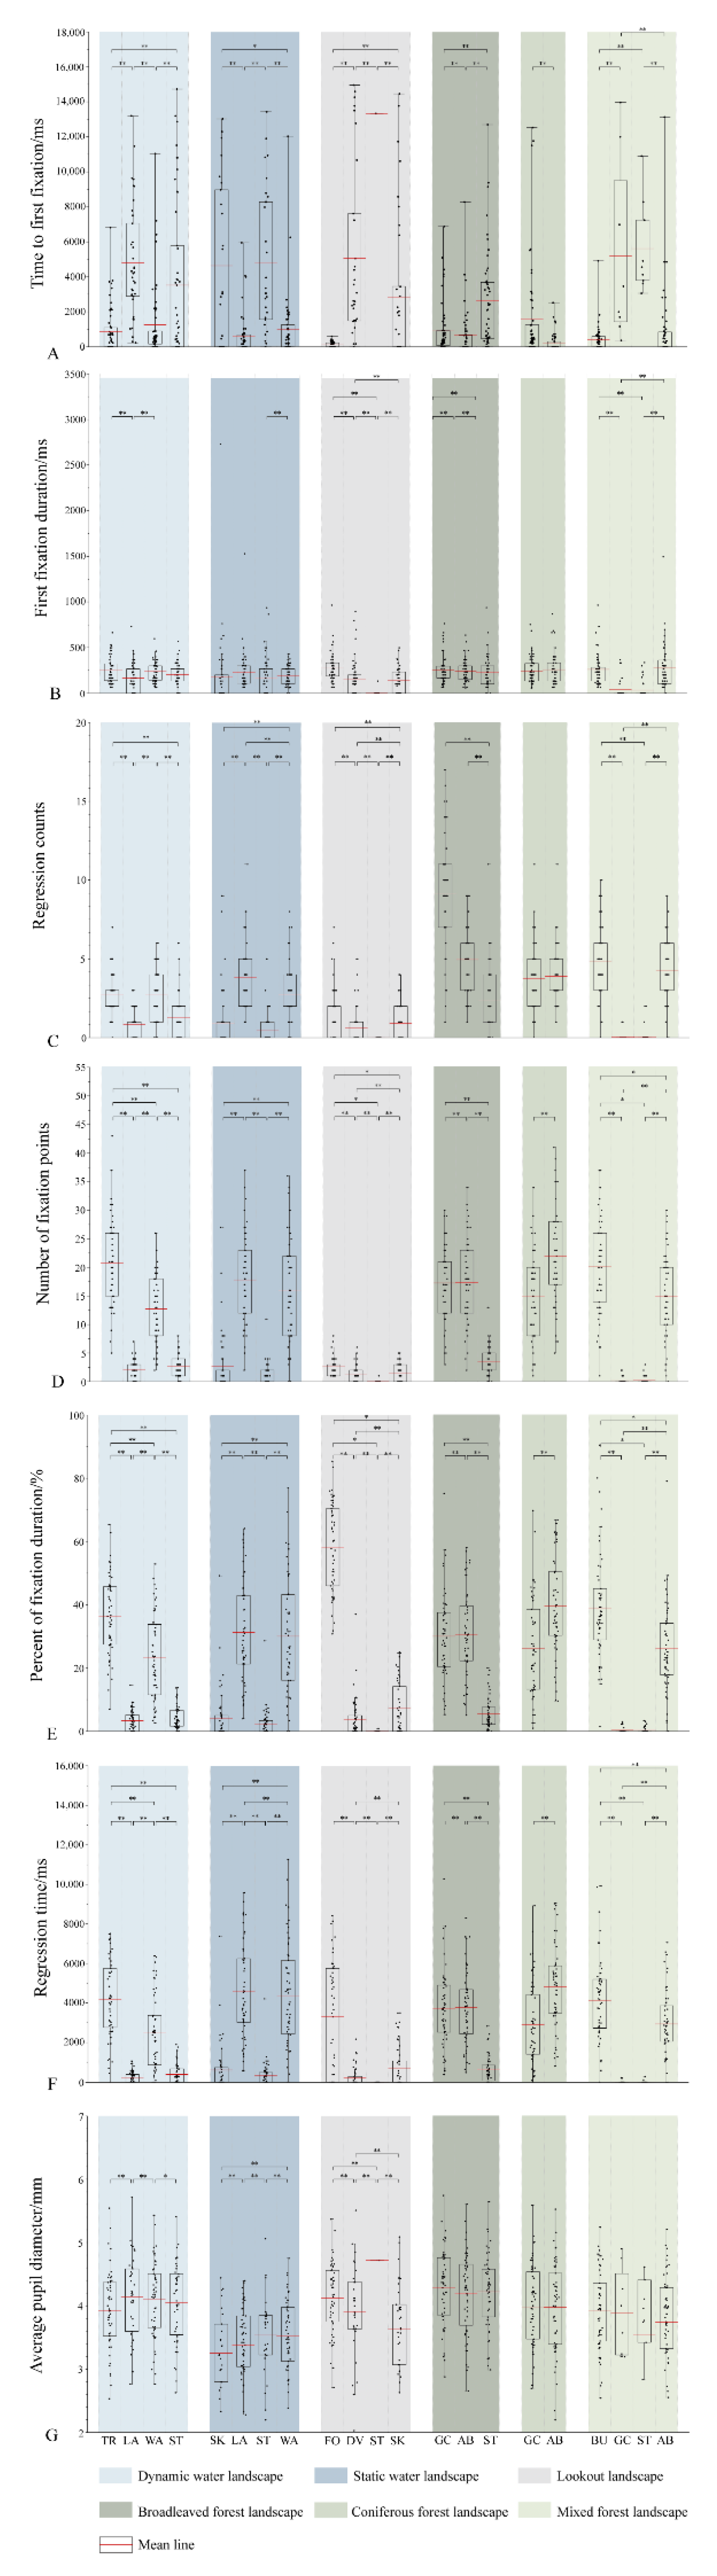
To understand the visual behavioural characteristics of different landscape elements in each forest landscape, first, we used Voronoi diagrams (Figure 4) to analyse the distribution form of the viewpoints in each landscape element of each forest landscape space. According to the research of Edelsbrunner [55], we made a Voronoi diagram in units of landscape picture pixel size using Python. The diagram directly reflects the distribution of the points in the plane space. Then, we used one-way ANOVA and box plots (Figure 5) to compare the differences in eye-movement behaviours when the participants viewed various landscape elements in the different forest landscapes.
First, in the forest waterscape space, we found that although it is the same waterscape, the visual behaviours in the two spaces were obviously different. In the dynamic water landscape, the viewpoints tended to focus on the waterscape, trees, and structures near the vanishing point of sight (Figure 4(1-B)), while in the static water landscape, the viewpoints tended to focus on the terrain and the reflection of terrain near the water (Figure 4(2-B)). This tendency may be related to spatial composition. The dynamic water landscape was a one-point perspective, while the static water landscape was a horizontal perspective. The distribution of viewpoints was concentrated mainly near the vanishing point of sight and the apparent horizon. The eye movement indexes (Figure 5) showed that two spaces had something in common: in the waterscape space, the participants spent a long time viewing and regressing to the landscape elements with the largest proportion near the waterscape rather than the waterscape itself.
Second, in the lookout space, the viewpoints were concentrated in the foreground, while the viewpoints in the sky were scattered (Figure 4(3-B)). The box plot was consistent with the Voronoi diagram; that is, more attention was paid to the shape of the close-up view of the mountain when overlooking. At the same time, we found that even when the proportion of structures in the scene was very small, the participants still quickly paid attention to structures. Therefore, structures may play a role in guiding the line of sight in the early stage of observation.
Finally, in the forest landscape, the Voronoi diagram (Figure 4(4-B,5-B,6-B) and box plot (Figure 5) show that trees and shrubs in the upper layer of space have the most viewpoints. Compared with other elements, the fixation times on trees and shrubs were longer, and the regression count are more. We also found that although there were structures (rocks) in broadleaved and mixed forest landscapes, the rocks in the broadleaved forest landscape accounted for a larger proportion and were closer to the centre of the image. Therefore, rocks in the broadleaved forest landscape were more easily noticed, and the fixation times were longer.
Based on the above results, we found that (1) when the participants observed the elements of the forest landscape, different characteristics affected their attention distribution and then led to significant differences in visual behaviours, and (2) the distributions of fixation points and eye movement behaviours were obviously influenced by the overall spatial composition and the position of elements. The elements closer to the composition line and the centre of the picture were more likely to be noticed, and more fixation time was spent on those elements.
3.3. Cognitive Preference Characteristics of Each Landscape Element in Various Forest Landscape Spaces
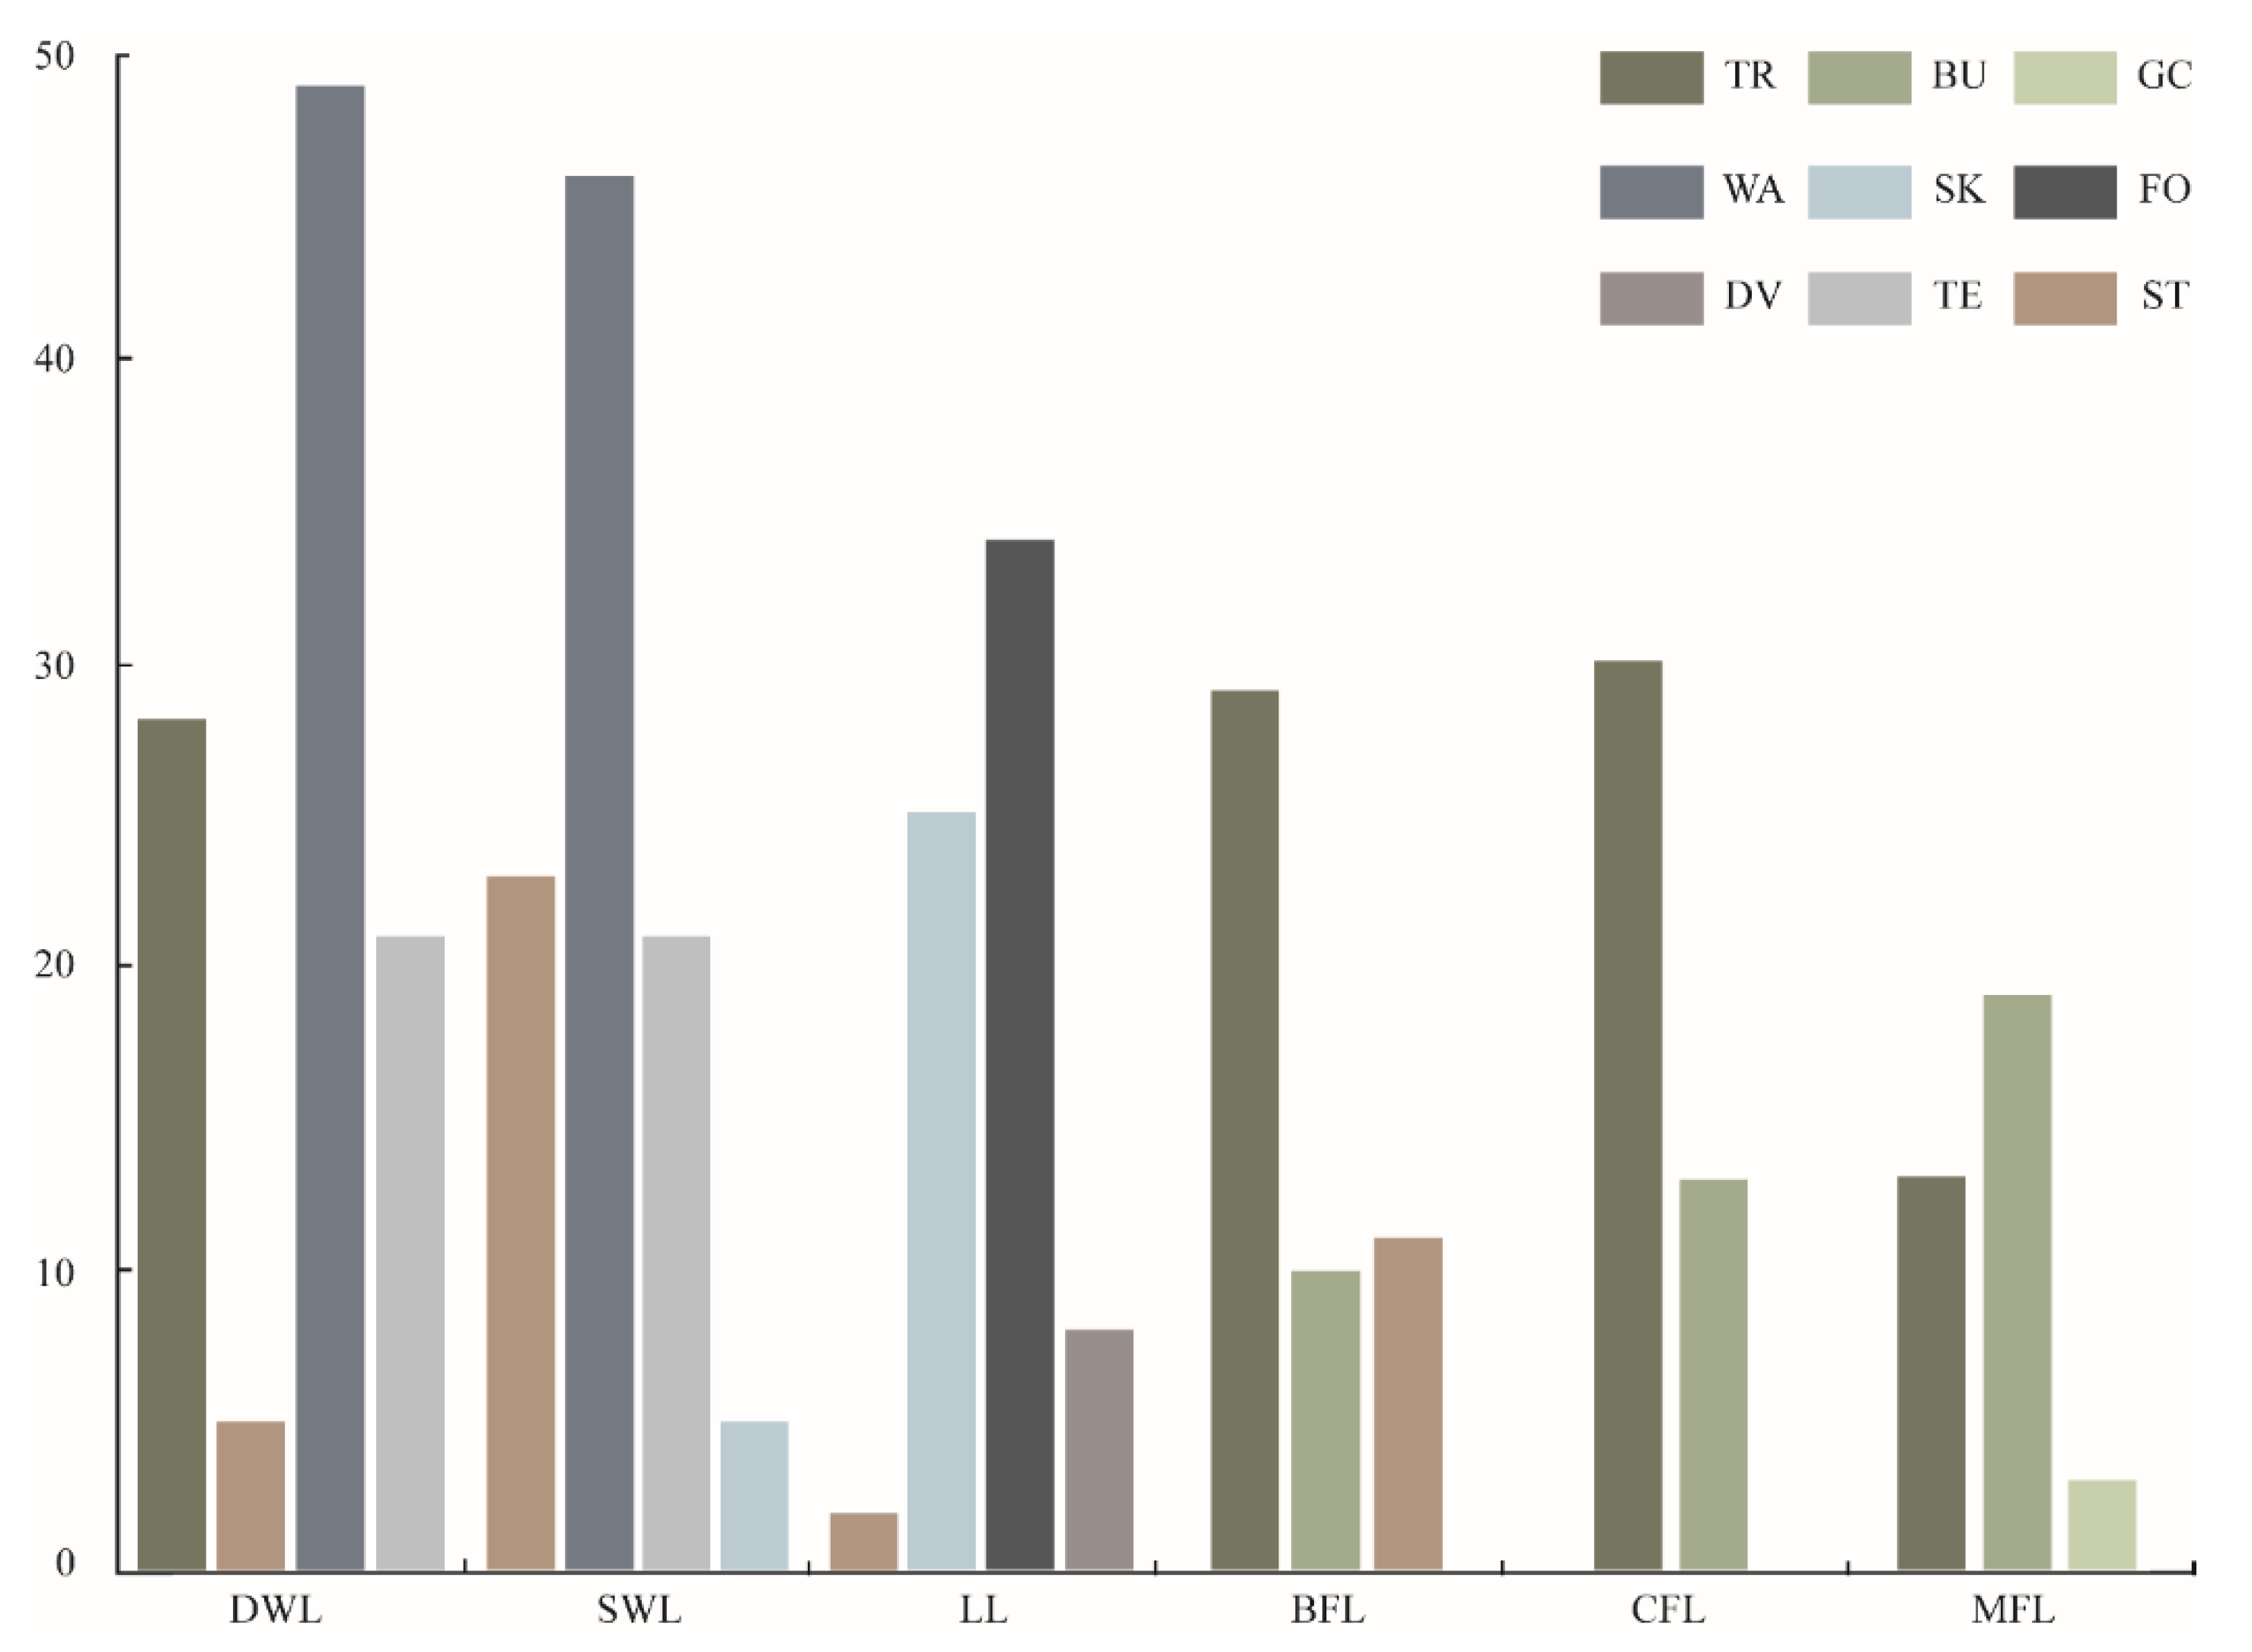
We categorized the descriptions of the favourite elements in the six types of forest landscape in the questionnaires (Figure 6) and found that the preferred elements varied with forest landscapes.
On the whole, the participants generally liked plant elements, especially trees, in the various forest landscapes (Figure 6). Meanwhile, the special elements of landscape spaces, such as the waterscape in the forest water landscape and the foreground in the lookout landscape, were preferred by the participants.
3.4. The Relationship among Visual Behaviour, Element Characteristics, and AOI Preferences
3.4.1. The Correlation between Element Characteristics, Cognitive Preference Indicators, and Eye-Movement Indicators
We used Spearman correlation analysis to analyse the correlation among element characteristics, AOI preferences, and eye-movement indicators (Table 5).
As shown in Table 5, we found that the complexity and proportion of elements had no significant correlation with time to the first fixation but had a significant correlation with other eye-movement indicators and VBSs.
The results indicated that the characteristics of the elements significantly affected the visual behaviour of the participants. Among them, complexity and proportion were positively correlated with six eye-movement indicators (first fixation duration, regression count, number of fixation points, percentage of fixation duration, regression time, and average pupil diameter). That is, the higher the complexity and proportion of an AOI, the more time the participants spent viewing the area.
Preference for AOI and satisfaction were also significantly correlated with certain eye-movement indicators. Among them, first fixation duration, regression count, number of fixation points, percentage of fixation duration, regression time, and average pupil diameter were positively correlated with AOI preferences. However, first fixation duration was positively correlated with satisfaction, while regression count and regression time were negatively correlated.
Additionally, there was a significant positive correlation between preference for constituent elements and satisfaction. That is, the more constituent elements the participants liked in a space, the more satisfied they were with the landscape.
3.4.2. The Relationship among Element Characteristics, Cognitive Preferences, and Eye-Movement Behaviours
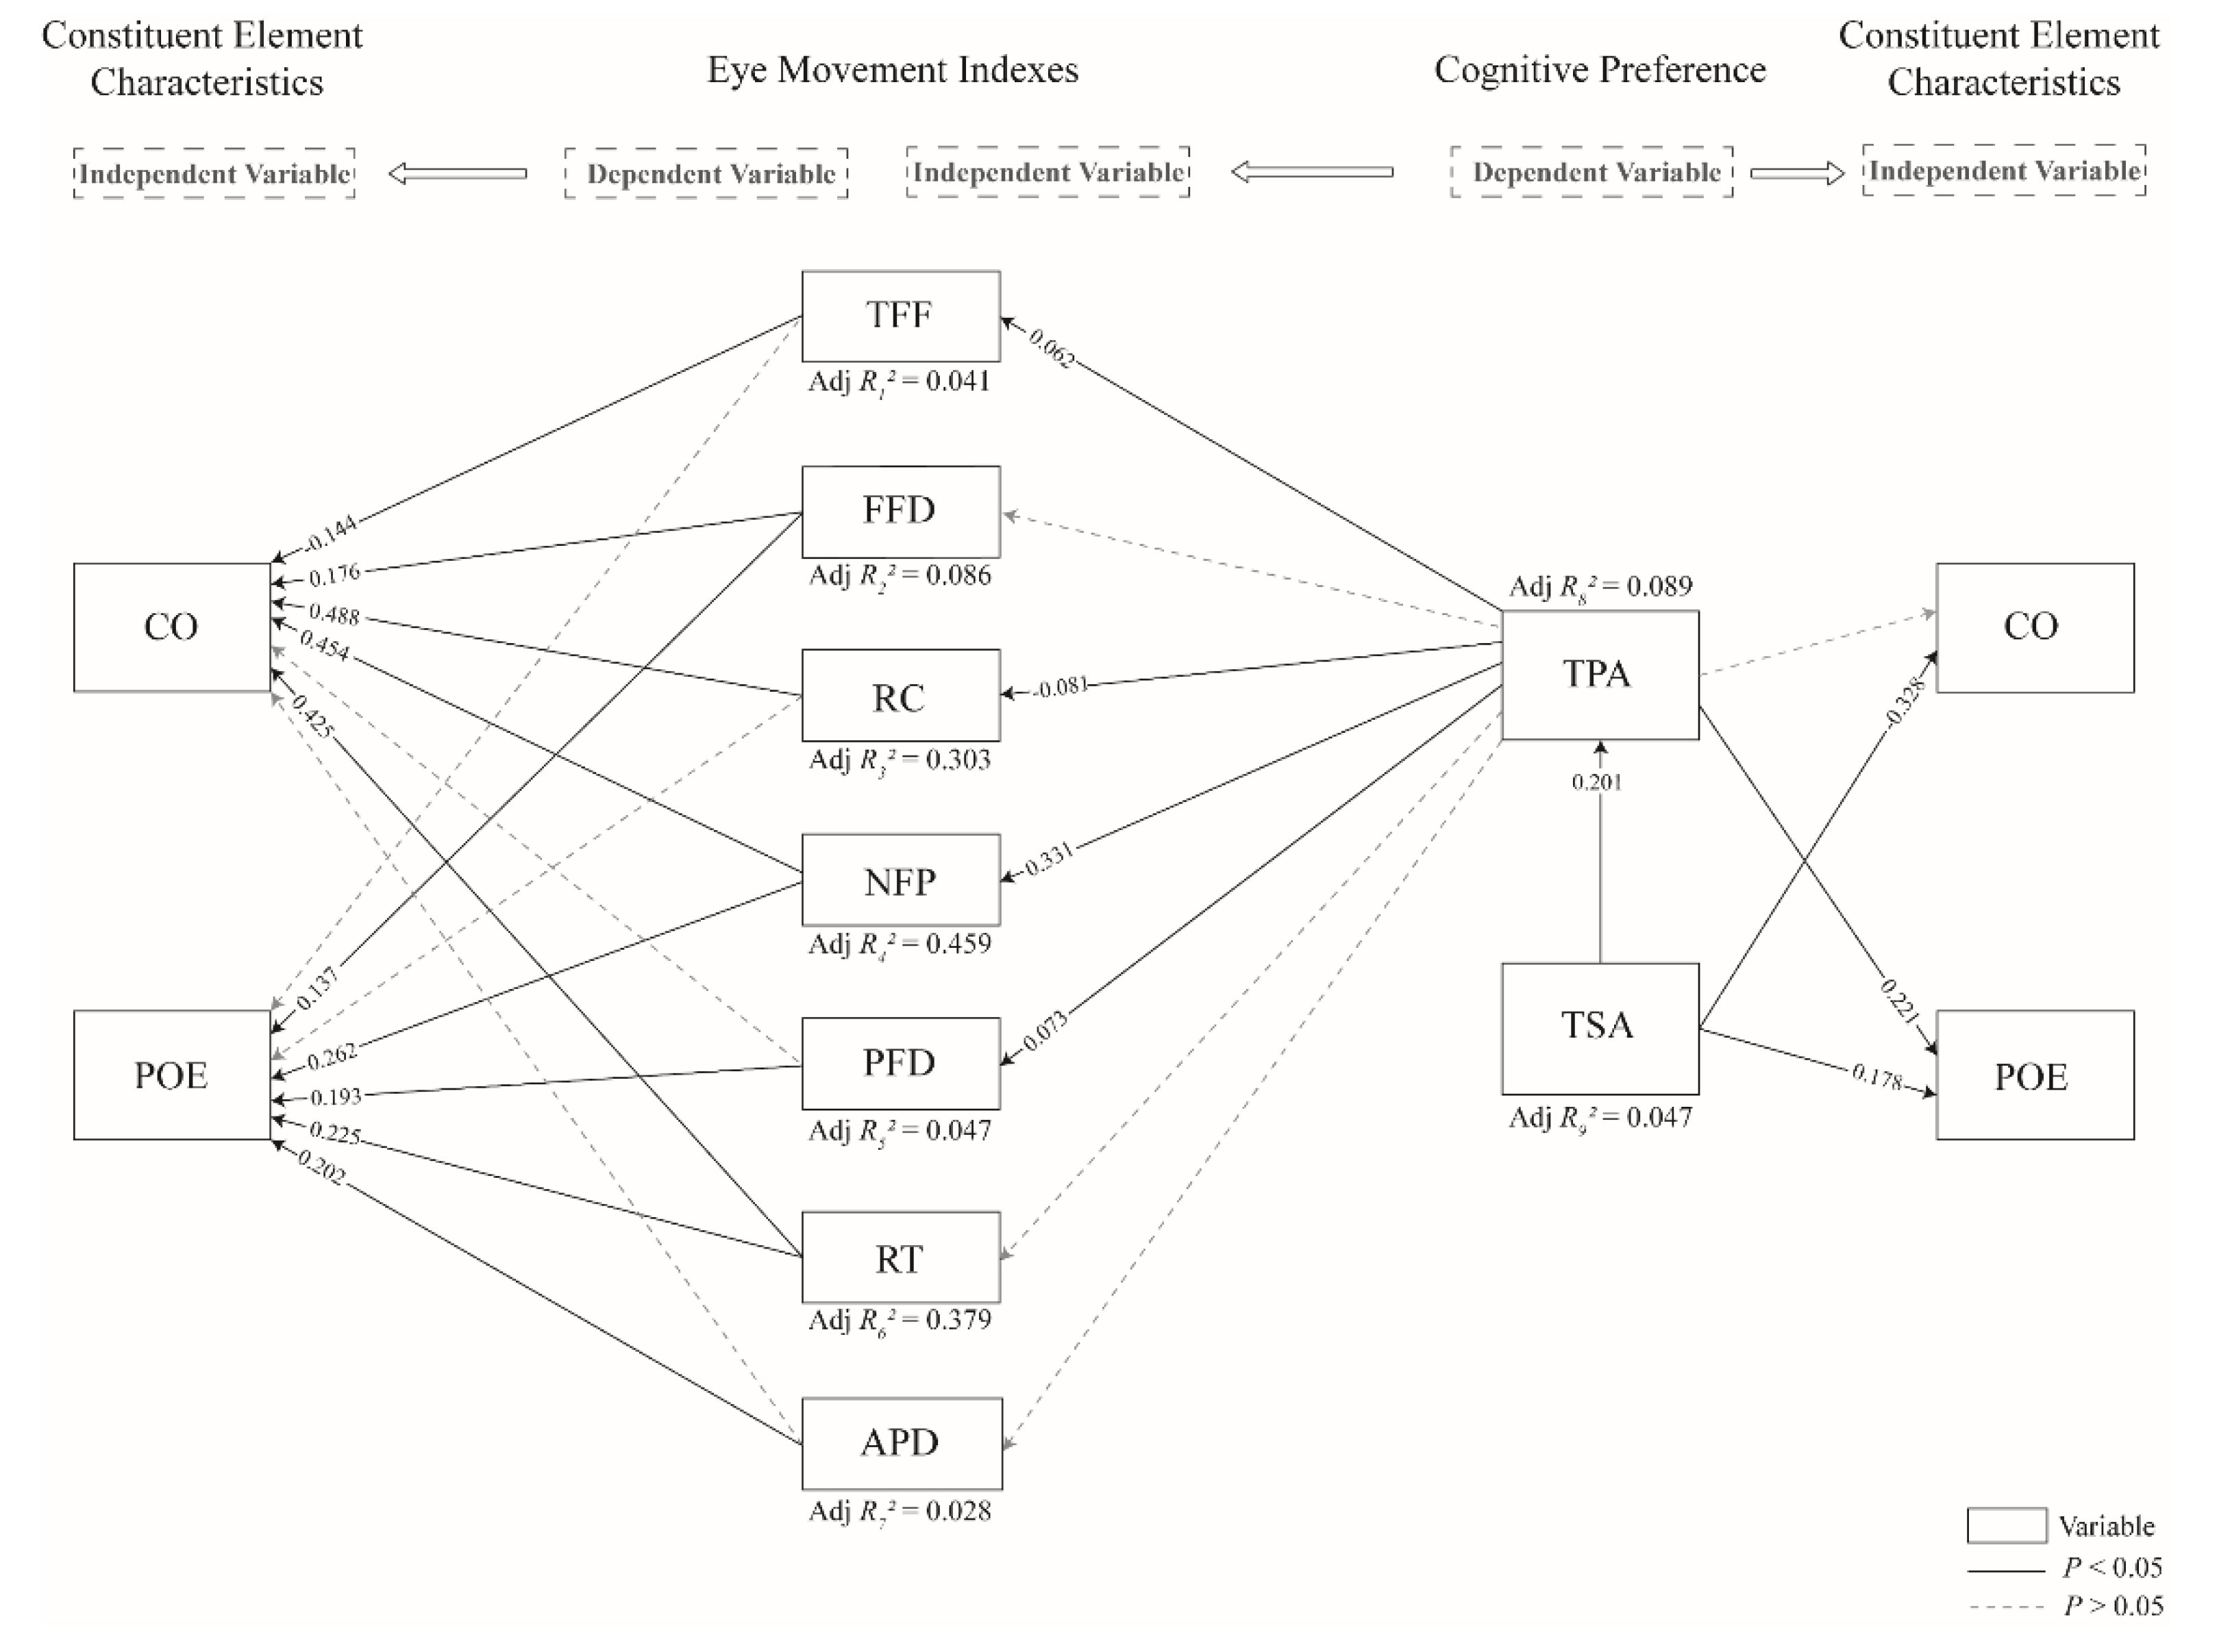
Through multiple linear regression, we established a linear regression model among element characteristics, eye-movement indicators, and cognitive preference indicators (Figure 7).
- (1)
- Influence of element characteristics on visual behaviour
In addition to the time of the first fixation, complexity made a positive contribution to the four eye-movement indicators, including first fixation duration, regression count, regression time, and average pupil diameter (Figure 7). The proportion of elements made a positive contribution to the five eye-movement indicators: time to the first fixation, regression time, number of fixation points, percentage of fixation duration, and average pupil diameter. At the same time, the contribution rate of complexity was greater than the proportion of elements in the first fixation duration, number of fixation points and regression time.
In other words, the higher the complexity and proportion of elements, the more time the participants spent viewing and the more fixations they generated. Complexity influenced visual behaviour more than the proportion of elements.
- (2)
- Influence of element characteristics and eye-movement indicators on AOI preferences
Few AOI eye-movement indicators influence AOI preferences (Figure 7). This might be because eye-movement indicators and AOI preferences are different dimensional indicators, and the mechanism of the mutual influence is complex. Eye-movement indicators might only be a reaction of preference rather than an influencing factor.
We found that the more fixation points there were, the more the participants liked the elements. However, the more regression there was, the less the participants liked the landscape elements (Figure 7).
In the forest landscape spaces, some landscape elements that the participants fell in love with at first sight easily gained higher preference. Other elements that were viewed repeatedly did not obtain the participants’ preference. The results indicated that the preference for elements depends on the first impression.
- (3)
- Influence of element characteristics and AOI preferences on satisfaction
As Figure 7 shows, element characteristics and preferences have an impact on satisfaction. Among them, the complexity of elements has a significant negative impact on satisfaction, while the proportion of and preference for elements have positive effects.
Therefore, we found that when viewing the entire landscape space, the participants allocated more visual attention to elements with high complexity and proportions. However, they were more likely to favour simple and large landscape elements. The more of these elements there were, the higher the satisfaction with the pictures representing landscape spaces.
4. Discussion
4.1. With the Composition of Forest Landscape Spaces and the Different Ways of Combining Landscape Elements, Users’ Visual Behaviour in Relation to Landscape Elements also Differs
We found that visual behaviour varied with the elements in a forest landscape space (Table 4), which is consistent with the results of Li and Cottet [23,25].
In the forest landscapes, the participants paid more attention to the main elements, such as plants in the in-forest space and the foreground in the lookout space. As the main landscape elements in forests, plants attract more visual attention. Among all plant types, users pay more attention to trees, which is consistent with the findings of Nordh and other researchers [24,56]. Especially in the in-forest space, the vertical combination, collocation, and composition of the space affected visual behaviour (Figure 4).
However, in the waterscape spaces, people paid more attention to the landscape elements around the waterscape (Figure 5). This may have been because waterscape is a highly fascinating landscape element, and the participants’ observation modes are different than for other landscape elements. There may be two reasons for this result. First, the landscape elements concerned were all close to the vanishing point of sight or apparent horizon, and the participants were easily influenced by the overall spatial composition when viewing. Second, this phenomenon may verify Kaplan’s hypothesis. Nordh showed that water is a highly fascinating landscape element [57]. Berto et al. showed that the number of gaze points was significantly less in a highly fascinating landscape than in a low fascinating landscape [38]. That is, waterscapes are a highly fascinating landscape element that is so easy to understand that people pay little attention to them. Therefore, after quickly understanding the waterscape, the participants turned their attention to other landscape elements around the waterscape.
In contrast, the landscape elements around the waterscape are low fascinating elements, so people need to pay more attention to viewing and recognizing them. That is, in the landscape space, people are easily attracted by highly fascinating landscape elements, but they allocate more cognitive efforts to understand the low fascinating elements around them, which leads to the phenomenon of attention diversion.
4.2. The Cognitive Preferences of Users for Each Element Vary with Forest Landscape Space
The cognitive preferences for a given element vary with the forest landscape space (Figure 6), which verifies previous research results [23,56]. People prefer the main landscape elements in a space, such as plants in the forest landscape, especially trees. Additionally, the participants had a strong preference for the special landscape elements in forests.
4.3. Interactive Influence among Element Characteristics, Visual Behaviour, and Cognitive Preferences
According to the results of multiple linear regression (Figure 7), there are mutual influences among element characteristics, cognitive preference indicators, and eye-movement indicators.
(1) Regarding the influence of element characteristics on visual behaviour, the complexity and proportion of elements significantly affect visual behaviour. The higher the complexity and proportion of the elements, the more time the participants spent viewing them. The results indicated that more cognitive effort is required to deal with highly complex and large elements. This is similar to the findings of Franěk et al. [30], who showed a positive correlation between image complexity and fixation duration.
Regarding the meaning of eye-movement indicators, time to the first fixation and first fixation duration mainly reflect the early period of cognition, regression time and regression count mainly reflect the later period of cognition, and total fixation time mainly reflects the whole cognitive process over a long period [47,58].
According to the results of the equation model (Figure 7), first, in the whole cognitive process, the positive contribution of complexity to the percentage of fixation duration was greater than that of the proportion of elements. Second, in the early period of cognition, only complexity made a positive contribution to time to first fixation, and the contribution of complexity to first fixation duration was greater than that of the proportion of elements. Finally, in the later period of cognition, complexity made a positive contribution to regression count, while the proportion of elements made a greater positive contribution to regression time than complexity.
Therefore, we deduced that complexity and proportion of elements both play important roles in the whole cognitive process, and complexity is more important. In the early period of cognition, the effect of complexity is greater than that of the proportion of elements, but in the later period of cognition, both have significant effects.
Thus, element characteristics in the forest landscape space affect the cognition of space. The landscape cognition stage moves from incomprehension to exploration and finally to recognition. In this process, the element characteristics that affect a given cognitive stage may change. This is a significant and interesting topic that involves the influence mechanism of spatial elements of forest landscapes on cognition.
(2) Regarding the influence of element characteristics on cognitive preference, first, the larger the proportion of an element is, the higher the preference for that element. In addition, complexity affects element preference. We found that the participants did not always prefer overly complex landscape elements, even though those elements required more visual attention. This may be because people have a tolerance threshold for element complexity and tend to prefer images of moderate complexity [33]. At the same time, the more complex elements in the scene were, the more time the participants spent on cognition and exploration, which led to a greater cognitive load, thus reducing overall satisfaction with the space. After all, in a completed landscape space, people prefer simplicity.
(3) Regarding the effect of visual behaviour on cognitive preferences, landscape elements with more fixations are more likely to be favoured by users. Since each eye-movement behaviour affects the formation of preferences [1], an increase in viewing time may also lead to an increase in preference. This result is consistent with the findings of Huang [33], who showed that landscape preferences are positively correlated with the number of fixation points.
On the other hand, the regression coefficients of regression count and element preferences are negative (Figure 7). We found that the first observation of an element could lay the foundation for preferring the element. In other words, repeated exposure to something we initially dislike only makes us dislike it more [59]. In the entire experiment, the participants repeatedly viewed various landscape elements in the forest landscape to understand the space. In the cognitive process, disliked elements may weaken a preference when they are repeatedly viewed.
4.4. Limitations
In this study, landscape photographs were used as experimental samples. Although some studies have confirmed the effectiveness of photographs as a visual substitute for landscape assessment [20,43], the perception of landscape is multisensory; that is, it is not only visual but also involves other senses, such as hearing and smell [60]. Experiencing landscape through photographs only under laboratory conditions may result in truncated feelings [25]. Therefore, one topic worthy of further study is exploring the influence of other sensory stimuli on the cognition of vision and landscape spaces.
The data obtained in this study were from college undergraduate and graduate students who had received higher education and had background knowledge of agriculture and forestry. Although some studies have shown that student data are representative [36,61], the growth background of such users affects their cognition of forests [17]. At the same time, it is undeniable that middle-aged and elderly people have more leisure time and make up the main body of forest park users. Therefore, exploring the impact of demographic characteristics on visual behaviour and cognition is another topic for future research.
In addition, with changes in seasons, forests can bring different visual experiences to tourists. Therefore, in the future, we will analyse the influence of elements in various landscape spaces on people’s eye-movement behaviours and cognitive preferences in different seasons.
Finally, in future research, we will expand the choice of sample plots. At present, the selected forest landscape sample plot has a high degree of artificiality, but the sense of wildness is also one of the charms of forests. It is also a necessary subject to explore the influence of forest primitiveness on visual behaviour and psychological cognition. At the same time, we will consider visual behaviour and psychological cognition when looking at different viewing angles to help designers better choose the location of viewing points.
5. Conclusions and Suggestions
5.1. Conclusions
Landscape elements are important components of landscapes that determine the spatial characteristics to a certain extent. This study is based on our previous analysis of visual behavioural characteristics and cognitive preferences in different types of forest spaces. From the perspective of spatial composition and element characteristics, we further analysed how landscape elements and their combinations influenced visual behaviour and cognitive preferences in different types of forest landscapes.
Specifics are as follows:
- (1)
- Visual behaviour towards various elements is influenced by the overall spatial composition. With changes in the composition of a forest landscape space and different ways of combining landscape elements, visual behaviour towards landscape elements also differs. People are more likely to pay attention to landscape elements near the vanishing point of sight or apparent horizon.
- (2)
- In landscape spaces, people tend to shift their attention. At first, attention is easily attracted by highly fascinating landscape elements, but more time will be spent on less fascinating landscape elements.
- (3)
- Element characteristics significantly affect visual behaviour and cognitive preferences.
- (4)
- It takes people more time to recognize elements with high complexity and proportion. However, this does not mean that people prefer this kind of element, and people may reduce their satisfaction evaluations of a whole space because of the complex colour. The elements that people prefer at first sight usually account for a large proportion and low complexity. At the same time, judging from the influence of element characteristics on satisfaction, the more landscape elements with large proportions but simple forms there are, the higher the satisfaction with the landscape space.
5.2. Suggestions
Previous studies have shown that photographs can replace scenic landscapes for research purposes [20,43], and our research is based on using visual perceptions to study the relationship between the characteristics of landscape elements, visual behaviour, and psychological cognition. In forest parks, landscape nodes are the space where people spend the most time, so the landscape effect of landscape nodes needs special attention. Our sample sites are all located at the landscape nodes in the forest park. Therefore, we proposed the following suggestions to help forest planners better optimize the landscape node space in the forest park.
Forest landscape spaces are composed of various landscape elements. In terms of visual effects, landscape spaces also include the composition effect (Figure 8). Therefore, regarding the planning of forest landscapes, designers should consider not only the composition effect but also the characteristics and combination of landscape elements according to landscape type.
Overall, firstly, designers should avoid using landscape elements that are too complex, which can easily make people feel tired and reduce their satisfaction. Based on the results of characteristics and satisfaction with constituent elements (Figure 7), people prefer elements with large proportions but simple forms. Therefore, landscape designers should pay attention to this preference and follow the design rule that simplicity is beauty. Second, designers should pay attention to the composition form of the whole space. The vanishing point of sight and elements near the apparent horizon are more likely to attract viewers’ attention. Using these features, designers can better present the landscape elements that they wish to highlight in a particular space.
In forest waterscape landscapes, designers should pay attention to the collocation of elements near waterscapes and the outline of reflection. These two landscape combinations are the most important parts of waterscape spaces, and their forms and characteristics significantly affect satisfaction with the whole space.
In lookout landscape, designers can take advantage of the features that the structures on a mountain are easy to be identified to guide viewers’ sight and then create the overlooking sight corridor.
In in-forest landscapes, trees and tall shrubs are the focus of attention, so designers should carefully consider the shapes of the upper and middle spaces when planning. At the same time, they should pay attention to the density of trees to avoid reducing satisfaction with the forest landscape due to too many complex tree elements.
Author Contributions
Design and conduction of experiments, T.Z.; methodology, T.Z. and Y.G.; data analysis, S.Z.; writing—original draft, S.Z. and Y.G.; writing—review & editing, Z.Z., W.Z. and H.M. All authors have read and agreed to the published version of the manuscript.
Funding
The research was supported by the Natural Science Foundation of China (31971714) and the Shenyang Agricultural University Student Innovation and Venture Fund.
Data Availability Statement
The data presented in this study are available on request from the corresponding author. The data are not publicly available due to the copyright of relevant data in the article belonging to the research group rather than to individuals. As the first author, I have no right to public the relevant data.
Acknowledgments
We would like to thank the reviewers for their comments on this paper, which helped us improve the ideas of the paper and for the linguistic assistance during the preparation of this manuscript. We would also like to thank Chen Zhenju from the College of Forestry in Shenyang Agricultural University for their valuable comments in the revision of this manuscript.
Conflicts of Interest
The authors declare no conflict of interest.
References
- Gao, Y.; Zhang, T.; Zhang, W.; Meng, H.; Zhang, Z. Research on visual behavior characteristics and cognitive evaluation of different types of forest landscape spaces. Urban For. Urban Green. 2020, 54, 126788. [Google Scholar] [CrossRef]
- People’s Daily Online. 2021. Available online: http://sd.people.com.cn/BIG5/n2/2021/0118/c386907-34534285.html (accessed on 18 January 2021).
- Chinese Government Website. 2021. Available online: http://www.gov.cn/shuju/2021-01/19/content_5580910.htm (accessed on 19 January 2021).
- Arnberger, A. Recreation use of urban forests: An inter-area comparison. Urban For. Urban Green. 2006, 4, 135–144. [Google Scholar] [CrossRef]
- Arnberger, A.; Schneider, I.E.; Ebenberger, M.; Eder, R.; Venette, R.C.; Snyder, S.A.; Gobster, P.H.; Choi, A.; Cottrell, S. Emerald ash borer impacts on visual preferences for urban forest recreation settings. Urban For. Urban Green. 2017, 27, 235–245. [Google Scholar] [CrossRef]
- Buhyoff, G.J.; Wellman, J.D. Seasonality bias in landscape preference research. Leis. Sci. 1979, 2, 181–190. [Google Scholar] [CrossRef]
- Bulut, Z.; Yilmaz, H. Determination of waterscape beauties through visual quality assessment method. Environ. Monit. Assess. 2009, 154, 459–468. [Google Scholar] [CrossRef] [PubMed]
- Daniel, T.C. Whither scenic beauty? Visual landscape quality assessment in the 21st century. Landsc. Urban Plan. 2001, 54, 267–281. [Google Scholar] [CrossRef]
- Deng, S.; Yan, J.; Guan, Q.; Katoh, M. Short-term effects of thinning intensity on scenic beauty values of different stands. J. For. Res. 2013, 18, 209–219. [Google Scholar] [CrossRef]
- Gong, L.; Zhang, Z.; Xu, C. Developing a Quality Assessment Index System for Scenic Forest Management: A Case Study from Xishan Mountain, Suburban Beijing. Forests 2015, 6, 225–243. [Google Scholar] [CrossRef] [Green Version]
- Litton, R.B. Visual vulnerability of forest landscapes. J. For. 1974, 72, 392–397. [Google Scholar] [CrossRef]
- Schroeder, H.; Daniel, T.C. Progress in Predicting the Perceived Scenic Beauty of Forest Landscapes. For. Sci. 1981, 27, 71–80. [Google Scholar] [CrossRef]
- White, M.P.; Cracknell, D.; Corcoran, A.; Jenkinson, G.; Depledge, M.H. Do Preferences for Waterscapes Persist in Inclement Weather and Extend to Sub-aquatic Scenes? Landsc. Res. 2013, 39, 339–358. [Google Scholar] [CrossRef]
- Gundersen, V.; Stange, E.; Kaltenborn, B.; Vistad, O. Public visual preferences for dead wood in natural boreal forests: The effects of added information. Landsc. Urban Plan. 2017, 158, 12–24. [Google Scholar] [CrossRef]
- Van der Wal, R.; Miller, D.; Irvine, J.; Fiorini, S.; Amar, A.; Yearley, S.; Gill, R.; Dandy, N. The influence of information provision on people’s landscape preferences: A case study on understorey vegetation of deer-browsed woodlands. Landsc. Urban Plan. 2014, 124, 129–139. [Google Scholar] [CrossRef]
- Zhang, Z.; Qie, G.; Wang, C.; Jiang, S.; Li, X.; Li, M. Application of eye-tracking assistive technology in forest landscape evaluation. World For. Res. 2017, 30, 19–23. (In Chinese) [Google Scholar]
- Zhang, T.; Zhang, W.; Meng, H.; Zhang, Z. Analyzing Visitors’ Preferences and Evaluation of Satisfaction Based on Different Attributes, with Forest Trails in the Akasawa National Recreational Forest, Central Japan. Forests 2019, 10, 431. [Google Scholar] [CrossRef] [Green Version]
- Zhang, C.; Wang, H.; Wang, C. Visual Quality Evaluation and Distance Change Analysis of Urban Forest Landscape Based on Eye-movement. J. Chin. Urban For. 2020, 1, 6–12. (In Chinese) [Google Scholar]
- Habron, D. Visual perception of wild land in Scotland. Landsc. Urban Plan. 1998, 42, 45–56. [Google Scholar] [CrossRef]
- Dupont, L.; Antrop, M.; Van Eetvelde, V. Eye-tracking Analysis in Landscape Perception Research: Influence of Photograph Properties and Landscape Characteristics. Landsc. Res. 2013, 39, 417–432. [Google Scholar] [CrossRef]
- Rogge, E.; Dessein, J.; Gulinck, H. Stakeholders perception of attitudes towards major landscape changes held by the public: The case of greenhouse clusters in Flanders. Land Use Policy 2011, 28, 334–342. [Google Scholar] [CrossRef] [Green Version]
- Amati, M.; Parmehr, E.G.; McCarthy, C.; Sita, J. How eye-catching are natural features when walking through a park? Eye-tracking responses to videos of walks. Urban For. Urban Green. 2018, 31, 67–78. [Google Scholar] [CrossRef]
- Li, J.; Zhang, Z.; Jing, F.; Gao, J.; Ma, J.; Shao, G.; Noel, S. An evaluation of urban green space in Shanghai, China, using eye tracking. Urban For. Urban Green. 2020, 56, 126903. [Google Scholar] [CrossRef]
- Nordh, H.; Hagerhall, C.M.; Holmqvist, K. Tracking Restorative Components: Patterns in Eye Movements as a Consequence of a Restorative Rating Task. Landsc. Res. 2013, 38, 101–116. [Google Scholar] [CrossRef]
- Cottet, M.; Vaudor, L.; Tronchère, H.; Roux-Michollet, D.; Augendre, M.; Brault, V. Using gaze behavior to gain insights into the impacts of naturalness on city dwellers’ perceptions and valuation of a landscape. J. Environ. Psychol. 2018, 60, 9–20. [Google Scholar] [CrossRef]
- Lisińska-Kuśnierz, M.; Krupa, M. Suitability of Eye Tracking in Assessing the Visual Perception of Architecture—A Case Study Concerning Selected Projects Located in Cologne. Buildings 2020, 10, 20. [Google Scholar] [CrossRef] [Green Version]
- Shao, H. Landscape Quality Evaluation of Coal Mining Collapsed Land Based on Eye-Movement Analysis: A Case Study of Xuzhou City. Master’s Thesis, China University of Mining and Technology, Beijing, China, 2018. (In Chinese). [Google Scholar]
- Wang, M. Research on the Eye Analysis Techniques Used in the Visual Quality Evaluation of Landscape: A Case Study of the Landscape of Danxia Landform, Sunan, Gansu. Master’s Thesis, Nanjing University, Nanjing, China, 2011. (In Chinese). [Google Scholar]
- Zeng, X.Y. A Dissertation Submitted in Partial Fulfillment of the Requirements for the Degree of. Master of Landscape Architecture. Master’s Thesis, Huazhong University of Science and Technology, Wuhan, China, 2017. (In Chinese). [Google Scholar]
- Franěk, M.; Petružálek, J.; Šefara, D. Eye-movements in viewing urban images and natural images in diverse vegetation periods. Urban For. Urban Green. 2019, 46, 126477. [Google Scholar] [CrossRef]
- Dupont, L.; Antrop, M.; Van Eetvelde, V. Does landscape related expertise influence the visual perception of landscape photographs? Implications for participatory landscape planning and management. Landsc. Urban Plan. 2015, 141, 68–77. [Google Scholar] [CrossRef] [Green Version]
- Sun, L.; Shao, H.; Li, S.; Huang, X.; Yang, W. Integrated Application of Eye Movement Analysis and Beauty Estimation in the Visual Landscape Quality Estimation of Urban Waterfront Park. Int. J. Pattern Recognit. Artif. Intell. 2018, 32, 1856010. [Google Scholar] [CrossRef]
- Huang, A.S.-H.; Lin, Y.-J. The effect of landscape colour, complexity and preference on viewing behaviour. Landsc. Res. 2019, 45, 214–227. [Google Scholar] [CrossRef]
- Hands, D.E.; Brown, R. Enhancing visual preference of ecological rehabilitation sites. Landsc. Urban Plan. 2002, 58, 57–70. [Google Scholar] [CrossRef] [Green Version]
- Glaholt, M.G.; Wu, M.C.; Reingold, E.M. Predicting Preference from Fixations. PsychNology. J. 2009, 7, 141–158. [Google Scholar] [CrossRef]
- Guo, S.; Zhao, N.; Zhang, J.; Xue, T.; Liu, P.; Xu, S.; Xu, D. Landscape visual quality assessment based on eye-movement: College student eye-tracking experiments on tourism landscape pictures. Resour. Sci. 2017, 39, 1137–1147. (In Chinese) [Google Scholar]
- Kim, M.; Kang, Y.; Abu Bakar, S. A nightscape preference study using eye-movement analysis. Int. J. Sustain. Trop. Des. Res. Pract. 2013, 6, 85–99. [Google Scholar]
- Berto, R.; Massaccesi, S.; Pasini, M. Do eye movements measured across high and low fascination photographs differ? Addressing Kaplan’s fascination hypothesis. J. Environ. Psychol. 2008, 28, 185–191. [Google Scholar] [CrossRef]
- Rubin, E. Visuell Wahrgenommene Figuren; Glydenalske Boghandel: Kobenhaven, Denmark, 1921. [Google Scholar]
- Zhang, T.; Luo, T.; Gan, Y.; Qiu, Q. Effects of visual characteristics of landscape elements on perceptual priority. Res. Environ. Sci. 2012, 25, 297–303. (In Chinese) [Google Scholar]
- Rahnema, S.; Sedaghathoor, S.; Allahyari, M.S.; Damalas, C.A.; El Bilali, H. Preferences and emotion perceptions of ornamental plant species for green space designing among urban park users in Iran. Urban For. Urban Green. 2019, 39, 98–108. [Google Scholar] [CrossRef]
- Khachatryan, H.; Rihn, A.; Hansen, G.; Clem, T. Landscape Aesthetics and Maintenance Perceptions: Assessing the Relationship between Homeowners’ Visual Attention and Landscape Care Knowledge. Land Use Policy 2020, 95, 104645. [Google Scholar] [CrossRef]
- Dupont, L.; Ooms, K.; Antrop, M.; Van Eetvelde, V. Comparing saliency maps and eye-tracking focus maps: The potential use in visual impact assessment based on landscape photographs. Landsc. Urban Plan. 2016, 148, 17–26. [Google Scholar] [CrossRef]
- De Lucio, J.; Mohamadian, M.; Ruiz, J.; Banayas, J.; Bernaldez, F. Visual landscape exploration as revealed by eye movement tracking. Landsc. Urban Plan. 1996, 34, 135–142. [Google Scholar] [CrossRef]
- Sevenant, M.; Antrop, M. Landscape Representation Validity: A Comparison between On-site Observations and Photographs with Different Angles of View. Landsc. Res. 2011, 36, 363–385. [Google Scholar] [CrossRef]
- Lappi, O. Eye Tracking in the Wild: The Good, the Bad and the Ugly. J. Eye Mov. Res. 2015, 8, 1–21. [Google Scholar] [CrossRef]
- Wu, X.; Chen, S.; Zhao, R. Analysis of impact factors on forest park passenger flow based on baidu index. For. Resour. Manag. 2017, 1, 27. (In Chinese) [Google Scholar]
- Sui, X.; Gao, M.; Xiang, H.W. (Eds.) Eye-Movement Theory and Empirical Research in Visual Cognition; Beijing-Science Press: Beijing, China, 2018. (In Chinese) [Google Scholar]
- Jin, H.; Murakawa, S.; Nishina, D. Study on recognition and fixation behavior for river-landscape by the subjects of Chinese, Japanese and European. J. Archit. Plan. 2002, 67, 71–78. [Google Scholar] [CrossRef] [Green Version]
- Lin, Y.; Ye, X. Landscape elements of Chinese classical gardens. Mod. Gard. 2014, 14, 127. (In Chinese) [Google Scholar]
- Liu, Y.; Hu, M.; Zhao, B. Audio-visual interactive evaluation of the forest landscape based on eye-tracking experiments. Urban For. Urban Green. 2019, 46, 126476. [Google Scholar] [CrossRef]
- Yukio, N. Urban landscape planning: Methods and practices of landscape control in Europe and America. Urban Plan. J. 2005, 3, 35. (In Chinese) [Google Scholar]
- Xu, S. Research on Image Complexity Based on Color Feature. Master’s Thesis, Henan University, Kaifeng, China, 2016. [Google Scholar]
- Lu, S.; Wang, B. An image retrieval algorithm based on improved color histogram. J. Phys. Conf. Ser. 2019, 1176, 022039. [Google Scholar] [CrossRef]
- Edelsbrunner, H.; Seidel, R. Voronoi diagrams and arrangements. Discret. Comput. Geom. 1986, 1, 25–44. [Google Scholar] [CrossRef]
- Liu, M.; Nijhuis, S. Mapping landscape spaces: Methods for understanding spatial-visual characteristics in landscape design. Environ. Impact Assess. Rev. 2020, 82, 106376. [Google Scholar] [CrossRef]
- Nordh, H.; Hartig, T.; Hagerhall, C.; Fry, G. Components of small urban parks that predict the possibility for restoration. Urban For. Urban Green. 2009, 8, 225–235. [Google Scholar] [CrossRef]
- Yan, G.L.; Bai, X.J. General Introduction to the Eye Movement Research: A Magic Science to Explore the Mystery of the Window on Mind; Beijing-Science Press: Beijing, China, 2012. (In Chinese) [Google Scholar]
- Swap, W.C. Interpersonal Attraction and Repeated Exposure to Rewarders and Punishers. Pers. Soc. Psychol. Bull. 1977, 3, 248–251. [Google Scholar] [CrossRef]
- Liu, Y.; Hu, M.; Zhao, B. Interactions between forest landscape elements and eye movement behavior under audio-visual integrated conditions. J. For. Res. 2019, 25, 21–30. [Google Scholar] [CrossRef]
- Berg, A.E.V.D.; Joye, Y.; Koole, S.L. Why viewing nature is more fascinating and restorative than viewing buildings: A closer look at perceived complexity. Urban For. Urban Green. 2016, 20, 397–401. [Google Scholar] [CrossRef]
Figure 1.
The locations of the study sites. (A): Shenyang National Forest Park is located in eastern Shenyang and has a forest coverage rate as high as 96%. Natural secondary forests and deciduous broadleaved trees constitute the majority of the elements. (B): Hemu National Forest Park is located in southeastern Fushun, Liaoning Province. The vegetation is mainly planted larch forest and Korean pine. (C): Greenstone Valley National Forest Park in Benxi is a typical natural scenic spot with a forest coverage rate of 90%. Typical landscapes in autumn include maple forests and lake views. (D): The “Liberated Forest” in Caohekou, Benxi, is the first artificially planted Korean pine forest in China. (E): Phoenix Mountain National Scenic Area is located in southeastern Fengcheng and has magnificent mountains and abundant waterfall resources. It is famous for its mountains and maple forests in autumn. It is a typical scenic spot in eastern Liaoning.

Figure 2.
Schematic diagram of the experiment. (A): Experimental flow chart of the eye-tracking experiment. (B): The eye-tracking experiment site. (C): PowerPoint playback diagram in the eye-tracking experiment. (D,E): Cognitive preferences survey site.
Figure 2.
Schematic diagram of the experiment. (A): Experimental flow chart of the eye-tracking experiment. (B): The eye-tracking experiment site. (C): PowerPoint playback diagram in the eye-tracking experiment. (D,E): Cognitive preferences survey site.

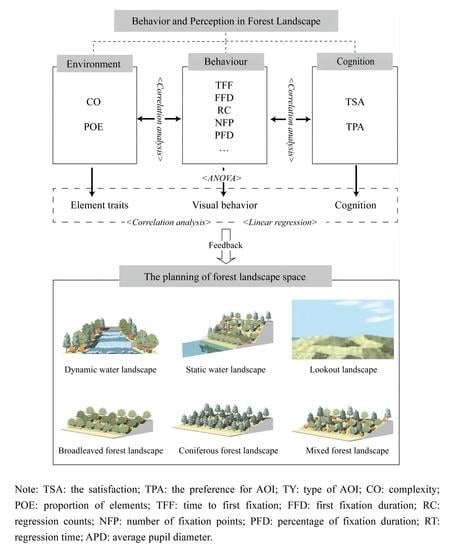
Figure 3.
The overall framework of the paper. TSA: the satisfaction; TPA: the preference for AOI; TY: AOI type; CO: complexity; POE: proportion of elements; TFF: time to first fixation; FFD: first fixation duration; RC: regression count; NFP: number of fixation points; PFD: percentage of fixation duration; RT: regression time; APD: average pupil diameter.

Figure 4.
Fixation point distribution of various elements in the forest landscape spaces. In the Voronoi diagram, when the points are uniformly distributed, the adjacent Voronoi polygons have the same size. When the points are aggregated, the Voronoi polygons have different sizes, smaller in the aggregation area and larger outside the aggregation area. When the points are randomly distributed, the Voronoi polygon sizes are between uniform distribution and aggregate distribution. (1): dynamic water landscape; (2): static water landscape; (3): lookout landscape; (4): broadleaved forest landscape; (5): coniferous forest landscape; (6): mixed forest landscape; (A): original map; (B): Voronoi distribution map of fixation points; (C): AOI map.

Figure 5.
Comparison of eye-movement indexes for various landscape elements in the forest landscapes. (A): The box plot of time to first fixation; (B): The box plot of first fixation duration; (C): The box plot of regression count; (D): The box plot of number of fixation points; (E): The box plot of percentage of fixation duration; (F): The box plot of regression time; (G): The box plot of average pupil diameter. *. significant at the 5% level, **. significant at the 1% level, ns: no significant difference. TR: trees; BU: bushes; GC: ground cover; TE: terrain; WA: waterscape; ST: structure; SK: sky; FO: foreground; DV: distant view.

Figure 6.
Favourite landscape elements in forest landscape spaces. DWL: dynamic water landscape; SWL: static water landscape; LL: lookout landscape; BFL: broadleaved forest landscape; CFL: coniferous forest landscape; MFL: mixed forest landscape. TR: trees; BU: bushes; GC: ground cover; TE: terrain; WA: waterscape; ST: structure; SK: sky; FO: foreground; DV: distant view.

Figure 7.
The model diagram of multivariate linear regression was established by element characteristics, cognitive preference indicators, and eye-movement indicators. TSA: the satisfaction; TPA: the preference for AOI; CO: complexity; POE: proportion of elements; TFF: time to first fixation; FFD: first fixation duration; RC: regression count; NFP: number of fixation points; PFD: percentage of fixation duration; RT: regression time; APD: average pupil diameter.

Figure 8.
Forest landscape formation and planning proposals.


Table 1.
The meanings of eye-movement indicators.
| Eye-Movement Indexes | Abbreviation | Significance |
|---|---|---|
| Time to first fixation/(ms) | TFF | Refers to the time point of first looking at an AOI when viewing a picture, reflecting how quickly the participant is attracted to a certain AOI. |
| First fixation duration/(ms) | FFD | Refers to the duration of the first fixation on the AOI, which best reflects the early processing state when viewing pictures. |
| Regression count/(count) | RC | Refers to the number of times that the AOI was viewed again after the first gaze, which reflects the participant’s reprocessing of the previous picture information. |
| Number of fixation points/(count) | NFP | Refers to the total number of gaze points in the AOI, effectively reflecting the cognitive processing load of or degree of interest in the AOI; AOIs with greater cognitive load or more interest have more viewing points. |
| Percentage of fixation duration/(%) | PFD | Refers to the ratio of the total fixation time on the AOI to the total fixation time on the whole picture and is an effective index of fixation on the region of interest accounting for the total fixation process. |
| Regression time/(ms) | RT | Refers to the sum of all gaze time spent looking back to the current AOI and reflects the postprocessing of the picture. |
| Average pupil diameter/(mm) | APD | Refers to the average pupil diameter while viewing the AOI, reflecting the cognitive processing degree and cognitive load of the participant. |
Table 2.
The meanings of cognitive perception evaluation indicators.
| Cognitive Preference Indexes | Abbreviation | Significance |
|---|---|---|
| The satisfaction | TSA | How satisfied are you with this landscape |
| The preferences of AOI | TPA | What are your favourite landscape elements |
Table 3.
Classification of constituent elements in various types of forest landscape space.
| Type of Landscape Space | Construction Elements of the Space |
|---|---|
| Dynamic water landscape | Trees, terrain, waterscape, structures |
| Static water landscape | Sky, terrain, waterscape, structures |
| Lookout landscape | Sky, foreground, distant view, structures |
| Broadleaved forest landscape | Trees, ground cover, structures |
| Coniferous forest landscape | Trees, ground cover |
| Mixed forest landscape | Trees, bushes, ground cover, structures |
Table 4.
VBSs and characteristics of landscape elements in forest spaces.
| Spatial Type | Type of AOI | Complexity | Proportion | Visual Behaviour Score |
|---|---|---|---|---|
| DWL | Trees | 0.922 | 65.400 | 0.742 |
| Terrains | 0.219 | 11.400 | −0.511 | |
| Waterscape | 0.303 | 20.600 | 0.269 | |
| Structures | 0.053 | 2.600 | −0.500 | |
| SWL | Terrains | 0.275 | 24.800 | 0.341 |
| Waterscape | 0.352 | 39.600 | 0.212 | |
| Structures | 0.027 | 1.200 | −0.339 | |
| Sky | 0.022 | 34.400 | −0.215 | |
| LL | Structures | 0.001 | 2.600 | −0.020 |
| Sky | 0.001 | 46.900 | −0.297 | |
| Foreground | 0.751 | 34.400 | 0.700 | |
| Distant view | 0.010 | 8.100 | 0.160 | |
| BFL | Trees | 0.722 | 52.900 | 0.359 |
| Ground cover | 0.727 | 41.300 | 0.453 | |
| Structures | 0.177 | 6.700 | −0.813 | |
| CFL | Trees | 0.794 | 66.500 | 0.322 |
| Ground cover | 0.470 | 33.500 | −0.322 | |
| MFL | Trees | 0.647 | 49.200 | 0.556 |
| Bushes | 1.309 | 48.400 | 0.838 | |
| Ground cover | 0.096 | 1.700 | −0.703 | |
| Structures | 0.023 | 0.700 | −0.695 |
DWL: dynamic water landscape; SWL: static water landscape; LL: lookout landscape; BFL: broadleaved forest landscape; CFL: coniferous forest landscape; MFL: mixed forest landscape.
Table 5.
Correlation analysis of element characteristics, AOI preferences, and eye-movement indicators.
Table 5.
Correlation analysis of element characteristics, AOI preferences, and eye-movement indicators.
| TFF | FFD | RC | NFP | PFD | RT | APD | TPA | TSA | ||
|---|---|---|---|---|---|---|---|---|---|---|
| Spearman’s rho | CO | 0.020 | 0.430 ** | 0.639 ** | 0.735 ** | 0.557 ** | 0.715 ** | 0.435 ** | 0.259 ** | −0.148 ** |
| POE | −0.031 | 0.406 ** | 0.565 ** | 0.658 ** | 0.667 ** | 0.635 ** | 0.418 ** | 0.309 ** | −0.088 ** | |
| TSA | 0.072 * | 0.012 | −0.133 ** | −0.057 | −0.027 | −0.077 ** | −0.059 | 0.175 ** | 1.000 | |
| TPA | 0.049 | 0.212 ** | 0.215 ** | 0.300 ** | 0.318 ** | 0.264 ** | 0.228 ** | 1.000 | 0.175 ** | |
| N | 1110 | 1110 | 1110 | 1110 | 1110 | 1110 | 1110 | 1110 | 1110 | |
* Correlation is significant at the 0.05 level (2-tailed). ** Correlation is significant at the 0.01 level (2-tailed). TSA: the satisfaction; TPA: the preference for AOI; CO: complexity; POE: proportion of elements; TFF: time to first fixation; FFD: first fixation duration; RC: regression count; NFP: number of fixation points; PFD: percentage of fixation duration; RT: regression time; APD: average pupil diameter.
Publisher’s Note: MDPI stays neutral with regard to jurisdictional claims in published maps and institutional affiliations. |
© 2022 by the authors. Licensee MDPI, Basel, Switzerland. This article is an open access article distributed under the terms and conditions of the Creative Commons Attribution (CC BY) license (https://creativecommons.org/licenses/by/4.0/).
Share and Cite
MDPI and ACS Style
Zhou, S.; Gao, Y.; Zhang, Z.; Zhang, W.; Meng, H.; Zhang, T. Visual Behaviour and Cognitive Preferences of Users for Constituent Elements in Forest Landscape Spaces. Forests 2022, 13, 47. https://0-doi-org.brum.beds.ac.uk/10.3390/f13010047
AMA Style
Zhou S, Gao Y, Zhang Z, Zhang W, Meng H, Zhang T. Visual Behaviour and Cognitive Preferences of Users for Constituent Elements in Forest Landscape Spaces. Forests. 2022; 13(1):47. https://0-doi-org.brum.beds.ac.uk/10.3390/f13010047
Chicago/Turabian StyleZhou, Sitong, Yu Gao, Zhi Zhang, Weikang Zhang, Huan Meng, and Tong Zhang. 2022. "Visual Behaviour and Cognitive Preferences of Users for Constituent Elements in Forest Landscape Spaces" Forests 13, no. 1: 47. https://0-doi-org.brum.beds.ac.uk/10.3390/f13010047
Note that from the first issue of 2016, this journal uses article numbers instead of page numbers. See further details here.