
Characterizing Global Fire Regimes from Satellite-Derived Products
by
 , , , , ,
Mariano García
1,* ,
,
M. Lucrecia Pettinari
1,
Emilio Chuvieco
1 ,
,
Javier Salas
1,
Florent Mouillot
2,
Wentao Chen
2 and
Inmaculada Aguado
1 1
Universidad de Alcalá, Departamento de Geología, Geografía y Medio Ambiente, Environmental Remote Sensing Research Group, Calle Colegios 2, 28801 Alcalá de Henares, Spain
2
CEFE, CNRS, IRD, EPHE, University of Montpellier, 34293 Montpellier, France
*
Author to whom correspondence should be addressed.
Forests 2022, 13(5), 699; https://0-doi-org.brum.beds.ac.uk/10.3390/f13050699
Submission received: 14 March 2022
/
Revised: 22 April 2022
/
Accepted: 24 April 2022
/
Published: 29 April 2022
(This article belongs to the Special Issue Using Remote Sensing to Monitor Forest Fire Behavior and Forest Landscape)
Abstract
:We identified four global fire regimes based on a k-means algorithm using five variables covering the spatial, temporal and magnitude dimensions of fires, derived from 19-year long satellite burned area and active fire products. Additionally, we assessed the relation of fire regimes to forest fuels distribution. The most extensive fire regime (35% of cells having fire activity) was characterized by a long fire season, medium size fire events, small burned area, high intensity and medium variability. The next most extensive fire regime (25.6%) presented a long fire season, large fire events and the highest mean burned area, yet it showed the lowest intensity and the least variability. The third group (22.07%) presented a short fire season, the lowest burned area, with medium-low intensity, the smallest fire patches and large variability. The fourth group (17.3%) showed the largest burned area with large fire patches of moderate intensity and low variability. Fire regimes and fuel types showed a statistically significant relation (CC = 0.58 and CC’ = 0.67, p < 0.001), with most fuel types sustaining all fire regimes, although a clear prevalence was observed in some fuel types. Further efforts should be directed towards the standardization of the variables in order to facilitate comparison, analysis and monitoring of fire regimes and evaluate whether fire regimes are effectively changing and the possible drivers.
1. Introduction
Fire is a natural phenomenon that has been present on Earth for millions of years, shaping vegetation distribution and playing a key role in the structure, composition and functioning of terrestrial ecosystems, the carbon cycle and climate [1]. Fires can be considered as a multidimensional event whose attributes include the spatial, temporal and magnitude dimensions [2]. Spatial attributes include the average fire size of fire events and the total burned area; temporal attributes encompass the frequency, seasonality or recurrence; and the magnitude dimension includes intensity and severity [2,3]. The combination of these attributes over time in a given area determines its fire regime [4]. Importantly, there are constraints in the possible combination of such attributes limiting the type of fire regimes that can exist. These types of fire regimes were defined globally as pyromes, representing global units of fires [3].
A consistent and robust characterization of fire regimes is of great interest to increase our understanding of vegetation resilience, improve fuel management activities, preserve ecosystems’ ecological integrity, quantify fire emissions or appraise global trends in burned area [5,6,7]. This is particularly important in a changing context where global fire activity is expected to be altered [8]. A shift in fire regimes towards an increase in fire frequency and intensity, not only in fire-prone regions but also in areas not typically affected by fires in the past, has been suggested [9] as a result of global warming, fire management policies and land use changes [10]. However, those changes in fire activity can be very diverse, not only increasing in some regions, but decreasing in others, as a result of changes in precipitation or adoption of new agricultural practices [11,12]. Moreover, a great uncertainty subsists to predict future fire activity given the number of elements that control fire regimes [13].
Characterization of fire regimes is challenging because it implies a great diversity of variables (extent, causes, duration, seasonality, variability, severity, intensity, etc.), which are seldom available at global scale and for long periods of time [4,14]. Attempts to understand historical global fire patterns have been carried out utilizing fire and climate modeling combined with land cover and population [11], sedimentary charcoal records [15] and ice core samples [16]. Pechony and Shindell [11] identified a shift in the drivers of fire regime, from a pre-industrial period driven by precipitation, to an anthropogenic-driven post-industrial period and an expected change towards temperature-driven fire regimes this century. Moreno et al. [7] used Spanish national fire statistics on burned area and number of fires to identify changes in fire regimes in Spain based on a statistical time-series break point, which were mainly related to climate and land use, including fire suppression policies. These approaches, however, are limited by the availability of consistent and spatially explicit data.
Remote sensing provides the most robust means to characterize current fire regimes, especially at global scale, due to the systematic observation provided by satellite-borne sensors ensuring comparable observations in both space and time [17]. Two types of remotely sensed data are used for the characterization of fire regimes, namely burned area and active fire products. These products enable deriving spatial (e.g., fire patch size, burned area), temporal (e.g., frequency, recurrence) as well as magnitude (e.g., fire intensity, fire severity) attributes, necessary to characterize fire regimes. Additionally, remote sensing has demonstrated its potential to study fire regimes at different scales, including local [2], regional [18,19,20,21] and global studies [3,9,10,22,23,24]. Integration of remote sensing with socio-economic data has also been carried out due to the impact of anthropogenic activities such as fire ignition, fire suppression or fuel management, on fire regimes [10,25,26]. Early attempts to define fire regimes from remotely sensed data were limited by the short length of the time series available and the uncertainty of the products [10,27]. The former issue is currently less problematic with time series spanning more than 20/30 years, although uncertainty issues remain, mainly due to the lack of sensitivity of coarse resolution sensors to small fires, which can result in a notable underestimation of the burned area [28].
Appraisal of fire regimes from remotely sensed data at global scale has been generally based on gridded products at 0.5° spatial resolution. However, in recent years, global databases based on individual events have been developed [9,22,29,30]. They are commonly based on burned area products and apply spatial analysis to convert burned pixels to burned patches, which offer more detailed information and flexibility to study fire regimes. Delineation of individual events improves our understanding of actual fire events, facilitates the integration of different products and avoids common artifacts at the edge of tiled products. Moreover, deriving information of single fire events provides a more complete picture of fire variability regionally or globally, and improves the information on intra-annual variability (multi-season fires) [22]. Likewise, it allows obtaining information on fire properties not previously available such as daily fire spread rate, as well as distinguishing single large events from fire complexes, or linking this information with covariates such as meteorological data [22]. Despite the advantages of these individual fire databases, they generally lack some important information for fire regime characterization, like the one related to the intensity or severity of the fire events. In addition, the cut-off time parameter, measured in days, used to identify fire patches introduces additional uncertainty [31].
This research aims at identifying fire regimes globally from 19-year long satellite products. In addition, the relation of the identified fire regimes to global forest fuel types was evaluated. To achieve these objectives, an unsupervised k-means algorithm was applied to five fire attributes derived from global satellite remote sensing products. These attributes enabled the characterization of fire regimes according to their spatial, temporal and magnitude dimensions. Subsequently, the relation of the discriminated fire regimes with fuel types was assessed.
2. Materials and Methods
2.1. Remote Sensing Products
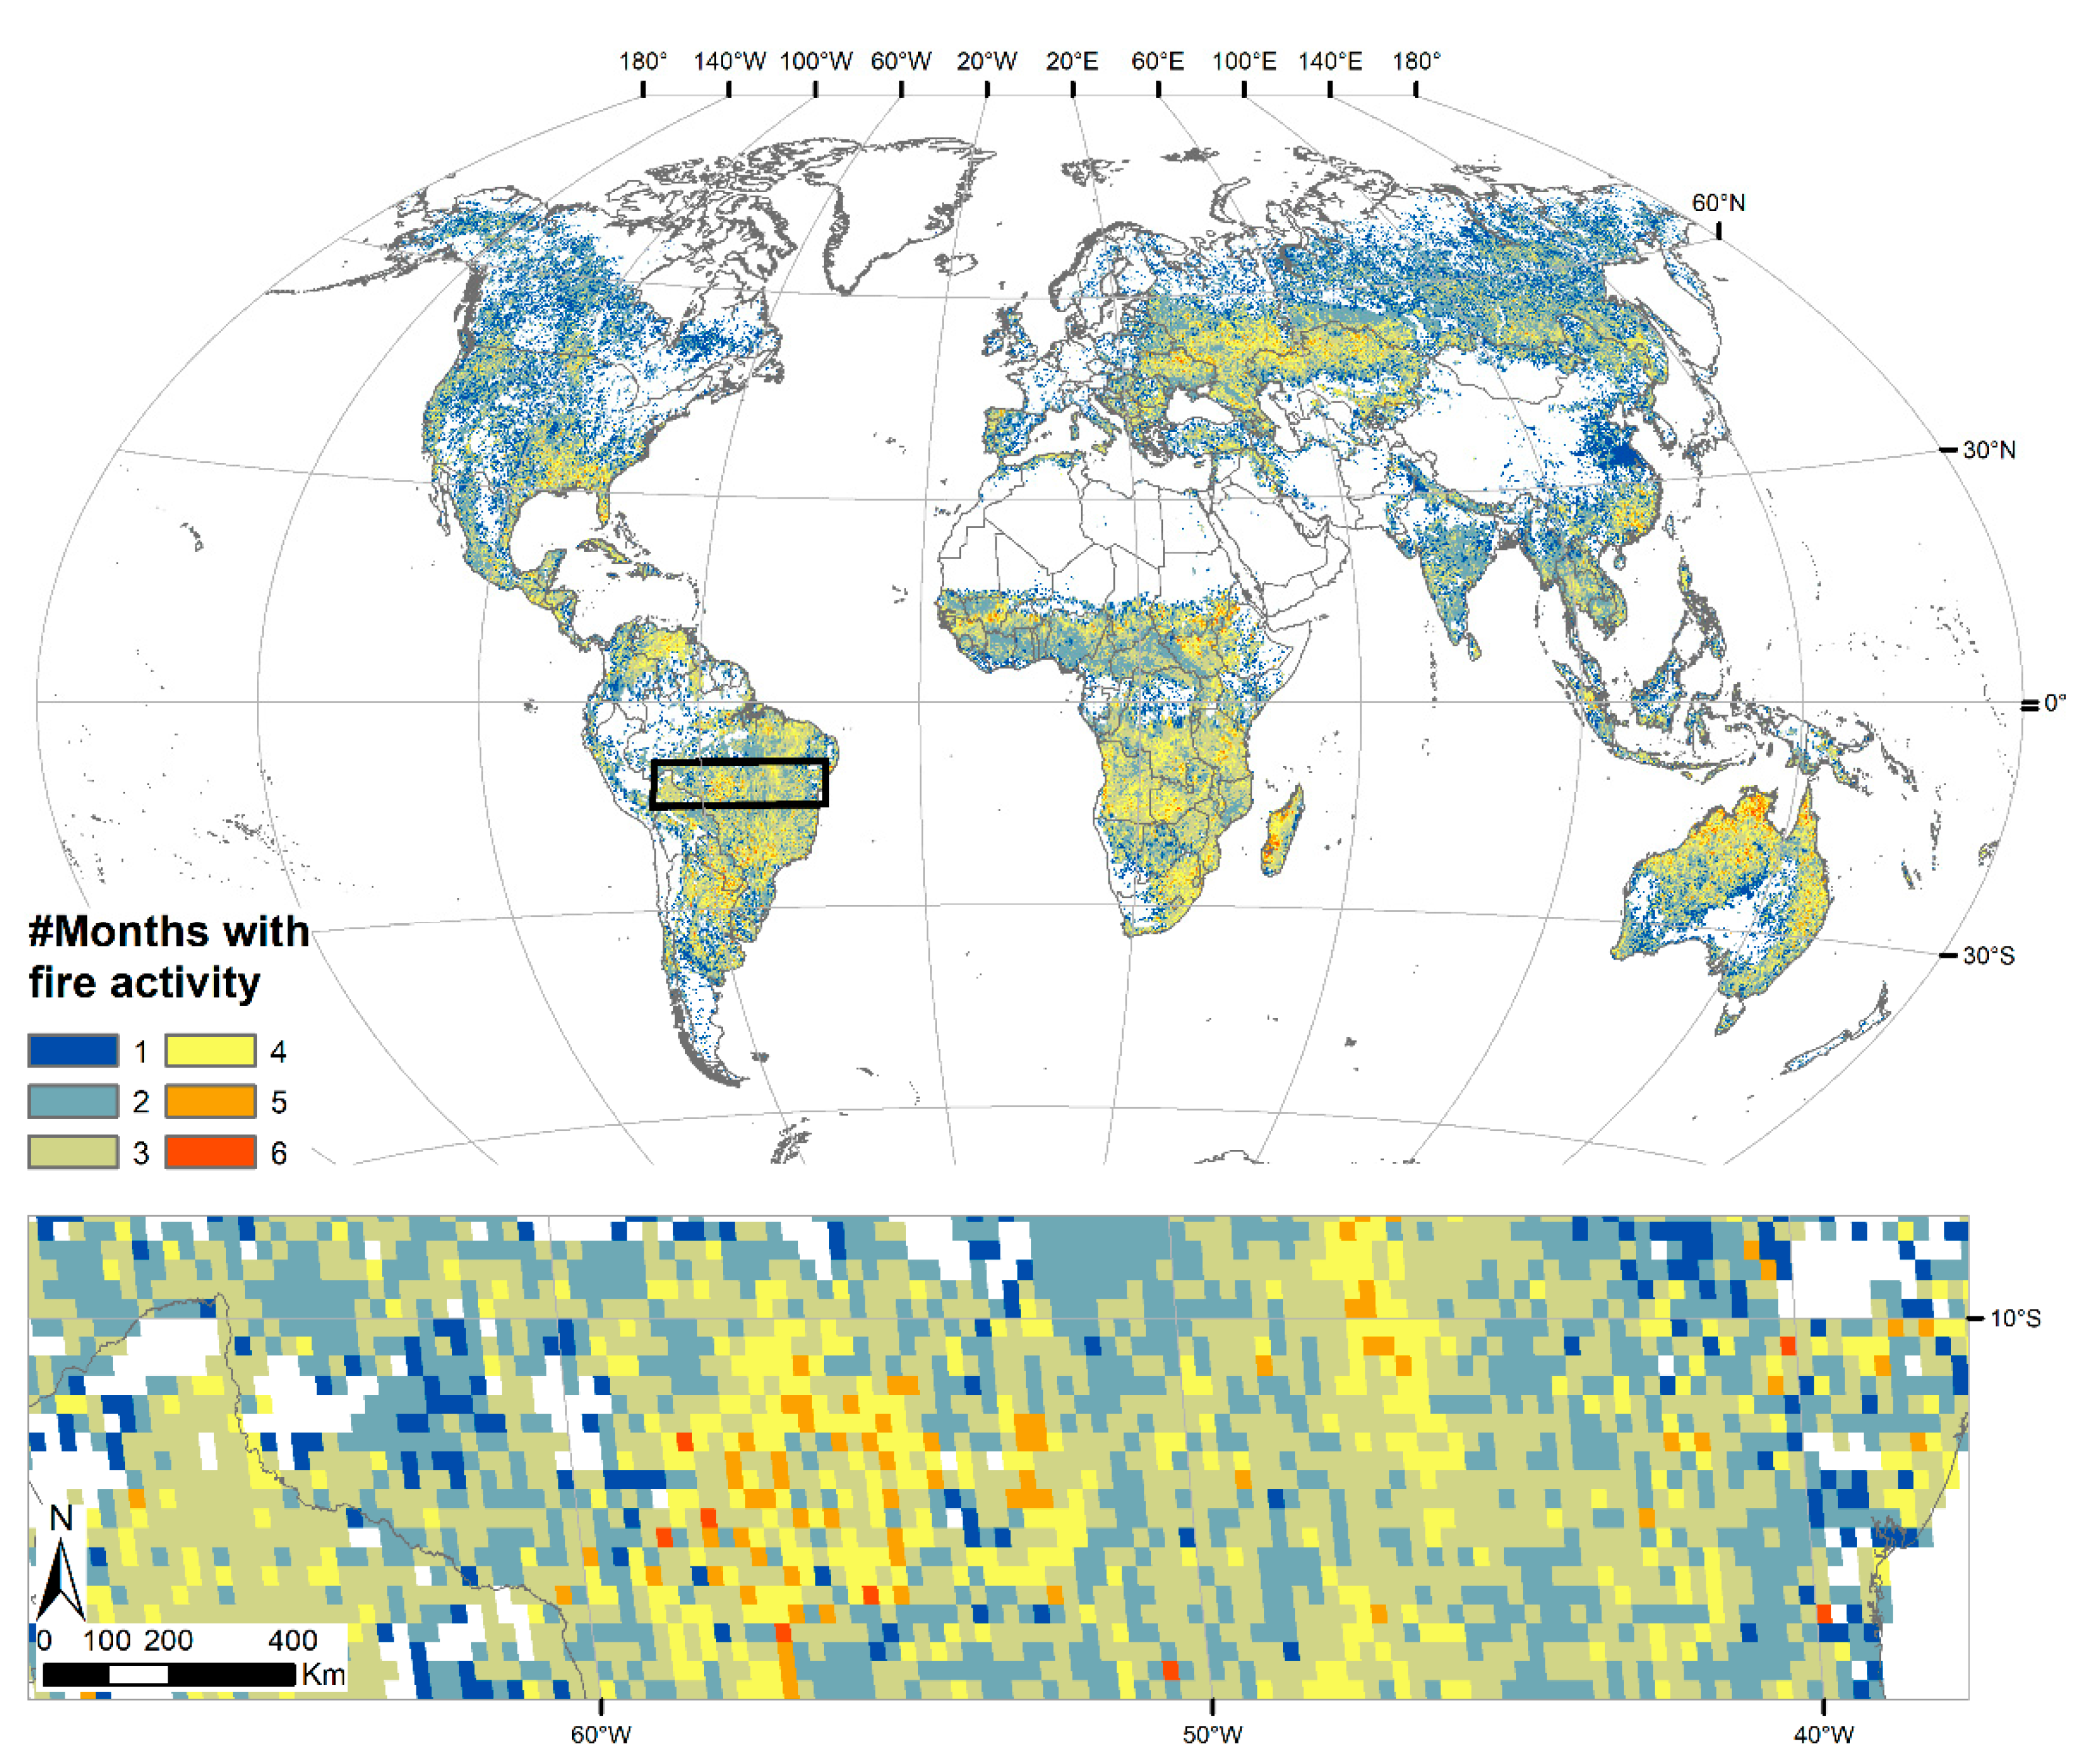
Our characterization of global fire regimes was based on different fire traits obtained at 0.25° spatial resolution, representing different attributes of fires in the spatial, temporal and magnitude dimensions (Appendix A). The spatial attributes encompass average fire size (AFS), annual mean burned area (AMBA) and the coefficient of variation of the burned area (CVBA). The temporal dimension was represented through the number of months for which at least 10% of the grid was burned (#Months). Finally, the ecological impact or magnitude dimension was accounted for through the fire radiative power (FRP), which is a measure of the radiant energy released per unit time from biomass burning [32]. The source of the first four parameters (AFS, AMBA, CVBA and #Months) was the FireCCI51 burned area product, developed as part of the European Space Agency Climate Change Initiative. The FireCCI51 product was generated from MODIS 250 m reflectance data, complemented with 1 km active fires, and it is available from 2001 to 2020 (https://climate.esa.int/en/projects/fire/data/, accessed on 17 January 2022). The product was obtained from a hybrid algorithm applied to monthly composites of daily MODIS reflectances [33]. Omission and commission errors of this product are similar to other existing global burned area (BA) databases [33].
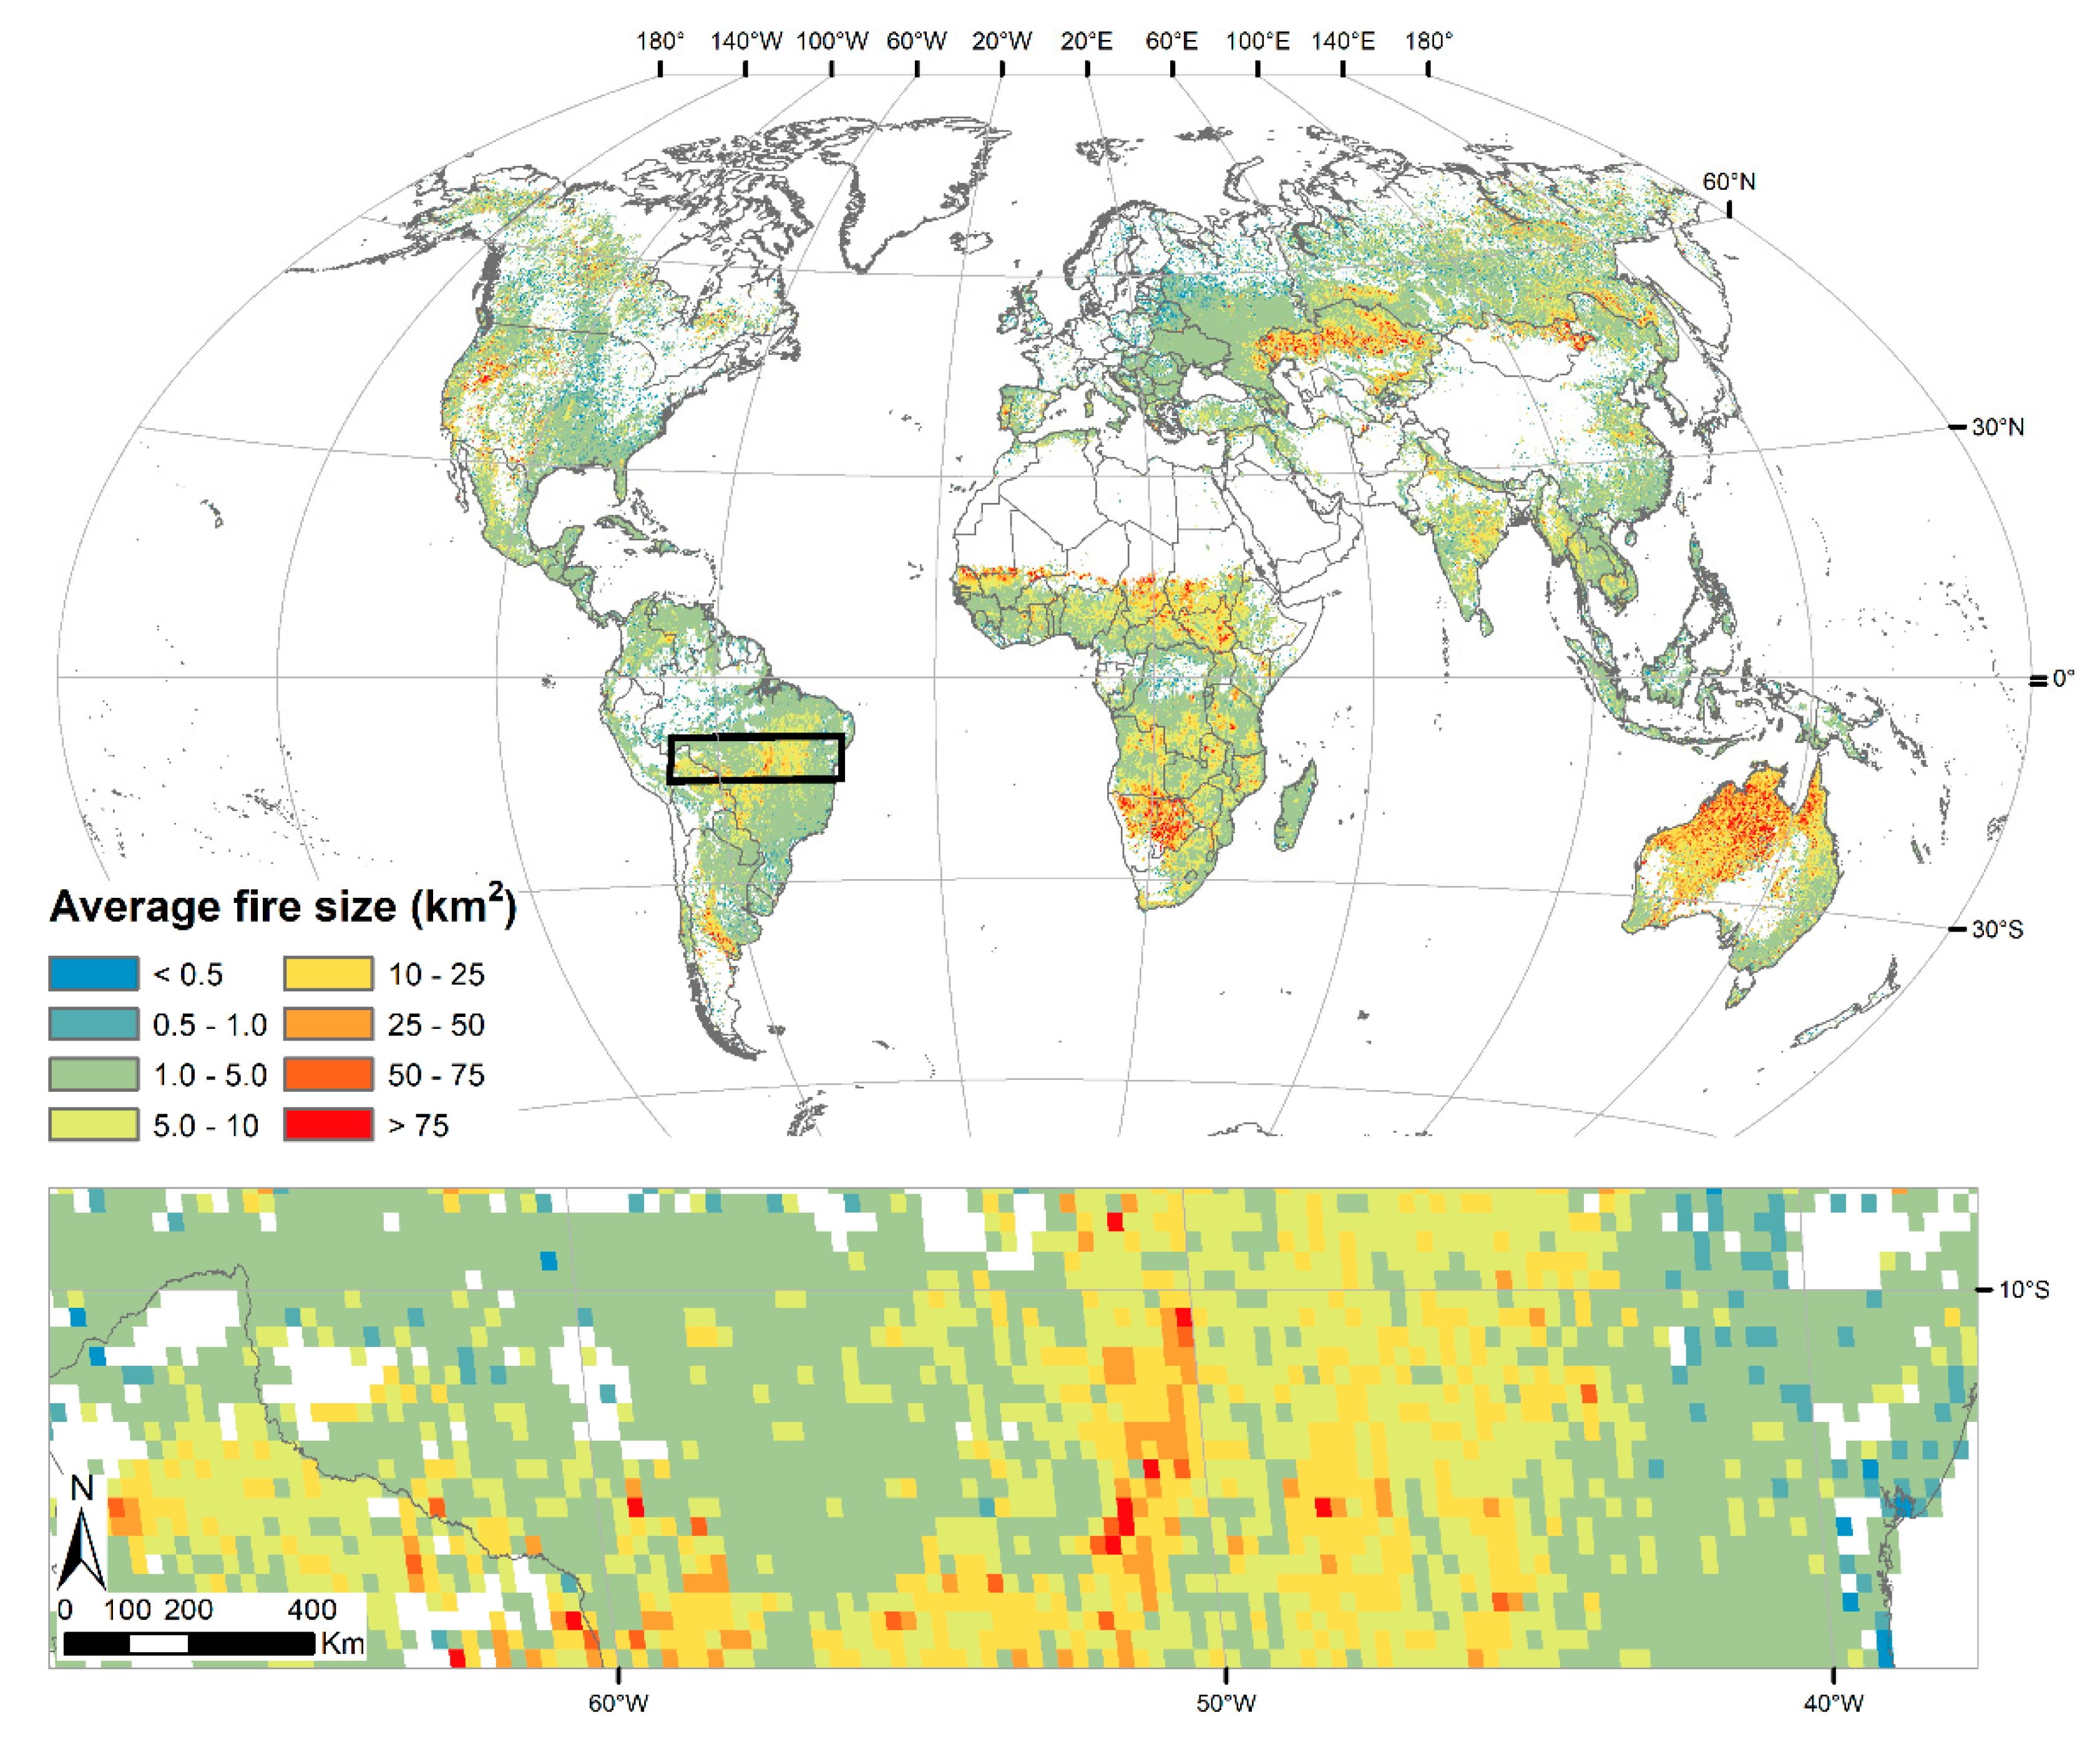
- AFS (Figure A1) is a key parameter determining the fire regime, which has been related to fuel continuity and fuel flammability [3], but also includes indirect information on fire management practices (as an active fire suppression or control policy will derive in generally smaller patches). For computing AFS, the 2001–2020 FireCCI51 pixel product (at 250 m spatial resolution) was converted to burned patches using a modified version of the algorithm developed by Oom et al. [34], using a cut-off of 6 days as the temporal threshold below which two neighboring pixels are considered as belonging to the same fire patch. This allows capturing fires simultaneously ignited in various starting points but merging into one single final burned patch. All fire patches smaller than four pixels (approx. 25 ha) were discarded from the analysis as they are the ones having the highest commission/omission errors [35].
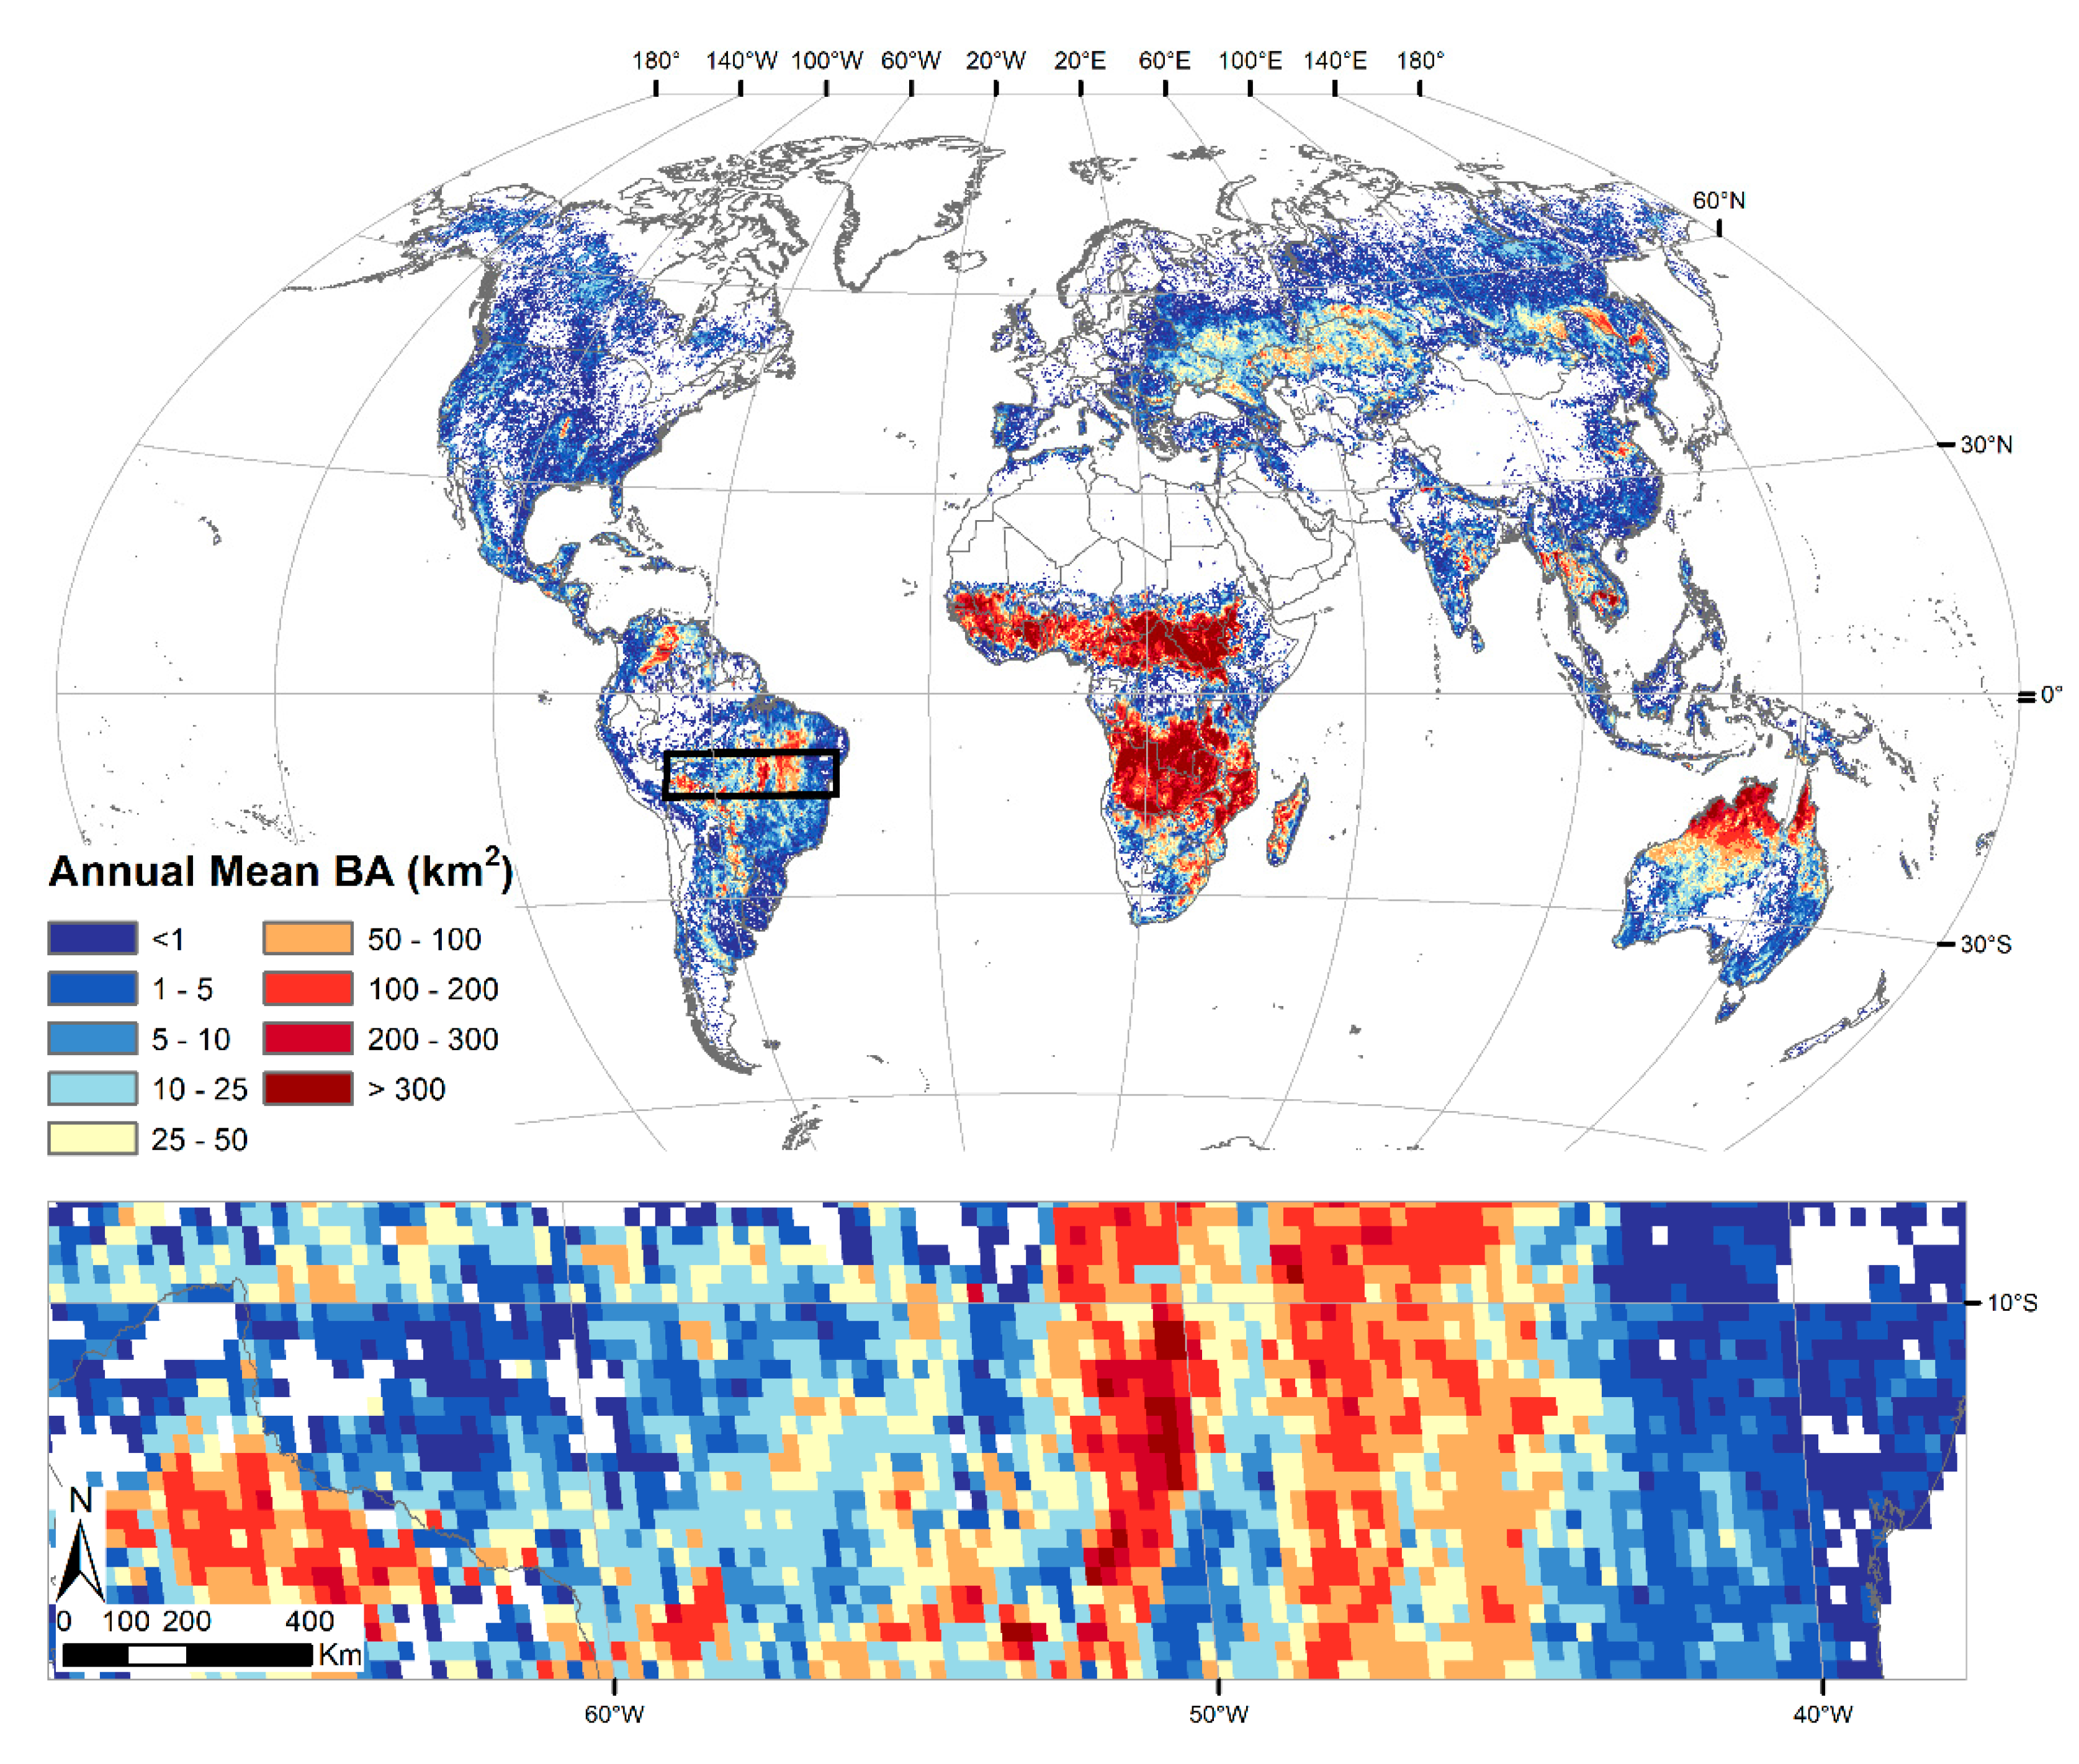
- AMBA (Figure A2) represents the total occurrence of fires within each grid and is also related to fuel continuity and flammability conditions, and was obtained as the mean value of the yearly BA in each grid cell.
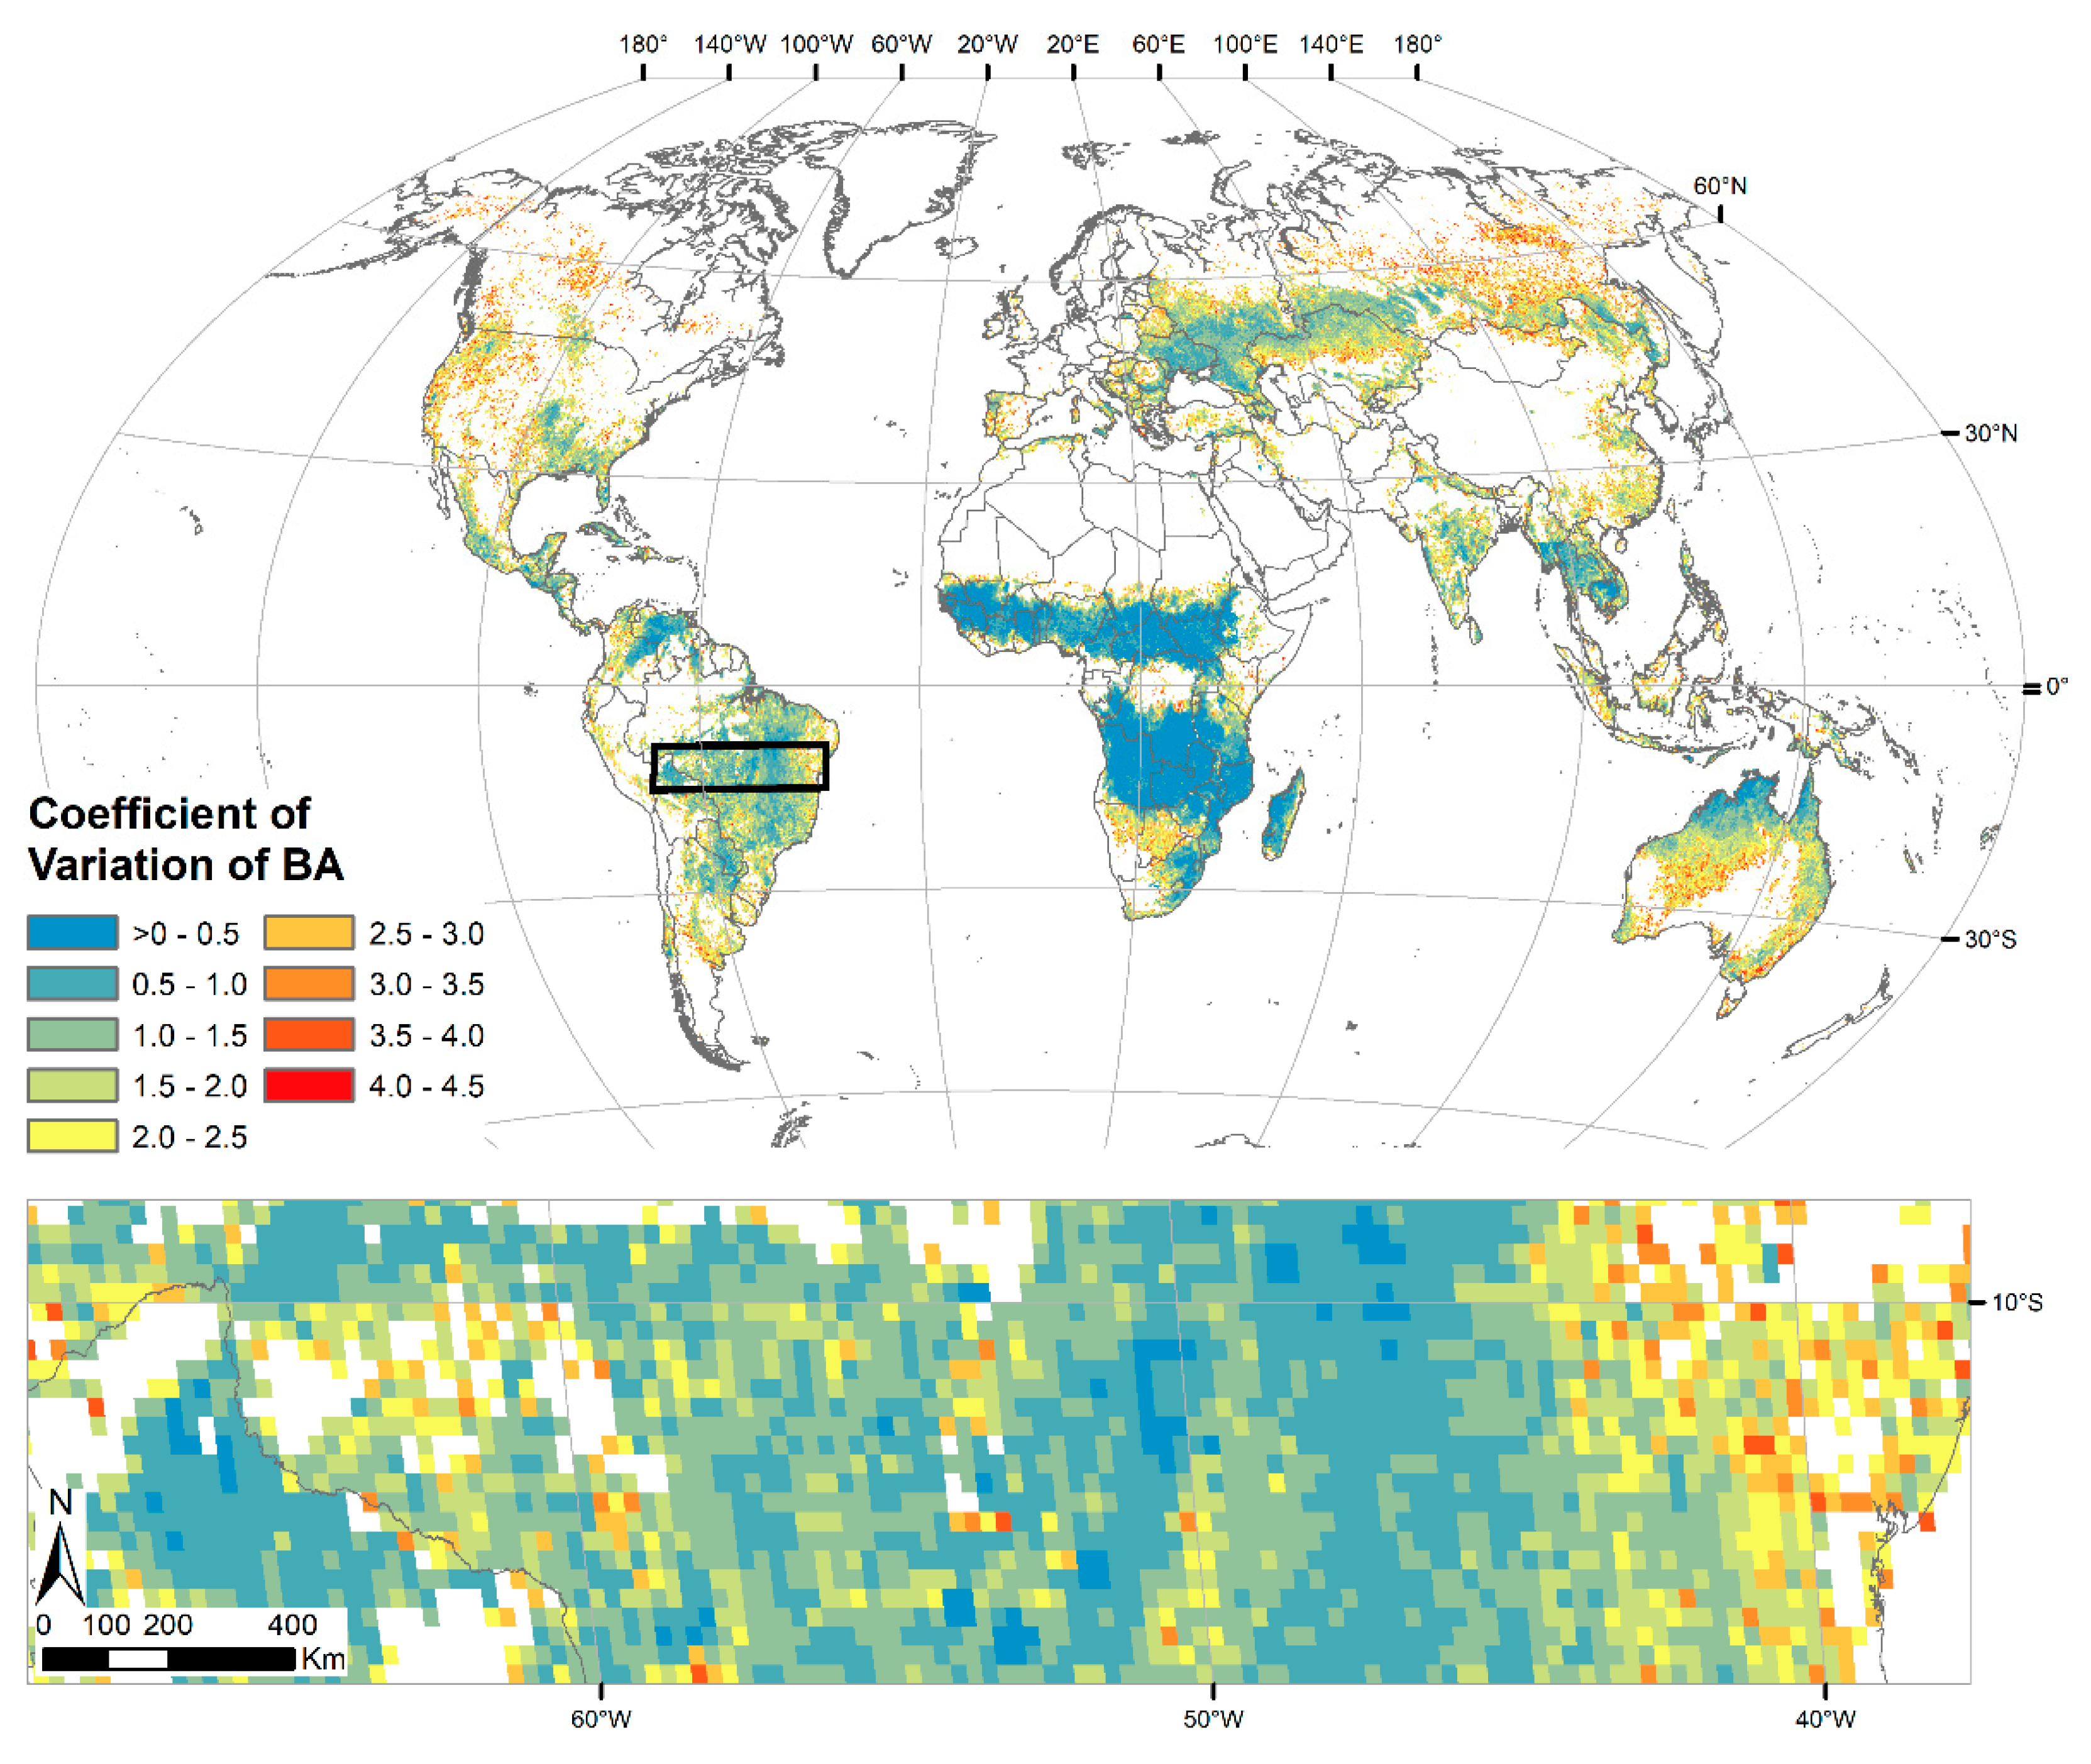
- CVBA (Figure A3) is an indicator of interannual variability (or alternatively, the persistency) of fires in a particular area [10]. This variable has been used as a surrogate of fire return interval, and indicates the impact of both climate cycles and anthropogenic fire use on fire occurrence [26]. It is calculated for each grid cell as the standard deviation of the yearly BA divided by AMBA.
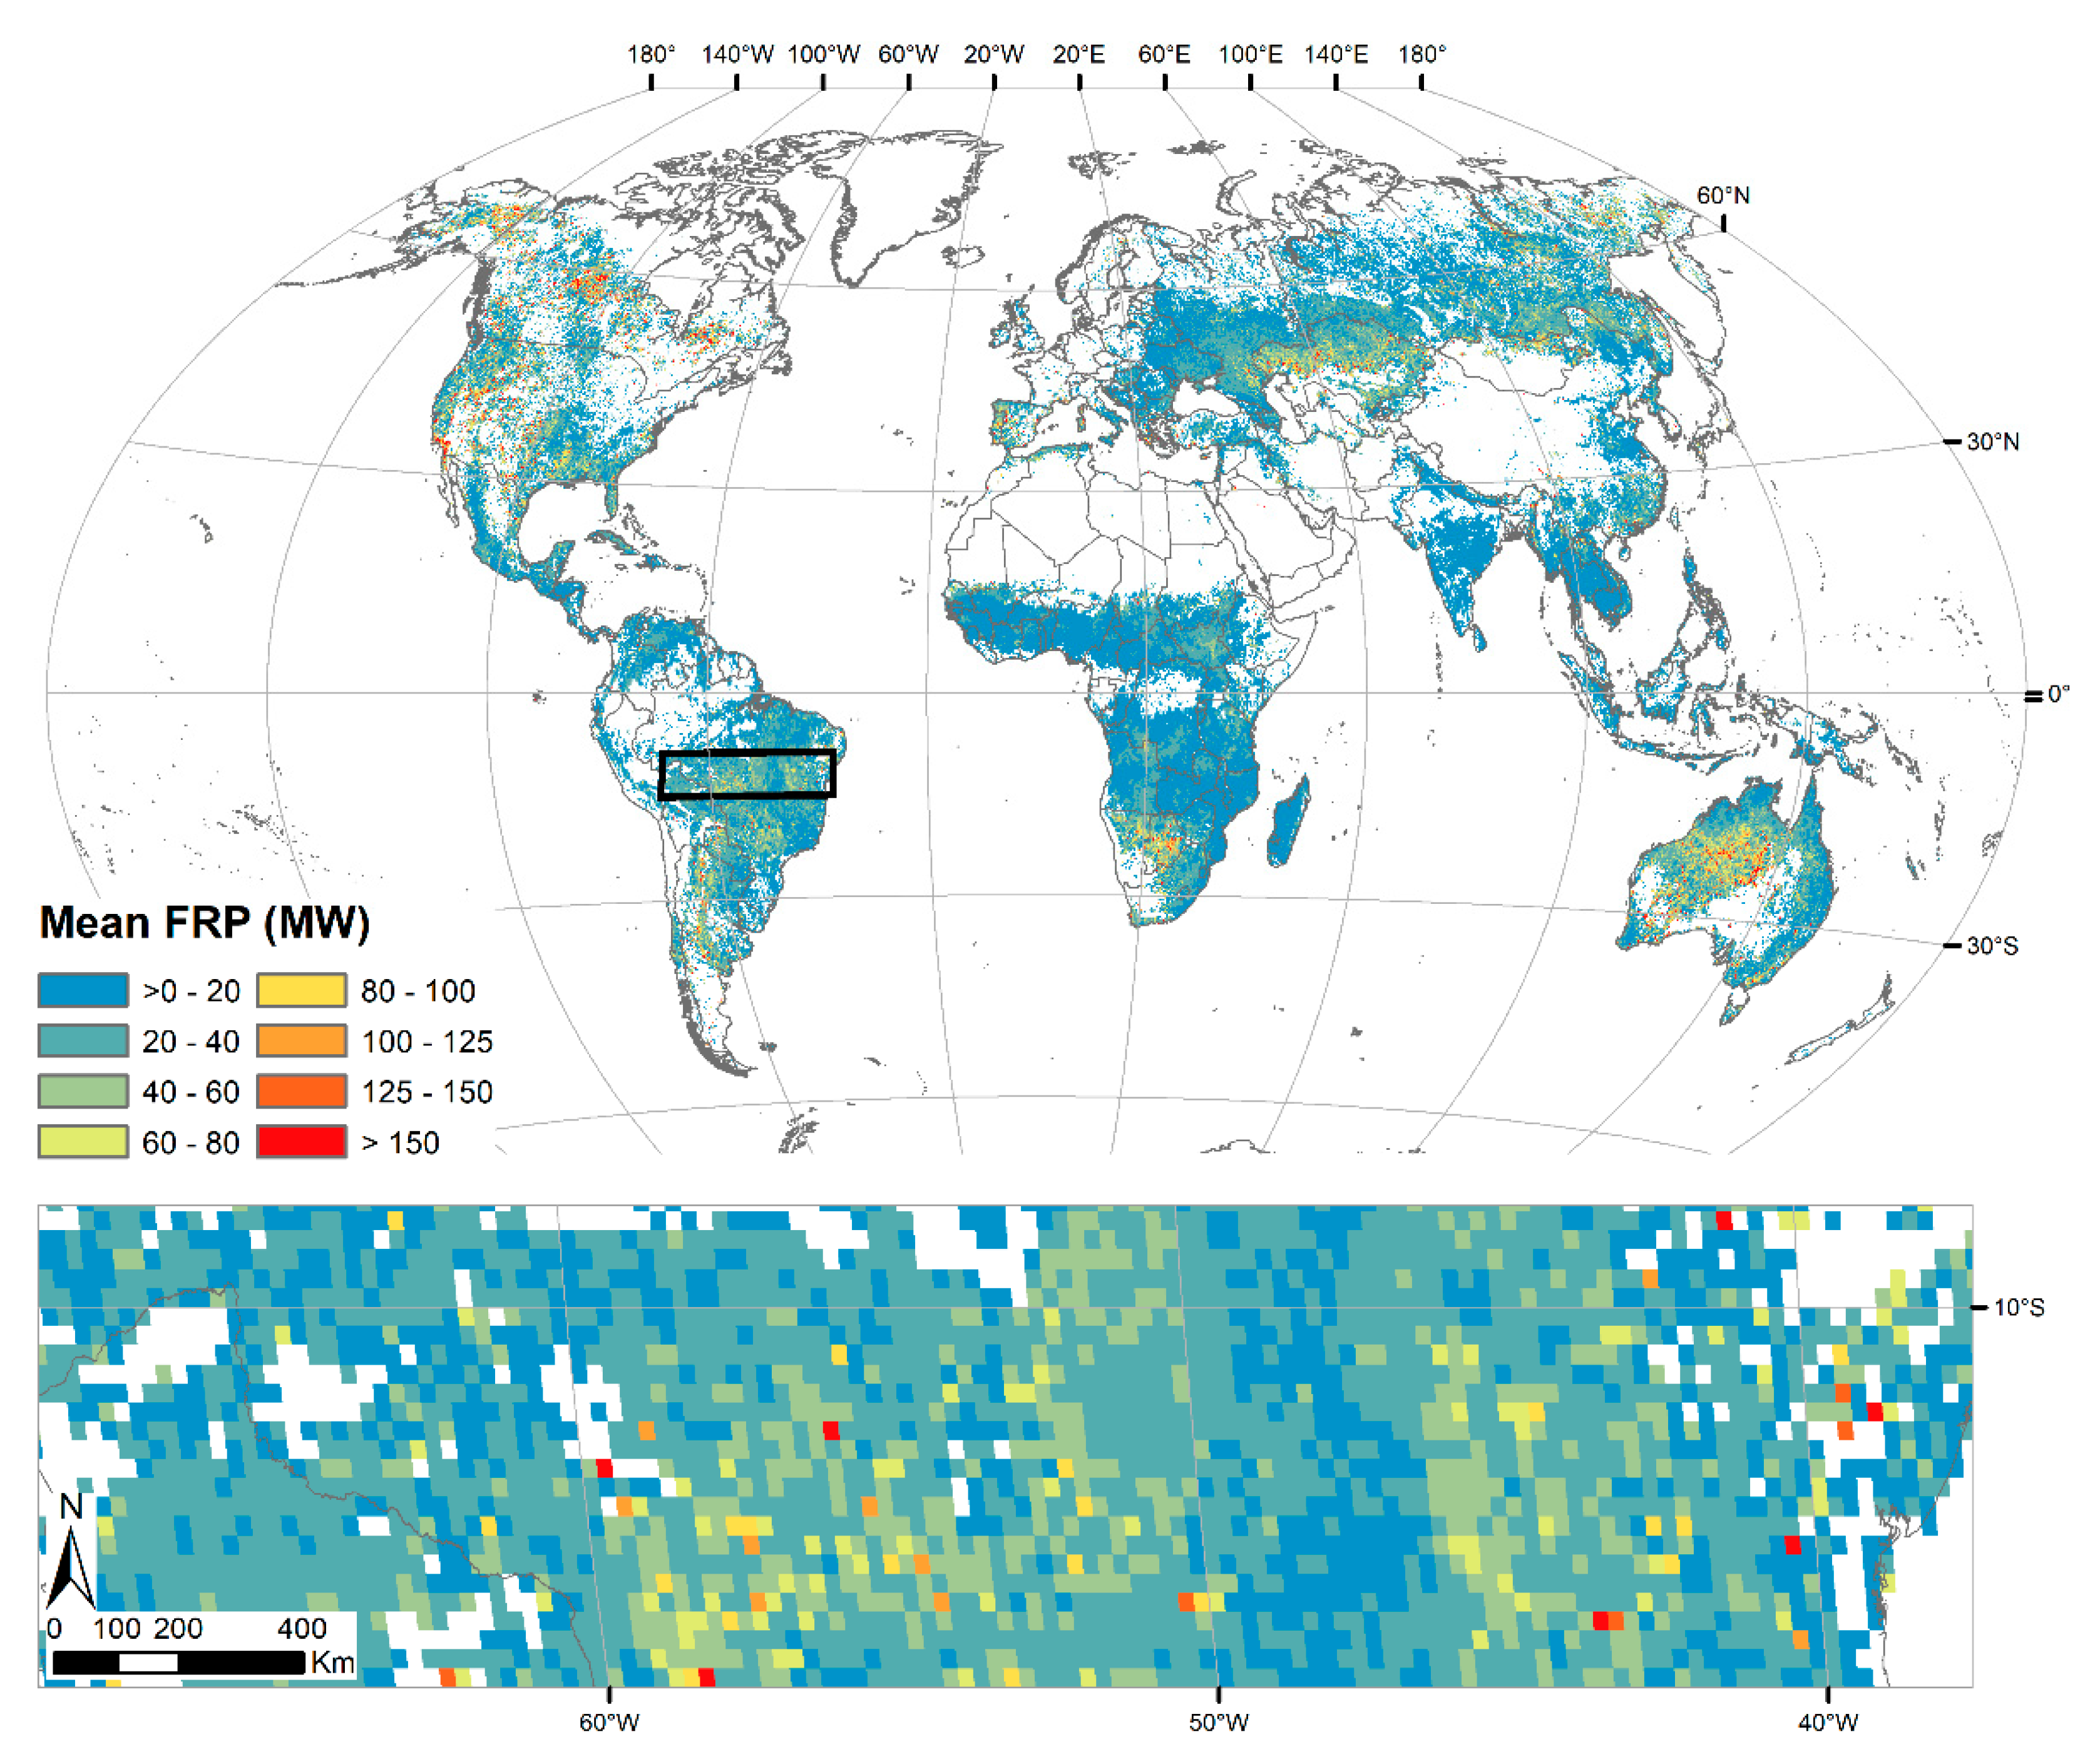
- FRP (Figure A5) was used as an indicator of the damage caused by fire. To obtain this metric, first the mean FRP of all MODIS hotspots (MCD14DL, Aqua and Terra) located within each burned patch (of the ones used to compute AFS) was calculated as described in Laurent et al. [36]. Then, a mean FRP value was obtained for each 0.25° grid cell as the average of the FRP of all fire patches within that cell for the whole study period. When no hotspot was observed in a fire patch, a NA value was assigned, and not considered in the mean FRP computation.
2.2. Classification of Global Fire Regimes
In order to identify the global patterns of fire regimes, an unsupervised clustering approach was used. We applied a k-means algorithm that partitions the data according to a similarity measure (e.g., Euclidean distance) so that the within-cluster variance is minimized [37]. Prior to the application of the algorithm, the data were scaled to the [0–1] range (Equation (1)) and variables showing skewness were log-transformed to meet the symmetric distribution of variables assumption.
where Xi is the value of the pixel, and Xmax and Xmin represent the maximum and the minimum value of the variable, respectively.
An important step to describe the data more accurately is the determination of the most appropriate number of clusters, minimizing the overlap among groups [38]. To identify the optimal number of clusters, i.e., the number of fire regimes to be distinguished from our remotely sensed data, we applied the elbow method, which is one of the oldest and most popular algorithms applied for such an aim [39]. This algorithm considers the total within-cluster sum of square (WSS) variation as a function of the number of clusters so that the most appropriate number of clusters is found for the smallest WSS. Graphically, the optimal number of clusters is found at the bend “elbow” of the curve representing WSS as a function of the number of clusters [40]. Validation of the quality of the identified clusters was performed using the silhouette score [41], which takes into account the mean intra-cluster distance, i.e., the distance of each observation to the rest of observations of its same cluster; and the mean nearest-cluster distance, i.e., the distance of an observation to the observations of the next nearest cluster. The silhouette score ranges between −1 and 1, with negative values representing misclassified observations and values close to 1 representing good clustering [42].
2.3. Relation of Fire Regimes to Fuel Distribution
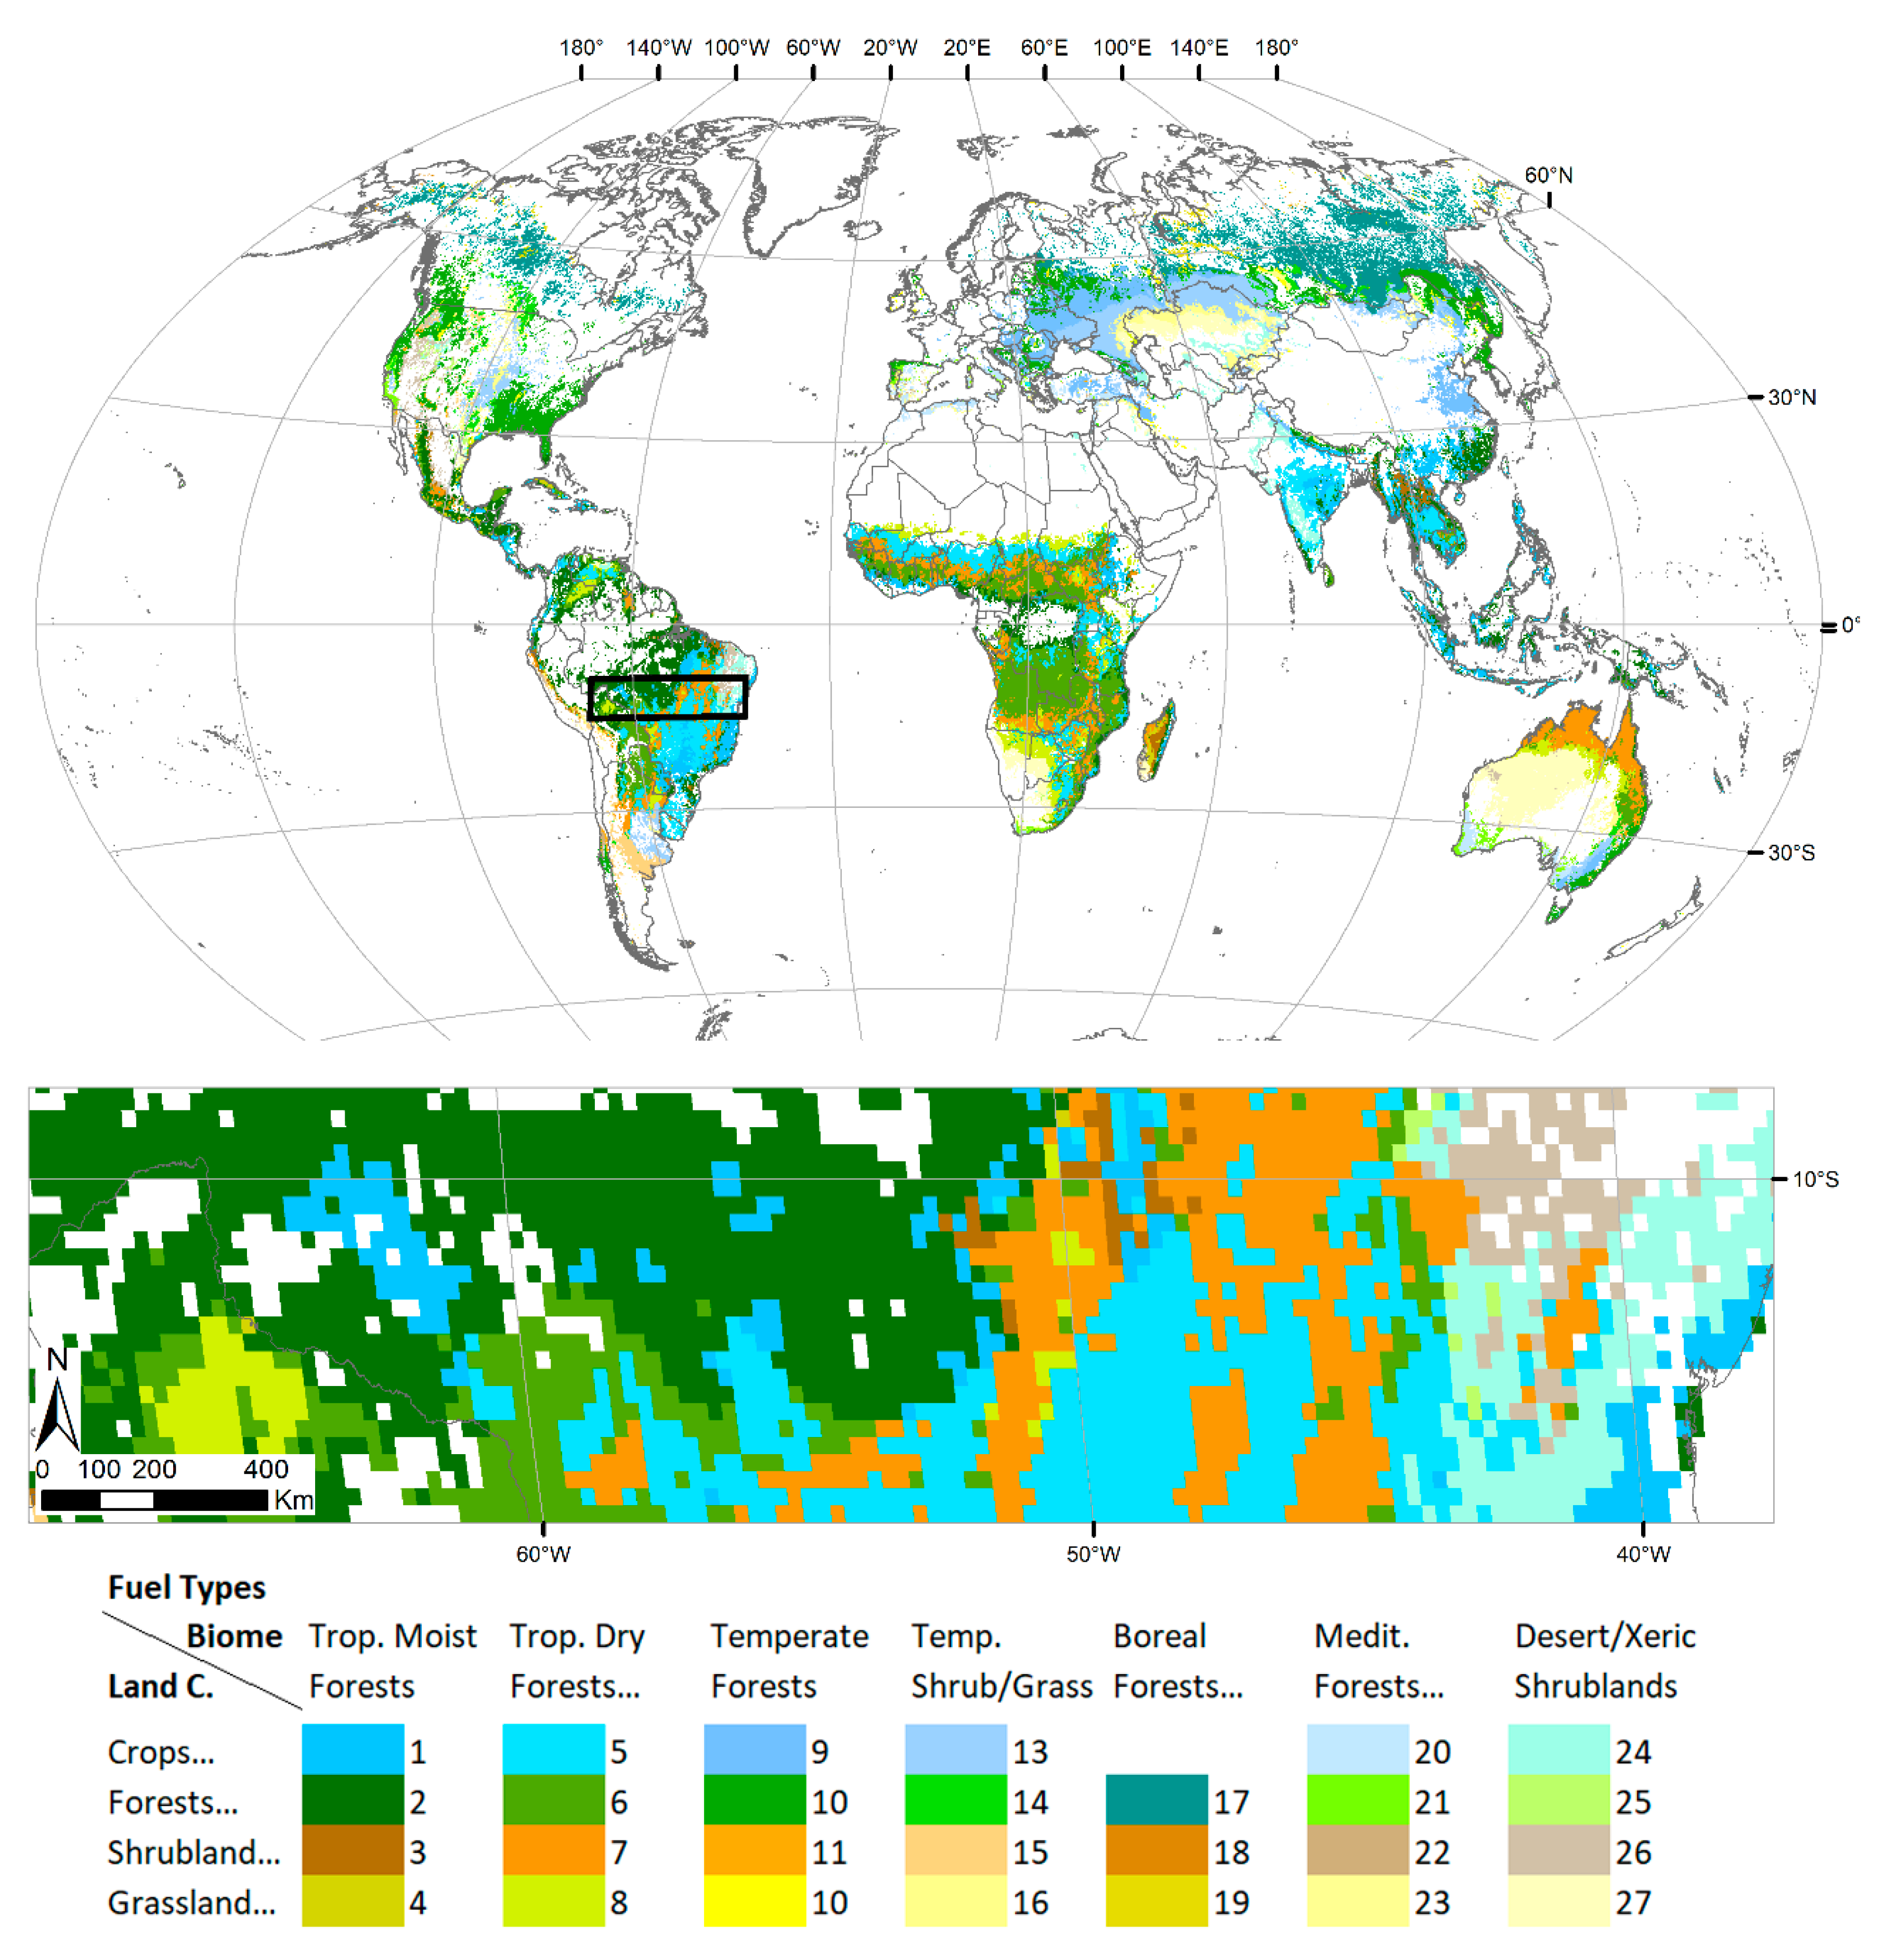
The k-means algorithm groups similar data according to the input features; therefore, in order to provide a meaningful description of the identified groups, we computed descriptive statistics for each input variable and the obtained clusters. Moreover, we explored the relation of the identified fire regimes with the fuel types included in the global fuel map developed by Pettinari and Chuvieco [43], which includes 274 different fuel types, created as a combination of biomes and land cover data, and further subdivided into 359 classes according to forest cover [43].
We aggregated the fuel types to a smaller number of classes taking into consideration both the different biomes and the main land cover class (Table A1) to obtain a total of 27 different fuel types (FT) to be used in this study (Table 1 and Figure A6).
The aggregated fuel map was resampled to 0.25° to match the resolution of the fire products, using a majority filter.
Similar to Chuvieco et al. [10], the association between the identified fire regimes and fuels was measured by means of the contingency coefficient (CC), which was subsequently adjusted for the table size by applying the Sakoda’s correction factor, as follows [44]:
where N is the sample size and K is the smallest dimension of the contingency table. The index varies in the range [0–1].
3. Results
3.1. Identifying and Characterizing Fire Regimes
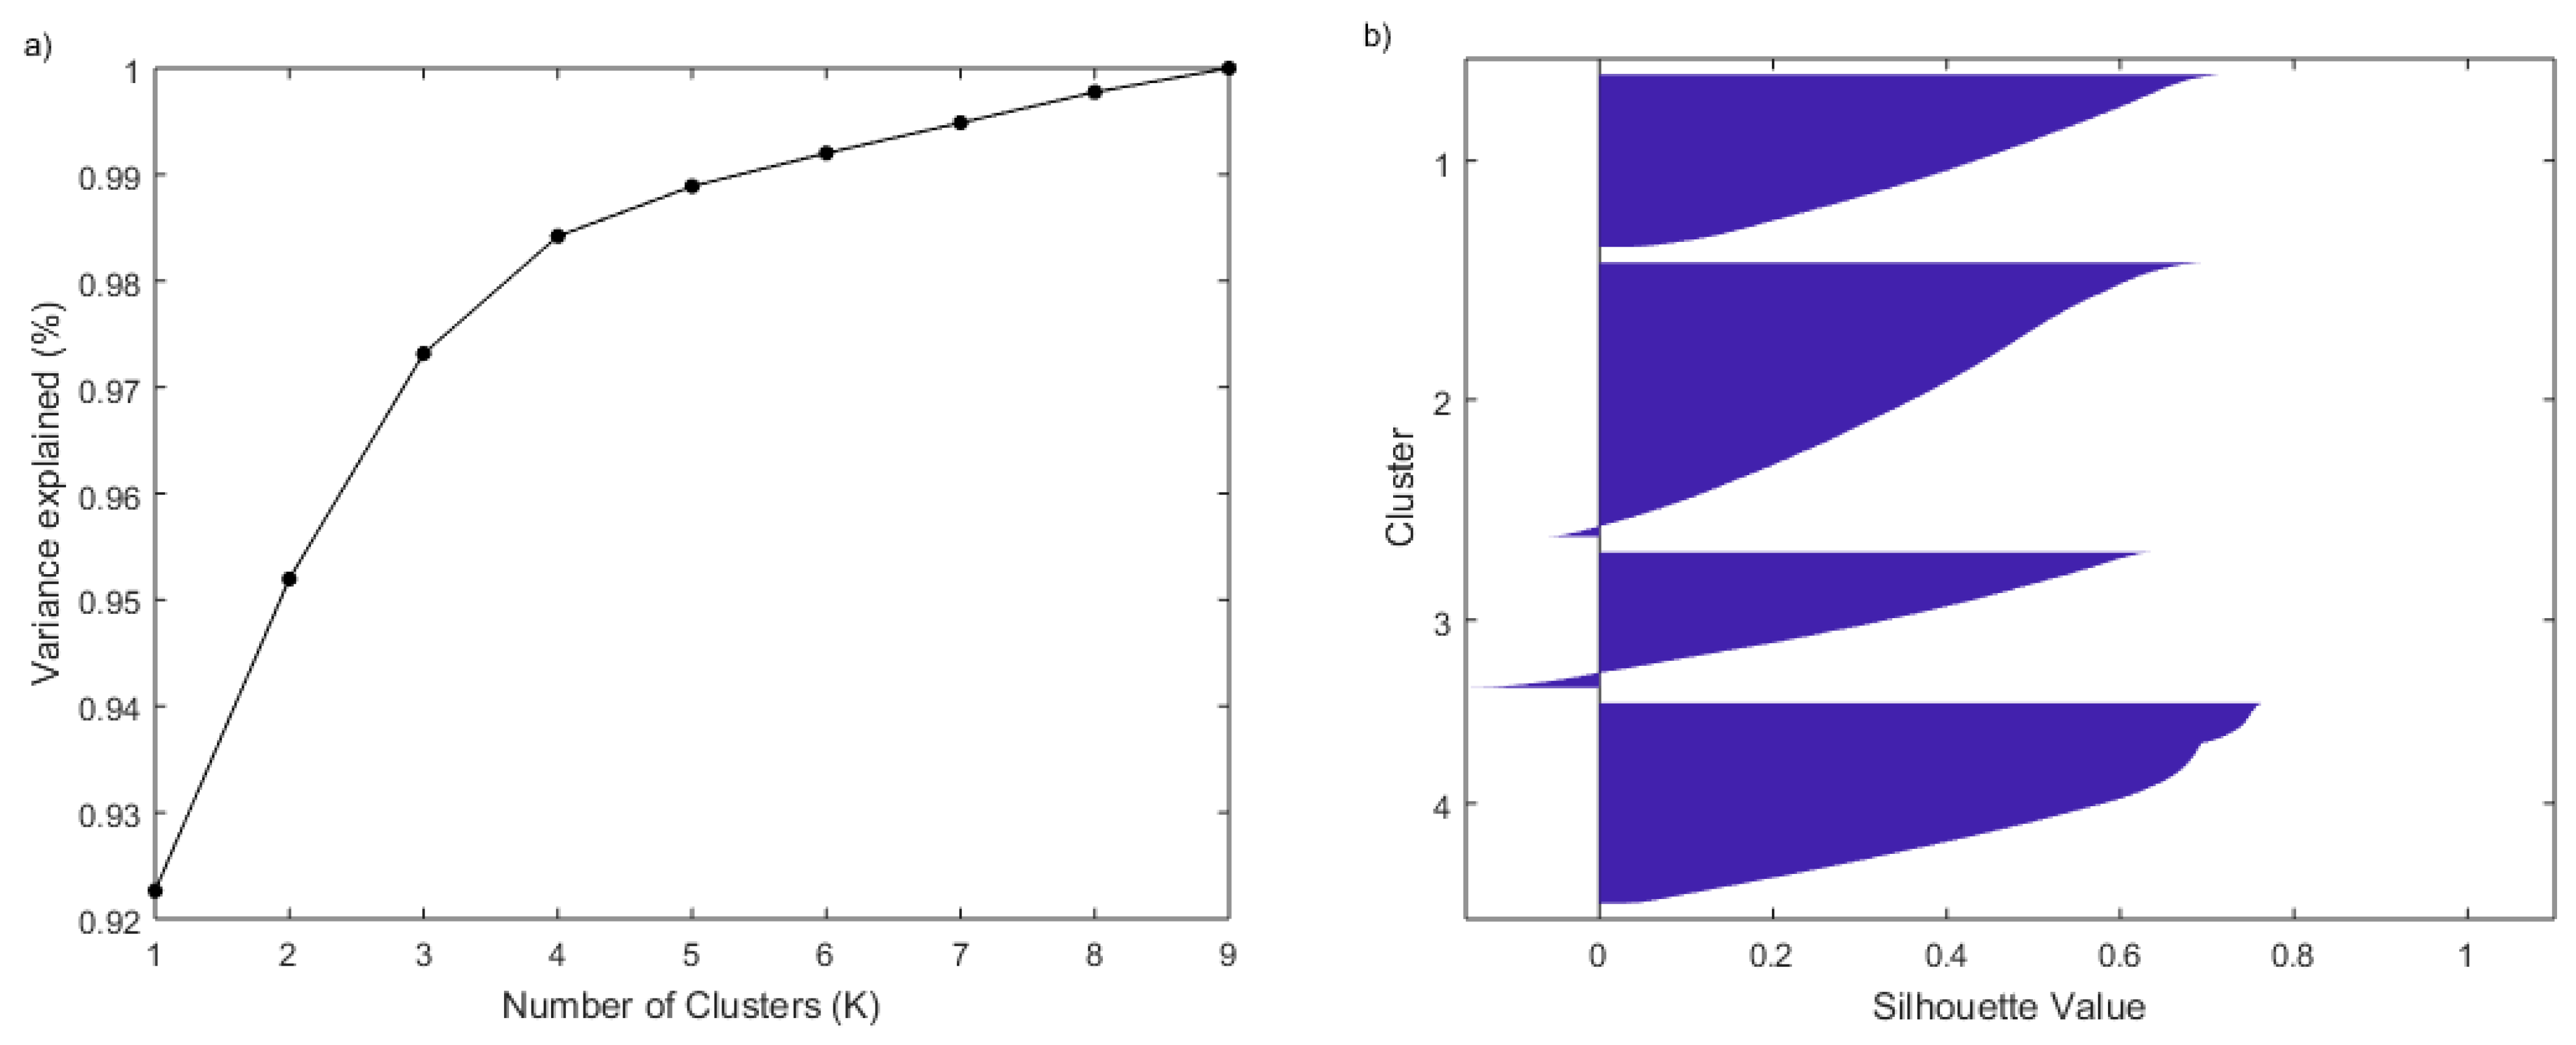
Evaluation of the optimal number of clusters identifiable from our dataset using the elbow method resulted in four clusters. Nevertheless, no sharp elbow could be unambiguously identified, and the percentage of variance explained kept increasing with the number of clusters (Figure 1a). A further evaluation of the number of clusters based on the silhouette confirmed the number of clusters, with groups clearly defined and a small amount of misclassified pixels (Figure 1b). Therefore, we selected four fire regimes as the optimal number of clusters from our remotely sensed data.
The most extensive class corresponded to group 2 (hereinafter FireReg2), with 35% of the pixels assigned to this group, followed by group 4 (FireReg4) with 25.6%, group 1 (FireReg1) with 22.07%, and the least frequent was group 3 (FireReg3) with 17.3% of the pixels belonging to this group. The mean and dispersion values of fire attributes for each group (Table 2) make it possible to establish a first explanation of each resultant group:
- FireReg1 is characterized by a short season length, the lowest total burned area, medium-low fire intensity and the smallest fire patches. This group also showed the second largest interannual variability.
- FireReg2 was found to have the longest fire season, medium-low burned area and medium size fire size, moderate intensity and moderate variability.
- FireReg3 had the shortest fire season with a low total burned area but caused by large fire events with the highest intensity. This group also showed the largest variability.
- FireReg4 showed a long fire season with large fire events and the highest value of mean burned area. However, this group had moderate intensity (the lowest of the four groups) and the least variability.
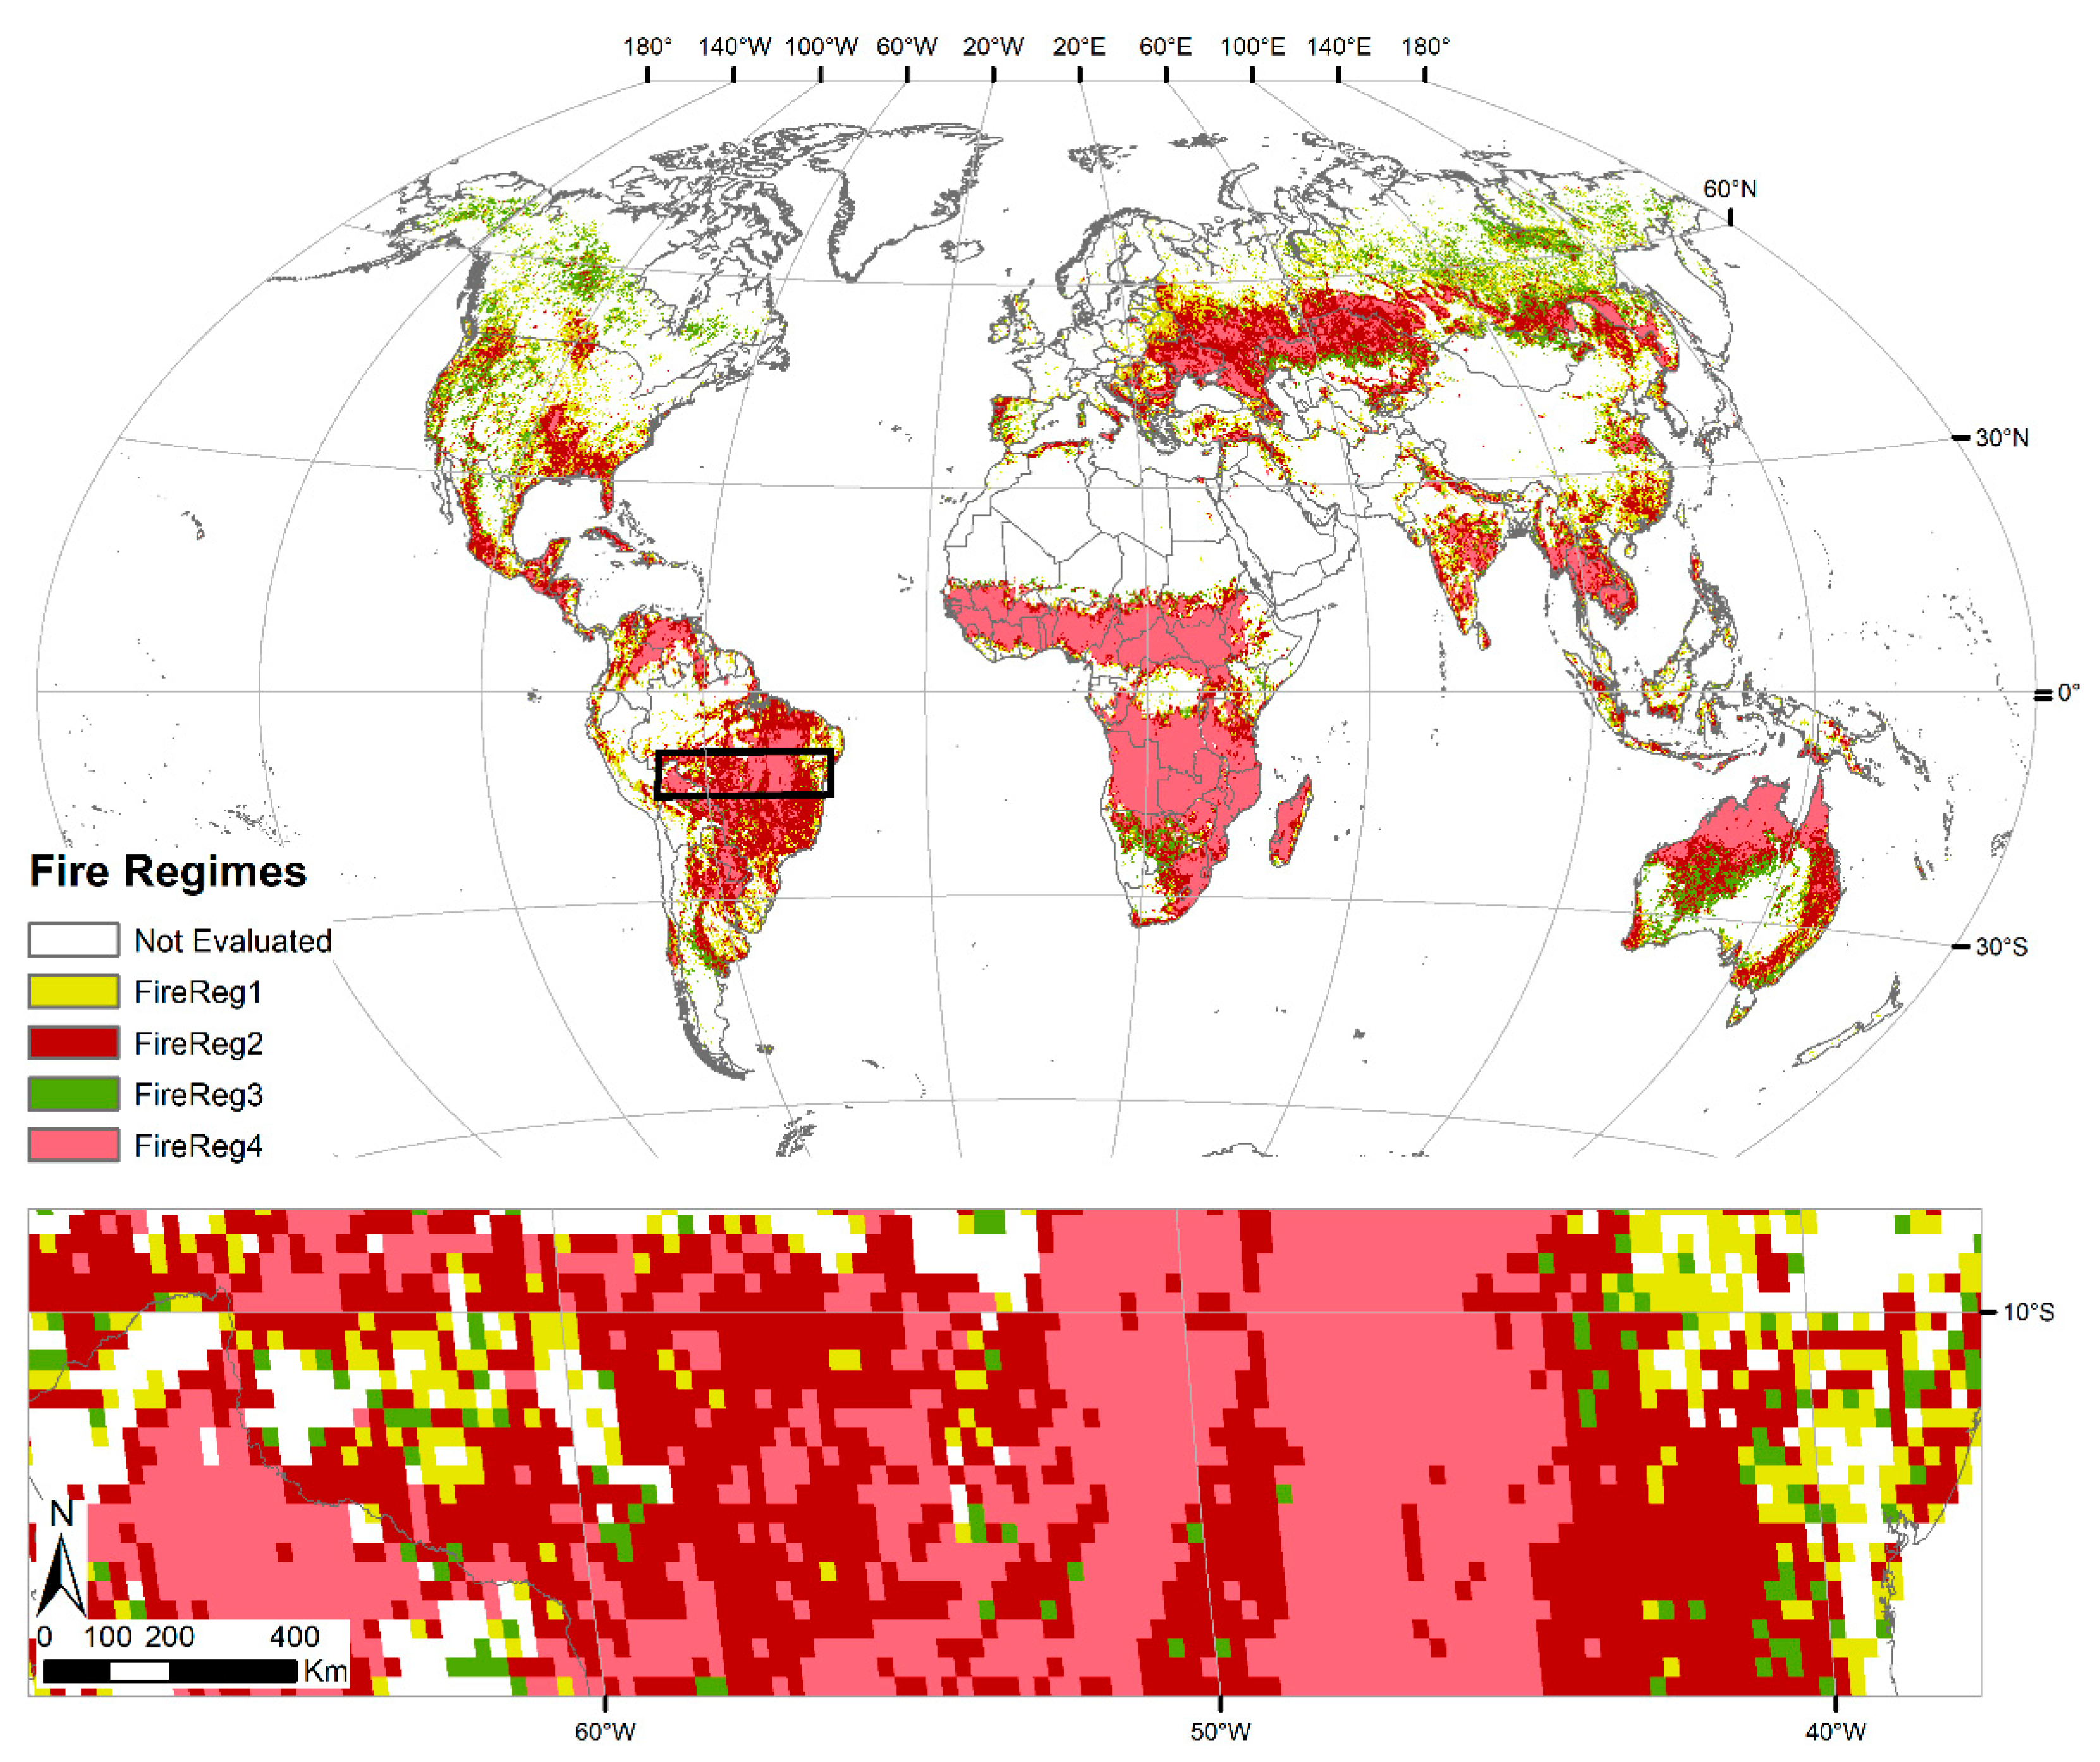
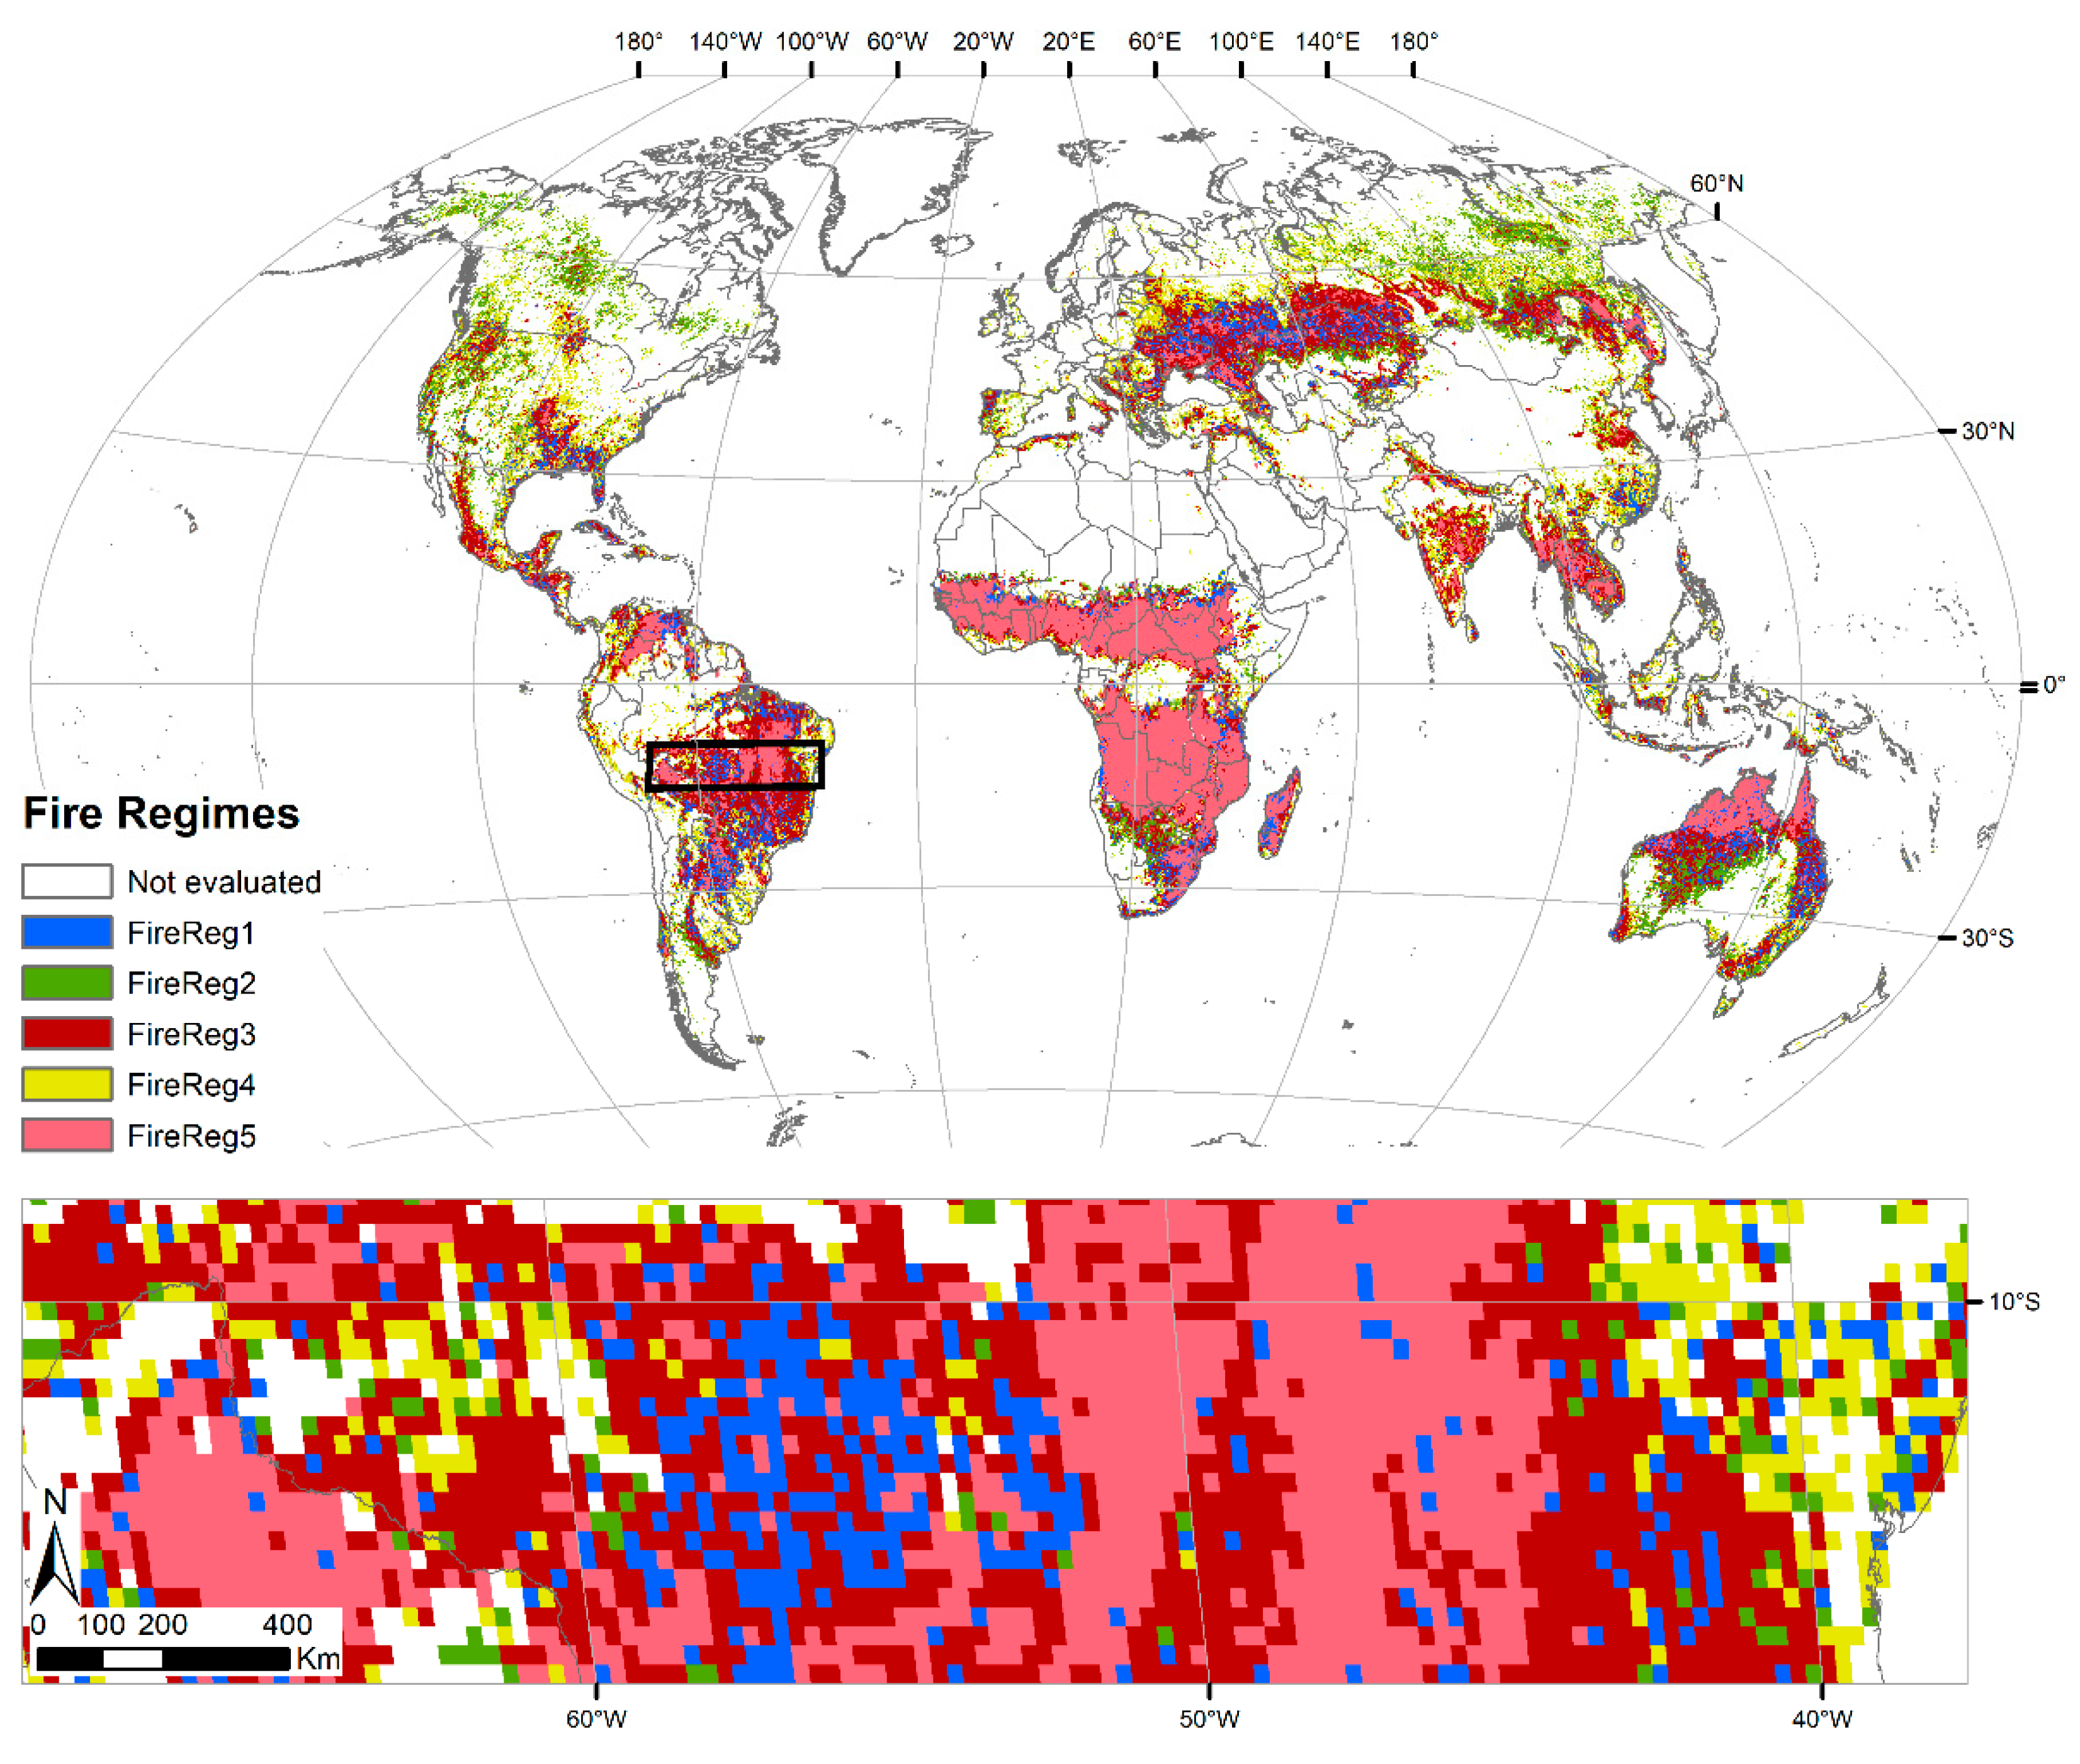
Figure 2 shows the global distribution of the fire regime classes obtained from our k-means classification. The most extensive class, FireReg2, showed a wide geographical distribution from tropical to temperate areas. FireReg4, on the other hand, was more concentrated in the tropical belt, particularly in Africa and northern Australia, followed by South America. This regime was also present in temperate regions, although less predominantly. The least common groups, FireReg1 and FireReg3, were mainly scattered through boreal, both in Siberia and Canada-Alaska, and temperate regions. They were also observed in southern America, in the borders of the most extensively burned regions, and in inner parts of Australia.
3.2. Relation of Fire Regimes to Fuels Distribution
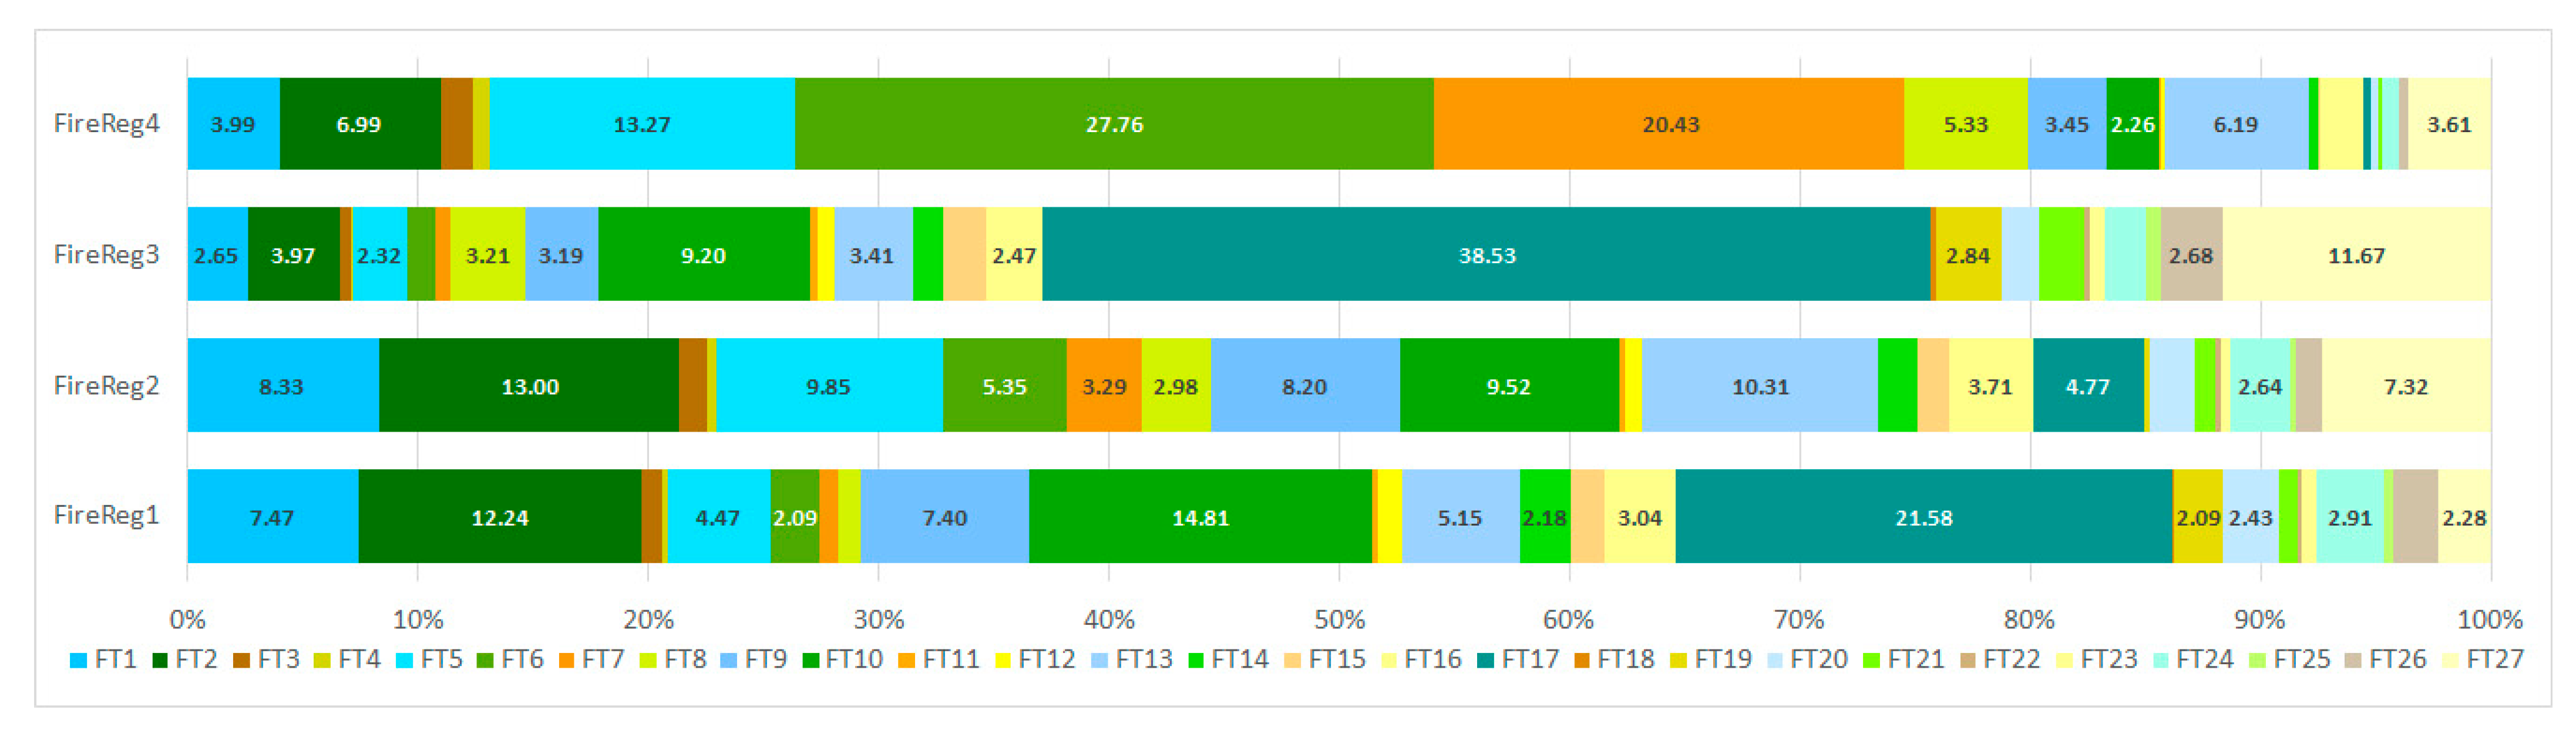
The analysis of the relation between fire regimes and fuel distribution showed a statistically significant relationship (p < 0.001) with relatively strong associations (CC = 0.58 and CC’ = 0.67). It can be observed that each fire regime encompasses a wide variety of fuel types (Figure 3). Nevertheless, a predominance of certain fuel types was observed for each fire regime. Thus, five fuel types enclosed 63.51% of cells assigned to the FireReg1, with FT17 (21.58%) being the most dominant followed by FT10 (14.81%), FT2 (12.24%), FT1 (7.47%) and FT9 (7.40%). In the case of FireReg2, the most extensive fire regime, six fuel types accounted for 59.21% of the cells classified into this category. This category showed a more even distribution among fuel types with FT2 representing 13.0%, FT13 10.31%, FT5 9.85%, FT10 9.52%, FT1 8.33% and FT9 8.20%. FireReg3 showed a more concentrated distribution, with a clear dominance of FT17 (38.53%) followed by FT27 (11.67%) and FT10 (9.20%), the three representing 59.39%. Even higher dominance of fuel types was observed for FireReg4 with three fuel types accounting for 61.46% of the activity. Thus, FT6 represented 27.76% of the cells assigned to this fire regime, followed by FT7 with 20.43% and FT5 with 13.27%.
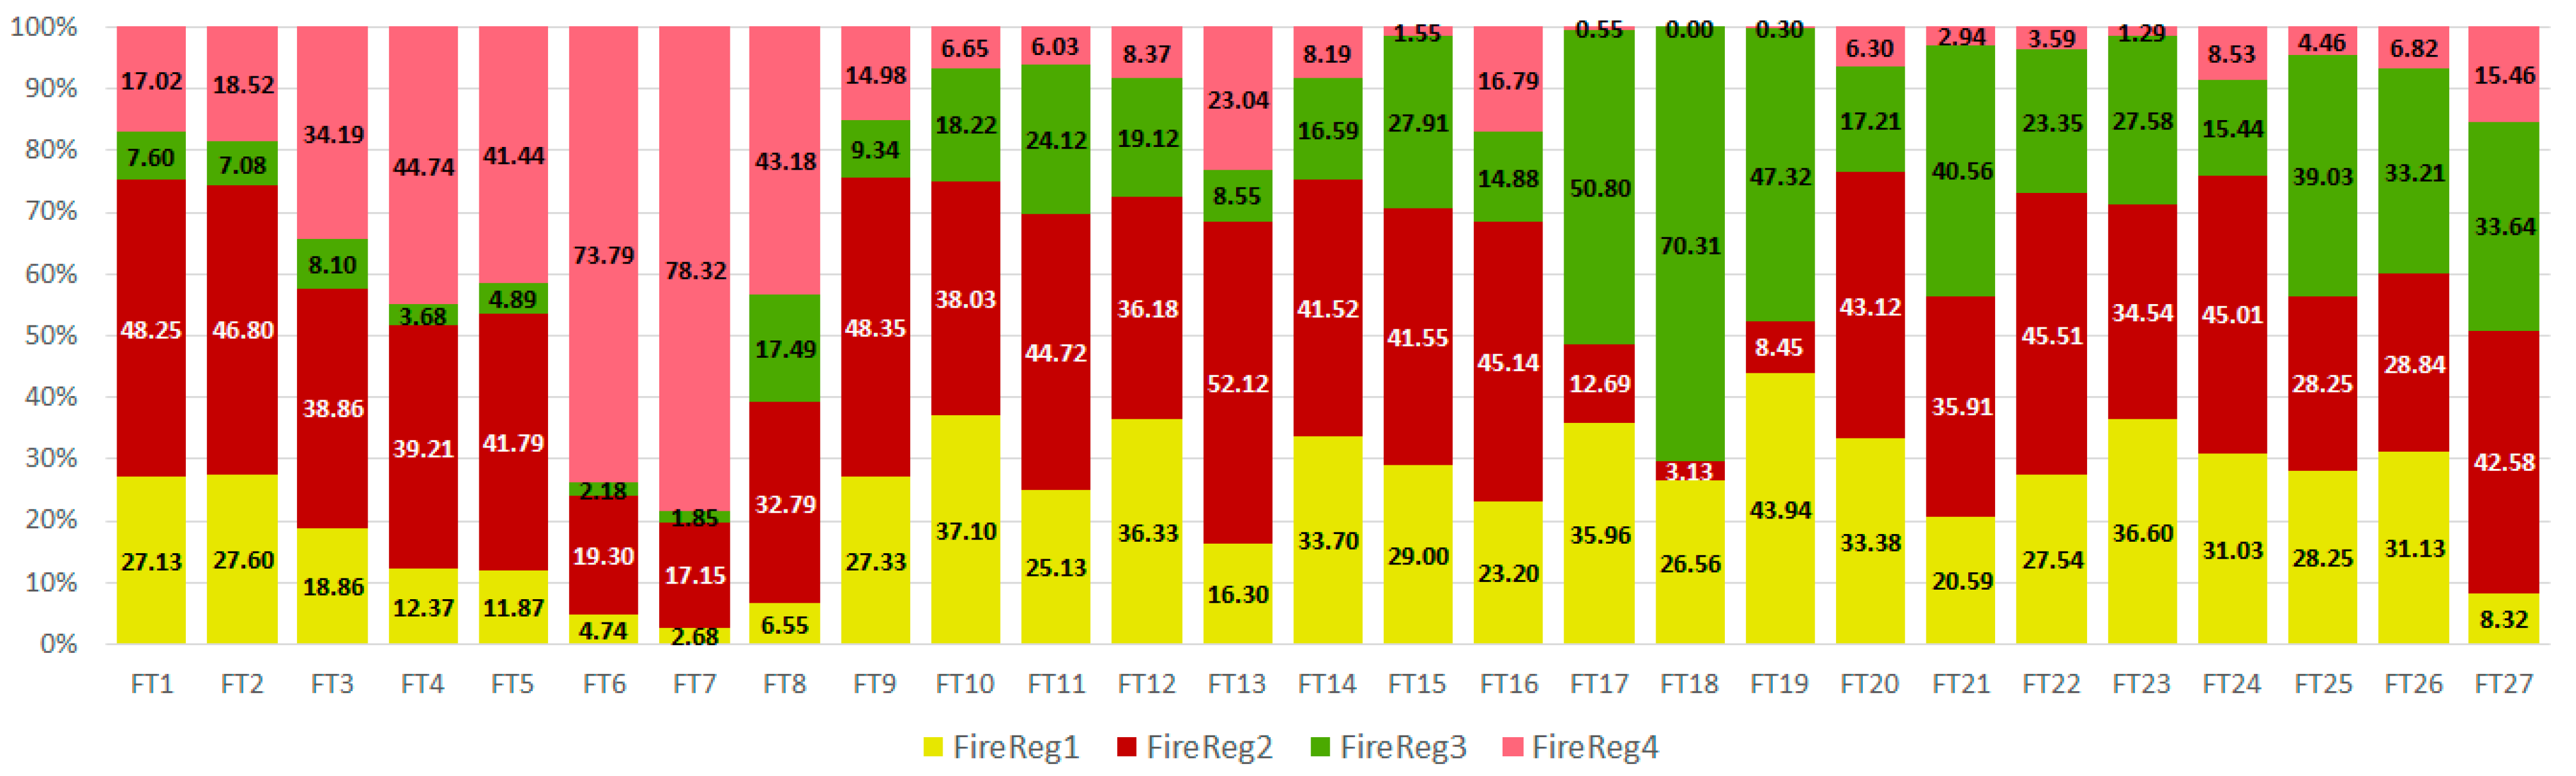
The distribution of fire regimes within each fuel type (Figure 4) was heterogeneous, although a prevalence of a particular fire regime can be observed in certain cases. Ten out of the twenty-seven fuel types considered represented more than 5% of the fire activity each, whereas the rest showed a marginal activity. In addition, for these 10 fuel types, two fire regimes represented around or more than 75% of the grid cells with fire activity. Within these 10 fuel types, five different patterns can be discriminated. First, the fuel type showing the highest proportion of affected cells corresponds to boreal forest (FT17) with 13.16% (Appendix B, Table A2). In this fuel type predominates FireReg3, which represented more than 50% of the cells, followed by FireReg1 with almost 36%. These fire regimes accounted for more than 85% of the fire affected cells. This fuel type is the largest fuel type globally, distributed across North America and Eurasia. Both regimes had the shortest fire season, largest interannual variability and low burned area but differed in fire intensity and fire extent.
All the fuel types located in the tropical dry biome (FT5 to FT8) showed a similar pattern of fire regimes distribution, dominated by FireReg4 followed by FireReg2. Thus, tropical dry forest (FT6), the second most affected (9.69%) fuel type, was clearly dominated by FireReg4 (73.79%) and FireReg2 (19.3%). Both are characterized by a longer fire season, low interannual variability and moderate intensity, differing in fire size and total burned area. This fuel type is mainly distributed across southern hemisphere African Savannas and the Gran Chaco region in South America and southeast Asia. A similar pattern was observed for the tropical dry shrubland (FT7), which represented 6.72% of the affected cells, with FireReg4 representing 78.32% and FireReg2 17.15% of the affected cells. This fuel type is found mainly in northern Australia, shrublands of Angola and Zambia, and the Brazilian Caatinga region. The crops in the tropical dry biome (FT5), which mainly occur in the Sahel and southeast Asia (SEAS) and some part of the Llanos in Venezuela, showed almost the same prevalence of FireReg4 (41.44%) and FireReg2 (41.79%). Finally, and although the total burned surface represented less than 5% global fire activity, FT8 also showed the same pattern of fire regimes, with FireReg4 (43.18%) and FireReg2 (32,79%) representing together more than 75% of the fire regimes in that area, mainly comprised by the grasslands and low vegetation in the fringes between the forest/savannas and deserts in northern and southern Africa and Australia, the Llanos region in Colombia/Venezuela, and the wetland regions in Argentina/Paraguay.
Crops in the temperate grassland biome (FT13) have 6.92% of all fire affected cells. In this fuel type, approximately 52% of the cells belongs to FireReg2, followed by FireReg4 (23.04%), both accounting for approximately 75% of occurrence. This fuel type is located across the Eurasian Steppes, followed by central Argentina, the central region of the United States and the western part of New South Wales in Australia.
Crops both in the tropical moist forest biome (FT1) and temperate forest biome (FT9) showed similar distribution of fire regimes with FireReg2 representing nearly 50% of the fire activity (48.25% and 48.35%, respectively), followed by FireReg1 (27.13% and 27.33%, respectively). FT1 is mainly located in southeast Asia, Central America, southern Brazil, eastern Paraguay and western Colombia and Venezuela. FT9 is mainly located in eastern Europe, eastern China (Shandong and Heilongjiang provinces) and southern New South Wales in Australia. Other cropland fuel types such as the ones located in the desert (FT24) and Mediterranean (FT20) biomes, although with less global fire activity (2.05% and 1.60%, respectively), were also dominated by FireReg2 followed by FireReg1, both accounting for more than 75% of fire occurrence.
FireReg2 was also the dominant fire regime for the tropical moist forest and temperate forest biomes (FT2 and FT10), representing 46.80% and 38.03%, respectively. The second most dominant fire regime for this fuel types was FireReg1, with 27.60% and 37.10%, respectively. Tropical moist forests affected by fire are in the deforestation fringe of the Amazon, the border between the Republic of Congo and the Democratic Republic of Congo, and Indonesia. As for FT10, burned grid cells are mainly found in northwest conterminous United States and southwestern Canada.
Grasses in the desert and xeric shrubland biome (FT27) were characterized by a prevalence of FireReg2 (42.58%) followed by FireReg3 (33.64%). This fire activity is concentrated in inner Australia, followed by Kazakhstan and eastern Mongolia.
Mediterranean fuels (FT20–FT23) represented less than 1% of the cells affected by fire, despite fire representing the main natural disturbance. However, they show characteristic patterns. Mediterranean forests (FT21) were dominated by FireReg3 (40.56%), with large and intense fire events and high variability in persistence, followed by more moderate fire events as represented by FireReg2 (35.91%). Mediterranean shrublands (FT22) showed a dominance of FireReg2 (45.51%) and a similar influence of FireReg3 and FireReg1 (27.54% and 23.35%, respectively). Mediterranean grasslands (FT23) were evenly affected by FireReg1 and FireReg2 (36.60% and 34.54%, respectively), closely followed by FireReg3 (27.58%).
4. Discussion
We identified four distinct fire regimes from our remotely sensed data representing attributes in the spatial, temporal and magnitude dimensions of fires. Their spatial patterns are similar to those obtained in previous works despite having a different number of global fire regimes (Figure 5 in [10]; and Figure 2 in [3]), with fire activity concentrated along the subequatorial belt and the southern boreal fringe. Differences in the number of identified clusters, and on the characterization of fire regimes, can be explained by differences in the techniques, the datasets and the length of the time series used as well as the threshold applied to partition the variables in the definition of the regimes. For instance, Chuvieco et al. [10] used a binarization of three variables based on active fires (instead of burned area) spanning 6 years, representing the temporal and spatial dimensions of fires but not the magnitude, resulting in eight different classes. Likewise, they applied a threshold of 6 months to separate long from short duration of the fire season. From our analysis of the 19-year time series data, the longest average length of the fire season was only 3 months, and our definition of long or short season was relative to the length of the season of the four regimes distinguished. Part of this difference in fire season length might be explained because we selected only the months that had a significant contribution to fire activity (more than 10% of the AMBA), in order to eliminate possible outliers. Archibald et al. [3], using a 14-year long series of variables encompassing the spatial, temporal and magnitude dimensions and a clustering approach, identified five pyromes. Although we also used variables in the same dimensions, they were not the same and the data sources also differed, which may explain the different optimal number of fire regimes found. In our case, selecting five clusters instead of four meant the split of FireReg2 into two groups differing in terms of length of the fire season, long versus medium. Spatially, these two new groups did not show a clear pattern but a scattered distribution across FireReg2 (see Table A3 and Figure A7 in Appendix C).
Several authors have suggested that there is a close link between total burned area with the length of the fire season [45] and the size of the fires [46]. However, the fire regimes identified in this study showed a variety of combinations of the length of the fire season and the size of fire events with the burned area. Thus, long fire seasons were observed for fire regimes having medium BA extent as well as a large extent (FireReg2 and FireReg4). Likewise, we observed large fire events for fire regimes that presented medium-low and large BA extent (FireReg3 and FireReg4). This agrees with findings by Archibald et al. [3]. The most intense fires occurred in FireReg3, which had large fires, short fire seasons and large interannual variability. These characteristics are compatible with a dominance of stand replacing crown fires in areas where this fire regime dominates, particularly in boreal [47] and temperate forests. Moreover, the high variability may result from the large amount of biomass consumed, limiting the amount of fuel available for subsequent fires.
We found a significant relationship between fuel types and fire regime (CC = 0.58, CC’ = 0.67). This work represents the first attempt to appraise the association between fuel types, which represent vegetation classes having similar combustion behavior [48], with fire regimes, representing regions of similar fire characteristics. The relationships found are slightly higher than those found by Chuvieco et al. [10] between the Holdridge Life Zones (HLZ) and their fire regimes (CC = 0.54, CC’ = 0.58; p < 0.0001). One possible reason for this is that the global fuel classification used is based on both biome and land cover characteristics [43], while the HLZ are based on climatic variables more related to biomes, but do not include an explicit vegetation component.
A dominance of FireReg2 was observed across all crop fuel types as well as in tropical moist and temperate forests. It also showed high occurrence in Mediterranean forests and shrublands with preponderance of low vegetation, whereas in boreal forests it has low representation. Therefore, it could be inferred that this fire regime is related to human activities, including deforestation and cultivation in tropical forests. In fact, positive correlation between human population density and burned area has only been reported in densely forested tropical regions [49]. FireReg2 is the most extensive, showing a global distribution and affecting almost all fuel types, which agrees with findings by Archibald et al. [3] who also identified a human-derived pyrome.
The tropical dry biome represents the biome with the highest proportion of affected cells, with 27.83% of the total burned cells. This biome includes almost all the fuel types with a majority of cells having FireReg4. This is especially evident in the land covers corresponding to forests (FT6) and shrublands (FT7), the latter also including savannas, with more than 70% of burned grid cells corresponding to that fire regime. These fuel types are mostly located in the Brazilian Cerrado, Africa (where they represent the majority of the burned cells in the continent), and northern Australia. These regions have burned for thousands of years [14], but in the last centuries these fire regimes have been widely altered by human activities [18,50]. In these fuel types, the vegetation is adapted to fire [51,52], which means that the fuels can grow and dry in short amounts of time, resulting in very short fire-return intervals [18], as demonstrated by the low CVBA value of FireReg4. Regarding the different fire regime allocation between FT6 and the rest of the fuel types in this biome, recent studies have shown that the fragmentation of the landscape due to agricultural practices can decrease the fire extent and fire size [49,53]. This could partially explain the higher proportion of FireReg2 in the cropland fuel type, which has lower AMBA and AFS values compared to FireReg4.
In the case of the boreal fuel types, they were dominated by FireReg3, followed by FireReg1. Still, some differences were found between the different fuel types within this biome. In the case of the grasslands (FT19), the burned cells were almost evenly distributed between the two fire regimes (44% in FireReg1 and 47% in FireReg3) versus the forest fuel type (FT17) having a clear majority of FireReg3 (36% and 51%, respectively). These two fire regimes are opposite in terms of fire intensity, with FireReg3 having the highest FRP versus FireReg1 having almost the lowest. It is reasonable to expect that a grassland and sparse vegetation fuel type, due to its low biomass, would not reach high values of FRP. Still, it should be noted that the grid cells are classified as a “majority” fuel type at 0.25° resolution from a 300 m original resolution, which means that they could also comprise regions with forested vegetation that could have released high amounts of energy, contributing to some grid cells being classified as FireReg3. Regarding the fire season, although both predominant fire regimes have the shortest seasons, as expected by the short period of the year when the climatic conditions allow fires to occur, the higher proportion of FireReg1 in FT19 could be explained because that fuel type is located mostly in central Russia and central Canada, in regions with a high proportion of peatland cover [54]. In fact, the vast majority of the FT19 cells in Asia are located in the Yamalia and Khantia-Mansia, which have the largest peatland coverage within boreal Asia [54]. The smoldering combustion of peatlands, compared to the flaming combustion typical of surface vegetation, can persist in wetter conditions, hence extending the potential fire season [55]. Although the shrubland and low vegetation fuel type (FT18) had more than 70% of the burned cells classified as FireReg3, the small number of samples (only 0.07% of the global burned cells) does not allow obtaining meaningful conclusions.
Expected changes in fire regimes, under the current context of climate change, would have global environmental, climate and societal implications. Gaining better understanding of these changes and their drivers, either climatic, anthropogenic [56] or ecological [49], is essential to plan and develop climate change mitigation and adaptation policies. Global remote sensing burned area or active fire products enable obtaining important variables for the appraisal of fire regimes. However, variables derived from them are subject to uncertainties related to the spatial resolution of the sensor, the burned area algorithm or the parameters used to identify burn patches, such as the minimum fire patch or the cut-off threshold used to merge single pixels into a fire patch [31]. The global burned area product used in this research has been validated using a statistically robust approach [57]; yet, Ramo et al. [28] found a large underestimation of burned area over sub-Saharan Africa resulting from small fires (<100 ha) undetected as result of the sensor resolution. Studies comparing fire patch features with reference data and intercomparing datasets identified potential mismatches in fire number or size depending on the sensors and temporal cut-offs used to aggregate pixels, both regionally and globally [31,58]. Further fire patch product assessment should be performed, and increasing temporal/spatial resolution of sensors [59] should lead to better accuracy in small fire characterization (number and size). This, in turn, will most probably improve the characterization of the fire regimes. Finally, current burned area and active fire products span 20 years, which allows for the characterization of current fire regimes; yet, in order to detect changes in fire regimes, a longer time series is necessary.
A comprehensive characterization of fire regimes cannot rely on remote sensing data alone as they do not provide important variables such as those related to human activity, which have been found to be important drivers of fire regimes affecting ignition and suppression, and in turn modify the duration of the fire season and density [10,11,17]. The influence of the human population varies among biomes, showing large heterogeneity in their response to human activity [49]. Therefore, further efforts should be directed towards the generation of demographic and socio-economic variables that could be integrated with burned area and active fire products to improve our understanding of fire regimes and their changes [26]. Likewise, homogenization on the remote sensing products and variables used to define fire regimes would facilitate the comparison, analysis and monitoring of fire regimes, and the evaluation of whether fire regimes are effectively changing and the possible drivers of these changes.
5. Conclusions
This paper provides a characterization of fire regimes globally based on five attributes describing the temporal, spatial and magnitude dimensions of fires using 19 years of remote sensing products. Using an unsupervised k-means clustering approach over these fire attributes derived from active fire and burned area products, fire activity was represented by four fire regimes. Fire activity is concentrated along the subequatorial belt and the southern boreal fringe, where FireReg2 and FireReg4 are predominant. FireReg2 was characterized by a long fire season, medium size fire events, small burned area, high intensity and medium variability. FireReg4 presented long fire seasons, large fire events, the highest mean burned area, the lowest intensity and the least variability. Outside these latitudes, FireReg1 and 3 are prevalent, although presenting a more scattered pattern. FireReg1 showed a short fire season, the lowest burned area, with medium-low intensity, the smallest fire patches and large variability. Finally, FireReg3 presented the largest burned area with large fire patches of moderate intensity and low variability.
The analysis of fire regimes compared to fuel types showed that most of the fuel types are present in all fire regimes and vice versa, although some fuel types were clearly associate with some specific fire regimes. Thus, three to six fuel types comprised most of the fire activity of each fire regime. Likewise, two fire regimes represented more than 70% of the fire activity found in almost all fuel types.
This paper contributes to the efforts of properly defining fire regimes, using the longest time series of remotely sensed data so far. Nevertheless, further efforts should be directed towards the standardization of the variables used to define fire regimes and the inclusion of demographic and socio-economic variables to improve our understanding of fire regimes and their changes.
Author Contributions
Conceptualization, M.G., M.L.P., E.C., J.S. and I.A.; data curation, M.L.P., F.M. and W.C.; formal analysis, M.G. and M.L.P.; funding acquisition, I.A.; methodology, M.G., M.L.P., E.C., J.S. and I.A.; software, M.G., F.M. and W.C.; validation, M.G., M.L.P., E.C., J.S. and I.A.; visualization, M.G. and M.L.P.; writing—original draft, M.G.; writing—review and editing, M.L.P., E.C., J.S., F.M. and I.A. All authors have read and agreed to the published version of the manuscript.
Funding
This research was funded by the MCIU/AEI/FEDER, UE, RTI2018-097538-B-I00—Global analysis of human factors of fire risk (AnthropoFire Project), and the Climate Change Initiative (CCI) Fire_cci Project (Contract 4000126706/19/I-NB).
Data Availability Statement
The FireCCI51 dataset used for this study is available at https://climate.esa.int/en/projects/fire/data/, accessed on 23 April 2022.
Acknowledgments
We would like to thank the two anonymous reviewers for their constructive suggestions, which helped to improve our paper.
Conflicts of Interest
The authors declare no conflict of interest.
Abbreviations
| AFS | Average Fire Size |
| AMBA | Annual Mean Burned Area |
| BA | Burned Area |
| CC | Contingency Coefficient |
| CVBA | Coefficient of Variation of the Burned Area |
| #Months | Number of months with significant fire activity |
| FireReg | Fire Regime |
| FRP | Fire Radiative Power |
| FT | Fuel Type |
| HLZ | Holdridge Life Zones |
| MODIS | Moderate Resolution Imaging Spectroradiometer |
| SEAS | Sahel and Southeast Asia |
| WWS | Within-cluster sum of square |
Appendix A
Figure A1.
Spatial distribution of the average fire size (see main text for definition and further details). The bottom panel shows a zoomed region in central South America, as delineated in the global map.
Figure A1.
Spatial distribution of the average fire size (see main text for definition and further details). The bottom panel shows a zoomed region in central South America, as delineated in the global map.

Figure A2.
Spatial distribution of the mean burned area (see main text for definition and further details). The bottom panel shows a zoomed region in central South America, as delineated in the global map.
Figure A2.
Spatial distribution of the mean burned area (see main text for definition and further details). The bottom panel shows a zoomed region in central South America, as delineated in the global map.

Figure A3.
Spatial distribution of the coefficient of variation of the burned area (see main text for definition and further details). The bottom panel shows a zoomed region in central South America, as delineated in the global map.
Figure A3.
Spatial distribution of the coefficient of variation of the burned area (see main text for definition and further details). The bottom panel shows a zoomed region in central South America, as delineated in the global map.

Figure A4.
Spatial distribution of length of the fire season, expressed as number of months with significant fire activity (see main text for definition and further details). The bottom panel shows a zoomed region in central South America, as delineated in the global map.
Figure A4.
Spatial distribution of length of the fire season, expressed as number of months with significant fire activity (see main text for definition and further details). The bottom panel shows a zoomed region in central South America, as delineated in the global map.

Figure A5.
Spatial distribution of the fire radiative power (see main text for definition and further details). The bottom panel shows a zoomed region in central South America, as delineated in the global map.
Figure A5.
Spatial distribution of the fire radiative power (see main text for definition and further details). The bottom panel shows a zoomed region in central South America, as delineated in the global map.


Table A1.
Reclassification of the biomes and land cover classes of the global fuel dataset [43]. The classes correspond to the ones shown in Figure 5 of that article.
Table A1.
Reclassification of the biomes and land cover classes of the global fuel dataset [43]. The classes correspond to the ones shown in Figure 5 of that article.
| # | Reclassified | Correspondence to the Classes in Global Fuel Map |
|---|---|---|
| Biomes | ||
| 1 | Tropical moist forests | Tropical/Sub-tropical moist broadleaf forests, tropical/sub-tropical coniferous forests, mangroves |
| 2 | Tropical dry forests, shrublands and grasslands | Tropical/Sub-tropical dry broadleaf forests, tropical/sub-tropical grasslands, savannas and shrublands |
| 3 | Temperate forests | Temperate broadleaf and mixed forests, temperate coniferous forests |
| 4 | Temperate shrublands and grasslands | Temperate grasslands, savannas and shrublands |
| 5 | Boreal forests and tundra | Boreal forests/taiga, tundra |
| 6 | Mediterranean forests and woodlands | Mediterranean forests, woodlands and scrub |
| 7 | Desert and xeric shrublands | Desert and xeric shrublands |
| Land Cover | ||
| 1 | Crops and mosaics with crops | Cropland, mosaic cropland (50–70%)/vegetation (20–50%), mosaic vegetation (50–70%)/cropland (20–50%) |
| 2 | Forests and mosaics with preponderance of forest | Broadleaved evergreen or semi-deciduous forest, broadleaved deciduous forest, needleleaved evergreen forest, needleleaved deciduous forest, broadleaved/needleleaved evergreen mixed forest, broadleaved/needleleaved deciduous mixed forest, mosaic forest-shrubland (50–70%)/grassland (20–50%), broadleaved forest regularly flooded (fresh-brackish water), broadleaved forest-shrubland permanently flooded (saline water) |
| 3 | Shrubland and mosaics with preponderance of low vegetation | Mosaic grassland (50–70%)/Forest-shrubland (20–50%), shrubland |
| 4 | Grassland and sparse vegetation | Grassland, sparse vegetation, grassland/shrubland regularly flooded |
Figure A6.
Spatial distribution of the fire types (FTs) (see main text and Table 1 for definition and further details). The bottom panel shows a zoomed region in central South America, as delineated in the global map.
Figure A6.
Spatial distribution of the fire types (FTs) (see main text and Table 1 for definition and further details). The bottom panel shows a zoomed region in central South America, as delineated in the global map.

Appendix B
Table A2.
Number of grid cells burned for each fuel type (FT) and fire regime (FireReg).
| FireReg1 | FireReg2 | FireReg3 | FireReg4 | Total | Percentage of the Total Burned Cells | |
|---|---|---|---|---|---|---|
| FT1 | 1581 | 2812 | 443 | 992 | 5828 | 6.04 |
| FT2 | 2590 | 4391 | 664 | 1738 | 9383 | 9.72 |
| FT3 | 198 | 408 | 85 | 359 | 1050 | 1.09 |
| FT4 | 47 | 149 | 14 | 170 | 380 | 0.39 |
| FT5 | 945 | 3326 | 389 | 3298 | 7958 | 8.24 |
| FT6 | 443 | 1805 | 204 | 6902 | 9354 | 9.69 |
| FT7 | 174 | 1112 | 120 | 5079 | 6485 | 6.72 |
| FT8 | 201 | 1007 | 537 | 1326 | 3071 | 3.18 |
| FT9 | 1565 | 2769 | 535 | 858 | 5727 | 5.93 |
| FT10 | 3135 | 3214 | 1540 | 562 | 8451 | 8.75 |
| FT11 | 50 | 89 | 48 | 12 | 199 | 0.21 |
| FT12 | 230 | 229 | 121 | 53 | 633 | 0.66 |
| FT13 | 1089 | 3482 | 571 | 1539 | 6681 | 6.92 |
| FT14 | 461 | 568 | 227 | 112 | 1368 | 1.42 |
| FT15 | 319 | 457 | 307 | 17 | 1100 | 1.14 |
| FT16 | 644 | 1253 | 413 | 466 | 2776 | 2.88 |
| FT17 | 4567 | 1612 | 6452 | 70 | 12,701 | 13.16 |
| FT18 | 17 | 2 | 45 | 0 | 64 | 0.07 |
| FT19 | 442 | 85 | 476 | 3 | 1006 | 1.04 |
| FT20 | 514 | 664 | 265 | 97 | 1540 | 1.60 |
| FT21 | 168 | 293 | 331 | 24 | 816 | 0.85 |
| FT22 | 46 | 76 | 39 | 6 | 167 | 0.17 |
| FT23 | 142 | 134 | 107 | 5 | 388 | 0.40 |
| FT24 | 615 | 892 | 306 | 169 | 1982 | 2.05 |
| FT25 | 76 | 76 | 105 | 12 | 269 | 0.28 |
| FT26 | 420 | 389 | 448 | 92 | 1349 | 1.40 |
| FT27 | 483 | 2473 | 1954 | 898 | 5808 | 6.02 |
| Total Burned Cells | 96,534 |
Appendix C
Table A3.
Mean value of each attribute for each identified fire regime selecting five clusters. The standard deviation of the variables is shown in brackets. Correspondence among classes using 4 and 5 clusters: FireReg1 (FireReg2); FireReg2 (FireReg3); FireReg3 (FireReg2); FireReg4 (FireReg1); FireReg5 (FireReg4).
| FireReg1 | FireReg2 | FireReg3 | FireReg4 | FireReg5 | |
|---|---|---|---|---|---|
| # Months | 2.33 (0.71) | 4.25 (0.90) | 2.49 (0.58) | 1.76 (0.65) | 2.92 (0.76) |
| AFS (km2) | 2.04 (1.61) | 7.44 (25.26) | 8.86 (31.22) | 15.86 (67.54) | 15.63 (80.52) |
| AMBA (ha) | 0.82 (0.86) | 18.54 (27.80) | 14.21 (16.30) | 6.29 (8.05) | 190.17 (18.00) |
| FRP (MW) | 23.00 (36.37) | 28.16 (22.94) | 27.78 (23.84) | 44.08 (57.49) | 2053 (10.87) |
| CVBA | 2.62 (0.47) | 1.40 (0.48) | 1.55 (0.44) | 3.39 (0.47) | 0.56 (0.31) |
Figure A7.
Spatial distribution of the global fire regimes identified from the remotely sensed products selecting five clusters as the optimal number of groups. The bottom panel shows a zoomed region in central South America, as delineated in the global map.
Figure A7.
Spatial distribution of the global fire regimes identified from the remotely sensed products selecting five clusters as the optimal number of groups. The bottom panel shows a zoomed region in central South America, as delineated in the global map.

References
- Bowman, D.M.J.S.; Balch, J.K.; Artaxo, P.; Bond, W.J.; Carlson, J.M.; Cochrane, M.A.; D’Antonio, C.M.; DeFries, R.S.; Doyle, J.C.; Harrison, S.P.; et al. Fire in the Earth System. Science 2009, 324, 481. [Google Scholar] [CrossRef] [PubMed]
- Fernández-García, V.; Quintano, C.; Taboada, A.; Marcos, E.; Calvo, L.; Fernández-Manso, A. Remote Sensing Applied to the Study of Fire Regime Attributes and Their Influence on Post-Fire Greenness Recovery in Pine Ecosystems. Remote Sens. 2018, 10, 733. [Google Scholar] [CrossRef] [Green Version]
- Archibald, S.; Lehmann, C.E.R.; Gómez-Dans, J.L.; Bradstock, R.A. Defining pyromes and global syndromes of fire regimes. Proc. Natl. Acad. Sci. USA 2013, 110, 6442. [Google Scholar] [CrossRef] [PubMed] [Green Version]
- Morgan, P.; Hardy, C.C.; Swetnam, T.W.; Rollins, M.G.; Long, D.G. Mapping fire regimes across time and space: Understanding coarse and fine-scale fire patterns. Int. J. Wildland Fire 2001, 10, 329–342. [Google Scholar] [CrossRef] [Green Version]
- Conedera, M.; Tinner, W.; Neff, C.; Meurer, M.; Dickens, A.F.; Krebs, P. Reconstructing past fire regimes: Methods, applications, and relevance to fire management and conservation. Quat. Sci. Rev. 2009, 28, 555–576. [Google Scholar] [CrossRef]
- Forkel, M.; Dorigo, W.; Lasslop, G.; Chuvieco, E.; Hantson, S.; Heil, A.; Teubner, I.; Thonicke, K.; Harrison, S.P. Recent global and regional trends in burned area and their compensating environmental controls. Environ. Res. Commun. 2019, 1, 051005. [Google Scholar] [CrossRef]
- Moreno, M.V.; Conedera, M.; Chuvieco, E.; Pezzatti, G.B. Fire regime changes and major driving forces in Spain from 1968 to 2010. Environ. Sci. Policy 2014, 37, 11–22. [Google Scholar] [CrossRef]
- Krawchuk, M.A.; Moritz, M.A.; Parisien, M.-A.; Van Dorn, J.; Hayhoe, K. Global Pyrogeography: The Current and Future Distribution of Wildfire. PLoS ONE 2009, 4, e5102. [Google Scholar] [CrossRef]
- Artés, T.; Oom, D.; de Rigo, D.; Durrant, T.H.; Maianti, P.; Libertà, G.; San-Miguel-Ayanz, J. A global wildfire dataset for the analysis of fire regimes and fire behaviour. Sci. Data 2019, 6, 296. [Google Scholar] [CrossRef]
- Chuvieco, E.; Giglio, L.; Justice, C. Global characterization of fire activity: Toward defining fire regimes from Earth observation data. Glob. Chang. Biol. 2008, 14, 1488–1502. [Google Scholar] [CrossRef]
- Pechony, O.; Shindell, D.T. Driving forces of global wildfires over the past millennium and the forthcoming century. Proc. Natl. Acad. Sci. USA 2010, 107, 19167. [Google Scholar] [CrossRef] [PubMed] [Green Version]
- Zubkova, M.; Boschetti, L.; Abatzoglou, J.T.; Giglio, L. Changes in Fire Activity in Africa from 2002 to 2016 and Their Potential Drivers. Geophys. Res. Lett. 2019, 46, 7643–7653. [Google Scholar] [CrossRef] [PubMed] [Green Version]
- Kloster, S.; Mahowald, N.M.; Randerson, J.T.; Lawrence, P.J. The impacts of climate, land use, and demography on fires during the 21st century simulated by CLM-CN. Biogeosciences 2012, 9, 509–525. [Google Scholar] [CrossRef]
- Bowman, D.M.J.S.; Balch, J.; Artaxo, P.; Bond, W.J.; Cochrane, M.A.; D’Antonio, C.M.; DeFries, R.; Johnston, F.H.; Keeley, J.E.; Krawchuk, M.A.; et al. The human dimension of fire regimes on Earth. J. Biogeogr. 2011, 38, 2223–2236. [Google Scholar] [CrossRef] [Green Version]
- Marlon, J.R.; Bartlein, P.J.; Carcaillet, C.; Gavin, D.G.; Harrison, S.P.; Higuera, P.E.; Joos, F.; Power, M.J.; Prentice, I.C. Climate and human influences on global biomass burning over the past two millennia. Nat. Geosci. 2008, 1, 697–702. [Google Scholar] [CrossRef]
- Wang, Z.; Chappellaz, J.; Park, K.; Mak, J.E. Large Variations in Southern Hemisphere Biomass Burning During the Last 650 Years. Science 2010, 330, 1663–1666. [Google Scholar] [CrossRef] [Green Version]
- Chuvieco, E. Fundamentals of Satellite Remote Sensing: An Environmental Approach, 3rd ed.; CRC Press: Boca Raton, FL, USA, 2020. [Google Scholar]
- Archibald, S.; Scholes, R.J.; Roy, D.P.; Roberts, G.; Boschetti, L. Southern African fire regimes as revealed by remote sensing. Int. J. Wildland Fire 2010, 19, 861–878. [Google Scholar] [CrossRef] [Green Version]
- Dwomoh, F.K.; Wimberly, M.C. Fire Regimes and Their Drivers in the Upper Guinean Region of West Africa. Remote Sens. 2017, 9, 1117. [Google Scholar] [CrossRef] [Green Version]
- Rollins, M.G.; Keane, R.E.; Parsons, R.A. Mapping fuels and fire regimes using remote sensing, ecosystem simulation, and gradient modelling. Ecol. Appl. 2004, 14, 75–95. [Google Scholar] [CrossRef] [Green Version]
- Sukhinin, A.I.; French, N.H.F.; Kasischke, E.S.; Hewson, J.H.; Soja, A.J.; Csiszar, I.A.; Hyer, E.J.; Loboda, T.; Conrad, S.G.; Romasko, V.I.; et al. AVHRR-based mapping of fires in Russia: New products for fire management and carbon cycle studies. Remote Sens. Environ. 2004, 93, 546–564. [Google Scholar] [CrossRef]
- Balch, J.K.; St. Denis, L.A.; Mahood, A.L.; Mietkiewicz, N.P.; Williams, T.M.; McGlinchy, J.; Cook, M.C. FIRED (Fire Events Delineation): An Open, Flexible Algorithm and Database of US Fire Events Derived from the MODIS Burned Area Product (2001–2019). Remote Sens. 2020, 12, 3498. [Google Scholar] [CrossRef]
- Carmona-Moreno, C.; Belward, A.; Malingreau, J.-P.; Hartley, A.; Garcia-Alegre, M.; Antonovskiy, M.; Buchshtaber, V.; Pivovarov, V. Characterizing interannual variations in global fire calendar using data from Earth observing satellites. Glob. Chang. Biol. 2005, 11, 1537–1555. [Google Scholar] [CrossRef]
- Riaño, D.; Moreno Ruiz, J.A.; Isidoro, D.; Ustin, S.L. Global spatial patterns and temporal trends of burned area between 1981 and 2000 using NOAA-NASA Pathfinder. Glob. Chang. Biol. 2007, 13, 40–50. [Google Scholar] [CrossRef]
- Hantson, S.; Lasslop, G.; Kloster, S.; Chuvieco, E. Anthropogenic effects on global mean fire size. Int. J. Wildland Fire 2015, 24, 589–596. [Google Scholar] [CrossRef]
- Chuvieco, E.; Pettinari, M.L.; Koutsias, N.; Forkel, M.; Hantson, S.; Turco, M. Human and climate drivers of global biomass burning variability. Sci. Total Environ. 2021, 779, 146361. [Google Scholar] [CrossRef] [PubMed]
- Padilla, M.; Stehman, S.V.; Chuvieco, E. Validation of the 2008 MODIS-MCD45 global burned area product using stratified random sampling. Remote Sens. Environ. 2014, 144, 187–196. [Google Scholar] [CrossRef]
- Ramo, R.; Roteta, E.; Bistinas, I.; van Wees, D.; Bastarrika, A.; Chuvieco, E.; van der Werf, G.R. African burned area and fire carbon emissions are strongly impacted by small fires undetected by coarse resolution satellite data. Proc. Natl. Acad. Sci. USA 2021, 118, e2011160118. [Google Scholar] [CrossRef]
- Andela, N.; Morton, D.C.; Giglio, L.; Paugam, R.; Chen, Y.; Hantson, S.; van der Werf, G.R.; Randerson, J.T. The Global Fire Atlas of individual fire size, duration, speed and direction. Earth Syst. Sci. Data 2019, 11, 529–552. [Google Scholar] [CrossRef] [Green Version]
- Laurent, P.; Mouillot, F.; Yue, C.; Ciais, P.; Moreno, M.V.; Nogueira, J.M.P. FRY, a global database of fire patch functional traits derived from space-borne burned area products. Sci. Data 2018, 5, 180132. [Google Scholar] [CrossRef] [Green Version]
- Moreno, M.V.; Laurent, P.; Mouillot, F. Global intercomparison of functional pyrodiversity from two satellite sensors. Int. J. Remote Sens. 2021, 42, 9523–9541. [Google Scholar] [CrossRef]
- Wooster, M.J.; Roberts, G.; Perry, G.L.W.; Kaufman, Y.J. Retrieval of biomass combustion rates and totals from fire radiative power observations: FRP derivation and calibration relationships between biomass consumption and fire radiative energy release. J. Geophys. Res. Atmos. 2005, 110, D24311. [Google Scholar] [CrossRef]
- Lizundia-Loiola, J.; Otón, G.; Ramo, R.; Chuvieco, E. A spatio-temporal active-fire clustering approach for global burned area mapping at 250 m from MODIS data. Remote Sens. Environ. 2020, 236, 111493. [Google Scholar] [CrossRef]
- Oom, D.; Silva, P.C.; Bistinas, I.; Pereira, J.M.C. Highlighting Biome-Specific Sensitivity of Fire Size Distributions to Time-Gap Parameter Using a New Algorithm for Fire Event Individuation. Remote Sens. 2016, 8, 663. [Google Scholar] [CrossRef] [Green Version]
- Nogueira, J.M.P.; Ruffault, J.; Chuvieco, E.; Mouillot, F. Can We Go Beyond Burned Area in the Assessment of Global Remote Sensing Products with Fire Patch Metrics? Remote Sens. 2017, 9, 7. [Google Scholar] [CrossRef] [Green Version]
- Laurent, P.; Mouillot, F.; Moreno, M.V.; Yue, C.; Ciais, P. Varying relationships between fire radiative power and fire size at a global scale. Biogeosciences 2019, 16, 275–288. [Google Scholar] [CrossRef] [Green Version]
- Steinley, D. K-means clustering: A half-century synthesis. Br. J. Math. Stat. Psychol. 2006, 59, 1–34. [Google Scholar] [CrossRef] [Green Version]
- Campello, R.J.G.B.; Hruschka, E.R. A fuzzy extension of the silhouette width criterion for cluster analysis. Fuzzy Sets Syst. 2006, 157, 2858–2875. [Google Scholar] [CrossRef]
- Kodinariya, T.M.; Makwana, P.R. Review on determining number of Cluster in K-Means Clustering. Int. J. Adv. Res. Comput. Sci. Manag. Stud. 2013, 1, 90–95. [Google Scholar]
- Bholowalia, P.; Kumar, A. EBK-Means: A Clustering Technique based on Elbow Method and K-Means in WSN. Int. J. Comput. Appl. 2014, 105, 17–24. [Google Scholar]
- Rousseeuw, P.J. Silhouettes: A graphical aid to the interpretation and validation of cluster analysis. J. Comput. Appl. Math. 1987, 20, 53–65. [Google Scholar] [CrossRef] [Green Version]
- Kaufman, L.; Rousseeuw, P.J. Finding Groups in Data: An Introduction to Cluster Analysis; J. Wiley & Son: New York, NY, USA, 1990. [Google Scholar]
- Pettinari, M.L.; Chuvieco, E. Generation of a global fuel data set using the Fuel Characteristic Classification System. Biogeosciences 2016, 13, 2061–2076. [Google Scholar] [CrossRef] [Green Version]
- Healey, J.F. Statistics: A Tool for Social Research; Wadsworth Pub. Co.: Belmont, CA, USA, 1993. [Google Scholar]
- Thonicke, K.; Venevsky, S.; Sitch, S.; Cramer, W. The role of fire disturbance for global vegetation dynamics: Coupling fire into a Dynamic Global Vegetation Model. Glob. Ecol. Biogeogr. 2001, 10, 661–677. [Google Scholar] [CrossRef] [Green Version]
- Strauss, D.; Bednar, L.; Mees, R. Do one percent of forest fires cause ninety-nine percent of the damage? For. Sci. 1989, 35, 319–328. [Google Scholar]
- Johnson, E.A.; Miyanishi, K.; Bridge, S.R.J. Wildfire Regime in the Boreal Forest and the Idea of Suppression and Fuel Buildup. Conserv. Biol. 2001, 15, 1554–1557. [Google Scholar] [CrossRef]
- Pyne, S.J.; Andrews, P.L.; Laven, R.D. Introduction to Wildland Fire; Wiley & Sons: New York, NY, USA, 1996. [Google Scholar]
- Harrison, S.P.; Prentice, I.C.; Bloomfield, K.J.; Dong, N.; Forkel, M.; Forrest, M.; Ningthoujam, R.K.; Pellegrini, A.; Shen, Y.; Baudena, M.; et al. Understanding and modelling wildfire regimes: An ecological perspective. Environ. Res. Lett. 2021, 16, 125008. [Google Scholar] [CrossRef]
- Pivello, V.R. The Use of Fire in the Cerrado and Amazonian Rainforests of Brazil: Past and Present. Fire Ecol. 2011, 7, 24–39. [Google Scholar] [CrossRef]
- Hoffmann, W.A.; Orthen, B.; Nascimento, P.K.V.d. Comparative fire ecology of tropical savanna and forest trees. Funct. Ecol. 2003, 17, 720–726. [Google Scholar] [CrossRef]
- Simon, M.F.; Pennington, T. Evidence for Adaptation to Fire Regimes in the Tropical Savannas of the Brazilian Cerrado. Int. J. Plant Sci. 2012, 173, 711–723. [Google Scholar] [CrossRef]
- Rosan, T.M.; Sitch, S.; Mercado, L.M.; Heinrich, V.; Friedlingstein, P.; Aragão, L.E.O.C. Fragmentation-Driven Divergent Trends in Burned Area in Amazonia and Cerrado. Front. For. Glob. Chang. 2022, 5, 801408. [Google Scholar] [CrossRef]
- Xu, J.; Morris, P.J.; Liu, J.; Holden, J. PEATMAP: Refining estimates of global peatland distribution based on a meta-analysis. Catena 2018, 160, 134–140. [Google Scholar] [CrossRef] [Green Version]
- Turetsky, M.R.; Benscoter, B.; Page, S.; Rein, G.; van der Werf, G.R.; Watts, A. Global vulnerability of peatlands to fire and carbon loss. Nat. Geosci. 2015, 8, 11–14. [Google Scholar] [CrossRef]
- Hantson, S.; Pueyo, S.; Chuvieco, E. Global fire size distribution is driven by human impact and climate. Glob. Ecol. Biogeogr. 2015, 24, 77–86. [Google Scholar] [CrossRef]
- Franquesa, M.; Lizundia-Loiola, J.; Stehman, S.V.; Chuvieco, E. Using long temporal reference units to assess the spatial accuracy of global satellite-derived burned area products. Remote Sens. Environ. 2022, 269, 112823. [Google Scholar] [CrossRef]
- Moreno, M.V.; Laurent, P.; Ciais, P.; Mouillot, F. Assessing satellite-derived fire patches with functional diversity trait methods. Remote Sens. Environ. 2020, 247, 111897. [Google Scholar] [CrossRef]
- Chuvieco, E.; Pettinari, M.L.; Roteta, E.; Storm, T.; Boettcher, M. ESA Fire Climate Change Initiative (Fire_cci): Small Fire Dataset (SFD) Burned Area Pixel Product for Sub-Saharan Africa, version 2.0. NERC EDS Centre for Environmental Data Analysis; Published on 16 August 2021. Available online: https://catalogue.ceda.ac.uk/uuid/4c5feb539f1f44308ca7ec26e0bb7316 (accessed on 23 April 2022).
Figure 1.
(a) Elbow plot for the identification of the optimal number of clusters. (b) Silhouette plot for the validation of the number of clusters identified.
Figure 1.
(a) Elbow plot for the identification of the optimal number of clusters. (b) Silhouette plot for the validation of the number of clusters identified.

Figure 2.
Spatial distribution of the global fire regimes identified from the remotely sensed products. The bottom panel shows a zoomed region in central South America, as delineated in the global map.
Figure 2.
Spatial distribution of the global fire regimes identified from the remotely sensed products. The bottom panel shows a zoomed region in central South America, as delineated in the global map.

Figure 3.
Percentage of each fuel type (FT) that comprise each Fire Regime (FireReg). Numbers indicate the percentage of each fuel type for each fire regime. FTs with no percentage indicated have values < 2%.
Figure 3.
Percentage of each fuel type (FT) that comprise each Fire Regime (FireReg). Numbers indicate the percentage of each fuel type for each fire regime. FTs with no percentage indicated have values < 2%.

Figure 4.
Percentage of each fire regime (FireReg) that comprise each fuel type (FT). Numbers indicate the percentage of each fire regime for each fuel type.
Figure 4.
Percentage of each fire regime (FireReg) that comprise each fuel type (FT). Numbers indicate the percentage of each fire regime for each fuel type.

Table 1.
Biome and land cover combination of the fuel types analyzed in this study.
| Fuel Type | Reclassified Biome | Reclassified Land Cover |
|---|---|---|
| FT1 | 1. Tropical moist forests | 1. Crops and mosaics with crops |
| FT2 | 2. Forests and mosaics with preponderance of forest | |
| FT3 | 3. Shrubland and mosaics with preponderance of low vegetation | |
| FT4 | 4. Grassland and sparse vegetation | |
| FT5 | 2. Tropical dry forests, shrublands and grasslands | 1. Crops and mosaics with crops |
| FT6 | 2. Forests and mosaics with preponderance of forest | |
| FT7 | 3. Shrubland and mosaics with preponderance of low vegetation | |
| FT8 | 4. Grassland and sparse vegetation | |
| FT9 | 3. Temperate forests | 1. Crops and mosaics with crops |
| FT10 | 2. Forests and mosaics with preponderance of forest | |
| FT11 | 3. Shrubland and mosaics with preponderance of low vegetation | |
| FT12 | 4. Grassland and sparse vegetation | |
| FT13 | 4. Temperate shrublands and grasslands | 1. Crops and mosaics with crops |
| FT14 | 2. Forests and mosaics with preponderance of forest | |
| FT15 | 3. Shrubland and mosaics with preponderance of low vegetation | |
| FT16 | 4. Grassland and sparse vegetation | |
| FT17 | 5. Boreal forests and tundra | 1. Forests and mosaics with preponderance of forest |
| FT18 | 2. Shrubland and mosaics with preponderance of low vegetation | |
| FT19 | 3. Grassland and sparse vegetation | |
| FT20 | 6. Mediterranean forests and woodlands | 1. Crops and mosaics with crops |
| FT21 | 2. Forests and mosaics with preponderance of forest | |
| FT22 | 3. Shrubland and mosaics with preponderance of low vegetation | |
| FT23 | 4. Grassland and sparse vegetation | |
| FT24 | 7. Desert and xeric shrublands | 1. Crops and mosaics with crops |
| FT25 | 2. Forests and mosaics with preponderance of forest | |
| FT26 | 3. Shrubland and mosaics with preponderance of low vegetation | |
| FT27 | 4. Grassland and sparse vegetation |
Table 2.
Mean value of each attribute for each identified fire regime. The standard deviation of the variables is shown in brackets.
Table 2.
Mean value of each attribute for each identified fire regime. The standard deviation of the variables is shown in brackets.
| FireReg1 | FireReg2 | FireReg3 | FireReg4 | |
|---|---|---|---|---|
| # Months | 2.26 (0.72) | 3.02 (0.90) | 1.77 (0.66) | 3.00 (0.88) |
| AFS (km2) | 2.04 (1.59) | 6.54 (16.79) | 17.4 (70.68) | 15.84 (76.72) |
| AMBA (km2) | 0.82 (0.86) | 11.48 (12.65) | 7.29 (9.25) | 162.95 (151.41) |
| FRP (MW) | 22.89 (36.50) | 27.62 (23.28) | 45.10 (57.47) | 21.65 (12.46) |
| CVBA | 2.66 (0.49) | 1.56 (0.42) | 3.33 (0.52) | 0.65 (0.36) |
Publisher’s Note: MDPI stays neutral with regard to jurisdictional claims in published maps and institutional affiliations. |
© 2022 by the authors. Licensee MDPI, Basel, Switzerland. This article is an open access article distributed under the terms and conditions of the Creative Commons Attribution (CC BY) license (https://creativecommons.org/licenses/by/4.0/).
Share and Cite
MDPI and ACS Style
García, M.; Pettinari, M.L.; Chuvieco, E.; Salas, J.; Mouillot, F.; Chen, W.; Aguado, I. Characterizing Global Fire Regimes from Satellite-Derived Products. Forests 2022, 13, 699. https://0-doi-org.brum.beds.ac.uk/10.3390/f13050699
AMA Style
García M, Pettinari ML, Chuvieco E, Salas J, Mouillot F, Chen W, Aguado I. Characterizing Global Fire Regimes from Satellite-Derived Products. Forests. 2022; 13(5):699. https://0-doi-org.brum.beds.ac.uk/10.3390/f13050699
Chicago/Turabian StyleGarcía, Mariano, M. Lucrecia Pettinari, Emilio Chuvieco, Javier Salas, Florent Mouillot, Wentao Chen, and Inmaculada Aguado. 2022. "Characterizing Global Fire Regimes from Satellite-Derived Products" Forests 13, no. 5: 699. https://0-doi-org.brum.beds.ac.uk/10.3390/f13050699
Note that from the first issue of 2016, this journal uses article numbers instead of page numbers. See further details here.