
Giant Trees Exhibited Great Cooling Effect in Residential Area Southwest of China
1
College of Environment and Ecology, Chongqing University, Chongqing 400045, China
2
Key Laboratory of the Three Gorges Reservoir Region’s Eco-environment, Ministry of Education, Chongqing University, Chongqing 400045, China
3
Guangdong Institute of Eco-Environment & Soil Science, Guangzhou 510650, China
4
School of Business Administration, Chongqing Technology and Business University, Chongqing 400067, China
*
Author to whom correspondence should be addressed.
Forests 2022, 13(9), 1516; https://0-doi-org.brum.beds.ac.uk/10.3390/f13091516
Submission received: 31 July 2022
/
Revised: 15 September 2022
/
Accepted: 16 September 2022
/
Published: 19 September 2022
(This article belongs to the Special Issue Advances on the Influence of Vegetation and Forest on Urban Air Quality and Thermal Comfort)
Abstract
:In recent years, extreme weather has become more and more frequent. The extreme heat in summer is a serious threat to human health. Chongqing is one of the hottest cities in China, and the high temperature in summer can cause skin cancer and heat stroke. Green plants in residential areas play a great role in cooling down air temperature. However, there are no accurate numerical references for which plants have a better cooling effect. Therefore, seven species of trees with the highest planting rate were selected in seven residential areas as research objects in this study. By measuring the temperature under the trees and related control factors, this study was conducted to clarify the following: (1) Which species of tree has the best cooling effect? (2) Whether tree species and size matter with the cooling effect. (3) What are the controlling factors and principles that affect the tree cooling effect? The results showed that: (1) Giant trees have the best cooling effect. (2) The cooling effects of Ficus virens, Camphor tree, and Ficus macrocarpa were significantly better than the other four species of trees. (3) The high rate of water replenishment in plants gives giant trees a greater cooling effect. This study is of great practical significance to the selection of plants in the green belt of residential communities, and has great theoretical significance to understand the principle of the plant cooling effect.
1. Introduction
In recent years, the frequency of extreme weather has been increasing, especially extreme heat weather, which poses a serious threat to people’s health [1,2]. Extreme heat can cause serious direct damage to the human body, such as skin cancer and heat stroke [3], and it also can make urban roads very hot and potentially threaten the tires of vehicles [4]. With the rapid development of cities, the proportion of concrete buildings and pavement is increasing, which leads to an increasingly serious urban heat island effect [5,6,7]. To mitigate the heat island effect, urban green belts are widely used. Urban green belts, occupying a very important position in the city, have the effect of purifying the environment and beautifying the city. It is easy to understand that the plant green belt in residential areas can improve resistance to high temperatures to some extent [8]. The green belt has been extensively studied [9,10,11,12,13]. For example, Amati and Yokohari argued that a new green space planning concept should be implemented that explicitly refers to the green belt’s role in restoring landscapes. [9]. Boentje and Blinnikov found that a trend toward less tree cover and more suburban development in the immediate vicinity of a large city is likely to result in worsening air quality and negative impacts on wildlife and opportunities [10]. Kowarik indicated that the new greenway may reduce environmental inequity in Berlin as it largely intersects neighborhoods where disadvantaged status coincides with poor access to urban green space [11]. Pathak et al. evaluated the performance of some tree species for green belt development to mitigate traffic-generated noise, then the most suitable plant species for green belt development in urban areas were identified and recommended [12]. Prajapati and Tripathi evaluated the Air Pollution Tolerance Index (APTI) of the green belt by analyzing important biochemical parameters, then identified and recommended the most suitable plant species for green belt development in urban areas for long-term air pollution management [13]. Kubilay concluded that mitigation solutions for the urban heat island effect and heat waves, which should include vegetation, evaporative cooling pavements, and neighborhood morphology, are assessed in terms of pedestrian comfort and building energy consumption [14]. Manickathan found that the shading provided by trees improves thermal comfort more than that of the transportive cooling effect of a single row of trees, and taller trees are more beneficial because the vegetation canopy with high leaf temperatures is further away from the pedestrian level [15]. It can be concluded that the green belt can be composed of different plants, such as various grass, shrubs, and arbor trees, and the functions of each plant show obvious differences. Obviously, the green belt has a cooling effect on air temperature; therefore, a variety of plants are planted near residential buildings to relieve the heat [16]. There is a Chinese proverb, it is good to enjoy the shade under giant trees. It is a good place under the giant tree where the temperature is cooler, which helps people cope with the hot summer more easily. Trees are well known for shading, and their transpiration has a significant cooling effect [17]. However, the specific cooling principle and process are often overlooked in the cooling process of trees.
Chongqing is one of the hottest cities in China, with a subtropical humid monsoon climate [18]. It is located on the southeastern edge of the Sichuan Basin in southwest China, among several parallel mountain ranges that run in the same direction [19]. This terrain is called parallel Ridge Valley and its geographical environment characteristics have a great influence on climate. The southeast monsoon from the Pacific Ocean and the southwest monsoon from the Indian Ocean are blocked by parallel mountains, such as tall mountains around the basin, making it difficult to cross these natural barriers and send cold air to Chongqing inside the basin [20]. Even if there is a chance to break through the siege, when cold air sinks down into the basin from the tall mountains on all sides, it absorbs the surrounding heat, causing water vapor to evaporate and the air temperature to rise, forming the dry hot foehn wind, which exacerbates the hot weather in Chongqing. Chongqing’s urban parallel low-lying valley leads to high air density at the bottom of the atmosphere. A dense atmosphere during the day in summer has little effect on weakening solar radiation, while thick clouds at night prevent ground heat radiation into the air [21]. In addition, high-rise and dense buildings block the air circulation, weakening the wind speed, and the hot air cannot diffuse in Chongqing city [22]. In densely populated urban areas, and developed industrial and commercial areas, there is a lot of equipment with high energy consumption, and more heat is discharged into the air, which further intensifies the heat island effect in the Chongqing urban area [23].
Therefore, the temperature under different tree species was studied in seven residential communities in the Nanan district of Chongqing in order to clarify the related control factors. The objectives of the paper are: (1) Which species of tree has the best cooling effect? (2) Whether tree species and size matter with the cooling effect. (3) What are the controlling factors and principles that affect the tree cooling effect? This study is of great practical significance to the selection of plants in the green belt of residential communities and has great theoretical significance to understand the principle of the plant cooling effect.
2. Materials and Methods
2.1. Study Area
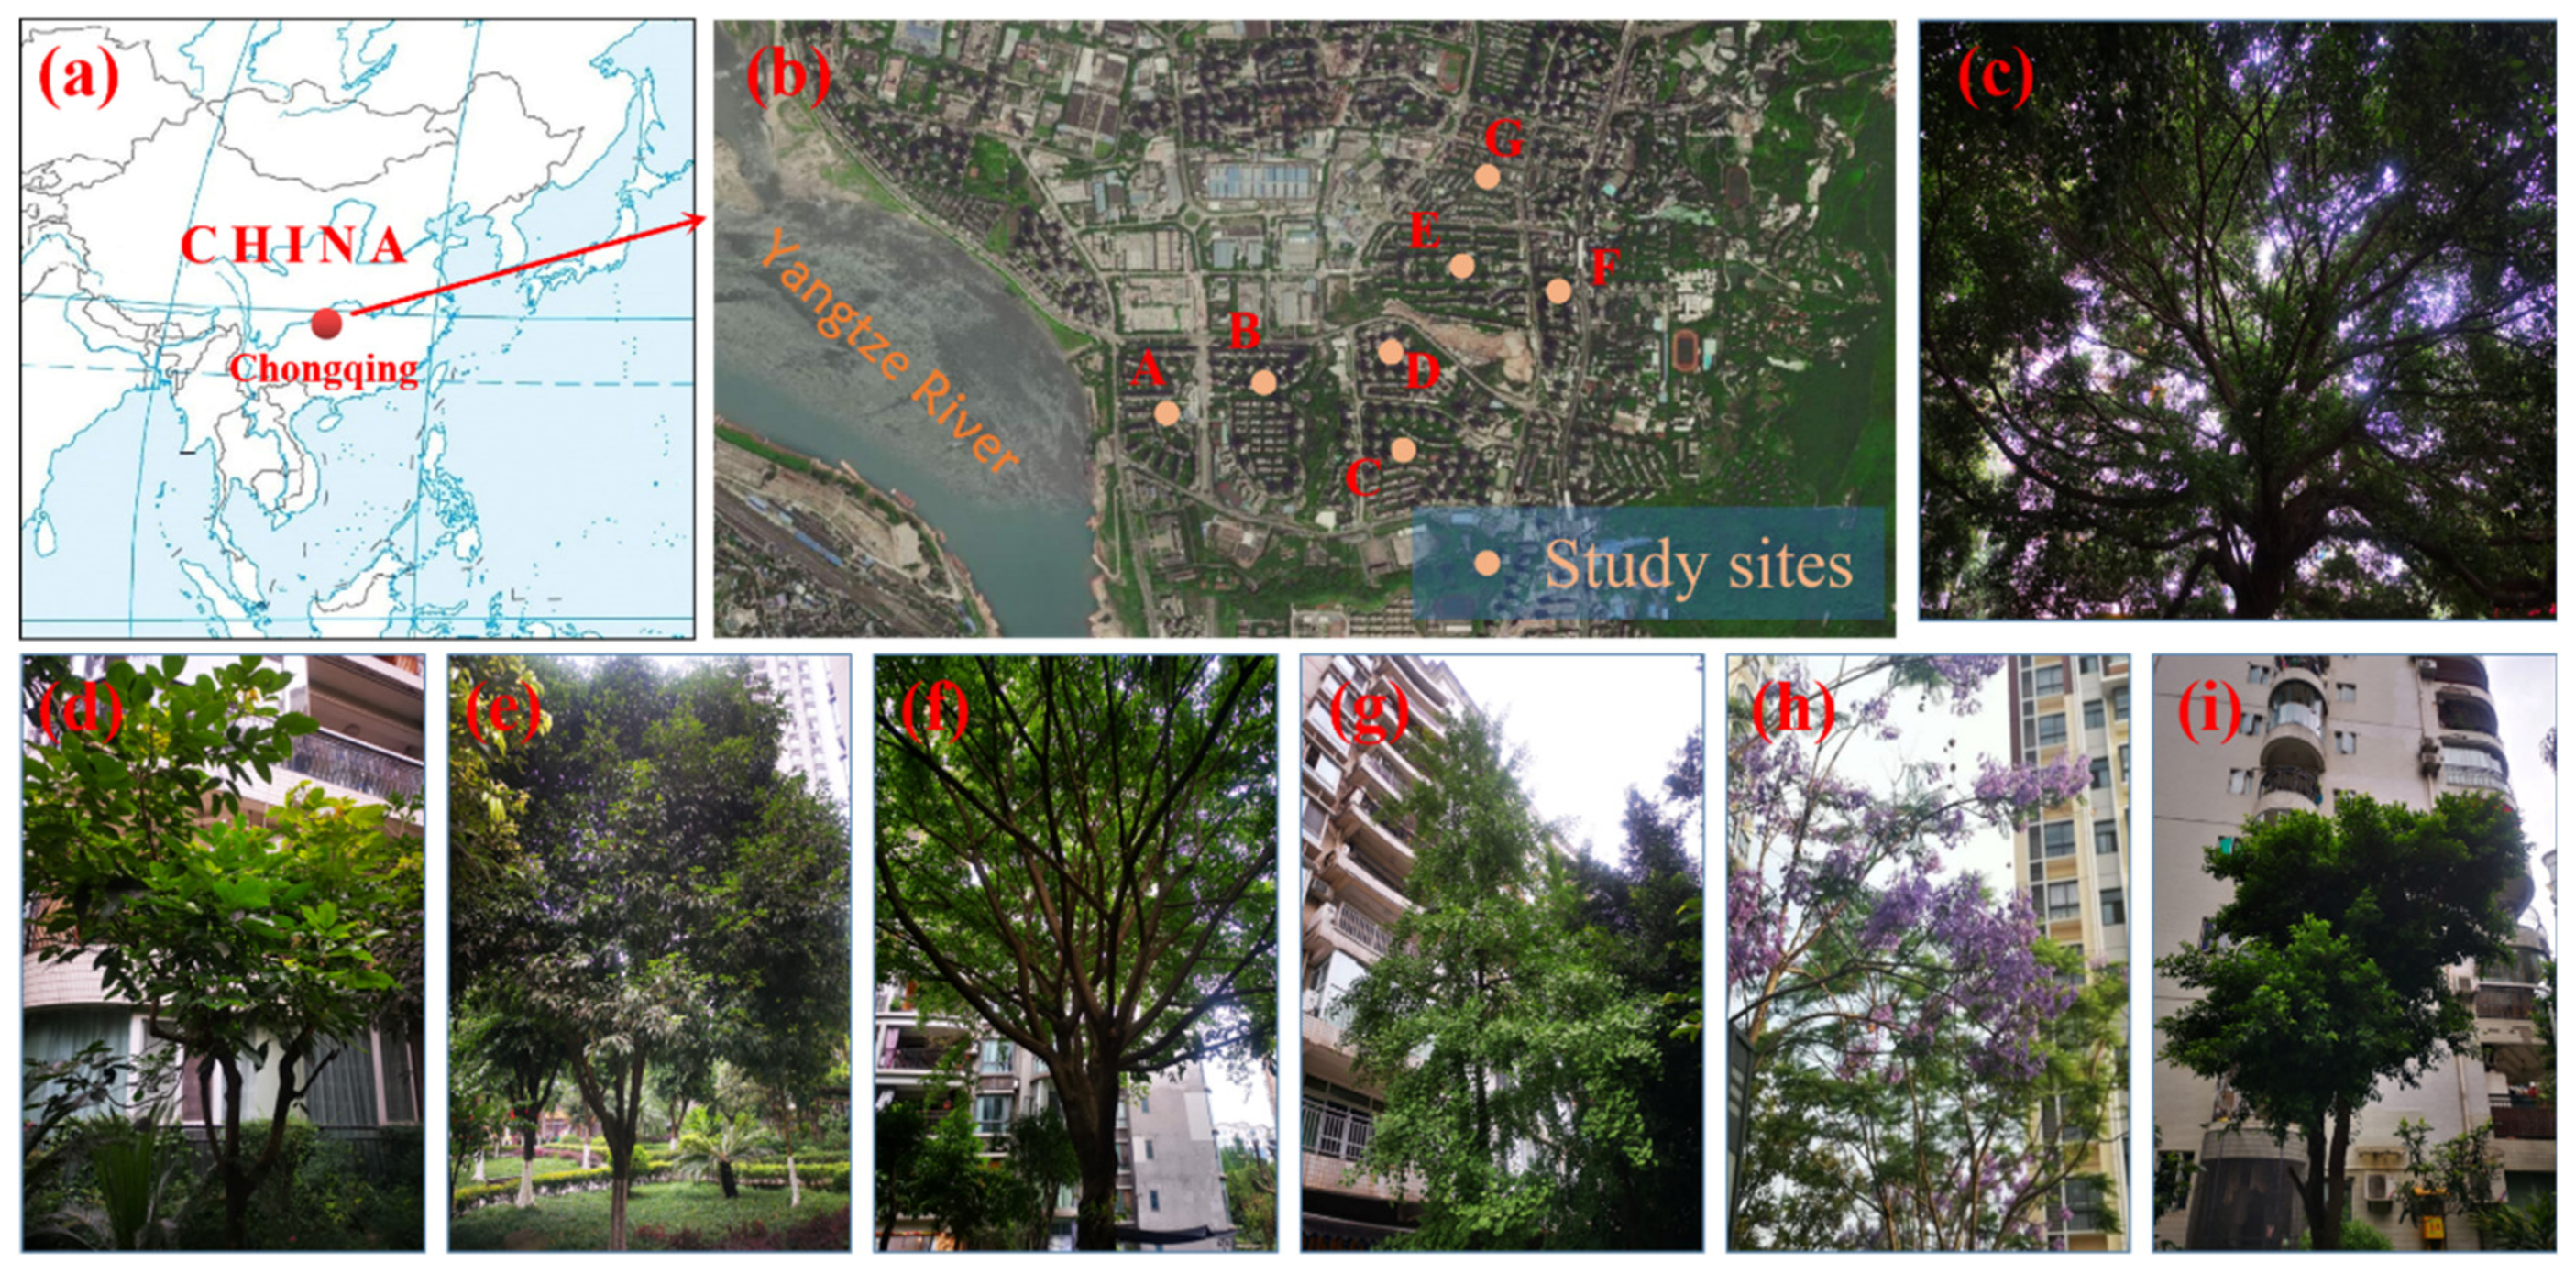
The study area was situated in the Nanan district (106°3′14″–106°47′2″ E, 29°27′2″–29°37′2″ N) of Chongqing, China (Figure 1). The area is located in the eastern Sichuan parallel range-valley area, with anticline and syncline distributed in parallel, constituting the combination of low mountains, hills, small flats, and rivers [24,25]. The elevation of Chongqing’s main urban area is mostly between 168 and 400 meters. The highest peak of the city is Yintiaoling, the main peak of Jieliang Mountain on the eastern edge of Wuxi County, 2796.8 meters above sea level. The lowest location is the water surface of the Yangtze River in Wushan County, 73.1 meters above sea level. The elevation difference in Chongqing is 2723.7 meters [26]. Chongqing has a subtropical monsoon humid climate, the average annual temperature is 16~18 °C, the Yangtze River valley Banan, Qijiang, Yunyang, and other places are up to 18.5 °C; the southeast Qianjiang, Youyang, and other places are 14–16 °C; the northeast higher elevation of Chengkou is only 13.7 °C; and the hottest month average temperature is 26–29 °C and the coldest month average temperature is 4–8 °C. The annual average relative humidity in Chongqing is mostly 70%–80%, which is a high humidity area in China [27]. The annual sunshine duration is 1000–1400 hours, and the sunshine percentage is only 25%–35%. With a subtropical monsoon climate, the Nanan district is rich in heat, abundant rainfall, long frost-free period, and little wind [19]. The annual average temperature is 18.5 °C and rainfall is approximately 1097.8 mm [28]. In our study, 7 residential communities were selected, which were built around the year 2000.
2.2. Experiment Design and Field Measurements
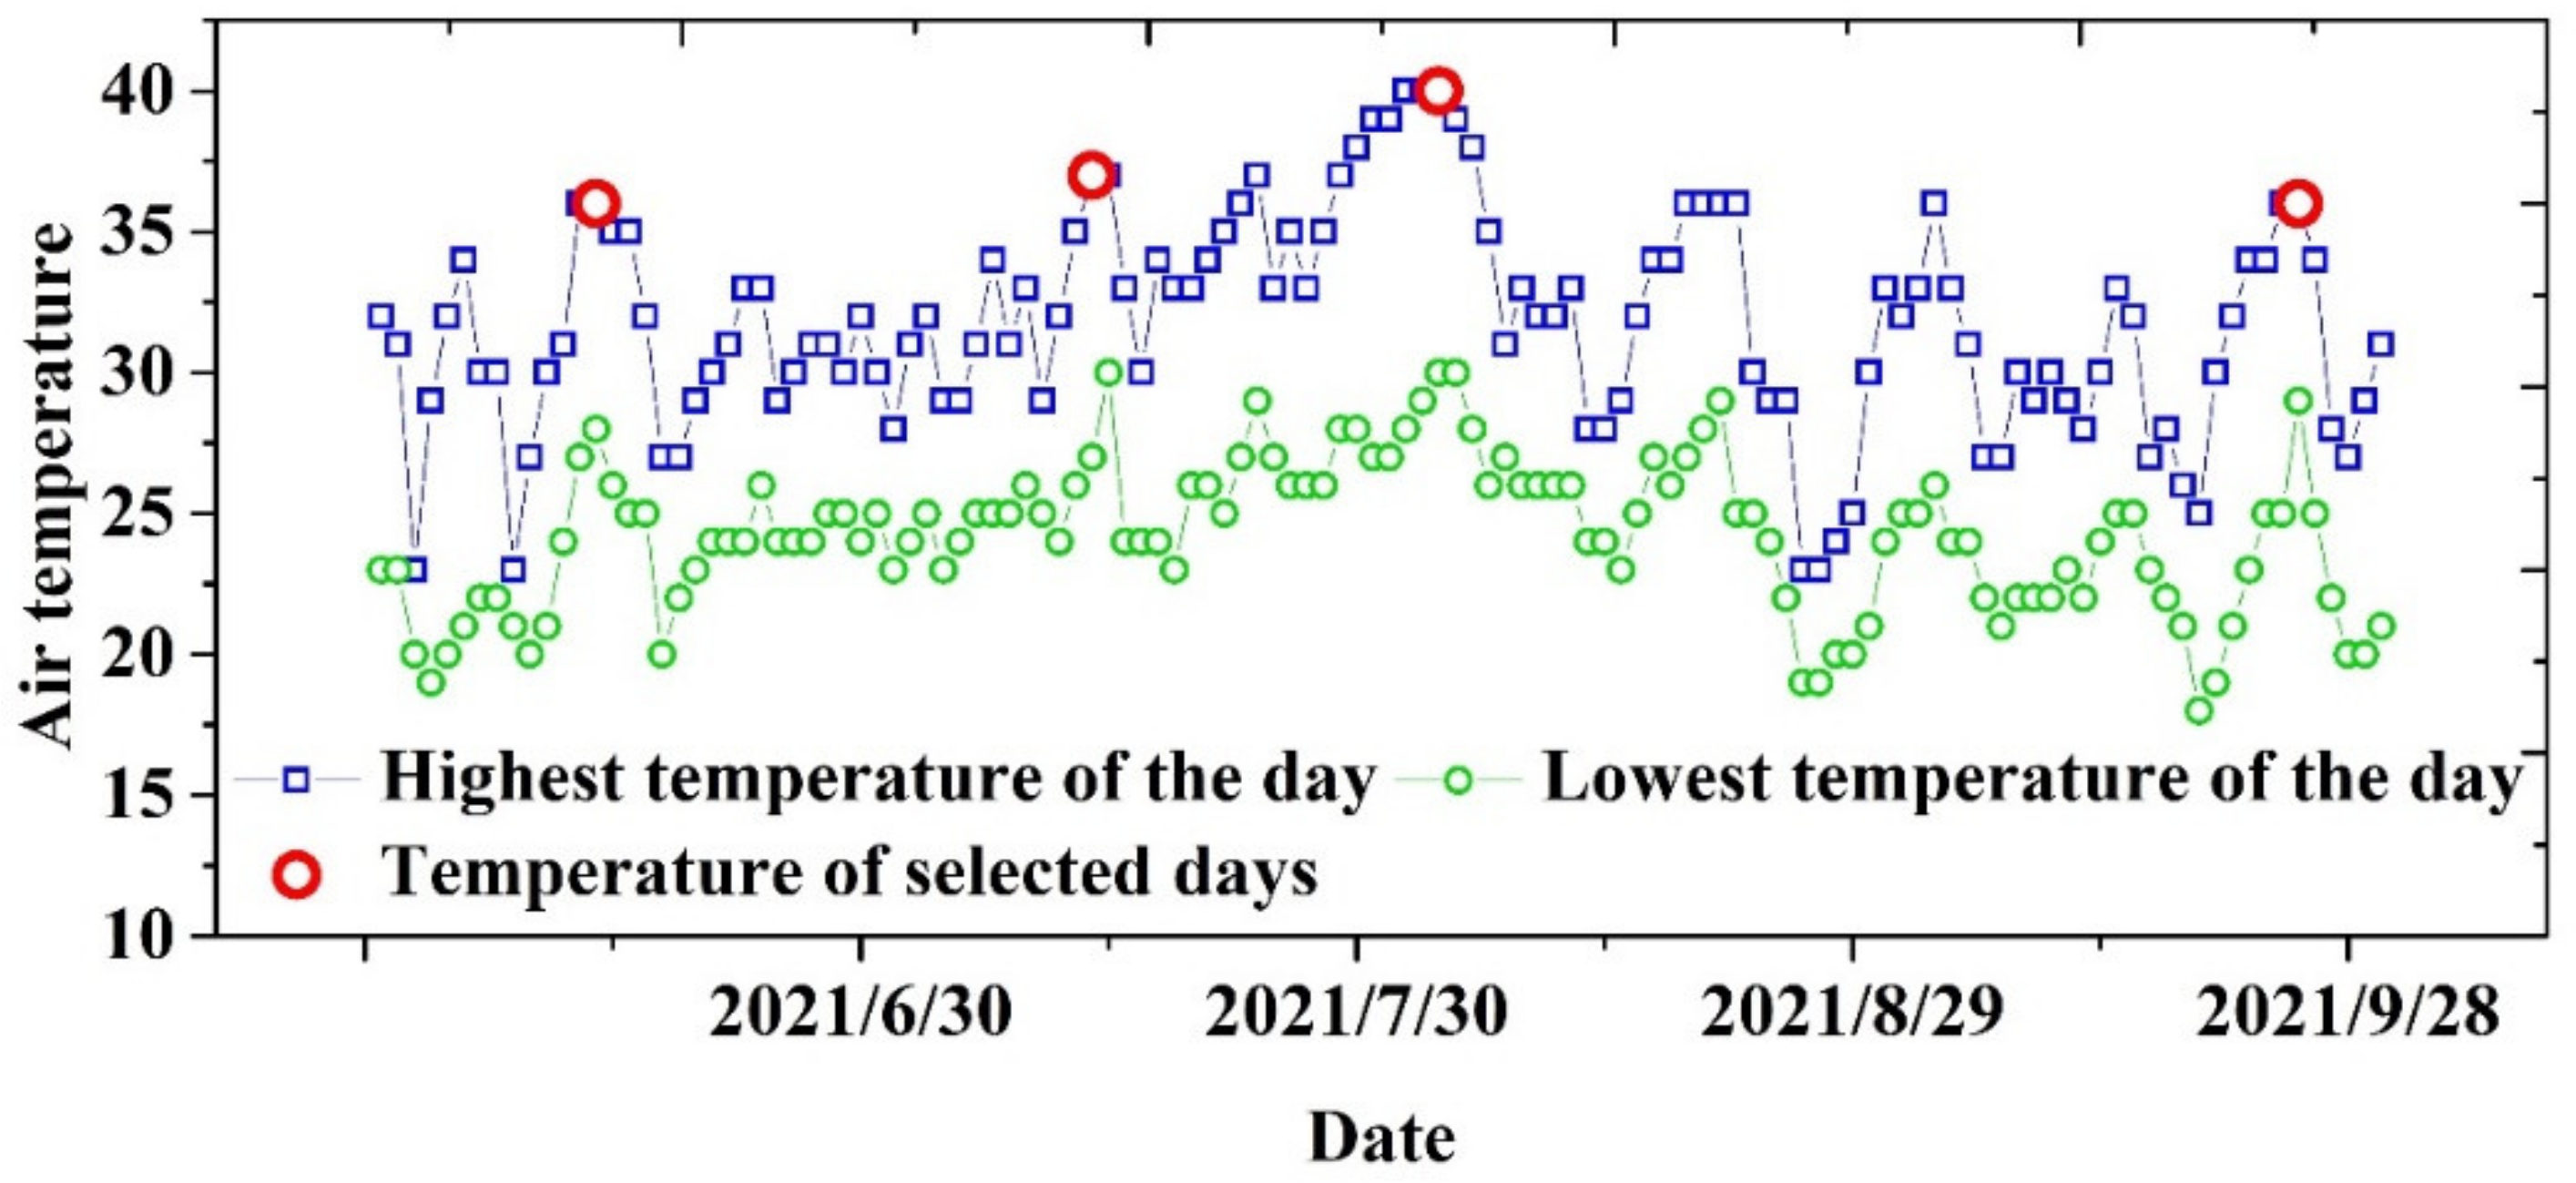
In our study, the most common 7 species of trees were selected in 7 residential communities, and for each species, 6 trees were selected based on different DBH (Diameter at breast height). All 6 trees of the same species were numbered from 1 to 6 (Control No.) according to DBH from large to small to make it easier to distinguish. The data were recorded from 1 June 2021 to 31 September 2021. As shown in Figure 2, the typical hottest days in each of the four months were selected as experimental days, which are 14 June, 14 July, 4 August, and 25 September, respectively.
To obtain deep soil temperature, soil temperature sensors (RR-7710, RS-Ltd., Hong Kong, China) were installed at 60 cm depth, the data was automatic continuous monitoring once every 5 minutes. Air temperature sensors (10TH) were used to measure air temperature automatically and continuously once every 5 minutes at 1.5 m height. TDP (Thermal Dissipation Probes, automatic continuous monitoring once every 5 minutes) were implanted in tree trunks at 1.5 m height to monitor the temperature of sap flow. The leaf area index (LAI) was measured once every 10–15 days using an LAI-2200C (LI-COR Ltd., Lincoln, NE, USA). The study was just in the peak growth period, and LAI did not change much; therefore, the data of LAI measured on 1 August were used in the study. Canopy height and canopy area were estimated by unmanned aerial vehicle (UAV, Dji-M600Pro) photos on 1 August. In addition, all these 7 types of trees were near to each other (<1 km), and solar radiation and wind conditions were almost the same for them. Therefore, these factors were not the controls for the difference in cooling effect among different trees.
2.3. Multiple Linear Regression
To clarify the relationship between DTa (temperature difference between the tree trunk and deep soil) and its control factors, multiple linear regression was used in this study. Multiple linear regression is a generalization of simple linear regression, which studies the quantitative dependence between a dependent variable and multiple independent variables. The mathematical formula of multiple linear regression can be expressed as [29]:
where y is the dependent variable, and it is the random quantitative observation value. β0 is the constant term, x1, …, xp are independent variables, β1, …, βp are partial regression coefficients. Βi (i = 1, 2, 3, …, p) denotes when other independent variables are fixed, each unit change in the independent variable alone causes the average change in the dependent variable y. ε is the random error, also known as residual, which is the part of the change in y that cannot be explained by independent variables and is subject to the distribution of N (0, σ2).
The multiple linear regression equation estimated from the sample is:
where is the average estimated value or average predicted value of the dependent variable y when a set of fixed values are taken for each x; and b0, …, bx are the sample estimate values of β1, …, βp.
3. Results
3.1. Comparison of Air Temperature under Different Trees
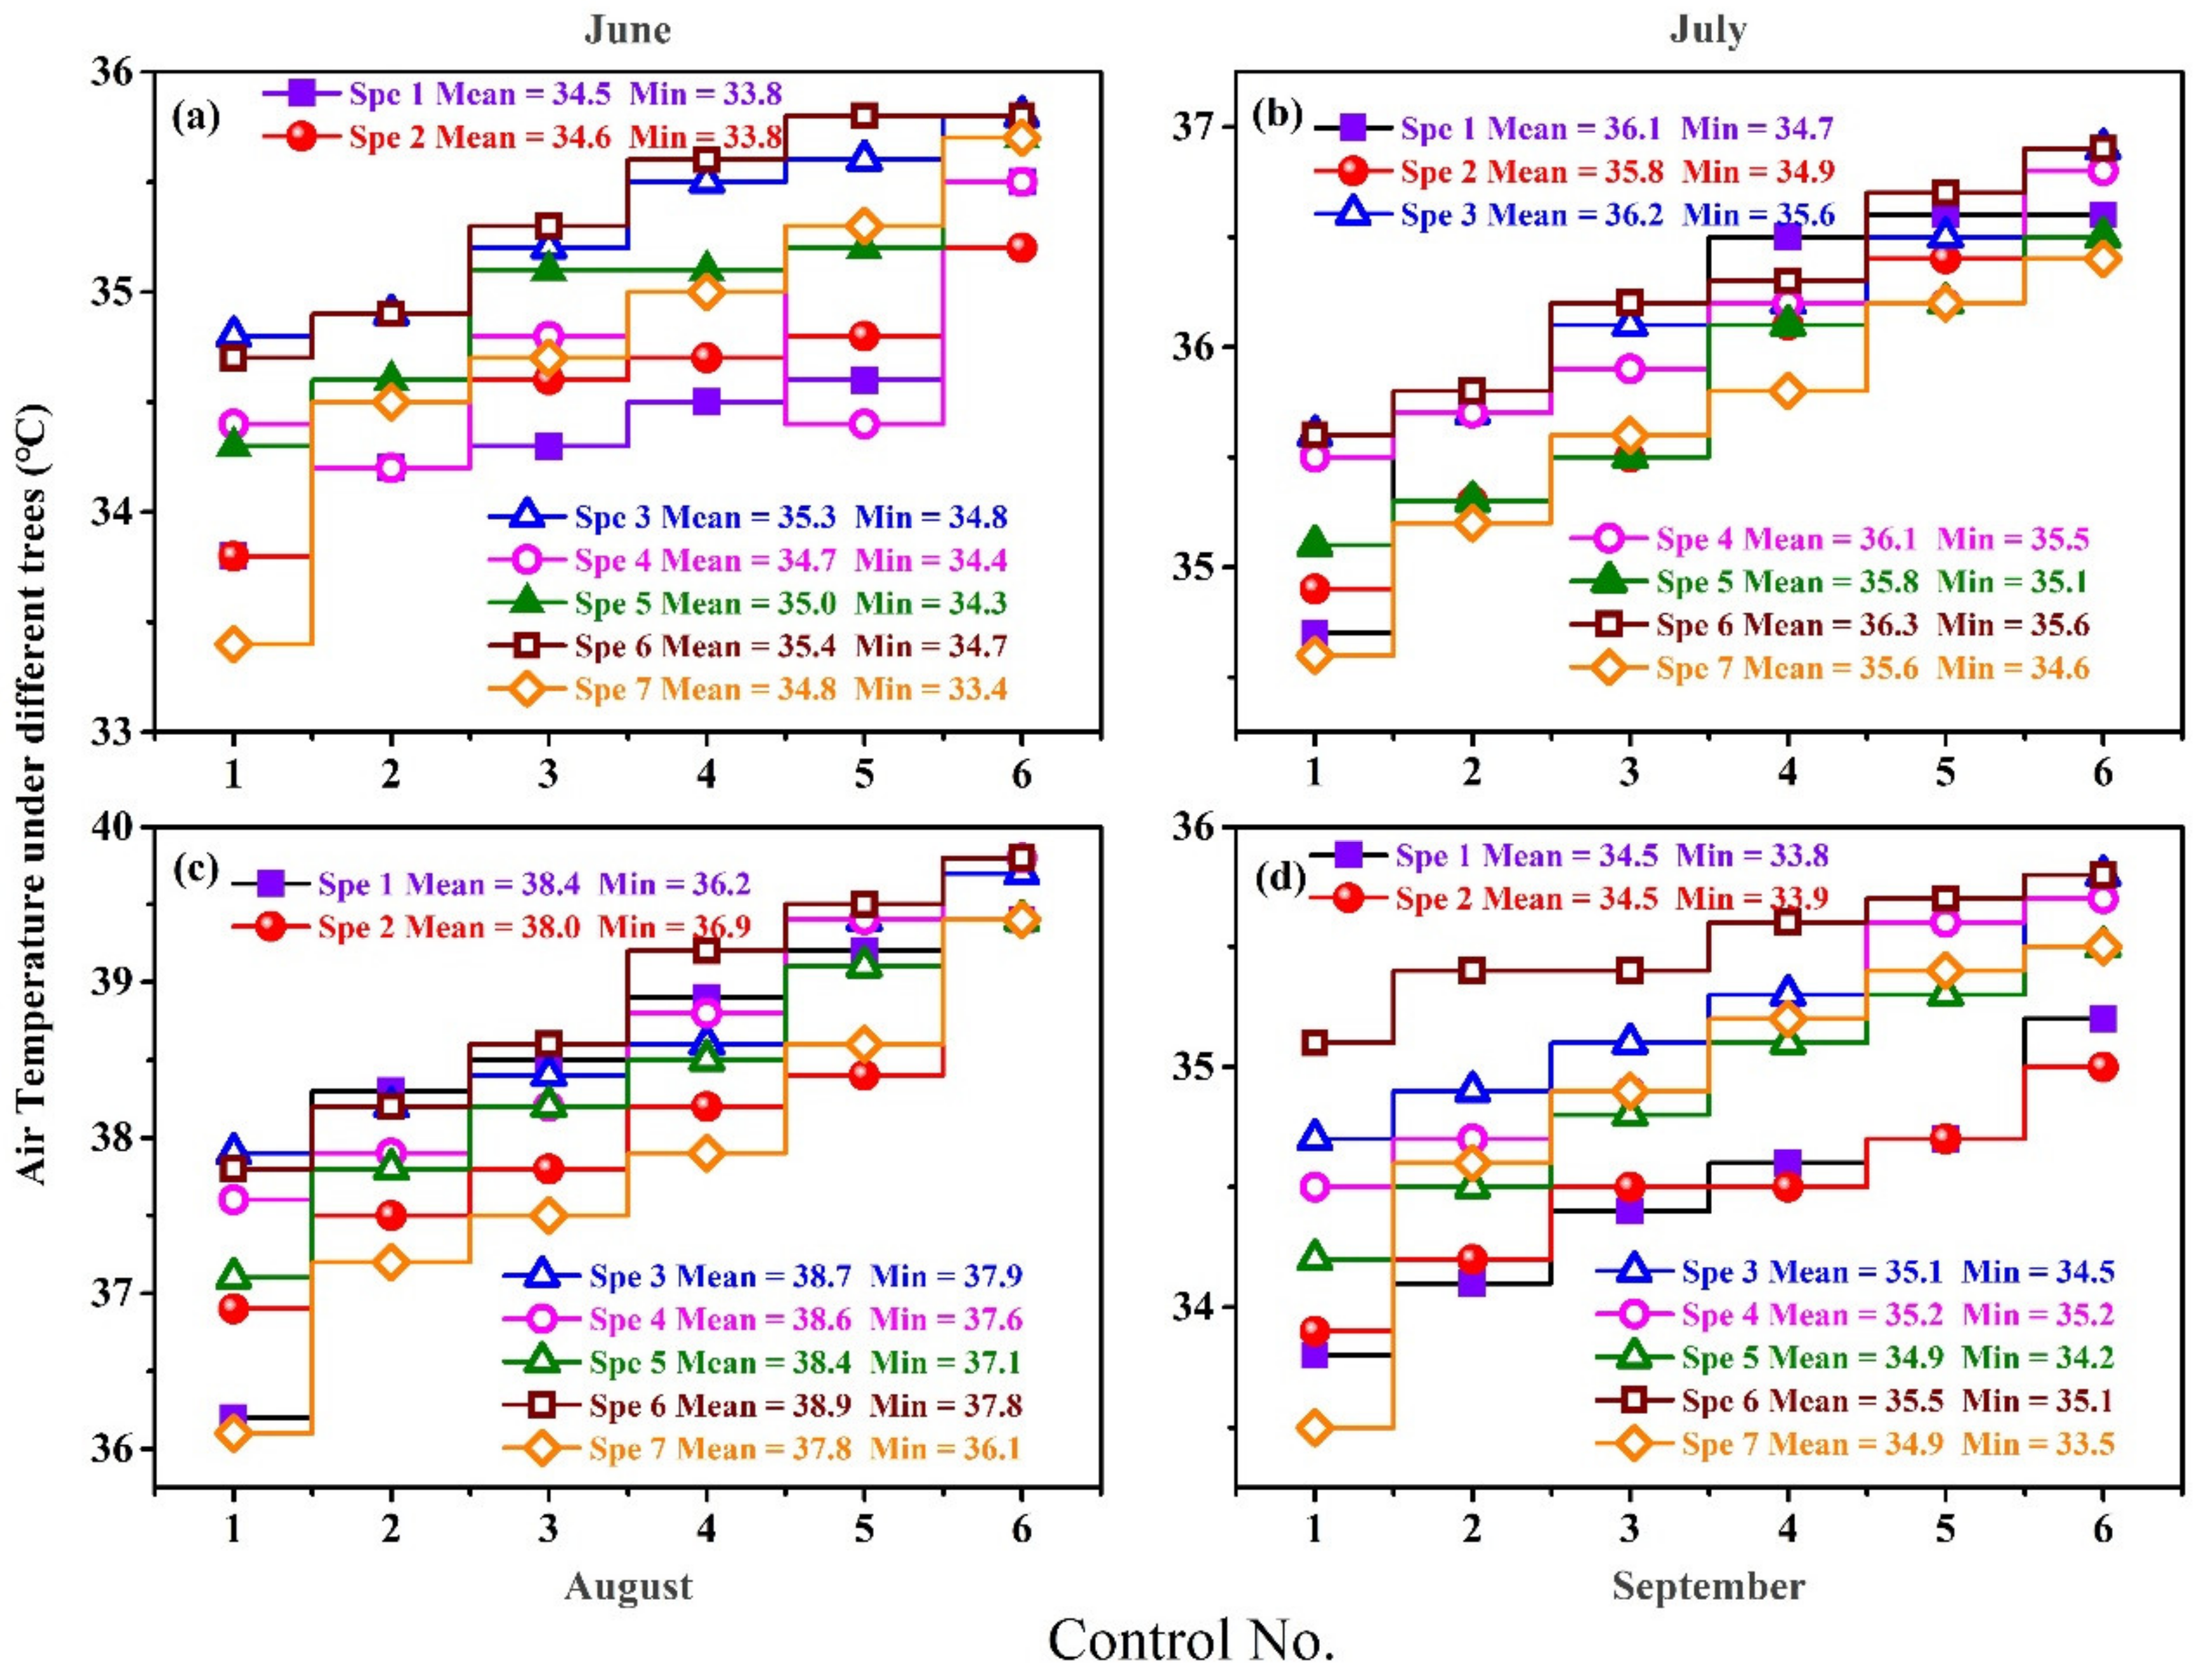
As shown in Figure 3a–d, for all tree species, the air temperature under the trees with larger DBH is lower than that with smaller DBH. The air temperature of the largest DBH in June is 33.8 °C, 33.8 °C, 34.8 °C, 34.4 °C, 34.3 °C, 34.7 °C, and 33.4 °C for Ficus virens, Camphor tree, Ginkgo biloba, Osmanthus fragrans, Magnolia tree, Jacaranda tree, and Ficus macrocarpa, respectively. The air temperature under different trees also exhibited obvious differences among species. For example, the air temperature of species 6, i.e., Jacaranda tree, is the highest among all species from June (Mean = 35.4 °C) to September (Mean = 35.5 °C). The lowest temperature tree species is Ficus virens (Mean = 34.5 °C) both in June and September. In addition, the cooling effect of different tree species also showed seasonality. For example, the air temperature under Ficus macrocarpa is higher than Ficus virens in June (Mean = 34.8 °C) and September (Mean = 34.9 °C), but it is lower in July (Mean = 35.6 °C) and August (Mean = 37.8 °C) than Ficus virens (Mean = 36.1 °C and 38.4 °C, respectively).
3.2. Impact of Temperature Difference between the Tree Trunk and Deep Soil
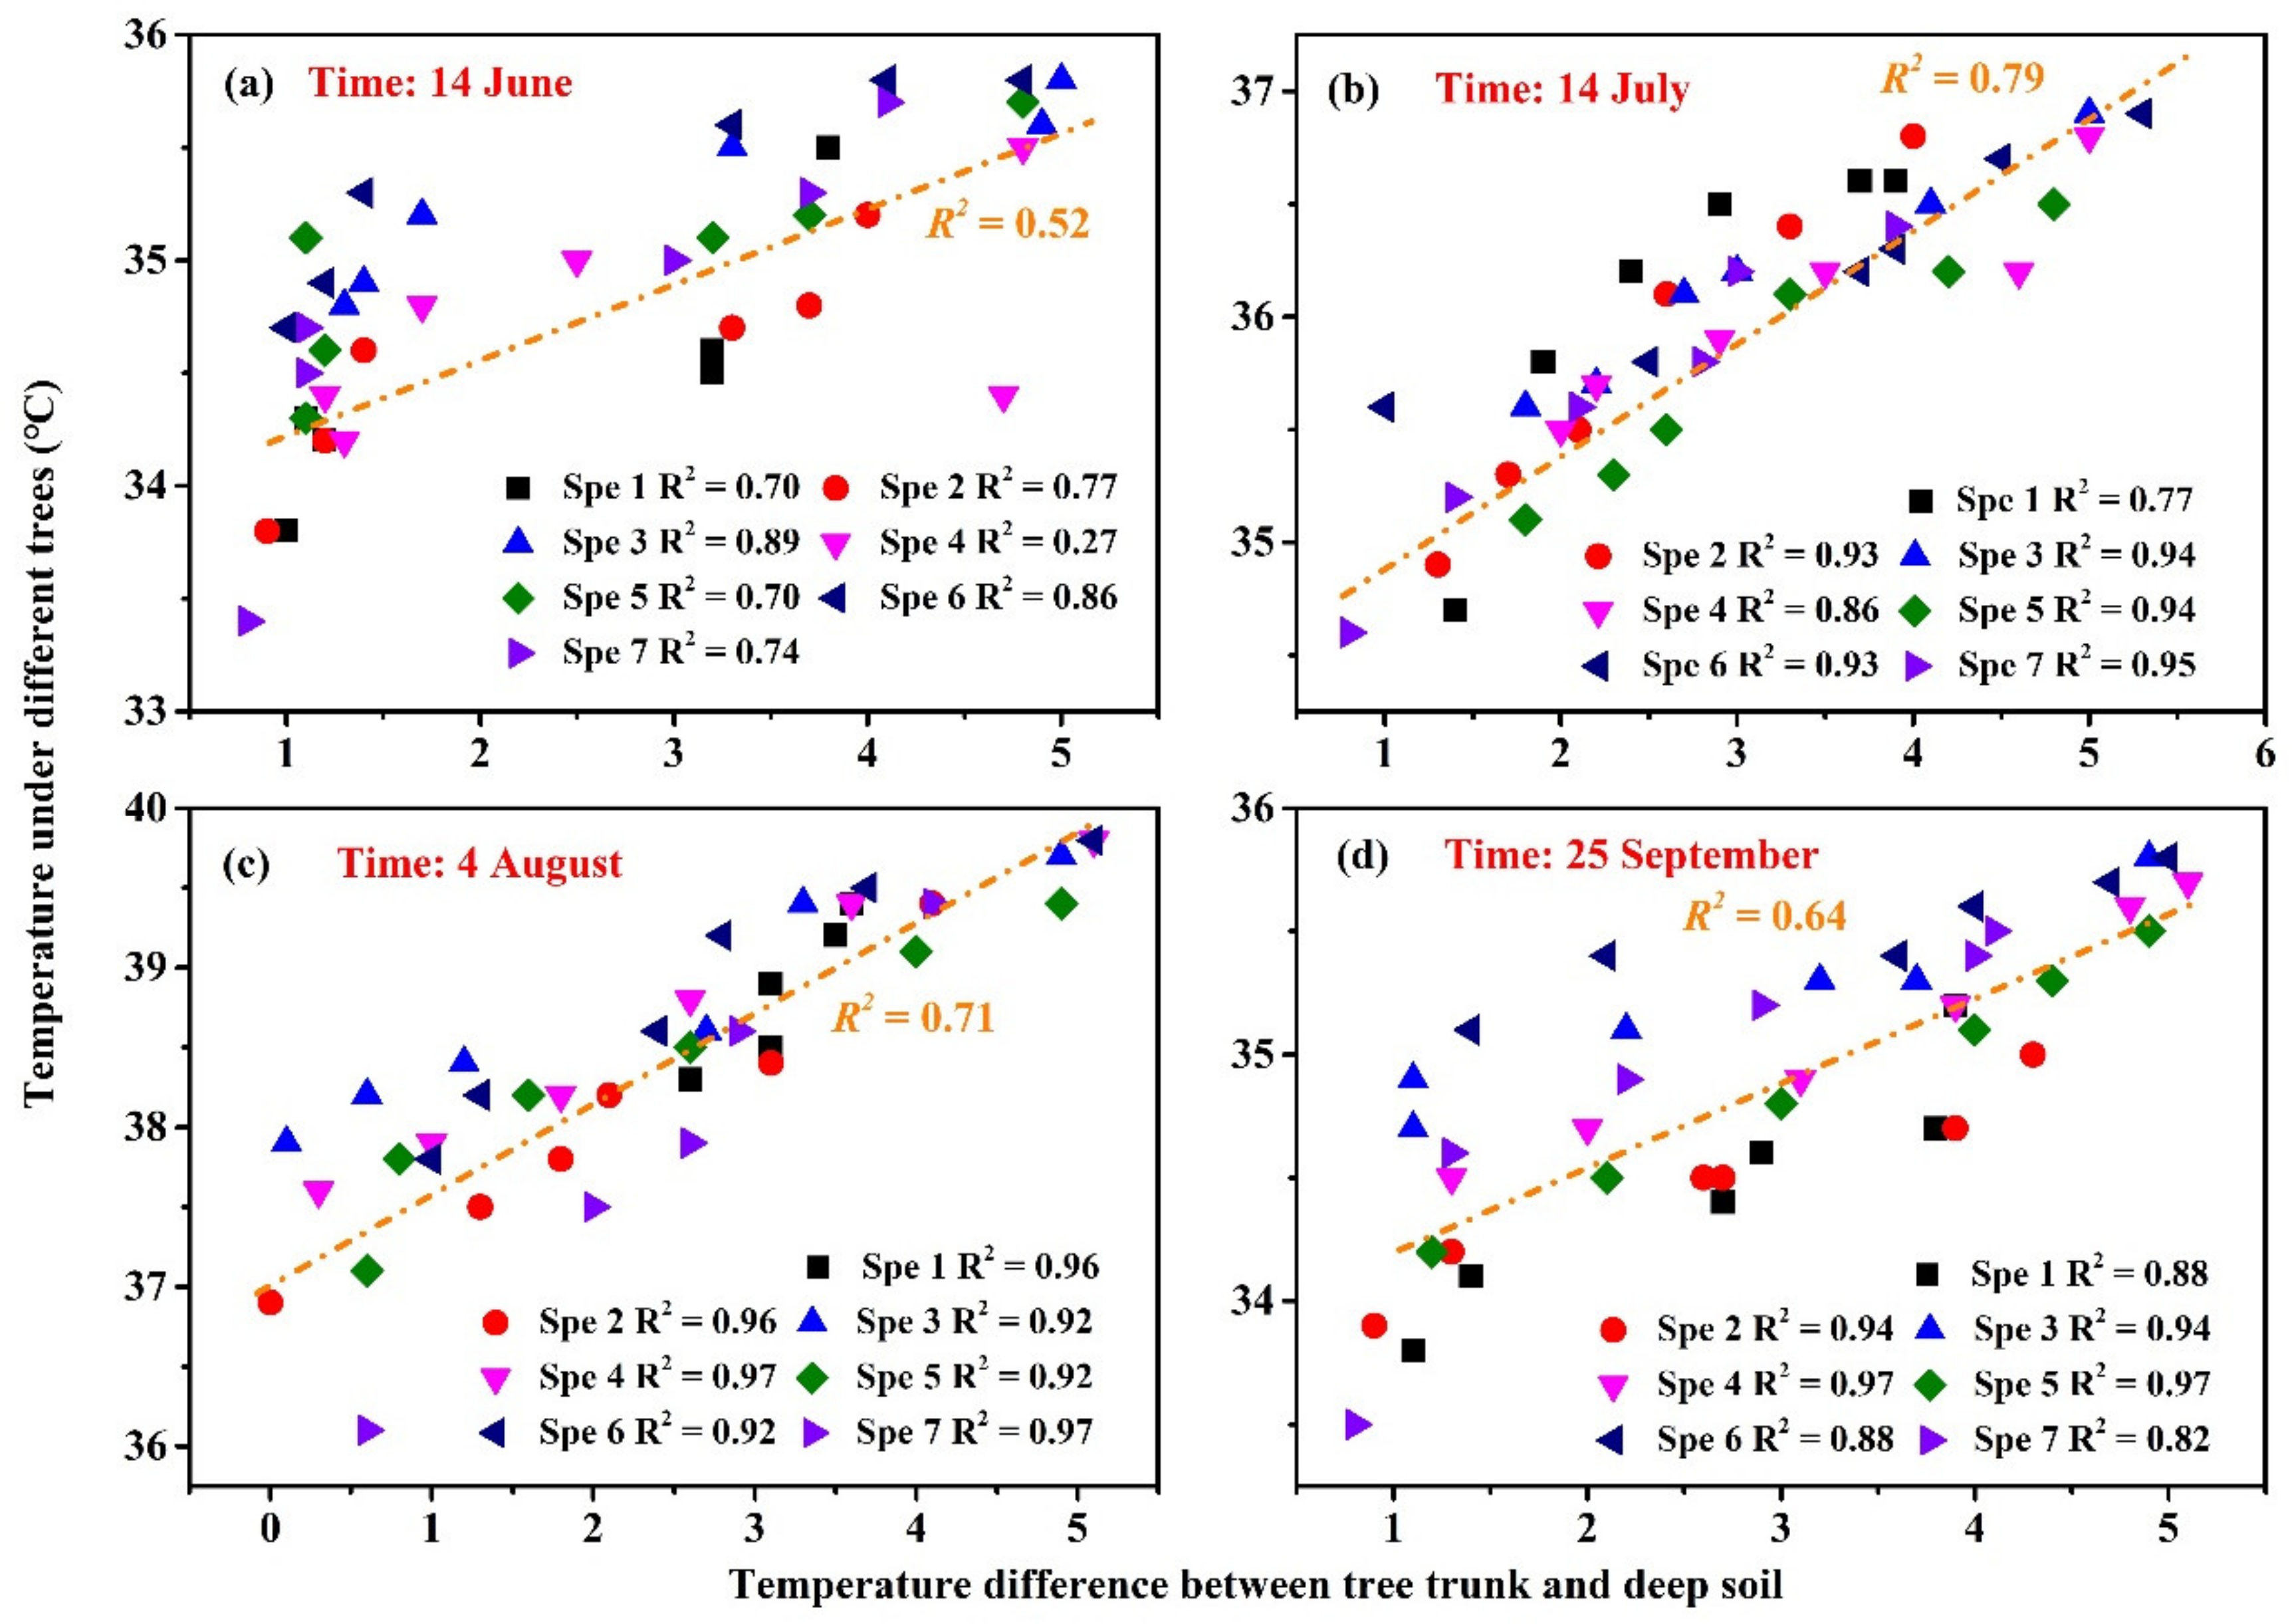
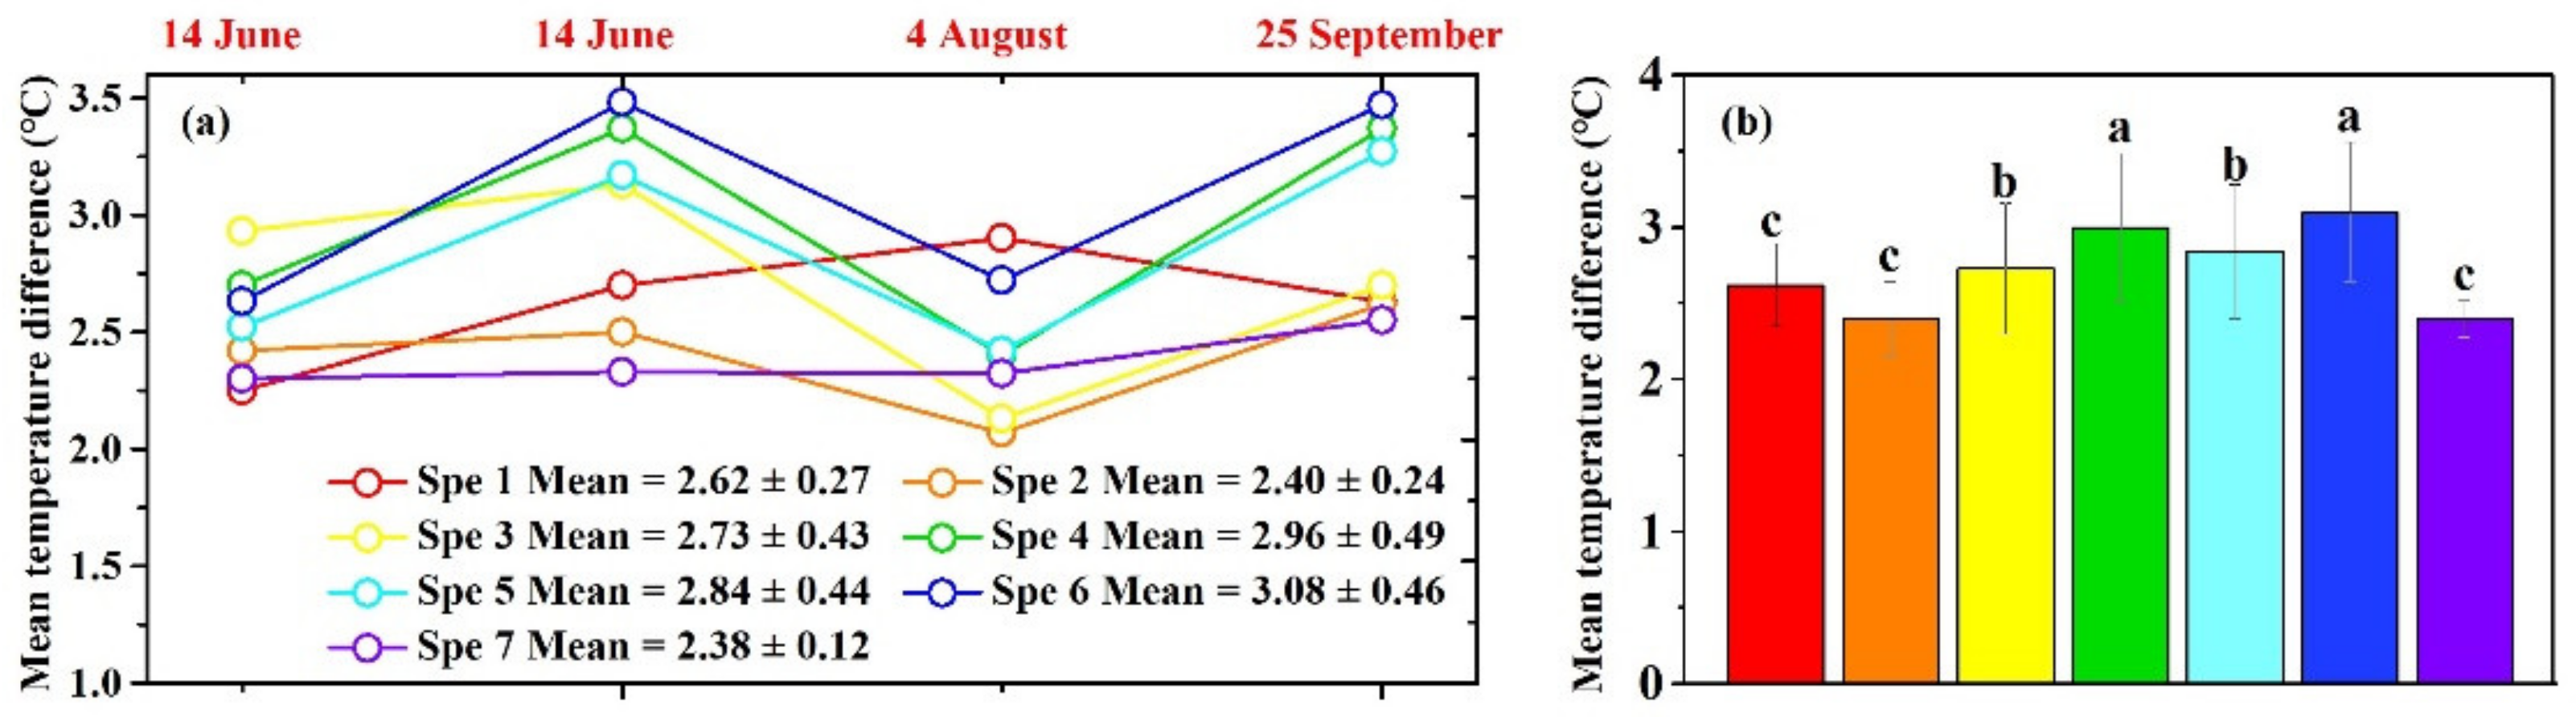
As shown in Figure 4, the temperature under trees and the temperature difference between the tree trunk and deep soil exhibited a linear positive correlation for all species (R2 > 0.27, P < 0.01). The relationship persisted when all the trees were considered as a whole (R2 ≥ 0.52). Their correlations show some seasonality, with July (R2 = 0.79) and August (R2 = 0.71) showing higher correlations than that in June (R2 = 0.52) and September (R2 ≥ 0.64). The temperature difference between the tree trunk and deep soil is linearly negatively correlated with DBH, which means that the temperature difference in the tree with the largest DBH is the lowest. As shown in Figure 5a,b, the temperature difference between the tree trunk and deep soil exhibited obvious differences among species. The temperature difference in Ficus virens (Mean = 2.62 ± 0.27 °C), Camphor tree (Mean = 2.40 ± 0.24 °C), and Ficus macrocarpa (Mean = 2.38 ± 0.12 °C) is lowest, and it is highest for Osmanthus fragrans (Mean = 2.96 ± 0.49 °C) and Jacaranda tree (Mean = 3.08 ± 0.46 °C).
3.3. Multiple Linear Regression for Control Factors
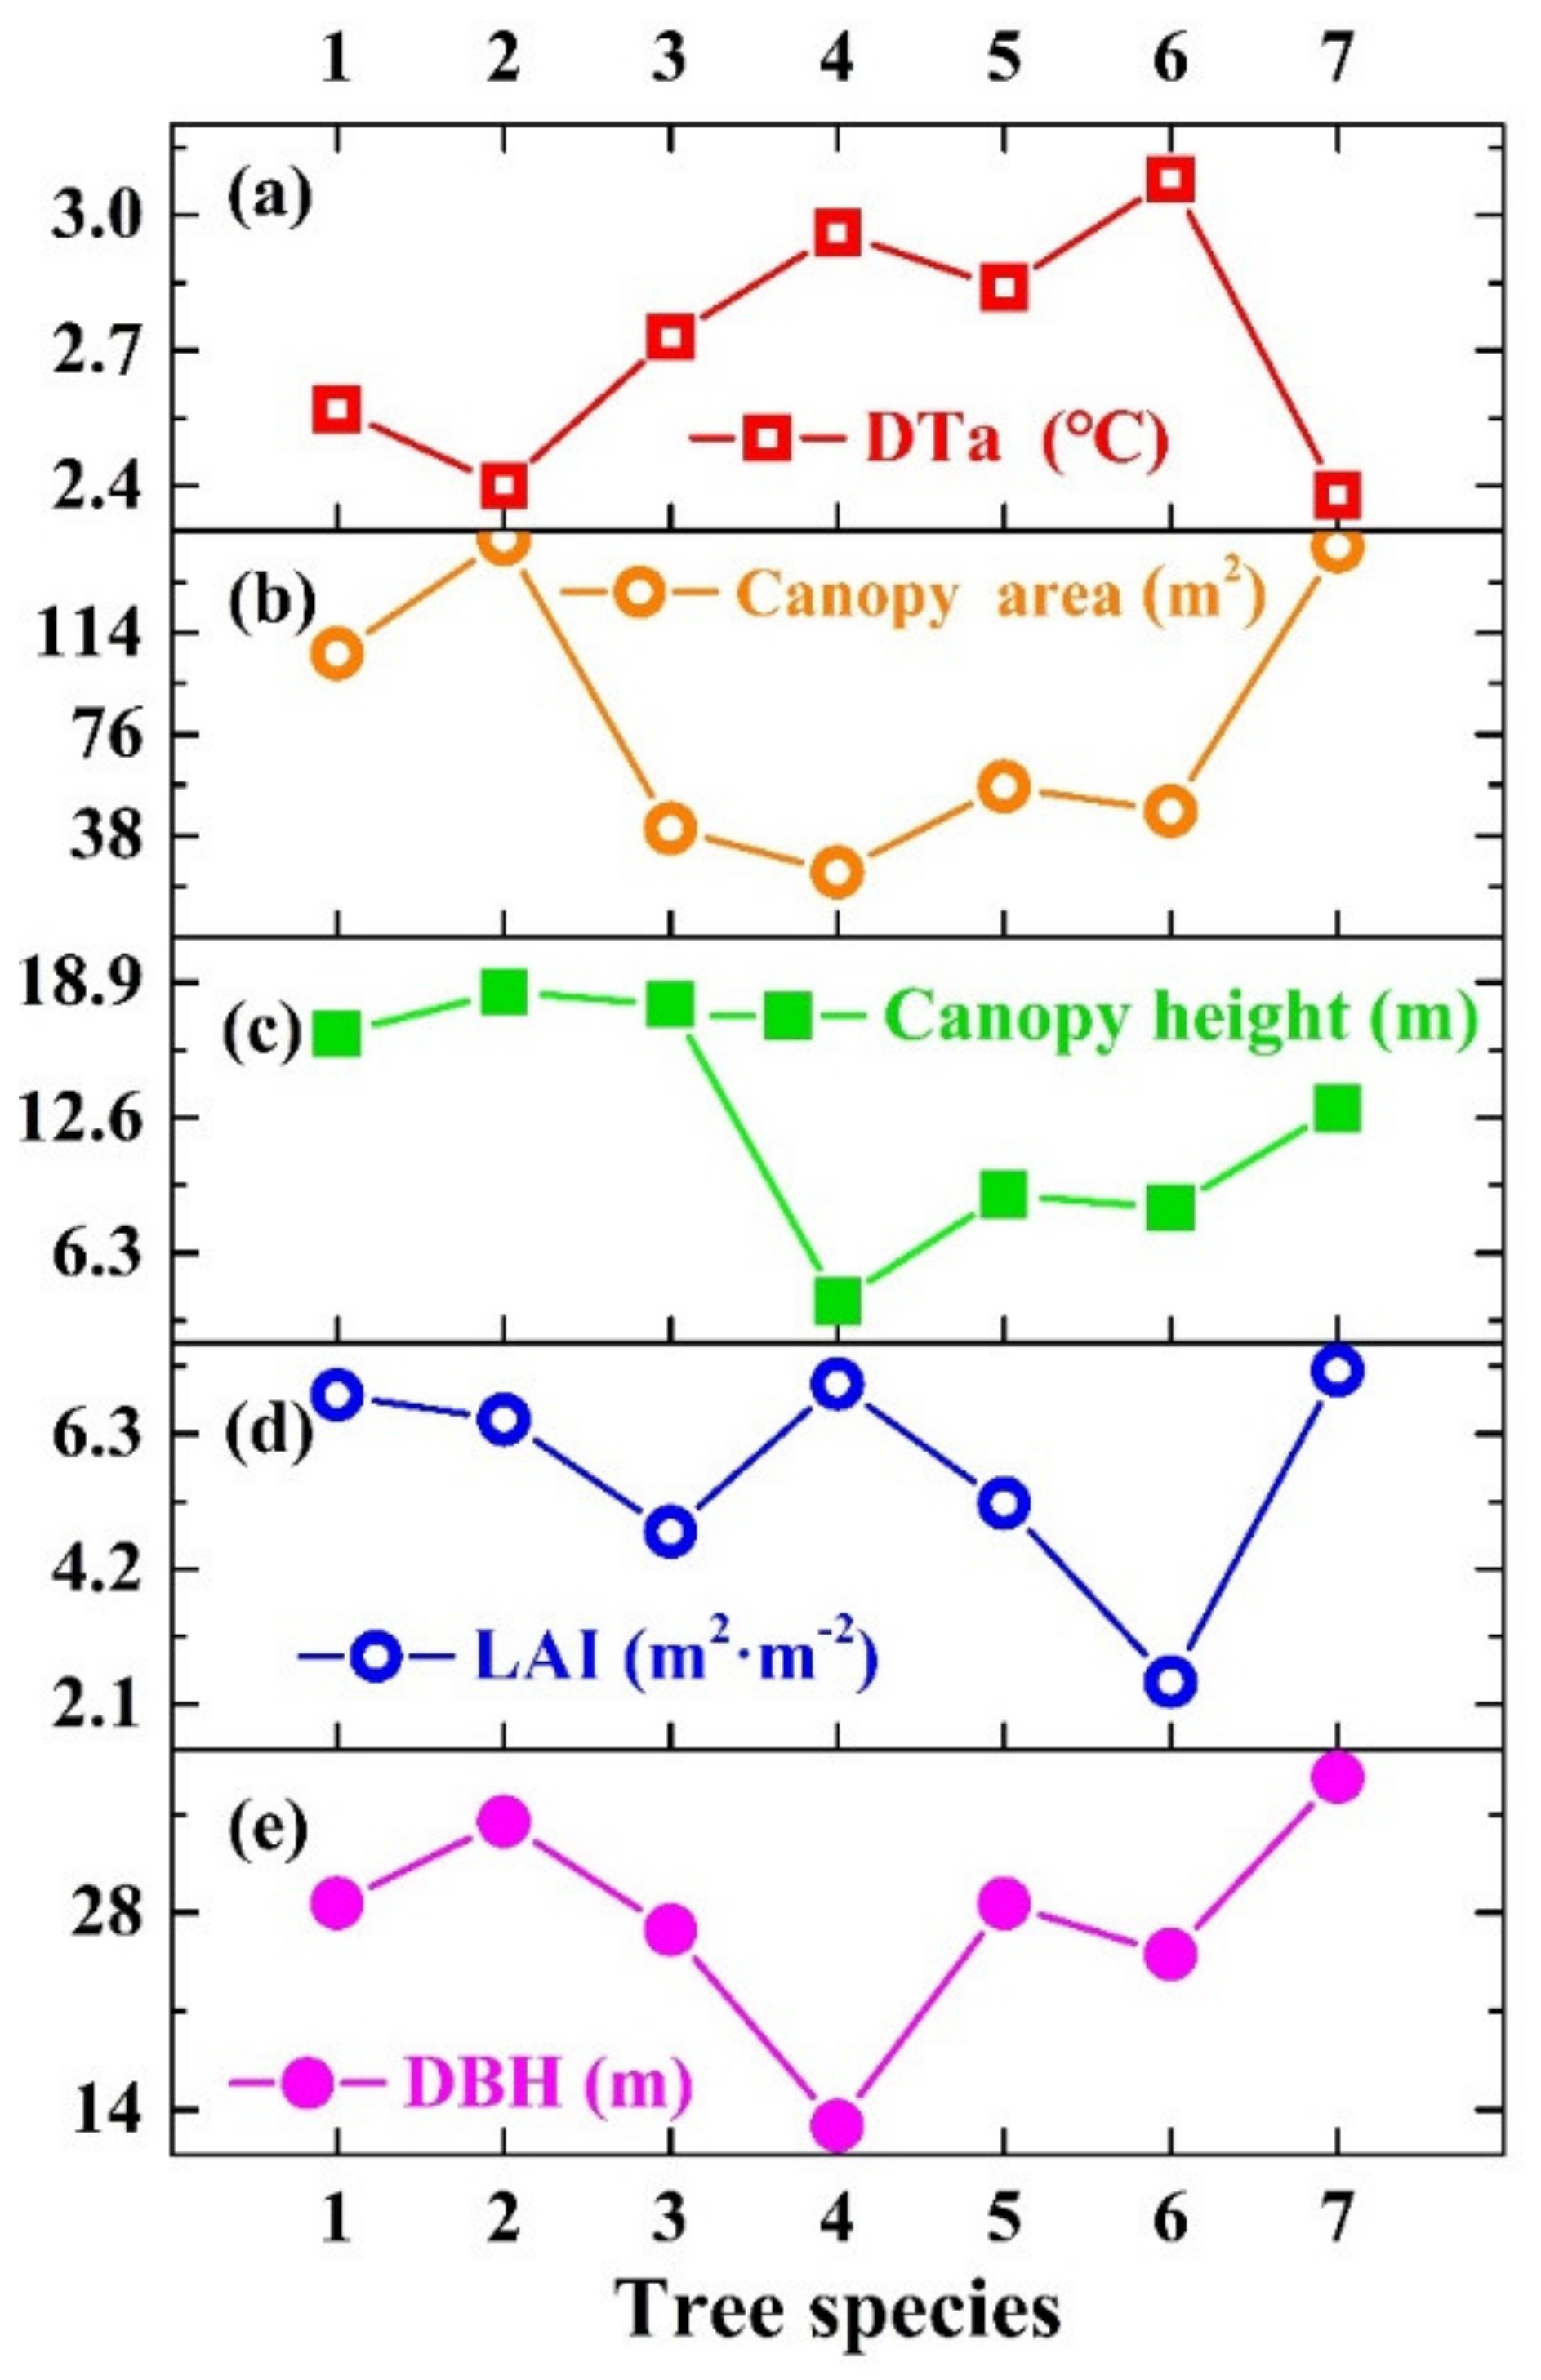
As shown in Figure 6, the trend of temperature difference in trees with different DBH sizes is obviously the opposite, with several controlling factors, such as canopy area, canopy height, LAI, and DBH. Canopy area, canopy height, and LAI of each species exhibited obvious differences among different DBH sizes. The highest DTa (Mean = 3.01 ± 1.49 °C) is for species 6 (Jacaranda tree), followed by species 4 (Osmanthus fragrans, Mean = 2.96 ± 1.51 °C) and species 5 (Magnolia tree, Mean = 2.84 ± 1.45 °C). However, the trend of the curve of control factors is not exactly the same. In detail, the highest temperature of the species is Spe 6 (Jacaranda tree), but the species with the lowest canopy area, canopy height, and DBH is Spe 4 (Osmanthus fragrans). In our study, multiple linear regression analysis was performed for multiple control factors as shown in Table 1. We found that canopy height is not the controlling factor for the temperature difference between the tree trunk and soil deep, and the canopy area is colinear with LAI. Therefore, only DBH and LAI were selected to establish the multiple linear regression equation.
4. Discussion
The air temperature is positively correlated with DBH in our study. In detail, for all tree species, the air temperature under the trees with larger DBH is lower than that with smaller DBH, as shown in Figure 3a–d. In fact, DBH is only a superficial factor, but there are other factors that really affect temperature. In general, a larger DBH means a larger canopy for the same tree species [30]. On the one hand, large trees have a stronger ability to store water [31]. Understandably, plants are cooler than air, and larger plants mean a larger heat transfer area. On the other hand, large trees have a stronger ability to evapotranspiration, which process consumes a lot of heat. Previous studies have demonstrated that taller trees have a great cooling effect due to evapotranspiration and shading [15]. Moreover, evapotranspiration causes the water originally stored in the plant body to dissipate into the air, and at the same time, absorb water from the deep soil to replenish the trunk and leaf [32,33]. A higher evapotranspiration rate means that water in your body is replaced more quickly, which means your body is cooler. This makes heat transfer more efficient and effective; that is, cooling the air around the plant more noticeable [34].
The temperature under trees and the temperature difference between the tree trunk and deep soil exhibited a linear positive correlation for all species as shown in Figure 4 in our study. This means that the closer the temperatures of the tree trunk and deep soil are to each other, the faster the water in the plant is replaced. Obviously, the giant trees with bigger DBH absorb deeper soil water more quickly. In this study, we used 60 cm as the depth representative of deep soil. In fact, the giant trees in this study are likely to absorb deeper soil water [32,33]. This also makes the trunk of these trees cooler than that of smaller trees. In terms of root distribution, the roots of large trees are significantly deeper [35,36,37], especially for trees with taproots well over 60 cm deep [35,38]. This is confirmed by root depth estimates using bottom-sounding radar.
In our study, when constructing multiple linear regression equations based on multiple control factors, only temperature was selected to evaluate the cooling effect. In fact, for each tree, the cooling effect should include not only the temperature, but also the area of cooling. In this study, the area of cooling was basically equal to the canopy area. Therefore, the canopy area, an important factor, was excluded when the stepwise regression equation was established. As for canopy height, it is not a key factor in the cooling effect between different species. Specifically, in this study, ginkgo and jacaranda trees, although tall, have relatively weak lateral branch growth, resulting in sparse leaf distribution, poor shading effect, weak transpiration capacity, slow water renewal rate in plants, and the weakest cooling effect. Therefore, canopy height is not a key factor in the cooling effect.
5. Conclusions
In this study, seven species of trees with the highest planting rate were selected in seven residential areas as research objects. By measuring the temperature under the trees and related control factors, the results conclude that: (1) Giant trees have the best cooling effect, i.e., the air temperature under the trees with larger DBH is lower than that with smaller DBH. The reason is that the high rate of water replenishment in plants increases giant trees’ transpiration rate and cooling effect. (2) The closer the temperatures of the tree trunk and deep soil are to each other, the faster the water in the plant is replaced. The giant trees with bigger DBH often have larger crowns and deeper roots, as well as greater evapotranspiration; therefore, they often absorbed deeper soil water more quickly, which makes the trunk of these trees cooler than that of smaller trees. In terms of root distribution, the roots of large trees are significantly deeper. This study is of great practical significance to the selection of plants in the green belt of residential communities, and has great theoretical significance to understand the principle of the plant cooling effect.
Author Contributions
Conceptualization, R.Z. and Z.Z.; methodology, R.Z.; software, R.Z.; validation, R.Z. and Z.Z.; formal analysis, R.Z.; investigation, Z.Z.; resources, R.Z.; data curation, Z.Z.; writing—original draft preparation, Z.Z.; writing—review and editing, R.Z.; visualization, R.Z.; supervision, R.Z.; project administration, R.Z.; funding acquisition, R.Z. All authors have read and agreed to the published version of the manuscript.
Funding
This study was supported by the National Natural Science Foundation of China (42101036), the GDAS’ Project of Science and Technology Development (2020GDASYL-20200103078) and the Natural Science Foundation of Guangdong Province (2020A1515111060), China Postdoctoral Science Foundation (2022M710504), Chongqing Postdoctoral Science Foundation (2021XM2031) and Fundamental Research Funds for the Central Universities (2022CDJXY-017).
Acknowledgments
This study was supported by the National Natural Science Foundation of China (42101036), the GDAS’ Project of Science and Technology Development (2020GDASYL-20200103078) and the Natural Science Foundation of Guangdong Province (2020A1515111060), China Postdoctoral Science Foundation (2022M710504), Chongqing Postdoctoral Science Foundation (2021XM2031) and Fundamental Research Funds for the Central Universities (2022CDJXY-017). We thank the editors and anonymous reviewers for their valuable comments and suggestions for improving the manuscript.
Conflicts of Interest
We certify that we have participated sufficiently in the work to take public responsibility for the appropriateness of the experimental design and method, and the collection, analysis, and interpretation of the data. We have reviewed the final version of the manuscript and approved it for publication. This manuscript has not been published in whole or in part nor is it being considered for publication elsewhere.
References
- Hou, Y.; Zhang, M.; Liu, S.; Sun, P.; Yin, L.; Yang, T.; Wei, X. The Hydrological Impact of Extreme Weather-Induced Forest Disturbances in a Tropical Experimental Watershed in South China. Forests 2018, 12, 734. [Google Scholar] [CrossRef]
- Zhang, Y.X.; Fu, B.; Sun, J.Y. Heat wave mitigation of ecosystems in mountain areas—A case study of the Upper Yangtze River basin. Ecosyst. Health Sustain. 2022, 8, 2084459. [Google Scholar] [CrossRef]
- Plasman, M.; Torres, R. Feeling the heat: Extreme temperatures compromise constitutive innate humoral immunity and skin color in a desert dwelling lizard. J. Therm. Biol. 2019, 83, 142–149. [Google Scholar] [CrossRef] [PubMed]
- Zhu, X.F.; Liu, T.T.; Xu, K.; Chen, C.X. The impact of high temperature and drought stress on the yield of major staple crops in northern China. J. Environ. Manag. 2022, 314, 115092. [Google Scholar] [CrossRef]
- Carrillo-Niquete, G.A.; Andrade, J.L.; Valdez-Lazalde, J.R.; Reyes-Garcia, C.; Hernandez-Stefanoni, J.L. Characterizing spatial and temporal deforestation and its effects on surface urban heat islands in a tropical city using Landsat time series. Landsc. Urban Plan 2022, 217, 104280. [Google Scholar] [CrossRef]
- Halder, B.; Bandyopadhyay, J.; Banik, P. Monitoring the effect of urban development on urban heat island based on remote sensing and geo-spatial approach in Kolkata and adjacent areas, India. Sustain. Cities Soc. 2021, 74, 103186. [Google Scholar] [CrossRef]
- Yu, Z.W.; Zhang, J.G.; Yang, G.Y. How to build a heat network to alleviate surface heat island effect? Sustain. Cities Soc. 2021, 74, 103135. [Google Scholar] [CrossRef]
- Zhu, C.Y.; Ji, P.; Li, S.H. Effects of Urban Green Belts on the Air Temperature, Humidity and Air Quality. J. Environ. Eng. Landsc. 2017, 25, 39–55. [Google Scholar] [CrossRef]
- Amati, M.; Yokohari, M. Temporal changes and local variations in the functions of London’s green belt. Landsc. Urban Plan 2006, 75, 125–142. [Google Scholar] [CrossRef]
- Boentje, J.P.; Blinnikov, M.S. Post-Soviet forest fragmentation and loss in the Green Belt around Moscow, Russia (1991–2001): A remote sensing perspective. Landsc. Urban Plan 2007, 82, 208–221. [Google Scholar] [CrossRef]
- Kowarik, I. The “Green Belt Berlin”: Establishing a greenway where the Berlin Wall once stood by integrating ecological, social and cultural approaches. Landsc. Urban Plan 2019, 184, 12–22. [Google Scholar] [CrossRef]
- Pathak, V.; Tripathi, B.D.; Mishra, V.K. Evaluation of Anticipated Performance Index of some tree species for green belt development to mitigate traffic generated noise. Urban For. Urban Green. 2011, 10, 61–66. [Google Scholar] [CrossRef]
- Prajapati, S.K.; Tripathi, B.D. Anticipated Performance Index of some tree species considered for green belt development in and around an urban area: A case study of Varanasi city, India. J. Environ. Manag. 2008, 88, 1343–1349. [Google Scholar] [CrossRef] [PubMed]
- Kubilay, A.; Allegrini, J.; Strebel, D.; Zhao, Y.; Derome, D.; Carmeliet, J. Advancement in Urban Climate Modelling at Local Scale: Urban Heat Island Mitigation and Building Cooling Demand. Atmosphere 2020, 11, 1313. [Google Scholar] [CrossRef]
- Manickathan, L.; Defraeye, T.; Allegrini, J.; Derome, D.; Carmeliet, J. Parametric study of the influence of environmental factors and tree properties on the transpirative cooling effect of trees. Agric. For. Meteorol. 2018, 248, 259–274. [Google Scholar] [CrossRef]
- Huang, J.; Kong, F.; Yin, H.; Middel, A.; Liu, H.; Zheng, X.; Wen, Z.; Wang, D. Transpirational cooling and physiological responses of trees to heat. Agric. Forest Meteorol. 2022, 320, 108940. [Google Scholar] [CrossRef]
- Wang, W.Z.; Xu, F.A.; Wang, J.M. Energy Exchange and Evapotranspiration over the Ejina Oasis Riparian Forest Ecosystem with Different Land-Cover Types. Water 2021, 13, 3424. [Google Scholar] [CrossRef]
- Chen, S.; Xie, Z.; Xie, J.; Liu, B.; Jia, B.; Qin, P.; Li, R. Impact of urbanization on the thermal environment of the Chengdu-Chongqing urban agglomeration under complex terrain. Earth Syst. Dynam. 2022, 13, 341–356. [Google Scholar] [CrossRef]
- Gao, J.; Bian, H.Y.; Zhu, C.J.; Tang, S. The response of key ecosystem services to land use and climate change in Chongqing: Time, space, and altitude. J. Geogr. Sci. 2022, 32, 317–332. [Google Scholar] [CrossRef]
- Liu, G.; Niu, J.; Guo, W.; Zhao, L.; Zhang, C.; Wang, M.; Guo, G. Assessment of terrain factors on the pattern and extent of soil contamination surrounding a chemical industry in Chongqing, Southwest China. Catena 2017, 156, 237–243. [Google Scholar] [CrossRef]
- Lu, H.; Xie, M.; Liu, B.; Liu, X.; Feng, J.; Yang, F.; Gao, Y. Impact of atmospheric thermodynamic structures and aerosol radiation feedback on winter regional persistent heavy particulate pollution in the Sichuan-Chongqing region, China. Sci. Total Environ. 2022, 842, 156575. [Google Scholar] [CrossRef] [PubMed]
- Lu, J.; Chen, J.H.; Tang, Y.; Feng, Y.; Wang, J.S. High-rise buildings versus outdoor thermal environment in Chongqing. Sensors 2007, 7, 2183–2200. [Google Scholar] [CrossRef] [PubMed]
- Li, Y.; Li, C.; Luo, S.; He, J.; Cheng, Y.; Jin, Y. Impacts of extremely high temperature and heatwave on heatstroke in Chongqing, China. Environ. Sci. Pollut. R 2017, 24, 8534–8540. [Google Scholar] [CrossRef] [PubMed]
- Chen, S.; Yan, Y.; Liu, G.; Fang, D.; Wu, Z.; He, J.; Tang, J. Spatiotemporal characteristics of precipitation diurnal variations in Chongqing with complex terrain. Appl. Clim. 2019, 137, 1217–1231. [Google Scholar] [CrossRef]
- Zhan, Z.Z.; Liu, H.B.; Li, H.M.; Wu, W.; Zhong, B. The Relationship between NDVI and Terrain Factors --A Case Study of Chongqing. Procedia Environ. Sci. 2012, 12, 765–771. [Google Scholar] [CrossRef]
- Yao, R.M.; Luo, Q.; Luo, Z.W.; Jiang, L.; Yang, Y. An integrated study of urban microclimates in Chongqing, China: Historical weather data, transverse measurement and numerical simulation. Sustain. Cities Soc. 2015, 14, 187–199. [Google Scholar] [CrossRef]
- He, B.J.; Zhao, D.; Dong, X.; Xiong, K.; Feng, C.; Qi, Q.; Pathak, M. Perception, physiological and psychological impacts, adaptive awareness and knowledge, and climate justice under urban heat: A study in extremely hot-humid Chongqing, China. Sustain. Cities Soc. 2022, 79, 103685. [Google Scholar] [CrossRef]
- Wang, Y.M.; Xiang, P.C. Urban Sprawl Sustainability of Mountainous Cities in the Context of Climate Change Adaptability Using a Coupled Coordination Model: A Case Study of Chongqing, China. Sustainability 2019, 11, 20. [Google Scholar] [CrossRef]
- Peterson, S.H.; Roberts, D.A.; Dennison, P.E. Mapping live fuel moisture with MODIS data: A multiple regression approach. Remote Sens. Environ. 2008, 112, 4272–4284. [Google Scholar] [CrossRef]
- Swayze, N.C.; Tinkham, W.T.; Vogeler, J.C.; Hudak, A.T. Influence of flight parameters on UAS-based monitoring of tree height, diameter, and density. Remote Sens. Environ. 2021, 263, 112540. [Google Scholar] [CrossRef]
- Bucci, S.J.; Goldstein, G.; Meinzer, F.C.; Scholz, F.G.; Franco, A.C.; Bustamante, M. Functional convergence in hydraulic architecture and water relations of tropical savanna trees: From leaf to whole plant. Tree Physiol. 2004, 24, 891–899. [Google Scholar] [CrossRef] [PubMed]
- Beyene, A.; Cornelis, W.; Verhoest, N.E.; Tilahun, S.; Alamirew, T.; Adgo, E.; Nyssen, J. Estimating the actual evapotranspiration and deep percolation in irrigated soils of a tropical floodplain, northwest Ethiopia. Agric. Water Manag. 2018, 202, 42–56. [Google Scholar] [CrossRef]
- Tang, Y.K.; Wen, X.F.; Sun, X.M.; Zhang, X.Y.; Wang, H.M. The Limiting Effect of Deep Soil Water on Evapotranspiration of a Subtropical Coniferous Plantation Subjected to Seasonal Drought. Adv. Atmos. Sci. 2014, 31, 385–395. [Google Scholar] [CrossRef]
- Kong, J.; Zhao, Y.; Carmeliet, J.; Lei, C. Urban heat island and its interaction with heatwaves: A review of studies on mesoscale. Sustainability 2021, 13, 10923. [Google Scholar] [CrossRef]
- Amato, M.; Basso, B.; Celano, G.; Bitella, G.; Morelli, G.; Rossi, R. In situ detection of tree root distribution and biomass by multi-electrode resistivity imaging. Tree Physiol. 2008, 28, 1441–1448. [Google Scholar] [CrossRef] [PubMed]
- Farahnak, M.; Mitsuyasu, K.; Hishi, T.; Katayama, A.; Chiwa, M.; Jeong, S.; Kume, A. Relationship between Very Fine Root Distribution and Soil Water Content in Pre- and Post-Harvest Areas of Two Coniferous Tree Species. Forests 2020, 11, 1227. [Google Scholar] [CrossRef]
- Plante, P.M.; Rivest, D.; Vezina, A.; Vanasse, A. Root distribution of different mature tree species growing on contrasting textured soils in temperate windbreaks. Plant Soil 2014, 380, 429–439. [Google Scholar] [CrossRef]
- Ali, N.; Tavoillot, J.; Chapuis, E.; Mateille, T. Trend to explain the distribution of root-knot nematodes Meloidogyne spp. associated with olive trees in Morocco. Agric. Ecosyst. Environ. 2016, 225, 22–32. [Google Scholar] [CrossRef]
Figure 1.
Study location and sites. Note that (a–g) are residential communities; (c–i) are Ficus macrocarpa, Magnolia tree, Osmanthus fragrans, Ficus virens, Ginkgo biloba, Jacaranda tree, and Camphor tree, respectively.
Figure 1.
Study location and sites. Note that (a–g) are residential communities; (c–i) are Ficus macrocarpa, Magnolia tree, Osmanthus fragrans, Ficus virens, Ginkgo biloba, Jacaranda tree, and Camphor tree, respectively.

Figure 2.
Air temperature for study sites during 1 June and 31 September 2021.

Figure 3.
Measured air temperature under different trees in different month, and (a–d) are for June, July, August and September, respectively. Note that Spe 1–7 are Ficus virens, Camphor tree, Ginkgo biloba, Osmanthus fragrans, Magnolia tree, Jacaranda tree, and Ficus macrocarpa, respectively. Six trees of each species were distinguished using control No. 1–6 based on DBH size from large to small.

Figure 4.
The relationship between temperature under trees and temperature difference between tree trunk and deep soil. Note that Spe 1–7 are Ficus virens, Camphor tree, Ginkgo biloba, Osmanthus fragrans, Magnolia tree, Jacaranda tree, and Ficus macrocarpa, respectively. (a–d) are for June, July, August, and September, respectively.

Figure 5.
Significant difference analysis of temperature difference between tree trunk and deep soil for different species of trees. (a,b) is the significant difference analysis for mean temperature difference of different species. Note that Spe 1–7 are Ficus virens, Camphor tree, Ginkgo biloba, Osmanthus fragrans, Magnolia tree, Jacaranda tree, and Ficus macrocarpa, respectively.

Figure 6.
Comparison of control factor trend for different trees. (a–e) are temperature difference, canopy area, canopy height, LAI and DBH of different species, respectively. Note that 1–7 are Ficus virens, Camphor tree, Ginkgo biloba, Osmanthus fragrans, Magnolia tree, Jacaranda tree, and Ficus macrocarpa, respectively. DTa is temperature difference between tree trunk and deep soil.


Table 1.
Multiple linear regression results between DTa and control factors. Note that DTa is temperature difference between tree trunk and deep soil, CH is canopy height, and CA is canopy area, respectively.
Table 1.
Multiple linear regression results between DTa and control factors. Note that DTa is temperature difference between tree trunk and deep soil, CH is canopy height, and CA is canopy area, respectively.
| Intercept | DBH | LAI | CH | CA | R2 | ||
|---|---|---|---|---|---|---|---|
| Result 1 | 6.2943 | −0.0832 | −0.2561 | −0.0291 | 0.0068 | 0.6821 | |
| p-value | 0.0000 | 0.0002 | 0.0021 | 0.3141 | 0.0650 | ||
| Result 2 | 6.2463 | −0.0926 | −0.2580 | 0.0063 | 0.6818 | ||
| p-value | 0.0000 | 0.0000 | 0.0019 | 0.0850 | |||
| Result 3 | 5.6671 | −0.0665 | −0.1942 | 0.6644 | |||
| p-value | 0.0000 | 0.0000 | 0.88 |
Publisher’s Note: MDPI stays neutral with regard to jurisdictional claims in published maps and institutional affiliations. |
© 2022 by the authors. Licensee MDPI, Basel, Switzerland. This article is an open access article distributed under the terms and conditions of the Creative Commons Attribution (CC BY) license (https://creativecommons.org/licenses/by/4.0/).
Share and Cite
MDPI and ACS Style
Zhang, R.; Zhao, Z. Giant Trees Exhibited Great Cooling Effect in Residential Area Southwest of China. Forests 2022, 13, 1516. https://0-doi-org.brum.beds.ac.uk/10.3390/f13091516
AMA Style
Zhang R, Zhao Z. Giant Trees Exhibited Great Cooling Effect in Residential Area Southwest of China. Forests. 2022; 13(9):1516. https://0-doi-org.brum.beds.ac.uk/10.3390/f13091516
Chicago/Turabian StyleZhang, Rongfei, and Ziyan Zhao. 2022. "Giant Trees Exhibited Great Cooling Effect in Residential Area Southwest of China" Forests 13, no. 9: 1516. https://0-doi-org.brum.beds.ac.uk/10.3390/f13091516
Note that from the first issue of 2016, this journal uses article numbers instead of page numbers. See further details here.