
Wineinformatics: Can Wine Reviews in Bordeaux Reveal Wine Aging Capability?


Department of Computer Science, University of Central Arkansas, Conway, AR 72035, USA
*
Author to whom correspondence should be addressed.
Fermentation 2021, 7(4), 236; https://0-doi-org.brum.beds.ac.uk/10.3390/fermentation7040236
Submission received: 10 September 2021
/
Revised: 13 October 2021
/
Accepted: 13 October 2021
/
Published: 20 October 2021
(This article belongs to the Section Fermentation for Food and Beverages)
Abstract
:Wineinformatics is a new and emerging data science that uses wine as domain knowledge and integrates data systems and wine-related data sets. Wine reviews from Wine Spectator usually include the aging information, at the end of the review, in the form of “Best from YearA through YearB”; with the vintage of the wine included, the suggested holding year (YearA—vintage), shelf-life (YearB—vintage) and aging capacity (YearB—YearA) can be calculated and provide crucial information in the study of wineinformatics. The goal of this paper is to test whether wine reviews describing olfactory and gustatory information reveal wines’ suggested holding-year information. Wine reviews from Wine Spectator are extracted and processed by a natural language processing tool named the Computational Wine Wheel for categorizing and mapping various wine terminologies from wine reviews into a consolidated set of descriptors. The suggested aging capability is also calculated from the review and served as a label for classification problems. The study uses different learning algorithms, analyzing their performances and using the best-performing algorithm(s) to build a model for the prediction of a wine’s aging properties. The results of the study suggest that both support vector machine (SVM) and the K-nearest neighbor (KNN) algorithms achieved more than 70% accuracy. These results suggest that the algorithms are able of capturing a hidden informational relationship between a wine’s reviews and its aging capability.
1. Introduction
Data is everywhere. Data is growing faster than ever, as the amount of existing digital data is growing rapidly, doubling every two years and changing our way of life. At the end of 2020, it was estimated that approximately 1.7 MB of new information was generated per second for all humans on Earth. This trend has made it extremely important to know how to extract useful meaning from this huge data. Data science is a successful study that includes different techniques and theories from different fields, including mathematics, computer science, economics, and business administration to gain unique insight, from data, related to its domain. All data science problems require different techniques to solve. Based on the type of data science problem there are four major categories of machine-learning algorithms that can be applied to the data. They are: supervised learning [1], unsupervised learning [2], semi-supervised learning [3], and reinforced learning [4]. These methods aid in the discovery of interesting information from large amounts of data with a specific application area.
Wine has been produced for several thousands of years. This type of beverage is typically made from fermented grape juice and has remained popular and become even more affordable in modern times. An endless number of varieties and flavors are provided to consumers; as not many of whom are wine experts, their choices in wines can be influenced by the reviews and scores that reputed experts and websites assign them. Therefore, what they have to say about the quality of produced wines can be relied upon when manufacturing them [5]. Beneficiaries of these wine reviews do not consist of only consumers; winemakers can also gain valuable information and knowledge from expert reviews in knowing which factors contribute most to whether a wine should be drunk or held. To uncover meaningful information from large amounts of wine reviews available currently is a major task, one which would be useful for wine producers, distributors, and consumers.
Wineinformatics is a new and emerging data science that uses wine as domain knowledge and integrates data systems and wine-related data sets, including physicochemical laboratory data and wine review analysis [6]. Wine reviews, which are written in human language format, describes a judge’s perception of a wine, including colors, smells, tastes, and overall feelings. Wine judges also assign a 50–100 rating to the wines they review. Through the study of wineinformatics, wine reviews are processed by a natural language processing tool named the Computational Wine Wheel for categorizing and mapping various wine terminologies from wine reviews into a consolidated set of descriptors [7].
Unlike many other foods, the evolution of wine’s sensory qualities is thought to peak after a period in the bottle [8]. The length of this time frame can vary enormously depending on the wine, meaning that some wines evolve very rapidly toward an optimum followed by a decline, whereas others can withstand several years of aging, during which their overall sensory characters evolve favorably [8]. This aging process is usually considered as the second phase, while the first is called maturation, which refers to the changes in wines after fermentation and before bottling [9]. Wines’ aromas change dramatically during bottle-aging, through a complex array of chemical reactions [8]. “Chardonnay”, “Cabernet Sauvignon”, “Merlot”, and “Zinfandel”, considered premium varietals, benefit most from maturation by developing a more complex flavor profile. Over 86% of Bordeaux wines are red wines made with Merlot, Cabernet Sauvignon and Cabernet Franc grapes, therefore, Bordeaux wine has an established history for aging and evolving in the bottle.
Experienced wine reviewers should be able to combine olfactory and gustatory clues to judge the aging potential of red wines [9]. Wine reviews from Wine Spectator usually include the aging information in the end of the review in the form of “Best from YearA through YearB”; With the vintage of the wine included, the suggested wine-holding year (YearA—vintage), shelf-life (YearB—vintage) and aging capacity (YearB—YearA) can be calculated and provide crucial information to the field of wineinformatics.
The goal of this paper is to test whether wine reviews describing olfactory and gustatory information reveal wines’ suggested holding-year information. The determination of aging capacity in a wine is usually decided by a panel since the task is very subjective. However, little-to-no research has evaluated wine professionals’ judgment in aging potential through olfactory and gustatory clues. To the best of our knowledge, no similar works have been conducted in discussing the relationship between wine reviews and the aging property of a wine, or using wine-aging capability as a class label in classification research.
2. Methods and Materials
For this study, we are interested in wine reviews provided by the Wine Spectator with a focus on 21st century elite Bordeaux Wines.
2.1. Wine Reviews
Wine Spectator uses a 50–100 score scale on the evaluation of the wine. The breakdown of the score brackets can be summarized as:
- 50–74 Not recommended
- 75–79 Mediocre: A drinkable wine that may have minor flaws
- 80–84 Good: A solid, well-made wine
- 85–89 Very good: A wine with special qualities
- 90–94 Outstanding: A wine of superior character and style
- 95–100 Classic: A great wine
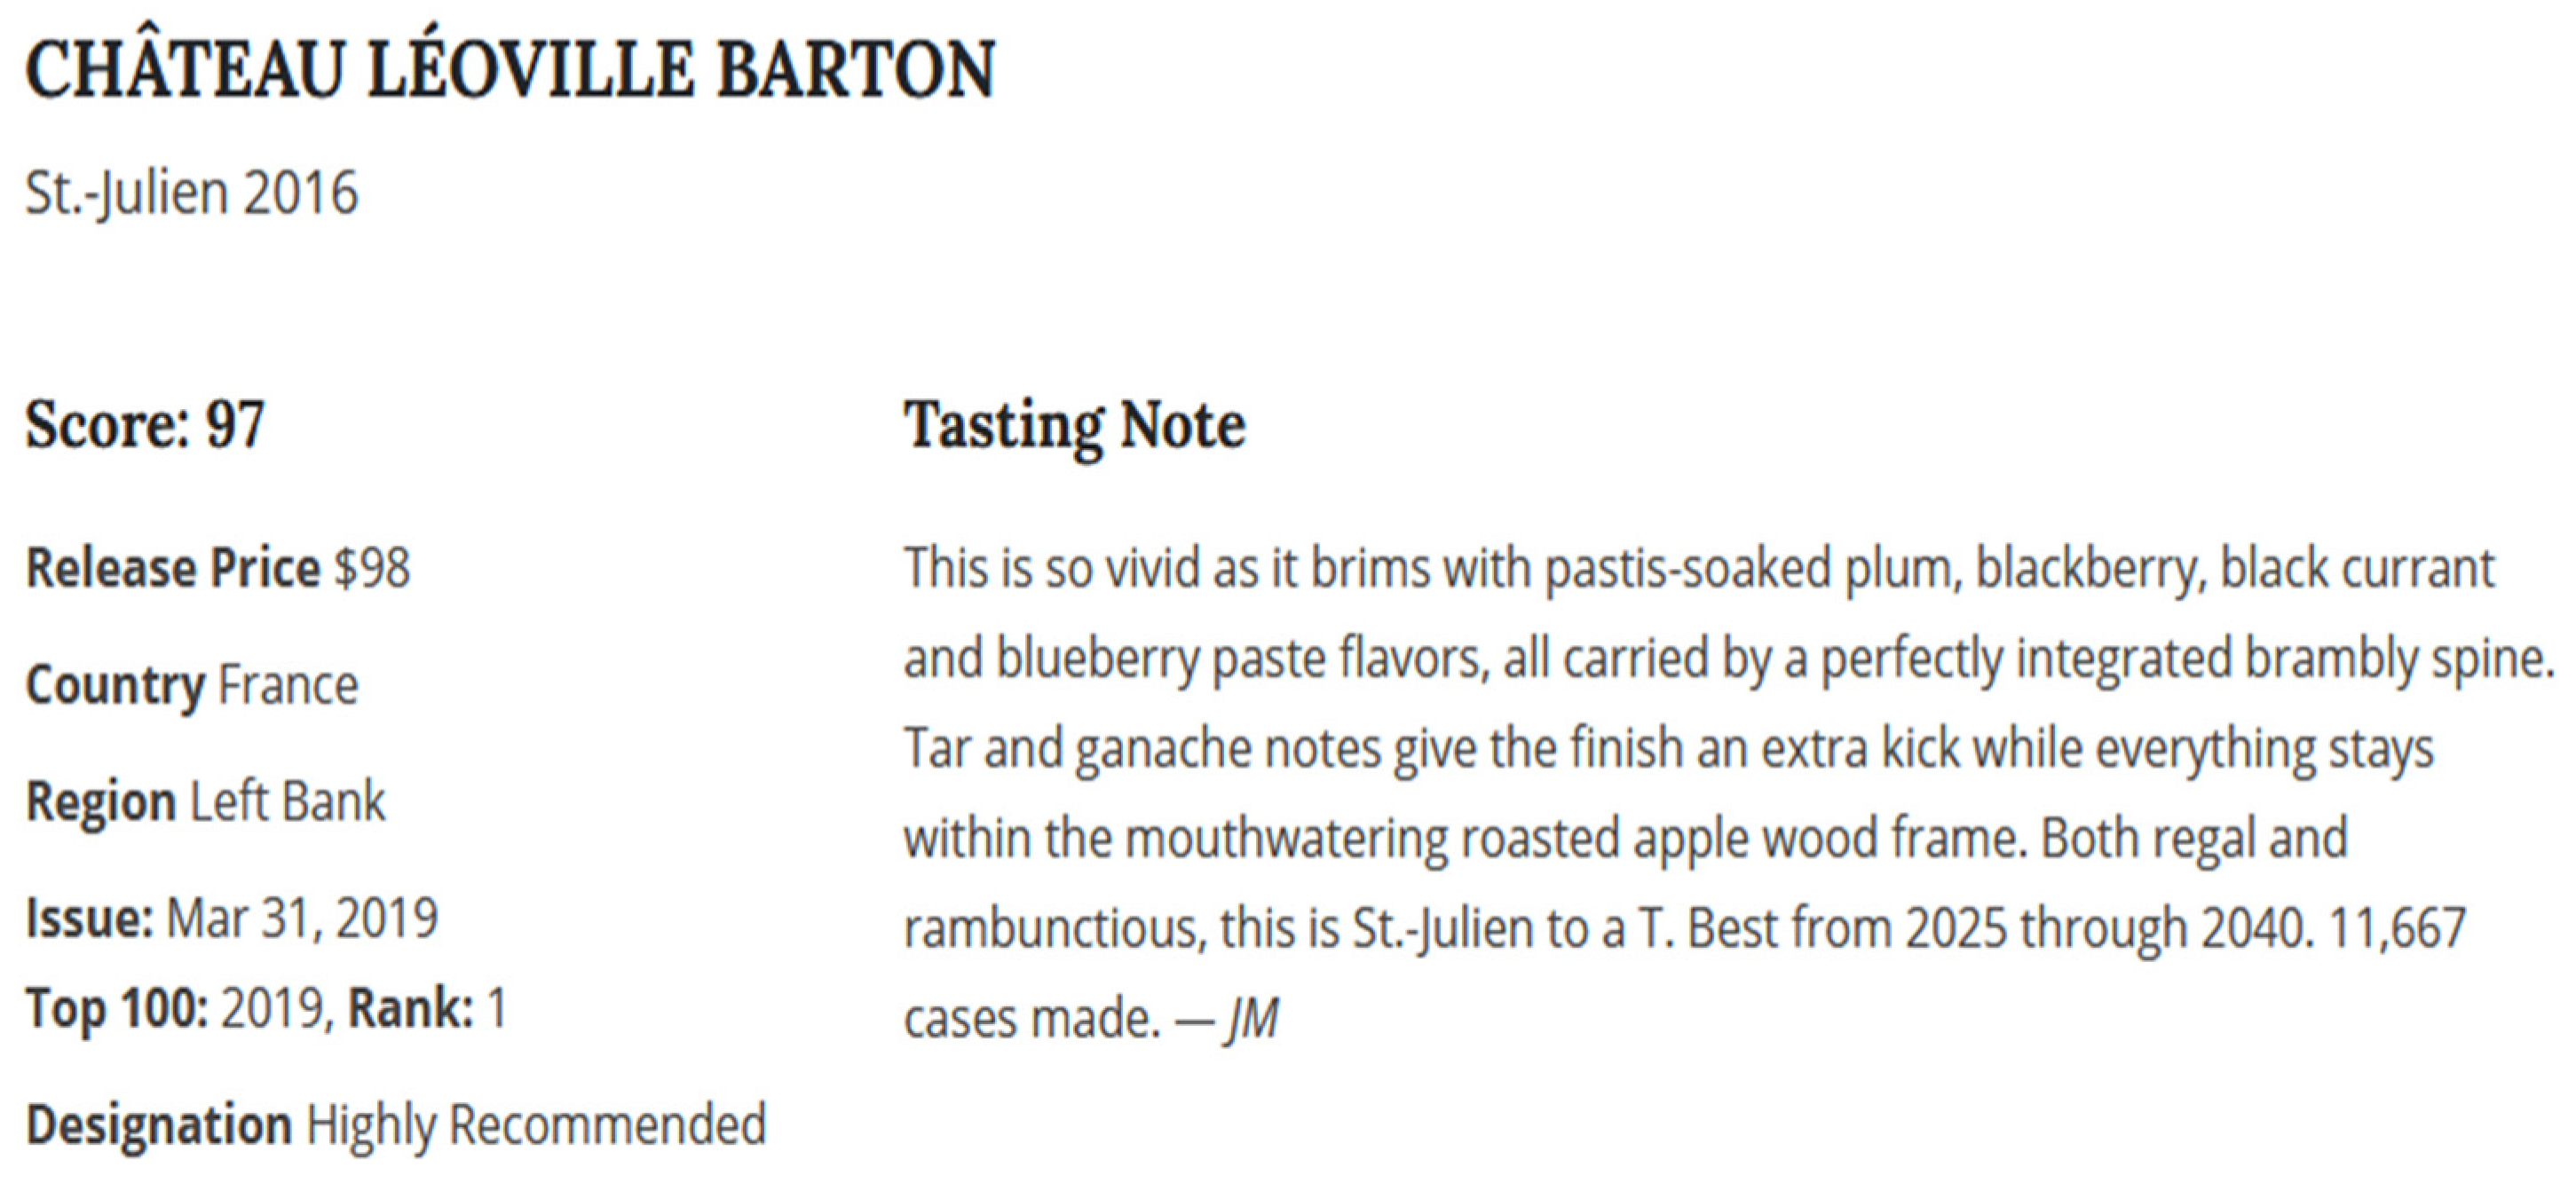
Figure 1 shows an example of a wine review for two different wines on Wine Spectator.com; Château Leoville Barton, from Saint-Julien, 2016. It is observable that, the wine has been scored as a classic (i.e., having a score over 95) or a great wine with the cost of close to $100. It should also be noted that Leoville Barton has the suggested holding year for 9 years (2025 − 2016 = 9), based on the difference between a wine’s vintage and its recommended consuming year.
2.2. Bordeaux Dataset
Bordeaux is one of the most famous wine growing regions in the world. Bordeaux wines are considered to have an ‘old world’ wine style and are famous for their aging capability. The review data collected in this research includes all wines listed in the 1855 Bordeaux classification [7], staring from vintage year 2000. The reviews used to generate the dataset were collected from Wine Spectator. As the reviews were retrieved in a raw format (human-readable format) some preprocessing was necessary to make sure that the data could be fed to a machine-learning algorithm.
The Computational Wine Wheel (CWW) [10] acts like a dictionary that can be used to convert words from the Wine Spectator reviews into class attributes. For example, if a wine review contains fruit attributes such as apple, blueberry, plum, etc., the CWW will try to match those words with the appropriate attribute value. It will assign a value of one if the match succeeds, and zero otherwise. In [10,11], the authors explain, in detail, how the Computational Wine Wheel is used to extract the class attributes from the same Bordeaux datasets. A total of 1359 wines reviews were collected to cover all elite Bordeaux wines, which are listed in a 1855-item classification list, covering, from 2000 to 2016, Wine Spectator reviews, processed through the Computational Wine Wheel to generate a dataset with 985 binary attributes.
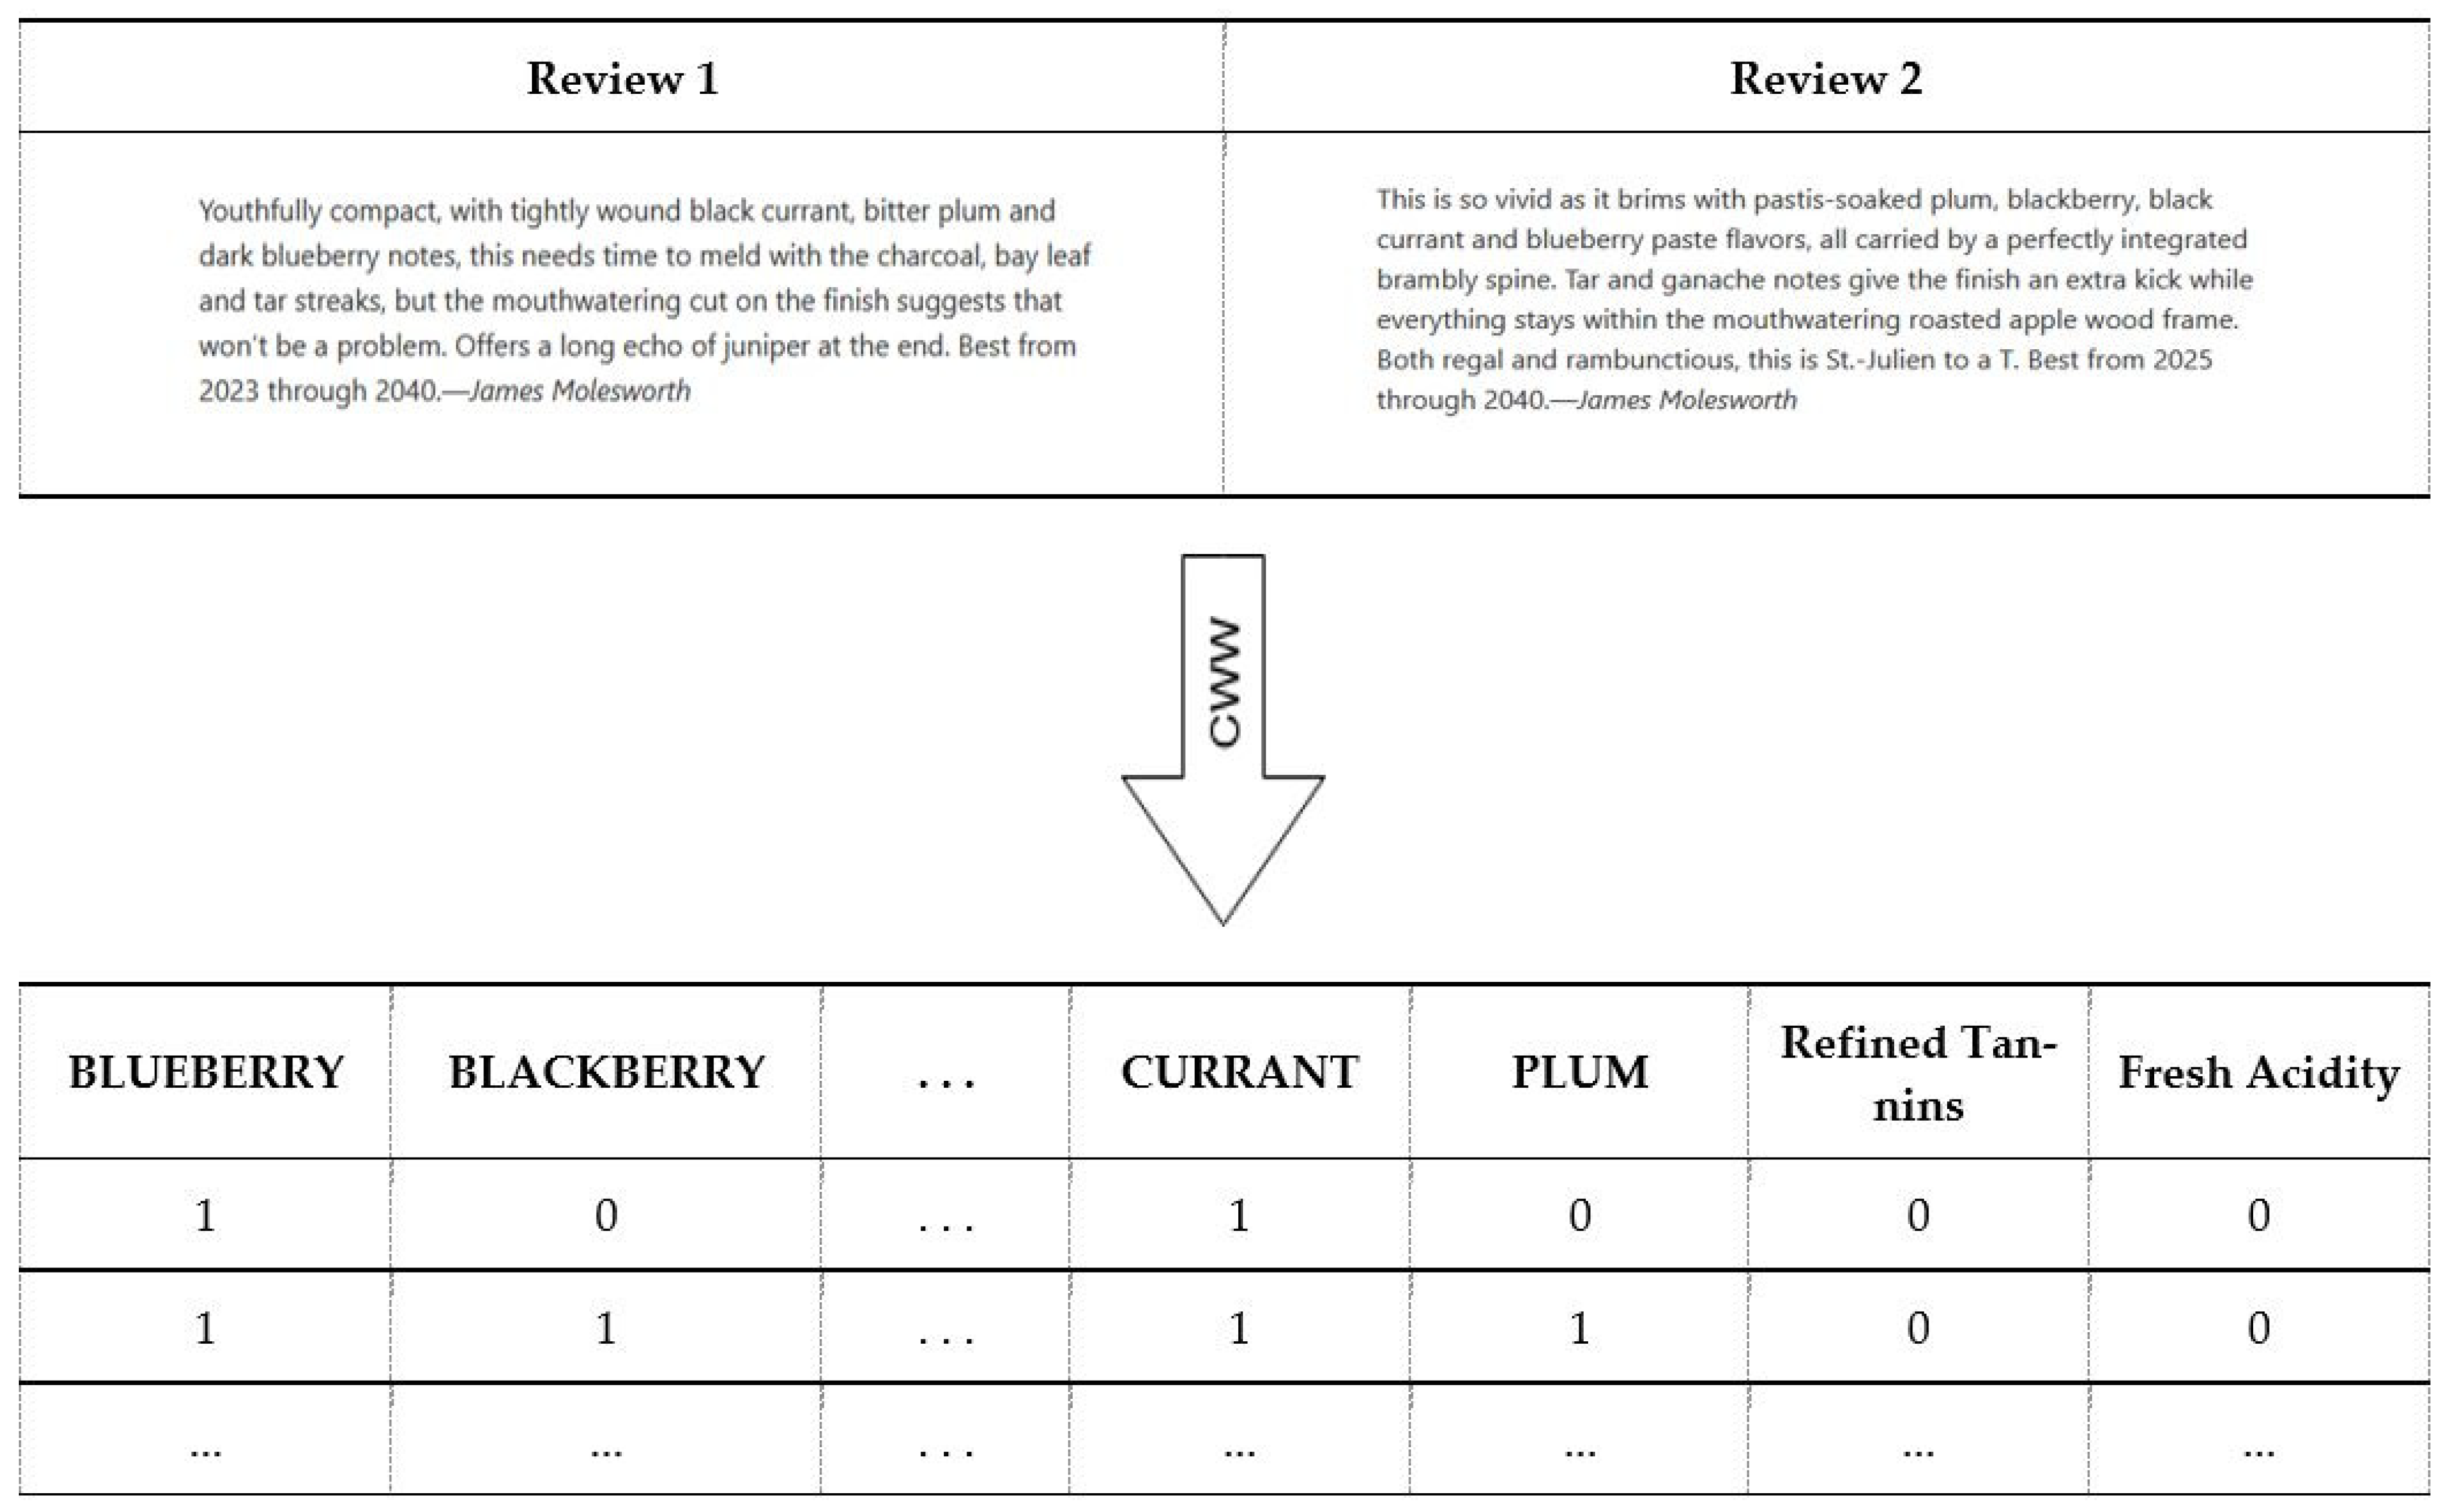
In the simplified version of the CWW, there are a number of attributes that correspond to wine features. Those features are used as columns, and if any specific wine has a unique set of features, corresponding attributes will be encoded into the table. The table below shows sample reviews, the first containing the words “black currant, bitter plum” and the other “pastis-soaked plum”; therefore the corresponding attributes CURRANT and PLUM are encoded with value of one in the table. On the other hand, only one sample has BLUEBERRY as a feature, thus only one of those wines will be assigned one for the attributes BLUEBERRY and BLACKBERRY. Figure 2 represents the basic idea of converting website reviews to Computational Wine Wheel attributes, and the subsequent use of these attributes to construct a table that can be statistically evaluated.
2.3. Extract Consumption Data
The original 1855 Bordeaux Wine Dataset did not have columns for manufacturing date, last-drinking date, or whether to drink or hold a wine. For each wine, these additional attributes were extracted from Wine Spectator and added as new columns in the dataset. These new columns are known as labels for classification problems that determine the learning outcome of a classification problem. Different Wineinformatics experiments have utilized different labels in their research: wine grade was used to understand how to produce wines classed as outstanding or classic [12]; and wine price was used to predict the cost of a wine by reviews thereof [13]. In this paper, suggested holding year is calculated and treated as a label.
The initial step was to remove wines from the Bordeaux wine dataset without information about aging capability. The second step was to verify the suggested holding year of each wine by checking its manufacturing date and vintage, as well as its recommended consumption date and the status of whether the wine has extended aging capability. To decide the status of a wine (drink or hold), we calculate the aging capability as the “Best From” year minus its vintage year. Two examples are shown in Figure 1. By collecting all information about aging capability from the dataset, it was found that using 6 years as a threshold generated the best data balance in terms of drink-or-hold aging capability. From Table 1, a six-year threshold generated a nearly balanced dataset with a small number of differences between the total “drink” and “hold” aging-capability wines, which was around 100. The other tested thresholds, 5 and 7 years, generated datasets with a huge difference between their quantities, which would have cause problems due to an imbalanced dataset [14,15]. After all preprocessing, the final format of the dataset was generated, a sample of which is shown in Table 2. Since a balanced dataset is ideal for bi-class classification problems, we selected 6 years as the threshold for deciding to “drink” or “hold”.
2.4. Methods
To develop a wine prediction model for predicting whether a wine can be held for 6 years before reaching optimal conditions for drinking, a four-step process was used:
- Define the problem
- Employ algorithms (KNN, naïve Bayes, SVM)
- Dimension reduction
- Compute results
2.4.1. Algorithms
The KNN Algorithm
KNN algorithm is widely used in pattern recognition and data mining for classification problems. Its popularity stems mainly from its simplicity and low error rate. The principle of the algorithm is that, if the majority of the k nearest neighbors (most similar samples) to a query point in the feature space belong to a certain category, then a choice can be made as to whether falls within this category or not.
A training dataset with accurate classification labels should be known at the beginning of the algorithm. Then for a query data , whose label is unknown, the distances are calculated against all points in the training dataset. After sorting the results of the distances, the classifier is now able to choose which class label should be assigned to test point according to the label of the k nearest points in the training dataset [16]. Each point in n-dimensional space can be expressed as an n-vector of coordinates, such as:
The distance between two points in the multi-dimensional feature space can be defined in many ways. In this research, since the data is in binary format, the Jaccard’s distance is used to measure the distances between wines. It is defined as:
where
p = number of variables positive for both wine P and Q
q = number of variables positive in Q but not P
r = number of variables positive in P but not Q
The lower Jaccard’s distance indicated the similar two wines are; If the Jaccard’s distance equals to 0, it means the two wines are identical. The quality of the training dataset directly affects the classification results. At the same time, the choice of parameter K is also very important, for different K values could result in different classification labels.
Support Vector Machines (SVM)
SVM are supervised learning models with associated learning algorithms that analyze data and recognize patterns, and are used for classification and regression analyses [18]. A model for the SVM classifier can be created by constructing a hyperplane or set of hyperplanes in a high- or infinite-dimensional space, which can then be used to perform classification, regression, or other tasks.
During the SVM model generation, each sample is plotted as a point in an n-dimensional space (where n is the number of features in the training dataset) where the value of each feature is the value of a particular coordinate. Finally, classification is performed by finding the hyperplane that differentiates k classes (where k is the number of distinct classes for the target feature) well [19].
Intuitively, a good separation is achieved by the hyperplane that has the largest distance to the nearest training data point of any class (so-called functional margin), since in general the larger the margin the lower the generalization error of the classifier. After a model is generated from the training dataset, a separate testing dataset is used to evaluate the performance of the classifier.
2.4.2. Evaluation
All experiments carried in this research use 10-fold cross validation. To evaluate the effectiveness of the classification model, several standard statistical evaluation metrics are used in this paper: true positive (TP), true negative (TN), false positive (FP), and false negative (FN). Table 3 demonstrates the idea of the confusion matrix used herein.
Based on the confusion matrix given above, we use those four values to evaluate the classification results with respect to accuracy, recall, precision and F-Score:
Accuracy is defined as the proportion of wines that have been correctly classified among all wines. Accuracy is a very straight-forward metric; it helps us answer the question: of all the wines in the dataset, how many were correctly predicted as Drink or Hold?
Recall is the proportion of Hold wines (one, in the database) that were identified correctly. Recall explains the sensitivity of the model for recognizing a Hold wine. It helps us answer the question: of all the wines that should be hold, how many of those were correctly predicted?
Precision is the proportion of predicted Hold wines that were actually correct. It helps us answer the question: of all the wines that were classified as Hold, how many of those were actually wines that should be held?
F-Score is the harmonic mean of recall and precision. F-scores take both recall and precision into account, combining them into a single metric.
2.4.3. Dimension Reduction
On top of the 903 attributes generated from the Computational Wine Wheel, the experiment tried to remove some of the most popular attributes among the dataset to assess the impact thereof on performance. We first removed the attribute FINISH, because it occurs most frequently in the dataset. We next removed an additional three wine attributes; FRUIT, PLUM, GREAT, which were the second-, third- and fourth-most frequent attributes of the dataset. The analyses results, with and without the removal of these attributes, are given in the next section.
3. Results
In prior wineinformatics research [12,13], naïve Bayes and SVM have been the best classification algorithms in predicting wine grade. Each algorithm has their pros and cons. In short, SVM is a black-box classification algorithm that addresses outliers. KNN and naive Bayes are white-box classification algorithms, which mean the classification process can be understood by humans. KNN is a lazy learner and is non-parametric. The naïve Bayes algorithm is parametric and builds probability models to make its predictions. We also noticed that K-nearest neighbors (KNN) algorithms outperformed many white-box classification approaches; therefore, we report the findings with all three algorithms in this study.
The four-step process mentioned in the previous section was followed for each of the three algorithms and their results were recorded. All three procedures mentioned in Section 2.4.1 were used for all algorithms: the first procedure included all wine attributes, while, in the second and third procedures, some attributes were removed from the dataset to improve the performance of the algorithms. Each table describes the accuracy, recall, precision, and F-Score for each of different algorithms used.
Table 4 shows the results of using KNN to predict whether a wine can be held for more than six years or not. The results suggest that more than 70% of wine could be identify from wine reviews suggestions of their holding years by using a KNN algorithm. The results also show that removing the FINISH attribute from the dataset had a negative impact on the performance of the KNN algorithm. However, in procedure III, where we removed the FRUIT, PLUM, GREAT and FINISH attributes, recall was significantly improved (+11.54%) while precision dropped (−6.58%).
Table 5 shows the results of using a naïve Bayes algorithm. The results indicate that naïve Bayes does not fit for this research task since the prediction accuracy is only slightly higher than 50%, which is the baseline for a bi-class classification problem. The removal of attributes in the dataset had no impact on the performance of the naïve Bayes algorithm—only runtime was improved.
Table 6 shows the results by using an SVM algorithm. The results indicate that it provided the best prediction results of the three algorithms in terms of recorded results. The removal of attributes in the dataset consistently improved its performance across the board.
F-Score considers both precision and recall; it is the harmonic mean of them. An F-Score of one is best if there is some sort of balance between precision and recall in the system. Conversely, the F-Score will be lower if one measure is improved at the expense of the other. Due to the distribution of Drink (44.3%) versus Fold (55.7%) in the dataset, the F-score serves as a key evaluator of overall performance in all three algorithms.
It is unsurprising that SVM was the top-performing algorithm (F-Score = 78.75%). However, it is a black-box classification algorithm, so it is difficult to really understand why or how it came to make its decisions when performing the classification. The KNN algorithm (F-Score = 74.86%), though producing “stable” results (there is no gradual increase in performance when moving from procedure to procedure), performed quite well when predicting whether or not a wine should be drunk or held. Finally, the naïve Bayes algorithm (F-score = 34.33%) performed the worst of the three, mainly because it generated a model that was heavily biased toward predicting that a wine should be held.
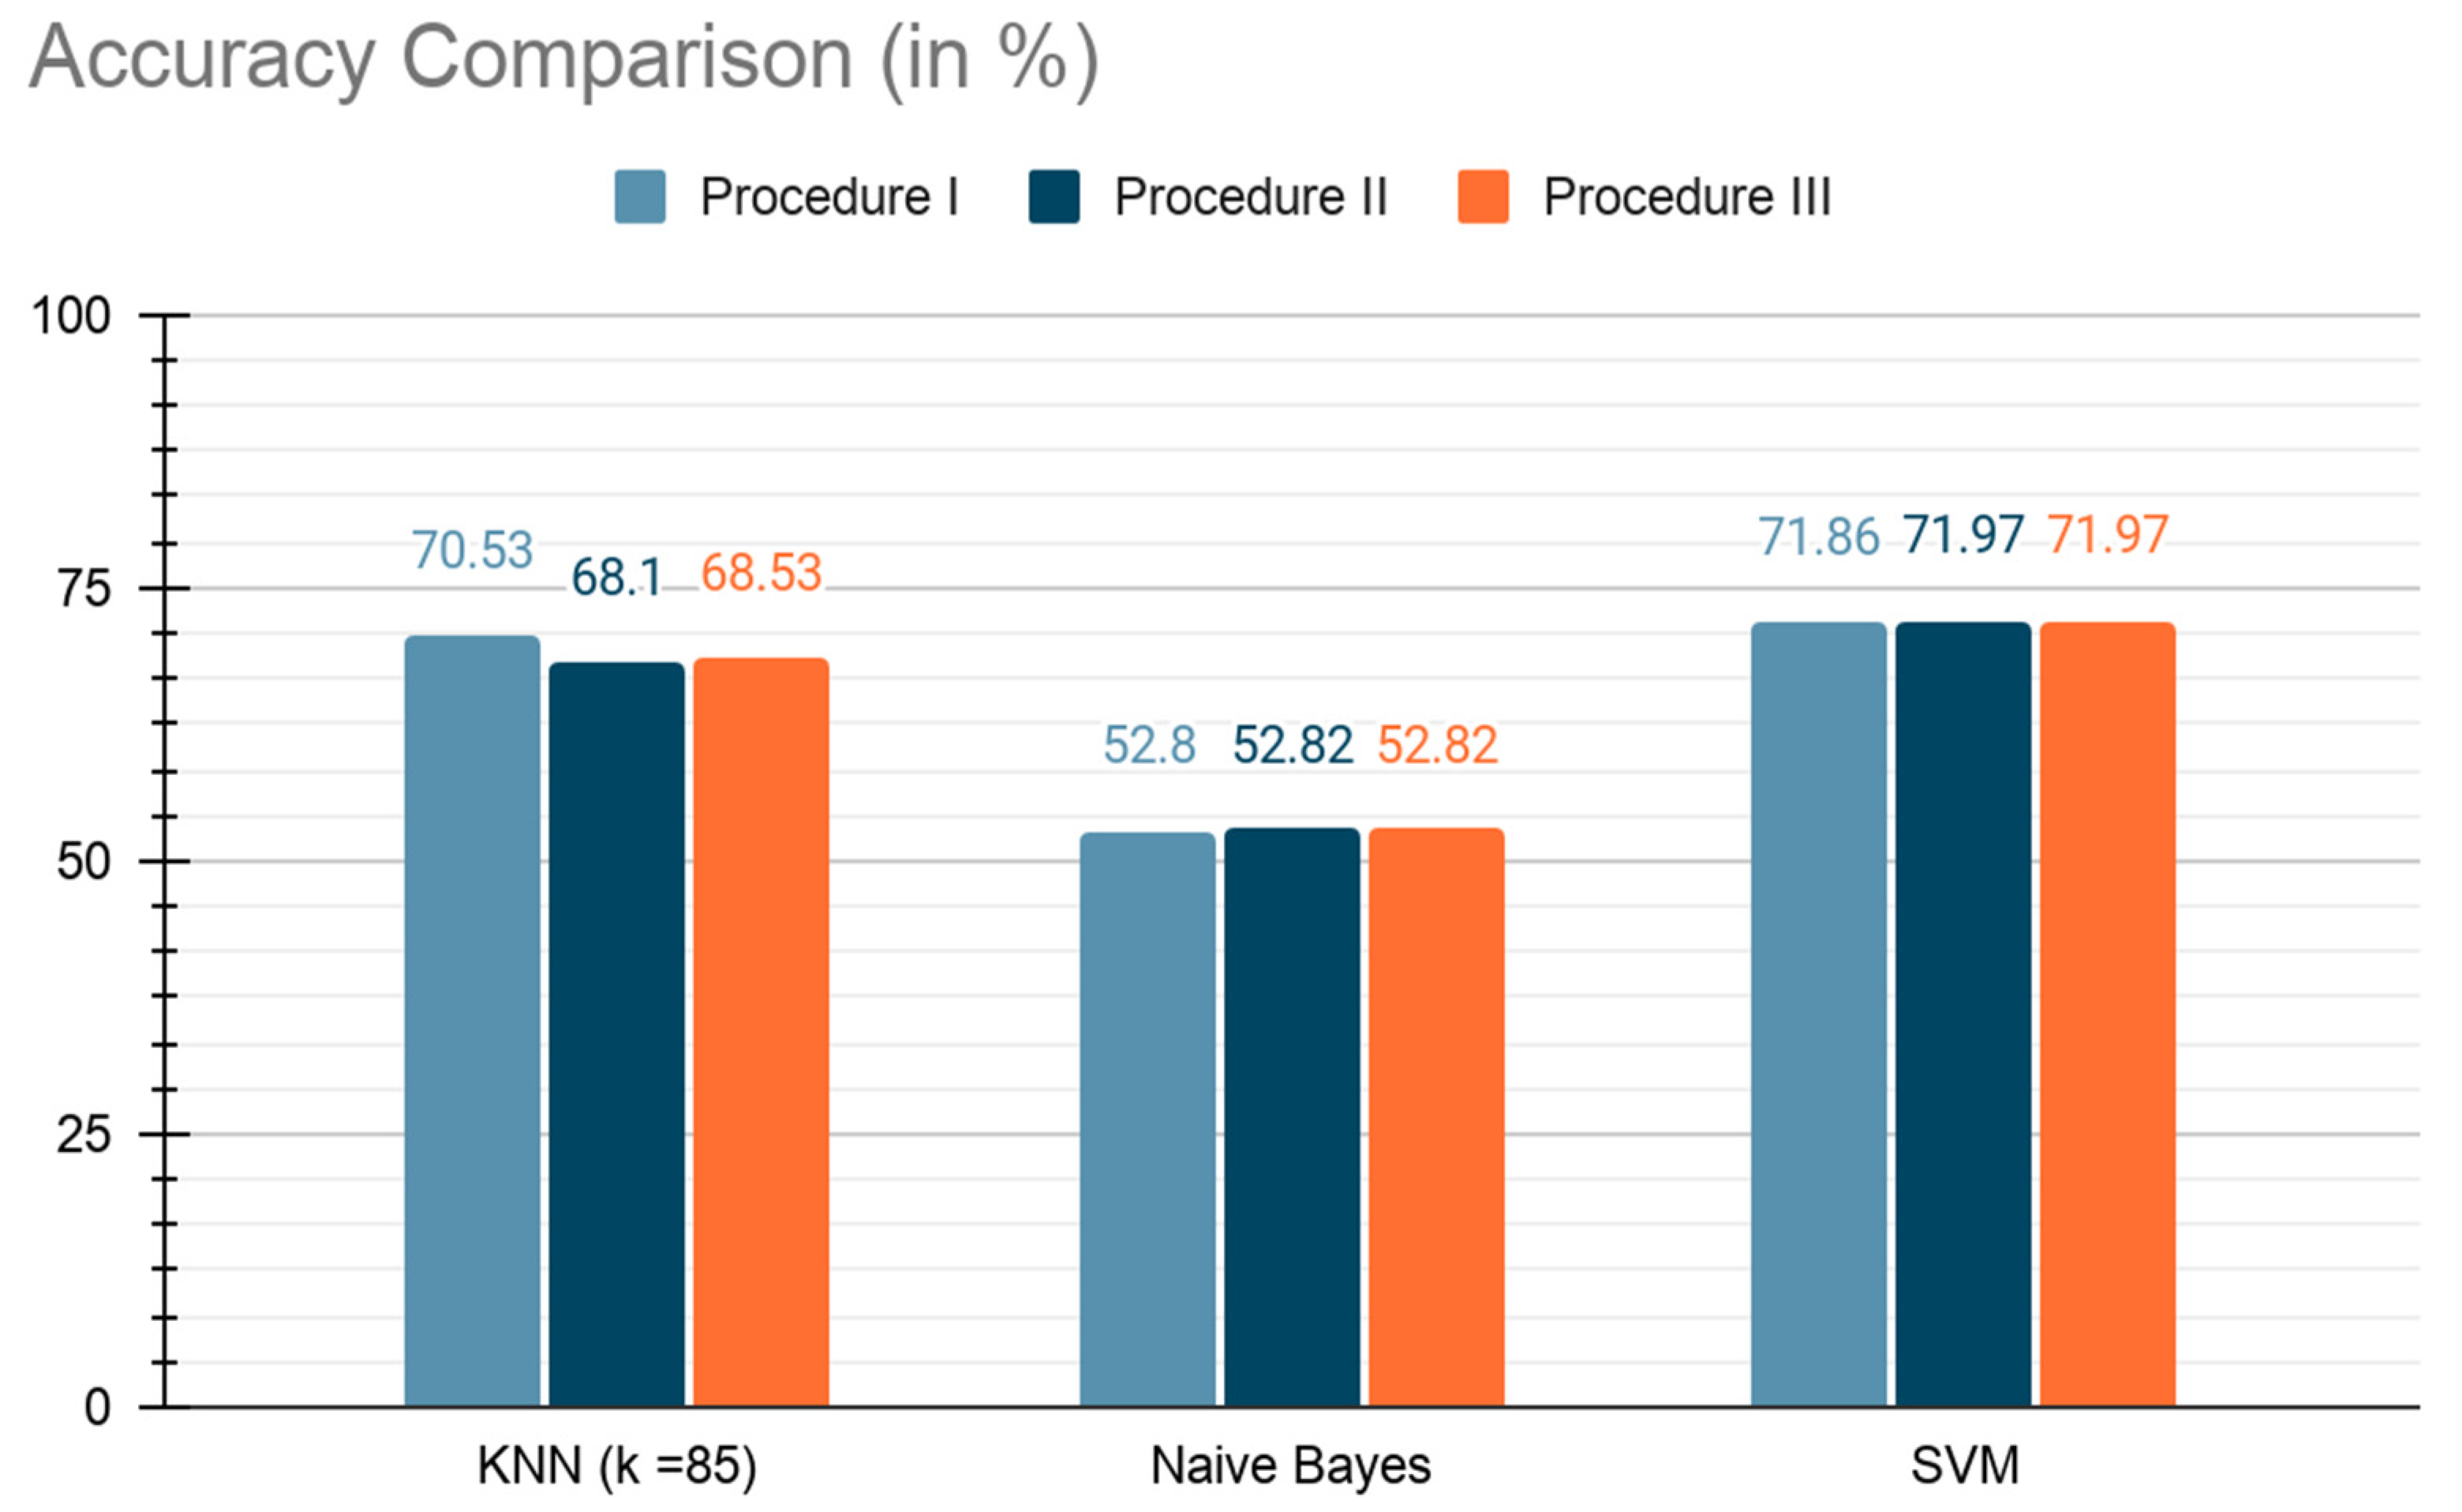
Figure 3 describes the performance of each algorithm on the wine dataset for each of the three procedures used. The goal of this paper is to utilize aging-capability information to associate wine reviews so as to test if they can be used to predict whether a wine can be held for more than six years or not. Three algorithms were used in the research, K-nearest neighbor (KNN), naïve Bayes, and support vector machines (SVM), to search for such hidden patterns. Two classification algorithms achieved more than 70% accuracy in this research. Several frequent attributes were deleted to test the impact thereof on the performances of the algorithms. While runtimes were improved when four attributes (FRUIT, PLUM, GREAT, and FINISH) were removed, SVM was also able to gain a minor improvements on all its evaluation metrics. Based on the performance of these algorithms, the KNN and SVM algorithms performed better on the dataset than did the naïve Bayes algorithm. This paper provides a new approach for using machine learning to understand the linkage between a wine’s reviews and its aging capability.
This research opens a new door for discovering wines’ aging capabilities and their tasting notes. Different labels can be used to extract distinct information; for example, instead of calculating the minimum years for holding by subtracting vintage year from the “best from” year, the aging capability can be derived as “through” year minus “best from” year, or the maximum drinkable years could be assessed as “through” year minus the vintage year of the wine. Bordeaux wines are considered exemplary of the Old World wines, which usually have longer aging capabilities compared with New World wines. Similar research could be carried out on new world wines, such as wines from the United States or Australia; the aging-years threshold would be expected to be shorter and the model thereof, built from classification algorithms, might vary widely from this research. Finally, the research results suggest that trying a more sophisticated approach to feature selection might be able to improve the classification performances of all the algorithms evaluated in this paper. Such step will be able to identify the important attributes linked with aging capacity. Although dimension reduction does not always yield better results, there seems to be enough academic literature supporting this idea [20,21] to warrant its exploration in the wine dataset.
4. Conclusions
To the best of our knowledge, this is the first paper to discuss the relationship between a wine’s reviews and its aging properties, or to use a wine’s aging capability as a class label in classification research. More than 900 Bordeaux wines’ reviews were included in the dataset and two algorithms were able to model the targeted relationship with more than 70% accuracy; thus, a new direction in wineinformatics has been developed by this research work.
Author Contributions
Conceptualization, B.C.; methodology, B.C., W.K., F.C., Y.Z.; software, W.K., F.C., Y.Z.; validation, B.C.; formal analysis, W.K., F.C., Y.Z.; resources, B.C.; data curation, B.C.; writing—original draft preparation, B.C., W.K., F.C., Y.Z.; writing—review and editing, B.C., W.K.; supervision, B.C.; project administration, B.C. All authors have read and agreed to the published version of the manuscript.
Funding
This research received no external funding.
Institutional Review Board Statement
Not applicable.
Informed Consent Statement
Not applicable.
Data Availability Statement
Not applicable.
Conflicts of Interest
The authors declare no conflict of interest.
References
- Muhammad, I.; Yan, Z. Supervised machine learning approaches: A survey. ICTACT J. Soft Comput. 2015, 5, 946–952. [Google Scholar] [CrossRef]
- Khanum, M.; Mahboob, T.; Imtiaz, W.; Ghafoor, H.A.; Sehar, R. A Survey on Unsupervised Machine Learning Algorithms for Automation, Classification and Maintenance. Int. J. Comput. Appl. 2015, 119, 34–39. [Google Scholar] [CrossRef]
- Van Engelen, J.E.; Hoos, H.H. A survey on semi-supervised learning. Mach. Learn. 2020, 109, 373–440. [Google Scholar] [CrossRef] [Green Version]
- Padakandla, S. A survey of reinforcement learning algorithms for dynamically varying environments. ACM Comput. Surv. 2021, 54, 1–25. [Google Scholar] [CrossRef]
- Chen, B.; Velchev, V.; Palmer, J.; Atkison, T. Wine Informatics: A Quantitative Analysis of Wine Reviewers. Fermentation 2018, 4, 82. [Google Scholar] [CrossRef] [Green Version]
- Schuring, R. RoboSomm Chapter 3: Wine Embeddings and a Wine Recommender. Available online: https://towardsdatascience.com/robosomm-chapter-3-wine-embeddings-and-a-wine-recommender-9fc678f1041e (accessed on 12 November 2020).
- Chen, B. Wineinformatics: 21st Century Bordeaux Wines Dataset. IEEE Dataport. 2020. Available online: https://ieee-dataport.org/open-access/wineinformatics-21st-century-bordeaux-wines-dataset (accessed on 18 October 2021).
- Ugliano, M. Oxygen contribution to wine aroma evolution during bottle aging. J. Agric. Food Chem. 2013, 61, 6125–6136. [Google Scholar] [CrossRef] [PubMed]
- Tao, Y.; García, J.F.; Sun, D. Advances in wine aging technologies for enhancing wine quality and accelerating wine aging process. Crit. Rev. Food Sci. Nutr. 2014, 54, 817–835. [Google Scholar] [CrossRef] [PubMed]
- Dong, Z.; Guo, X.; Rajana, S.; Chen, B. Understanding 21st Century Bordeaux Wines from Wine Reviews Using Naïve Bayes Classifier. Beverages 2020, 6, 5. [Google Scholar] [CrossRef] [Green Version]
- Chen, B.; Rhodes, C.; Crawford, A.; Hambuchen, L. Wineinformatics: Applying data mining on wine sensory reviews processed by the computational wine wheel. In Proceedings of the 2014 IEEE International Conference on Data Mining Workshop, Shenzhen, China, 14 December 2014; pp. 142–149. [Google Scholar]
- Chen, B.; Le, H.; Rhodes, C.; Che, D. Understanding the wine judges and evaluating the consistency through white-box classification algorithms. In Proceedings of the Industrial Conference on Data Mining, New York, NY, USA, 13–17 July 2016; Springer: Cham, Switzerland, 2016; pp. 239–252. [Google Scholar]
- Palmer, J.; Chen, B. Wineinformatics: Regression on the Grade and Price of Wines through Their Sensory Attributes. Fermentation 2018, 4, 84. [Google Scholar] [CrossRef] [Green Version]
- He, H.; Garcia, E.A. Learning from imbalanced data. IEEE Trans. Knowl. Data Eng. 2009, 21, 1263–1284. [Google Scholar]
- Chawla, V.N.; Japkowicz, N.; Kotcz, A. Special issue on learning from imbalanced data sets. ACM SIGKDD Explor. Newsl. 2004, 6, 1–6. [Google Scholar] [CrossRef]
- Kuang, Q.; Zhao, L. A practical GPU based kNN algorithm. In Proceedings of the 2009 International Symposium on Computer Science and Computational Technology (ISCSCI 2009), New Orleans, LA, USA, 31 August–4 September 2009; Academy Publisher: Oulu, FL, USA, 2009; p. 151. [Google Scholar]
- Metsis, V.; Androutsopoulos, I.; Paliouras, G. Spam Filtering with Naive Bayes—Which Naive Bayes? CEAS 2018, 17, 28–69. [Google Scholar]
- Suykens, K.J.A.; Vandewalle, J. Least squares support vector machine classifiers. Neural Process. Lett. 1999, 9, 293–300. [Google Scholar] [CrossRef]
- Ray, I.S. SVM: Support Vector Machine Algorithm in Machine Learning. 2020. Available online: https://www.analyticsvidhya.com/blog/2017/09/understaing-support-vector-machine-example-code/ (accessed on 28 November 2020).
- Fan, L.; Poh, K.L. A comparative study of PCA, ICA and class-conditional ICA for naïve bayes classifier. In Proceedings of the International Work-Conference on Artificial Neural Networks, San Sebastián, Spain, 20–22 June 2007; Springer: Berlin/Heidelberg, Germany, 2007; pp. 16–22. [Google Scholar]
- Zhang, M.L.; Peña, J.M.; Robles, V. Feature selection for multi-label naive Bayes classification. Inf. Sci. 2009, 179, 3218–3229. [Google Scholar] [CrossRef]
Figure 1.
Example of wine reviews on WineSpectator.com and their suggested holding years.

Figure 2.
The flowchart of review conversion into a machine-understandable format by the Computational Wine Wheel. The Computational Wine Wheel (CWW) is a dictionary-based natural language processing tool for the automatic extraction of key attributes from human-language wine reviews into machine-understandable binary data.

Figure 3.
Performance comparison with different procedures for all three algorithms. SVM outperformed the other two algorithms. Additional dimension reduction procedures also slightly improved its accuracy; it was the only algorithm to benefit from these additional steps. KNN, with k = 85, provided very comparable results with SVM when all attributes were trained (Procedure 1 in the figure). However, the additional dimension reduction step decreased its performance. Naïve Bayes performed poorly, unlike that reported in many other wineinformatics studies.


Table 1.
The change of the number of the wines receiving the drink or hold class labels, based on different thresholds. If the threshold was set to 5 years, the number of wines (720) classed as Hold is greater more than number of wines (185) classed as Drink. If the threshold is set to 7 years, the number of wines (333) classed as Hold is much less than the number of wines (572) classed as Drink. Therefore, the threshold was set to 6 years to generate a more balanced dataset.
| Threshold for Drink-or-Hold Aging Capability | Drink (<than Aging Capability) | Hold (≥than Aging Capability) |
|---|---|---|
| 5 years | 185 | 720 |
| 6 years | 401 | 504 |
| 7 years | 572 | 333 |
Table 2.
A sample wine dataset with the Drink and Hold attributes used as a class label. Compared with the data extracted from the Computational Wine Wheel, shown in Figure 2, additional column has been added to the end of the data, holding the class label. The “…” in the third column indicates much more attributes are included in the data format.
| Boysenberry | … | Current | Plum | Refined Tannings | Fresh Acidity | Class Label (Drink as 0 Hold as 1) | |
|---|---|---|---|---|---|---|---|
| Wine A | 0 | … | 1 | 0 | 0 | 0 | 0 |
| Wine B | 1 | … | 1 | 1 | 0 | 0 | 1 |
Table 3.
The confusion matrix of this research. A true positive means a wine is predicted as Hold, which means the wine can be aged for more than 6 years; it is assigned a value of one, which matches our database value. A true negative implies a wine is predicted as Drink, which means the wine cannot be aged for more than 6 years; it is assigned a value of zero, which matches our database value. A false positive means a wine is predicted as Hold; it is assigned a value of one, but the real value from the dataset is zero—in other words, the wine is predicted as Hold but in fact, the wine is suggested to be drunk within 6 years. A false negative is the opposite circumstance, wherein the value of zero was predicted, but was one in our database.
| Confusion Matrix | Predicted: YES | Predicted: NO |
|---|---|---|
| Actual: YES | TP | FN |
| Actual: NO | FP | TN |
Table 4.
Results of the performance of the KNN algorithm on the wine dataset with a K-value of 85.
| Accuracy | Recall | Precision | F-Score | |
|---|---|---|---|---|
| Procedure I (all wine attributes) | 70.53% | 72.56% | 74.04% | 73.29% |
| Procedure II (FINISH attribute removed) | 68.10% | 75.55% | 70.37% | 72.86% |
| Procedure III (FRUIT, PLUM, GREAT, and FINISH attributes removed) | 68.53% | 84.10% | 67.46% | 74.86% |
Table 5.
Results of the performance of the naïve Bayes algorithm on the wine dataset.
| Accuracy | Recall | Precision | F-Score | |
|---|---|---|---|---|
| Procedure I (All wine attributes) | 52.92% | 22.35% | 80.13% | 34.33% |
| Procedure II (FINISH attribute removed) | 52.92% | 22.35% | 80.13% | 34.33% |
| Procedure III (FRUIT, PLUM, GREAT, and FINISH attributes removed) | 52.92% | 22.35% | 80.13% | 34.33% |
Table 6.
Results of the performance of an SVM algorithm on the wine dataset.
| Accuracy | Recall | Precision | F-Score | |
|---|---|---|---|---|
| Procedure I (All wine attributes) | 71.86% | 74.44% | 73.69% | 74.12% |
| Procedure II (FINISH attribute removed) | 71.97% | 74.55% | 74.26% | 74.40% |
| Procedure III (FRUIT, PLUM, GREAT, and FINISH attributes removed) | 71.97% | 74.95% | 74.51% | 78.75% |
Publisher’s Note: MDPI stays neutral with regard to jurisdictional claims in published maps and institutional affiliations. |
© 2021 by the authors. Licensee MDPI, Basel, Switzerland. This article is an open access article distributed under the terms and conditions of the Creative Commons Attribution (CC BY) license (https://creativecommons.org/licenses/by/4.0/).
Share and Cite
MDPI and ACS Style
Kwabla, W.; Coulibaly, F.; Zhenis, Y.; Chen, B. Wineinformatics: Can Wine Reviews in Bordeaux Reveal Wine Aging Capability? Fermentation 2021, 7, 236. https://0-doi-org.brum.beds.ac.uk/10.3390/fermentation7040236
AMA Style
Kwabla W, Coulibaly F, Zhenis Y, Chen B. Wineinformatics: Can Wine Reviews in Bordeaux Reveal Wine Aging Capability? Fermentation. 2021; 7(4):236. https://0-doi-org.brum.beds.ac.uk/10.3390/fermentation7040236
Chicago/Turabian StyleKwabla, William, Falla Coulibaly, Yerkebulan Zhenis, and Bernard Chen. 2021. "Wineinformatics: Can Wine Reviews in Bordeaux Reveal Wine Aging Capability?" Fermentation 7, no. 4: 236. https://0-doi-org.brum.beds.ac.uk/10.3390/fermentation7040236
Note that from the first issue of 2016, this journal uses article numbers instead of page numbers. See further details here.