On the Effect of Block Roughness in Ogee Spillways with Flip Buckets


1
Department of Civil Engineering, Faculty of Engineering, University of Maragheh, Maragheh 8311155181, Iran
2
Department of Civil Engineering, Faculty of Engineering, University of Zanjan, Zanjan 4537138791, Iran
3
Department of Civil Engineering, University of Calabria, 87036 Arcavacata, Italy
4
Department of Civil Engineering, Faculty of Engineering, Razi University of Kermanshah, Kermanshah 6714414971, Iran
5
Department of Engineering, Engineering Faculty, Niccolò Cusano University, 00166 Rome, Italy
*
Author to whom correspondence should be addressed.
Fluids 2020, 5(4), 182; https://0-doi-org.brum.beds.ac.uk/10.3390/fluids5040182
Submission received: 10 September 2020
/
Revised: 11 October 2020
/
Accepted: 14 October 2020
/
Published: 16 October 2020
Abstract
:In this study, the effect of the presence of bed-block roughness in an ogee spillway on energy dissipation and jet length is investigated. A series of experimental and numerical tests were conducted using an ogee spillway with block roughness on the bed without a flip bucket and with a flip bucket at different take-off angles (32 °C and 52 °C). To model the free-flow surface, the volume-of-fluid (VOF) method and turbulence model from RNG k–ε were used. Results indicated that the numerical model is fairly capable of simulating a free-flow surface over an ogee spillway; using block roughness on the spillway chute without a bucket, relative energy dissipation increased by 15.4% compared to that in the spillway with a smooth bed, while for the spillway with 32 °C and 52 °C buckets, it increased by 9.5%. The jet length for a spillway with a flip bucket and roughened bed decreased by 8% to 58% compared to that in a smooth bed. Lastly, the relationships for the estimation of relative energy dissipation and jet length are presented.
1. Introduction
Energy-dissipating structures (i.e., hydraulic jump stilling basins, roller buckets, ski jump buckets) are usually constructed at the end of spillway discharge channels in order to dissipate the extra energy. Specifically, flip buckets are mainly placed at the end of chute spillways and outlets of high dams in order to dissipate the energy characterizing high-velocity flows [1]. So far, various models of flip buckets, such as simple, splitter, deflector, and specific compound buckets have been built, but information about the design of compound buckets is still limited and more studies are needed [2]. Flip buckets were proposed as successful hydraulic structures in the Dordogne hydraulic projects performed in France in the middle of 1930s, and after experiments carried out by Maitre and Obolenski on jet flows in 1954 [3]. Rohne and Peterka [4] conducted a study on an improved flip bucket design for the US Bureau of Reclamation. The simplest flip bucket is represented by a cylindrical shell sector tangent to the floor of the flood conduit (chute or tunnel), as suggested in studies conducted in 1993 on the Grand Coulee dam located in Washington [4]. Joun and Hager [5] evaluated the flip buckets both in the type of a prismatic rectangular channel and a bucket having a lateral flow deflector. In their research, the scale effects in the hydraulic models, pressure distribution through the bucket, flow projectile, shock-wave creation conditions and governing choking relations were investigated [5]. Dargahi [6] performed a numerical and experimental study on an ogee spillway using Fluent® software to simulate the flow with regular mesh. Steiner et al. [7] investigated the ski jump hydraulics in a laboratory model study related to circular bucket geometry. Kermannejad et al. [8] worked on dynamic pressure due to the impact of a ski jump out of a flip bucket downstream of a chute spillway model. Their results showed that the pressure coefficient is highly sensitive to horizontal and vertical distances from the impact location and impact angle. Zhenvwei and Zhiyan [9], and Parsaie et al. [10] investigated flow characteristics over chutes and the cavitation phenomenon using computational-fluid-dynamics (CFD) approaches on a spillway’s flip bucket. Daneshfaraz and Ghaderi [11] studied the effect of a reverse arch of an ogee spillway on pressure on the spillway. Yamini et al. [12] experimentally investigated the effect of entrance flow conditions on pressure fluctuation on the bed of compound flip buckets of the Gotvand dam in Iran.
One of the ways to reduce or even omit downstream energy dissipator dimensions, is to decrease the flow energy in the chutes. This can be accomplished, for example, with the use of a barrier or baffled aprons in the bed because they dissipate more hydraulic energy than corresponding conventional chutes or spillways do. A backfill is placed over one or more rows of baffles to restore the original bed elevation. When scour or downstream channel degradation occurs, successive rows of baffles are used to prevent excessive flow acceleration [13]. The baffled chute spillway relies upon multiple rows of baffles to aid in energy dissipation, as suggested by the United States Bureau of Reclamation (USBR), which conducted extensive studies on baffle block chutes to achieve an optimal design. Kaya and Emiroglu [14] investigated the effect of stepped, wedge, T-shaped, and trapezoidal blocks at different chute bed slopes on the energy dissipation of the flow passing over this structure. Elnikhely [15] examined the effect of cylindrical blocks installed on the ramp downstream of the spillway on the dimensions of a downstream scour hole.
As can be seen from the literature, most researchers have concentrated their efforts and studies on the use of energy-dissipating structures downstream of spillways or dams. However, there is still a lack of research focused on the appendance of elements on chutes as energy dissipators. The present study conducts numerical and experimental analysis on the effect of bed blocks on an ogee spillway, considering the amount of dynamic energy dissipation of water and jet length. Experiments were performed on physical models in an ogee spillway (USBR standard) with and without a flip bucket, with different take-off angles, applying the block roughness on the ogee spillway bed at a different range of Froude numbers.
2. Methods
2.1. Energy-Dissipation Analysis
The first step to develop a correlation is to select parameters that influence flow energy dissipation. In this research, we focused on the input parameters to keep correlation as simple as possible. In order to reach the aims of the present study, energy dissipation can be written as a function of the listed parameters in Equation (1):
where ∆E/E0 is the relative energy dissipation, Hdam is the dam height, ρ is the water density, μ is the dynamic viscosity of water, g is the gravitational acceleration, V the approaching flow velocity, y the flow depth, R the bucket’s radius, θ the take-off angle, σ the surface tension, and a the dimension of the roughness block. According to the Buckingham π theorem, the general relationship below can be obtained:
where R/a is the relative buckets radius, y/a is the relative depth of the approach flow, yc/Hdam is the relative critical flow depth, Fr is the approach flow Froude number to the bucket, We is the Weber number, and Re is the Reynolds number of the flow approaching the bucket, assuming the same value in all experiments (Re > 1 × 10⁵), thus not influencing Equation (2) [16]. Moreover, the effect of surface tension can be neglected: when flow depth on the spillway was more than 0.05 m (in the experiments, the least flow depth on the spillway was 0.053 m), inertia force dominated, and the effects of the Weber number (We = ρV2L/σ) could be neglected. In this research, longitudinal dimension and roughness height a were fixed. Thus, the final equation can be summarized as:
2.2. Multiphase (Water/Air) Hydraulic Model
The most common application of CFD for this area is associated with the simulation of free surfaces: open channel flows, overflows, and hydraulic jumps. The FLOW-3D® computational package, able to solve complex fluid dynamic problems, was used. This software shows high performance in modeling unsteady free-surface flows: it utilizes the finite-volume method for structured meshes to solve the three-dimensional Reynolds-averaged Navier–Stokes equations of fluid motion. These equations can be written in a Cartesian coordinate system (x, y, z) as follows [17,18]:
where (u, v, w) are velocity components, A symbols are the cross-sectional area of the flow associated with the flow direction, G terms are local fluid accelerations, and f terms are related to frictional forces in the respective directions; ρ indicates fluid density, K the local pressure, VF the fractional volume open to flow in the fractional area/volume obstacle representation (FAVOR) method, p the pressure, and R the source term.
A turbulence model is necessary to account for turbulent Reynolds stresses. Here, the k–ε re-normalization group (RNG) turbulence model was selected [19,20]. This model was applied to similar flow scenarios and is capable of providing accurate and efficient solutions [21,22,23,24,25,26,27]. The RNG k–ε model is a two-equation model expressed as:
where k is the turbulent kinetic energy, ε is the turbulence-dissipation rate, Gk is the production of turbulent kinetic energy that arises due to mean velocity gradient, Gb is turbulent kinetic energy production from buoyancy, YM is the fluctuating dilation in compressible turbulence, and αk and αε are inverse effective Prandtl numbers for turbulent kinetic energy and its dissipation, respectively [28]. In the above equations, = = 1.39, C1s = 1.42, and = 1.6 are model constants. All constants were explicitly derived in the RNG procedure. Terms Sk and are sources terms for and , respectively. In addition, Rε is a proper term of the RNG model with respect to the k–ε one. The following equations provide details on how effective viscosity is determined, considering molecular and turbulent effects:
where t is turbulence viscosity and eff is effective viscosity.
Since the present situation contained a free-surface interface (between water and air fluids), the software used the volume-of-fluid (VOF) method [29]. This method [30] can be summarized by Equation (12):
where A is the average ratio of the flow area along the x, y, and z directions, and u, v, and w are the average velocities along x, y, and z. Term F is the fraction function that represents the amount of fluid in each cell: it takes values of 0 for a cell that is empty of a particular fluid, and 1 for full fluid cells [31].
3. Experimental and Numerical Test Cases
3.1. Experiment Facilities
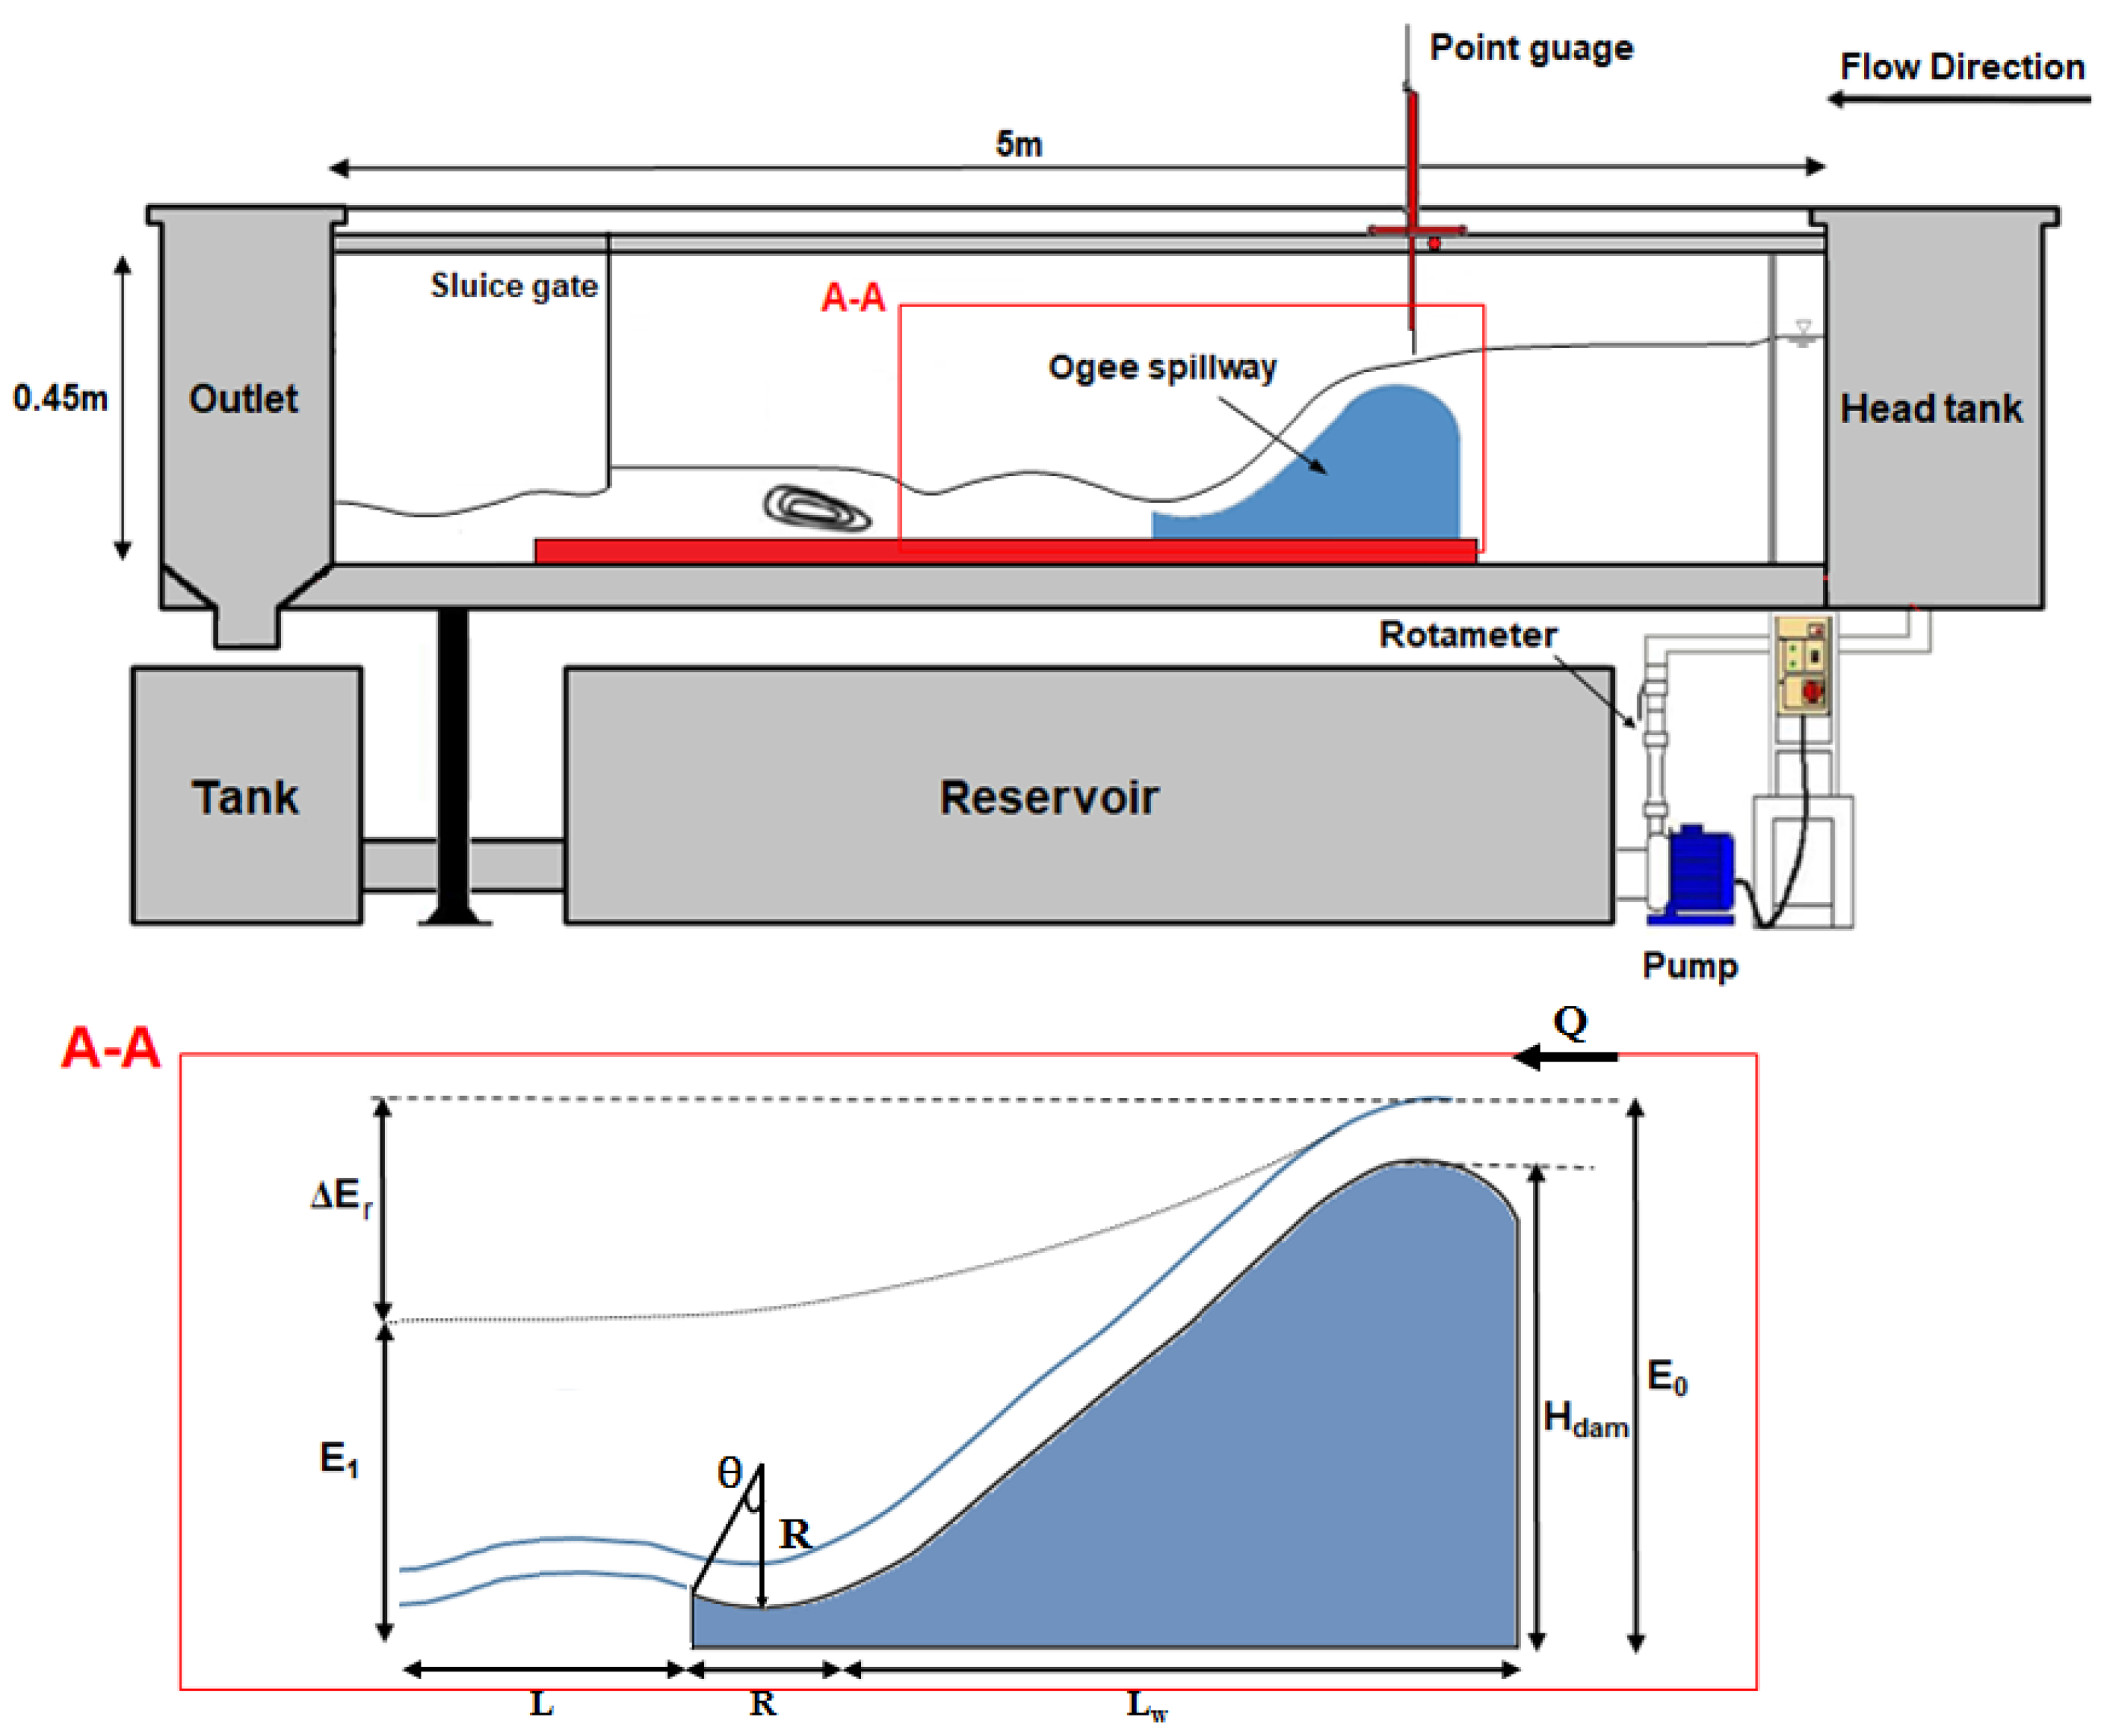
Tests were carried out at the Maragheh University Hydraulic Laboratory. A 5 m long flume with a rectangular section (0.3 m width and 0.45 m height) bed, and walls in plexiglass (to improve flow visibility and reduce friction), was adopted. With plexiglass, the influence of sidewall effects is considered to be negligible [32,33].
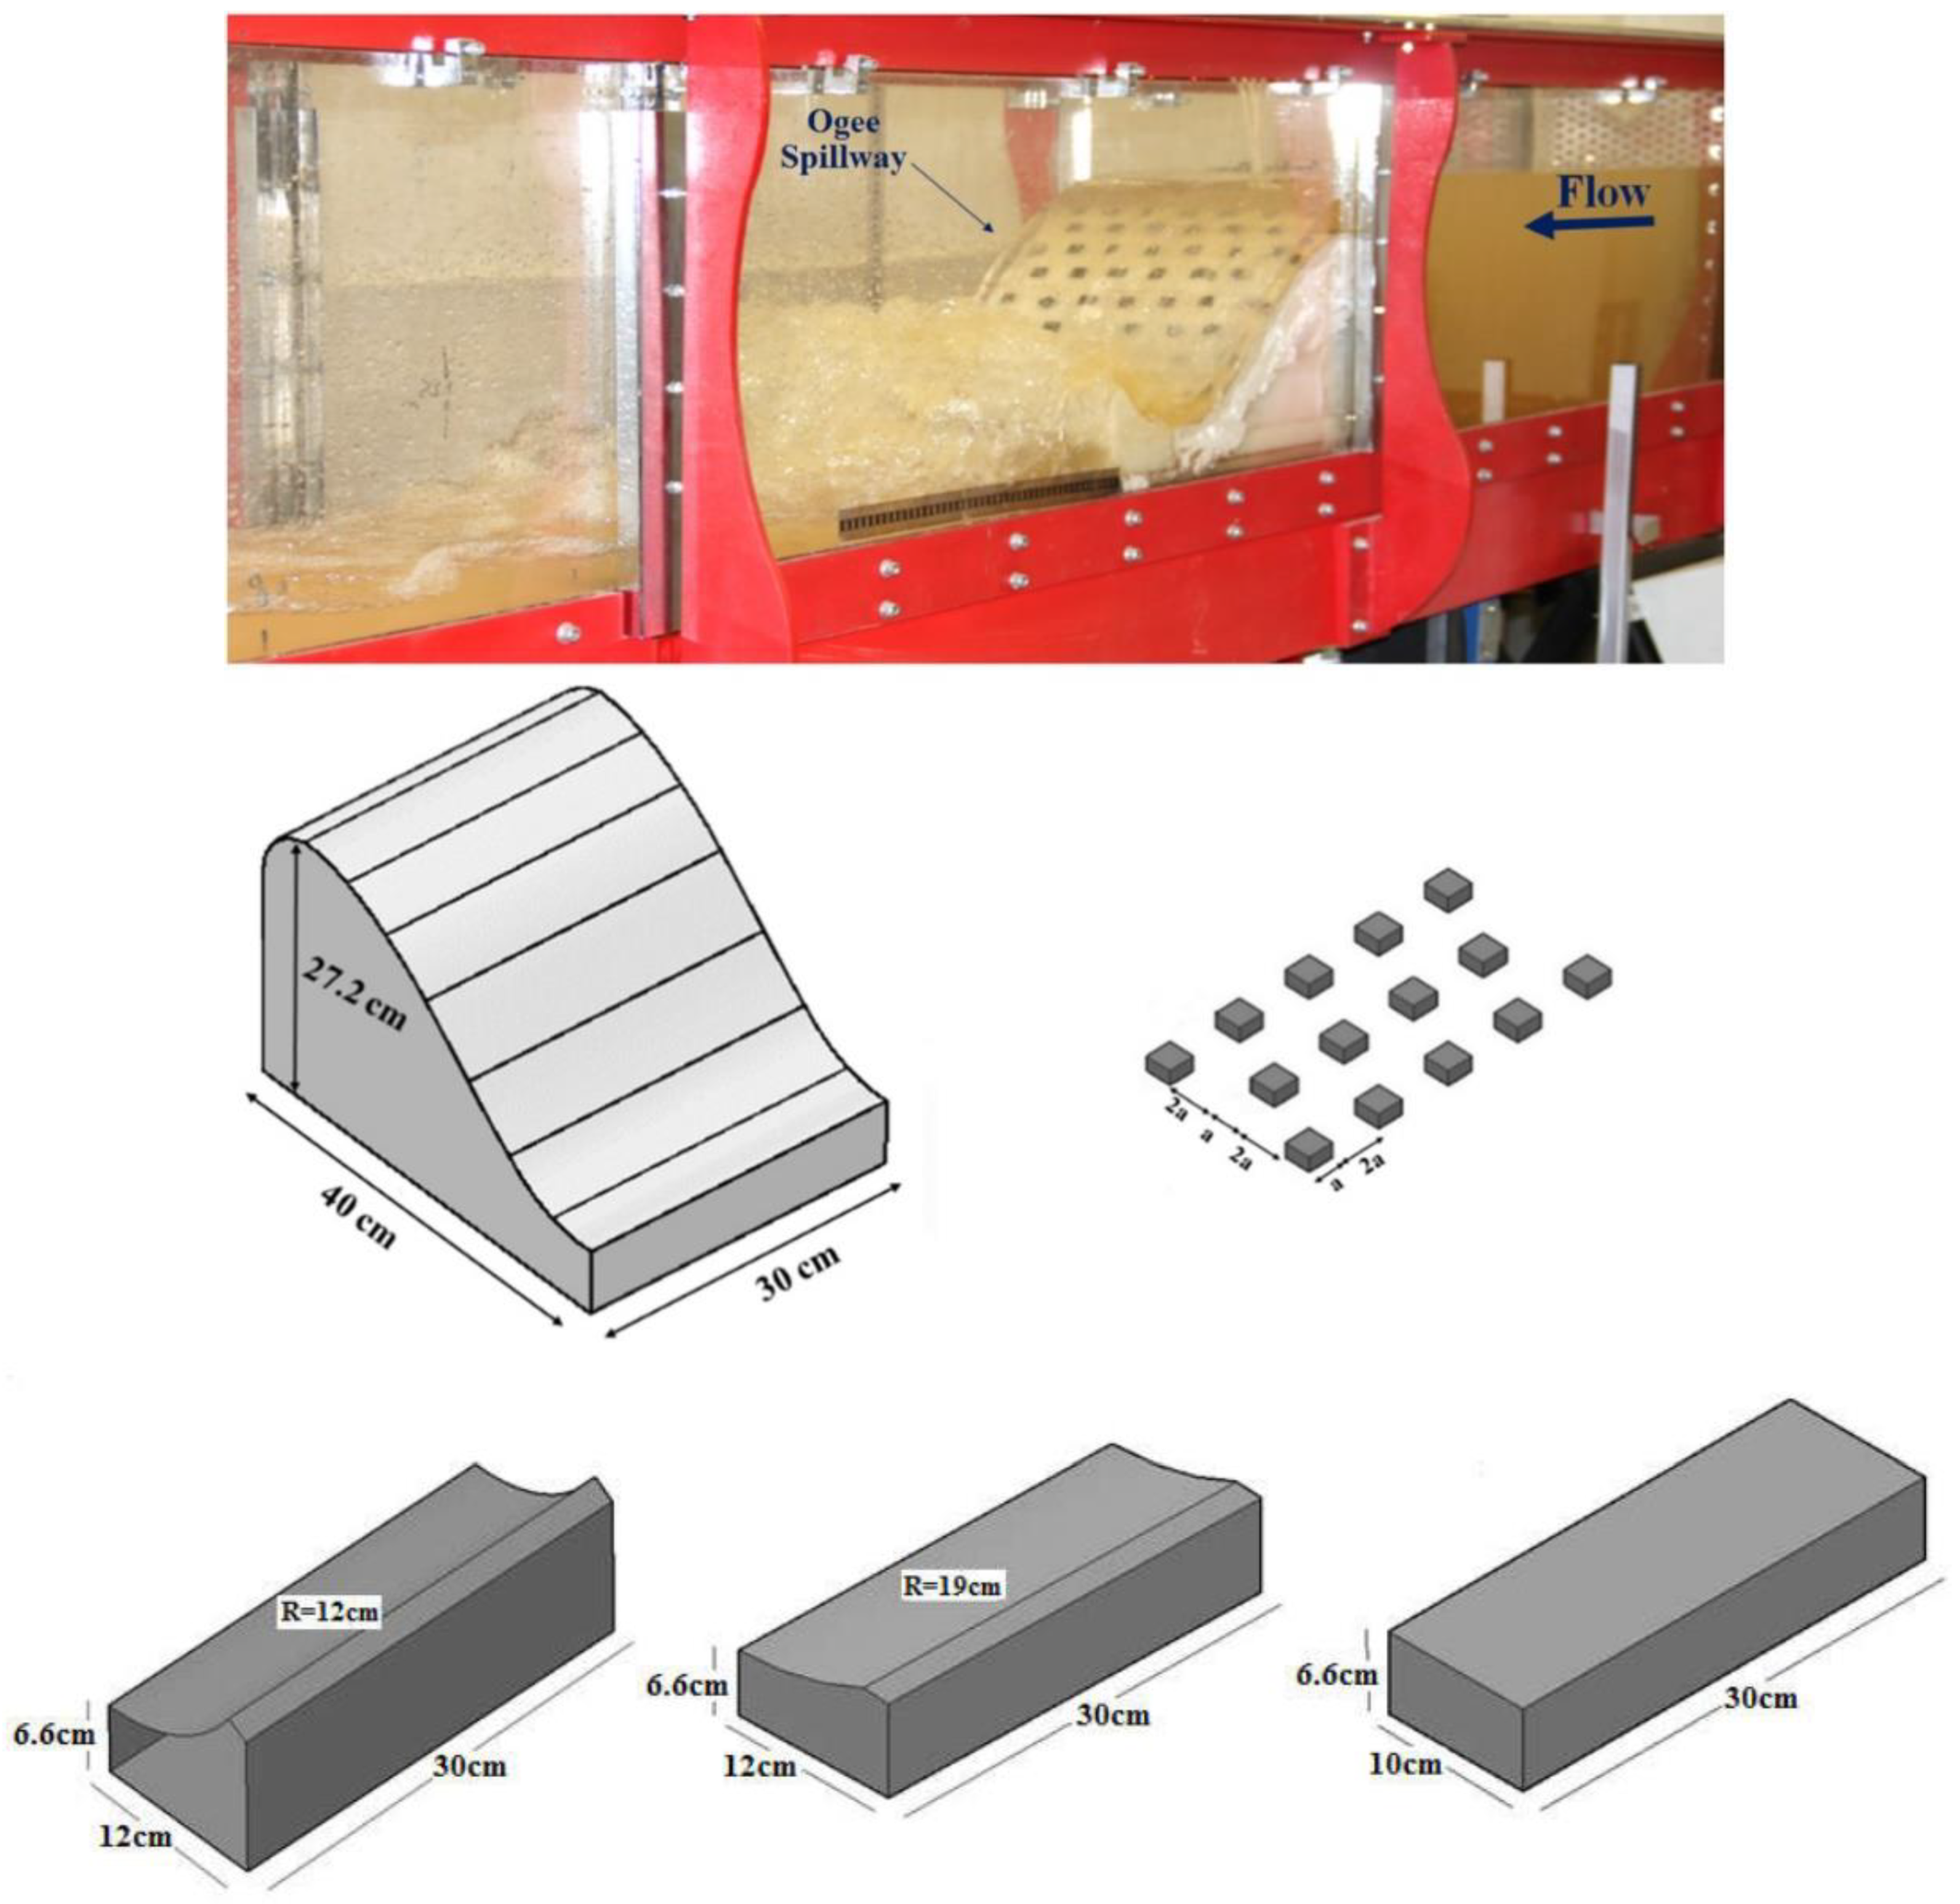
Flow in the flume was generated with two pumps with a maximal flow rate of 0.075 m3/s, connected to two rotameters with ±2% accuracy [34,35]. To eliminate turbulence in the entrance region, a planar mesh was added. At the inlet of the flume, there was a screen that eliminated the flow turbulence, and flow slowly entered the laboratory flume; to ensure steady flow, spillway models were installed 1.5 m downstream of the inlet tank. The physical model of the ogee spillway, based on the procedure reported in USBR (1987) [36], was fabricated from dense polyethylene and located 0.7 m far from the inlet of the flume (Figure 1), with a scale of 1:33 (height of 0.27 m, length of 0.4 m, and width of 0.3 m) on the basis of the Froude similarity criterion between model and prototype. It includes the whole ogee spillway and chute, which is 0.4 m long and connected with the flip bucket at the exit. After some pre-experiments, two types of flip buckets with take-off angles θ = 35° and 52 °C, and radii R = 19 and 12 cm, respectively, were considered. Block roughness with length and width of 1.5 cm, and height of 0.5 cm was considered in the bed of the ogee spillway.
A gauge point mounted on the flume top was used to measure upstream and downstream flow depth on the spillway. Jet length was measured with an inserted strip in both sides of the flume. To reduce the measuring error, jet length was measured by averaging both sides of the flume considering the length of the jet as the distance between the bucket end and where the water descended. In order to accurately measure flow depth, the average of three depths measured at 5 cm intervals from the walls and in the middle of the flume was used. Then, flow velocity was calculated using the continuity equation. As shown in Figure 1, relative energy dissipation was calculated from Equation (13):
where ∆Er is the relative energy dissipation, E0 is the total energy of upstream flow, and E1 is the current energy in the base of the spillway. Figure 2 and Table 1 illustrate the dimensions of the ogee spillway model with the roughness block, and list the geometric and hydraulic conditions, respectively (parameter a in Figure 2 is the dimension of the roughness block). Considering the 1:33 scale of physical model, approach flow Froude number Fr = V/(gh)0.5 was about 1.29–3.62, with Reynolds number Re = Vh/ν being about 2.07 × 10⁴–3.895 × 10⁴, where ν is the kinematic water viscosity, g is the gravitational acceleration, and V and h are the mean velocity and depth of approach flow, respectively.
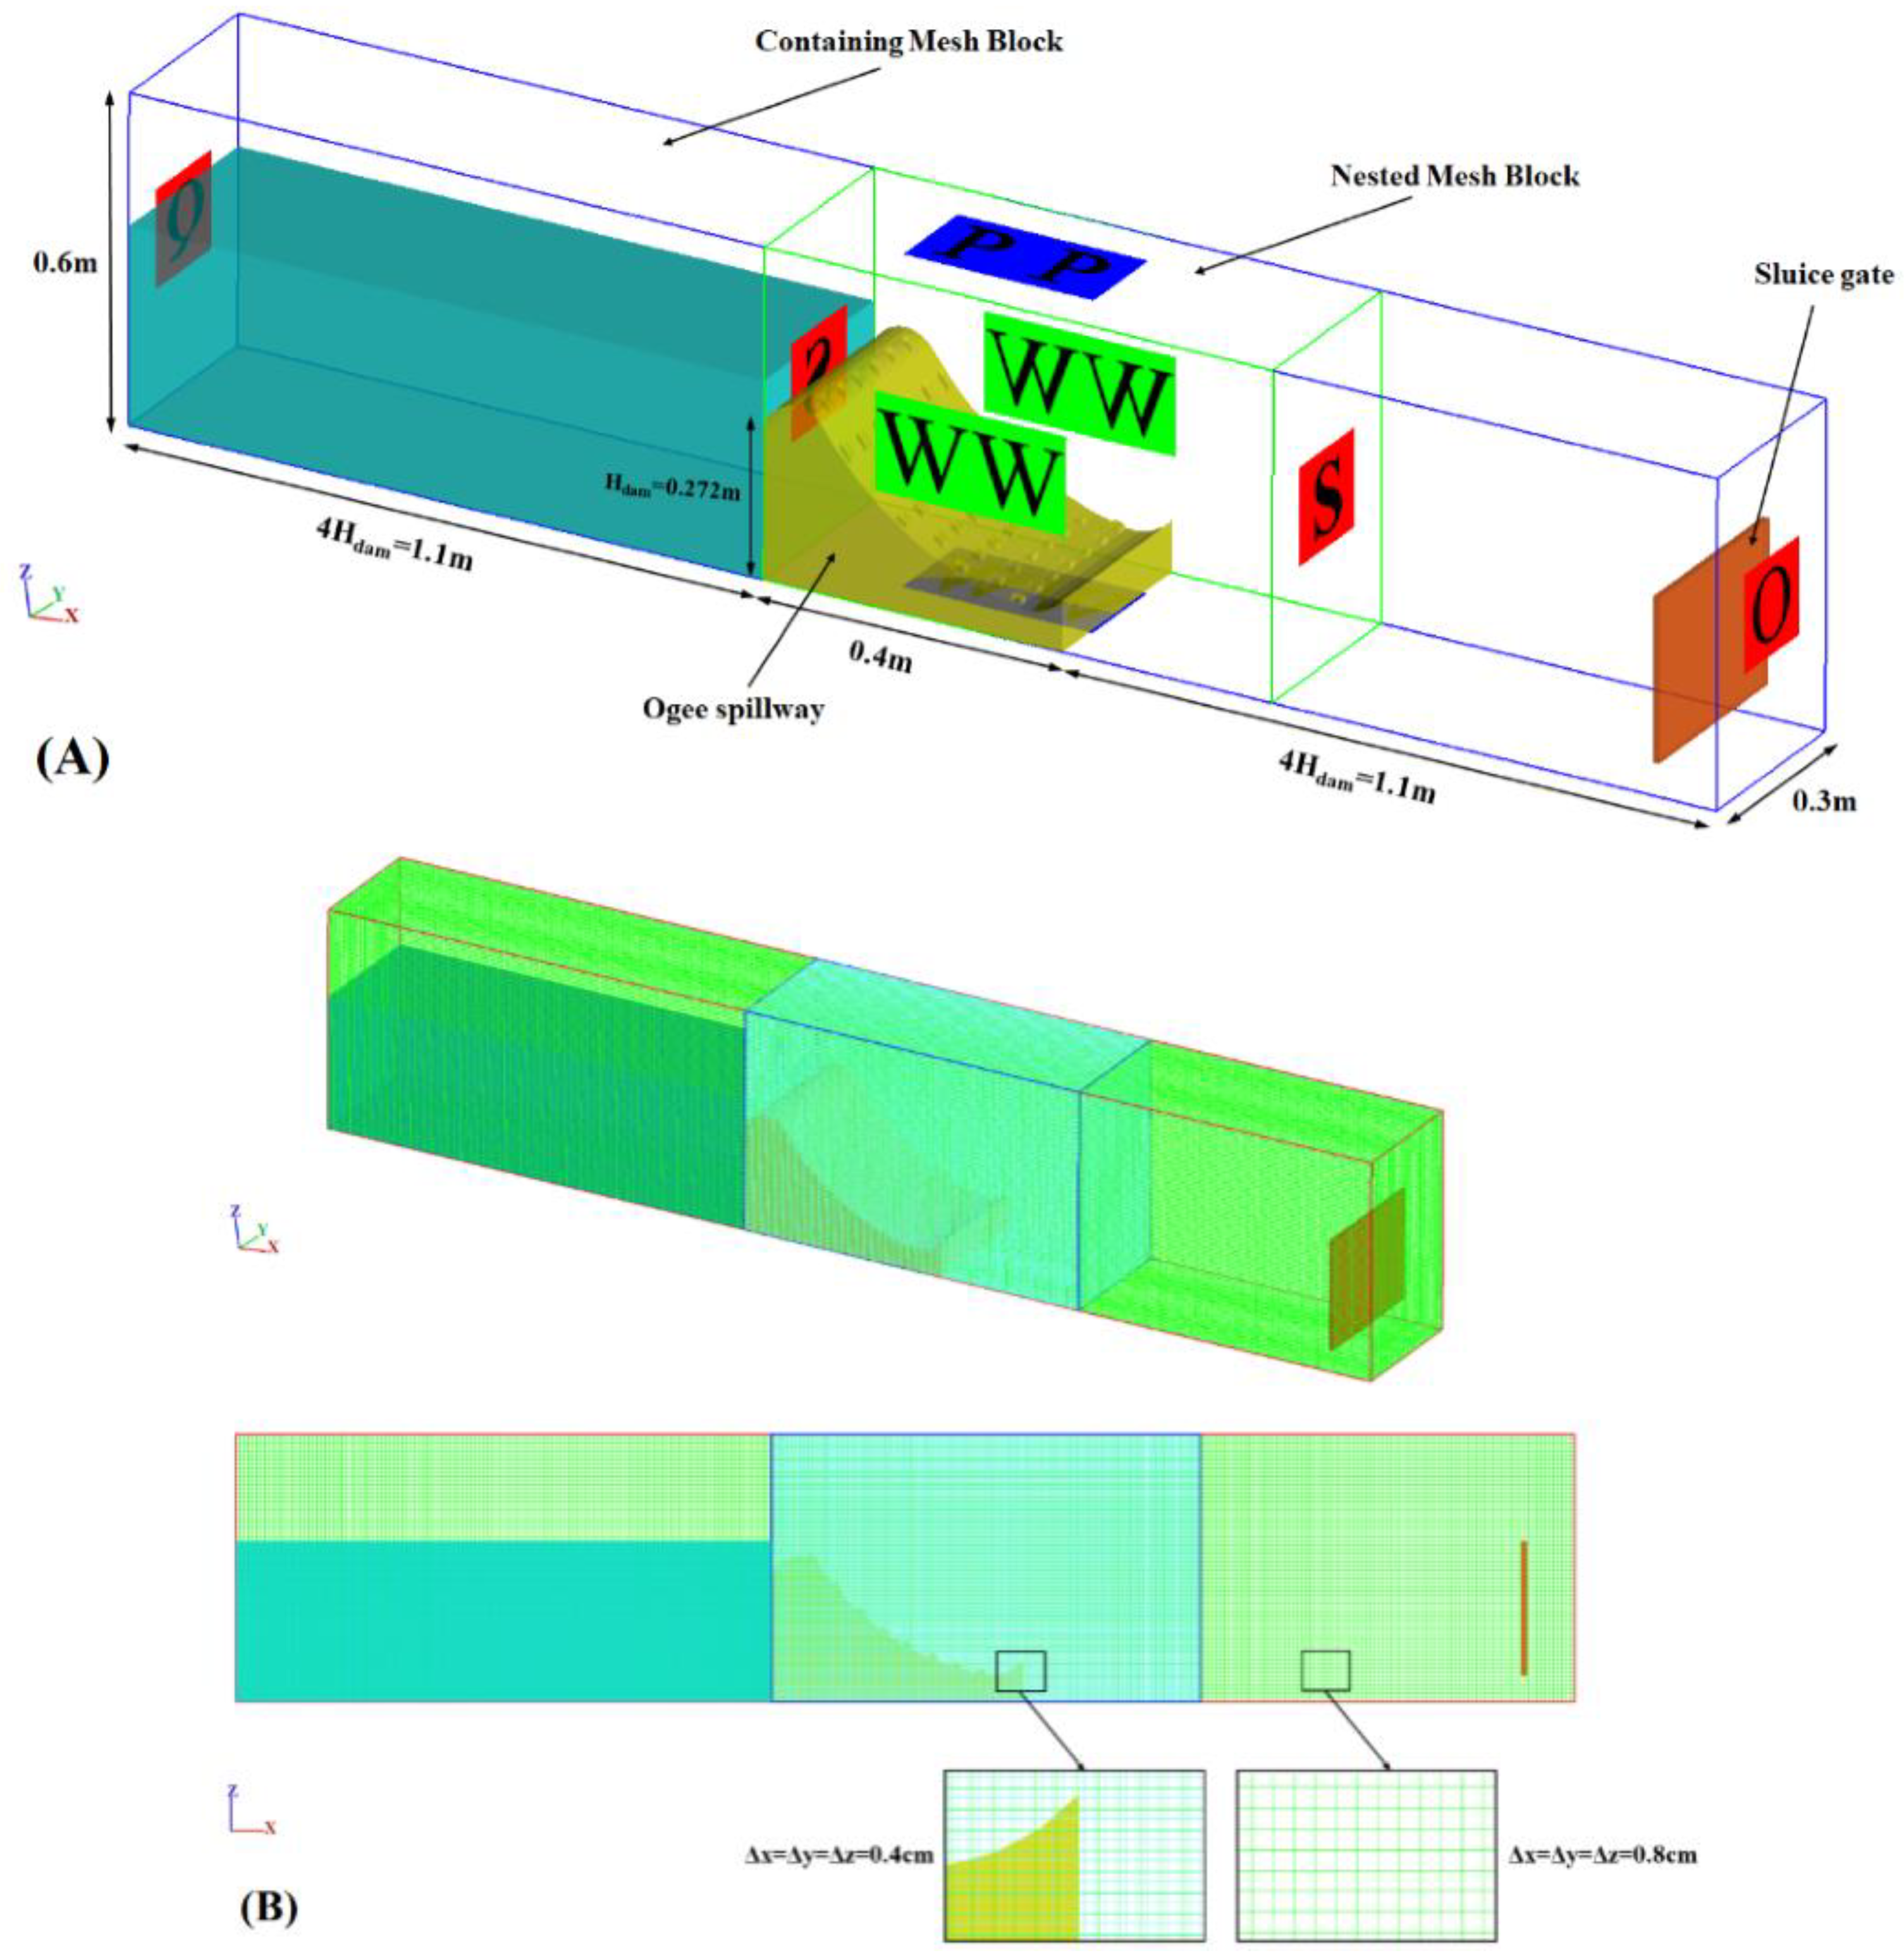
3.2. Numerical Domain
AutoCAD® software was used to build up the geometry of the models with a stereolithography (STL) file. According to the experiment conditions, the following boundary conditions were employed:
- inlet boundary condition was set as discharge flow rate (Q);
- outflow (O) boundary condition was used downstream (at a sufficiently far location to prevent boundary effects on the results);
- the bottom and side boundaries were treated as a rigid wall (W), and no-slip conditions were applied at the wall boundaries;
- an atmospheric boundary condition was set to the upper boundary of the channel, which allowed for the flow to enter and leave the domain; and
- symmetry boundary condition (S) was also used at the inner boundaries.
The distance between the ogee spillway and Xmin boundary was evaluated to be 4Hdam = 1.1 m. In fact, monitoring the water-surface variations at different stations upstream of the ogee spillway revealed that 1 m was sufficient for an undisturbed approach flow to be established. Figure 3A shows the computational domain of the present study and associated boundary conditions.
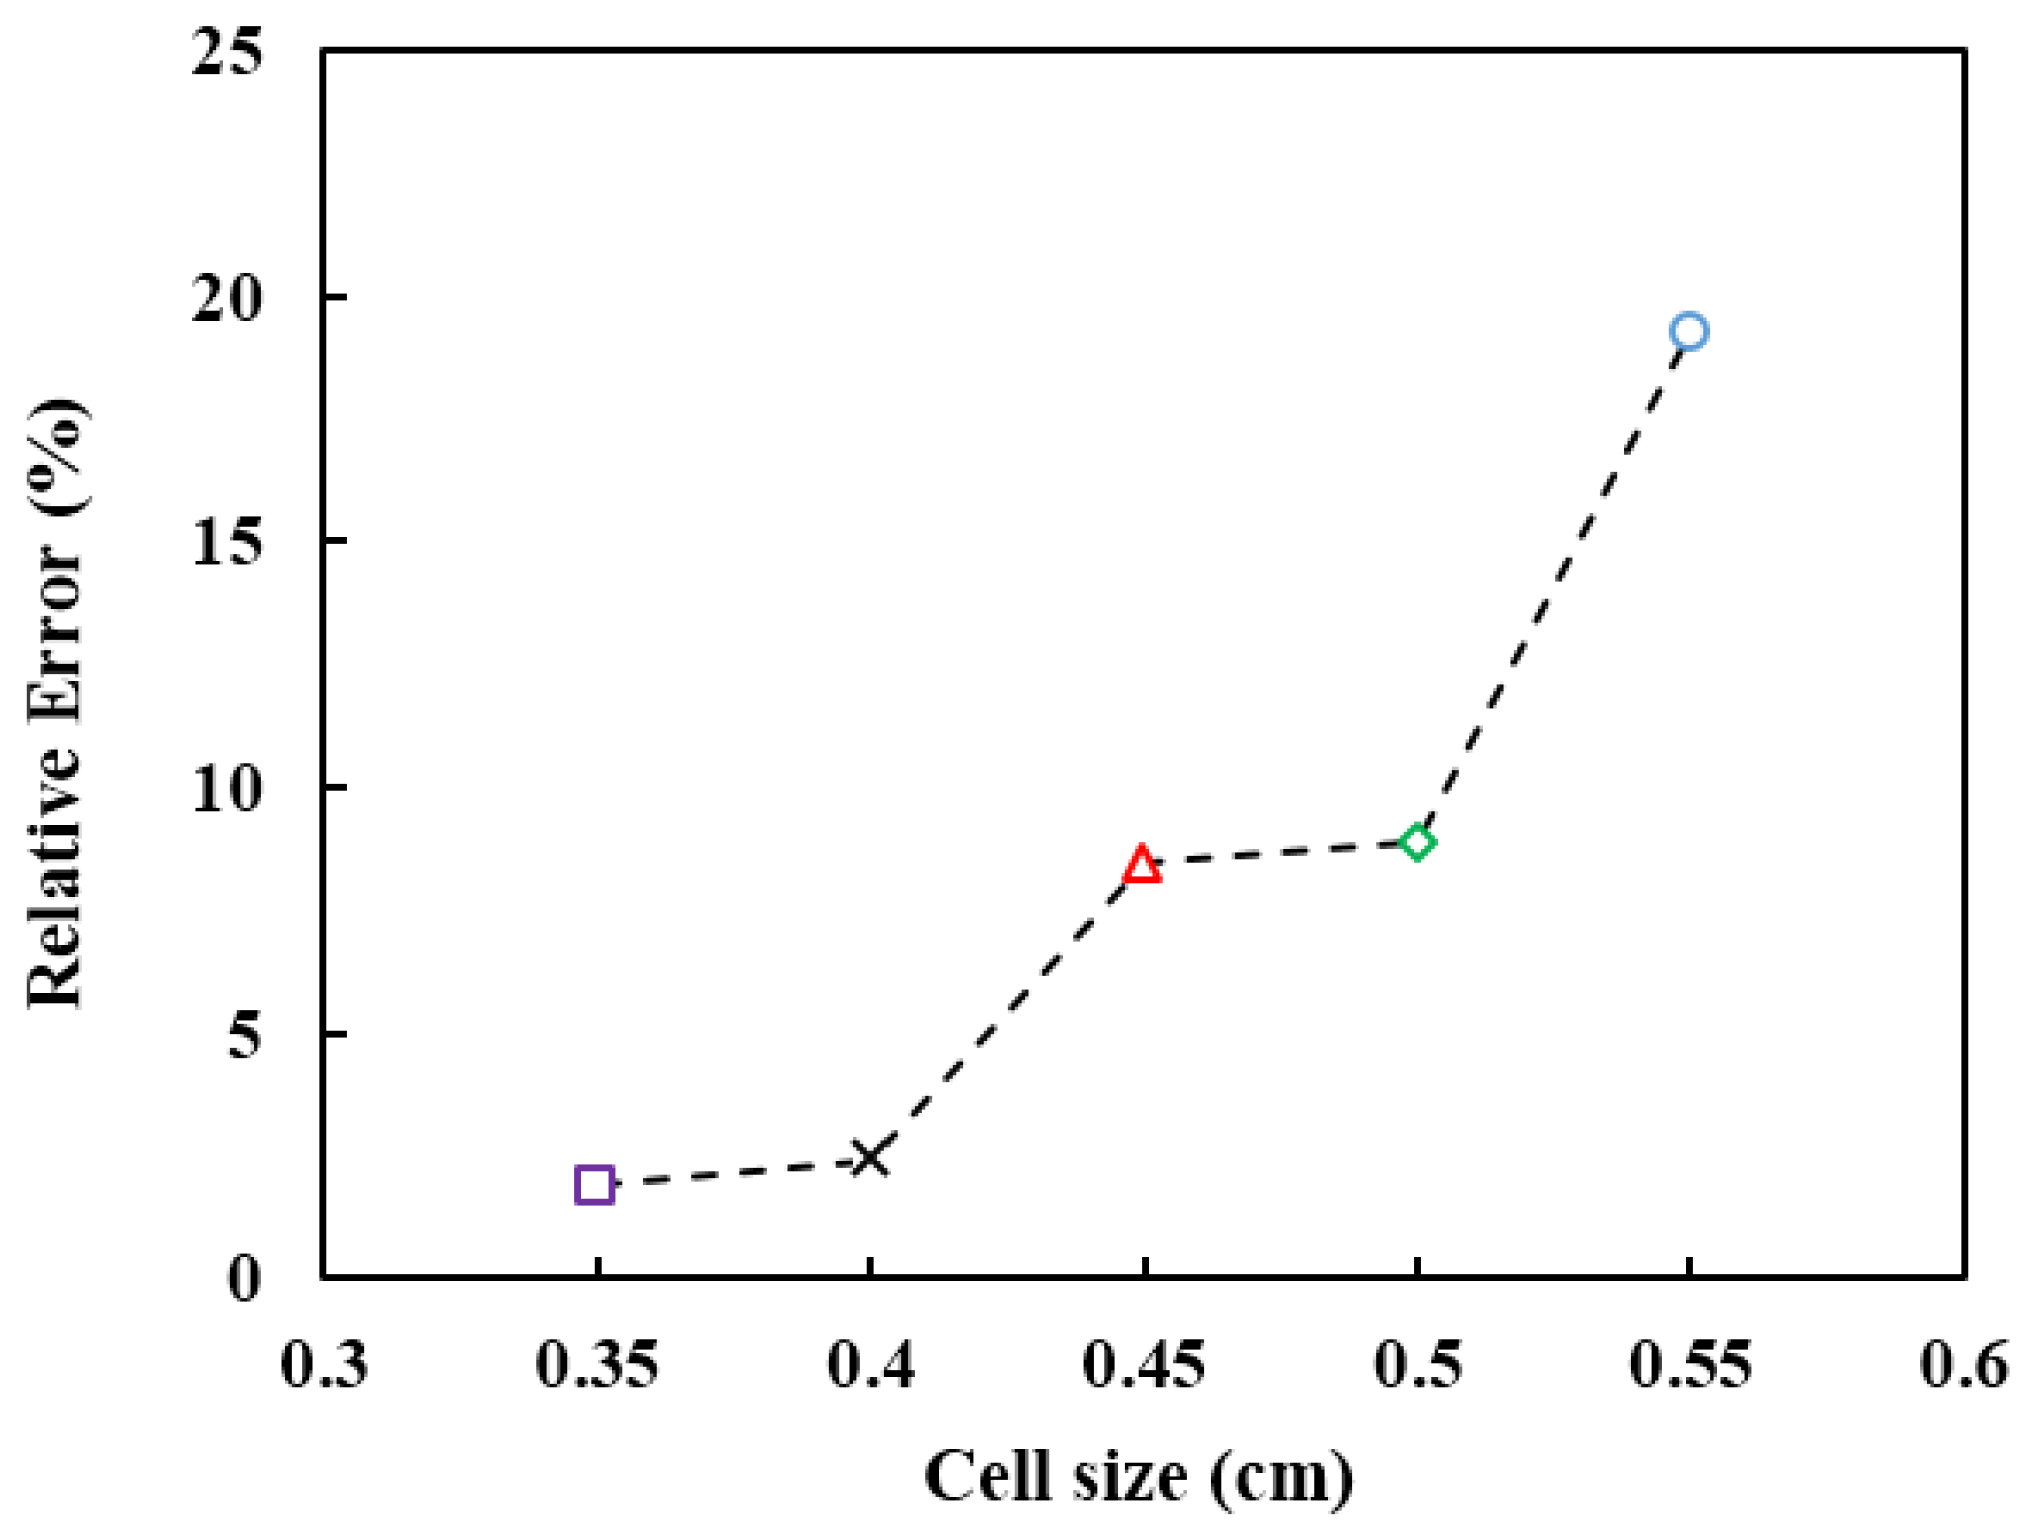
The spatial domain was meshed using a structured rectangular hexahedral mesh with two different mesh blocks (see Figure 3B). This technique, i.e., a nested mesh block, was adopted from previous studies [34,37] Numerical results were obtained for five different mesh sizes (T1, T2, T3, T4, and T5) for improved computational results and subsequent validation.
4. Results
4.1. Verification of Numerical Model and Laboratory Results
Recently, numerical approaches using computational fluid dynamics (CFD) were also successfully validated to simulate complex hydraulic phenomena [26,38,39,40,41,42,43]. It is compulsory to quantify uncertainty for a given confidence level, experimental validation, and uncertainty analysis for engineers [44,45]. The time step is calculated using a criterion similar to the Courant number, controlling stability and convergence during the iterations. These time steps were between 0.001 and 0.0013 s. Evolution in time was used as relaxation to the final steady state.
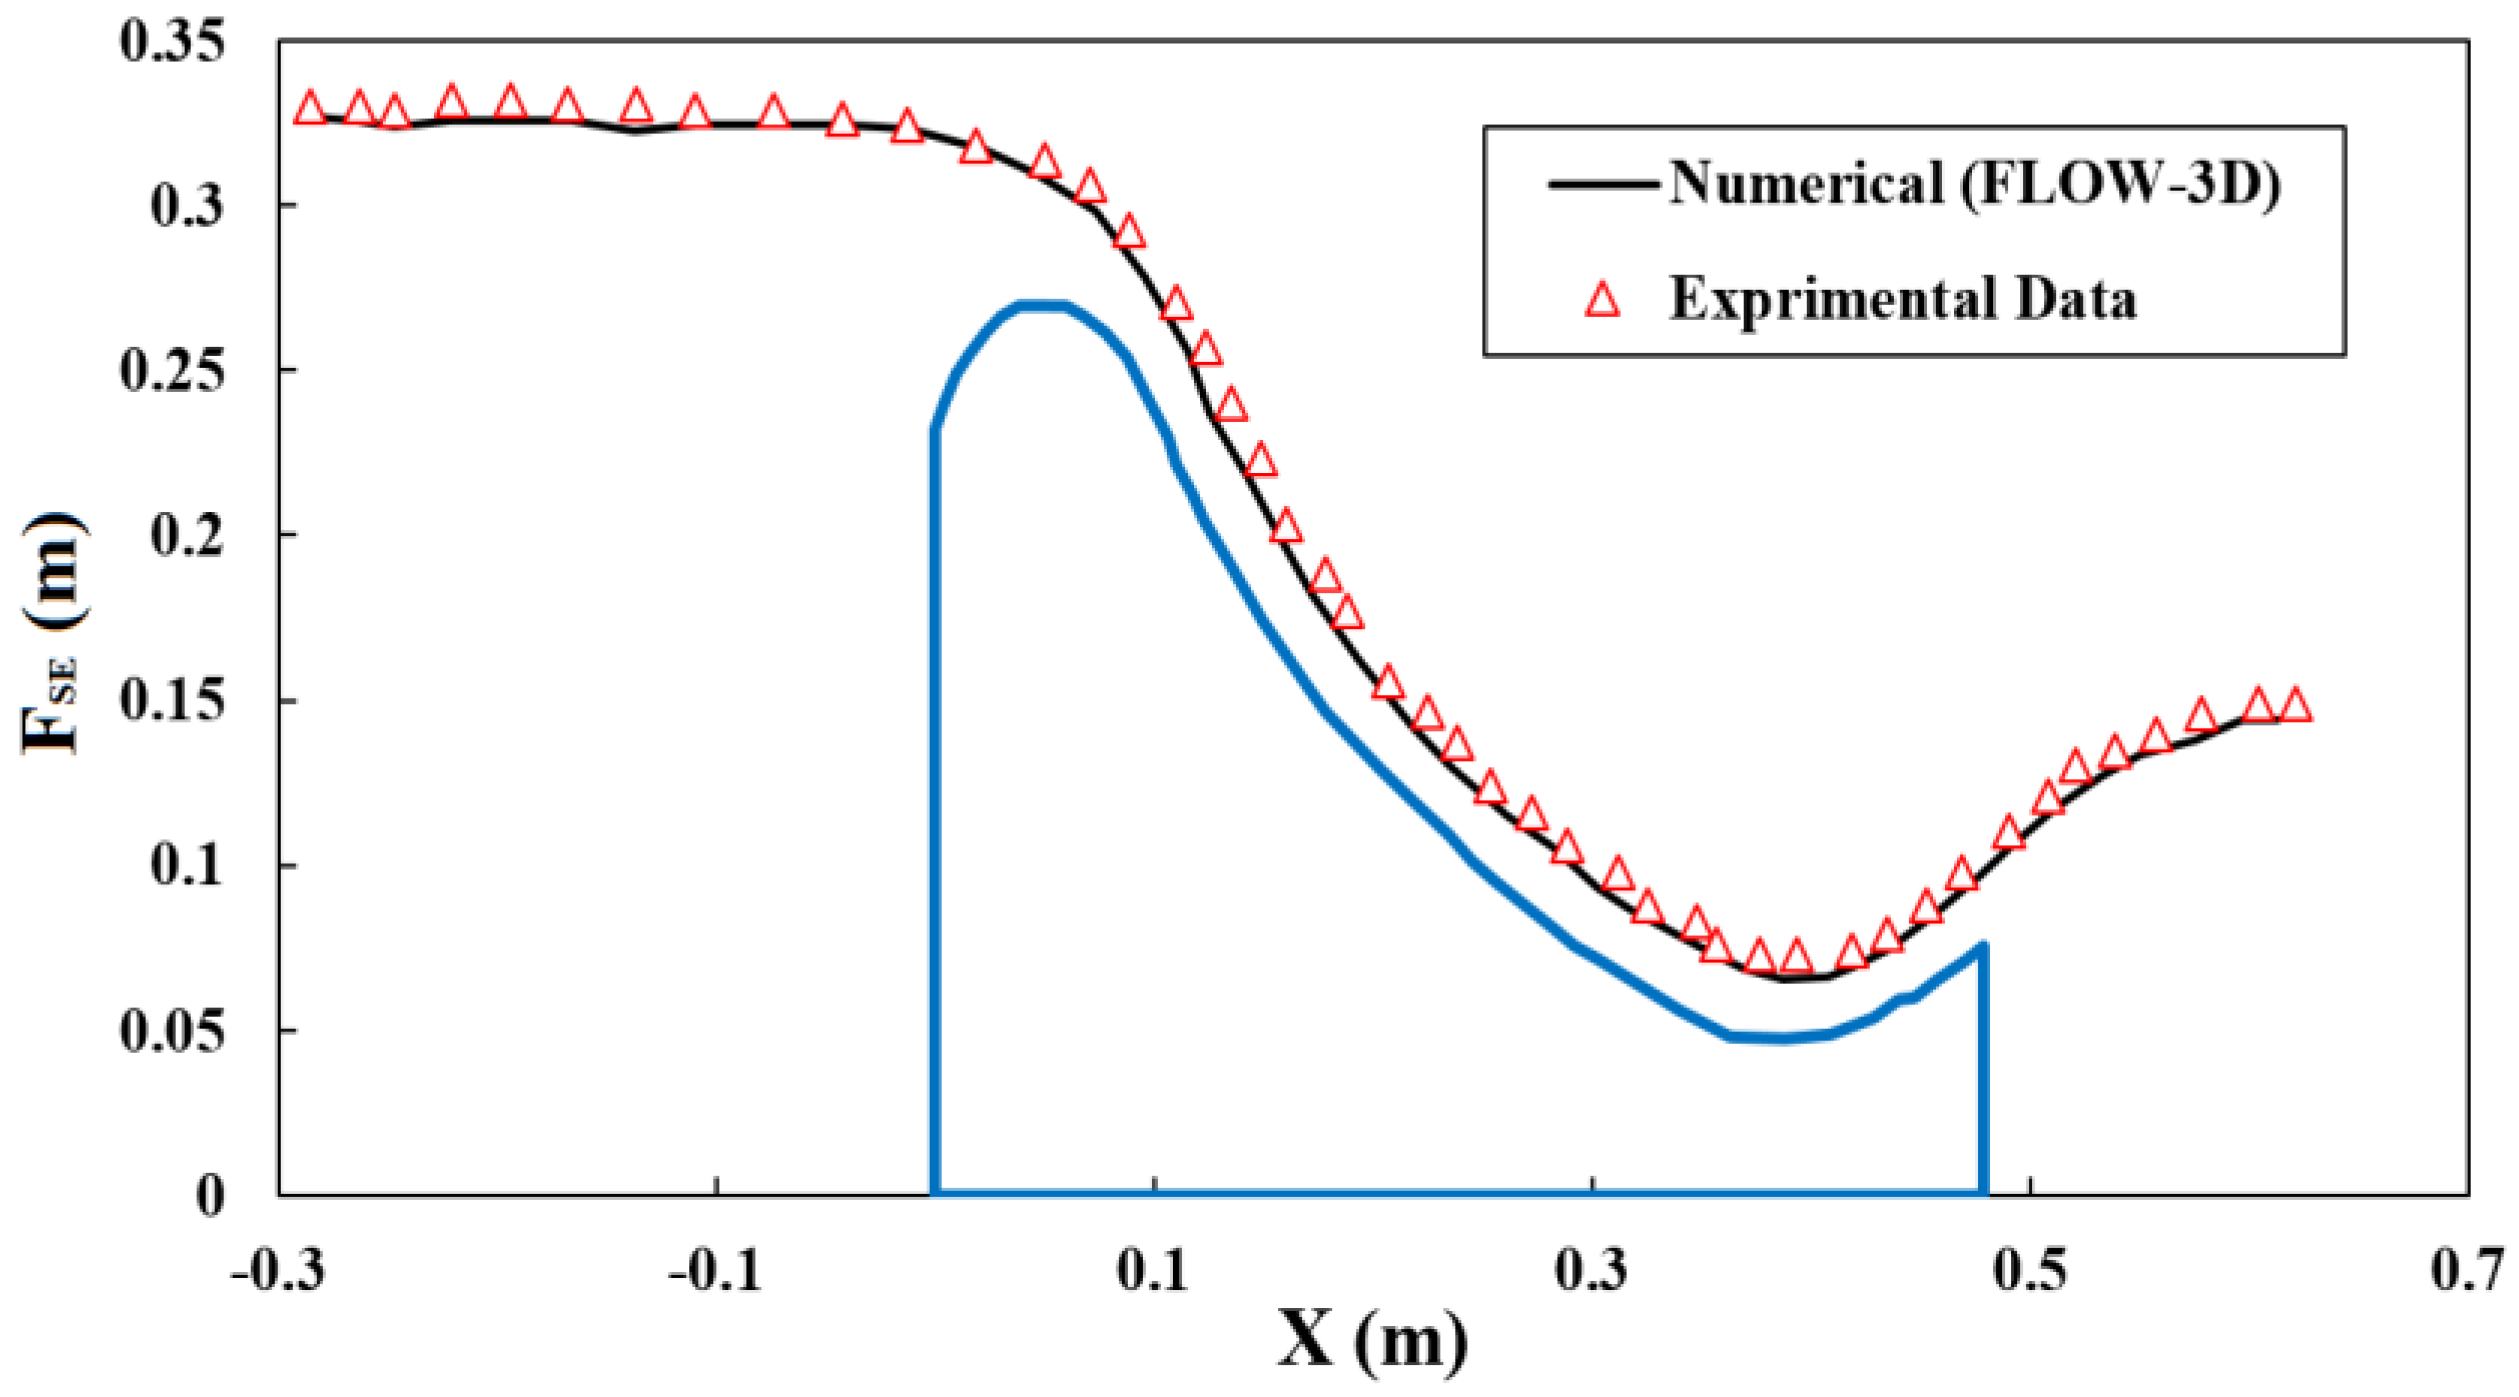
After the numerical simulation of steady-state flow over the ogee spillway had been completed, to validate the model, a comparison was performed between calculations and experimental results. The error between data obtained from FLOW-3D® and experimental data were calculated according to Equation (14):
where E(%) is the relative error percentage, FSE(Exp) is the experimental free-surface elevation, and FSE(Num) is the numerical counterpart. Figure 5 and Table 3 show free-surface profiles and errors. Good agreement was found between numerical and experimental data, and both of them represent a similar trend. The maximal difference between the data was related to X = 0.25 m and is equal to ~7%, and the overall mean values of the relative errors was ~2%, which confirmed the ability of the numerical model to predict flow specifications over the ogee spillway. A summary of the overall mean values of the relative errors generated for other discharges is shown in Table 4.
4.2. Flow Pattern Downstream of Ogee Spillway with Block Bed and Different Buckets
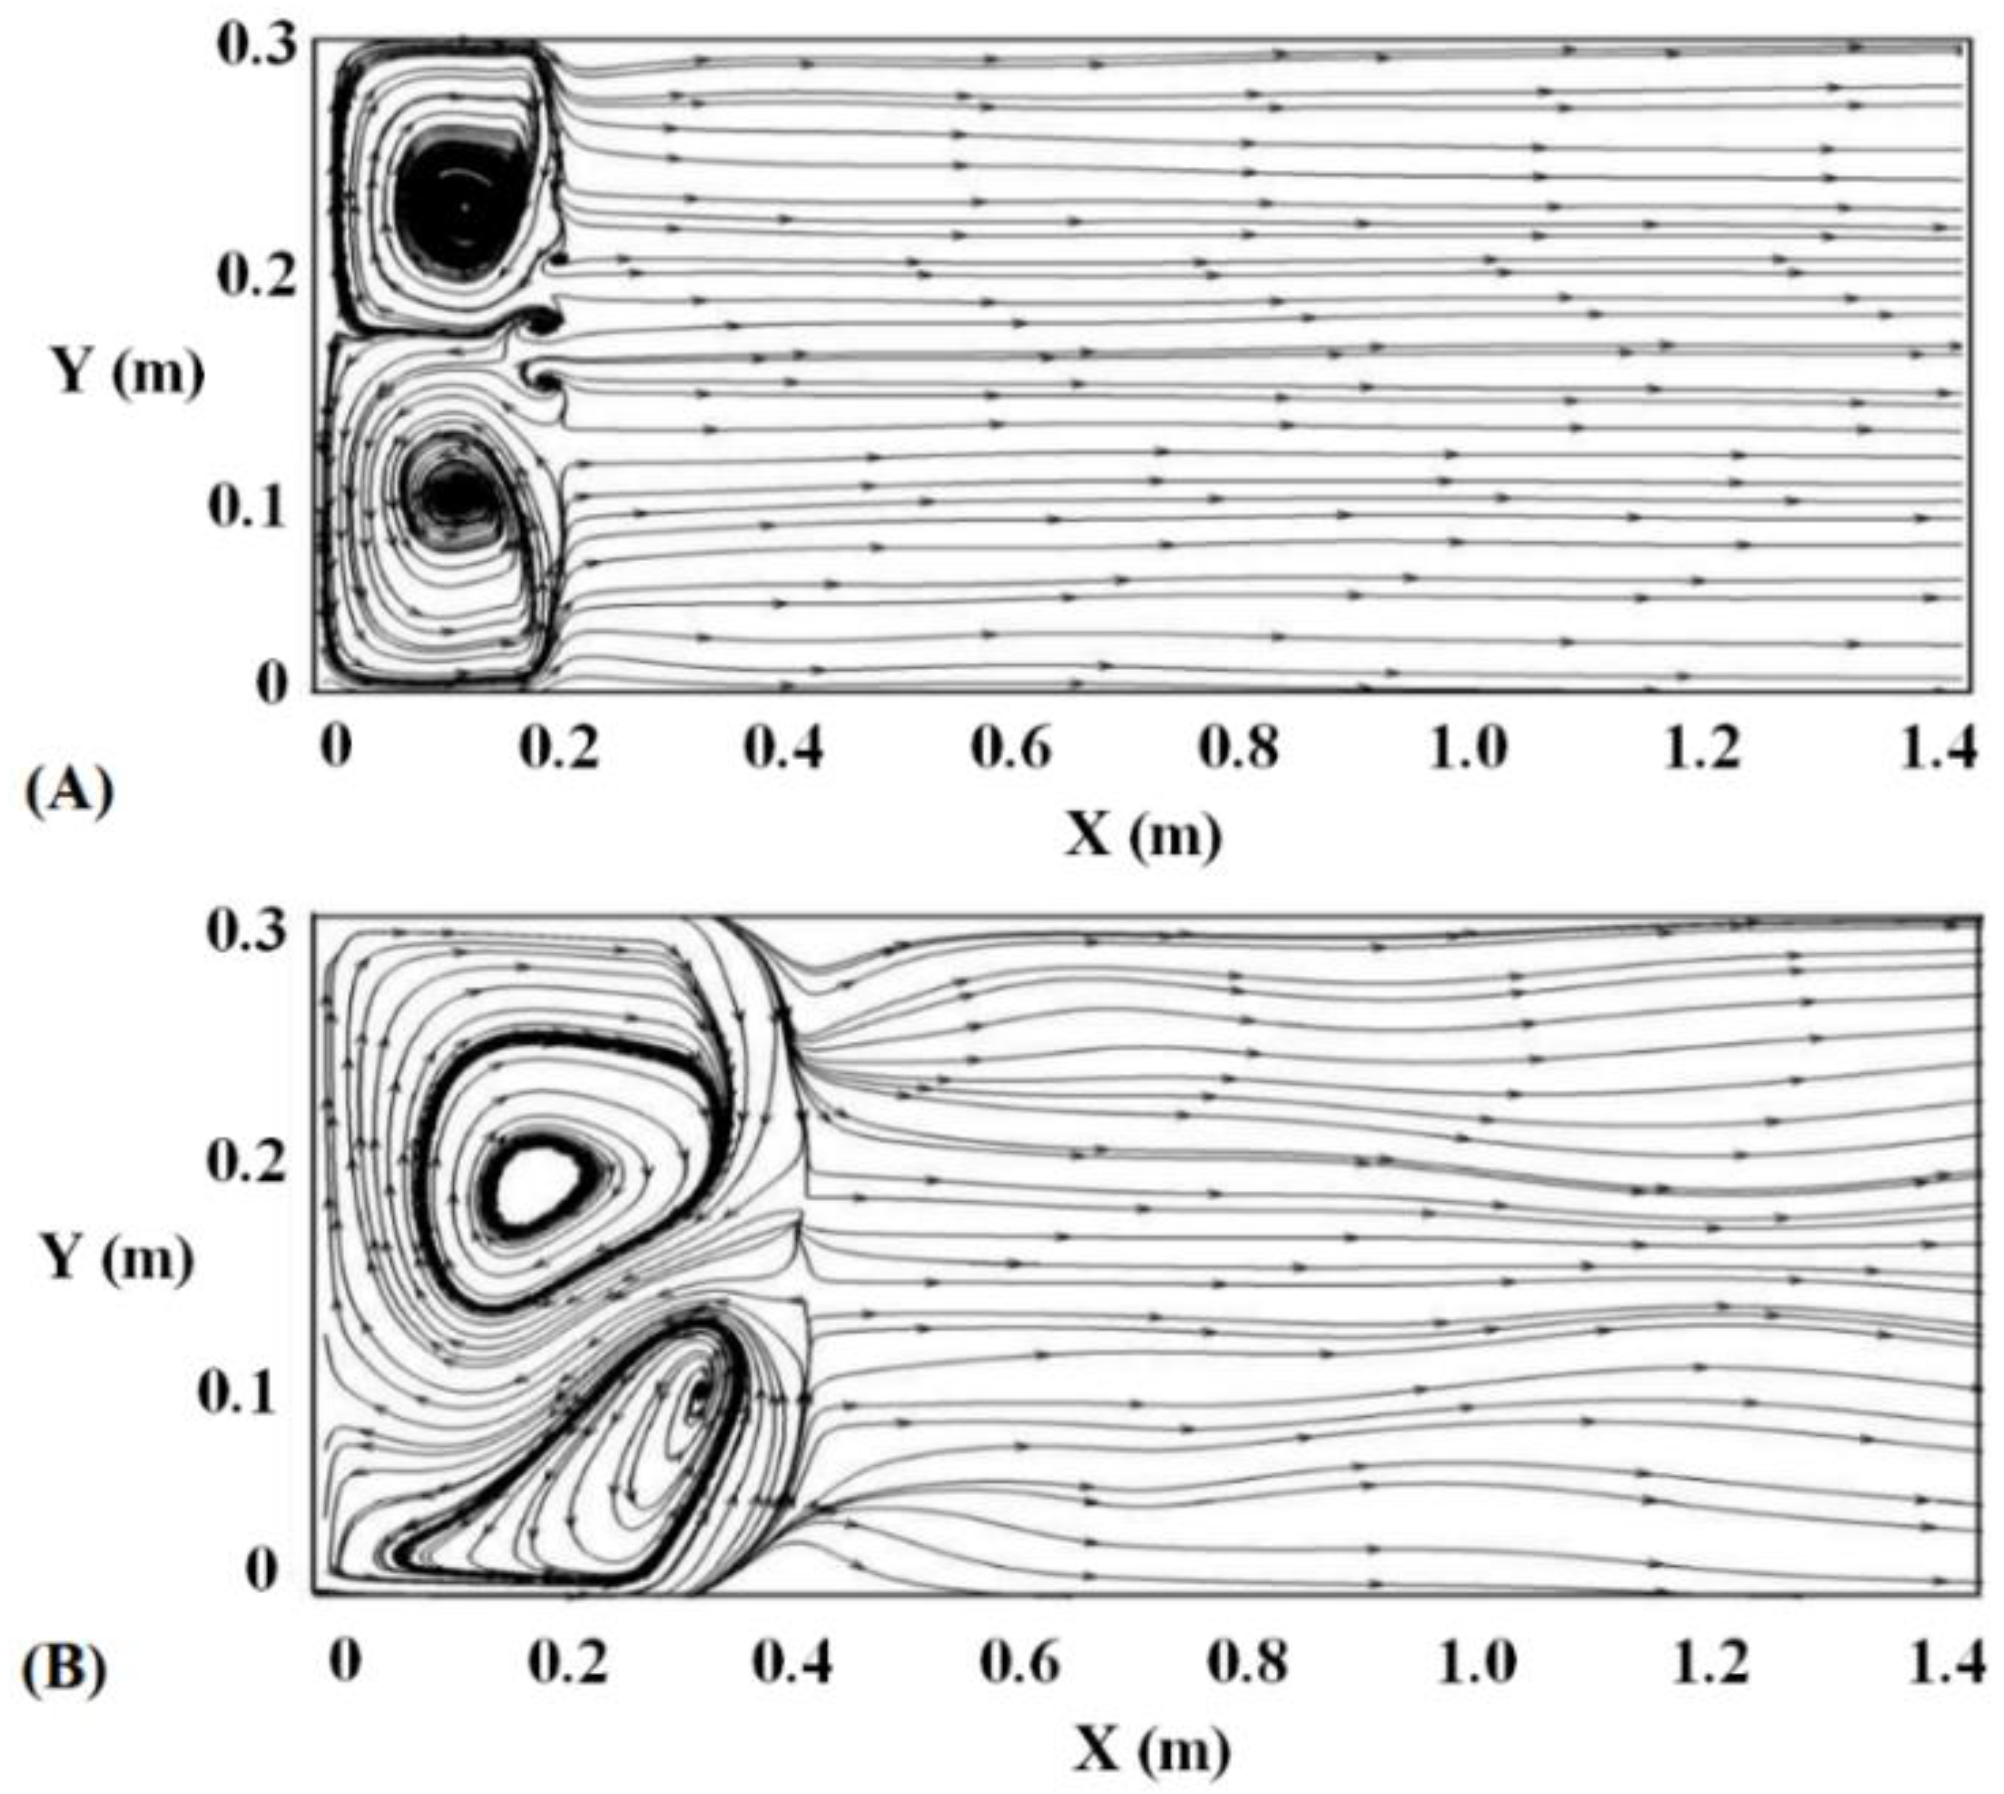
Figure 6 shows streamlines on the x–y plane in the main channel (m/s) for three conditions: without buckets (A), with θ = 32° buckets (B), and with θ = 52° buckets (C).
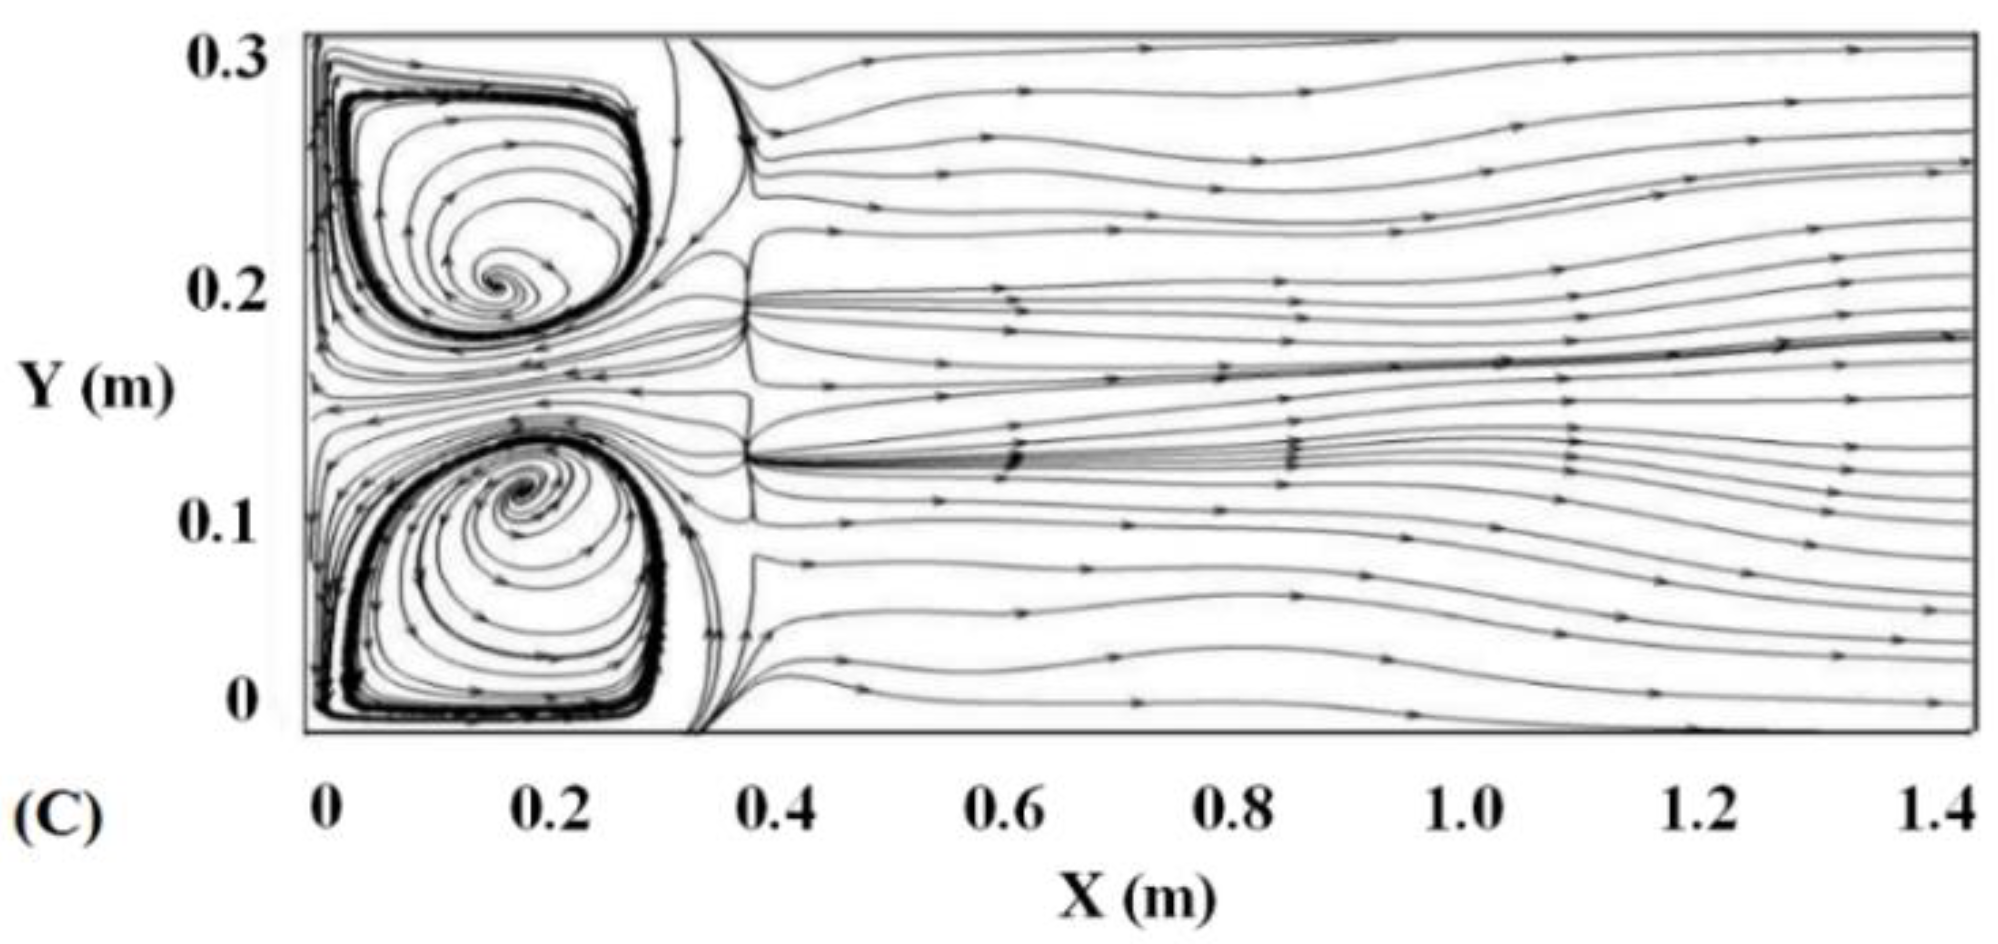
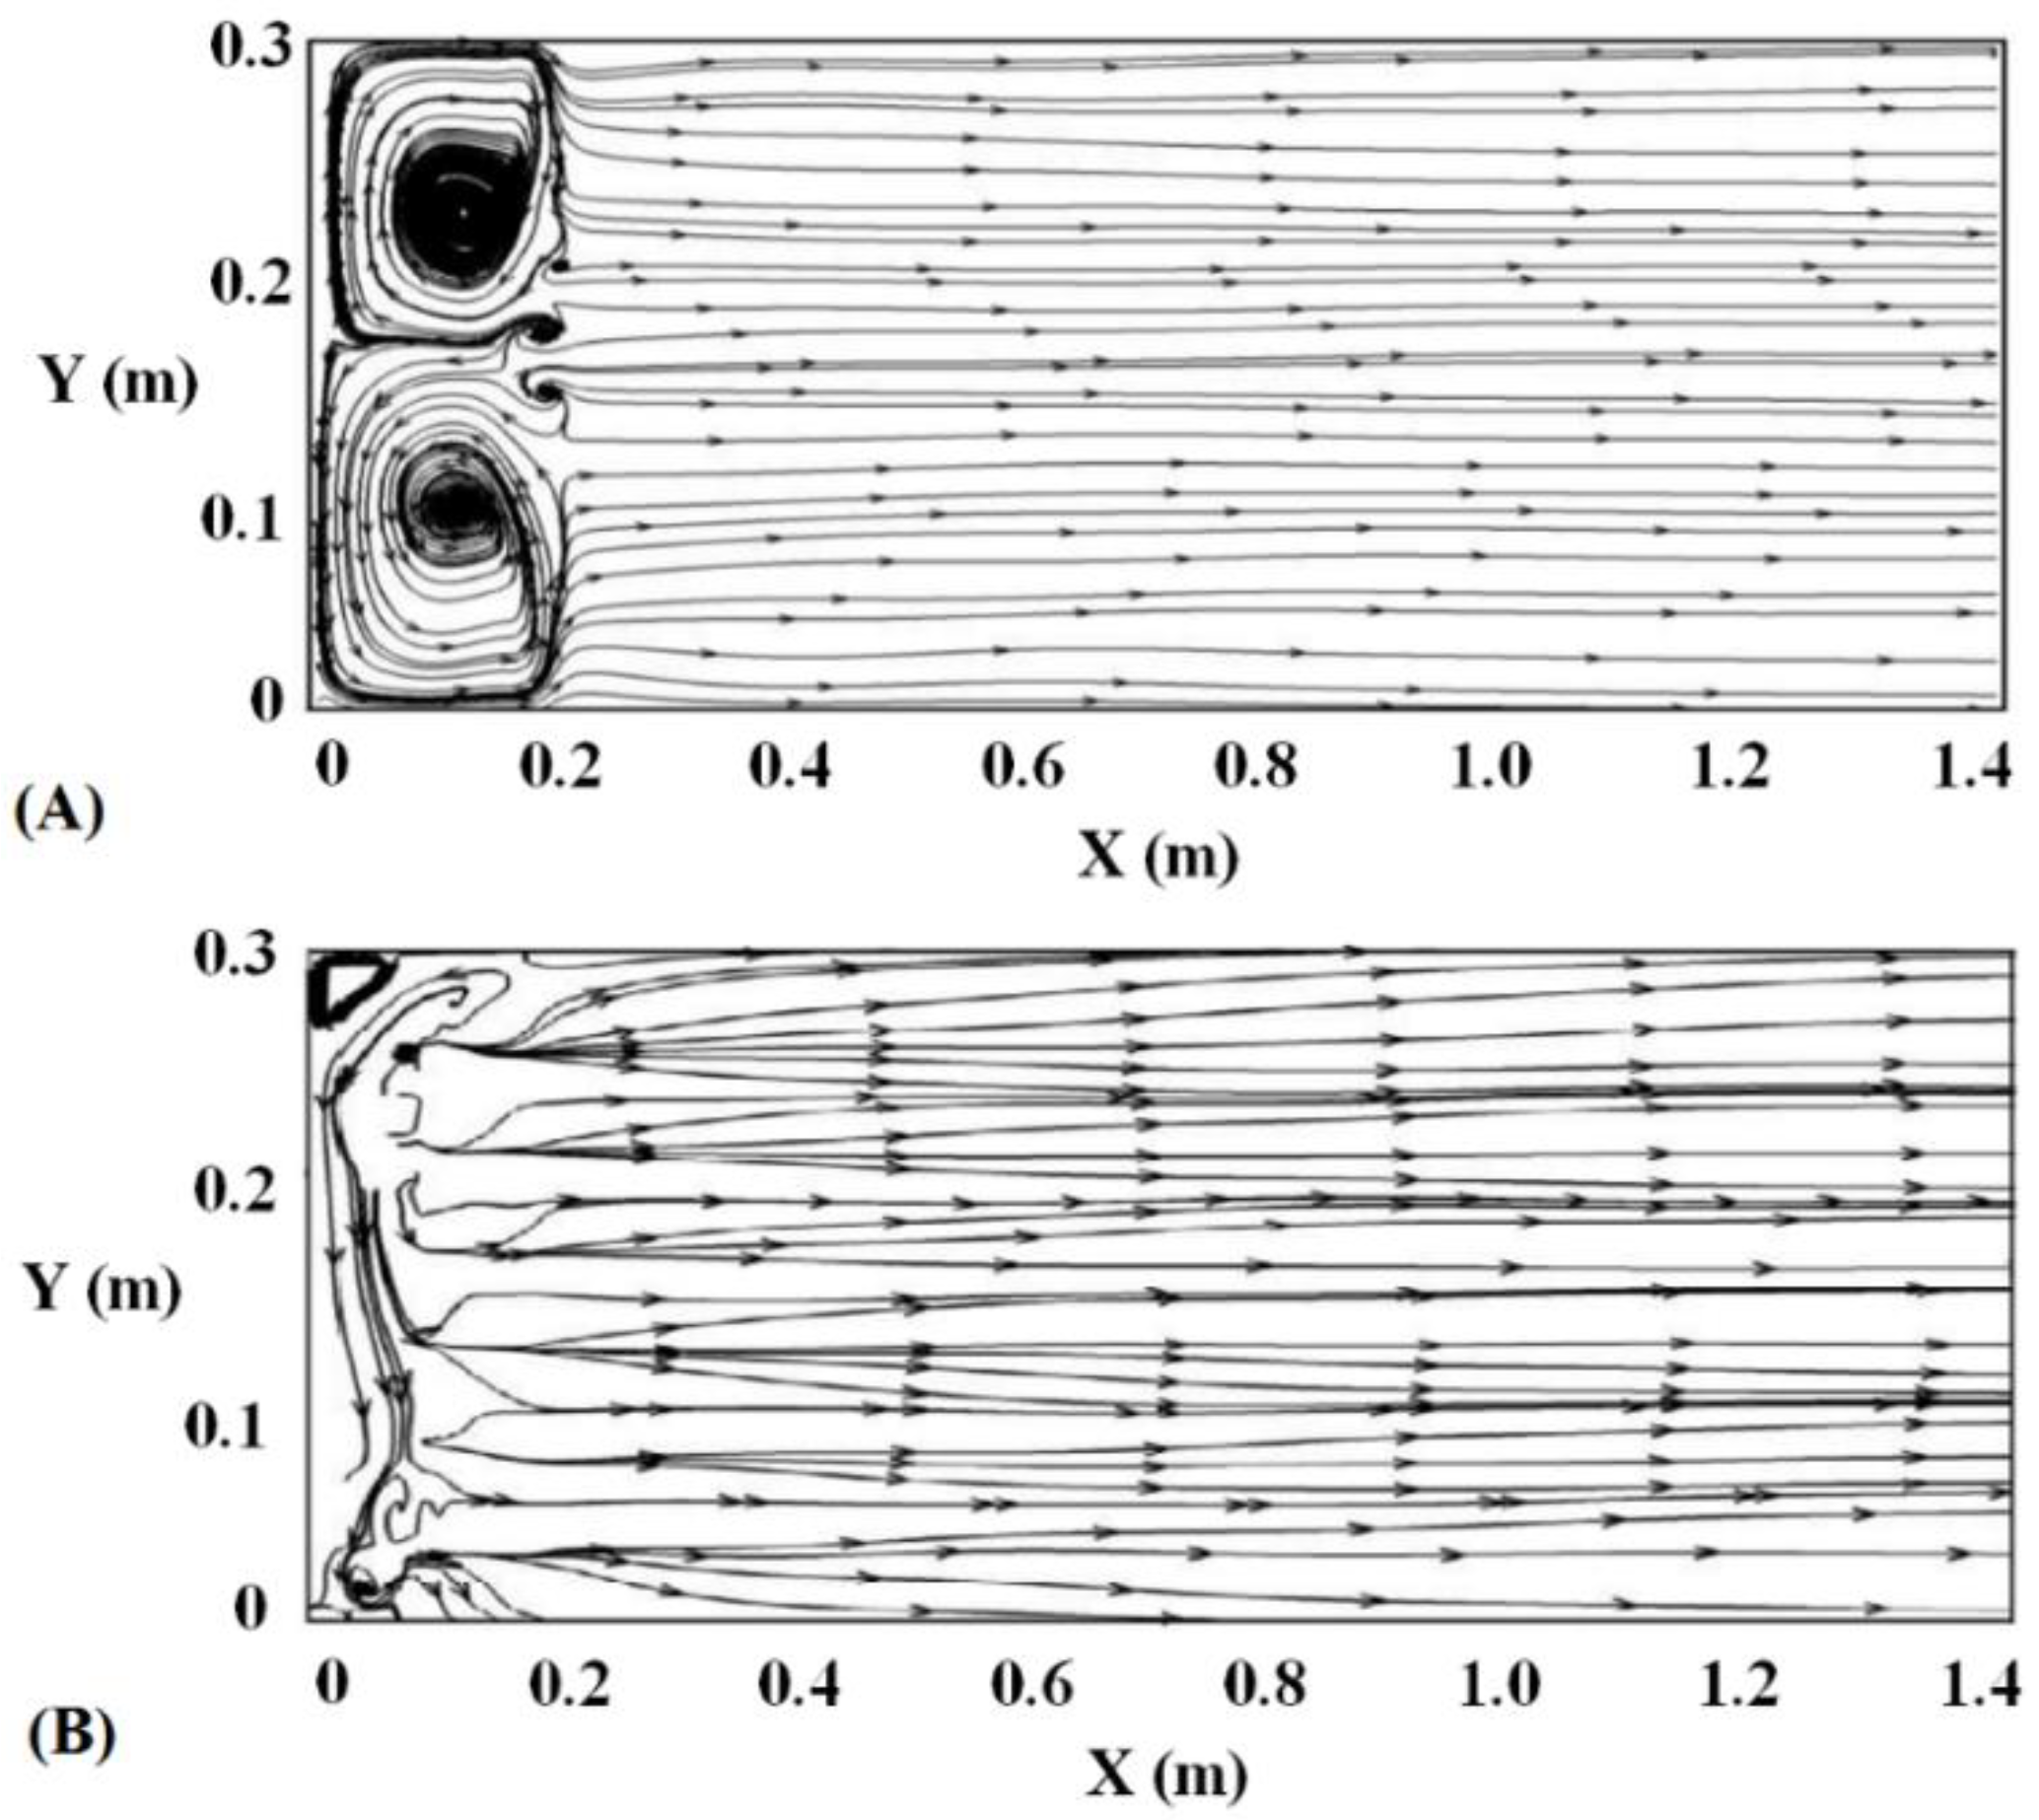
The secondary current area, downstream of the chute in the “without bucket” scenario, was smaller than the ones in the “with flip bucket” scenarios for different take-off angles. In the flip bucket with θ = 32° an asymmetric secondary current was formed with a larger area; in the 52° one, it returned to the symmetry state in the plan. According to Figure 7, with the block on the chute of the ogee spillway, the area of the secondary vortices decreased, and the area of the secondary vortices disappeared.
4.3. Energy Dissipation in Ogee Spillway with Block Bed and Different Buckets
To investigate the effect of the block in the ogee-spillway bed on relative energy dissipation, experiments and simulation were performed at various Froude numbers for a flip bucket with take-off angles of 32 and 52 degrees (smooth and blocked), and without a bucket for the substrate (smooth and rough). Table 5 shows the relative values of energy dissipation for the smooth and blocked beds from the FLOW-3D results.
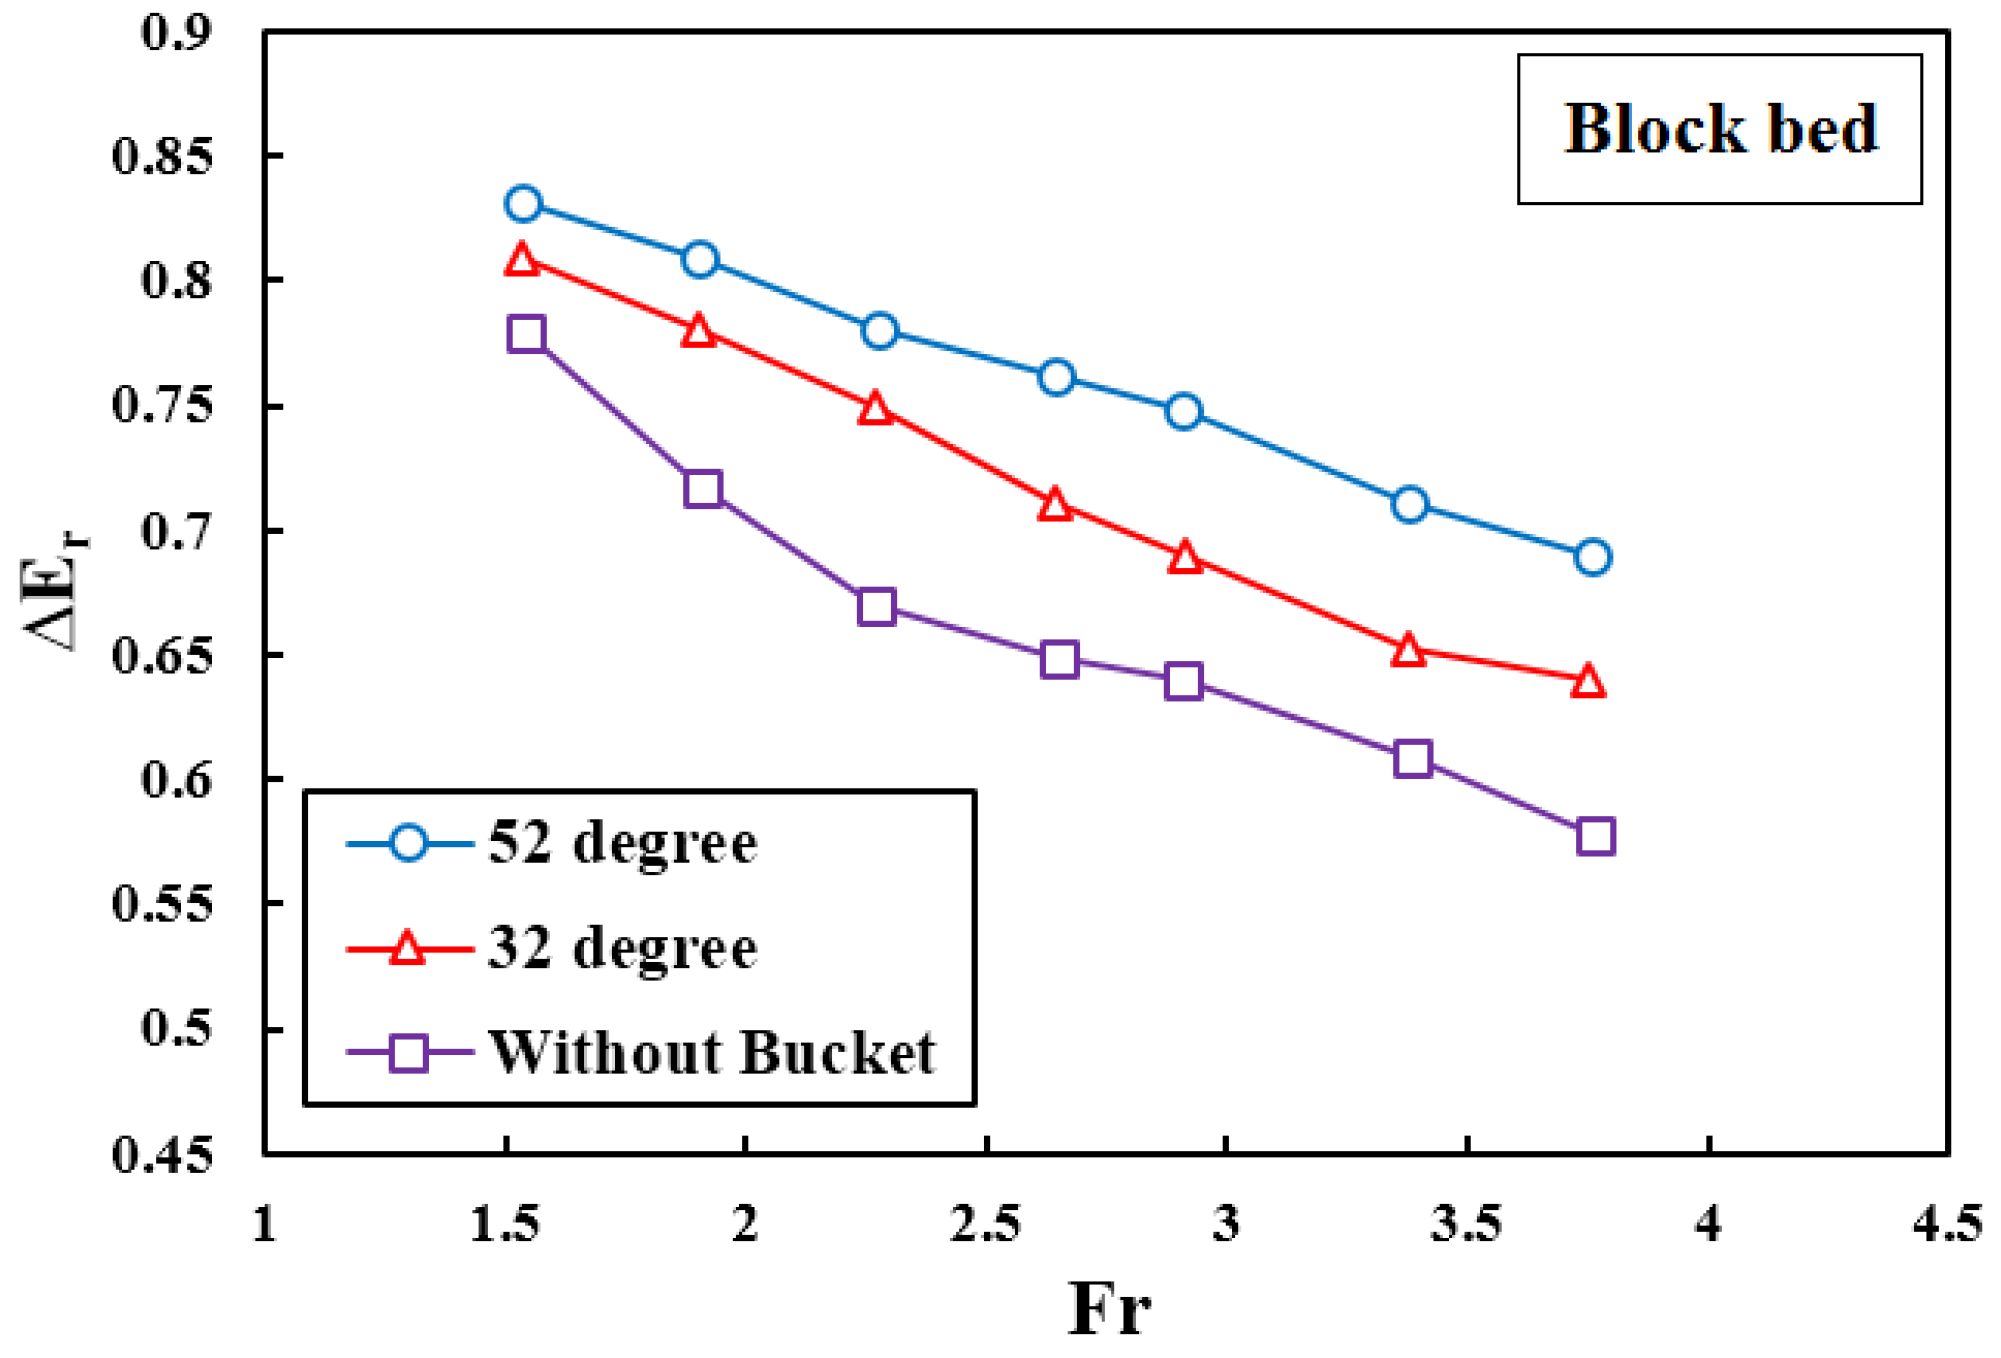
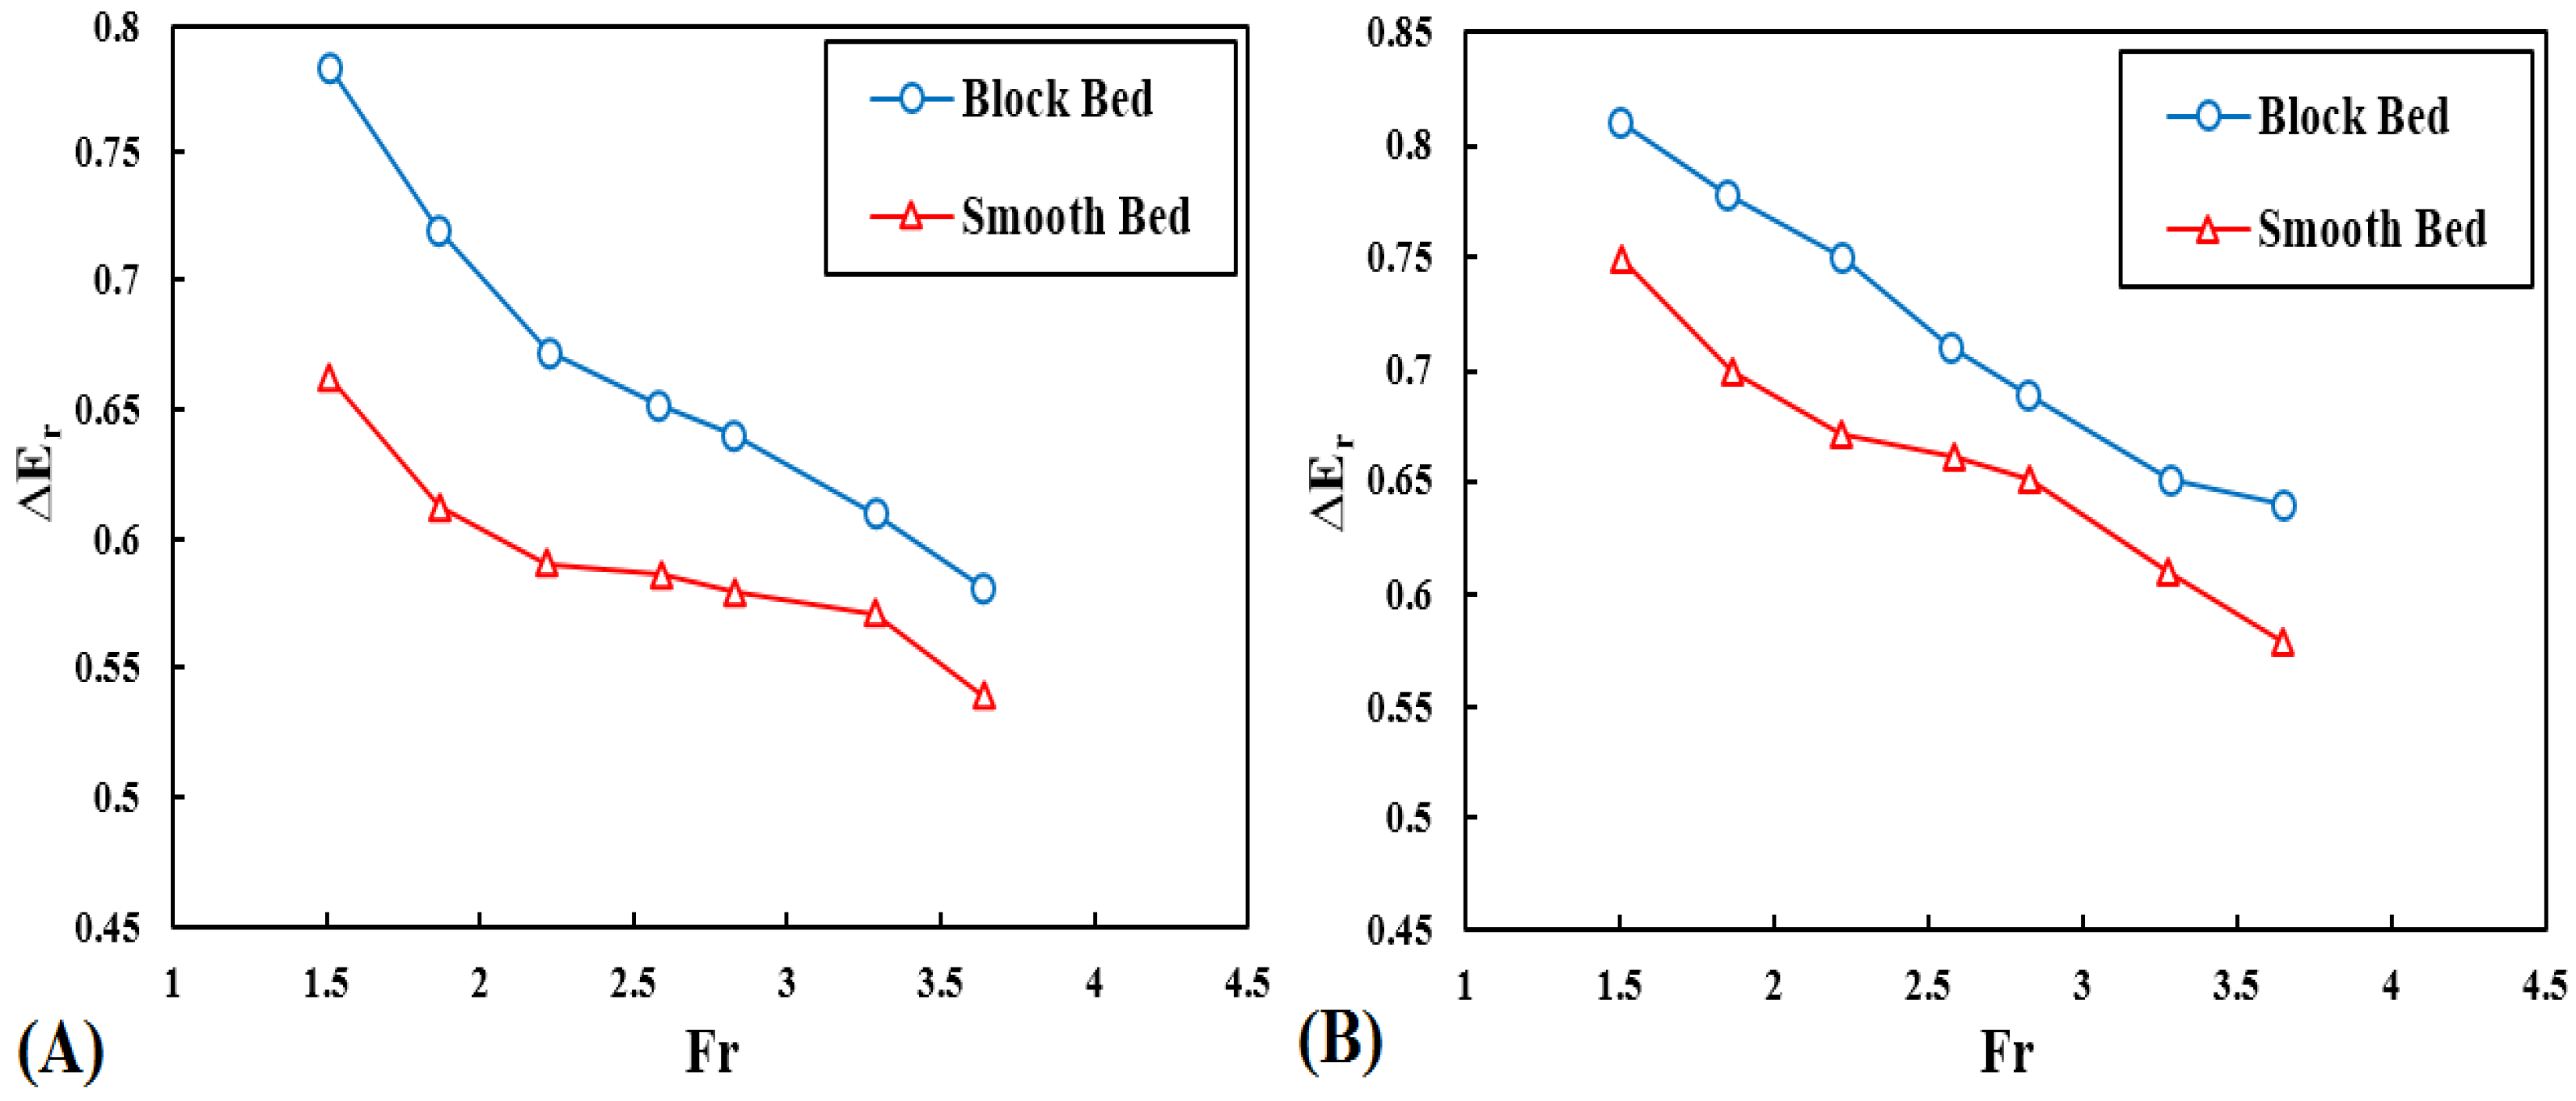
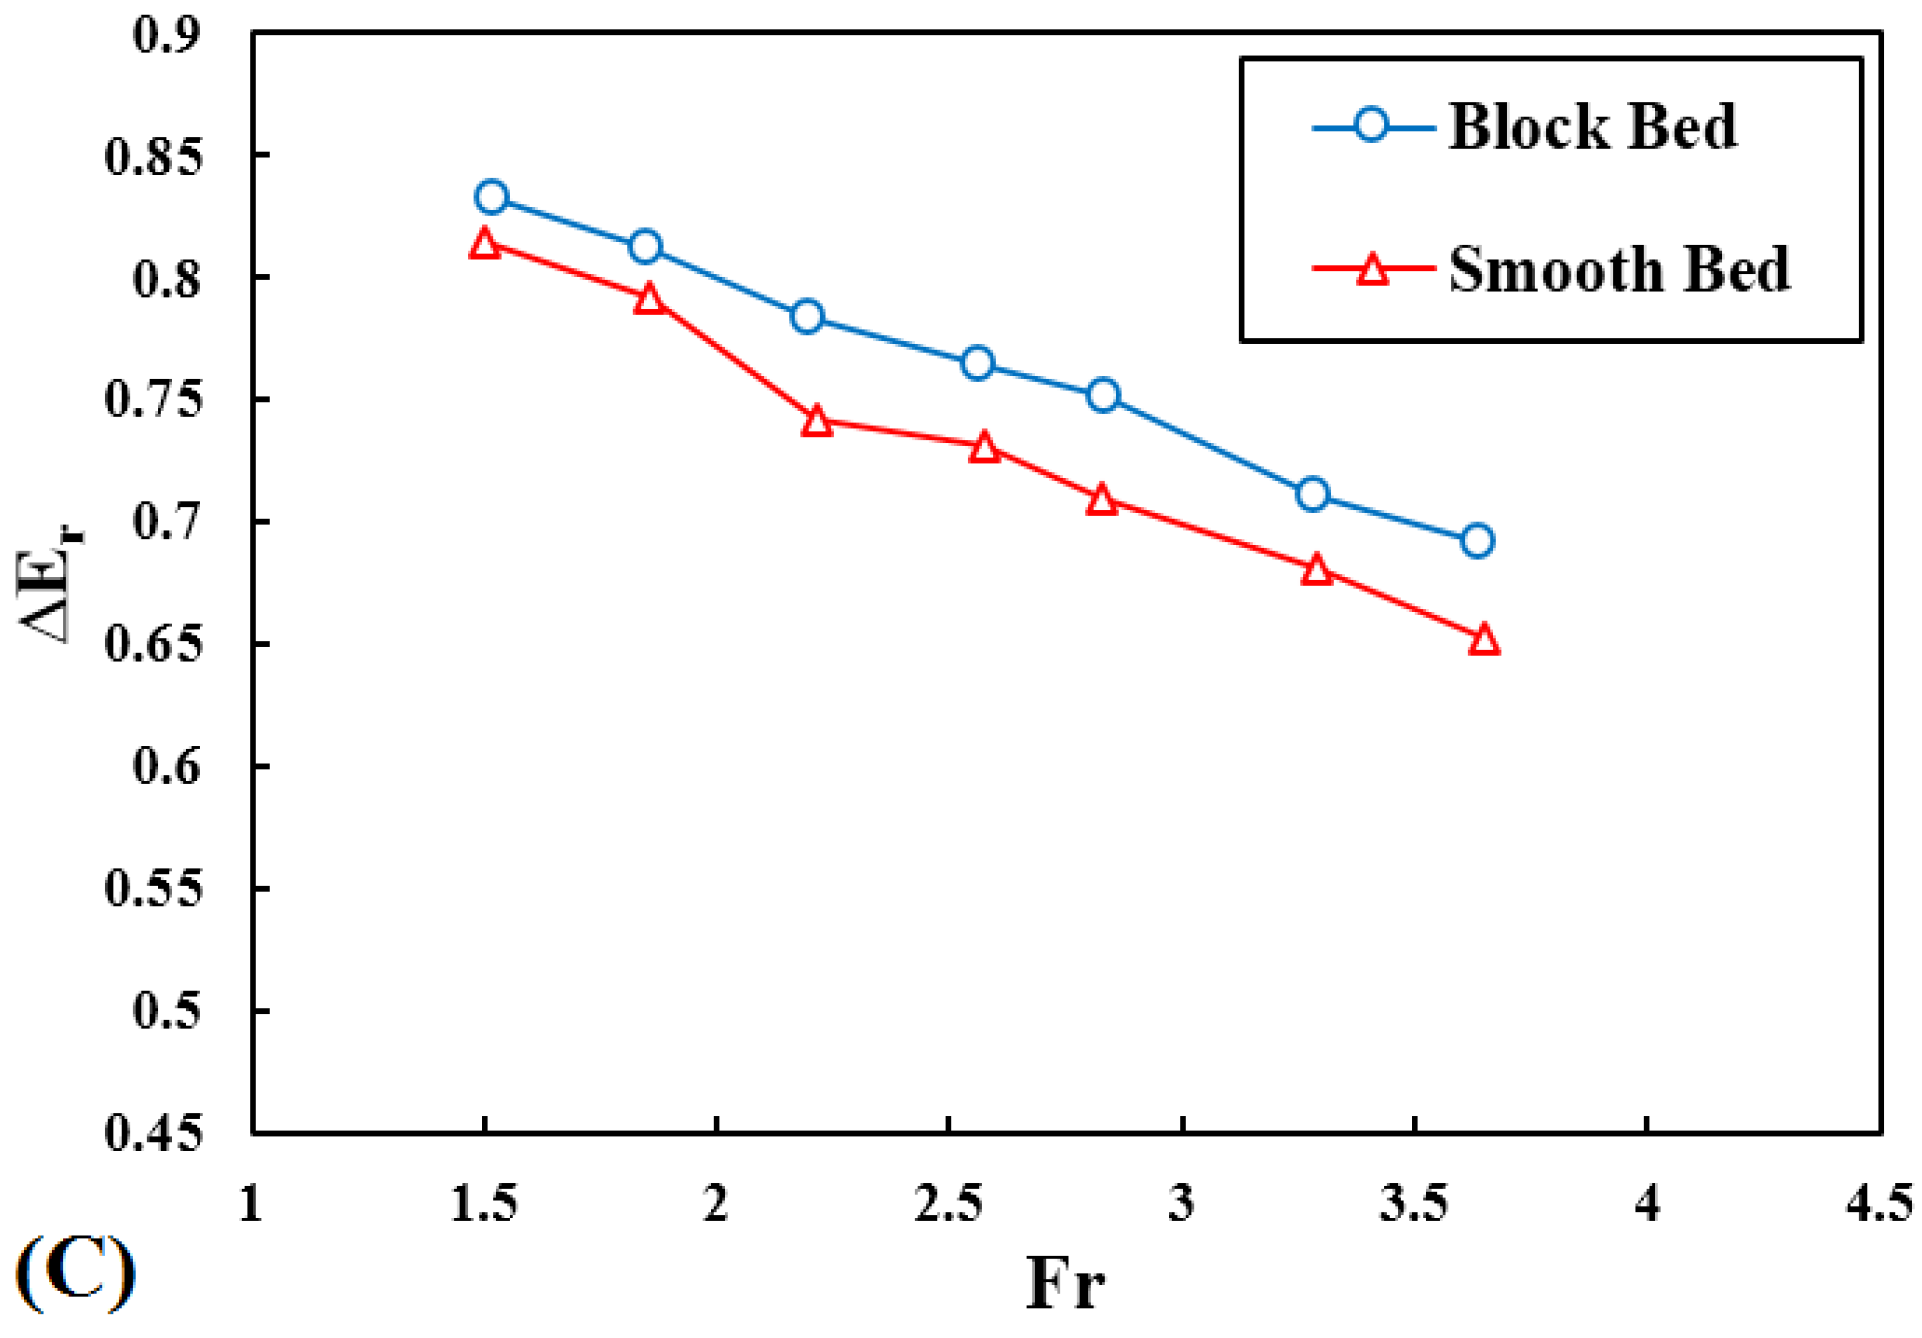
The difference in the relative percentage of energy dissipation in the two previous states (smooth and blocked) was in the range of 6.8—15.4% for the ogee spillway without a bucket, and in the range of 7.4—9.37% for the ogee spillway with a flip bucket with a take-off angle of 32 degrees. For a take-off angle of 52 degrees, the difference was about 5.8%; the decrease in energy depreciation could be due to the submergence of the blocks. Figure 8 shows the effect of the block in the ogee-spillway bed for different states (with and without flip buckets) on energy dissipation.
The increase in bucket take-off angle led to a rise in relative energy dissipation. In fact, as the bucket take-off angle increased, the flow direction changed to be more upward, causing more dispersion in the air and consequently more energy dissipation. By increasing the discharge (and consequently flow depth) in all three states, relative energy dissipation was also decreased because flow resistance was reduced. Figure 9 shows the block-bed difference between smooth beds for different states (with and without flip buckets) on energy dissipation from the experimental results.
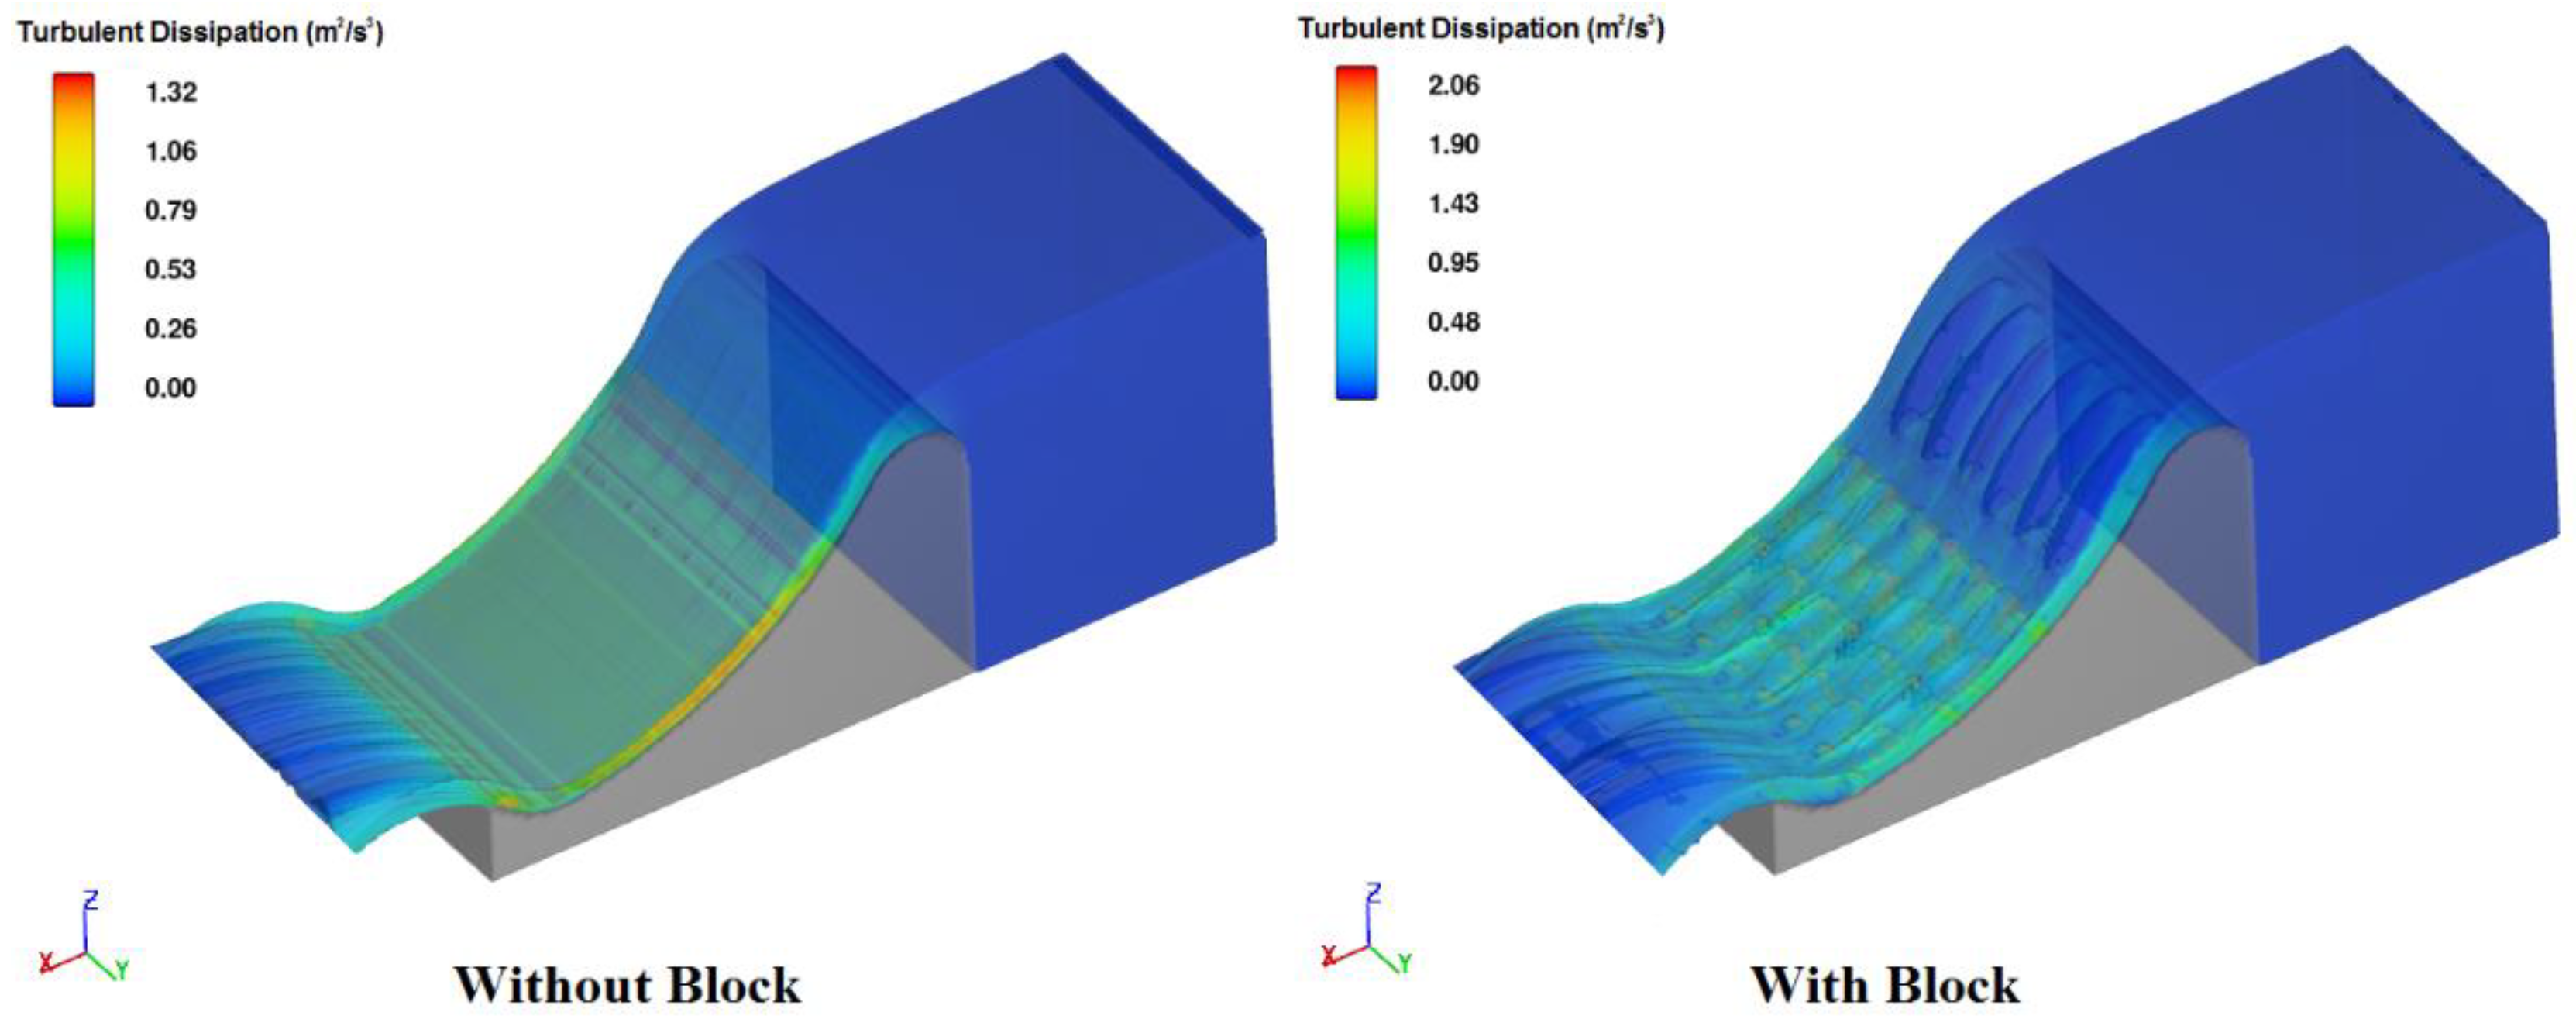
According to Figure 8, by increasing the Froude numbers in different buckets, relative energy dissipation decreased in all cases, even if the relative energy-dissipation ratio was larger than that of the conventional model (ogee spillway without block). Figure 10 shows the difference in energy dissipation (flow turbulence) in the state with and without blocks in the spillway bed. It was carefully observed on colorimetric meters that the block in the ogee spillway bed increased the energy dissipation of the flow in comparison with that in the conventional model in the same take-off angle buckets.
4.4. Jet Length in Ogee Spillway with Block Bed and Different Buckets
In this research, with the constant assumption of other parameters, the effects of the take-off angles, the block of spillway bed, and the downstream Froude number (outlet bucket discharge) on jet length were studied. Table 6 shows the jet length for smooth and blocked beds from the FLOW-3D results.
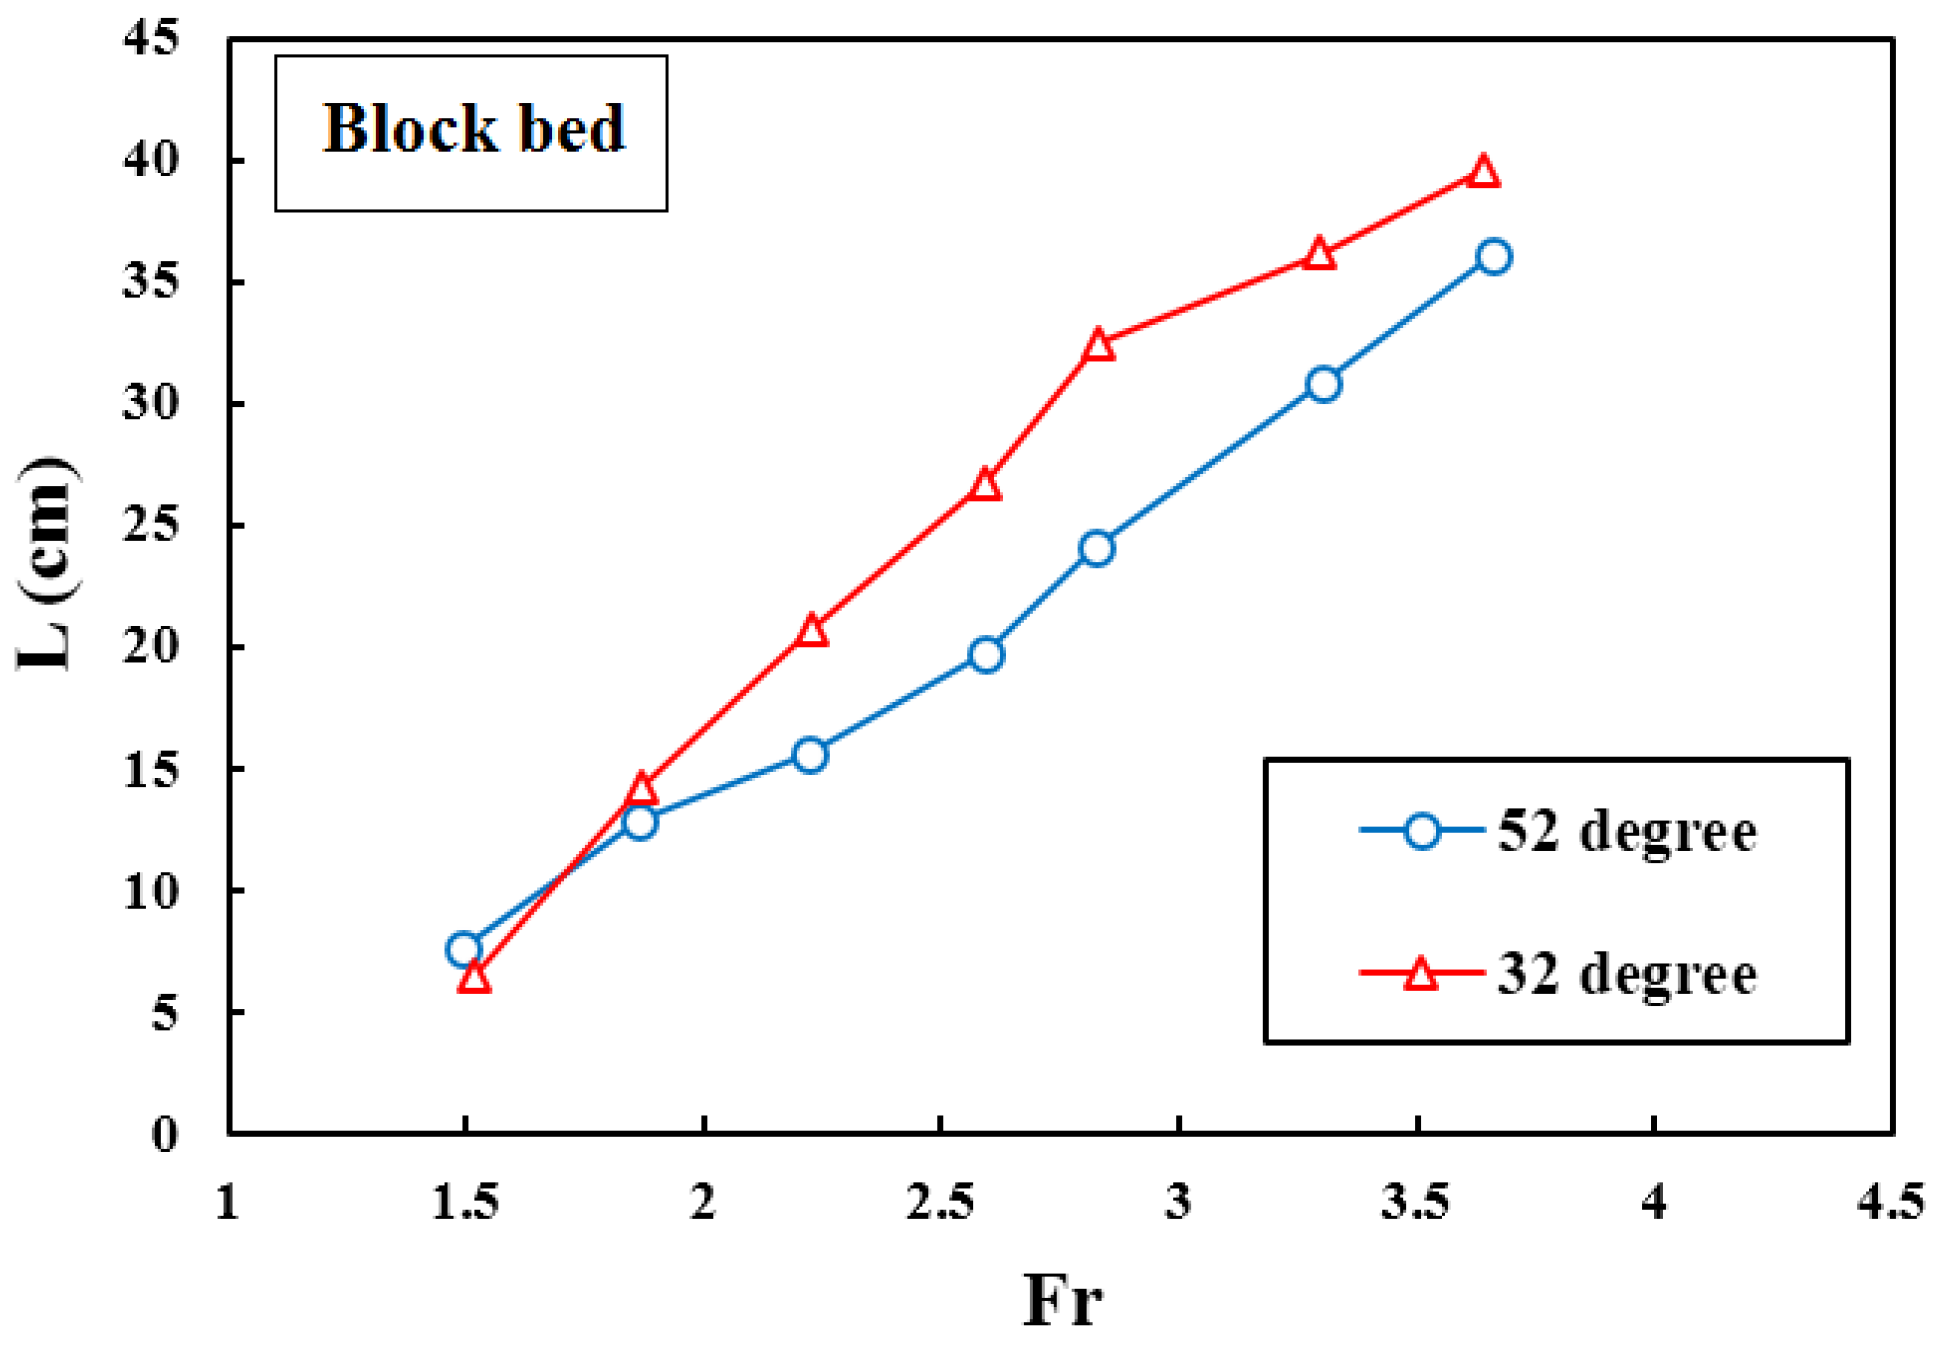
Figure 11 shows the variations in jet length (L) vs. Froude number (Fr) relative to discharge in a bucket with different take-off angles from the experimental results.
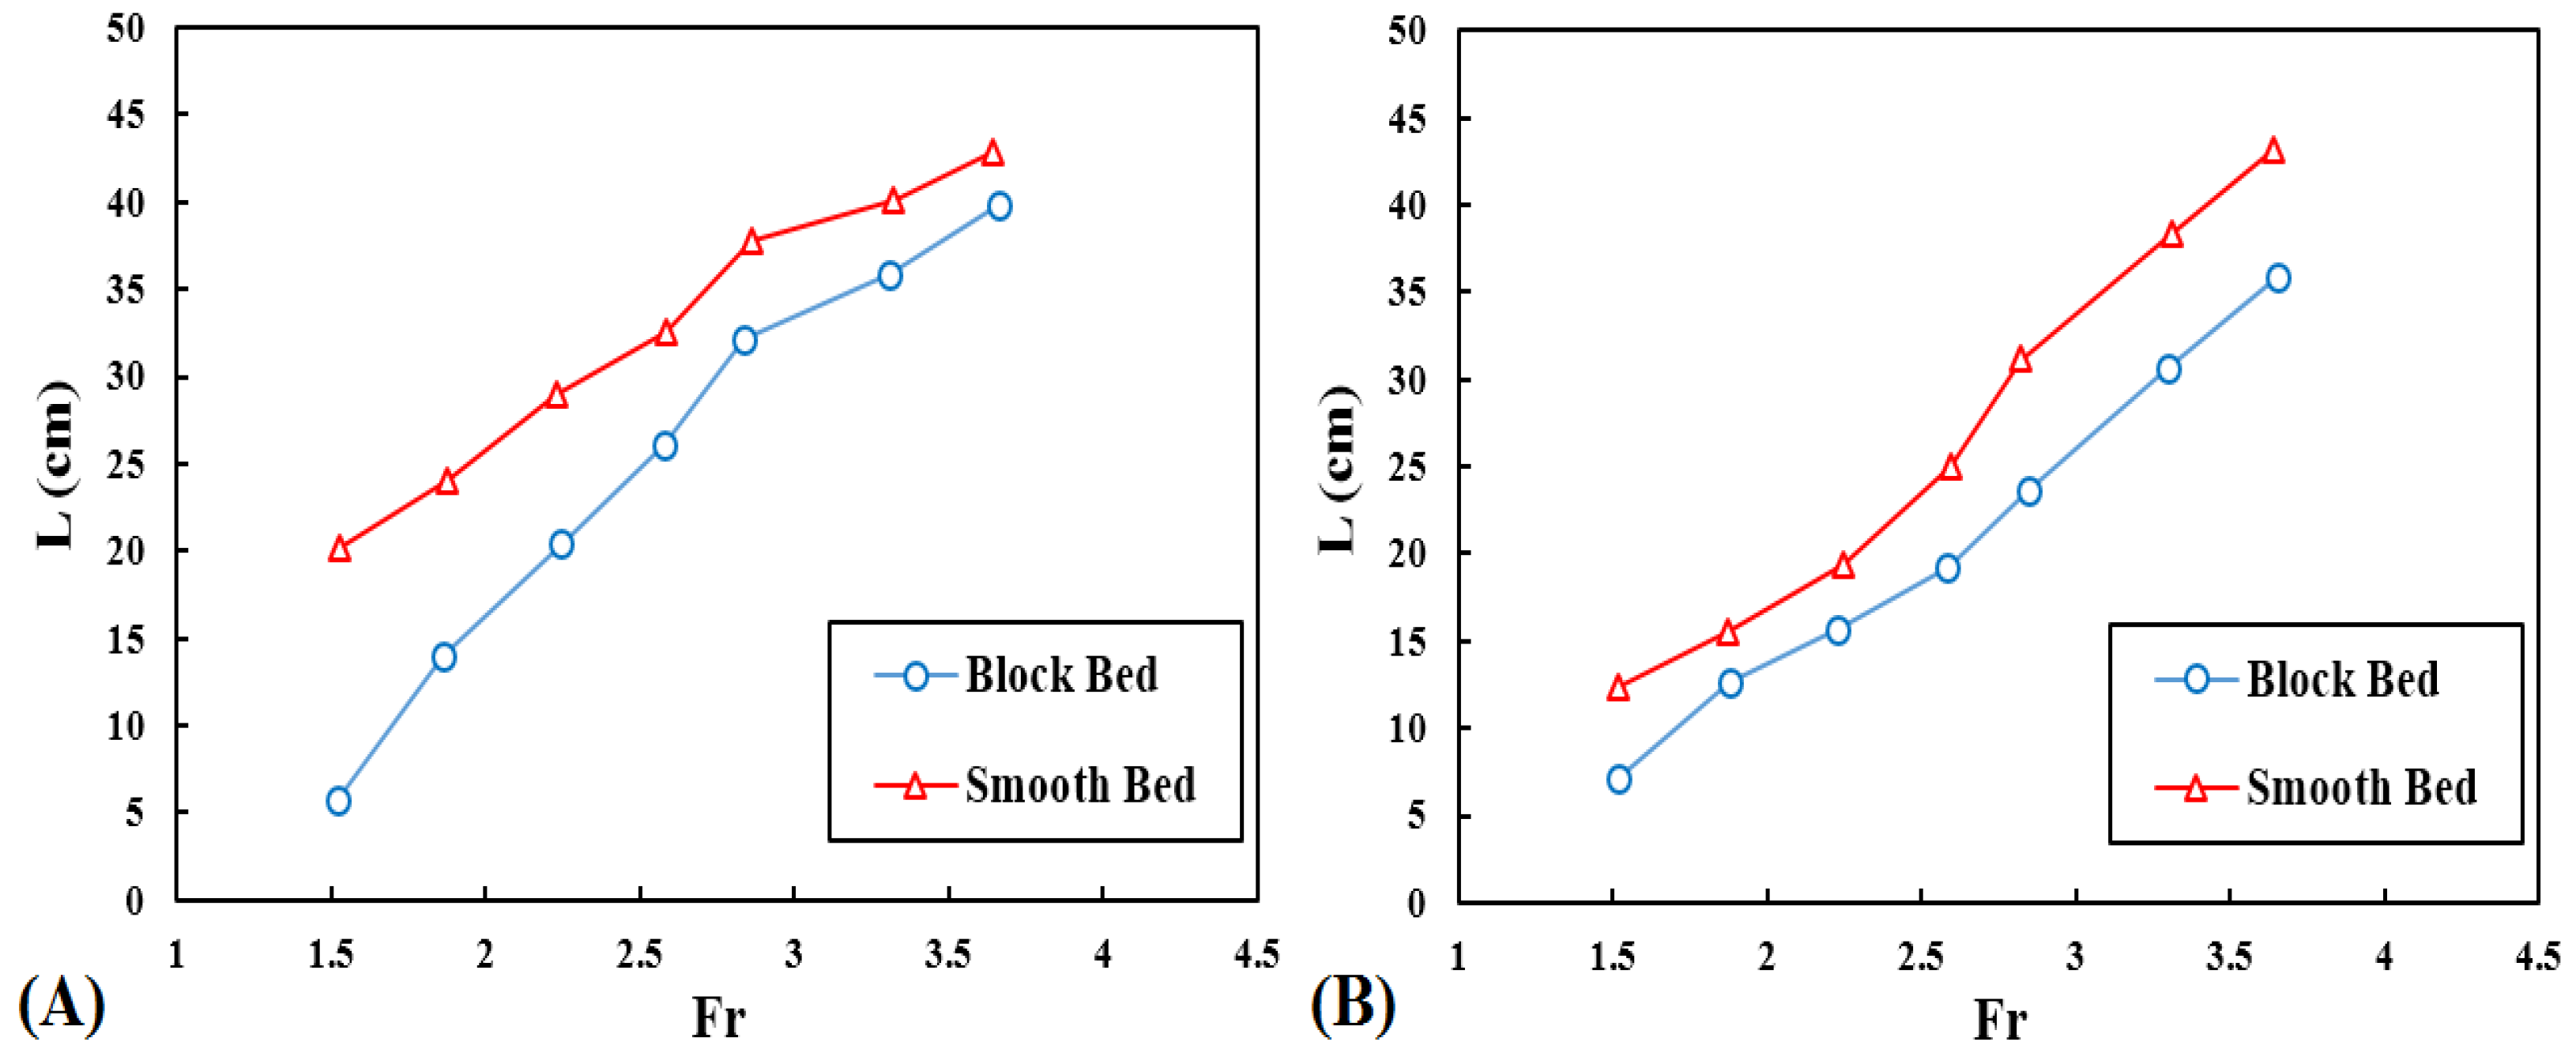
The jet length in the initial Froude number is the same for both buckets because of the low flow velocity. By increasing the Froude number, the jet length for the bucket with a 32° take-off angle was higher than that for the 52° take-off angle. In general, the length of the jets for a rough bed with a block was decreased from 8% to 58% relative to the smooth bed. With the increase in Froude number, the length of the jets was increased for both buckets. Figure 12 shows a comparison in jet lengths in the smooth- and blocked-bed cases (experiment results) at different Froude numbers. The length of the jet in the rough bed with blocks was lower than that for the smooth bed for both the 32° and 52° take-off angles. In a bucket with the take-off angle of 32 degrees, at lower discharges (lower Froude numbers), the difference between the jet length for the rough bed with a block and the smooth bed was more significant, and the rough bed with blocks had more of an impact on the length of the jet. For the flip bucket with a take-off angle of 52 degrees, in lower Froude numbers, the difference in the jet length between the smooth bed and the rough bed with block was due to the greater take-off angles.
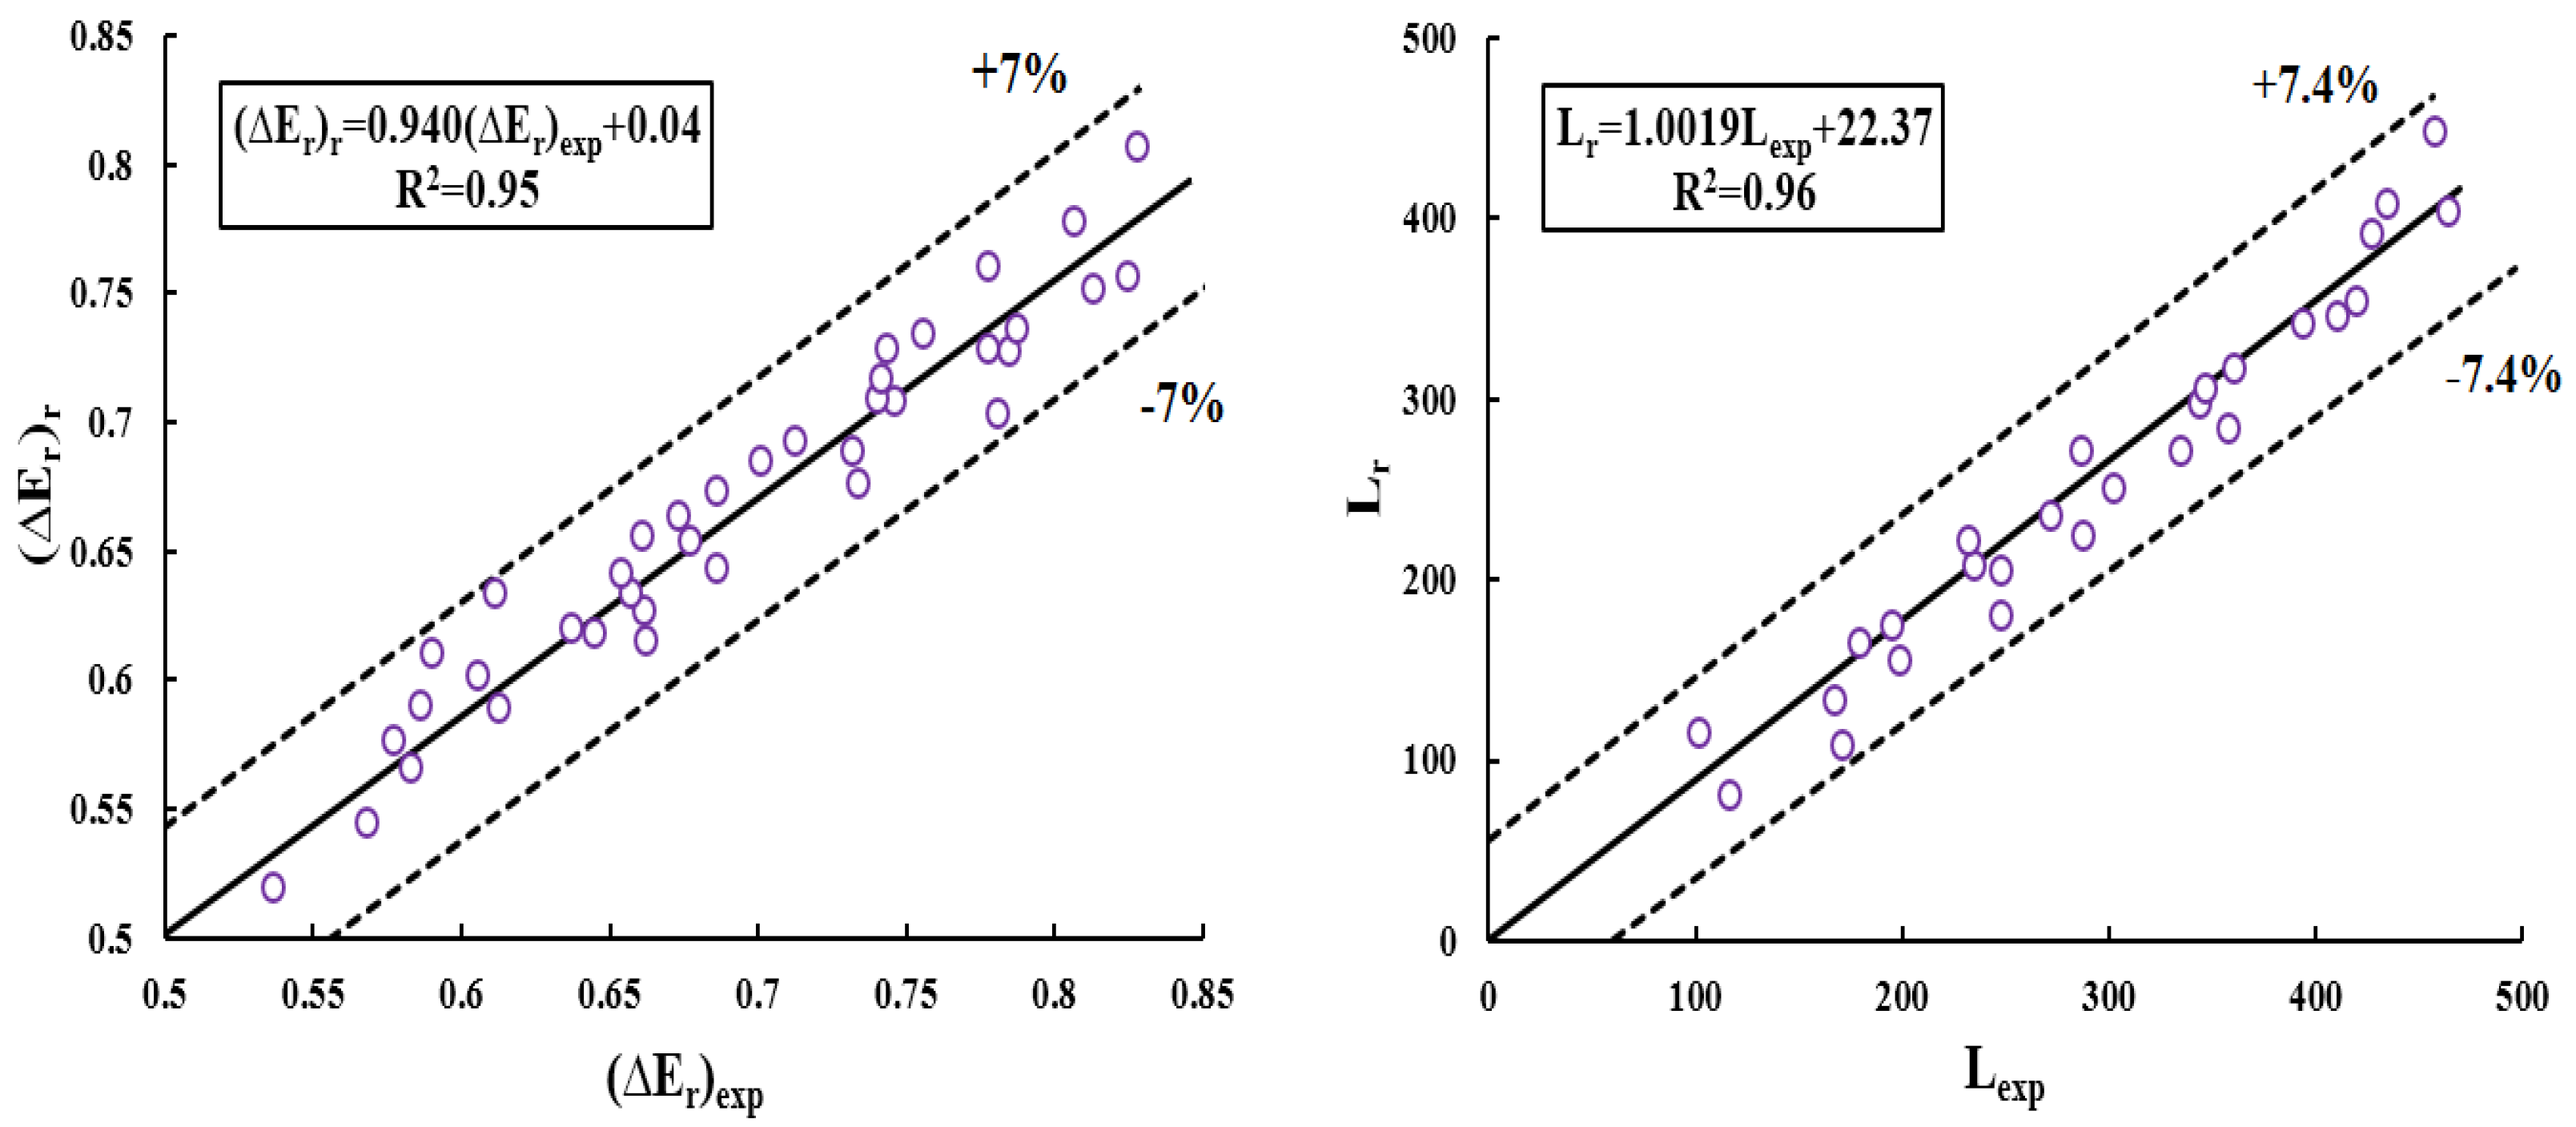
Equations (15) and (16) allow for the prediction of relative energy dissipation and jet length. Equations were developed on the basis of the 70–30% rule for experimental and numerical results. In this method, 70% of the data were used to train the coefficients, and the remaining 30% were used to test correlation accuracy:
where and are relative energy dissipation and jet length, respectively; the ratio of critical depth to dam height; the ratio of bucket height to bucket width; and θ is the take-off angles. In Figure 13, the calculated energy dissipation and jet length are compared with the experimental data (horizontal axis), and the energy-dissipation and jet-length values obtained from Equations (15) and (16) (vertical axis). The quality of this fit in energy dissipation and jet length was quantified by R2 = 0.95 via ± 7% relative error and R2 = 0.96 via ± 7.4% relative error, respectively. A scatter of points relative to the linear regression indicated that the experimental and computational values were in good agreement.
5. Discussion
This study focused on comparing experiments and a numerical model of ogee spillways with flip buckets. Although there are many studies on energy-dissipating structures downstream of spillways or dams, few works have focused on the effects of elements placed in the chute. This research contributes to basic knowledges regarding these dissipating structures. To this aim, two different structures were experimentally investigated and compared with the numerical results of CFD commercial software. Generally, there was good accordance between numerical and experimental data (maximal relative error in free-surface profiles was ~7%). Secondary current areas downstream of the chute were present in both scenarios, with and without flip buckets: the presence of flip buckets at different take-off angles led to an increase in secondary vortex area. With the block on the chute of the ogee spillway, the area of the secondary vortices disappeared.
Moreover, the amount of energy dissipation (compared to that in a smooth bed) increased by up to 15.4%, while jet length for the spillway was decreased by up to 58%. Starting from the experimental results, two analytical formulations were derived to investigate the amount of energy dissipation and the jet length of the ogee spillway. The proposed procedure was also used to test predictions against the experimental and numerical data, and it was highly correlated with yielding maximal errors of 7% and 7.4%, respectively.
6. Conclusions
Nowadays, flip buckets are widely used around the world because of their acceptable reliability in the field of energy depreciation. A flip bucket itself is, however, not an energy dissipator; it is an integral part of an energy-dissipation system. Flip buckets are used when energy has to be dissipated for large-velocity flows, and there is the possibility of cavitation and uplifting force in downstream structures. However, it is still an issue to investigate the cavitation between the blocked bed on the chute bed, downstream of the structure flip buckets, and the effect of a blocked bed on erosion downstream of flip buckets, caused by jet flow and a variety of shapes of blocks with the position and arrangement of block on the chute bed.
In this research, the effect of a blocked bed on an ogee-spillway chute on the amount of kinetic-energy dissipation and jet length was experimentally and numerically investigated. The numerical model was first compared with laboratory results to demonstrate the suitability of calculations for adequately capturing flow features.
Subsequently, changes to numerous independent parameters were made using a laboratory test and computational software to determine their effect on the amount of kinetic-energy dissipation and jet length. Changes included modifications to different take-off angles, bed type (smooth and rough bed), and Froude number. New correlating equations were provided for various values of the influencing parameters to allow for the prediction of the amount of energy dissipation and the jet length of the ogee spillway. The calculated results in this paper were in significantly good agreement with experimental and literature data.
Author Contributions
Conceptualization, R.D., A.G., A.A., and S.D.F.; methodology, R.D., A.G., A.A., and S.D.F.; software, A.G.; validation, A.G. and S.D.F.; formal analysis, A.G. and S.D.F.; investigation, R.D., A.G., A.A., and S.D.F.; writing—original-draft preparation, R.D., A.G., and S.D.F.; writing—review and editing, R.D., A.G. and S.D.F.; supervision, R.D. and A.A.; project administration, A.G.; funding acquisition, S.D.F. All authors have read and agreed to the published version of the manuscript.
Funding
This research was partially supported by Italian Ministry Program PRIN, grant No. 20154EHYW9, “Combined numerical and experimental methodology for fluid structure interaction in free-surface flows under impulsive loading”.
Conflicts of Interest
The authors declare no conflict of interest.
References
- Vischer, D.L.; Hager, W.H. Dam Hydraulics; Wiley: Hoboken, NJ, USA; Chichester, UK, 1998. [Google Scholar]
- Yamini, O.A.; Kavianpour, M.R.; Movahedi, A. Pressure distribution on the bed of the compound flip buckets. J. Comput. Multiph. Flows 2015, 7, 181–194. [Google Scholar] [CrossRef] [Green Version]
- Maitre, R.; Obolensky, S. Etude de Quelques Caractéristiques de l’Ecoulement dans la Partie Aval des Evacuateurs de Surface. Houille Blanche 1954, 4, 481–511. [Google Scholar] [CrossRef] [Green Version]
- Rhone, T.J.; Peterka, A.J. Improved tunnel spillway flip buckets. J. Hydraul. Eng. 1959, 126, 1270–1291. [Google Scholar]
- Juon, R.; Hager, W.H. Flip bucket without and with deflectors. J. Hydraul. Eng. 2000, 126, 837–845. [Google Scholar] [CrossRef]
- Dargahi, B. Experimental study and 3D numerical simulations for a free-overflow spillway. J. Hydraul. Eng. 2006, 132, 899–907. [Google Scholar] [CrossRef]
- Steiner, R.; Heller, V.; Hager, W.H.; Minor, H.E. Deflector Ski Jump Hydraulics. J. Hydraul. Eng. 2008, 134, 562–571. [Google Scholar] [CrossRef]
- Kermannejad, J.; Fathi Moghadam, M. Dynamic pressure of flip bucket jets. World Appl. Sci. J. 2011, 9, 1448–1454. [Google Scholar]
- Zhenwei, M.U.; Zhiyan, Z. Numerical simulation of 3-D flow field of spillway based on VOF method. Procedia Eng. 2012, 28, 808–812. [Google Scholar] [CrossRef] [Green Version]
- Parsaie, A.; Dehdar-Behbahani, S.; Haghiabi, A.H. Numerical modeling of cavitation on spillway’s flip bucket. Front. Struct. Civ. Eng. 2016, 10, 438–444. [Google Scholar] [CrossRef]
- Daneshfaraz, R.; Ghaderi, A. Numerical Investigation of Inverse Curvature Ogee Spillway. Civ. Eng. J. 2017, 3, 1146–1156. [Google Scholar] [CrossRef] [Green Version]
- Yamini, O.A.; Kavianpour, M.R.; Mousavi, S.H.; Movahedi, A.; Bavandpour, M. Experimental investigation of pressure fluctuation on the bed of compound flip buckets. ISH J. Hydraul. Eng. 2017, 1, 1–8. [Google Scholar]
- Peterka, A.J. Hydraulic design of stilling basins and energy dissipators. In A Water Resources Technical Publication, Engineering Monograph, No. 25; United States Department of the Interior Bureau of Reclamation: Denver, CO, USA, 1984. [Google Scholar]
- Kaya, N.; Emiroglu, M.E. Study of oxygen transfer efficiency at baffled chutes. Presented Meet. Proc. Inst. Civ. Eng. Water Manag. 2010, 163, 447–456. [Google Scholar] [CrossRef]
- Elnikhely, E. Investigation and analysis of scour downstream of a spillway. Ain Shams Eng. J. 2017, 9, 2275–2282. [Google Scholar] [CrossRef]
- Pfister, M.; Chanson, H. Two-phase air-water flows: Scale effects in physical modelling. J. Hydrodyn. 2014, 26, 291–298. [Google Scholar] [CrossRef] [Green Version]
- Flow Science Inc. FLOW-3D V 11.2 User’s Manual; Flow Science Inc.: Santa Fe, NM, USA, 2016. [Google Scholar]
- Ghaderi, A.; Abbasi, S. CFD simulation of local scouring around airfoil-shaped bridge piers with and without collar. Sādhanā 2019, 44, 216. [Google Scholar] [CrossRef] [Green Version]
- Yakhot, V.; Orszag, S.A. Renormalization Group Analysis of Turbulence: Basic Theory. J. Sci. Comput. 1986, 1, 1–51. [Google Scholar] [CrossRef]
- Cable, M. An Evaluation of Turbulence Models for the Numerical Study of Forced and Natural Convective Flow in Atria. Master’s Thesis, Queens University, Kingston, ON, Canada, 2009. [Google Scholar]
- Savage, B.; Johnson, M. Flow over ogee spillway: Physical and numerical model case study. J. Hydraul. Eng. 2001, 127, 640–649. [Google Scholar] [CrossRef]
- Aydin, M.C.; Ozturk, M. Verification and validation of a computational fluid dynamics (CFD) model for air entrainment at spillway aerators. Can. J. Civ. Eng. 2009, 36, 826–836. [Google Scholar] [CrossRef] [Green Version]
- Sangsefidi, Y.; MacVicar, B.; Ghodsian, M.; Mehraein, M.; Torabi, M.; Savage, B.M. Evaluation of flow characteristics in labyrinth weirs using response surface methodology. Flow Meas. Instrum. 2019, 69, 101617. [Google Scholar] [CrossRef]
- Daneshfaraz, R.; Joudi, A.R.; Ghahramanzadeh, A.; Ghaderi, A. Investigation of flow pressure distribution over a stepped spillway. Adv. Appl. Fluid Mech. 2016, 19, 811. [Google Scholar] [CrossRef]
- Zahabi, H.; Torabi, M.; Alamatian, E.; Bahiraei, M.; Goodarzi, M. Effects of geometry and hydraulic characteristics of shallow reservoirs on sediment entrapment. Water 2018, 10, 1725. [Google Scholar] [CrossRef] [Green Version]
- Ghaderi, A.; Abbasi, S.; Abraham, J.; Azamathulla, H.M. Efficiency of Trapezoidal Labyrinth Shaped Stepped Spillways. Flow Meas. Instrum. 2020, 72, 101711. [Google Scholar] [CrossRef]
- Daneshfaraz, R.; Ghahramanzadeh, A.; Ghaderi, A.; Joudi, A.R.; Abraham, J. Investigation of the Effect of Edge Shape on Characteristics of Flow under Vertical Gates. J. Am. Water Work. Assoc. 2016, 108, 425–432. [Google Scholar] [CrossRef]
- Yakhot, V.; Orsarg, S.A.; Thangam, S.; Gatski, T.B.; Speziale, C.G. Development of turbulence models for shear flows by a double expansion technique. Phys. Fluids 1992, 4, 1510–1520. [Google Scholar] [CrossRef] [Green Version]
- Biscarini, C.; Di Francesco, S.; Manciola, P. CFD modelling approach for dam break flow studies. Hydrol. Earth Syst. Sci. 2010, 14, 705–718. [Google Scholar] [CrossRef] [Green Version]
- Daneshfaraz, R.; Minaei, O.; Abraham, J.; Dadashi, S.; Ghaderi, A. 3-D Numerical simulation of water flow over a broad-crested weir with openings. ISH J. Hydraul. Eng. 2019, 1–9. [Google Scholar] [CrossRef]
- Ghaderi, A.; Dasineh, M.; Abbasi, S.; Abraham, J. Investigation of trapezoidal sharp-crested side weir discharge coefficients under subcritical flow regimes using CFD. Appl. Water Sci. 2020, 10, 31. [Google Scholar] [CrossRef] [Green Version]
- Johnson, M. Discharge Coefficient Scale Effects Analysis for Weirs. Ph.D. Thesis, Utah State University, Logan, UT, USA, 1996. [Google Scholar]
- Moradinejad, A.; Saneie, M.; Ghaderi, A.; Shahri, S.M.Z. Experimental study of flow pattern and sediment behavior near the intake structures using the spur dike and skimming wall. Appl. Water Sci. 2019, 9, 195. [Google Scholar] [CrossRef] [Green Version]
- Ghaderi, A.; Daneshfaraz, R.; Dasineh, M.; Di Francesco, S. Energy Dissipation and Hydraulics of Flow over Trapezoidal–Triangular Labyrinth Weirs. Water 2020, 12, 1992. [Google Scholar] [CrossRef]
- Ghaderi, A.; Daneshfaraz, R.; Torabi, M.; Abraham, J.; Azamathulla, H.M. Experimental investigation oneffective scouring parameters downstream from stepped spillways. Water Supply 2020. [Google Scholar] [CrossRef]
- United States Bureau of Reclamation. Design of Small Dams; United States Department of Interior—Bureau of Reclamation: Washington, DC, USA, 1987.
- Choufu, L.; Abbasi, S.; Pourshahbaz, H.; Taghvaei, P.; Tfwala, S. Investigation of flow, erosion, and sedimentation pattern around varied groynes under different hydraulic and geometric conditions: A numerical study. Water 2019, 11, 235. [Google Scholar] [CrossRef] [Green Version]
- Di Francesco, S.; Zarghami, A.; Biscarini, C.; Manciola, P. Wall roughness effect in the lattice Boltzmann method. AIP Conf. Proc. 2013, 1558, 1677–1680. [Google Scholar]
- Biscarini, C.; Di Francesco, S.; Ridolfi, E.; Manciola, P. On the Simulation of Floods in a Narrow Bending Valley: The Malpasset Dam Break Case Study. Water 2016, 8, 545. [Google Scholar] [CrossRef] [Green Version]
- Venturi, S.; Di Francesco, S.; Geier, M.; Manciola, P. Forcing for a Cascaded Lattice Boltzmann Shallow Water Model. Water 2020, 12, 439. [Google Scholar] [CrossRef] [Green Version]
- Venturi, S.; Di Francesco, S.; Geier, M.; Manciola, P. A new collision operator for lattice Boltzmann shallow water model: A convergence and stability study. Adv. Water Resour. 2020, 135, 103474. [Google Scholar] [CrossRef]
- Ghaderi, A.; Daneshfaraz, R.; Abbasi, S.; Abraham, J. Numerical analysis of the hydraulic characteristics of modified labyrinth weirs. Int. J. Energy Water Resour. 2020, 1–12. [Google Scholar] [CrossRef]
- Pourshahbaz, H.; Abbasi, S.; Pandey, M.; Pu, J.H.; Taghvaei, P.; Tofangdar, N. Morphology and hydrodynamics numerical simulation around groynes. ISH J. Hydraul. Eng. 2020, 1–9. [Google Scholar] [CrossRef]
- Longo, S.; Ciriello, V.; Chiapponi, L.; Di Federico, V. Combined effect of rheology and confining boundaries on spreading of gravity currents in porous media. Adv. Water Resour. 2015, 79, 140–152. [Google Scholar] [CrossRef]
- Ciriello, V.; Longo, S.; Chiapponi, L.; Di Federico, V. Porous gravity currents: A survey to determine the joint influence of fluid rheology and variations of medium properties. Adv. Water Resour. 2016, 92, 105–115. [Google Scholar] [CrossRef]
Figure 1.
Schematic of the experimental setup with an ogee spillway.

Figure 2.
Illustration of ogee spillway in flume, bucket, and block.

Figure 3.
Sketch of boundary conditions and mesh setup on numerical domain in FLOW-3D.

Figure 4.
Variations of relative error of mean free-surface profiles versus cell size.

Figure 5.
Comparison of free-surface profiles from FLOW-3D software with laboratory data; Q = 0.0085 m3/s.
Figure 5.
Comparison of free-surface profiles from FLOW-3D software with laboratory data; Q = 0.0085 m3/s.

Figure 6.
Streamlines on x–y plane. (A) Without buckets; (B) buckets with θ = 32°; (C) buckets with θ = 52°.
Figure 6.
Streamlines on x–y plane. (A) Without buckets; (B) buckets with θ = 32°; (C) buckets with θ = 52°.


Figure 7.
Streamlines on x–y plane. (A) Without buckets and smooth bed; (B) without buckets and block bed.
Figure 7.
Streamlines on x–y plane. (A) Without buckets and smooth bed; (B) without buckets and block bed.

Figure 8.
Difference in relative energy dissipation versus Froude number in block bed with different take-off angles.
Figure 8.
Difference in relative energy dissipation versus Froude number in block bed with different take-off angles.

Figure 9.
Difference in relative energy dissipation in smooth and block beds. (A) Without bucket; (B) bucket with θ = 32° (C) bucket with θ = 52°.
Figure 9.
Difference in relative energy dissipation in smooth and block beds. (A) Without bucket; (B) bucket with θ = 32° (C) bucket with θ = 52°.


Figure 10.
Comparison of flow turbulence on ogee-spillway chute with and without block bed.

Figure 11.
Difference in jet length versus Froude number in flip bucket with different take-off angles.
Figure 11.
Difference in jet length versus Froude number in flip bucket with different take-off angles.

Figure 12.
Difference in jet length in smooth and block beds. Bucket with (A) θ = 32° and (B) θ = 52°.
Figure 12.
Difference in jet length in smooth and block beds. Bucket with (A) θ = 32° and (B) θ = 52°.

Figure 13.
Comparison between observed and computational relative energy dissipation and jet length.
Figure 13.
Comparison between observed and computational relative energy dissipation and jet length.


Table 1.
Dimensions, and hydraulic experimental and numerical parameters.
| Range | Q (m3/s) | y (cm) | R (cm) | Fr | Re | |
|---|---|---|---|---|---|---|
| Min | 0.005 | 5.3 | 12 | 32 | 1.29 | 20,700 |
| Max | 0.014 | 11.7 | 19 | 52 | 3.62 | 38,950 |
Table 2.
Mesh-sensitivity analysis for present study.
| Test No. | Coarser Cell Size (cm) | Finer Cell Size (cm) | Total Mesh Number | MAPE (%) * | ** RMSE (cm) |
|---|---|---|---|---|---|
| T1 | 1.2 | 0.55 | 944,125 | 19.24 | 4.6 |
| T2 | 1.1 | 0.50 | 1,335,000 | 8.89 | 1.94 |
| T3 | 0.95 | 0.45 | 1,769,834 | 8.45 | 1.75 |
| T4 | 0.80 | 0.40 | 2,541,311 | 2.42 | 0.39 |
| T5 | 0.70 | 0.35 | 3,906,163 | 1.90 | 0.33 |
* Mean absolute percentage error; Xexp: experimental value of X; Xnum: numerical value of X; n: data count. ** Root mean square error; Xexp: experimental value of X; Xnum: numerical value of X; n: data count.
Table 3.
Comparison of numerical and experimental free-surface profiles; Q = 0.085 m3/s.
| X(m) | FsE (m)Exp | FsE (m)Num | Relative Errors (%) | RMSE (cm) |
|---|---|---|---|---|
| −0.28 | 0.326 | 0.330 | 1.22 | 0.04 |
| −0.20 | 0.327 | 0.331 | 1.22 | 0.04 |
| −0.15 | 0.325 | 0.330 | 1.53 | 0.05 |
| −0.10 | 0.324 | 0.328 | 1.22 | 0.04 |
| −0.05 | 0.324 | 0.325 | 0.38 | 0.01 |
| 0.00 | 0.322 | 0.323 | 0.38 | 0.01 |
| 0.05 | 0.309 | 0.313 | 1.22 | 0.04 |
| 0.15 | 0.217 | 0.223 | 2.76 | 0.06 |
| 0.25 | 0.116 | 0.124 | 6.89 | 0.08 |
| 0.35 | 0.074 | 0.076 | 2.07 | 0.02 |
| 0.45 | 0.083 | 0.088 | 1.53 | 0.05 |
| 0.55 | 0.133 | 0.139 | 2.76 | 0.06 |
| 0.60 | 0.144 | 0.148 | 1.22 | 0.04 |
| 0.65 | 0.146 | 0.149 | 2.03 | 0.03 |
| Mean | 1.88 | 0.04 | ||
Table 4.
Summary of overall mean values of relative errors between numerical and experiment data.
| Q(m3/s) | Mean Relative Errors (%) | Mean RMSE(cm) |
|---|---|---|
| 0.005 | 1.42 | 0.02 |
| 0.007 | 1.21 | 0.04 |
| 0.0085 | 1.88 | 0.04 |
| 0.010 | 1.56 | 0.03 |
| 0.011 | 1.42 | 0.04 |
| 0.013 | 1.26 | 0.03 |
| 0.014 | 1.47 | 0.04 |
Table 5.
Relative energy-dissipation values for smooth and blocked bed (FLOW-3D results).
| Take-Off Angles (θ) | Bed | Q (m3/s) | |||||||
|---|---|---|---|---|---|---|---|---|---|
| 0.005 | 0.007 | 0.0085 | 0.010 | 0.011 | 0.013 | 0.014 | |||
| ∆Er | Without flip bucket | Smooth | 0.66 | 0.61 | 0.59 | 0.59 | 0.58 | 0.57 | 0.54 |
| Blocked | 0.78 | 0.72 | 0.67 | 0.65 | 0.64 | 0.61 | 0.58 | ||
| 32° | Smooth | 0.75 | 0.70 | 0.67 | 0.66 | 0.66 | 0.61 | 0.58 | |
| Blocked | 0.81 | 0.78 | 0.75 | 0.71 | 0.69 | 0.65 | 0.64 | ||
| 52° | Smooth | 0.83 | 0.79 | 0.74 | 0.73 | 0.71 | 0.68 | 0.65 | |
| Blocked | 0.83 | 0.81 | 0.78 | 0.76 | 0.75 | 0.71 | 0.69 | ||
Table 6.
Jet-length values for smooth and block beds (cm; FLOW-3D results).
| Take-Off Angles (θ) | Bed | Q (m3/s) | |||||||
|---|---|---|---|---|---|---|---|---|---|
| 0.005 | 0.0070 | 0.0085 | 0.010 | 0.011 | 0.013 | 0.014 | |||
| L | 32° | Smooth | 20.5 | 24.5 | 29.5 | 32.7 | 37.7 | 40.3 | 42.8 |
| Blocked | 8.6 | 14.0 | 20.5 | 32.0 | 32.0 | 35.9 | 39.5 | ||
| 52° | Smooth | 12.4 | 15.5 | 19.2 | 31.0 | 31.0 | 38.5 | 43.0 | |
| Blocked | 7.4 | 12.5 | 15.5 | 23.5 | 23.5 | 30.7 | 36.0 | ||
Publisher’s Note: MDPI stays neutral with regard to jurisdictional claims in published maps and institutional affiliations. |
© 2020 by the authors. Licensee MDPI, Basel, Switzerland. This article is an open access article distributed under the terms and conditions of the Creative Commons Attribution (CC BY) license (http://creativecommons.org/licenses/by/4.0/).
Share and Cite
MDPI and ACS Style
Daneshfaraz, R.; Ghaderi, A.; Akhtari, A.; Di Francesco, S. On the Effect of Block Roughness in Ogee Spillways with Flip Buckets. Fluids 2020, 5, 182. https://0-doi-org.brum.beds.ac.uk/10.3390/fluids5040182
AMA Style
Daneshfaraz R, Ghaderi A, Akhtari A, Di Francesco S. On the Effect of Block Roughness in Ogee Spillways with Flip Buckets. Fluids. 2020; 5(4):182. https://0-doi-org.brum.beds.ac.uk/10.3390/fluids5040182
Chicago/Turabian StyleDaneshfaraz, Rasoul, Amir Ghaderi, Aliakbar Akhtari, and Silvia Di Francesco. 2020. "On the Effect of Block Roughness in Ogee Spillways with Flip Buckets" Fluids 5, no. 4: 182. https://0-doi-org.brum.beds.ac.uk/10.3390/fluids5040182