
Fractal Analysis of Particle Distribution and Scale Effect in a Soil–Rock Mixture
by
Xiaodong Fu
1,2, 
Haifeng Ding
1,2,
Qian Sheng
1,2,
Zhenping Zhang
1,3,*,
Dawei Yin
4 and
Fei Chen
5 1
State Key Laboratory of Geomechanics and Geotechnical Engineering, Institute of Rock and Soil Mechanics, Chinese Academy of Sciences, Wuhan 430071, China
2
School of Engineering Science, University of Chinese Academy of Sciences, Beijing 100049, China
3
School of Architecture and Civil Engineering, Shenyang University of Technology, Shenyang 110870, China
4
China State Construction International Investments (Hubei) Limited, Wuhan 430000, China
5
School of Architecture and Civil Engineering, Chengdu University, Chengdu 610106, China
*
Author to whom correspondence should be addressed.
Fractal Fract. 2022, 6(2), 120; https://0-doi-org.brum.beds.ac.uk/10.3390/fractalfract6020120
Submission received: 18 January 2022
/
Revised: 16 February 2022
/
Accepted: 17 February 2022
/
Published: 19 February 2022
(This article belongs to the Special Issue Fractal and Fractional in Geomaterials)
Abstract
:A soil–rock mixture (SRM) is a type of heterogeneous geomaterial, and the particle distribution of SRM can be described by fractal theory. At present, it is difficult to quantify the fractal dimension of a particle size distribution and understand the scale effect in SRMs. In this study, the fractal theory and discrete element method (DEM) were introduced to solve this problem. First, the particle gradation of SRM was dealt with by using fractal theory. The fractal structure of particle distribution was studied, and a method of calculation of the fractal dimension is presented in this paper. Second, based on the fractal dimension and relative threshold, the particle gradations of SRMs at different scales were predicted. Third, numerical direct shear tests of SRM at different scales were simulated by using the DEM. The scale effects of shear displacement, shear zone, and shear strength parameters were revealed. Last, taking the maximum particle size of 60 mm as the standard value, the piece-wise functional relationship between shear strength parameters and particle size was established. The results are as follows: for SRM in a representative engineering area, by plotting the relationship between particle cumulative mass percentage and particle size, we can judge whether the SRM has a fractal structure; in Southwest China, the frequency of the fractal dimension of the SRM is in the normal distribution, and the median fractal dimension is 2.62; the particle gradations of SRMs at different scales calculated by fractal dimension and relative threshold can expand the study scope of particle size analysis; when the particle size is less than 70 mm, the strength parameters show a parabolic trend with the particle size increases, and if not, a nearly linear trend is found. The proposed method can describe the fractal characteristics of SRM in a representative engineering area and provides a quantitative estimation of shear strength parameters of SRM at different scales.
1. Introduction
A soil–rock mixture (SRM) is a heterogeneous geomaterial that is composed of rock blocks with different particle sizes and a soil matrix. In 1994, Medley and Goodman [1] innovated the term “bimrocks” (block-in-matrix rocks) and pointed out that the particle sizes in bimrocks range from centimeters to hundreds of meters [2]. Lindquist and Goodman [3] called the mixed rock and soil embedded with fragments and rock blocks from itself or outside a “mélange” [4]. You [5] proposed the concept of a SRM for Quaternary loose accumulations, which considered the particularity of its material composition between rock and soil. Xu et al. [6,7] defined the SRM as an extremely heterogeneous loose geomaterial formed since the Quaternary that is composed of rock blocks, fine-grained soil, and pores. According to these definitions, the particle size distribution of soil and rock blocks in the SRM varies greatly. In the traditional soil classification system, the division of coarse-grained and fine-grained soil can be determined according to the limit values in specifications; however, there is no unified standard for the limiting values of particle size divided by particle group, and different countries have different regulations. For example, the Chinese Handbook of Engineering Geology [8] defined the mixtures of fine-grained soil and coarse-grained soil at sizes of less than 10 mm and lacking intermediate grain sizes as gravelly (stony) soils. Thus, to understand the particle distribution of SRM, it is essential to find a method with which to divide the soil and rock block in SRM and determine the threshold.
More importantly, the particle distribution of SRM is closely related to its mechanical properties. When obtaining the mechanical parameters of SRM by mechanical tests, the particle size of some natural SRM is much larger than the maximum size of rock block allowed by test equipment, such as 60 mm [9,10]. Thus, for the large-size rock block in SRM at the engineering scale, before mechanical testing, to make the scaled particle gradation maintain similar mechanical properties to the natural particle gradation as far as possible, the natural particle gradation needs to be treated by the scaling method. There are four common methods of coarse aggregate scaling, namely the removal method, equivalent substitution method, similar gradation method, and mixing method [11]. The variations in strength parameters of SRMs obtained by different scaling methods are different [12,13,14]. The reason is that the change of average particle gradation and fine particle caused by scaling methods directly affects the structural characteristics of SRM and then leads to the change of mechanical properties. The mechanical properties of a scaled SRM are different from those of natural SRM (the so-called scale effect).
As fractal theory is now widely used [15,16,17,18,19,20,21,22,23], many researchers [24,25,26,27,28,29,30,31] have found that geomaterials exhibit fractal characteristics, and the rock joints, particle distribution, and pores at different scales have self-similarity, which is also consistent with the evolution of geomaterials under natural conditions. Generally, geomaterials can be regarded as an open non-linear self-organizing system. When there are no external conditions to interfere with its self-organizing characteristics, the evolution of internal spatial structure exhibits certain orderliness [32,33,34,35]. The fractal structure is closely related to its composition and natural conditions: the fractal dimension represents the spatial structure characteristics formed by the long-term evolution of geomaterials. Sui et al. [36] discussed the development in rock fracture network descriptions by using traditional geometry and fractal methods and presented an analytical method for the quantitative evaluation of the irregularity and complexity of fracture networks based on the self-similarity of fractals. Xiao et al. [37] investigated the crushing characteristics of single particles and assemblies of rockfill materials with different nominal diameters and discussed the effects of the particle size on the Weibull modulus, compressibility index, and ultimate fractal dimension. He et al. [38] obtained the pore size distribution of the calcareous sand, quartz sand, and glass beads by using nuclear magnetic resonance tests, and fractal theory was introduced to describe the fractal properties of the pore size distribution. These studies show that the fractal theory can describe both structural characteristics and mechanical properties of geomaterials at different scales.
Previous studies [39,40,41] have shown that natural SRM exhibits a fractal structure. Commonly, the fractal curve of particle gradation of SRM is a broken line with an obvious turning point. According to the turning point, the particle size can be divided into fine aggregate and coarse aggregate. For example, Xu et al. [39] pointed out that SRM had a visible turning point at the particle size of 20 mm in its fractal dimension curve. However, at present, it is difficult to quantify the fractal dimension of the particle distribution of SRM, as well as the scale effect. In this study, the fractal theory was invoked to analyze the fractal characteristics of the particle distribution of SRM, numerical simulations of direct shear tests of SRM samples at different scales were conducted by using the discrete element method (DEM), and the variations in shear strength parameters of SRM at different scales were studied.
2. Fractal Model
2.1. Fractal Mathematical Model
Given the self-similarity of the particle distribution of SRM, the fractal characteristics under two-dimensional conditions can be quantitatively expressed by using the formula proposed by Mandelbrot [42]:
where R is any given particle size, r is the random particle size, A is the total area of particles satisfying r > R, Ca represents the area shape factor, λa is the maximum particle size under two-dimensional conditions, and D denotes the fractal dimension of particle size.
Under three-dimensional conditions, the formula proposed by Tyler and Wheacraft [43] is introduced:
where V is the total volume of particles satisfying r > R, Cm is the volume shape factor, and λm refers to the maximum particle size under three-dimensional conditions. Without considering the variation of particle density with particle size, in Formula (2), we multiply the density, ρ, on both sides at the same time, and then the total mass of particles satisfies r > R:
Furthermore, the total mass of all particles comprising an SRM sample can be calculated as follows:
The cumulative mass ratio of the SRM sample can be obtained as follows:
where MT is the total mass of all particles, and dmax is defined as the maximum particle size of an SRM sample. According to Formula (5), when R = dmax, the cumulative mass ratio is zero, and λm = dmax. By combining the commonly used particle gradation curves of SRM samples, Formula (5) can be converted into the following formula:
In Formula (6), for a given particle size, R, the mass percentage is defined as the ratio of the mass of particles satisfying r < R to the total mass; the particle size ratio is defined as the ratio of R to dmax; there is a power function relationship between the mass percentage and the particle size ratio; and the index is 3 − D.
Using the logarithmic transformation of Formula (6), in the double-logarithmic coordinate system, we can plot the relationship curve between lg (M(r < R)/MT and lg R, and whether the SRM meets the fractal structure can be ascertained. If the relationship is approximately linear, it indicates that the particle gradation of SRM within the range of interest has strict statistical self-similarity, the particle distribution demonstrates a fractal structure, and the slope is a = 3 − D. Otherwise, it means that the particle gradation is poor, the pore filling is poor, and natural SRM is loose. In addition, if the relationship shows the characteristics of a broken line, it indicates that the particle gradation has good multifractal characteristics, and the particle distribution has self-similarity in the corresponding linear interval. Based on the above fractal mathematical model, the particle gradation of natural SRM can be processed to judge whether it has a fractal structure, and the corresponding fractal dimension can be obtained.
2.2. Fractal Analysis of SRM Samples
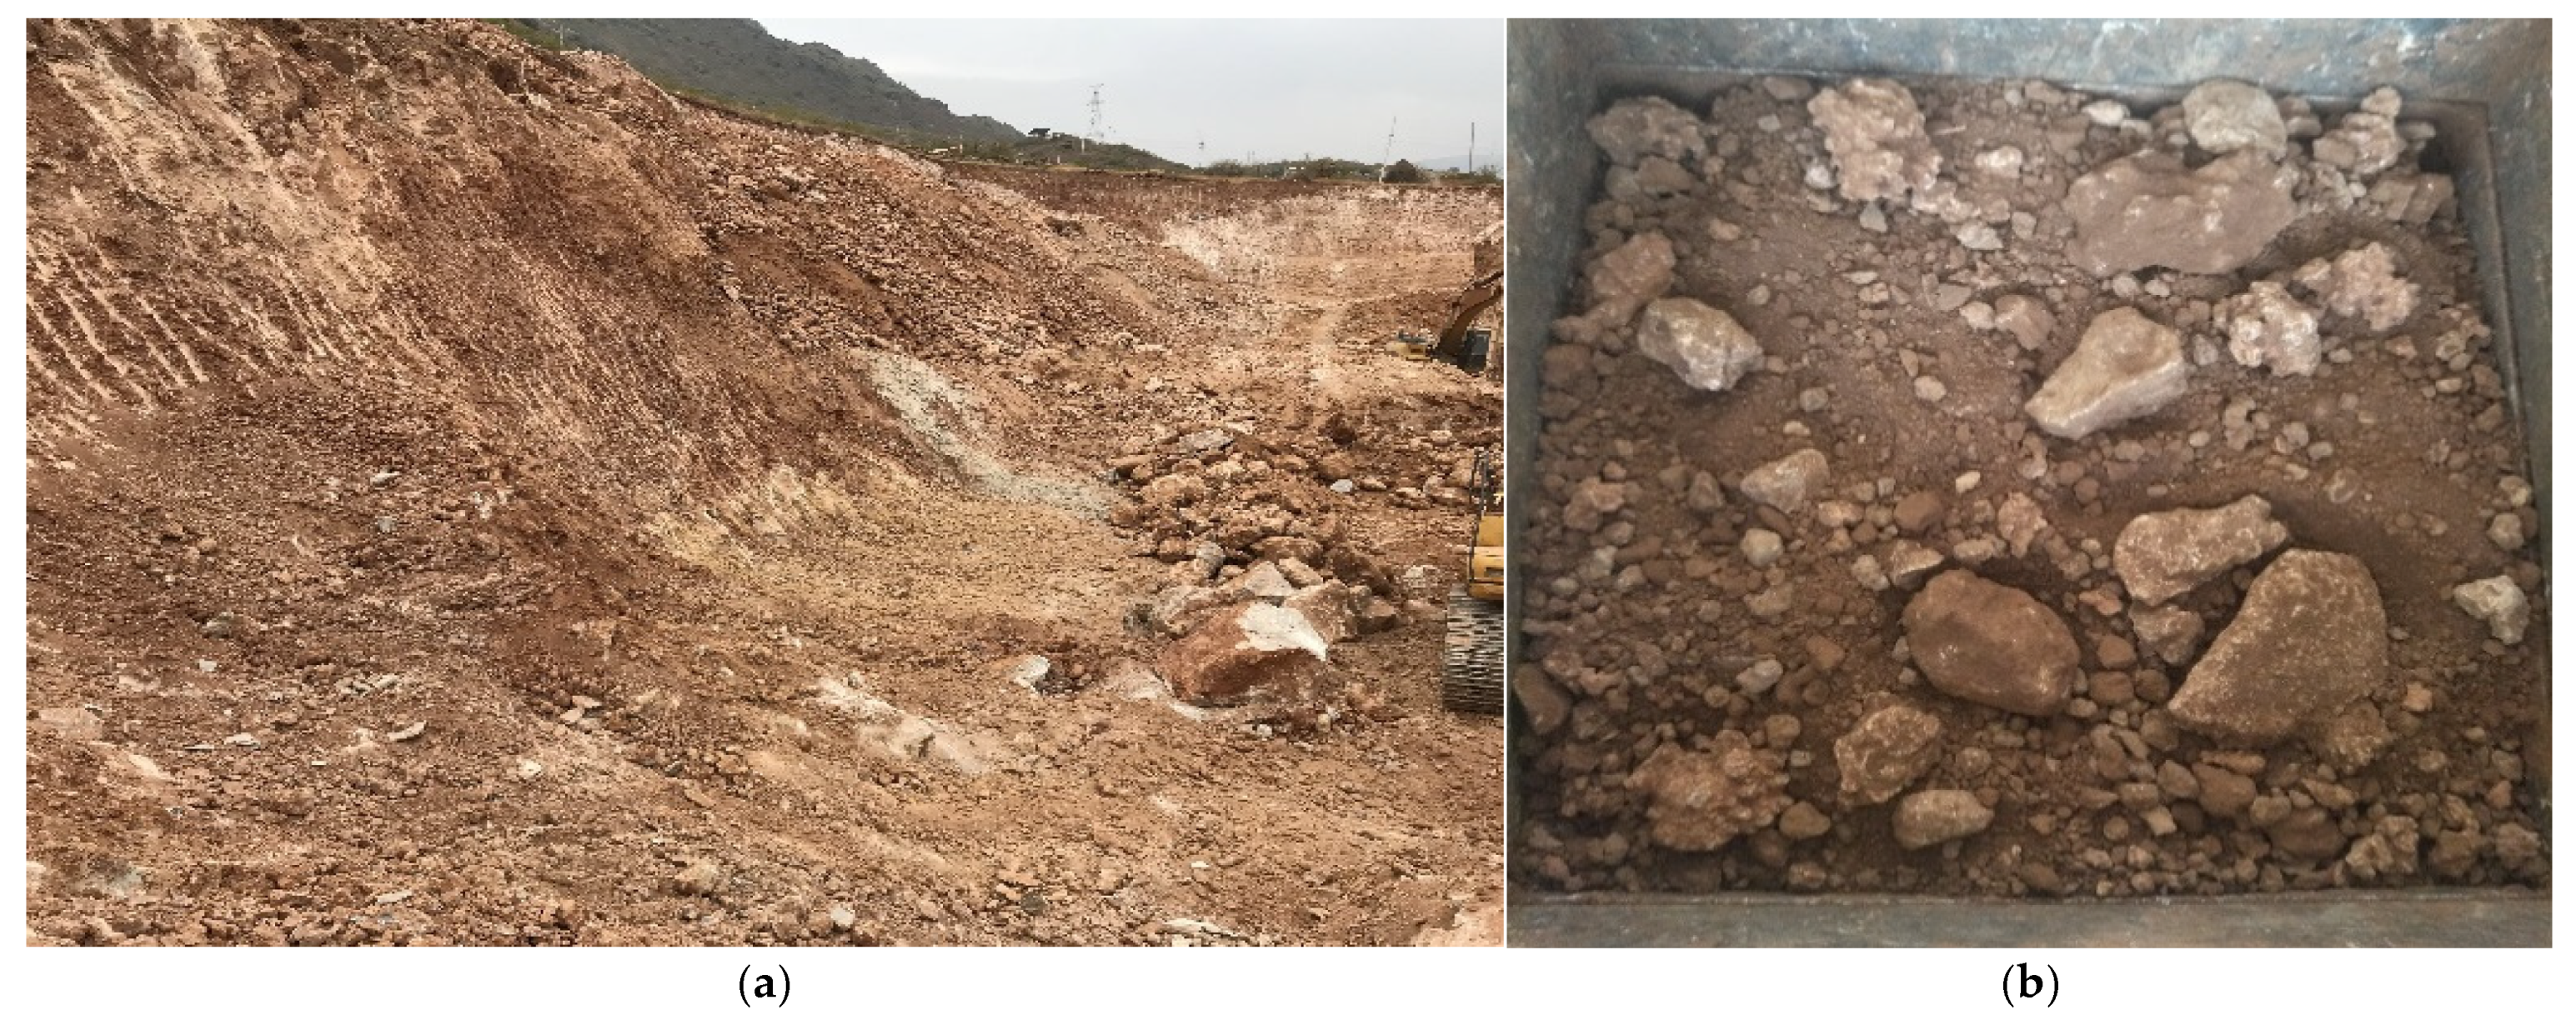
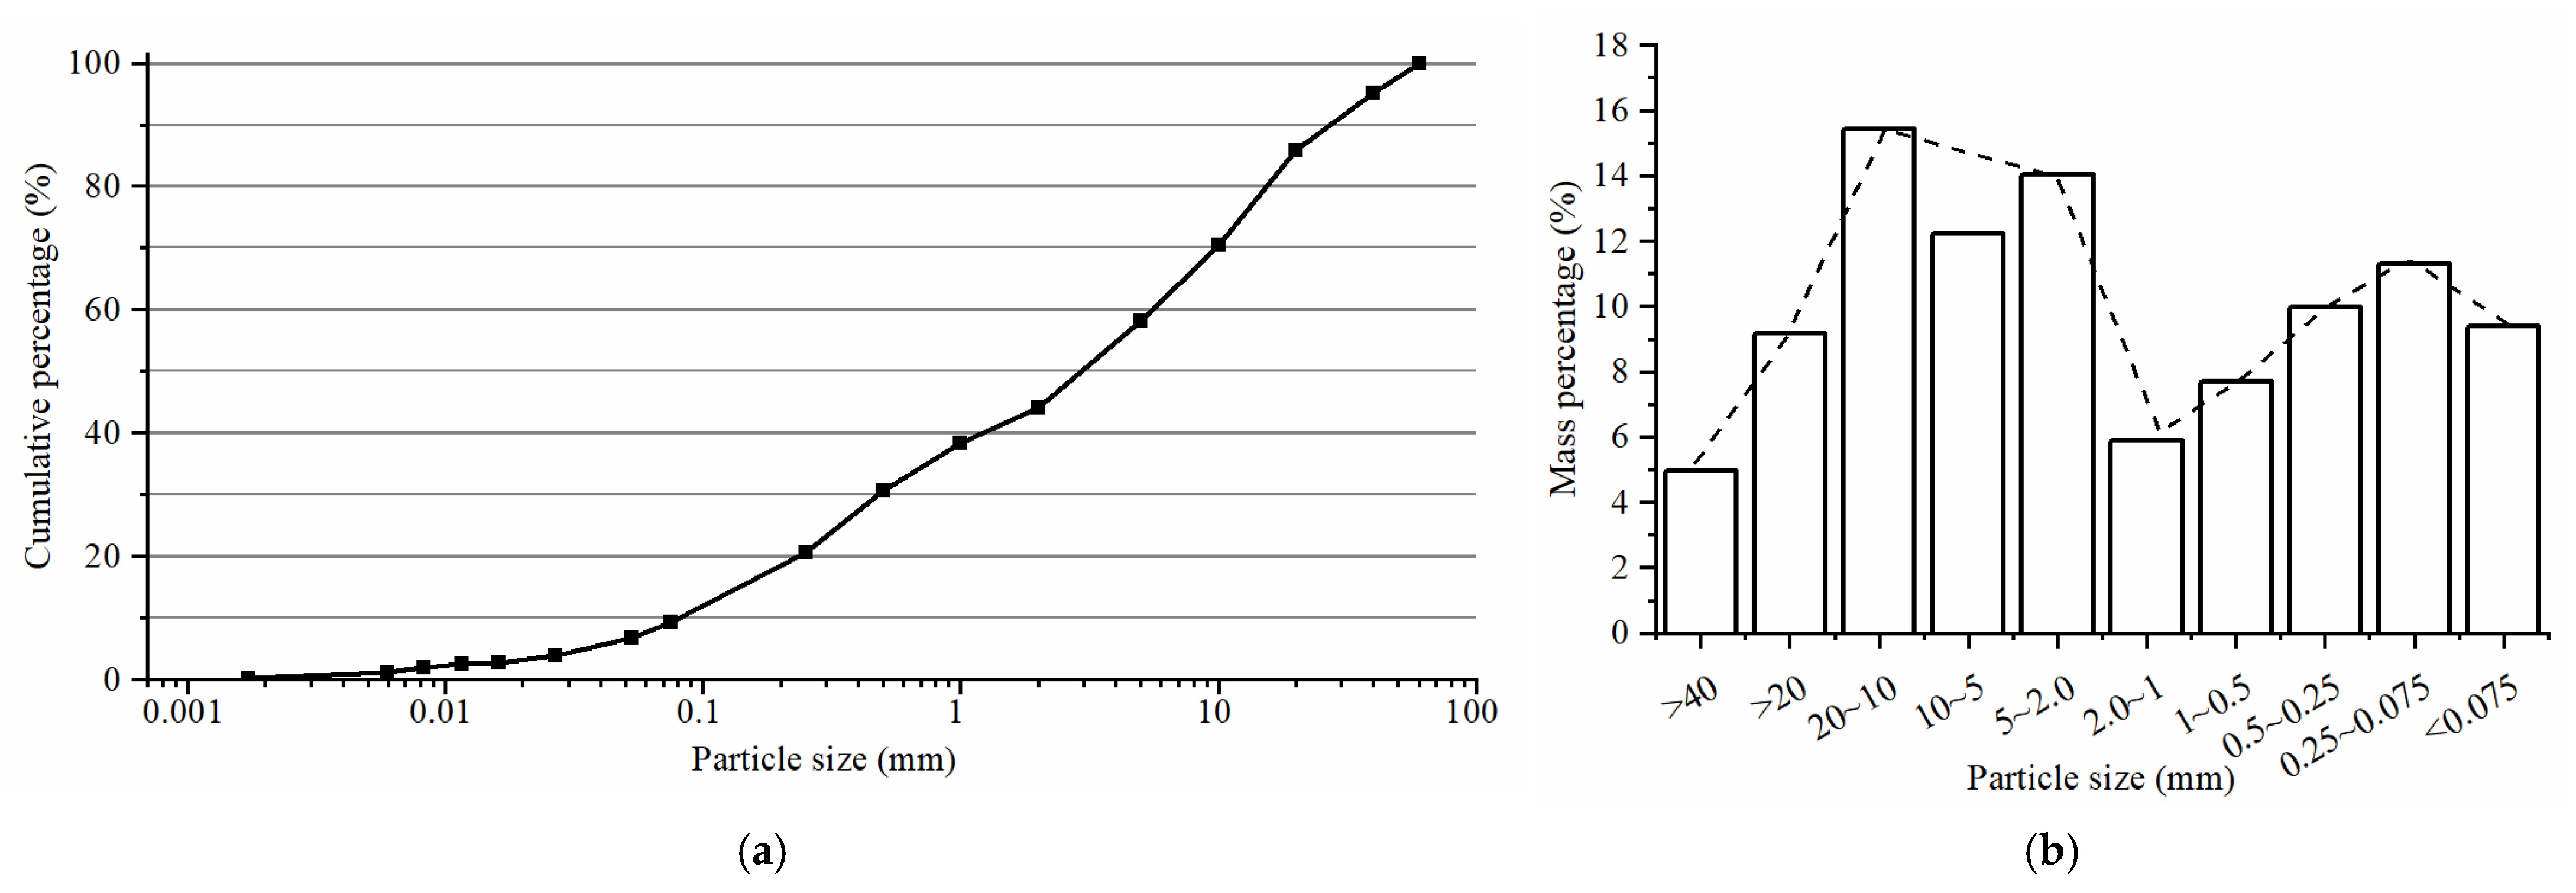
Taking the SRM from Zhaizi village, Lijiang City, Yunnan Province, China, as an example [44], field investigation and sampling were undertaken (Figure 1). Through laboratory particle-size analysis of a typical SRM sample with the maximum particle size of 60 mm, the particle size distribution was obtained (Figure 2a), and its equivalent histogram was plotted (Figure 2b). The statistical results show that the particle-size curves of SRM in this area are bimodal, indicating that the material is well sorted. The particle size corresponding to the trough is about 2 mm, and the threshold between the soil and the rock block of the SRM in this area is determined to be 2 mm.
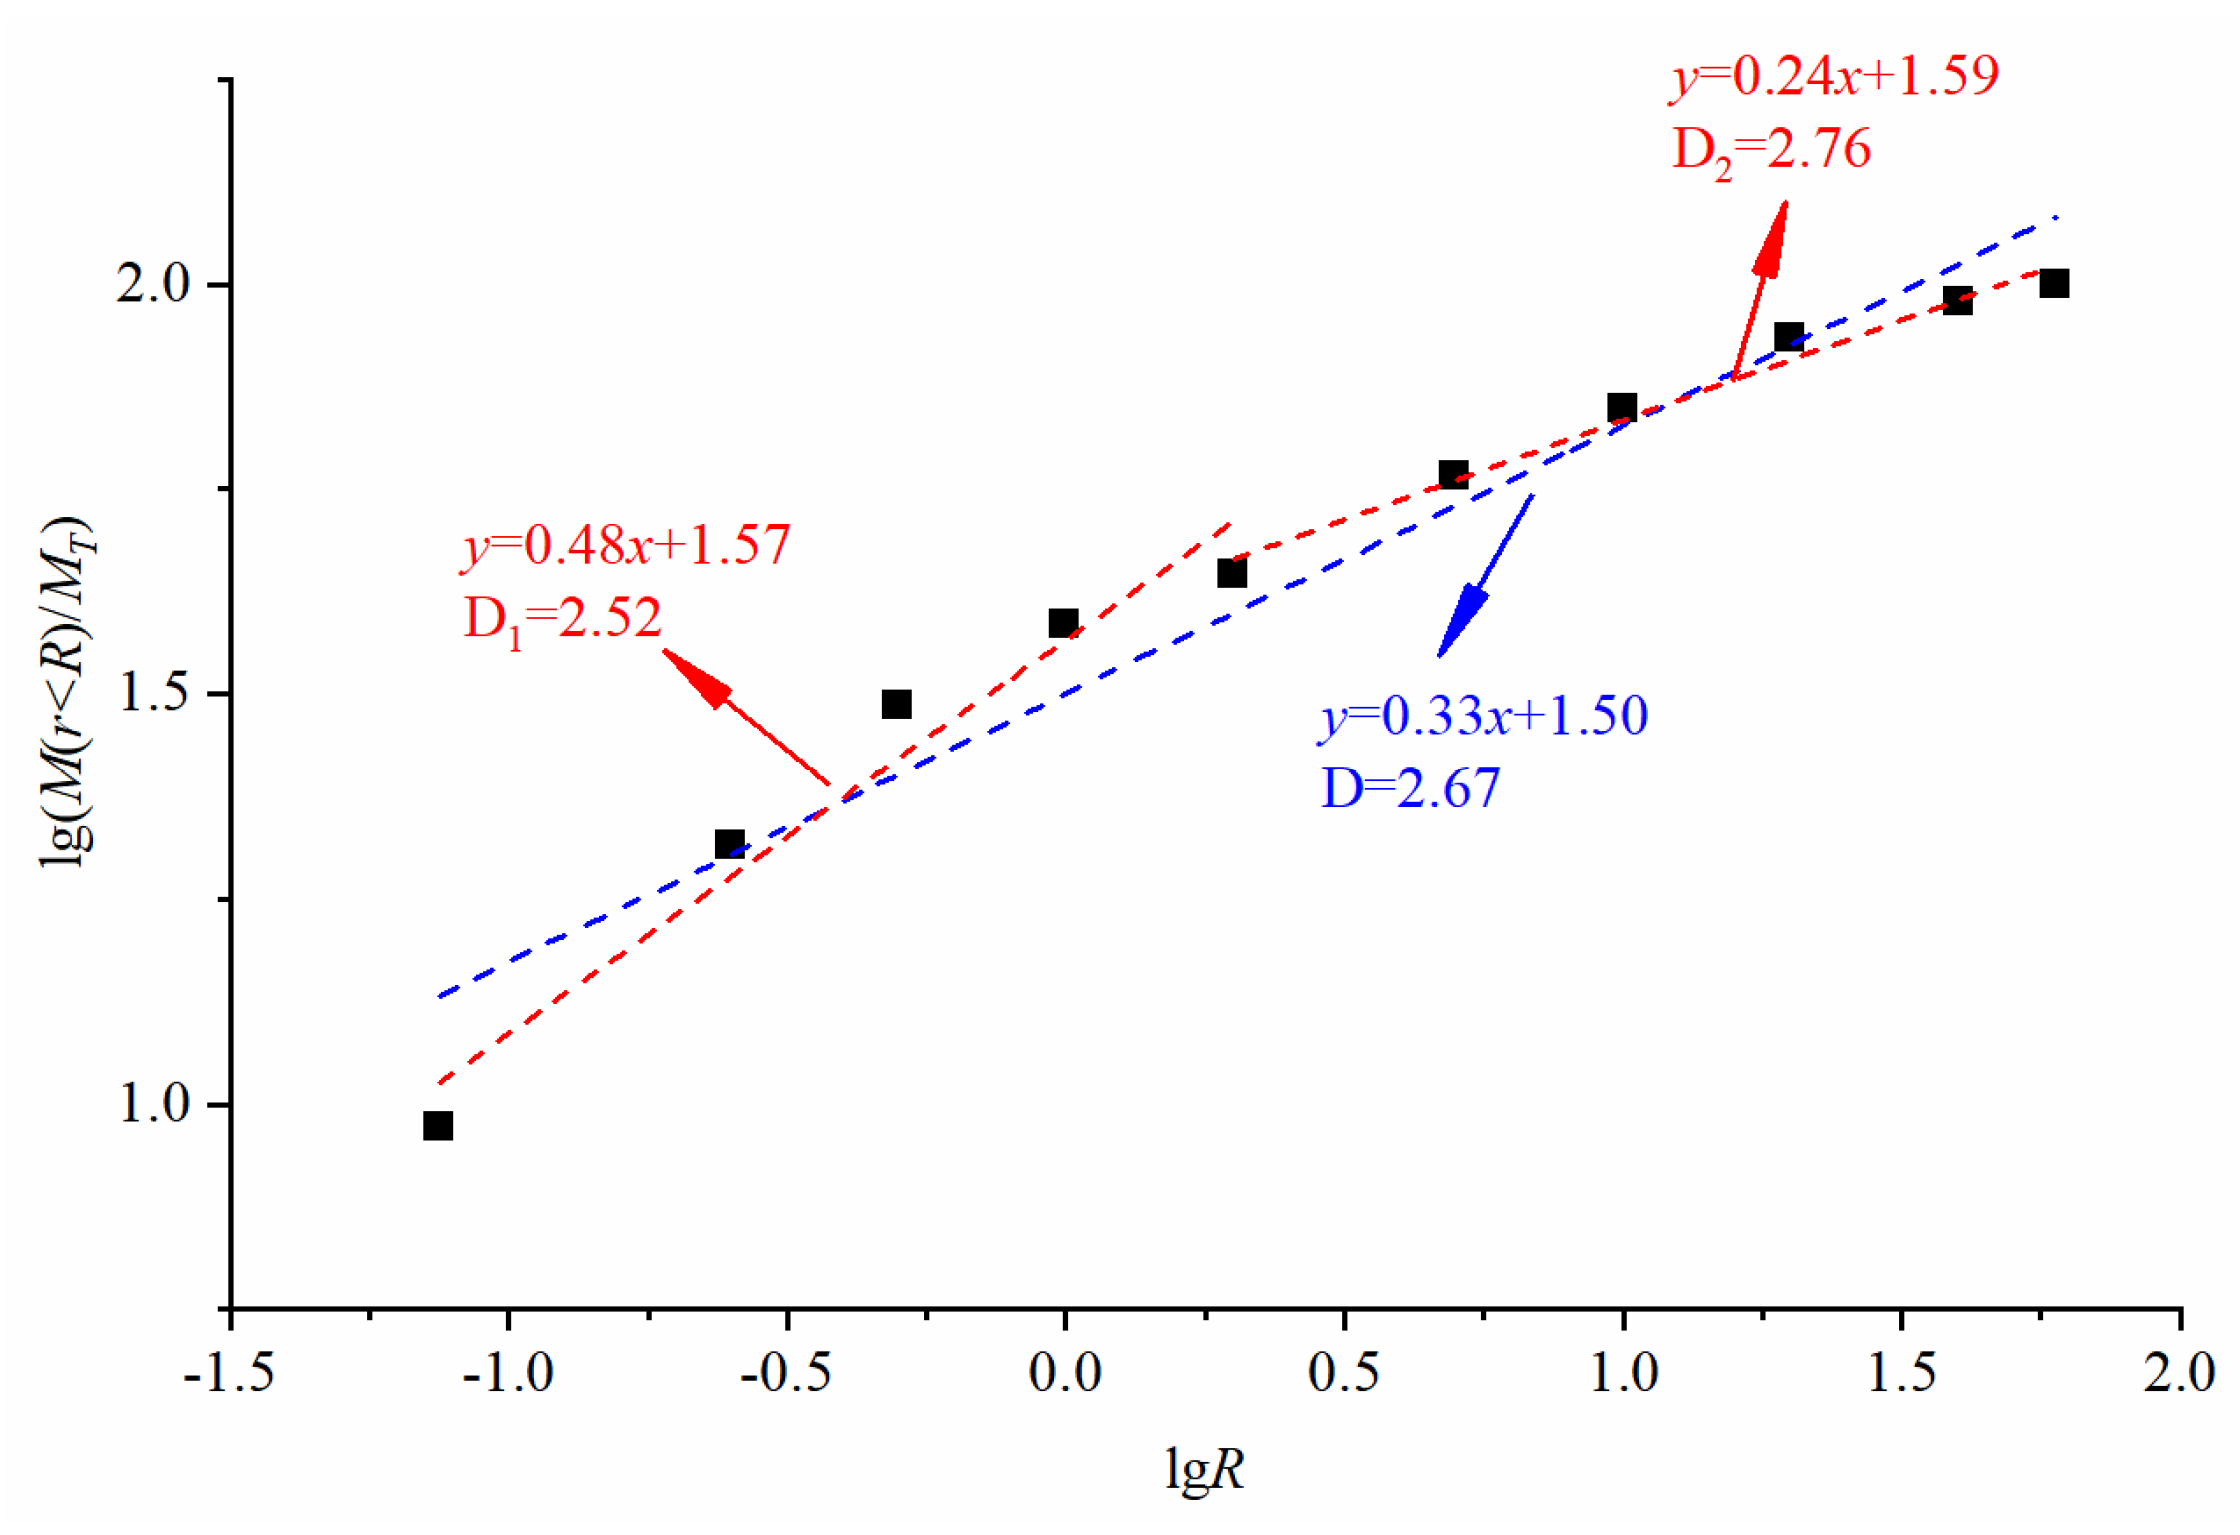
Formula (6) was used to process the particle-size-distribution data. The screening results were brought into the fractal mathematical model, and the relationship between lg (M(r < R)/MT and lg R was plotted in the double-logarithmic coordinate system (Figure 3). The results show that the relationship curve is approximately linear, indicating that the particle size of SRM in this area has a fractal structure. The fractal-curve-fitting formula of the overall grading is y = 0.33x + 1.50, the slope is 0.327, and the fractal dimension D is 2.67. In addition, it should be noted that the fractal curve does not meet the strict linear relationship within the full particle-size range. A dividing point is found at the particle size r = 2 mm; there is a scale-free interval on both sides, where the fitting formulae are y = 0.48x + 1.57 and y = 0.24x + 1.59 respectively; and the corresponding fractal dimensions are D1 = 2.52 and D2 = 2.76 respectively. These results imply that there is a double-fractal structure in the SRM, with a maximum particle size of 60 mm, meaning that the particle size and pore structure change at 2 mm. Thus, through fractal analysis of particle distribution of this SRM, the threshold between soil and rock blocks in the SRM in this area is found to be 2 mm, which is consistent with the results of laboratory grading.
3. Predictive Theory
3.1. Relative Threshold between Soil and Rock Blocks
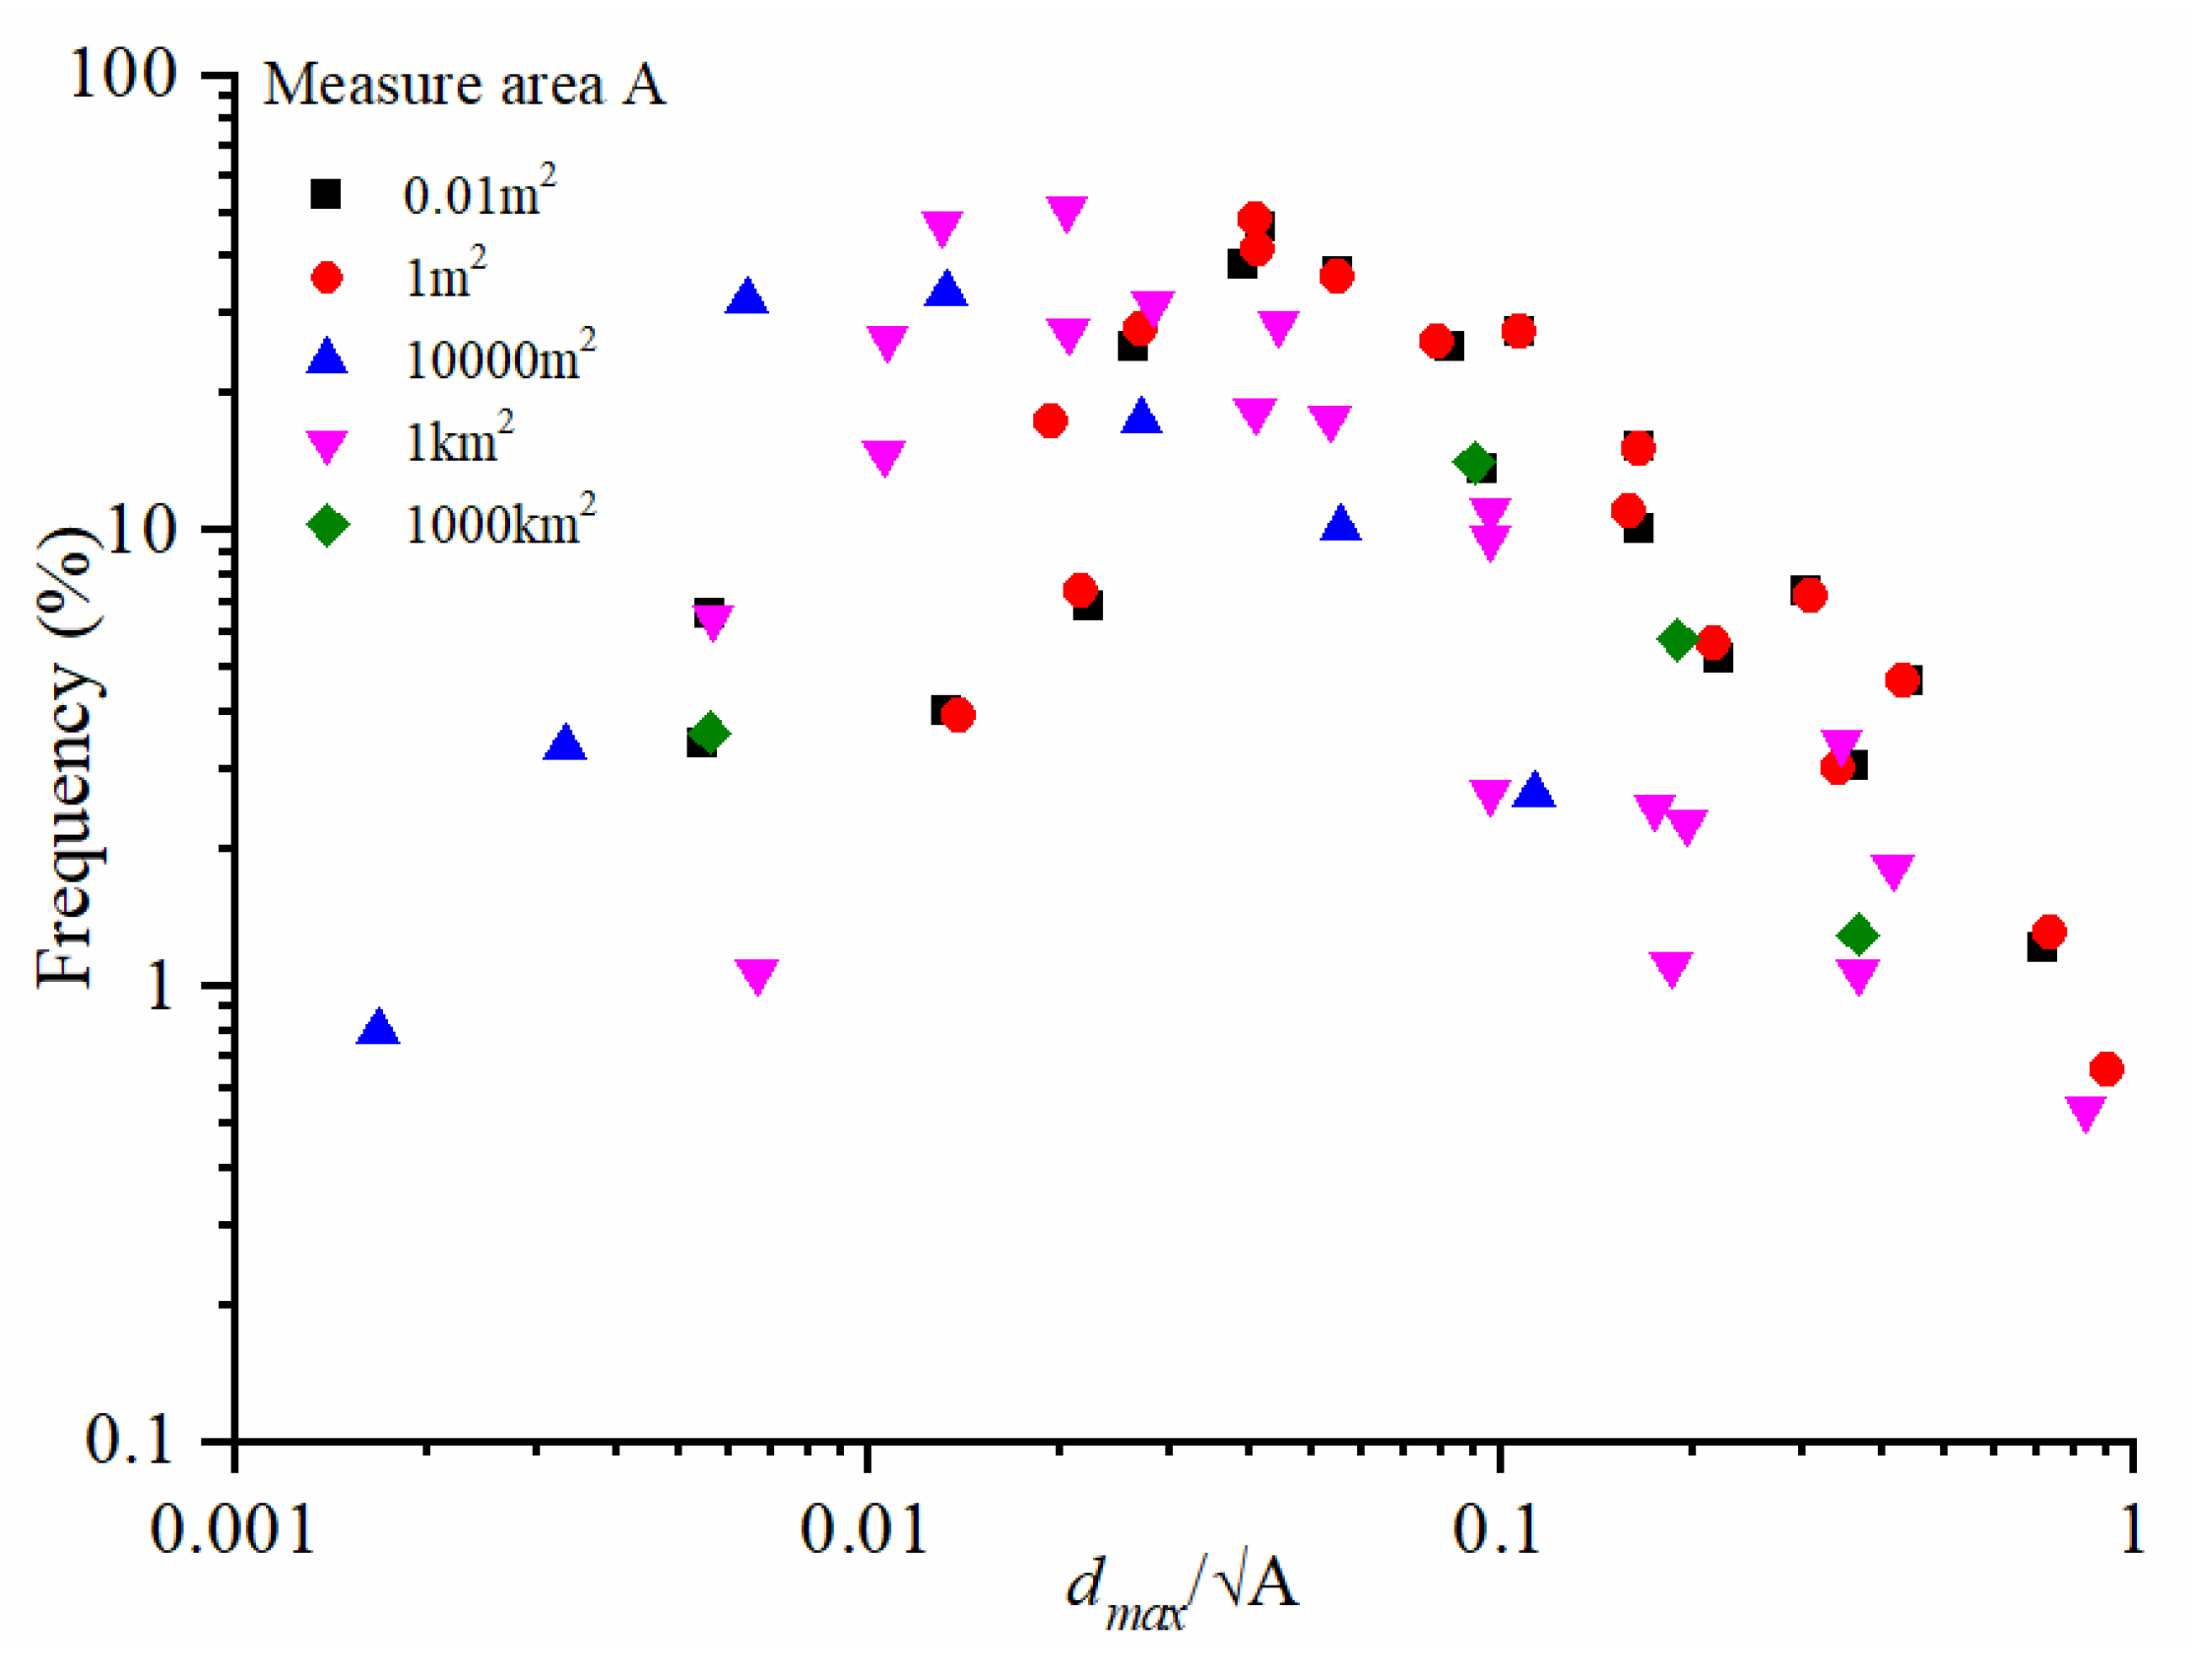
After analyzing the particle distribution characteristics of an SRM, Medley [2] and Lindquist [4] found that the particle distribution of SRM exhibits proportion-independence. As shown in Figure 4, even if the study area changes, when the particle size of SRM is 0.05 times the study area, the fractal dimension of particle size will always contain a turning point. According to this understanding, it is considered that the threshold between soil and rock blocks of SRM at the engineering scale should satisfy Formula (7):
where denotes the threshold between soil and rock blocks; and Lc is the engineering scale that, being the square root of the area for the plane study area, is the slope height for a slope, and it is the height of a single shear box for the direct shear sample.
This threshold definition method sets the soil and rock blocks in an SRM as a relative concept; across different research scales, the SRM from the same source may have different thresholds of coarse and fine-particle size. Therefore, this definition is called the relative threshold between soil and rock blocks, which is different from the limiting values of particle size divided by particle group defined in prevailing national standards [8]. The relative threshold links the particle gradation of SRM at different research scales by the proportion of rock blocks, which can directly expand the mechanical properties of SRM at test scale to engineering at full-scale.
3.2. Prediction of Particle Gradation Curves at Different Scales
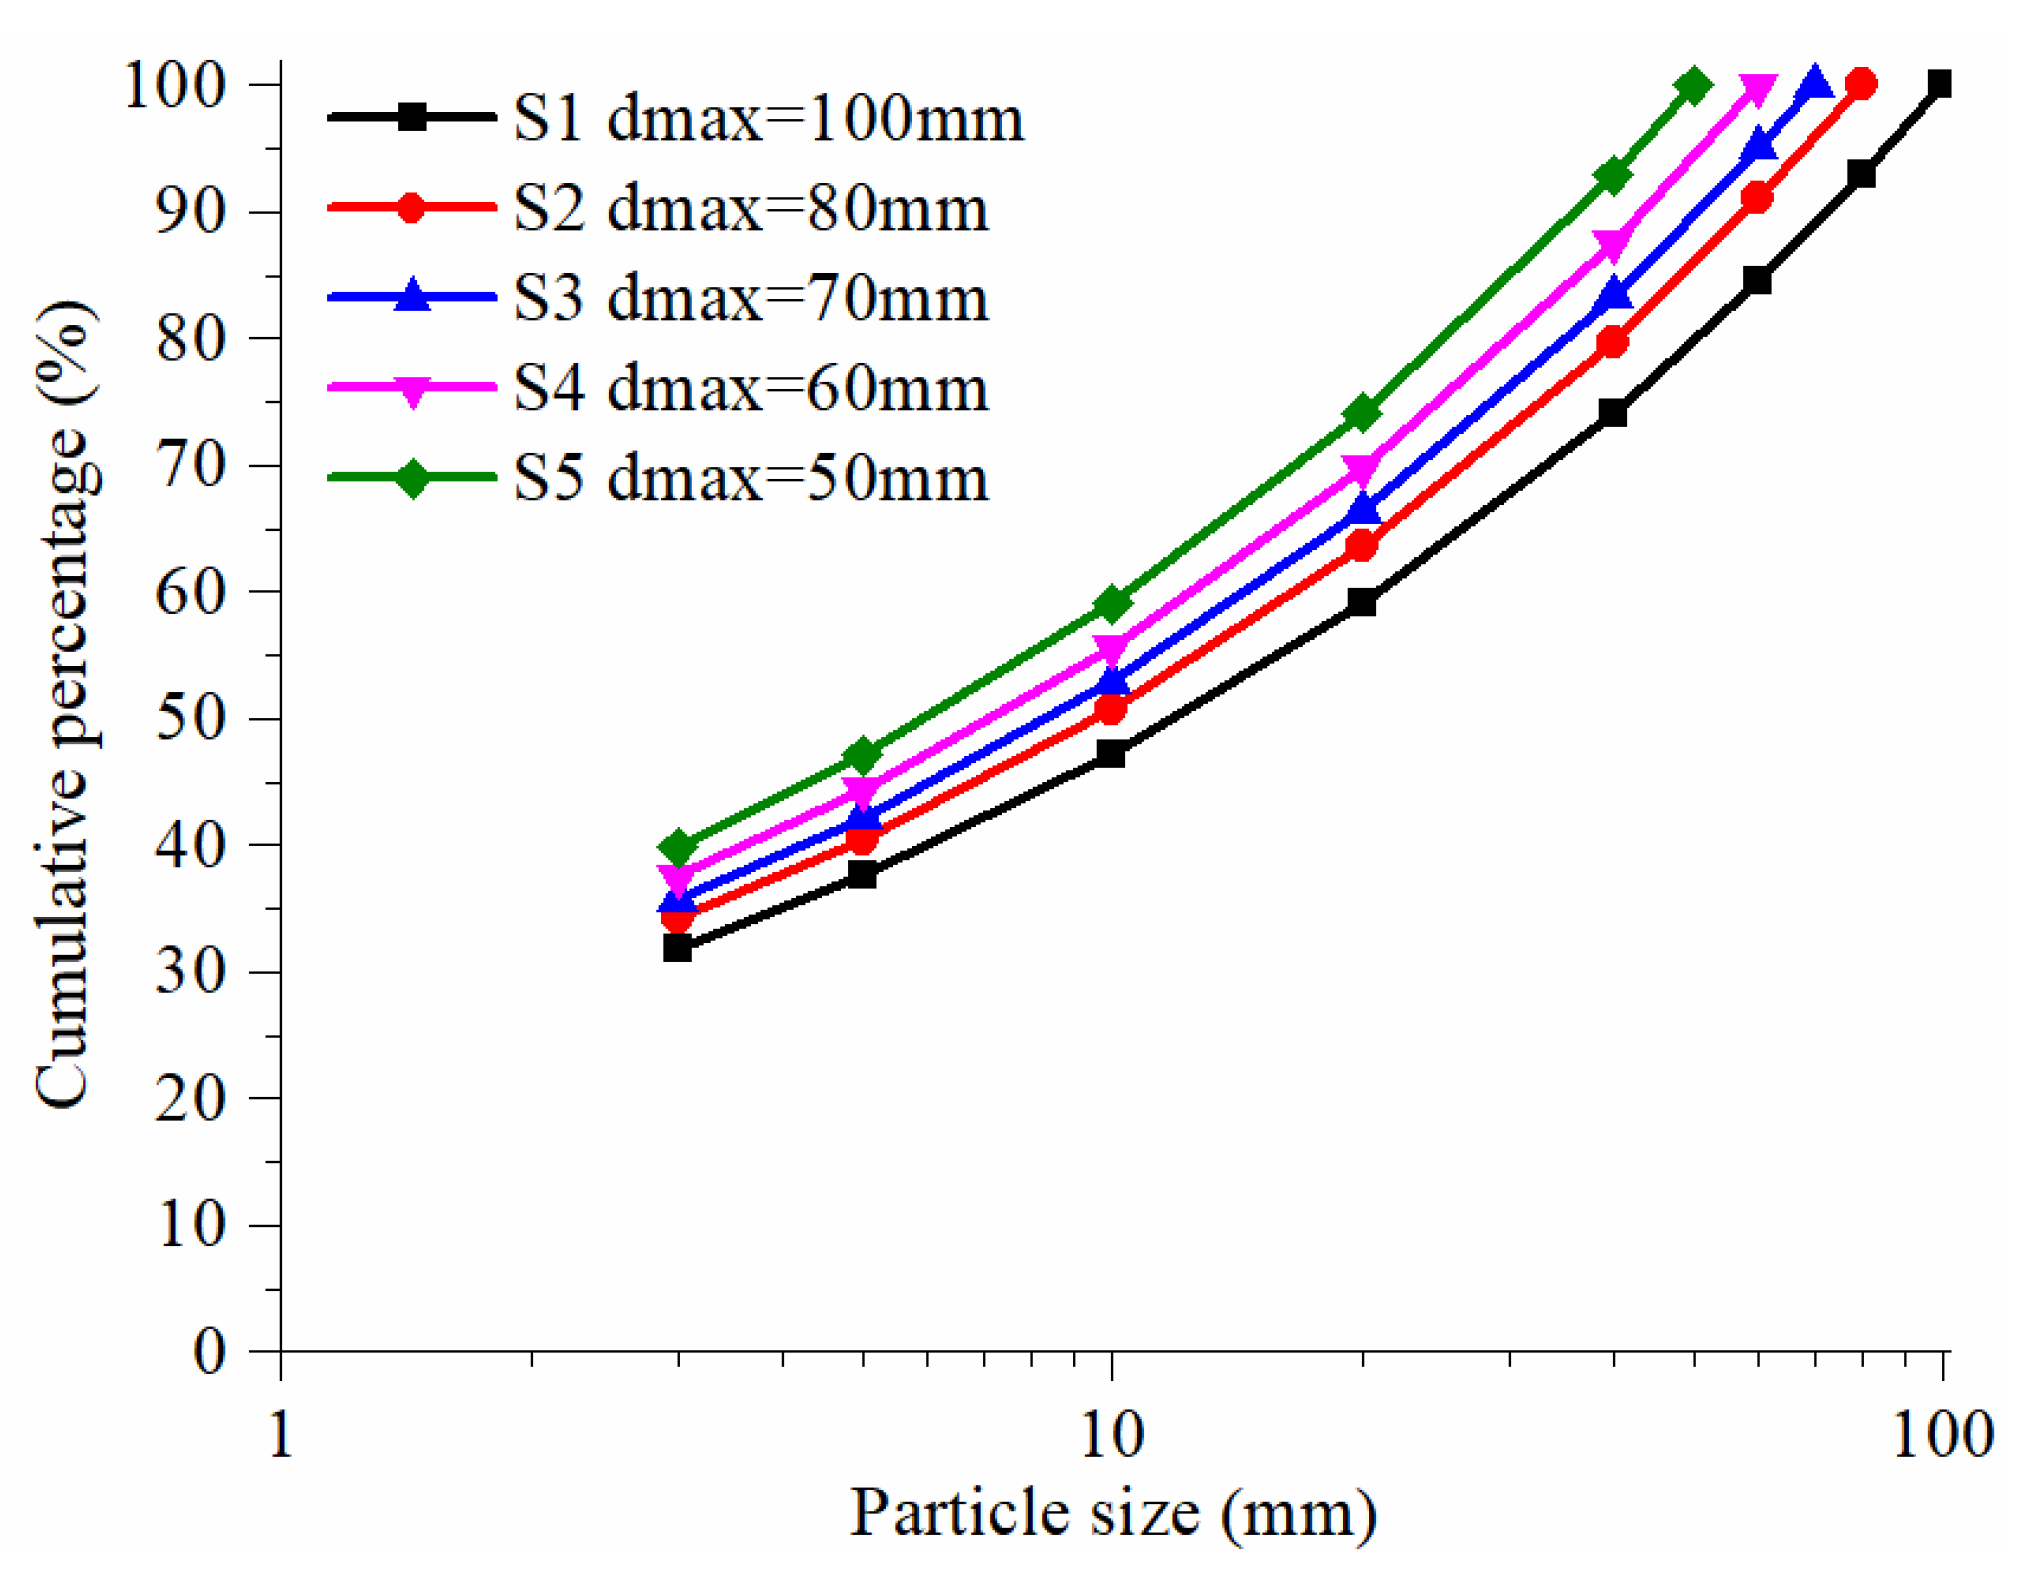
Since the particle gradation of SRM has a fractal structure, using the concepts of fractal dimension and the relative diameter threshold between soil and rock blocks, we can calculate the distribution of particle groups after the maximum particle size increases according to the existing gradation: the particle gradations of SRMs at different scales are thus obtained. Taking SRM in Zhaizi village as an example (Figure 3), the fractal dimension is 2.67. According to geological drilling data, the range of rock block sizes in the SRM is between 30 and 90 mm. For a given maximum particle diameter (dmax), substituting the fractal dimension 2.67 into Formula (6), the particle gradation of the SRM sample can be predicted. Figure 5 shows the predicted particle gradation of SRM samples with different dmax, including 100, 80, 70, 60, and 50 mm (labeled S1 to S5, respectively). Since tested particle gradation with the maximum particle size of 60 mm is obtained as shown in Figure 2a, the comparison between the tested particle gradation and predicted particle gradation can be performed. Taking 2 mm as the threshold between soil and rock blocks, we see that the result shows that the rock-block content of the predicted particle grading is about 62.46%, while the rock-block content of the tested particle gradation is 55.8%, so both are close to 60%. Therefore, the accuracy of the predicted particle grading curve is acceptable.
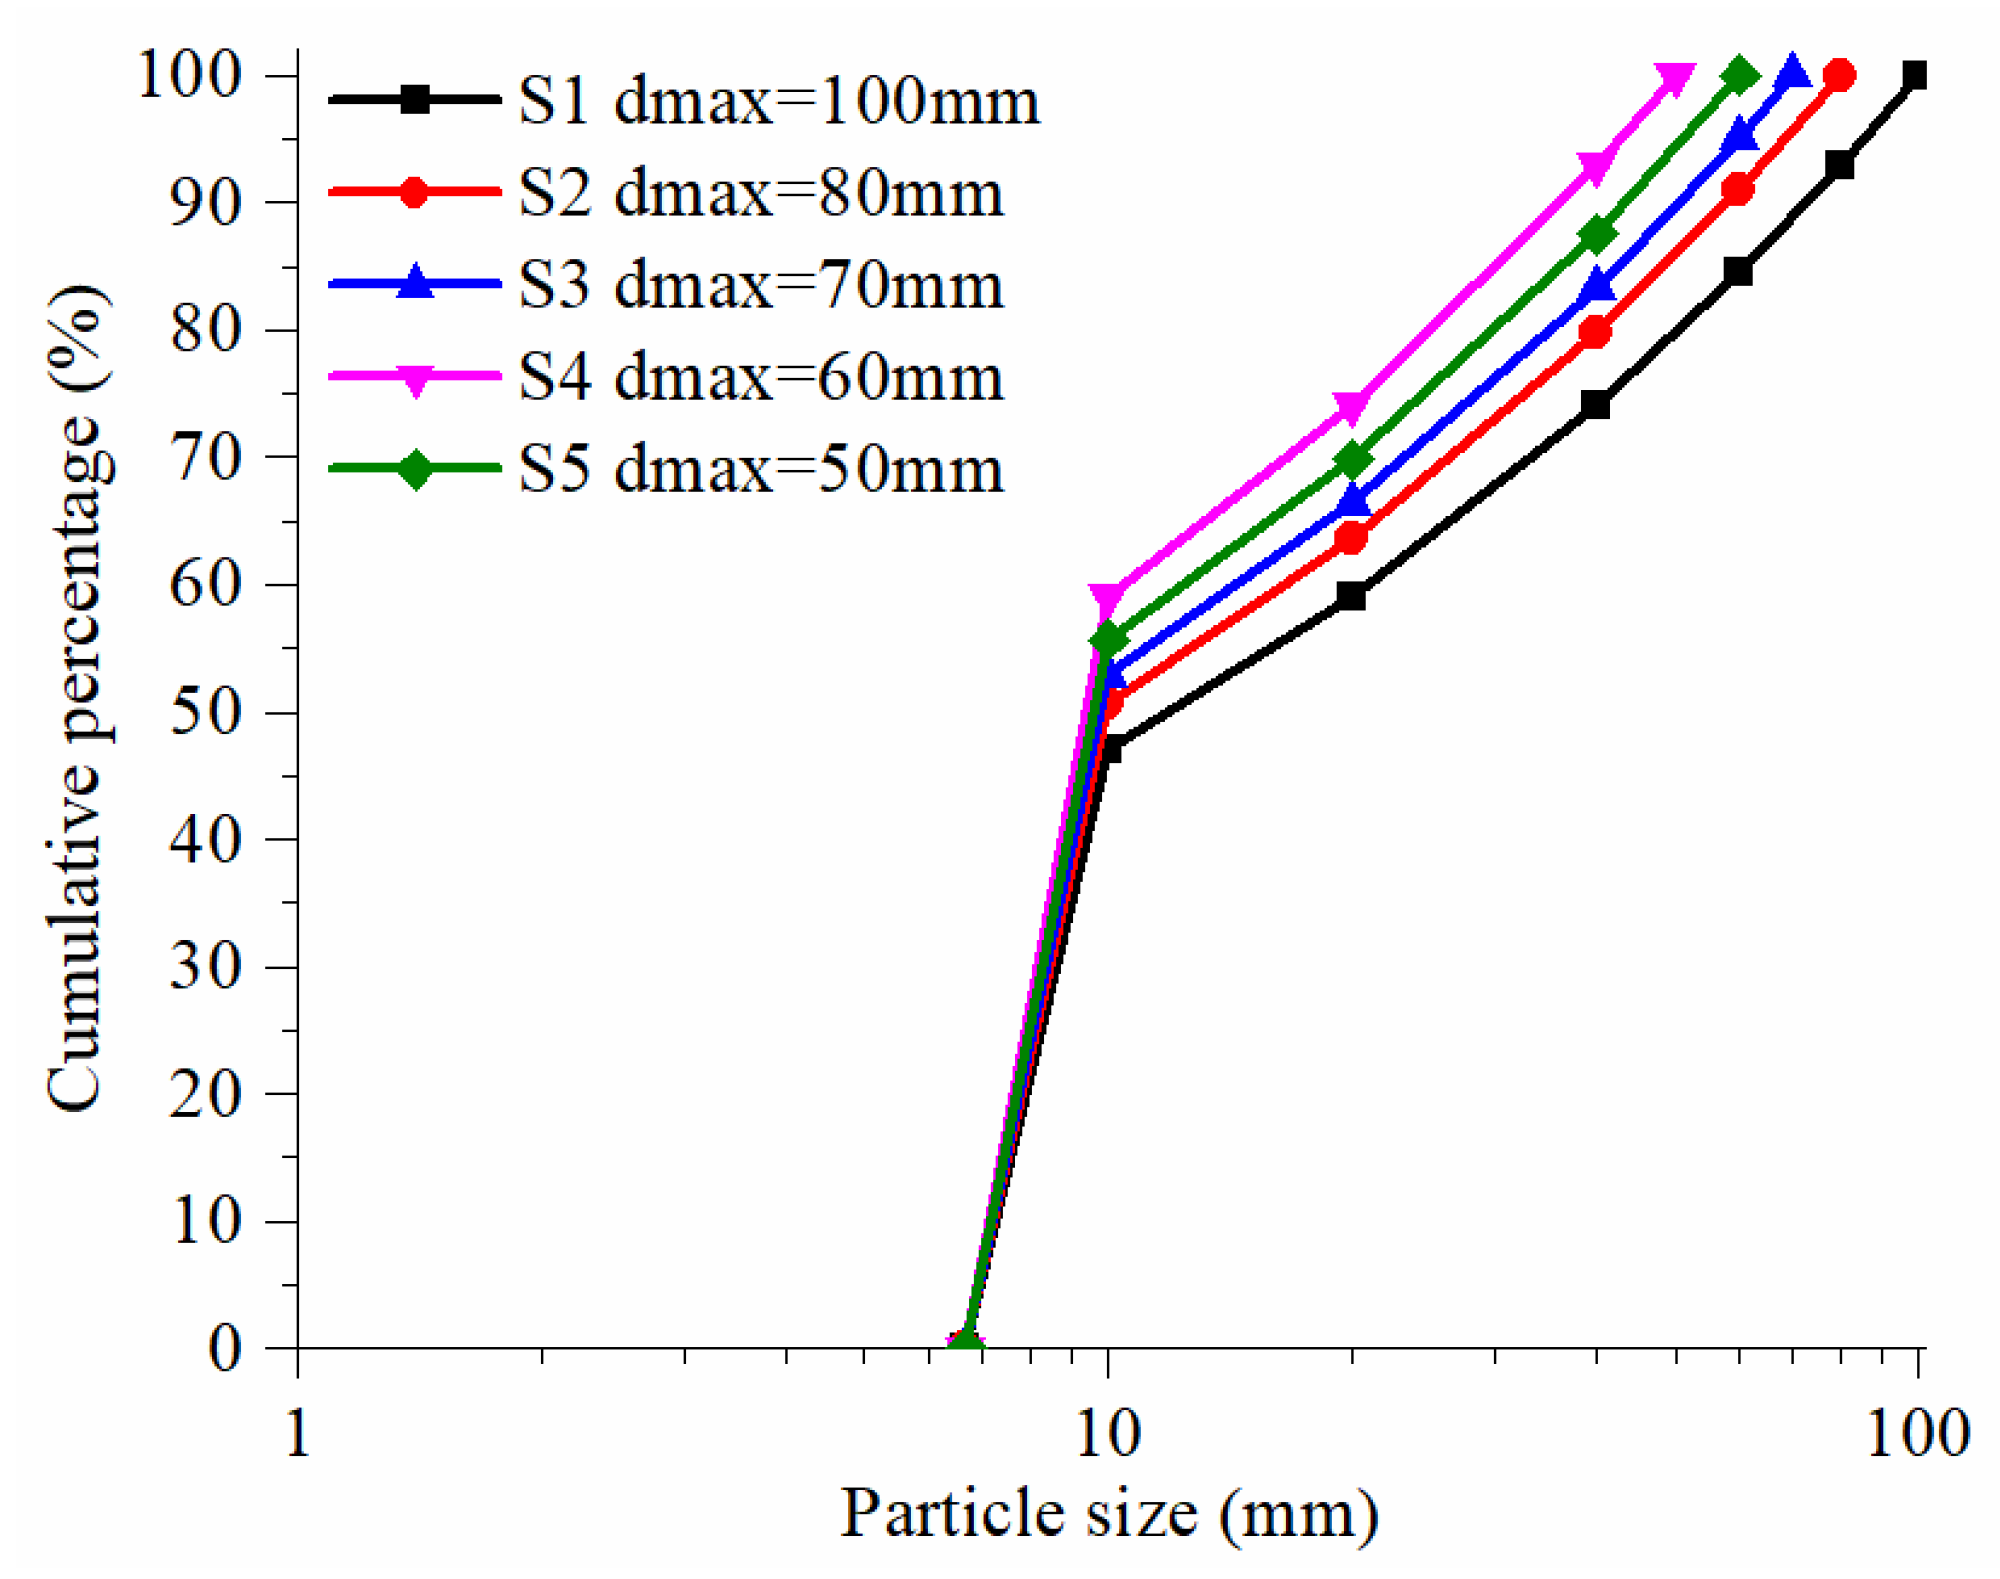
Then, according to the research scale, based on the particle size distribution in Figure 5, the gradation is modified by using the relative threshold between soil and rock blocks. In the following section of this study, we recount the numerical simulation of direct shear testing of SRM samples at different scales that were conducted, making it necessary to establish numerical models with different maximum particle diameters. Taking this scale as an example, we see that the size of the shear box used in the test is 500 mm (length) × 200 mm (height). According to Formula (7), the research scale Lc is the height of the shear box (200 mm), and the limit particle size of particles should be set to 10 mm. In addition, for a numerical model, the influences of the minimum particle size on the test results should also be considered [45]. Commonly, the particle size range of soil particles is 2 to 3 mm in numerically simulated direct shear tests. If the ratio of the maximum particle size to the minimum particle size remains unchanged at 1.5, the range of soil-particle size after modifying the threshold should be 6.66 to 10 mm. The particle gradation of rock-block particles larger than 10 mm remains the same (Figure 5), and the size of particles less than 10 mm should be corrected. Figure 6 shows the modified particle distributions of SRM samples with different maximum particle diameters.
4. Simulation Method
4.1. Simulation of Large-Scale Direct Shear Tests of SRM
During laboratory large-scale direct shear testing, the SRM sample needs to be encapsulated in an opaque shear box, so the movement of the particles in the sample cannot be seen [46]. The numerical simulation using particle flow code (PFC) based on DEM can overcome this problem [47]. The particle DEM proposed by Cundall [48] uses the rigid particle as the basic calculation element. In the calculation process, particle DEM continuously updates the contact characteristics between particle and particle or particle and boundary; based on Newton’s second law, it uses the explicit difference algorithm for iteratively solving the motion parameters of particle elements, and finally makes each particle element reach an equilibrium state. In this study, PFC2D [49] is used to simulate direct shear tests.
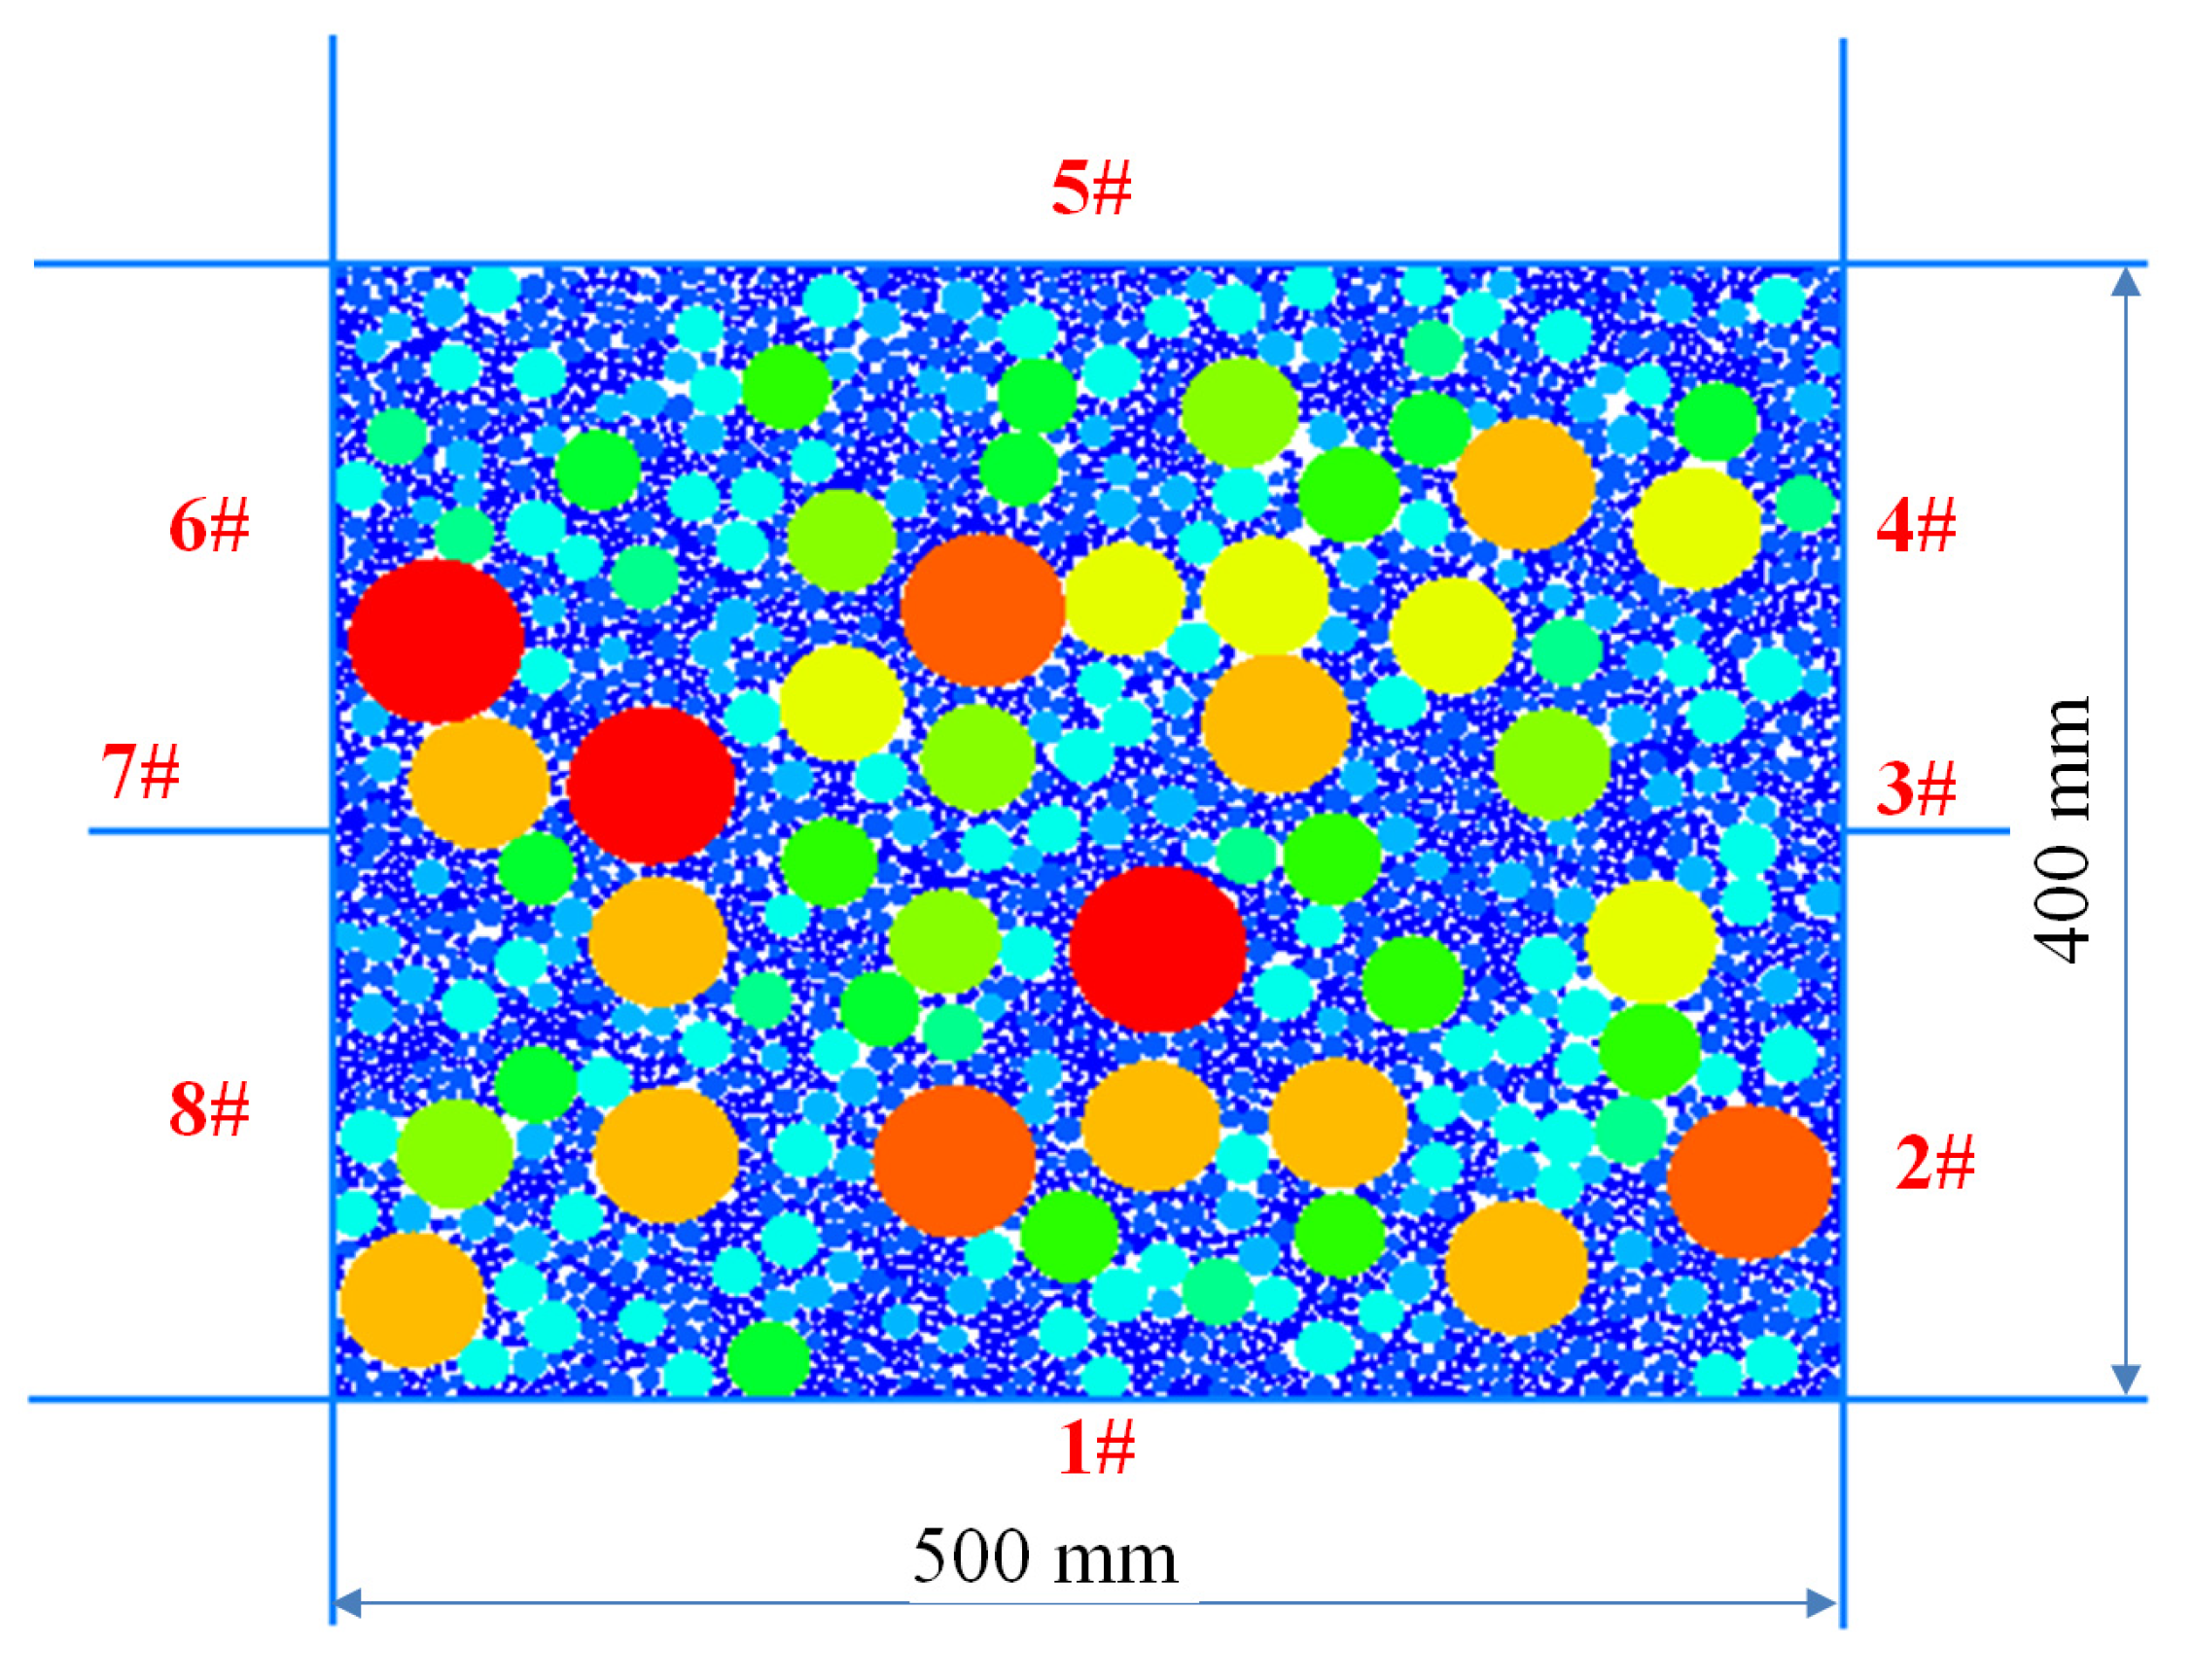
Before the simulation, it is necessary to build the particle flow model of SRM by wall element and particle element in PFC2D. As shown in Figure 7, keeping the same size as the shear box as used in the laboratory, we used a simulated shear box representing 500 mm (length) × 200 mm (height). The numerical model is divided into upper and lower halves: the upper half is composed of Walls 4, 5, and 6, and the lower half of Walls 1, 2, and 8. To prevent particles from escaping during shearing, Walls 3 and 7 are set on both sides of the shear box. During simulated shear, normal stress is applied to Wall 5 and the vertical load is kept stable, the upper shear box is fixed, and the same horizontal velocity is applied to the lower shear box wall; in addition, Wall 7 and the lower shear box move together, and Wall 3 remains fixed to avoid a loss of particles during shearing.
When building the particle model of SRM, due to the limited shape indices pertaining to the rock block, both rock and soil particles are simulated by traditional disk particles in PFC2D. According to particle size distributions of SRM samples in Figure 6, the random generation algorithm provided in the PFC2D is used for producing disk particles, and the target number of elements is generated by setting the maximum and minimum particle sizes and the target void ratio. To make the size of each particle group more consistent with the fractal law of particle gradation of SRM, the volume content of the rock block of each particle group is determined by using Formula (8), and then the volume content provided in PFC2D is employed to produce each particle group.
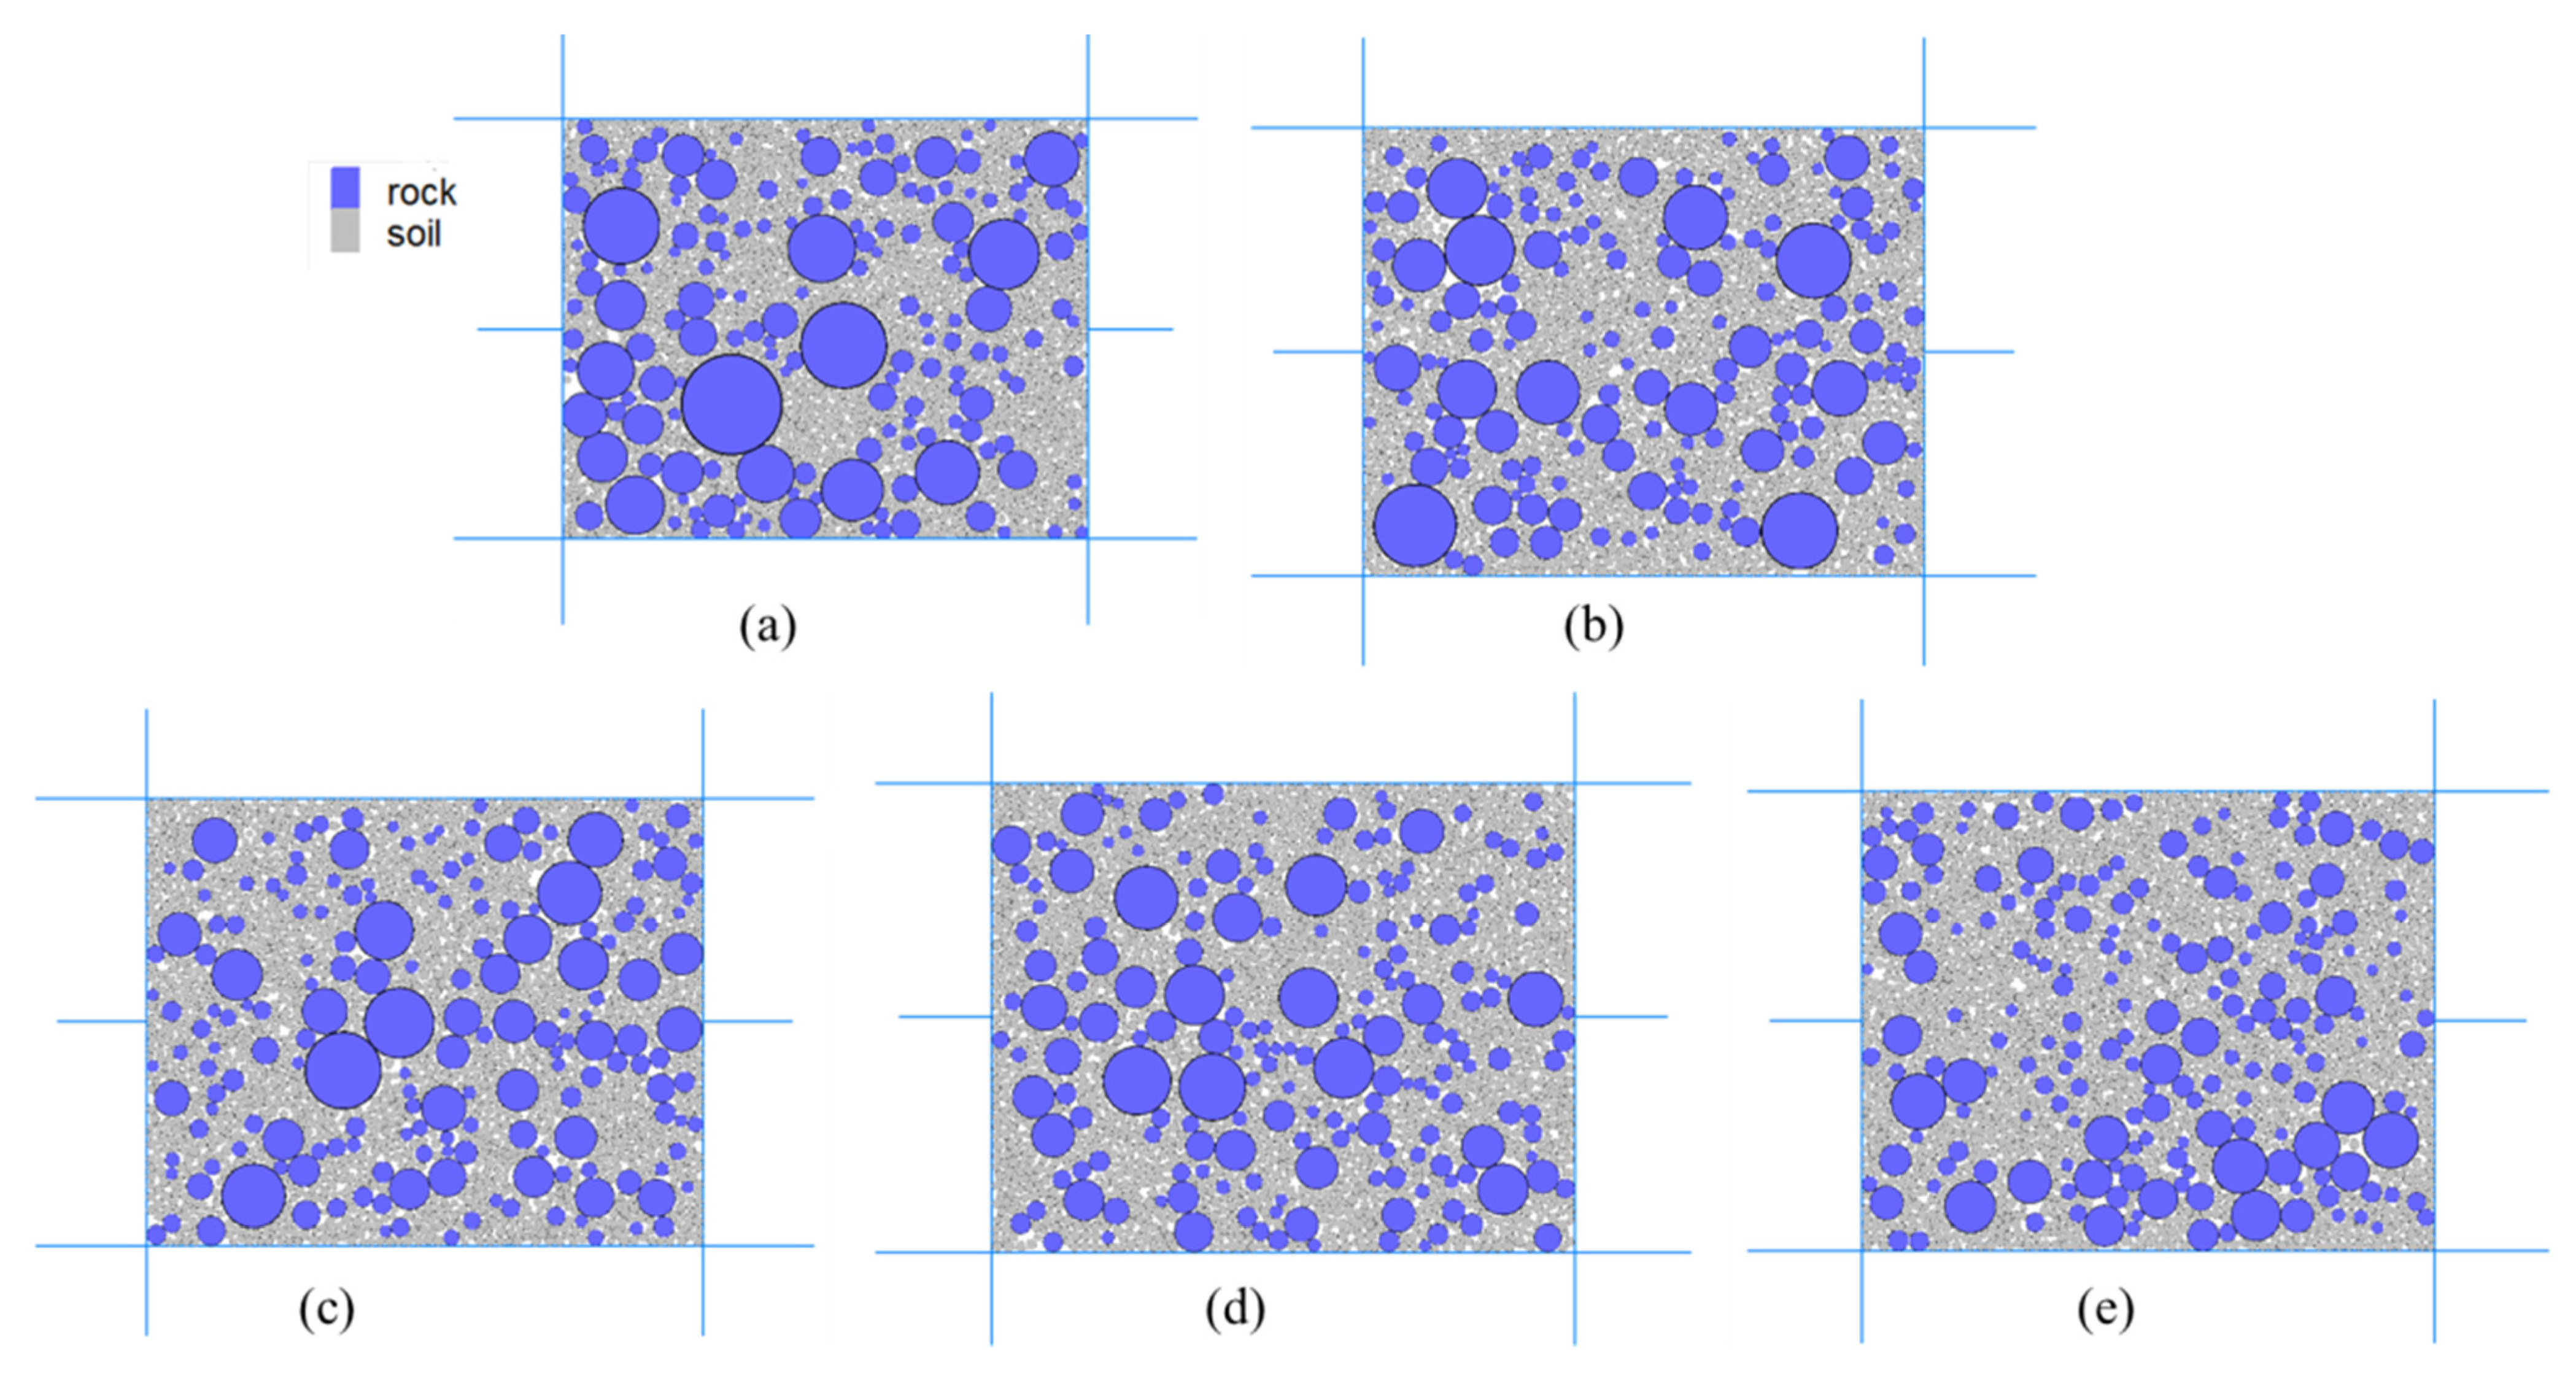
Figure 8 shows the particle models of SRM samples with different maximum particle diameters. For each type of SRM sample, numerical tests under four different normal stresses of 200, 400, 600, and 800 kPa are simulated. When the shear displacement of the SRM sample reaches 75 mm, the test is deemed to be over. The simulations are summarized in Table 1.
4.2. Scale Effect Analysis
4.2.1. Shear Displacement
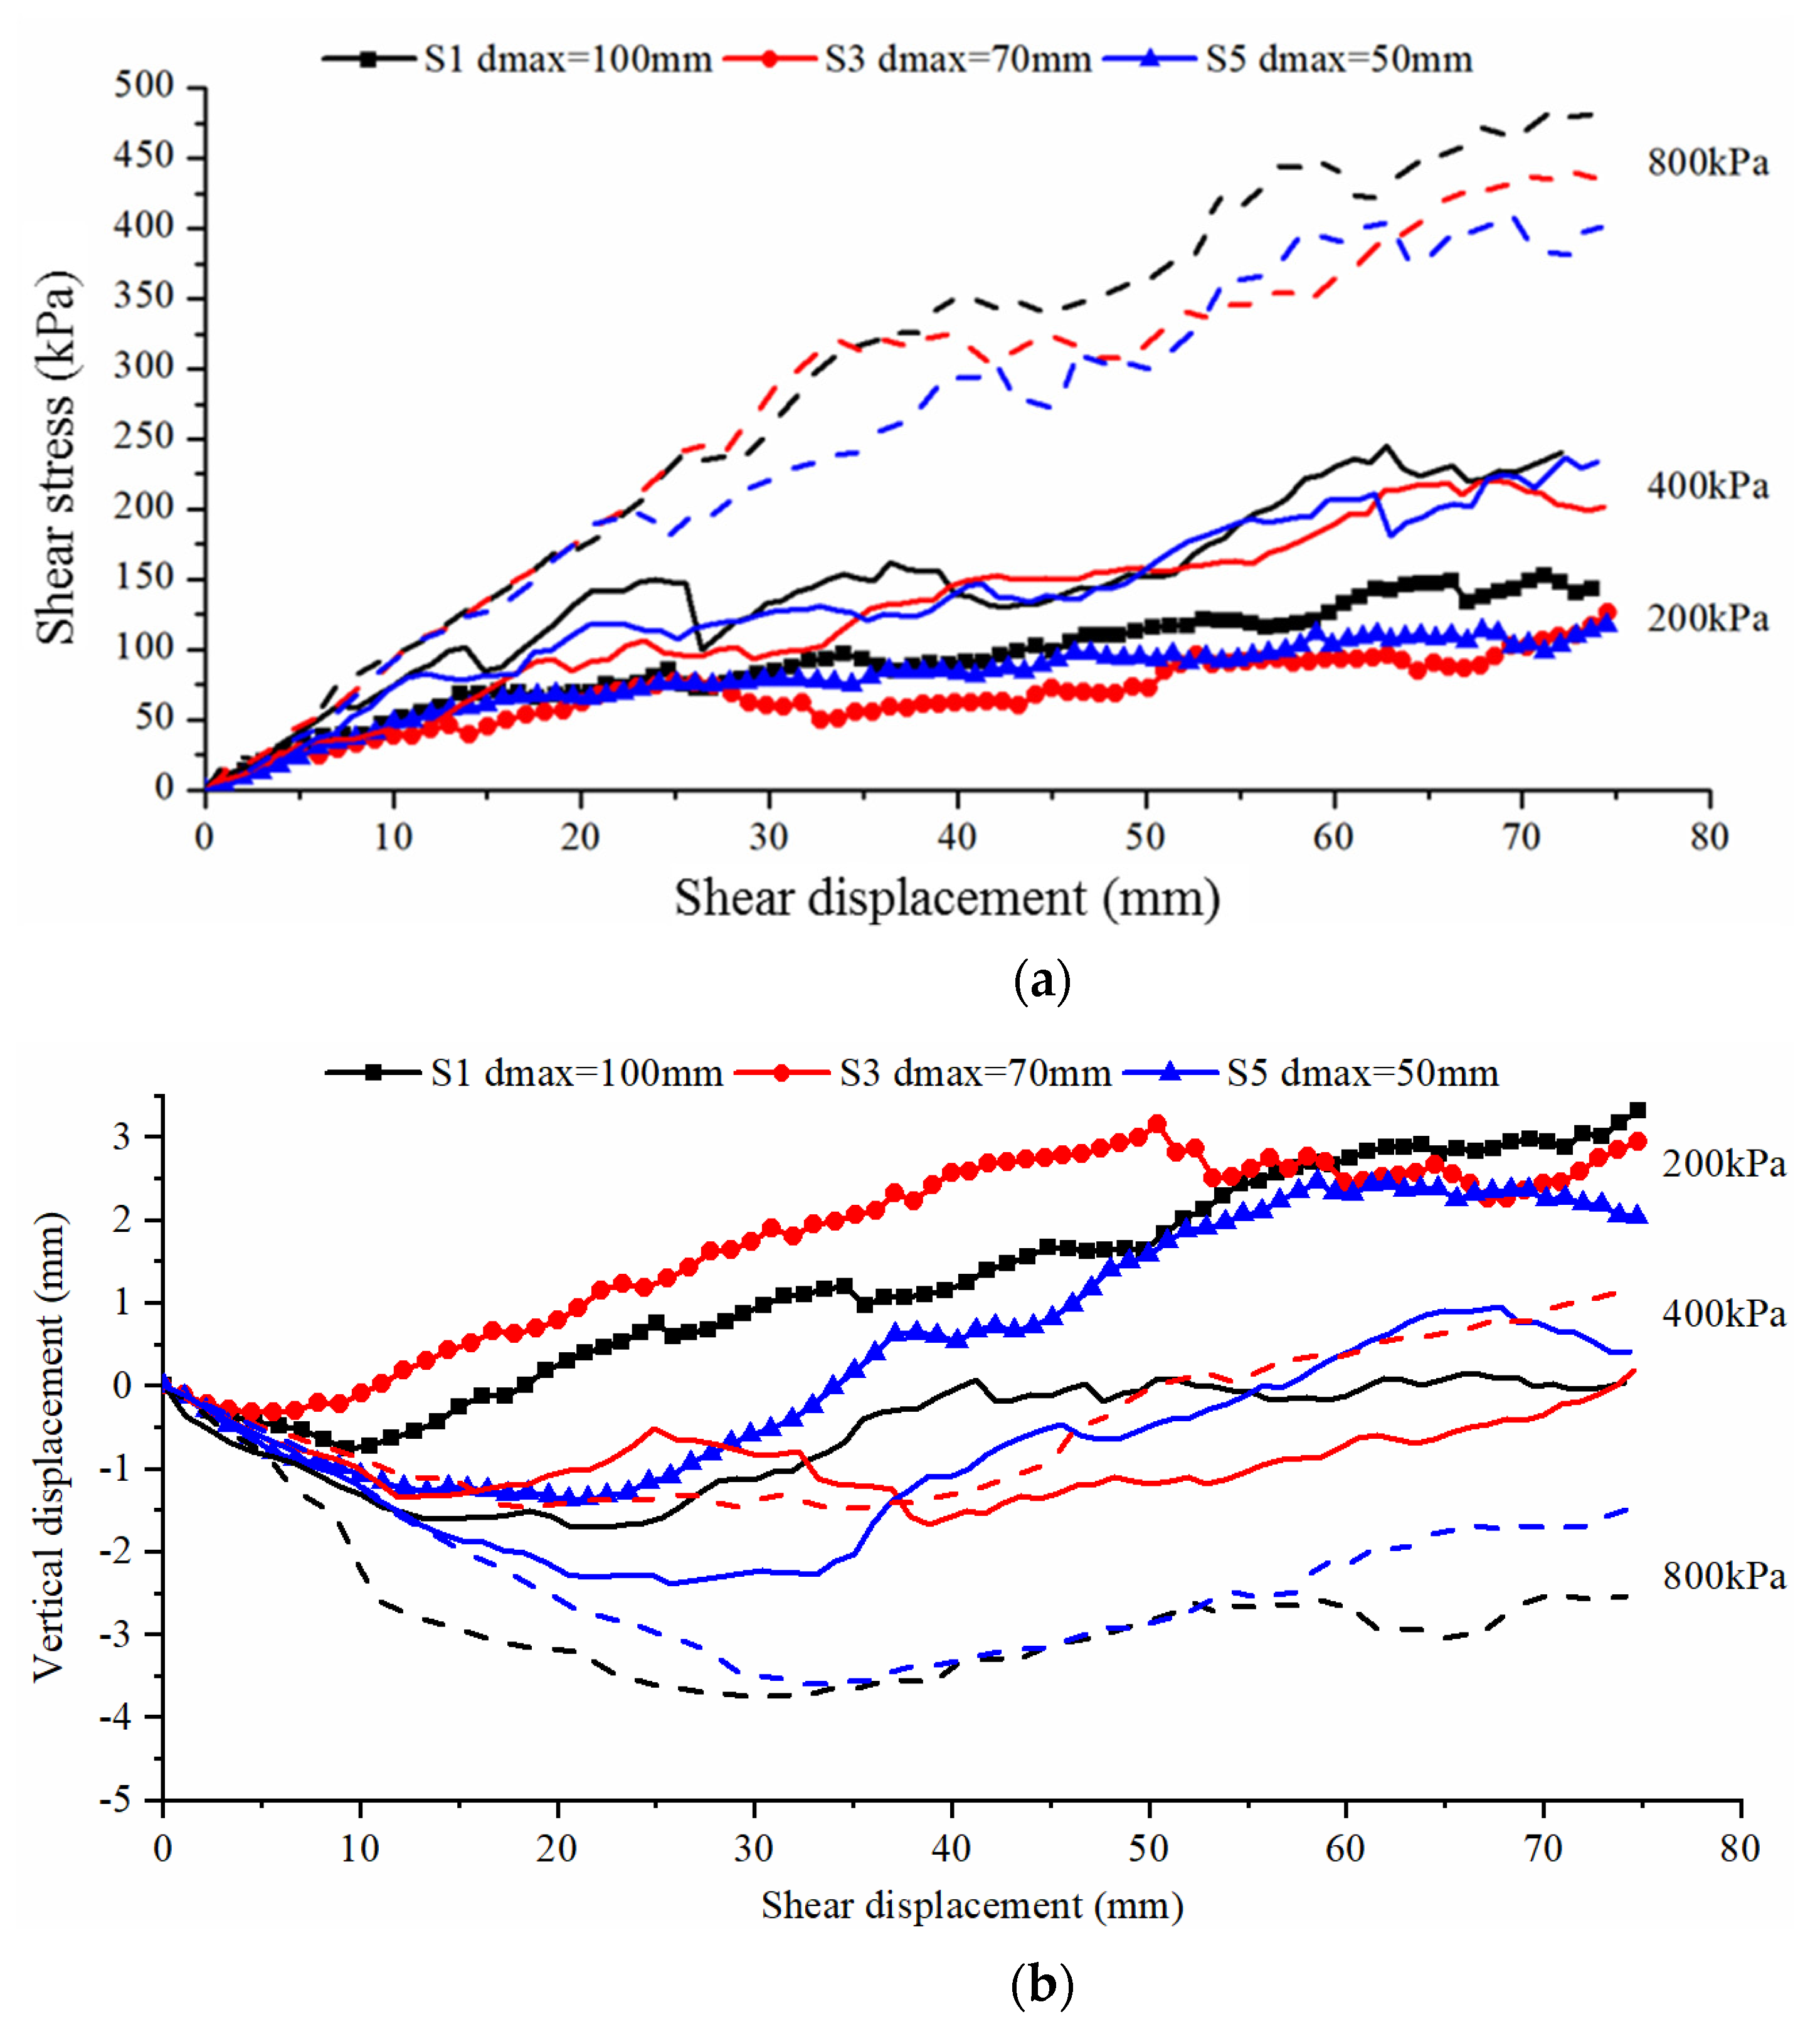
Figure 9a displays the relationship curve between shear stress and shear displacement as simulated. Under normal stress of 800 kPa, the shear stress increases gradually with the increase of the maximum particle size of SRM: for sample S1 (dmax = 100 mm), the peak shear strength is 492 kPa, while for sample S5 (dmax = 50 mm), the peak shear strength is reduced to 403 kPa. Under normal stress of 400 or 200 kPa, the change of maximum particle size has relatively little effect on the shear strength of SRM, thus indicating that, with the decrease of normal stress, the relationship is less affected by the maximum particle size in the SRM sample.
Figure 9b illustrates the relationship between vertical displacement and shear displacement as simulated: under normal stress of 200 kPa, the deformation of the SRM samples is similar, and they all show the characteristics of initial shear shrinkage and dilation; with the increase of dmax, the dilatancy at the end of the test increases. Under normal stress of 800 kPa, the shear shrinkage of sample S1 is obvious and close to that of sample S5, while shear expansion of sample S3 occurs.
4.2.2. Shear Zone
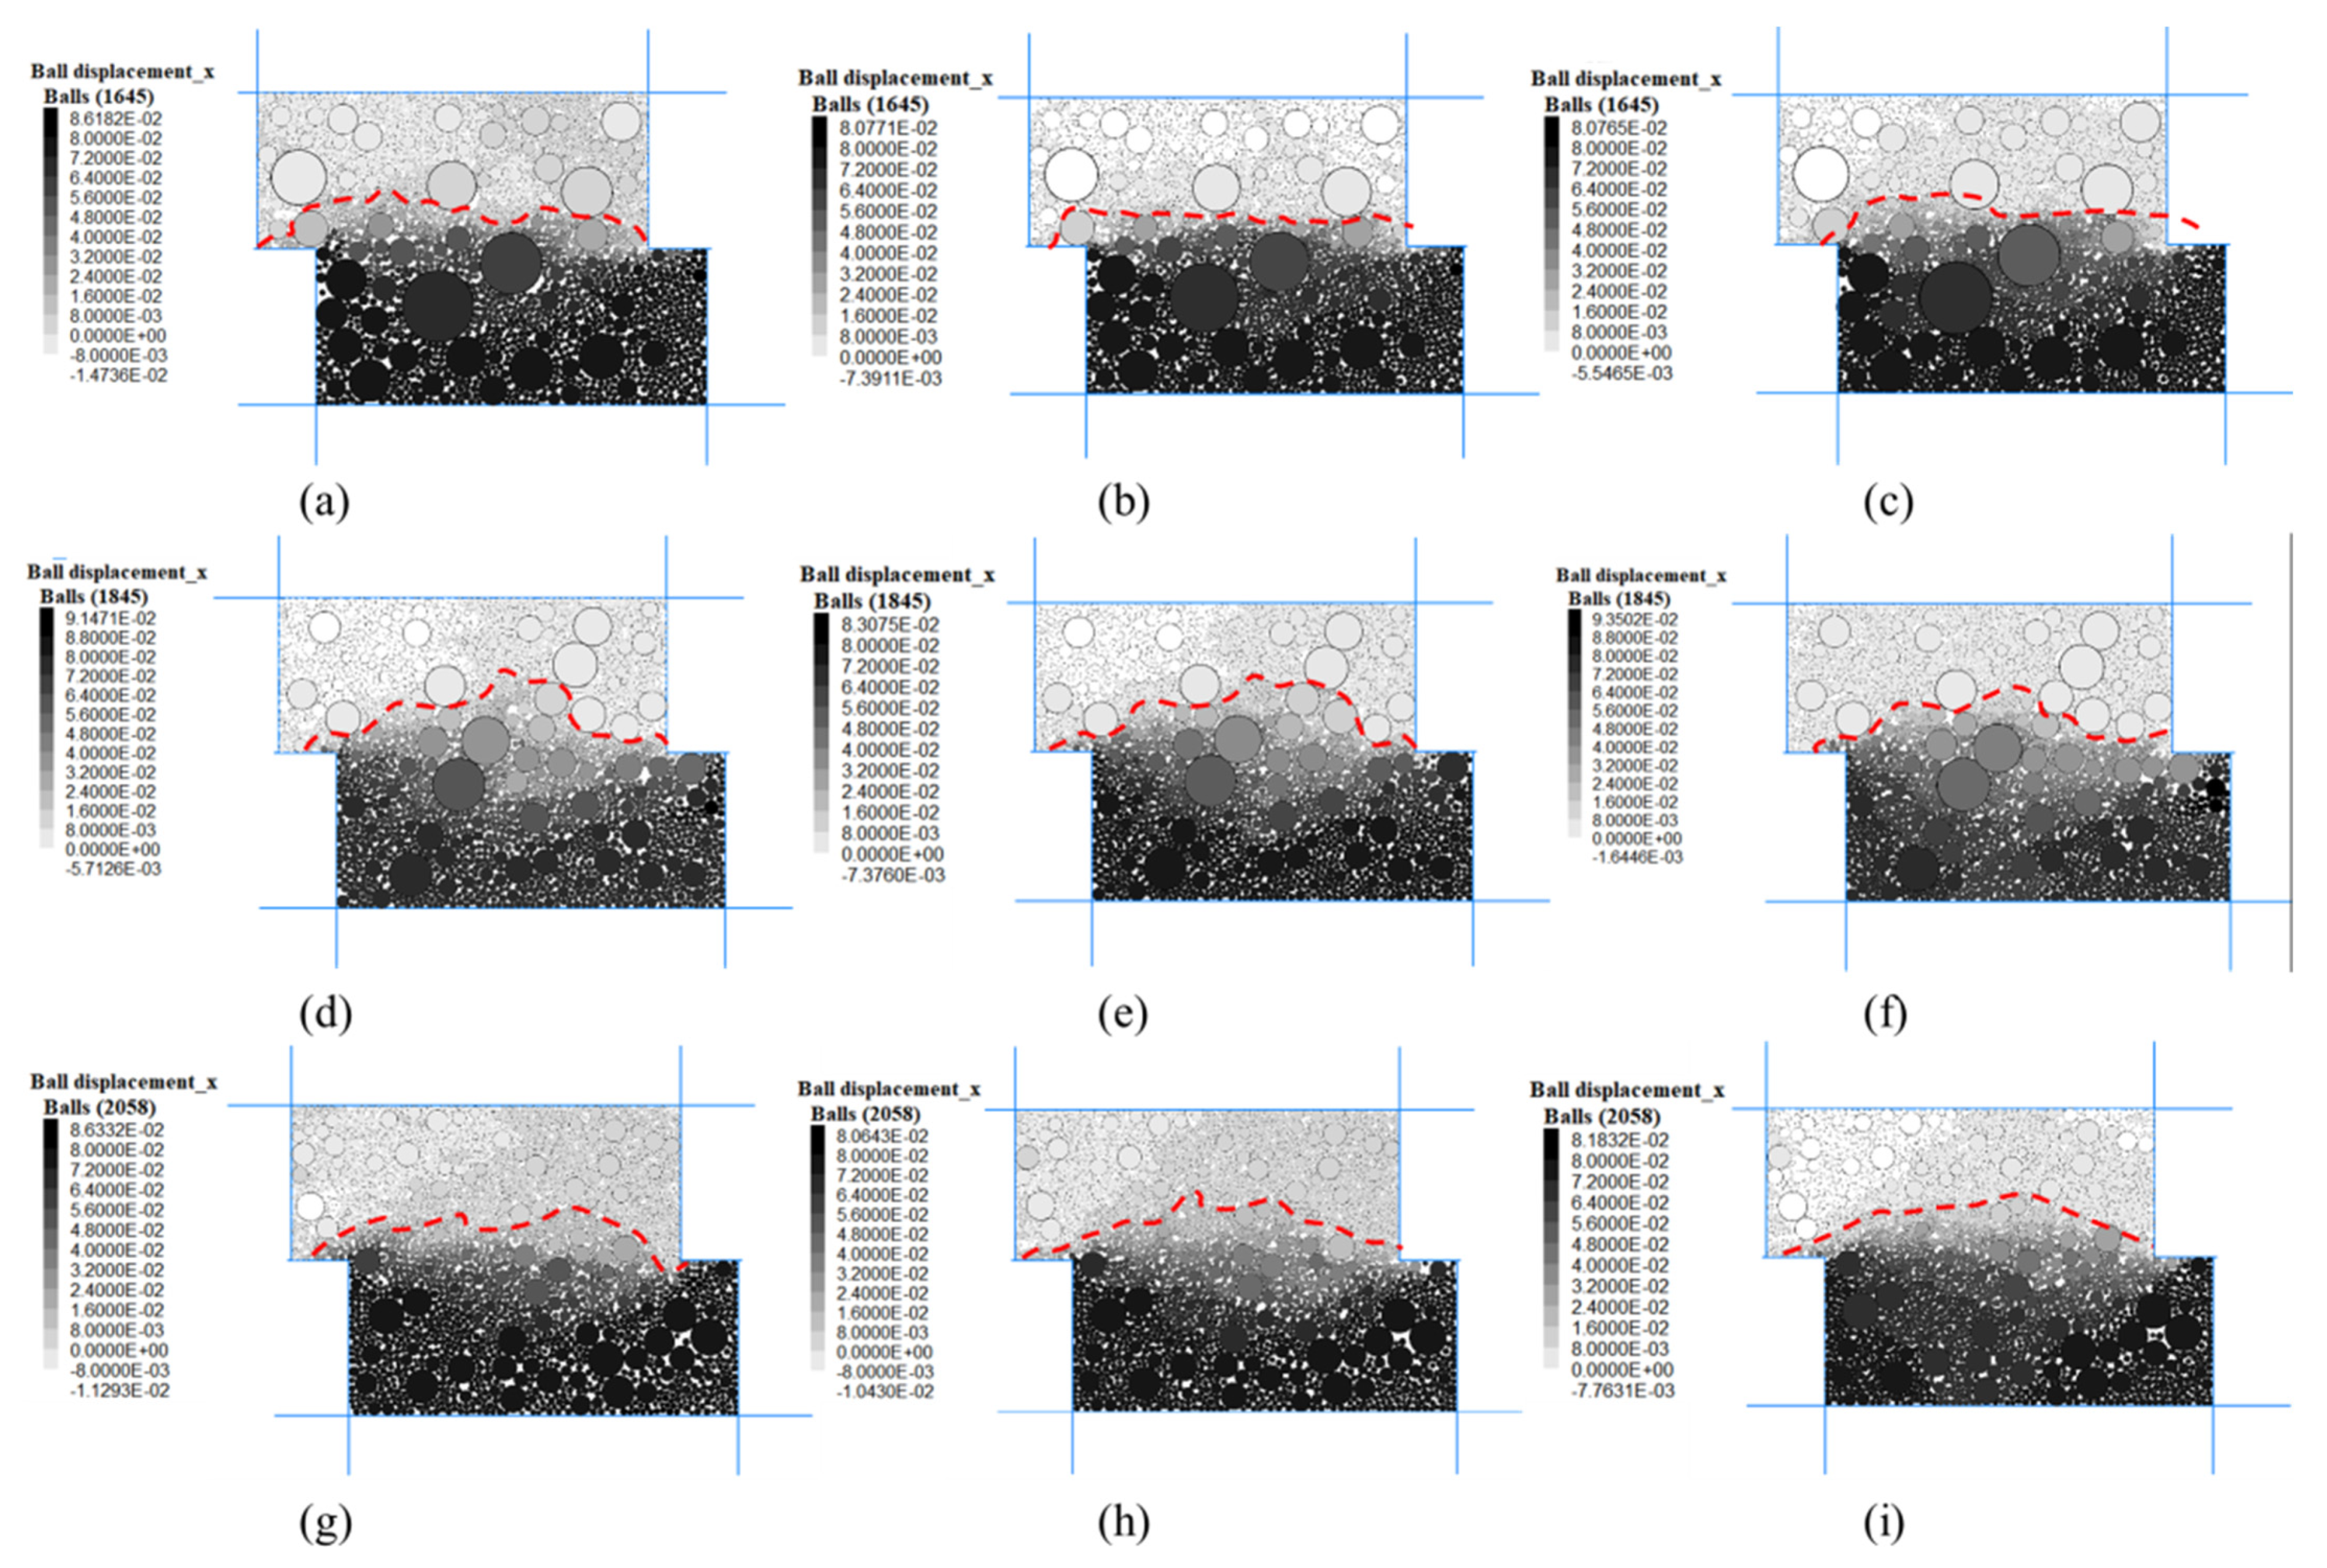
Figure 10 shows the horizontal displacements of SRM samples at the end of the simulations and marks the horizontal displacement of 0 mm as the boundary of the upper shear zone (drawn with a red dotted line). Under different normal stresses, the shape of the shear zone in different SRM samples fluctuates, and the shear zones are mostly distributed in the upper shear box.
As shown in Figure 10a–c, due to the large difference in particle size of sample S1, the shapes of shear zone change little under different normal stresses, and this is mainly controlled by particles with large size; in addition, compared with the case at 200 kPa, the irregularity of shear zone is reduced under normal stresses of 400 and 800 kPa. However, compared with sample S1, the shear zone shapes of sample S5 (Figure 10g–i) are significantly different. Under normal stress of 200 kPa, the fluctuation of the shear zone is more obvious, and the number of soil particles therein is smaller; under normal stress of 800 kPa, the shape of the shear zone is more regular, and the number of soil particles therein increases.
4.2.3. Shear Strength
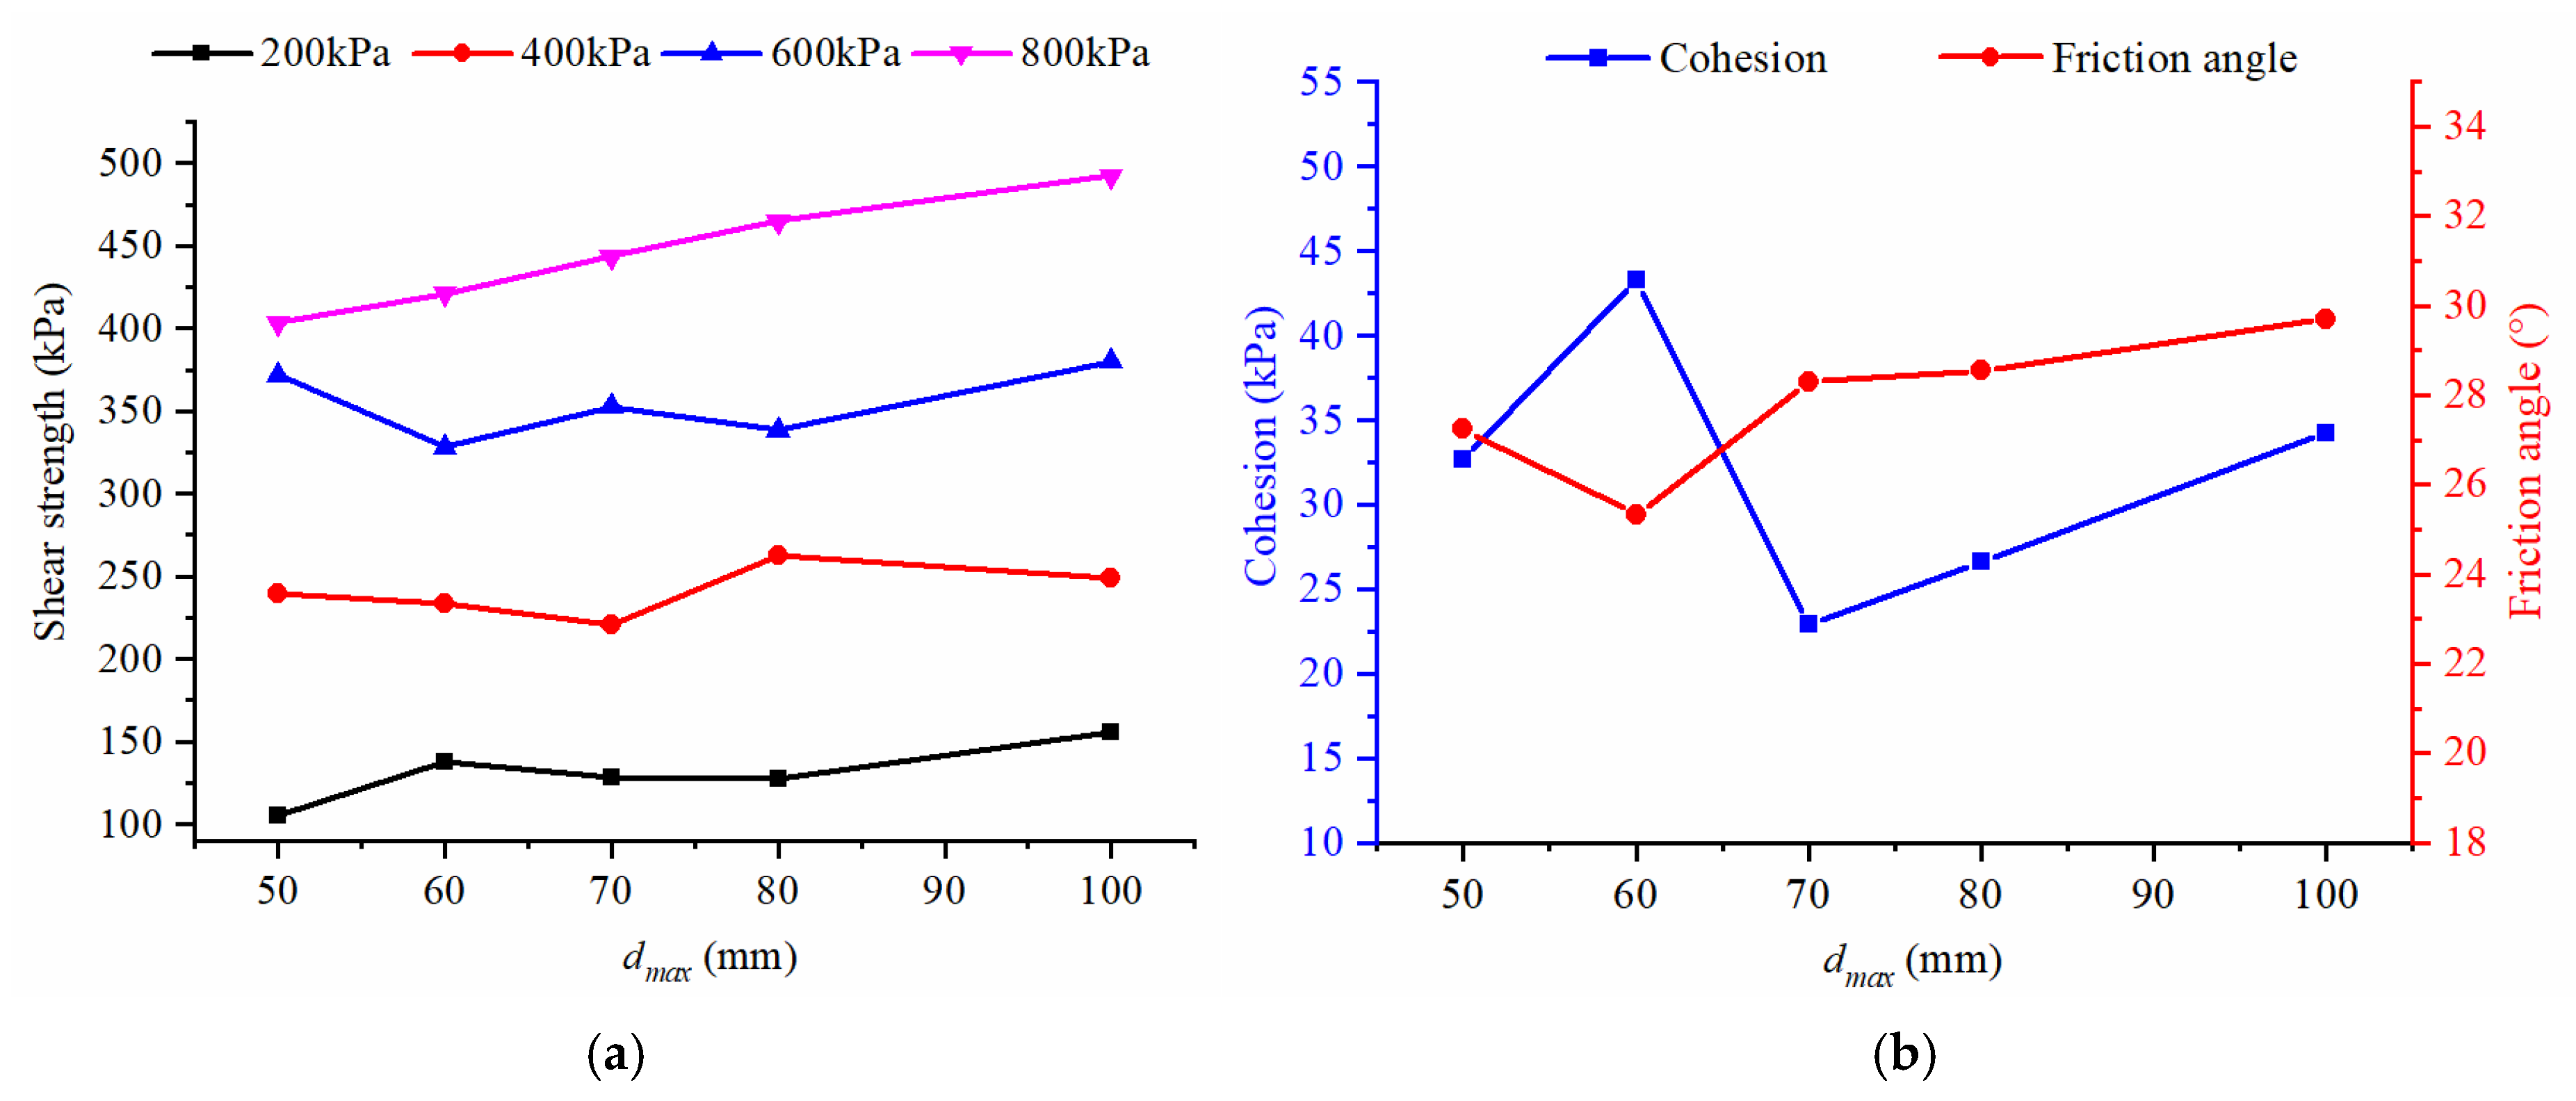
Figure 11 shows the relationship between the shear strength and dmax of SRM samples. As shown in Figure 11a, when dmax increases from 50 mm to 100 mm, the corresponding peak strength of the SRM samples under each normal stress increases. Taking the shear strength of sample S5 (dmax = 50 mm) as the standard, under normal stress of 800 kPa, the peak strengths of samples S1, S2, S3, and S4 are increased by 21.97%, 15.18%, 9.87%, and 4.31%, respectively.
As shown in Figure 11b, the shear strength indices of the SRM sample, including the cohesion and friction angle, fluctuate with the changes in the dmax. The cohesion of SRM samples decreased to 17 kPa at dmax = 70 mm, and then it increased to 34 kPa with the increase of dmax. The friction angle tended to increase with the dmax, from 29.5° to 32.7°.
5. Estimation of Shear Strength Parameters of SRM
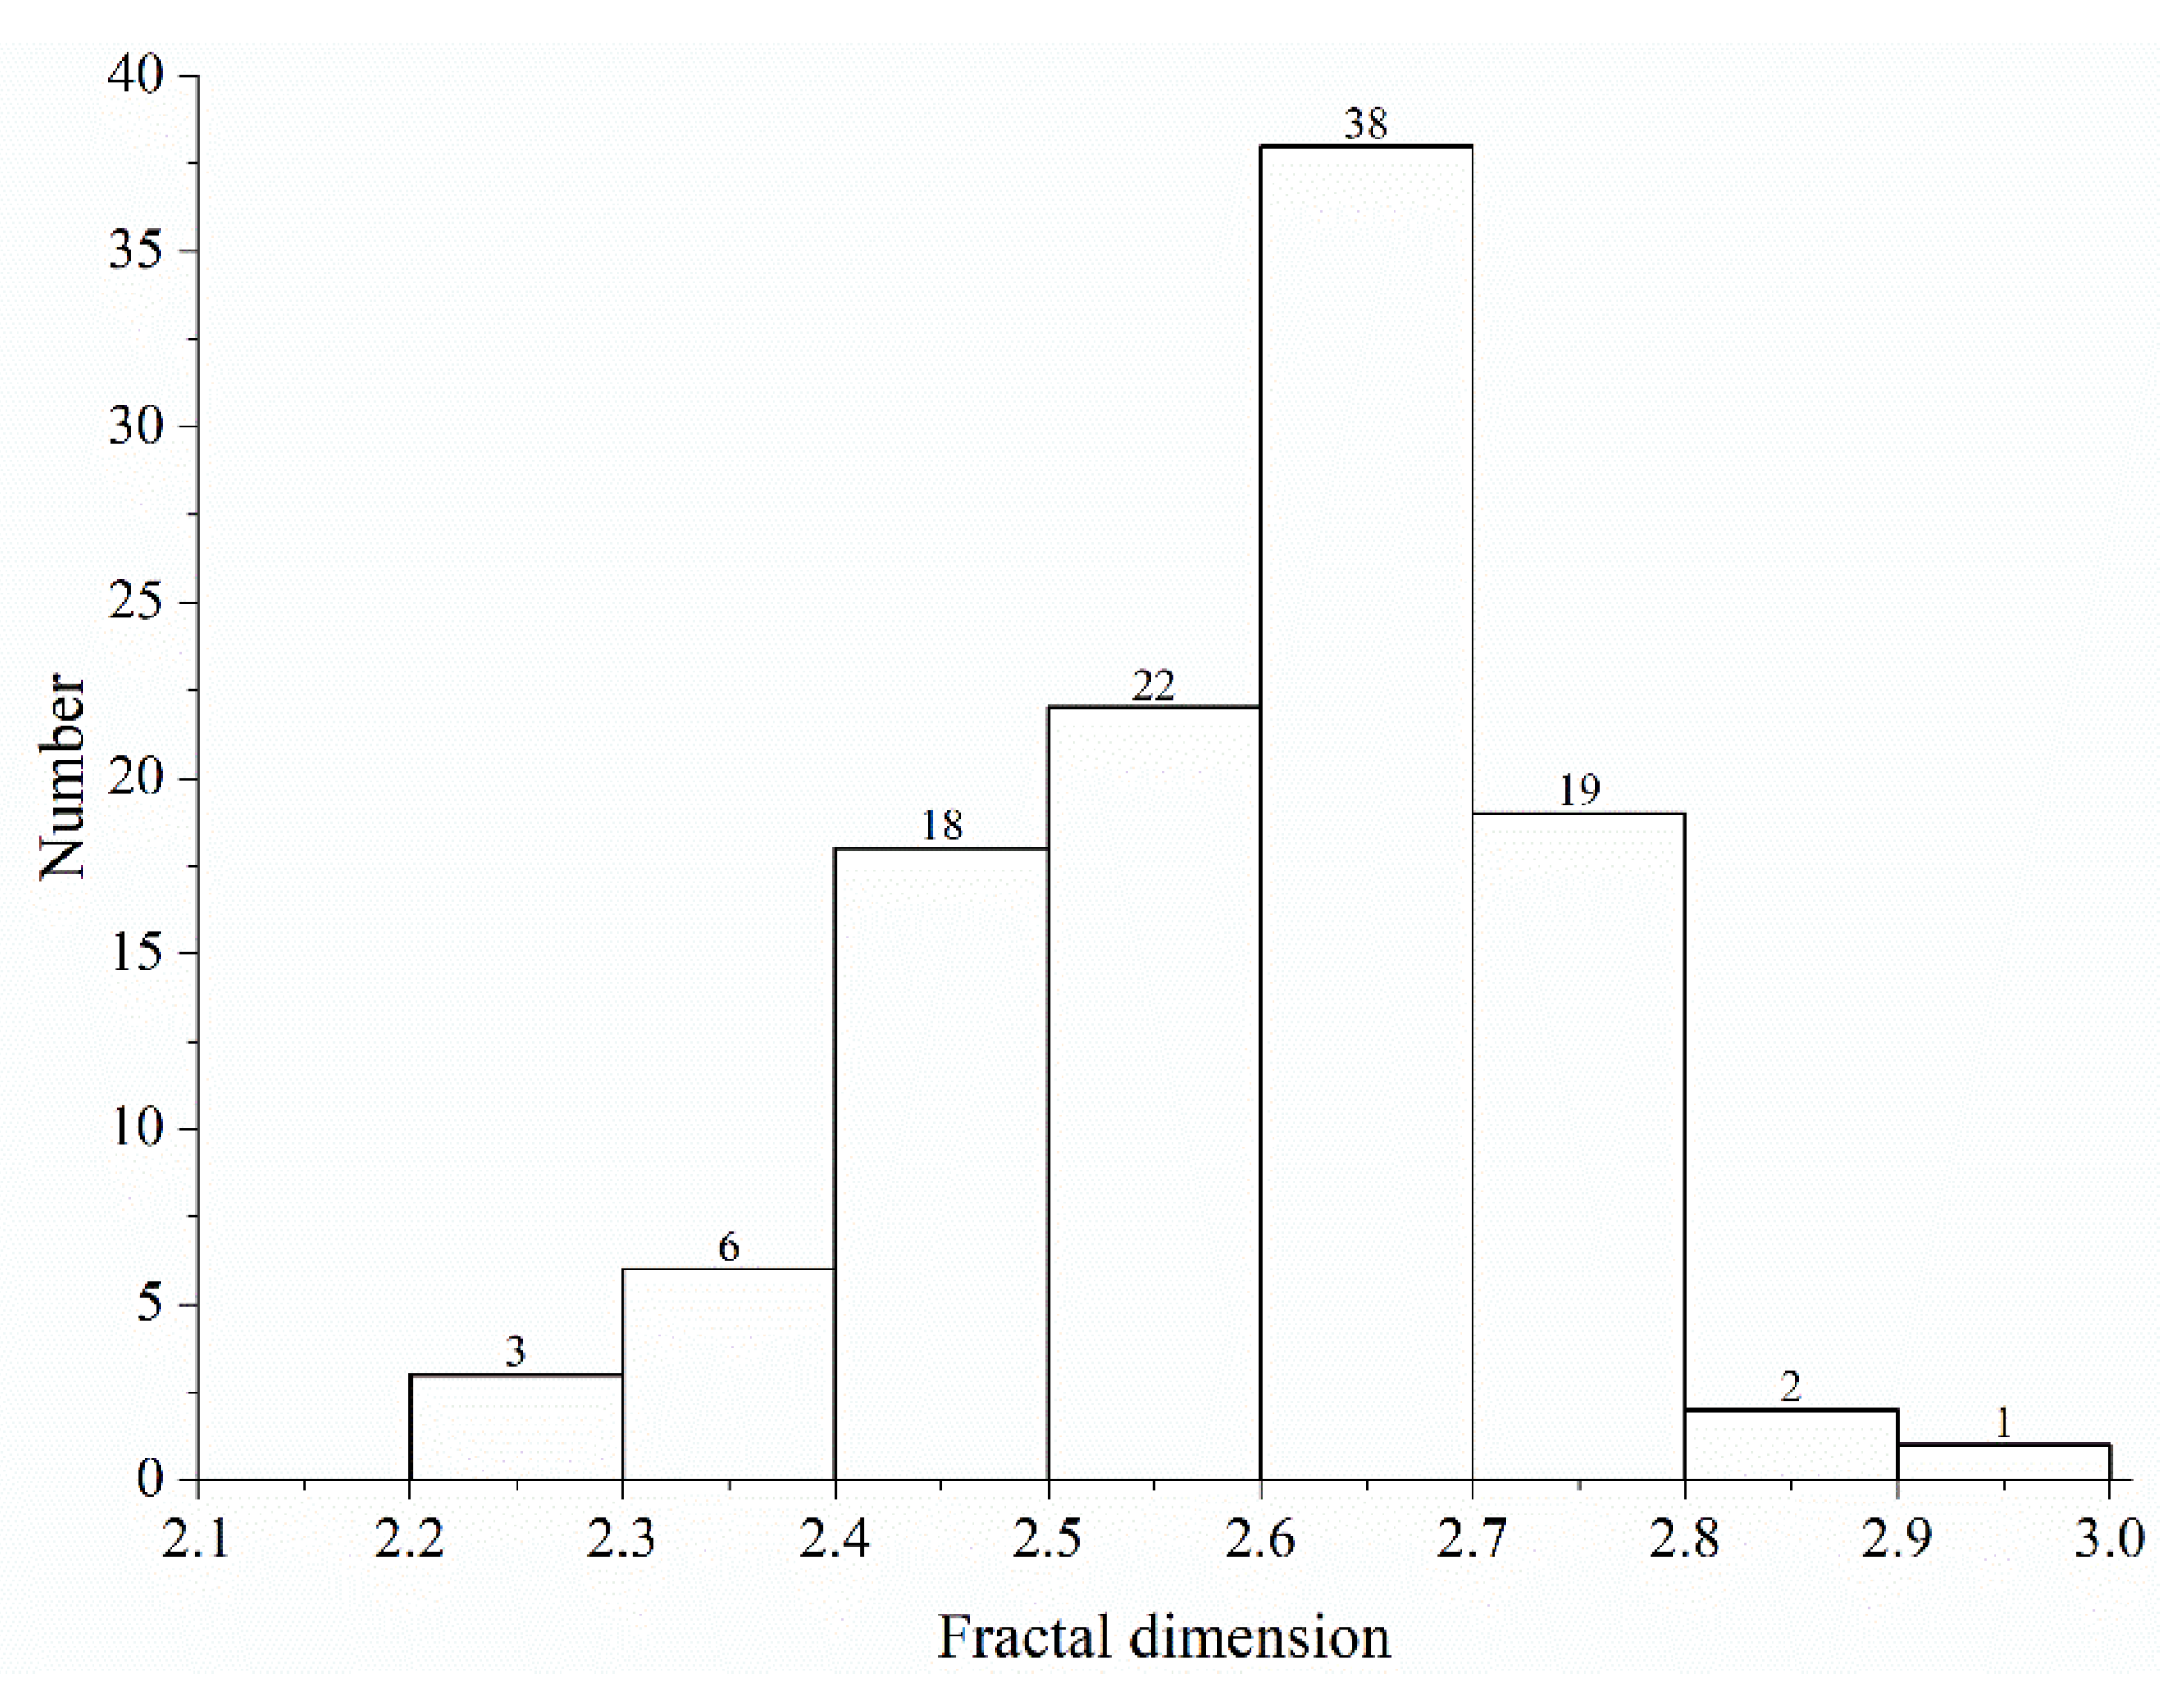
In fact, apart from the fractal dimension calculated based on the grading curve of the SRM from Zhaizi village in this study, the grading data of the SRM located in Southwest China were collected from the literature [50,51,52,53,54]. Using these grading data, we obtained over 100 fractal dimensions based on the fractal theory. Table 2 lists a part of representative fractal dimensions of the SRM located in Sichuan and Yunnan province, China. Figure 12 presented the frequency histogram of the whole collected fractal dimensions. The average fractal dimension of the SRM is 2.60, and the maximum and minimum values are 2.90 and 2.23, respectively. The results show that the largest frequency of the fractal dimension is in the range of 2.60–2.70, and then it is the range of 2.50–2.60. The frequency of the fractal dimension is in the normal distribution, and the median fractal dimension is 2.62. The fractal dimension utilized in this study for the numerical simulation is 2.67, which is near the most frequency range and the median value according to the discussions above. Therefore, the relationships between the dmax and the shear-strength parameters could be considered as the representations of the material distributed in the southwest of China.
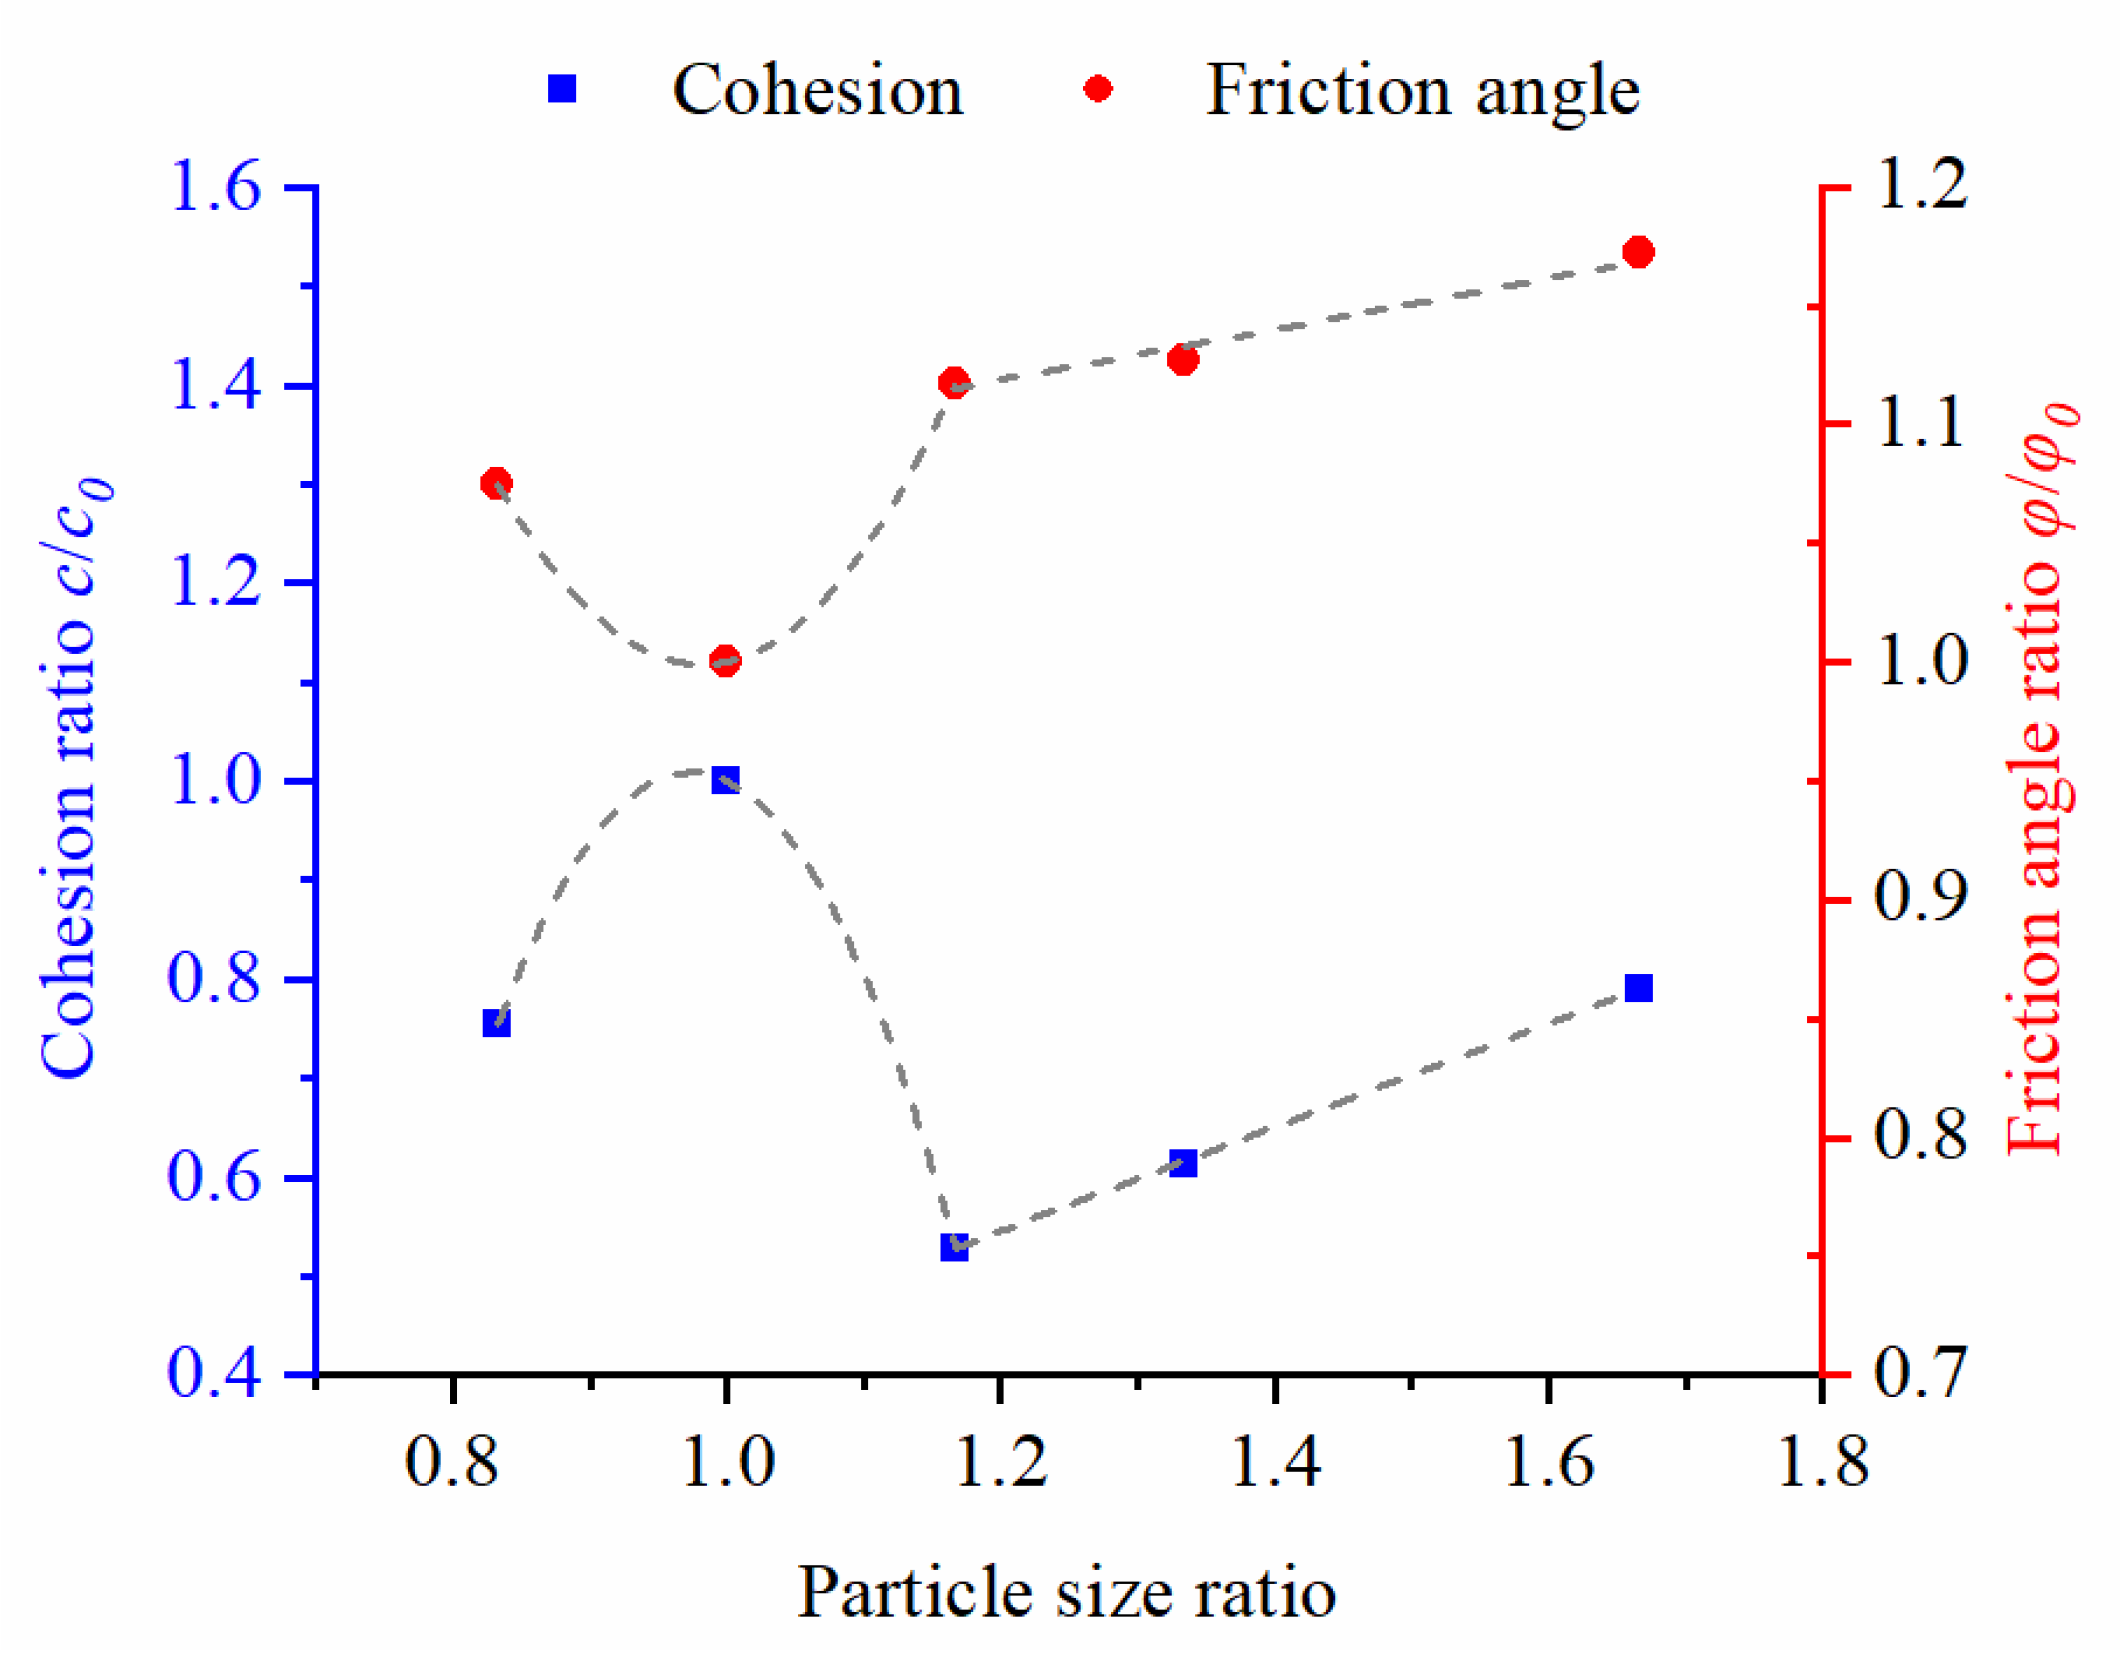
To establish the relationship between the dmax and the shear strength indices of SRM, the particle size of sample S4 (dmax = 60 mm) is taken as the reference particle size. The particle size ratios of SRM samples can be calculated by using their corresponding dmax divided by 60 mm. The particle-size ratios of samples S1, S2, S3, S4, and S5 are 1.67, 1.33, 1.17, 1, and 0.83, respectively. Then, the cohesion and friction angle of sample S4 is selected as a reference, the functional relationship between strength parameter ratio and particle size ratio is established. As shown in Figure 13, both the cohesion and friction angle ratio present the complex variation law as the particle-size ratio, x, increases. When x ≤ 1.17 (dmax ≤ 70 mm), the strength parameters show a parabolic trend with the x increases with an obvious variation. After dmax larger than 70 mm, the responses of the parameters keep increasing in a nearly linear trend. In this study, the relationships between the strength parameters and particle size ratio were expressed by using the piece-wise functions:
Using Formulas (9) and (10), we can estimate the cohesion and friction angle of SRM at different scales on the basis of obtaining the shear strength parameters of SRM with the reference particle size by large-scale direct shear test. The result provides a reference for the quantitative evaluation of mechanical properties of geomaterials at the engineering scale.
6. Conclusions
In this study, the fractal theory was invoked to explore the fractal characteristics of the particle distribution of SRM; the particle gradation curves of SRM at different scales were predicted by using the fractal dimension and relative threshold; the numerical large-scale direct shear tests were simulated by using PFC2D, and the variations in shear strength parameters of SRM with different particle sizes were studied. The main conclusions could be drawn as follows:
- (1)
- Based on the particle gradation data of SRM, the relationship curve between particle cumulative mass percentage lg (M(r < R)/MT and particle size lg R in the double logarithmic coordinate system can be drawn, whether the SRM has a fractal structure can be judged and the corresponding fractal dimension can be obtained. The case study shows that the SRM in Zhaizi village has a fractal structure, and the fractal dimension is 2.67. In addition, there is an obvious double-fractal structure in the SRM, with a maximum particle size of 60 mm, and the threshold between soil and rock blocks of the SRM in this area was determined to be 2 mm.
- (2)
- Based on the self-similarity and fractal structure of the natural SRM, the grading curve and the particle group mass under the condition of different maximum particle diameters could be obtained. This method not only can expand the study range of particle size of SRM, but also overcome the deficiency of conventional direct shear tests, which remain limited by sample size.
- (3)
- The increase of the maximum particle size leads to a more obvious positive influence on the shear stress. The shear contraction at the beginning of shearing then becomes dilated under the low normal stress with the fluctuation in the shear zone. With the increase of the particle size ratio, the friction-angle ratio increases. Meanwhile, the cohesion ratio increases up to a particle-size ratio of 1.3 and then decreases.
- (4)
- In Southwest China, the frequency of the fractal dimension of the SRM is in the normal distribution, and the median fractal dimension is 2.62. In the range of this fractal dimension, by taking the particle diameter of 60 mm as a standard value, the piece-wise functional relationship between the strength-parameter ratio and particle-size ratio is established. When particle size is less than 70 mm, the strength parameters show a parabolic trend and the particle size increases. When the particle size is larger than 70 mm, the responses of the strength parameters keep increasing in a nearly linear trend.
Author Contributions
Conceptualization, Z.Z.; methodology, Q.S.; validation, X.F. and D.Y.; formal analysis, H.D. and F.C.; writing—original draft preparation, X.F.; supervision, X.F. and Q.S.; funding acquisition, X.F. and D.Y. All authors have read and agreed to the published version of the manuscript.
Funding
This research was funded by the National Natural Science Foundation of China (No. 52179117) and the Youth Innovation Promotion Association CAS (No. 2021325).
Data Availability Statement
The data are available from the corresponding author upon request.
Conflicts of Interest
The authors declare no conflict of interest.
References
- Medley, E.; Goodman, E. Estimating the block volumetric proportions of melanges and similar block-in-matrix rocks (Bimrocks). In Proceedings of the 1st North American Rock Mechanics Symposium, Austin, TX, USA, 1–3 June 1994. [Google Scholar]
- Medley, E. The Engineering Characterization of Melanges and Similar Block-In-Matrix Rocks (Bimrocks). PhD Thesis, University of California, Berkeley, CA, USA, 1994. [Google Scholar]
- Lindquist, E.S.; Goodman, E. Strength and deformation properties of a physical model melange. In Proceedings of the 1st North American Rock Mechanics Symposium, Austin, TX, USA, 1–3 June 1994. [Google Scholar]
- Lindquist, E.S. The Strength and Deformation Properties of Melange. PhD Thesis, University of California, Berkeley, CA, USA, 1994. [Google Scholar]
- You, X. Stochastic Structural Model of the Earth-Rock Aggregate and Its Application; Northern Jiaotong University: Beijing, China, 2001. [Google Scholar]
- Xu, W.J.; Hu, L.; Tan, J. Some geomechanical properties of soil–rock mixtures in the Hutiao Gorge area, China. Geotechnique 2007, 57, 255–264. [Google Scholar] [CrossRef]
- Xu, W.-J.; Xu, Q.; Hu, R.-L. Study on the shear strength of soil–rock mixture by large scale direct shear test. Int. J. Rock. Mech. Min. 2011, 48, 1235–1247. [Google Scholar]
- Editorial Committee of Handbook of Engineering Geology. Handbook of Engineering Geology; China Building Industry Press: Beijing, China, 1982. [Google Scholar]
- Wang, S.; Li, Y.; Gao, X.; Xue, Q.; Zhang, P.; Wu, Z. Influence of volumetric block proportion on mechanical properties of virtual soil-rock mixtures. Eng. Geol. 2020, 278, 105850. [Google Scholar] [CrossRef]
- Zhang, Z.; Sheng, Q.; Fu, X.; Zhou, Y.; Huang, J.; Du, Y. An approach to predicting the shear strength of soil-rock mixture based on rock block proportion. Bull. Eng. Geol. Environ. 2020, 79, 2423–2437. [Google Scholar] [CrossRef]
- Marachi, N.D. Strength and Deformation Characteristics of Rockfill Materials. PhD Thesis, University of California, Berkeley, CA, USA, 1969. [Google Scholar]
- Afifipour, M.; Moarefvand, P. Mechanical behavior of bimrocks having high rock block proportion. Int. J. Rock. Mech. Min. 2014, 65, 40–48. [Google Scholar] [CrossRef]
- Kalender, A.; Sonmez, H.; Medley, E.; Tunusluoglu, C.; Kasapoglu, K.E. An approach to predicting the overall strengths of unwelded bimrocks and bimsoils. Eng. Geol. 2014, 183, 65–79. [Google Scholar] [CrossRef]
- Wang, Y.; Li, X. Experimental study on cracking damage characteristics of a soil and rock mixture by UPV testing. Bull. Eng. Geol. Environ. 2015, 74, 775–788. [Google Scholar] [CrossRef]
- Avnir, D.; Farin, D.; Pfeifer, P. Surface geometric irregularity of particulate materials: The fractal approach. J. Colloid Interface Sci. 1985, 103, 112–123. [Google Scholar] [CrossRef]
- Turcotte, D.L. Fractals and fragmentation. J. Geophys. Res. Atmos. 1986, 91, 1921. [Google Scholar] [CrossRef]
- Goldstein, G.; Benaroya, H. Fractal modelling of one-dimensional layered medium. Appl. Math. Model 1989, 13, 555–558. [Google Scholar] [CrossRef]
- Jafari, F.; Asgari, M.S.; Pishkoo, A. The fractal calculus for fractal materials. Fractal Fract. 2019, 3, 8. [Google Scholar] [CrossRef] [Green Version]
- Sun, Y.F.; Sumelka, W. Fractional viscoplastic model for soils under compression. Acta Mechanica 2019, 230, 3365–3377. [Google Scholar] [CrossRef]
- Sarkar, D.; Knig, D.; Goudarzy, M. The influence of particle characteristics on the index void ratios in granular materials. Particuology 2019, 46, 1–13. [Google Scholar] [CrossRef]
- Sun, Y.F.; Sumelka, W.; Gao, Y.F. Reformulated fractional plasticity for soil-structure interface. Mech. Res. Commun. 2020, 108, 103580. [Google Scholar] [CrossRef]
- Bohaienko, V.; Bulavatsky, V. Fractional-fractal modeling of filtration-consolidation processes in saline saturated soils. Fractal Fract. 2020, 4, 59. [Google Scholar] [CrossRef]
- Sun, Y.F.; Chen, C. Fractional order creep model for coral sand. Mech. Time Depend. Mater. 2019, 23, 465–476. [Google Scholar] [CrossRef]
- McDowell, G.R.; Bolton, M.D.; Robertson, D. The fractal crushing of granular materials. J. Mech. Phys. Solids 1996, 44, 2079–2101. [Google Scholar] [CrossRef]
- Yang, Z.Y.; Taghichian, A.; Huang, G.D. On the applicability of self-affinity concept in scale of three-dimensional rock joints. Int. J. Rock. Mech. Min. 2011, 48, 1173–1187. [Google Scholar] [CrossRef]
- Wu, L.; Zhu, S.; Wang, Y.; Wei, K.; Lu, C. A modified scale method based on fractal theory for rockfill materials. Eur. J. Environ. Civ. Eng. 2014, 18, 106–127. [Google Scholar] [CrossRef]
- Luo, M.; Glover, P.W.J.; Zhao, P.; Li, D. 3D digital rock modeling of the fractal properties of pore structures. Mar. Pet. Geol. 2020, 122, 104706. [Google Scholar] [CrossRef]
- Li, X.; Luo, M.; Liu, J. Fractal characteristics based on different statistical objects of process-based digital rock models. J. Pet. Sci. Eng. 2019, 179, 19–30. [Google Scholar] [CrossRef]
- Sun, Y.F.; Sumelka, W. State-dependent fractional plasticity model for the true triaxial behaviour of granular soil. Arch. Mech. 2019, 71, 23–47. [Google Scholar]
- Basirat, R.; Goshtasbi, K.; Ahmadi, M. Determination of the fractal dimension of the fracture network system using image processing technique. Fractal Fract. 2019, 3, 17. [Google Scholar] [CrossRef] [Green Version]
- Zhou, Y.Q.; Sheng, Q.; Li, N.N.; Fu, X.D. The dynamic mechanical properties of a hard rock under true triaxial damage-controlled dynamic cyclic loading with different loading rates: A case study. Rock Mech. Rock Eng. 2022, 55, 1–22. [Google Scholar] [CrossRef]
- Sun, Y.F.; Gao, Y.F.; Chen, C. Critical-state fractional model and its numerical scheme for isotropic granular soil considering state dependence. Int. J. Geomech. 2019, 19, 4019001. [Google Scholar] [CrossRef]
- Tao, G.; Wu, Z.; Li, W.; Li, Y.; Dong, H. Simplified relation model of soil saturation permeability coefficient and air-entry value and its application. Fractal Fract. 2021, 5, 180. [Google Scholar] [CrossRef]
- Sun, Y.F.; Sumelka, W.; Gao, Y.F.; Nimbalkar, S. Phenomenological fractional stress-dilatancy model for granular soil and soil-structure interface under monotonic and cyclic loads. Acta Geotechnica 2021, 16, 3115–3132. [Google Scholar] [CrossRef]
- Zhao, Z.; Ni, X.; Cao, Y.; Shi, Y. Application of fractal theory to predict the coal permeability of multi-scale pores and fractures. Energy Rep. 2021, 7, 10–18. [Google Scholar] [CrossRef]
- Sui, L.; Yu, J.; Cang, D.; Miao, W.; Wang, H.; Zhang, J.; Yin, S.; Chang, K. The fractal description model of rock fracture networks characterization. Chaos Solitons Fractals 2019, 129, 71–76. [Google Scholar] [CrossRef]
- Xiao, Y.; Meng, M.; Daouadji, A.; Chen, Q.; Wu, Z.; Jiang, X. Effects of particle size on crushing and deformation behaviors of rockfill materials. Geosci. Front. 2020, 11, 375–388. [Google Scholar] [CrossRef]
- He, S.H.; Ding, Z.; Hu, H.-B.; Gao, M. Effect of grain size on microscopic pore structure and fractal characteristics of carbonate-based sand and silicate-based sand. Fractal Fract. 2021, 5, 152. [Google Scholar] [CrossRef]
- Xu, W.J.; Yue, Z.Q.; Hu, L. Study on the mesostructure and mesomechanical characteristics of the soil-rock mixture using digital image processing based finite element method. Int. J. Rock. Mech. Min. 2008, 45, 749–762. [Google Scholar] [CrossRef]
- Wu, L.Q.; Zhu, S.; Wei, K.M.; Lu, Y. The fractal properties of scale effect on the density of rock-fill materials. Adv. Mat. Res. 2013, 706–708, 520–525. [Google Scholar] [CrossRef]
- Pi, Z.; Zhou, Z.; Li, X.; Wang, S. Digital image processing method for characterization of fractures, fragments, and particles of soil/rock-like materials. Mathematics 2021, 9, 815. [Google Scholar] [CrossRef]
- Mandelbrot, B.B. The fractal geometry of nature. Am. J. Phys. 1983, 51, 286–287. [Google Scholar] [CrossRef]
- Tyler, S.W.; Wheatcraft, S.W. Fractal scaling of soil particle-size distributions: Analysis and limitations. Soil Sci. Soc. Am. J. 1992, 56, 362–369. [Google Scholar] [CrossRef]
- Fu, X.; Zhang, Z.; Sheng, Q.; Zhou, Y.; Huang, J.; Wu, Z.; Liu, M. Applications of an innovative strength parameter estimation method of the soilrock mixture in evaluating the deposit slope stability under rainfall. Front. Earth Sci. 2021, 9, 868. [Google Scholar] [CrossRef]
- Zhou, W.; Wang, D.; Ma, G.; Cao, X.; Hu, C.; Wu, W. Discrete element modeling of particle breakage considering different fragment replacement modes. Powder Technol. 2020, 360, 312–323. [Google Scholar] [CrossRef]
- Zhang, Z.L.; Xu, W.J.; Xia, W.; Zhang, H.Y. Large-scale in-situ test for mechanical characterization of soil–rock mixture used in an embankment dam. Int. J. Rock. Mech. Min. 2016, 86, 317–322. [Google Scholar] [CrossRef]
- Shi, D.D.; Cao, D.; Deng, Y.B.; Xue, J.F. DEM investigations of the effects of intermediate principal stress ratio and particle breakage on the critical state behaviors of granular soils. Powder Technol. 2021, 379, 547–559. [Google Scholar] [CrossRef]
- Cundall, P.A.; Strack, O.D.L. A discrete numerical model for granular assemblies. Geotechnique 1979, 29, 47–65. [Google Scholar] [CrossRef]
- Itasca Consulting Group. PFC2D (Particle Flow Code in 2 Dimensions) Use’s Guide: Verification Problems and Example Applications; Itasca Consulting Group: Minneapolis, MN, USA, 2008. [Google Scholar]
- Wei, H.Z.; Wang, R.; Hu, M.J.; Zhao, H.Y.; Xu, X.Y. Strength behavior of gravelly soil with different coarse-grained contents in Jiangjiagou. Rock Soil Mech. 2008, 29, 48–51. [Google Scholar]
- Hu, W. Experimental Study on Shear Strength of Soil-Rock-Mixture in Xiluodu Reservoir; Institute of Rock and Soil Mechanics, Chinese Academy of Sciences: Wuhan, China, 2014. [Google Scholar]
- Gao, W.; Hu, R.; Oyediran, I.A.; Li, Z.Q.; Zhang, X.Y. Geomechanical characterization of Zhangmu soil-rock mixture deposit. Geotech. Geol. Eng. 2014, 32, 1329–1338. [Google Scholar] [CrossRef]
- Ma, C.; Zhan, H.B.; Zhang, T.; Yao, W.M. Investigation on shear behavior of soft interlayers by ring shear tests. Eng. Geol. 2019, 254, 34–42. [Google Scholar] [CrossRef]
- Tu, G.X.; Huang, D.; Huang, Q.; Deng, H. Effect of locally accumulated crushed stone soil on the infiltration of intense rainfall: A case study on the reactivation of an old deep landslide deposit. Bull. Eng. Geol. Environ. 2019, 78, 4833–4849. [Google Scholar] [CrossRef]
Figure 1.
SRM in Zhaizi village, Lijiang City, Yunnan Province, China. (a) Site investigation; (b) SRM sample.
Figure 1.
SRM in Zhaizi village, Lijiang City, Yunnan Province, China. (a) Site investigation; (b) SRM sample.

Figure 2.
Distribution of particle size of SRM samples. (a) Particle-size distribution; (b) Histogram.
Figure 2.
Distribution of particle size of SRM samples. (a) Particle-size distribution; (b) Histogram.

Figure 3.
Fractal analysis of SRM sample.

Figure 4.
Particle-size-distribution characteristics of SRM after normalization.

Figure 5.
Predicted particle size distributions of SRM samples with different maximum particle diameters.
Figure 5.
Predicted particle size distributions of SRM samples with different maximum particle diameters.

Figure 6.
Modified particle distributions of SRM samples with different maximum particle diameters.

Figure 7.
Numerical model of the direct shear test of an SRM sample.

Figure 8.
Particle models of SRM samples with different maximum particle diameters. (a) S1, (b) S2, (c) S3, (d) S4, and (e) S5.
Figure 8.
Particle models of SRM samples with different maximum particle diameters. (a) S1, (b) S2, (c) S3, (d) S4, and (e) S5.

Figure 9.
Shear displacements from numerical simulation of SRM samples. (a) Relationship between shear stress and shear displacement; (b) Relationship between vertical displacement and shear displacement.
Figure 9.
Shear displacements from numerical simulation of SRM samples. (a) Relationship between shear stress and shear displacement; (b) Relationship between vertical displacement and shear displacement.

Figure 10.
Horizontal displacements of SRM samples at the end of simulations. (a) S1-2 × 10² kPa, (b) S1-4 × 10² kPa, (c) S1-8 × 10² kPa, (d) S3-2 × 10² kPa, (e) S3-4 × 10² kPa, (f) S3-8 × 10² kPa, (g) S5-2 × 10² kPa, (h) S5-4 × 10² kPa, and (i) S5-8 × 10² kPa.
Figure 10.
Horizontal displacements of SRM samples at the end of simulations. (a) S1-2 × 10² kPa, (b) S1-4 × 10² kPa, (c) S1-8 × 10² kPa, (d) S3-2 × 10² kPa, (e) S3-4 × 10² kPa, (f) S3-8 × 10² kPa, (g) S5-2 × 10² kPa, (h) S5-4 × 10² kPa, and (i) S5-8 × 10² kPa.

Figure 11.
Relationship between the shear strength and the maximum particle size of SRM samples. (a) Peak shear stress; (b) Strength parameters.
Figure 11.
Relationship between the shear strength and the maximum particle size of SRM samples. (a) Peak shear stress; (b) Strength parameters.

Figure 12.
Frequency histogram of the fractal dimensions of the SRM in Southwest China.

Figure 13.
Relationship between strength-parameters ratio and particle-size ratio.


Table 1.
Numerical test scheme.
| Sample Number | Rock Proportion/% | Fine Particle/% | Maximum Particle Diameter/mm | Normal Stress/kPa |
|---|---|---|---|---|
| S1 | 52.9 | 47.1 | 100 | 200, 400, 600, 800 |
| S2 | 49.3 | 50.7 | 80 | |
| S3 | 47.1 | 52.9 | 70 | |
| S4 | 44.3 | 55.7 | 60 | |
| S5 | 40.9 | 59.1 | 50 |
Table 2.
Representative fractal dimensions of the SRM in China.
| Number | Fractal Dimension | Location of the SRM | Resource |
|---|---|---|---|
| 1 | 2.67 | A deposit slope in Zhaizi village | This study |
| 2 | 2.52 | Soil–rock mixtures in the Hutiao Gorge area | Xu et al. (2007) [6] |
| 3 | 2.55 | Gravelly soil in Jiangjiagou Ravine in Yunnan | Wei et al. (2008) [50] |
| 4 | 2.62 | Fujiapingzi, Xiluodu Reservoir | Hu (2014) [51] |
| 2.64 | Ganhaizi, Xiluodu Reservoir | ||
| 2.59 | NiuGudang, Xiluodu Reservoir | ||
| 2.64 | Shuanglongba, Xiluodu Reservoir | ||
| 2.66 | Shaniwan, Xiluodu Reservoir | ||
| 5 | 2.68 | Zhangmu soil–rock mixture deposit in Southwestern China | Gao et al. (2014) [52] |
| 2.65 | |||
| 2.66 | |||
| 2.59 | |||
| 2.69 | |||
| 2.65 | |||
| 2.64 | |||
| 6 | 2.85 | Soil–rock mixture of Nuozhadu hydropower station in Yunnan | Zhang et al. (2016) [46] |
| 7 | 2.66 | An open-pit limestone mine in Esheng, Sichuan Province | Ma et al. (2019) [53] |
| 8 | 2.75 | Accumulated crushed stone soil in Deqin County, Yunnan | Tu et al. (2019) [54] |
| 2.75 | |||
| 2.74 | |||
| 2.75 | |||
| 2.45 |
Publisher’s Note: MDPI stays neutral with regard to jurisdictional claims in published maps and institutional affiliations. |
© 2022 by the authors. Licensee MDPI, Basel, Switzerland. This article is an open access article distributed under the terms and conditions of the Creative Commons Attribution (CC BY) license (https://creativecommons.org/licenses/by/4.0/).
Share and Cite
MDPI and ACS Style
Fu, X.; Ding, H.; Sheng, Q.; Zhang, Z.; Yin, D.; Chen, F. Fractal Analysis of Particle Distribution and Scale Effect in a Soil–Rock Mixture. Fractal Fract. 2022, 6, 120. https://0-doi-org.brum.beds.ac.uk/10.3390/fractalfract6020120
AMA Style
Fu X, Ding H, Sheng Q, Zhang Z, Yin D, Chen F. Fractal Analysis of Particle Distribution and Scale Effect in a Soil–Rock Mixture. Fractal and Fractional. 2022; 6(2):120. https://0-doi-org.brum.beds.ac.uk/10.3390/fractalfract6020120
Chicago/Turabian StyleFu, Xiaodong, Haifeng Ding, Qian Sheng, Zhenping Zhang, Dawei Yin, and Fei Chen. 2022. "Fractal Analysis of Particle Distribution and Scale Effect in a Soil–Rock Mixture" Fractal and Fractional 6, no. 2: 120. https://0-doi-org.brum.beds.ac.uk/10.3390/fractalfract6020120