
Weaving Mitochondrial DNA and Y-Chromosome Variation in the Panamanian Genetic Canvas

 , , ,
, , ,  , , , , , , and add
Show full author list
, , , , , , and add
Show full author list
Abstract
:1. Introduction
2. Materials and Methods
2.1. DNA Sample Collection
2.2. Mitochondrial DNA Sequencing and Haplogroup Classification
2.3. Y-Chromosome Genotyping and Haplogroup Classification
2.4. Data Analyses
3. Results
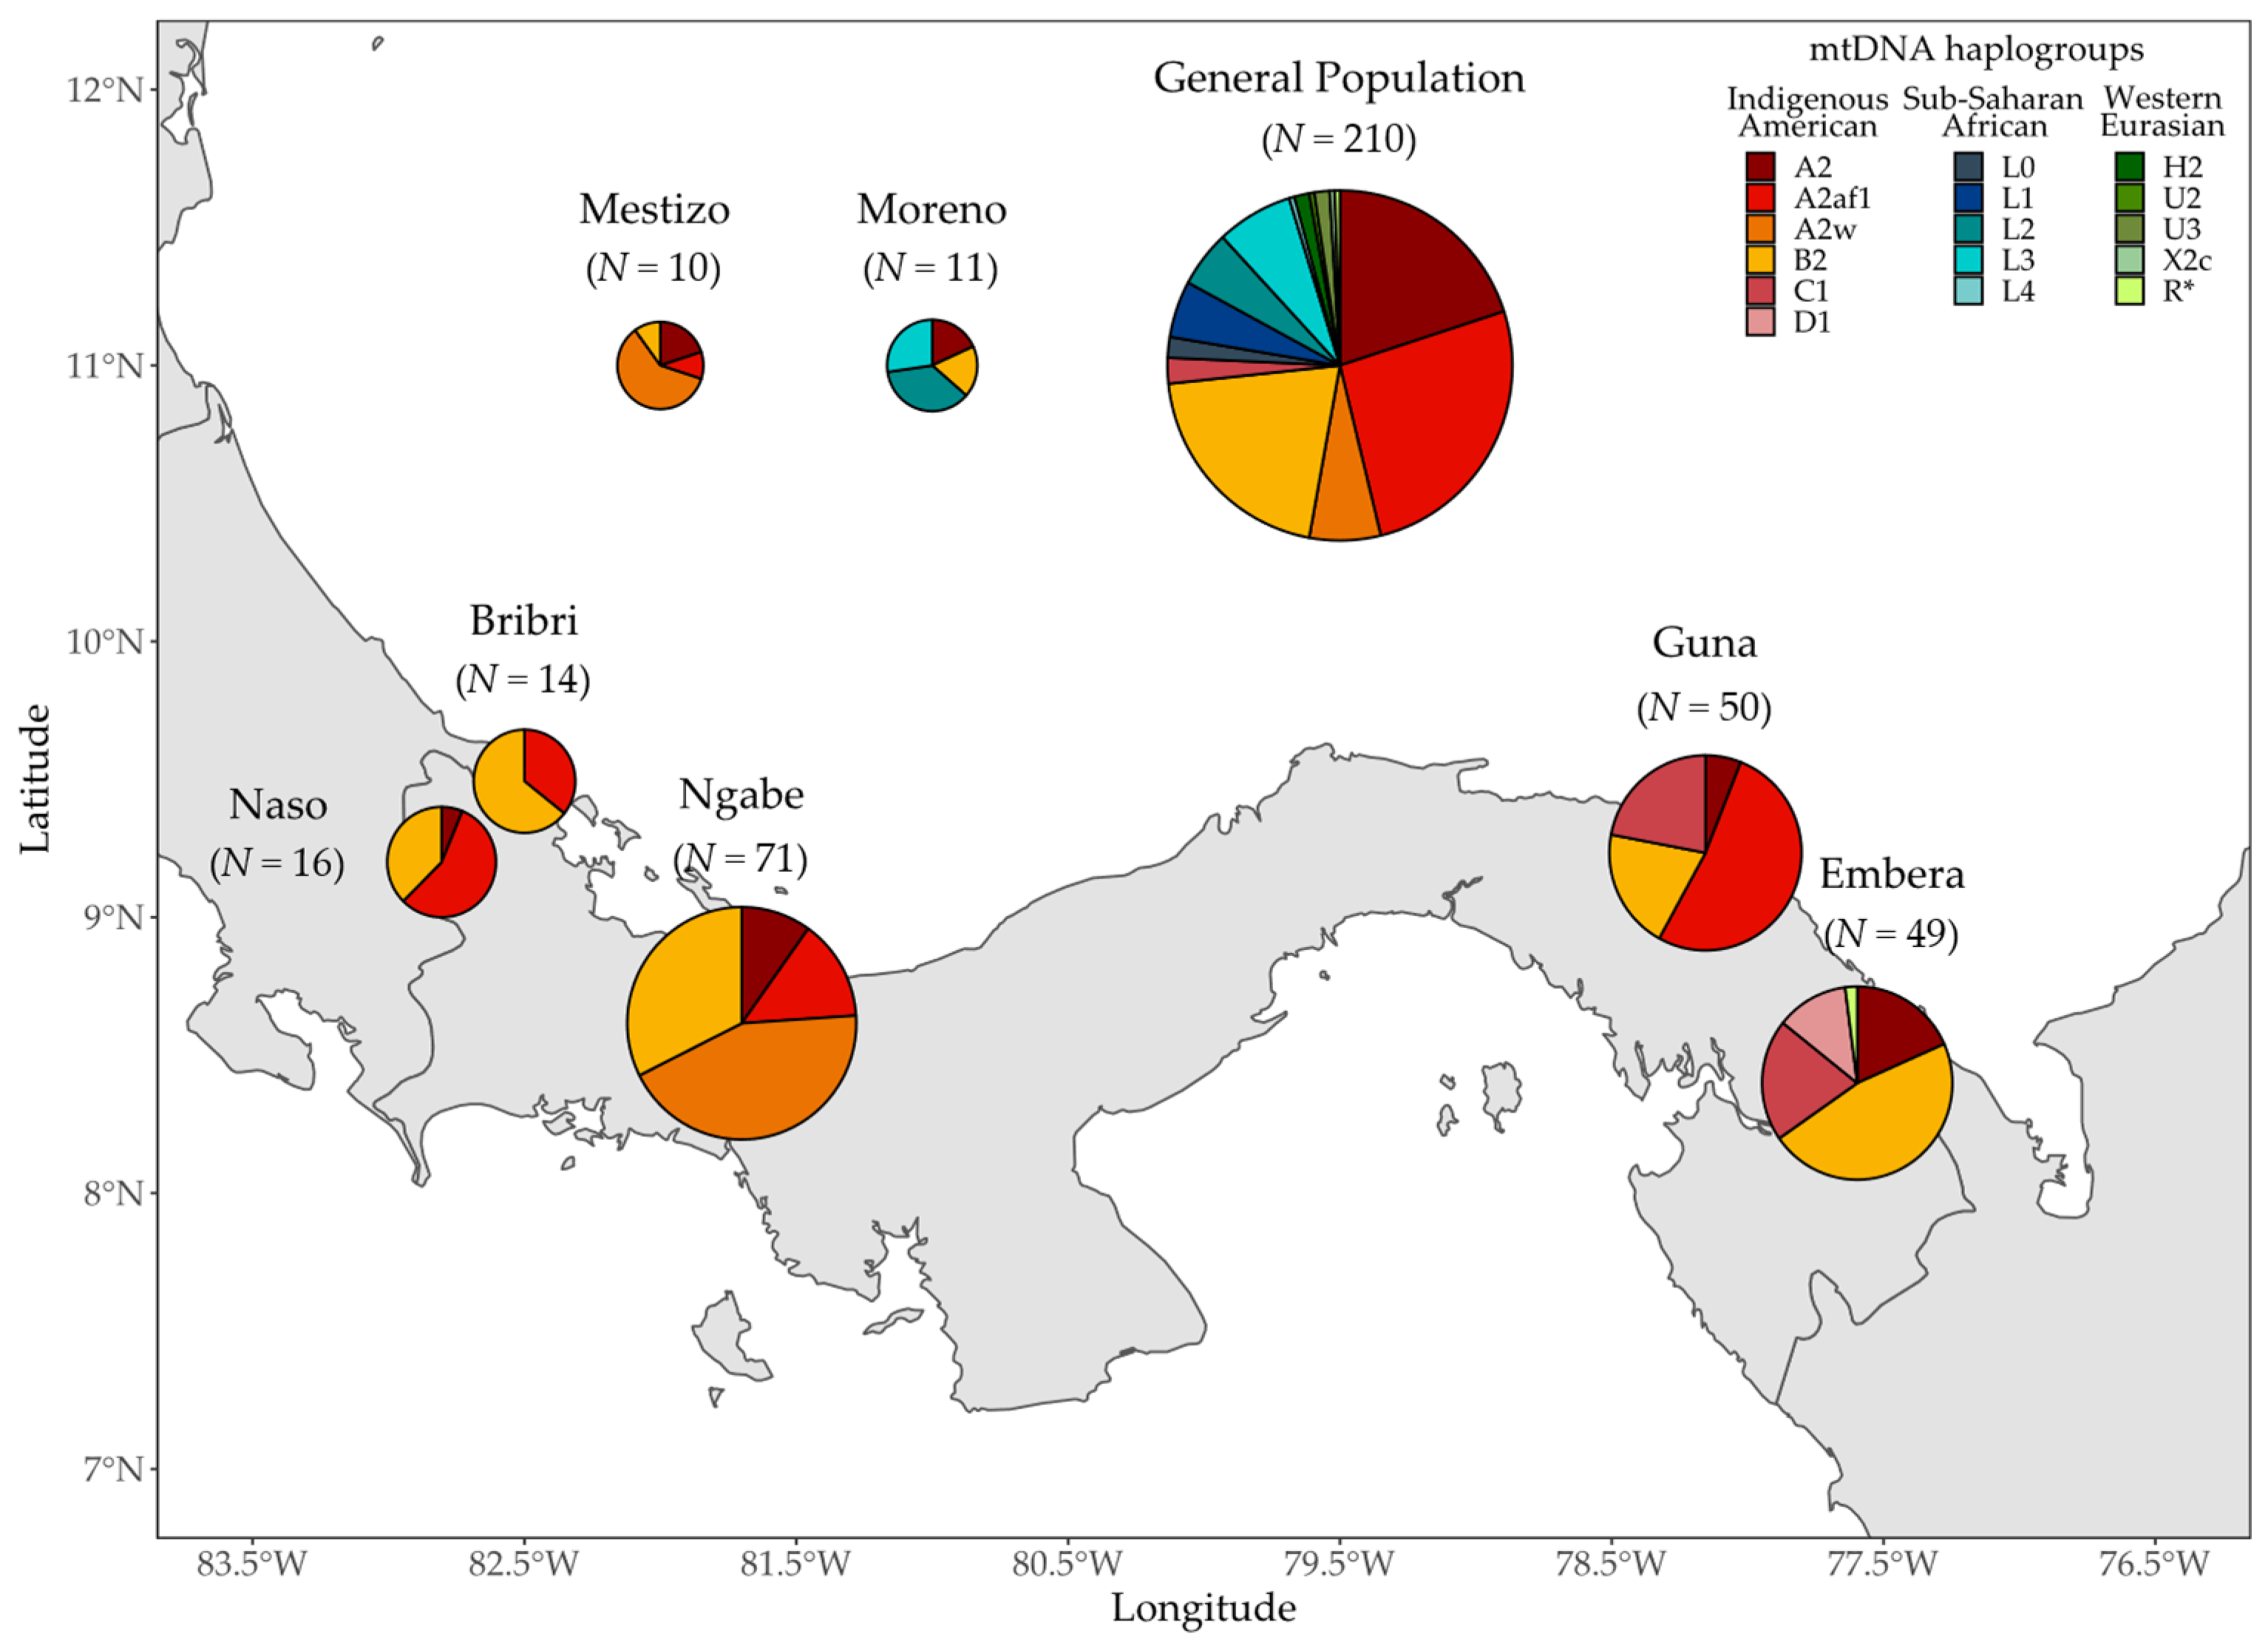
3.1. MtDNA
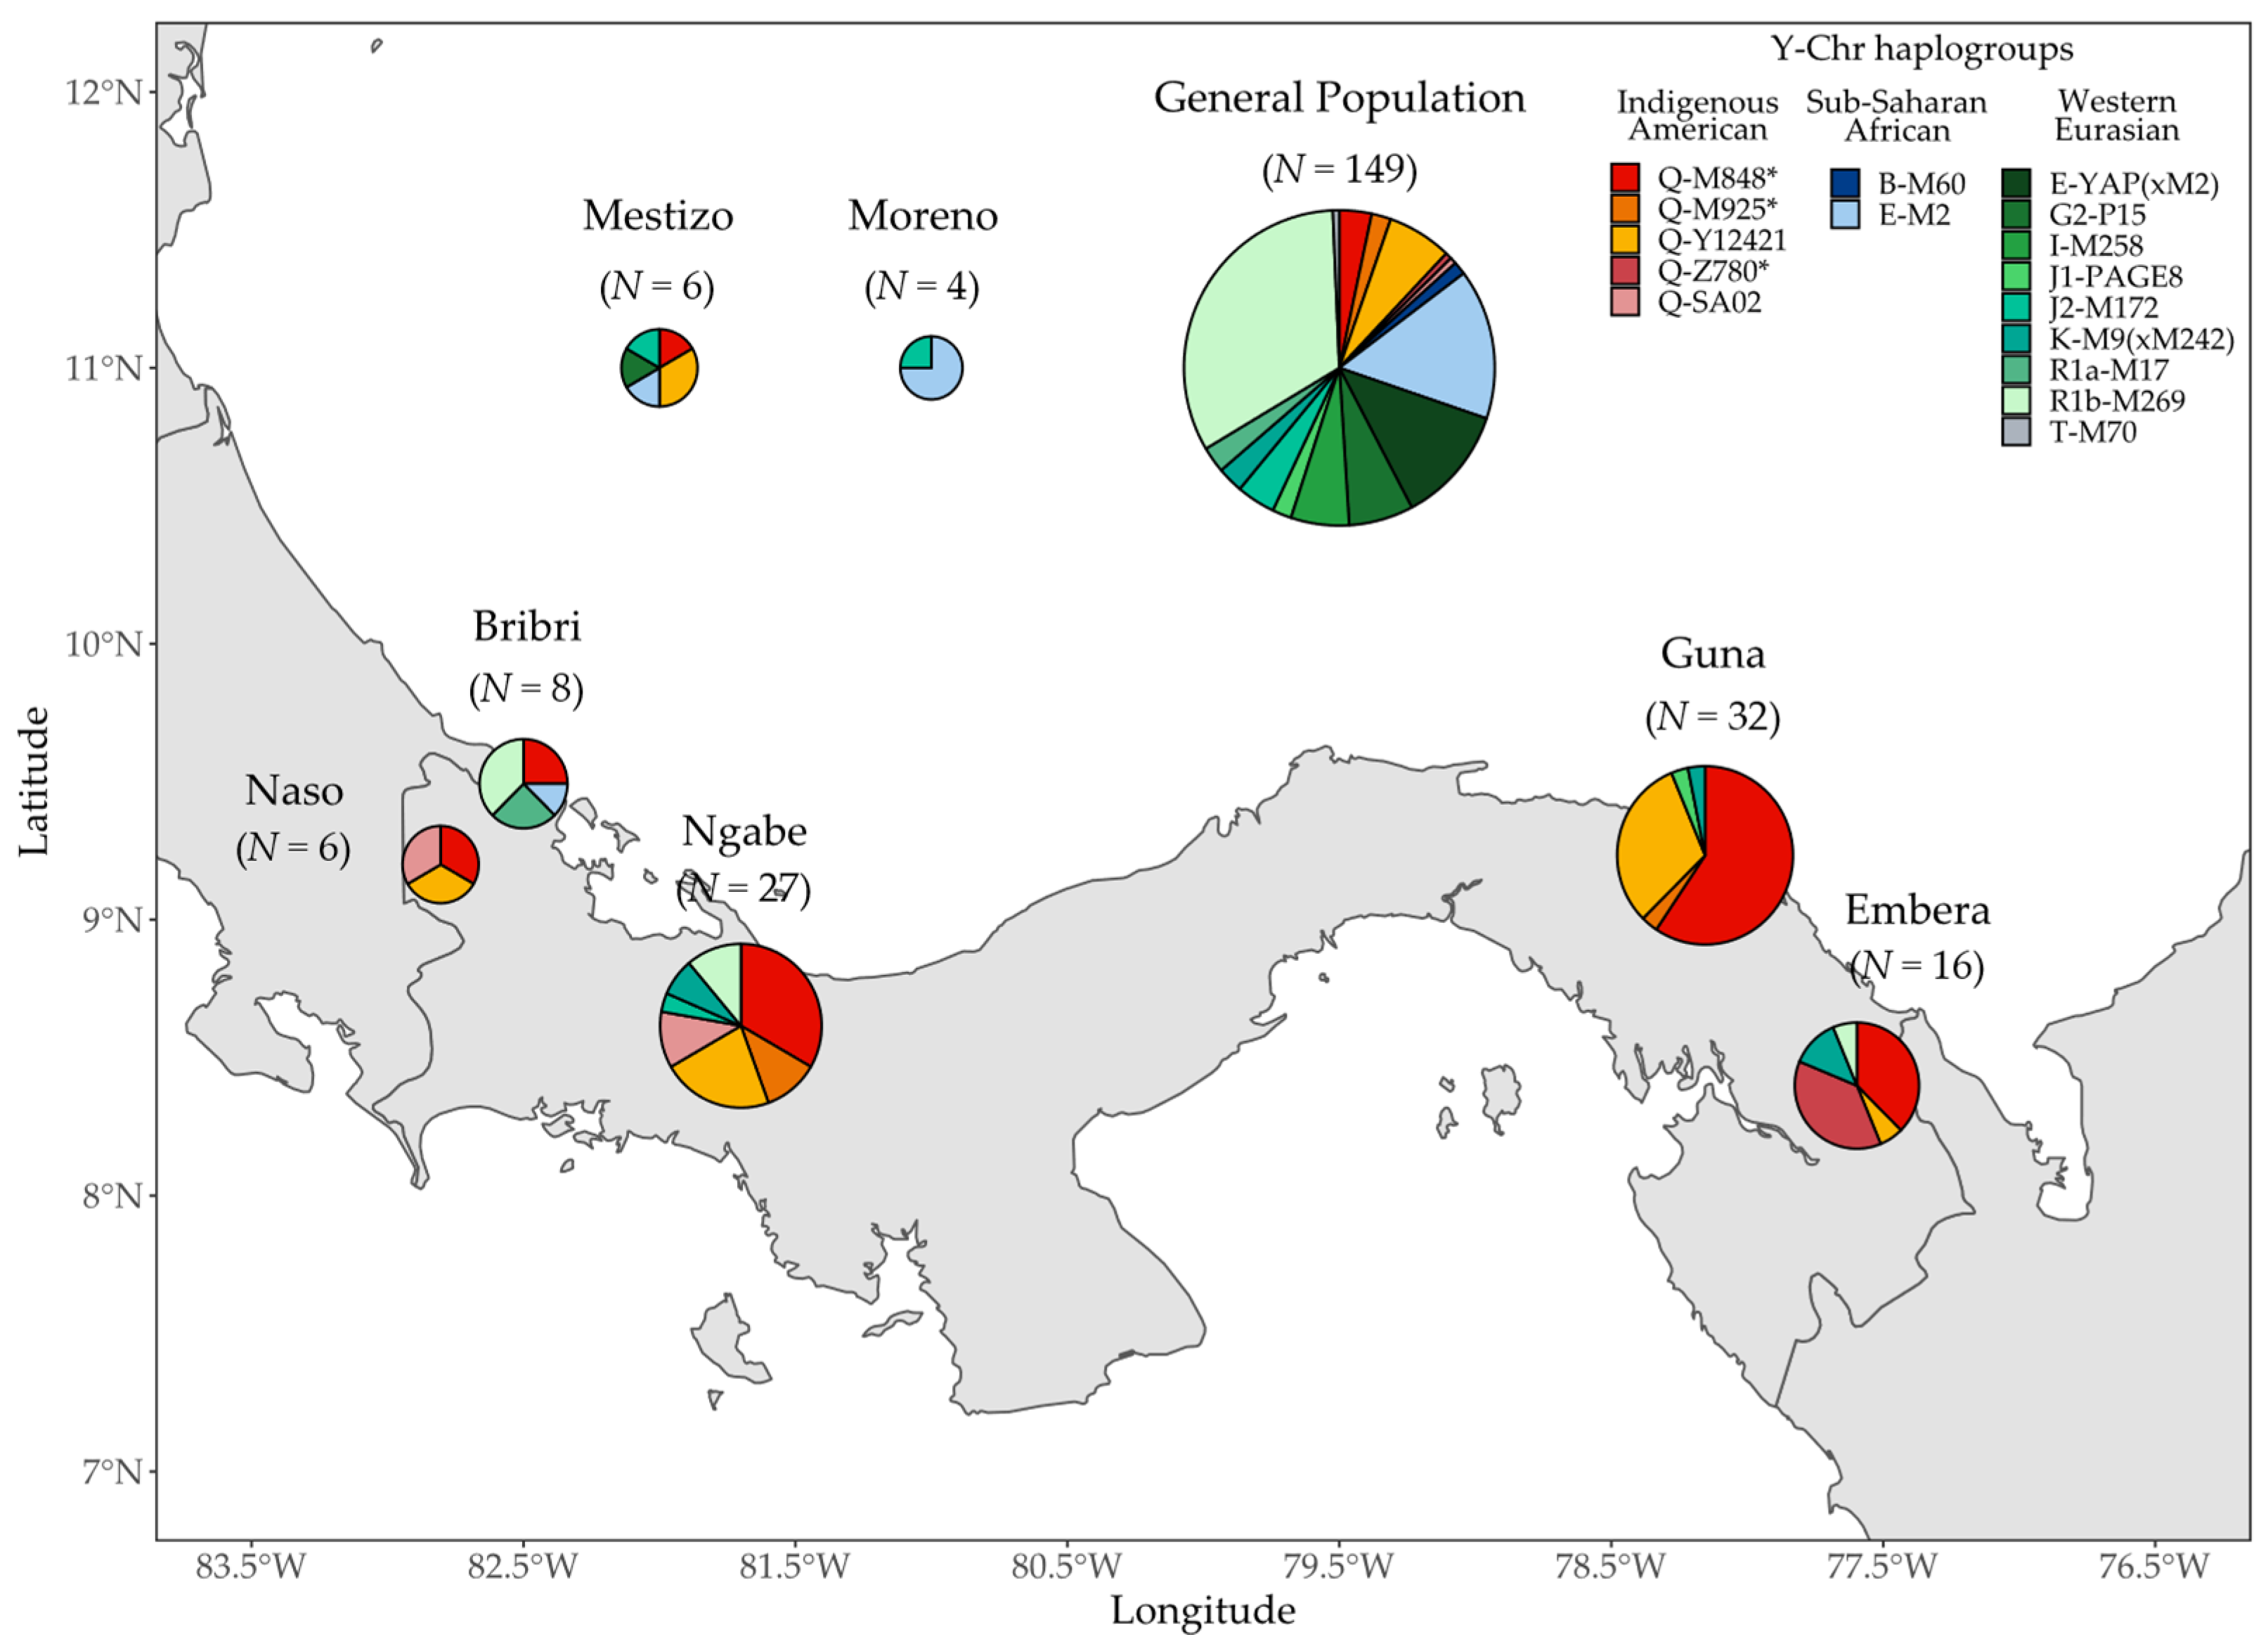
3.2. Y Chromosome
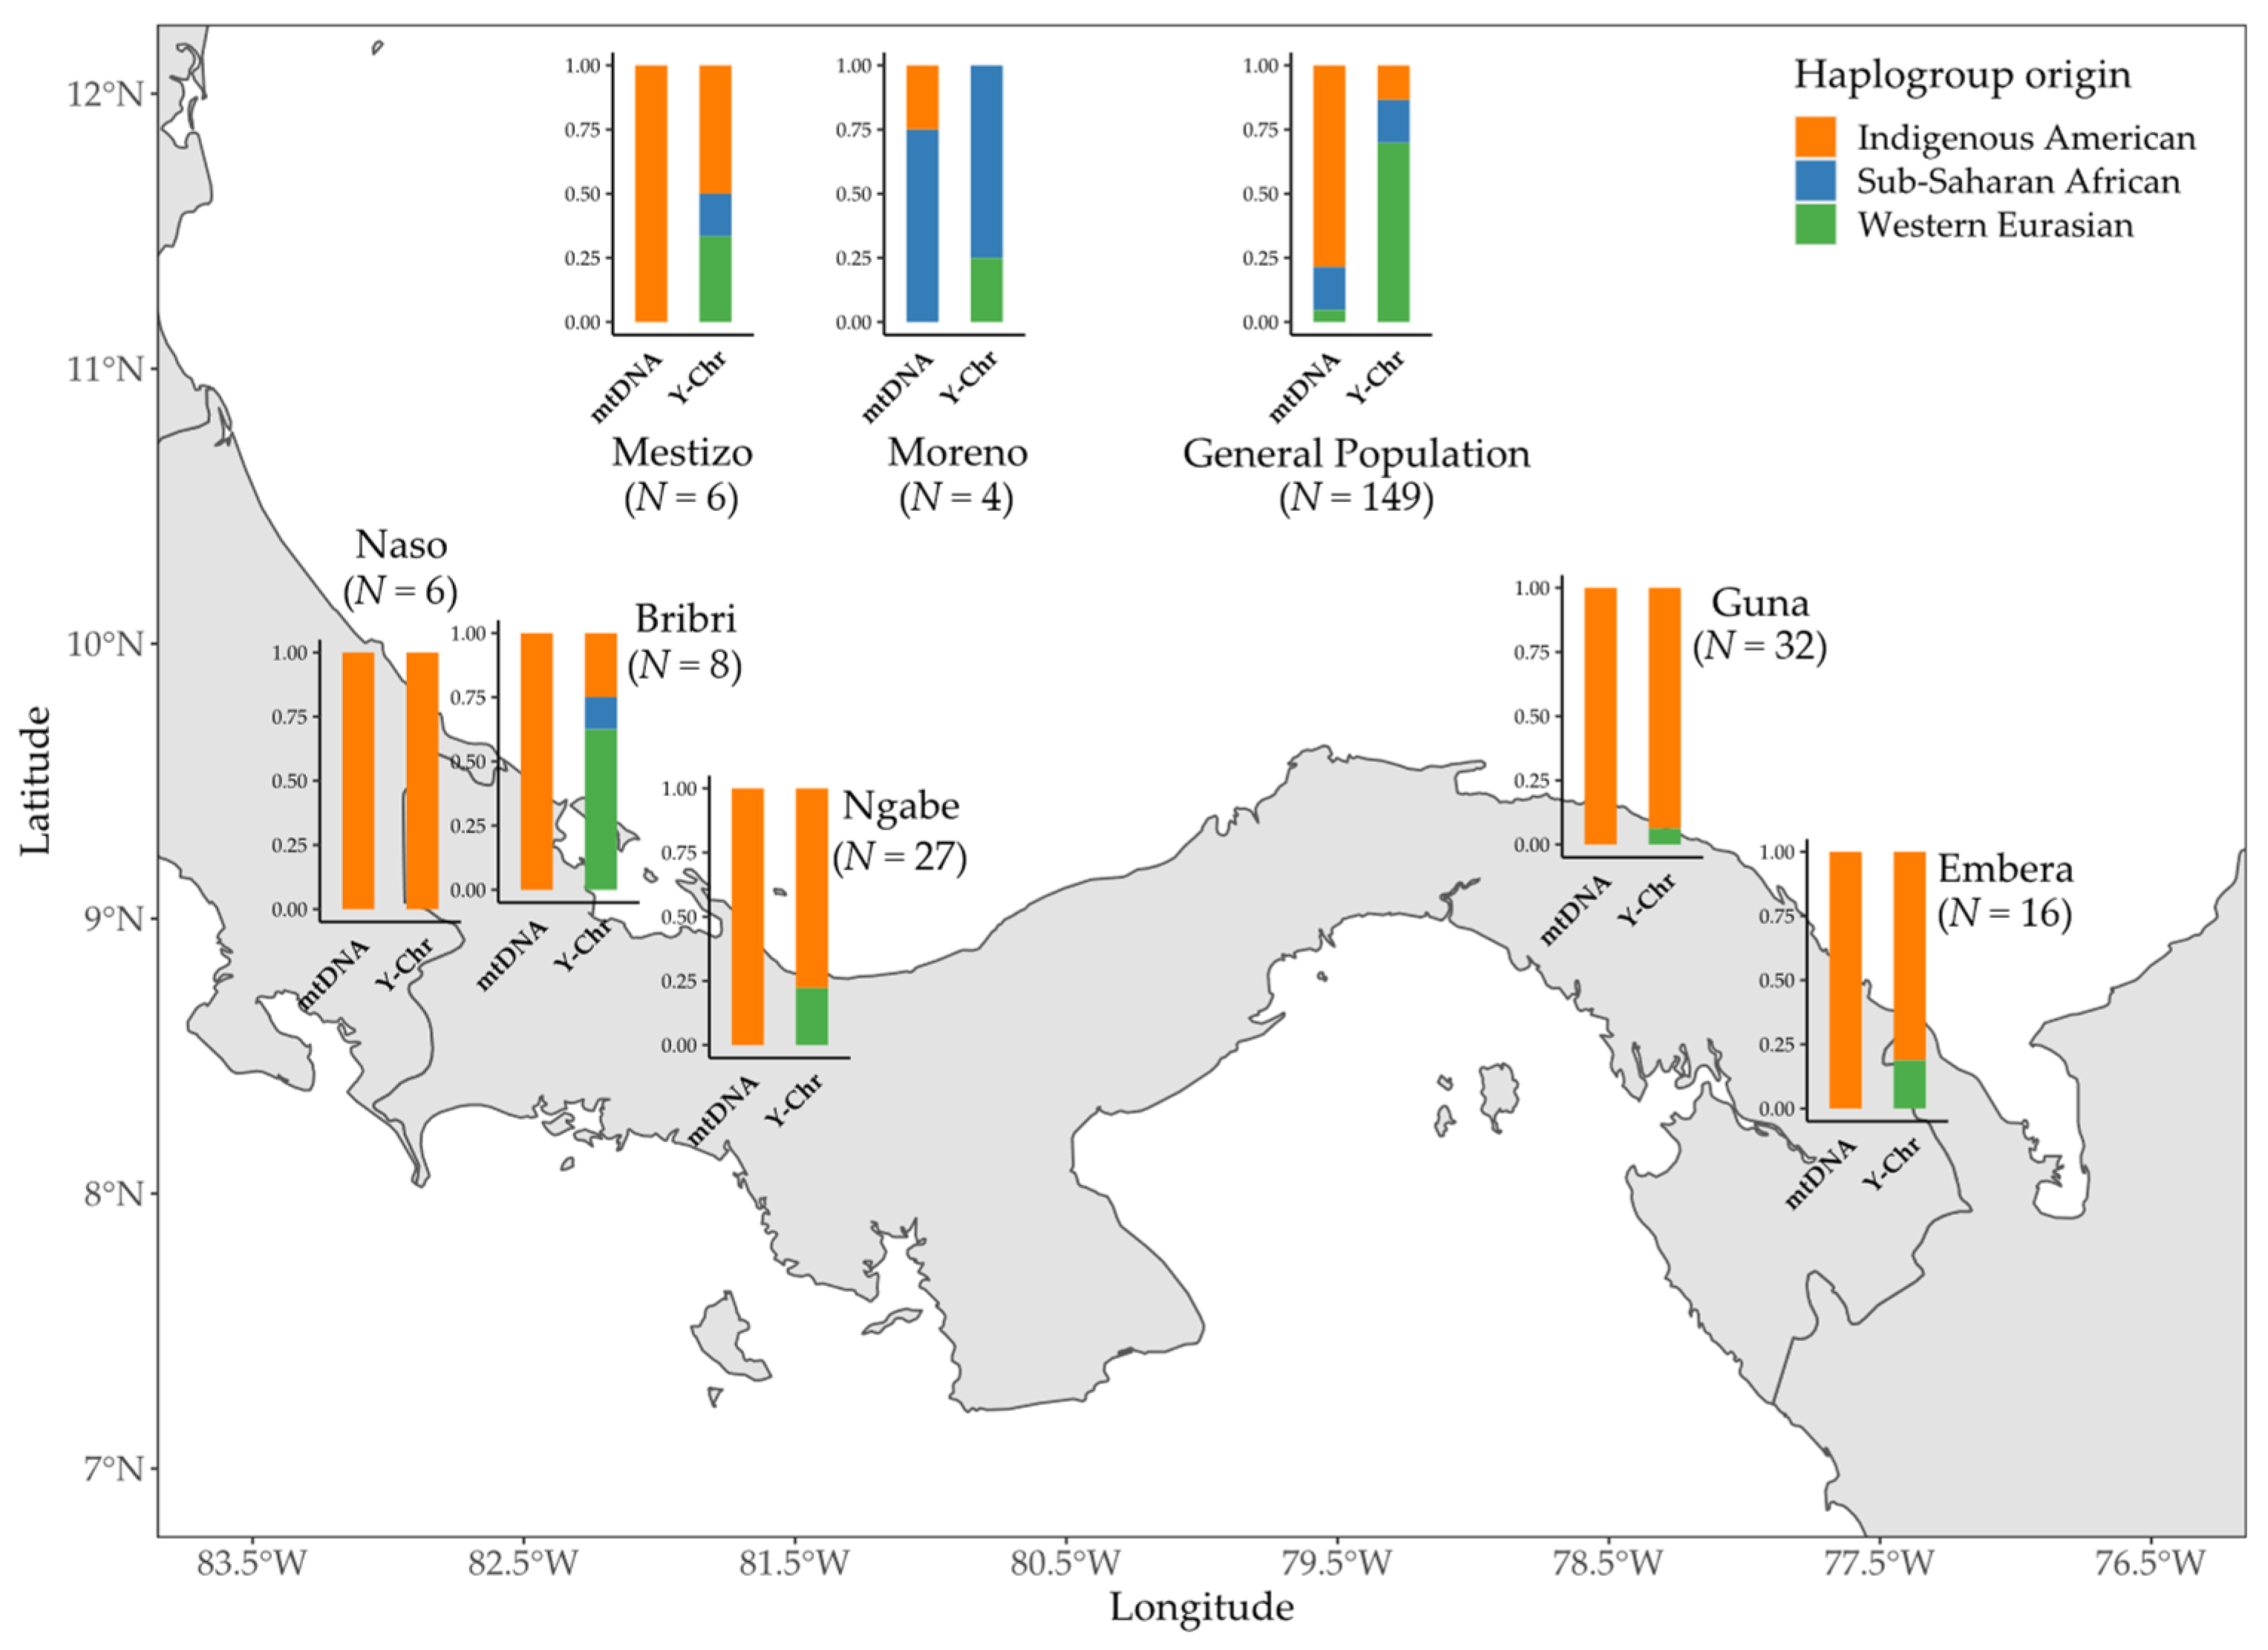
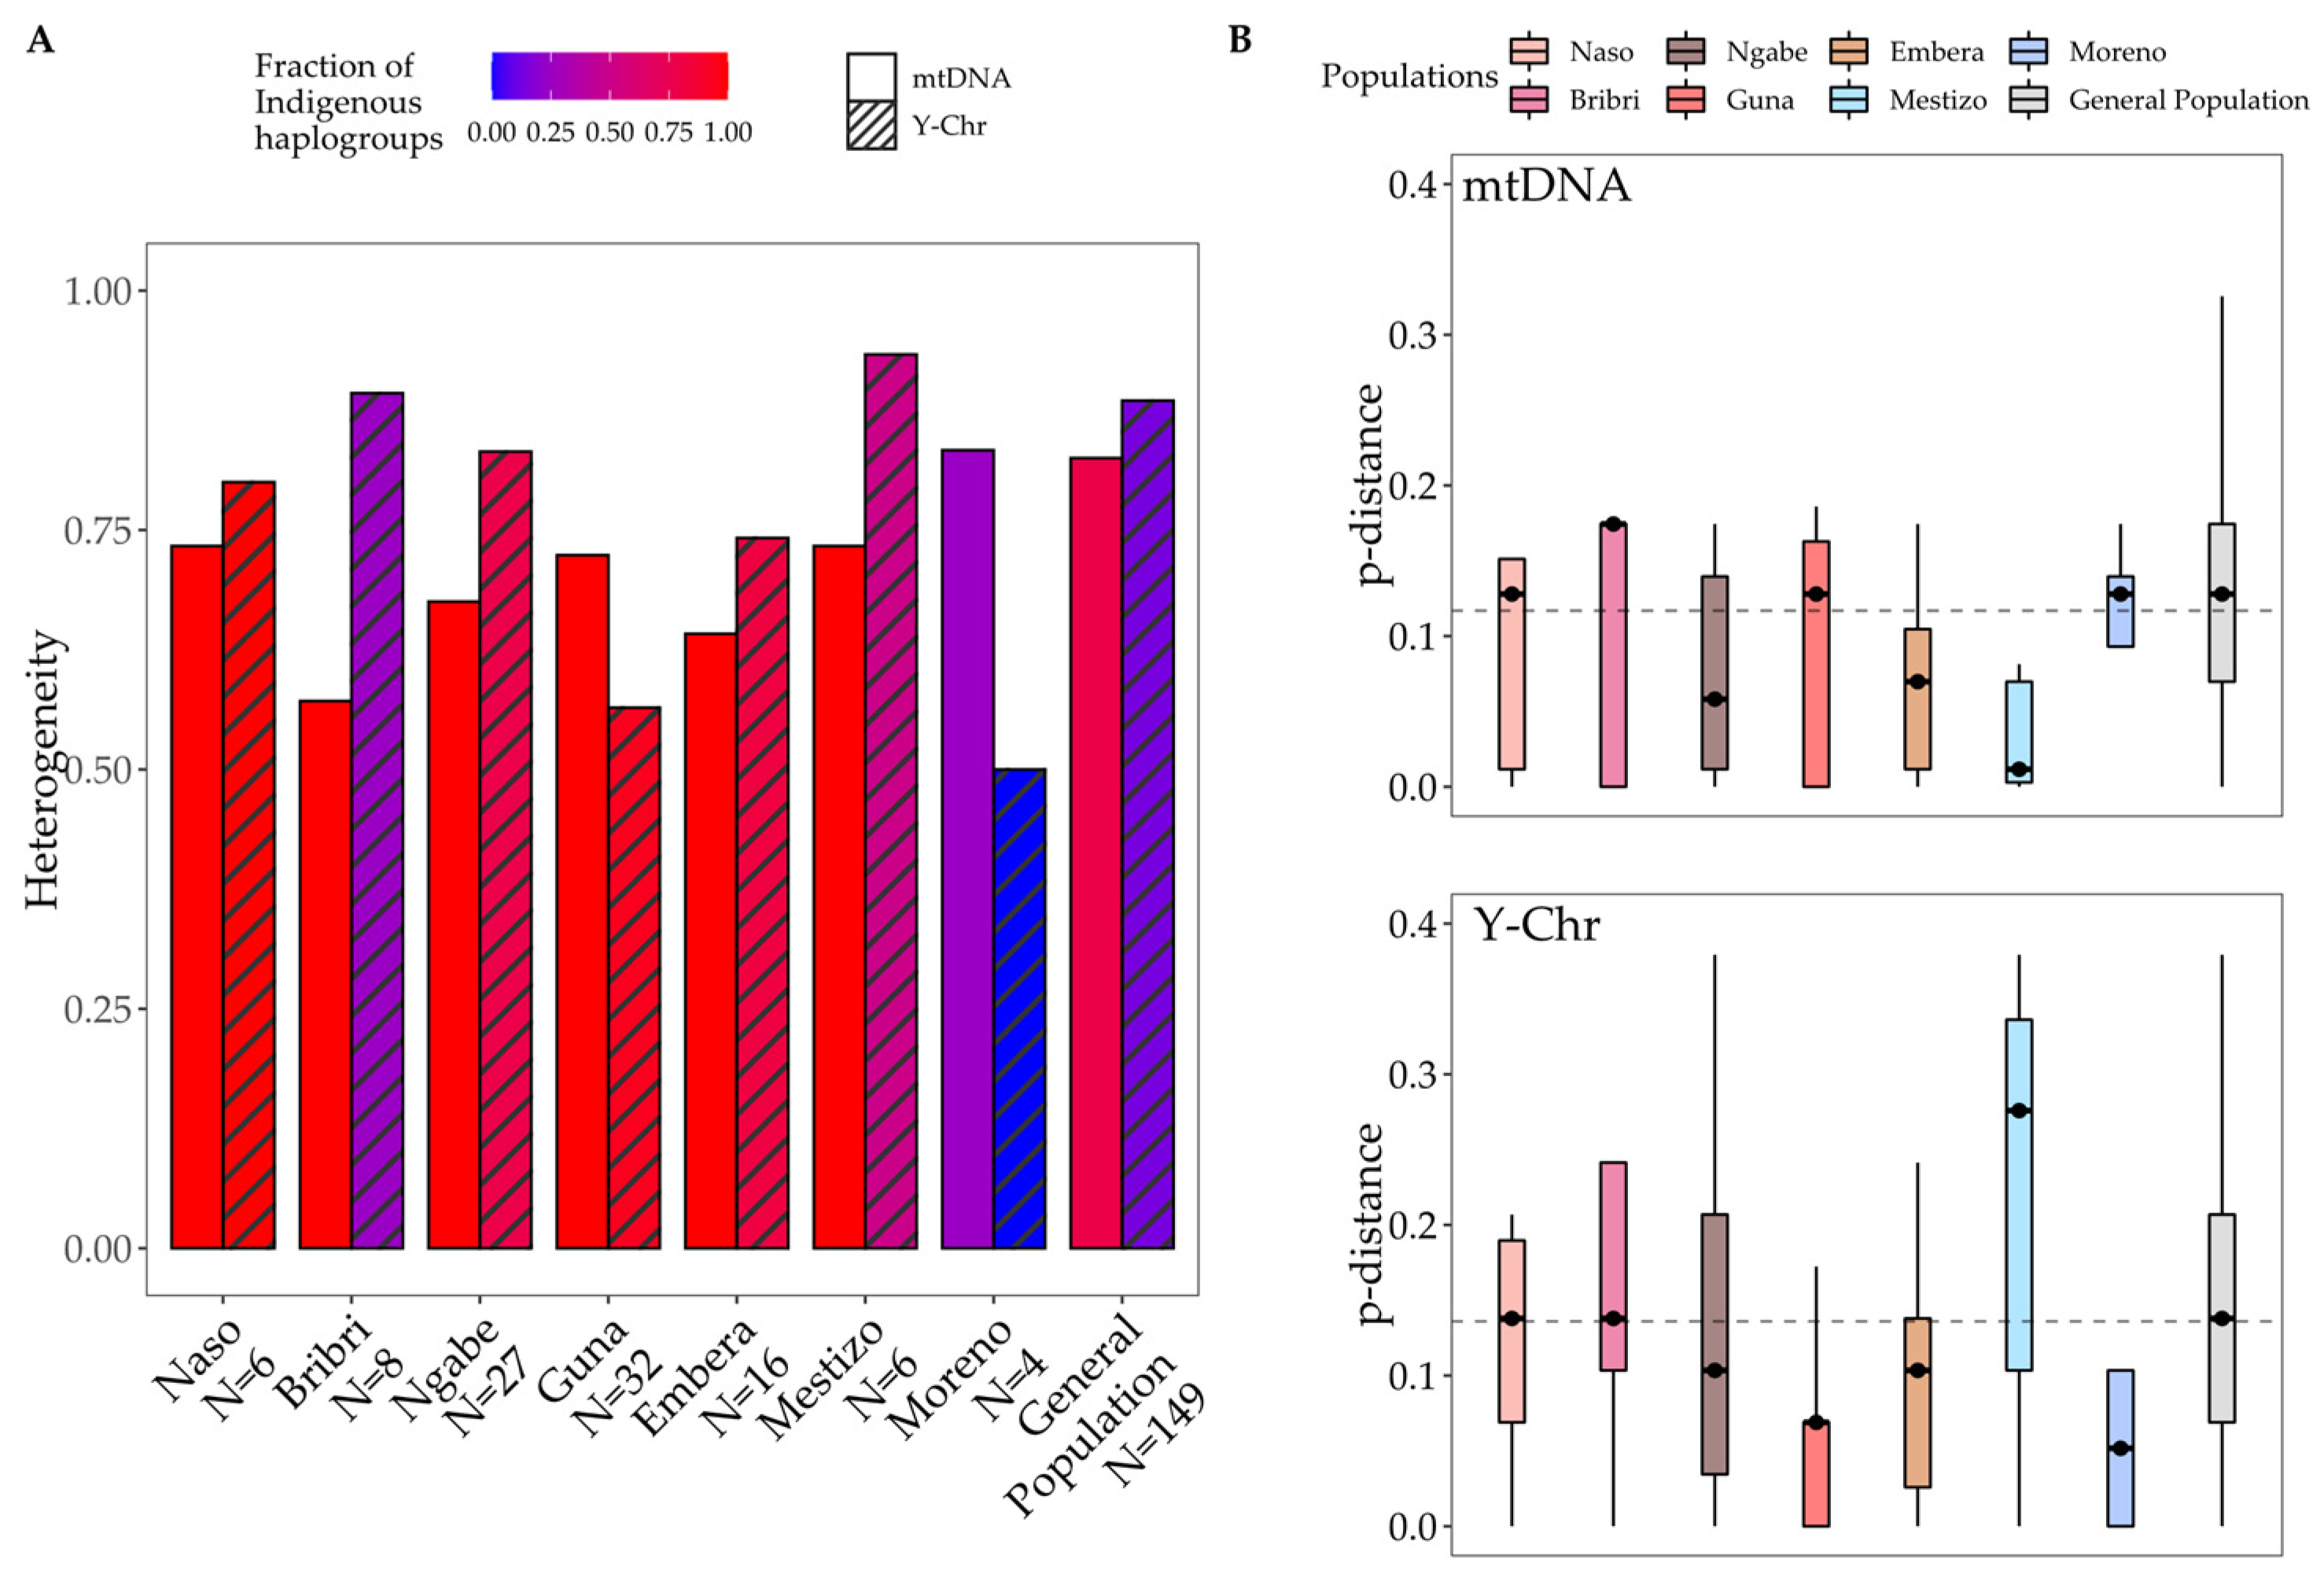
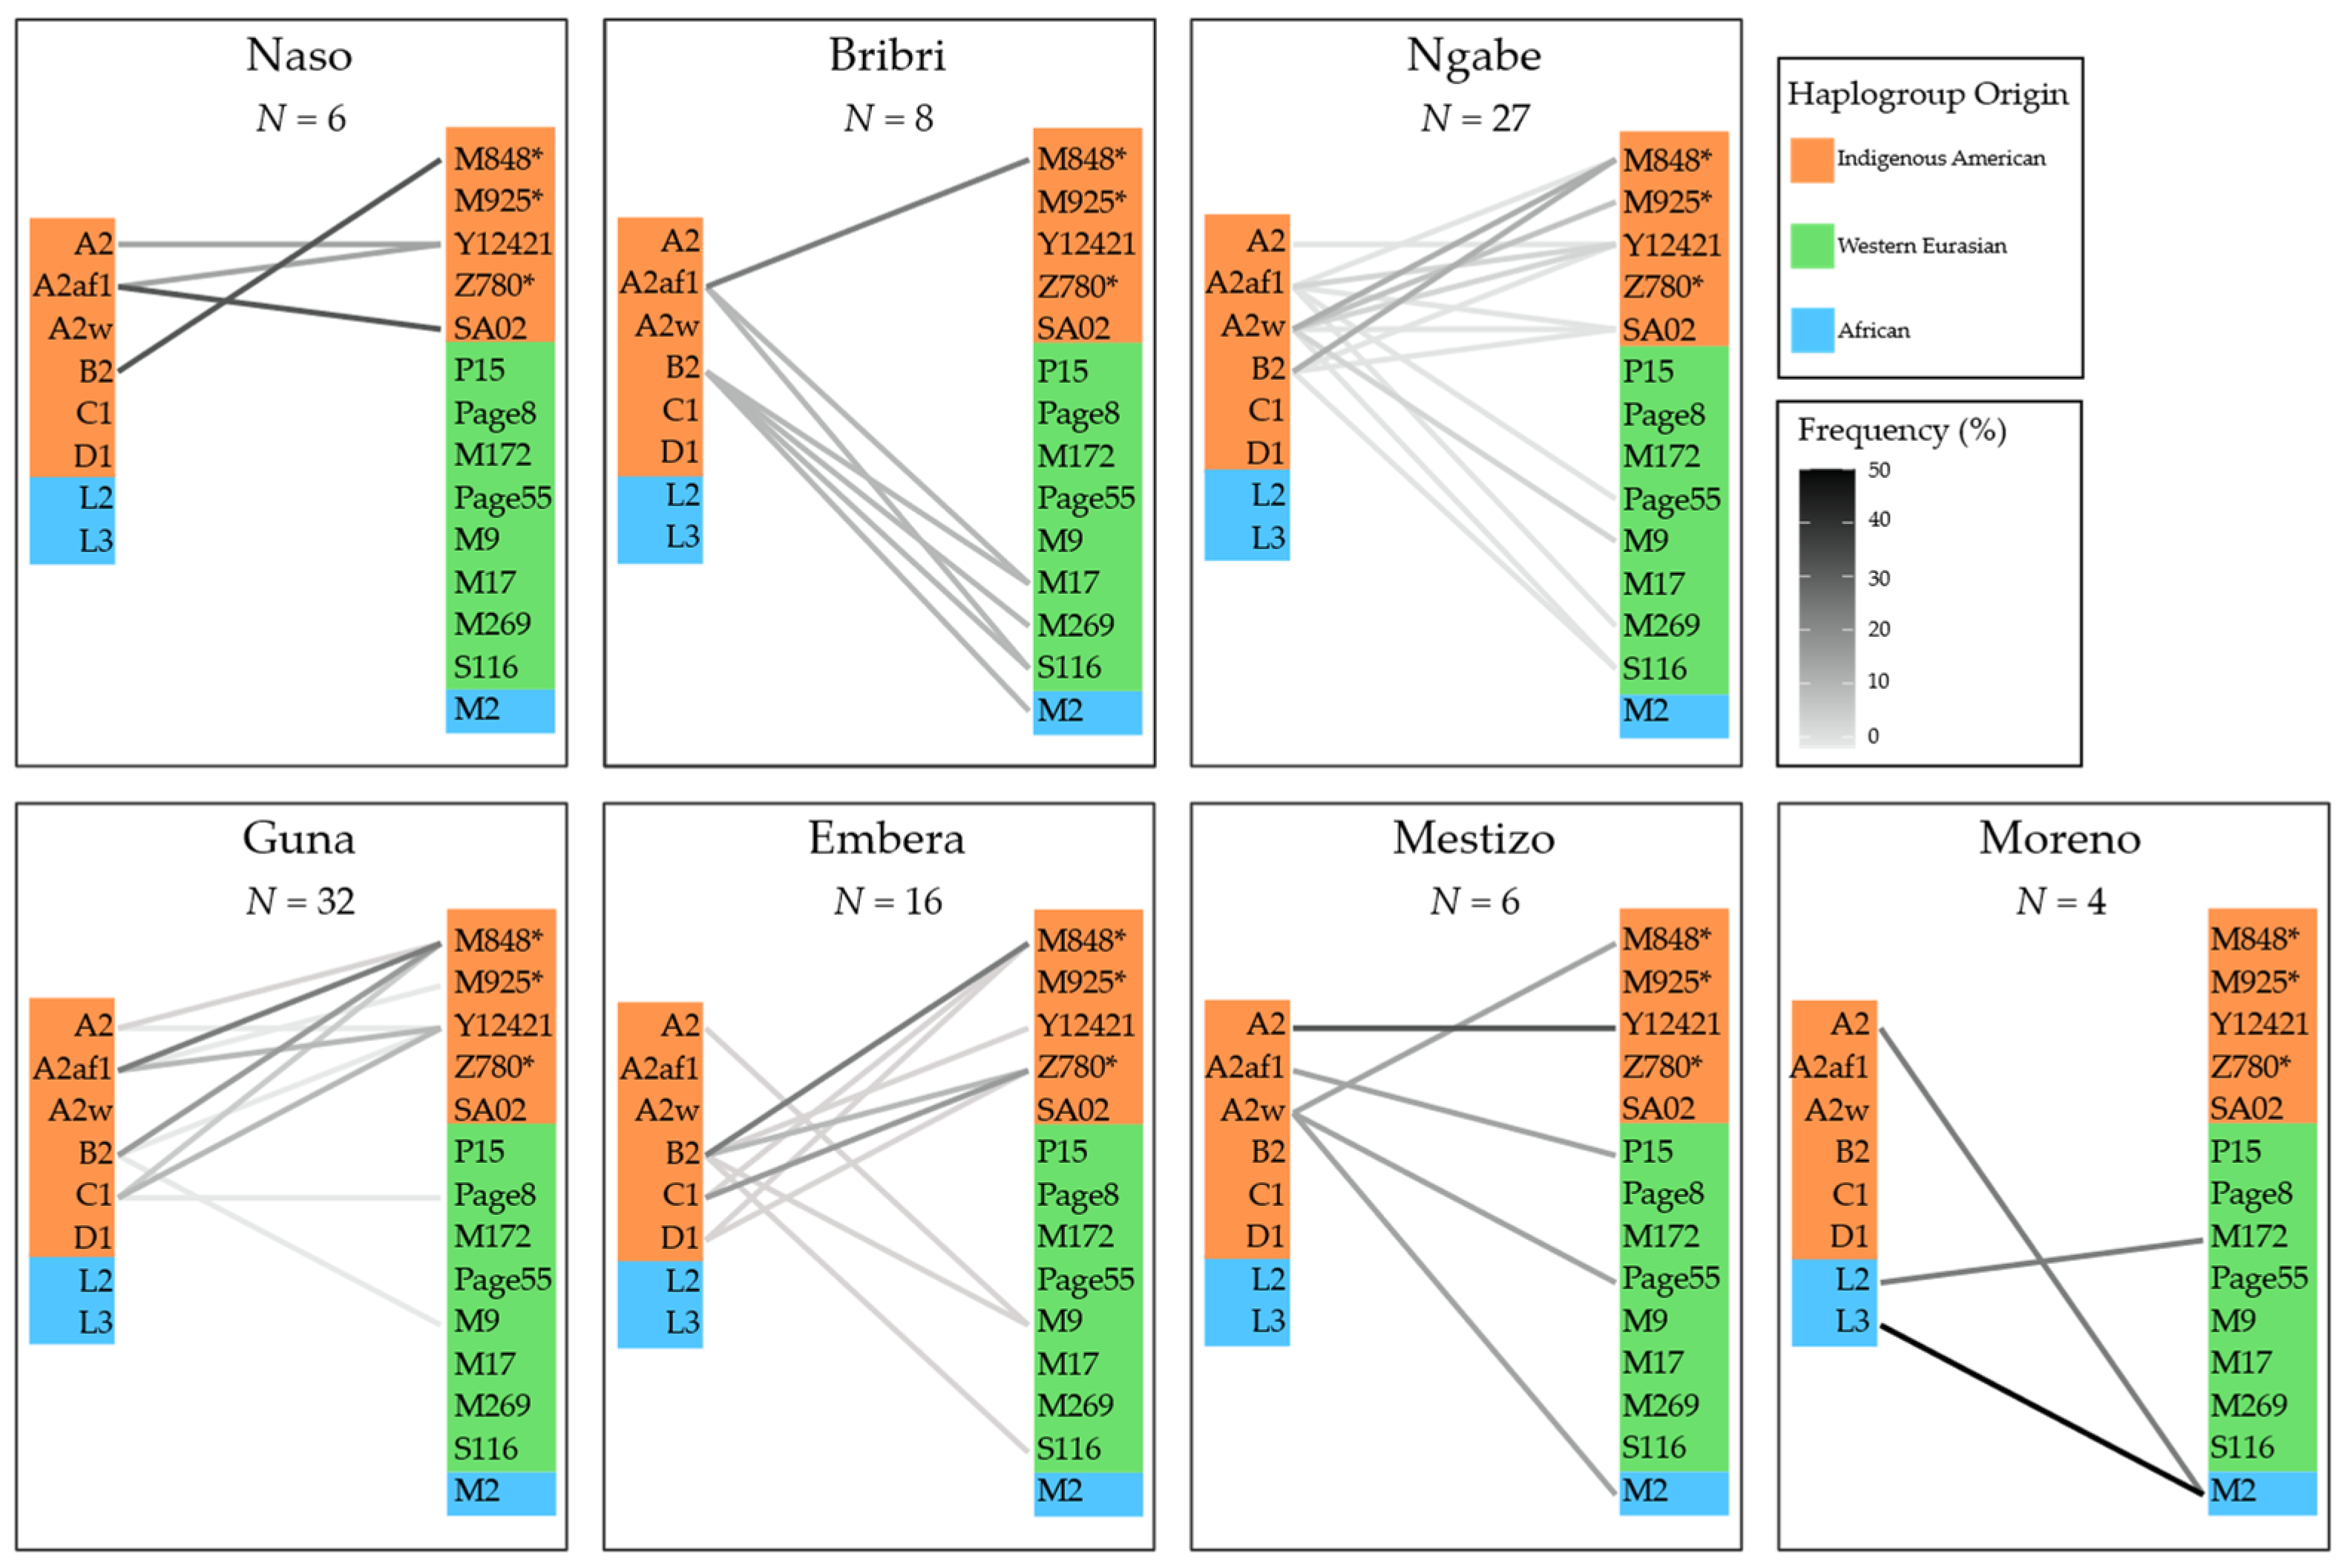
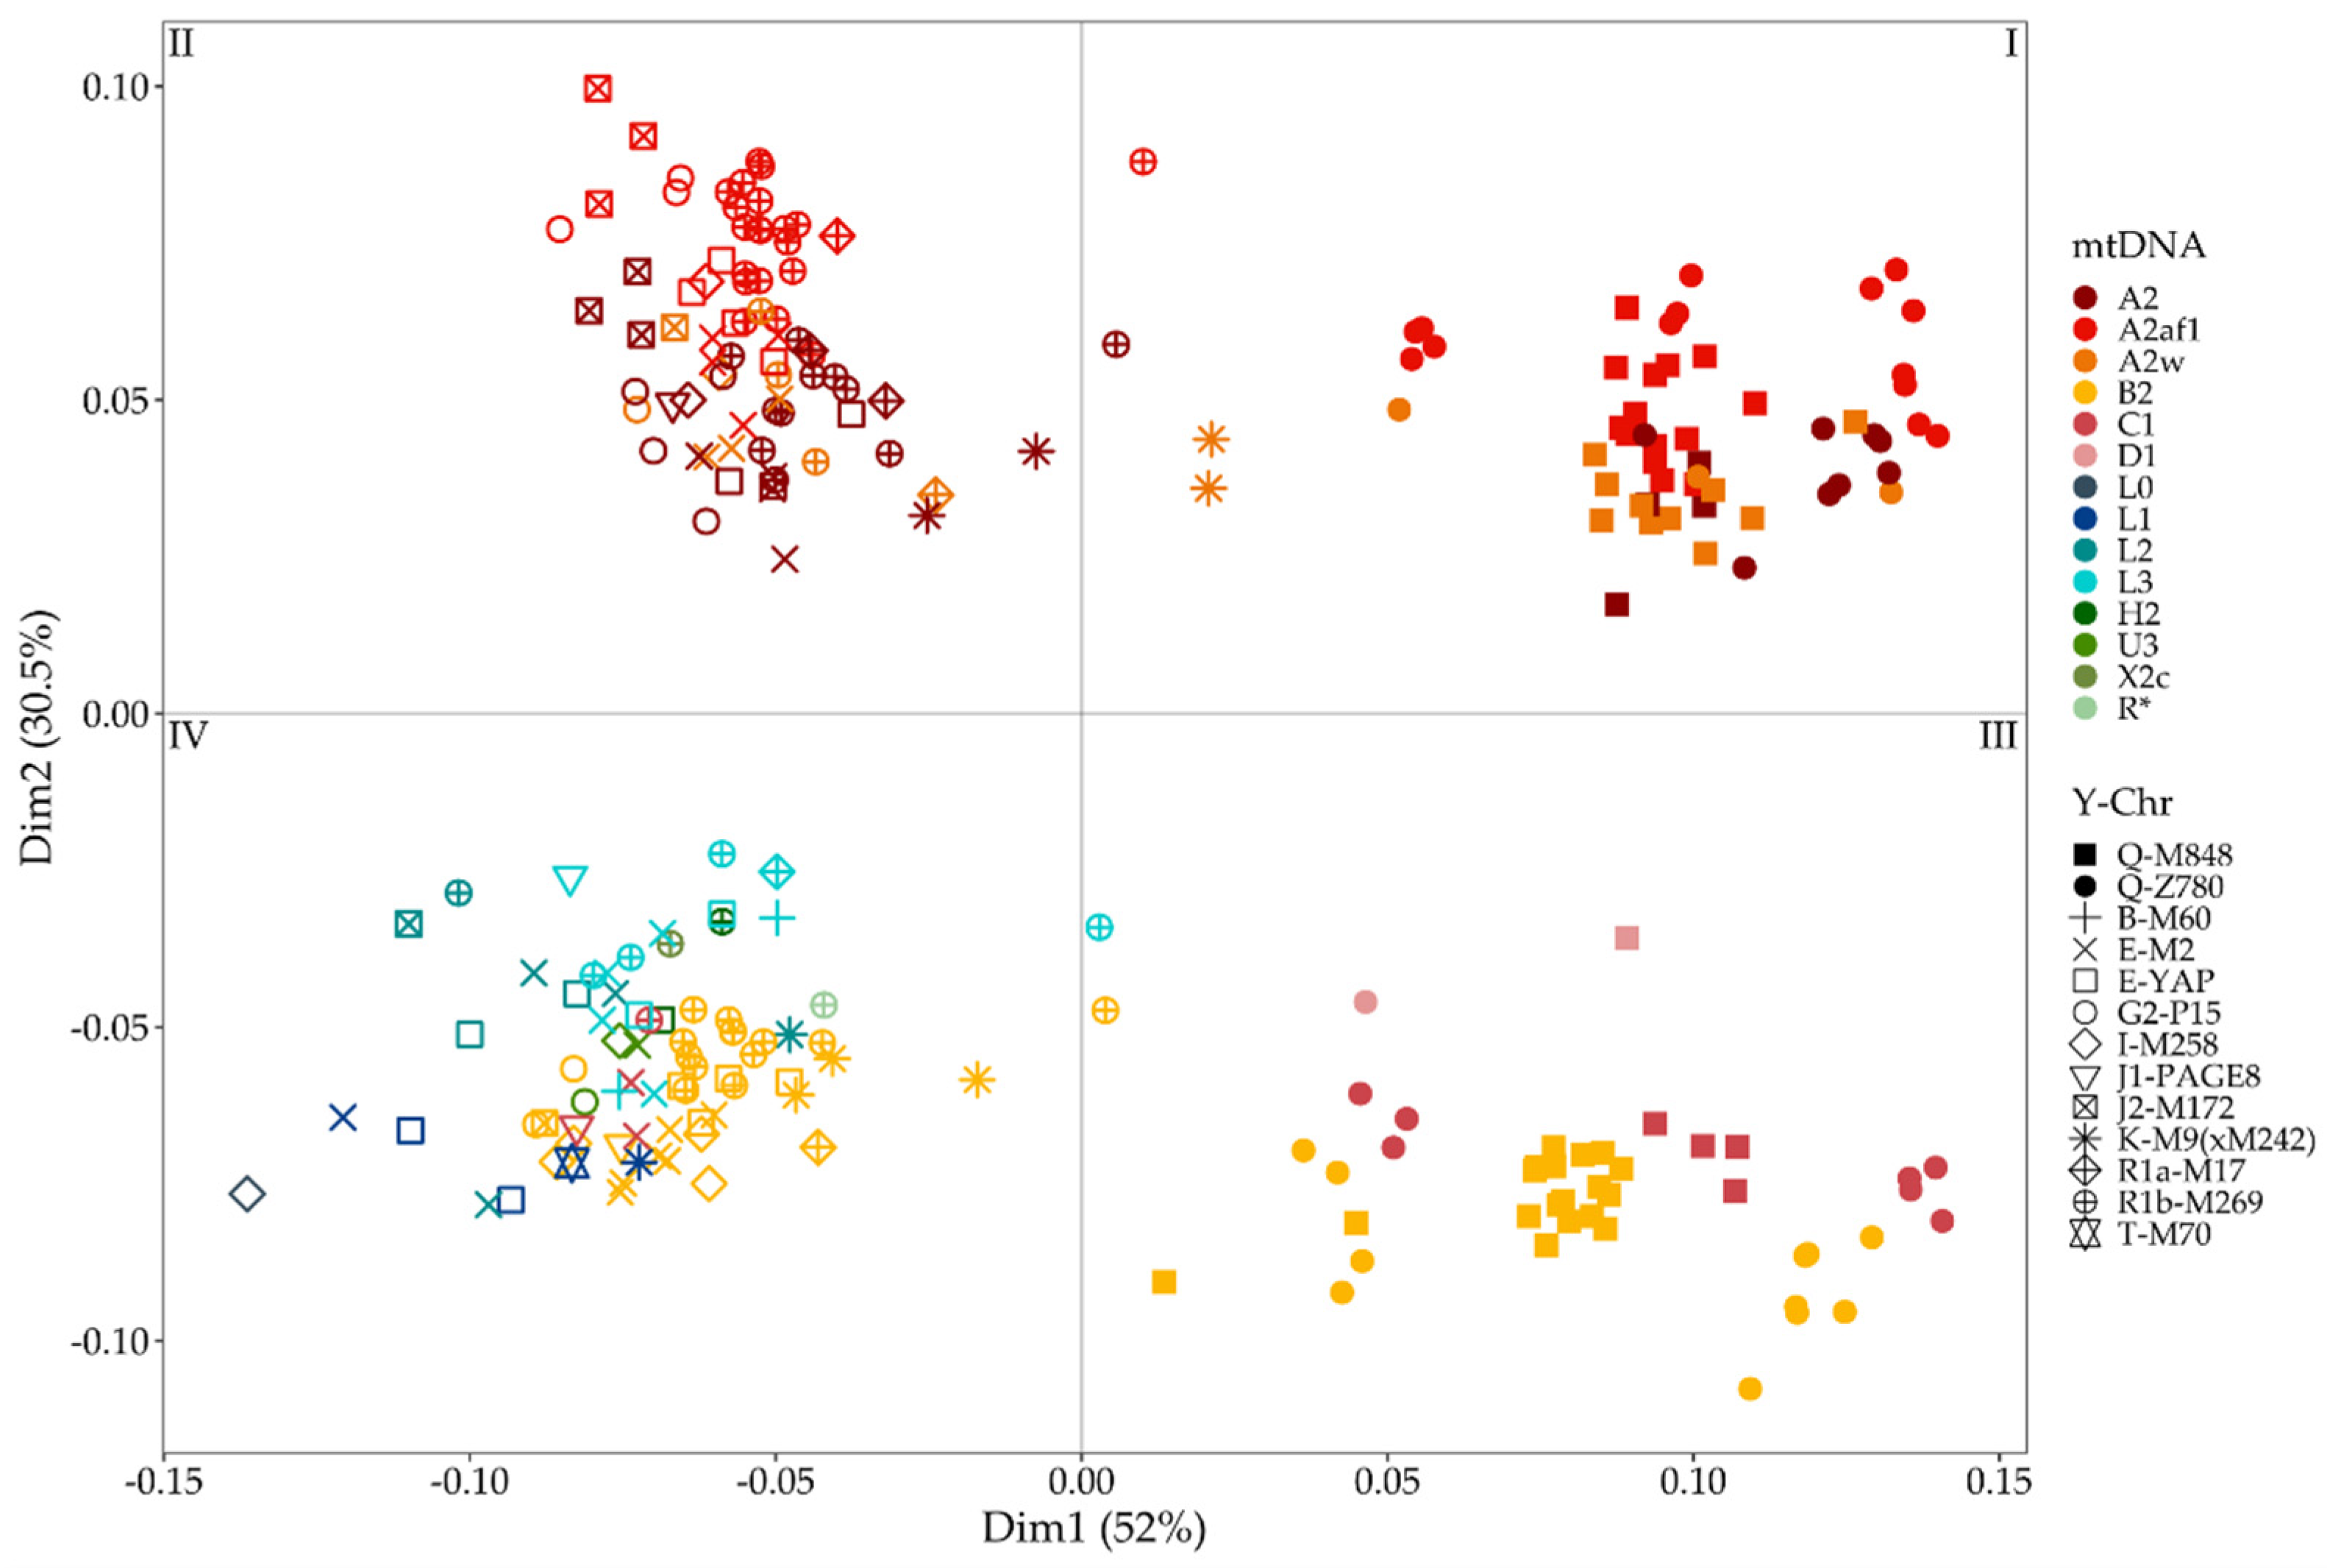
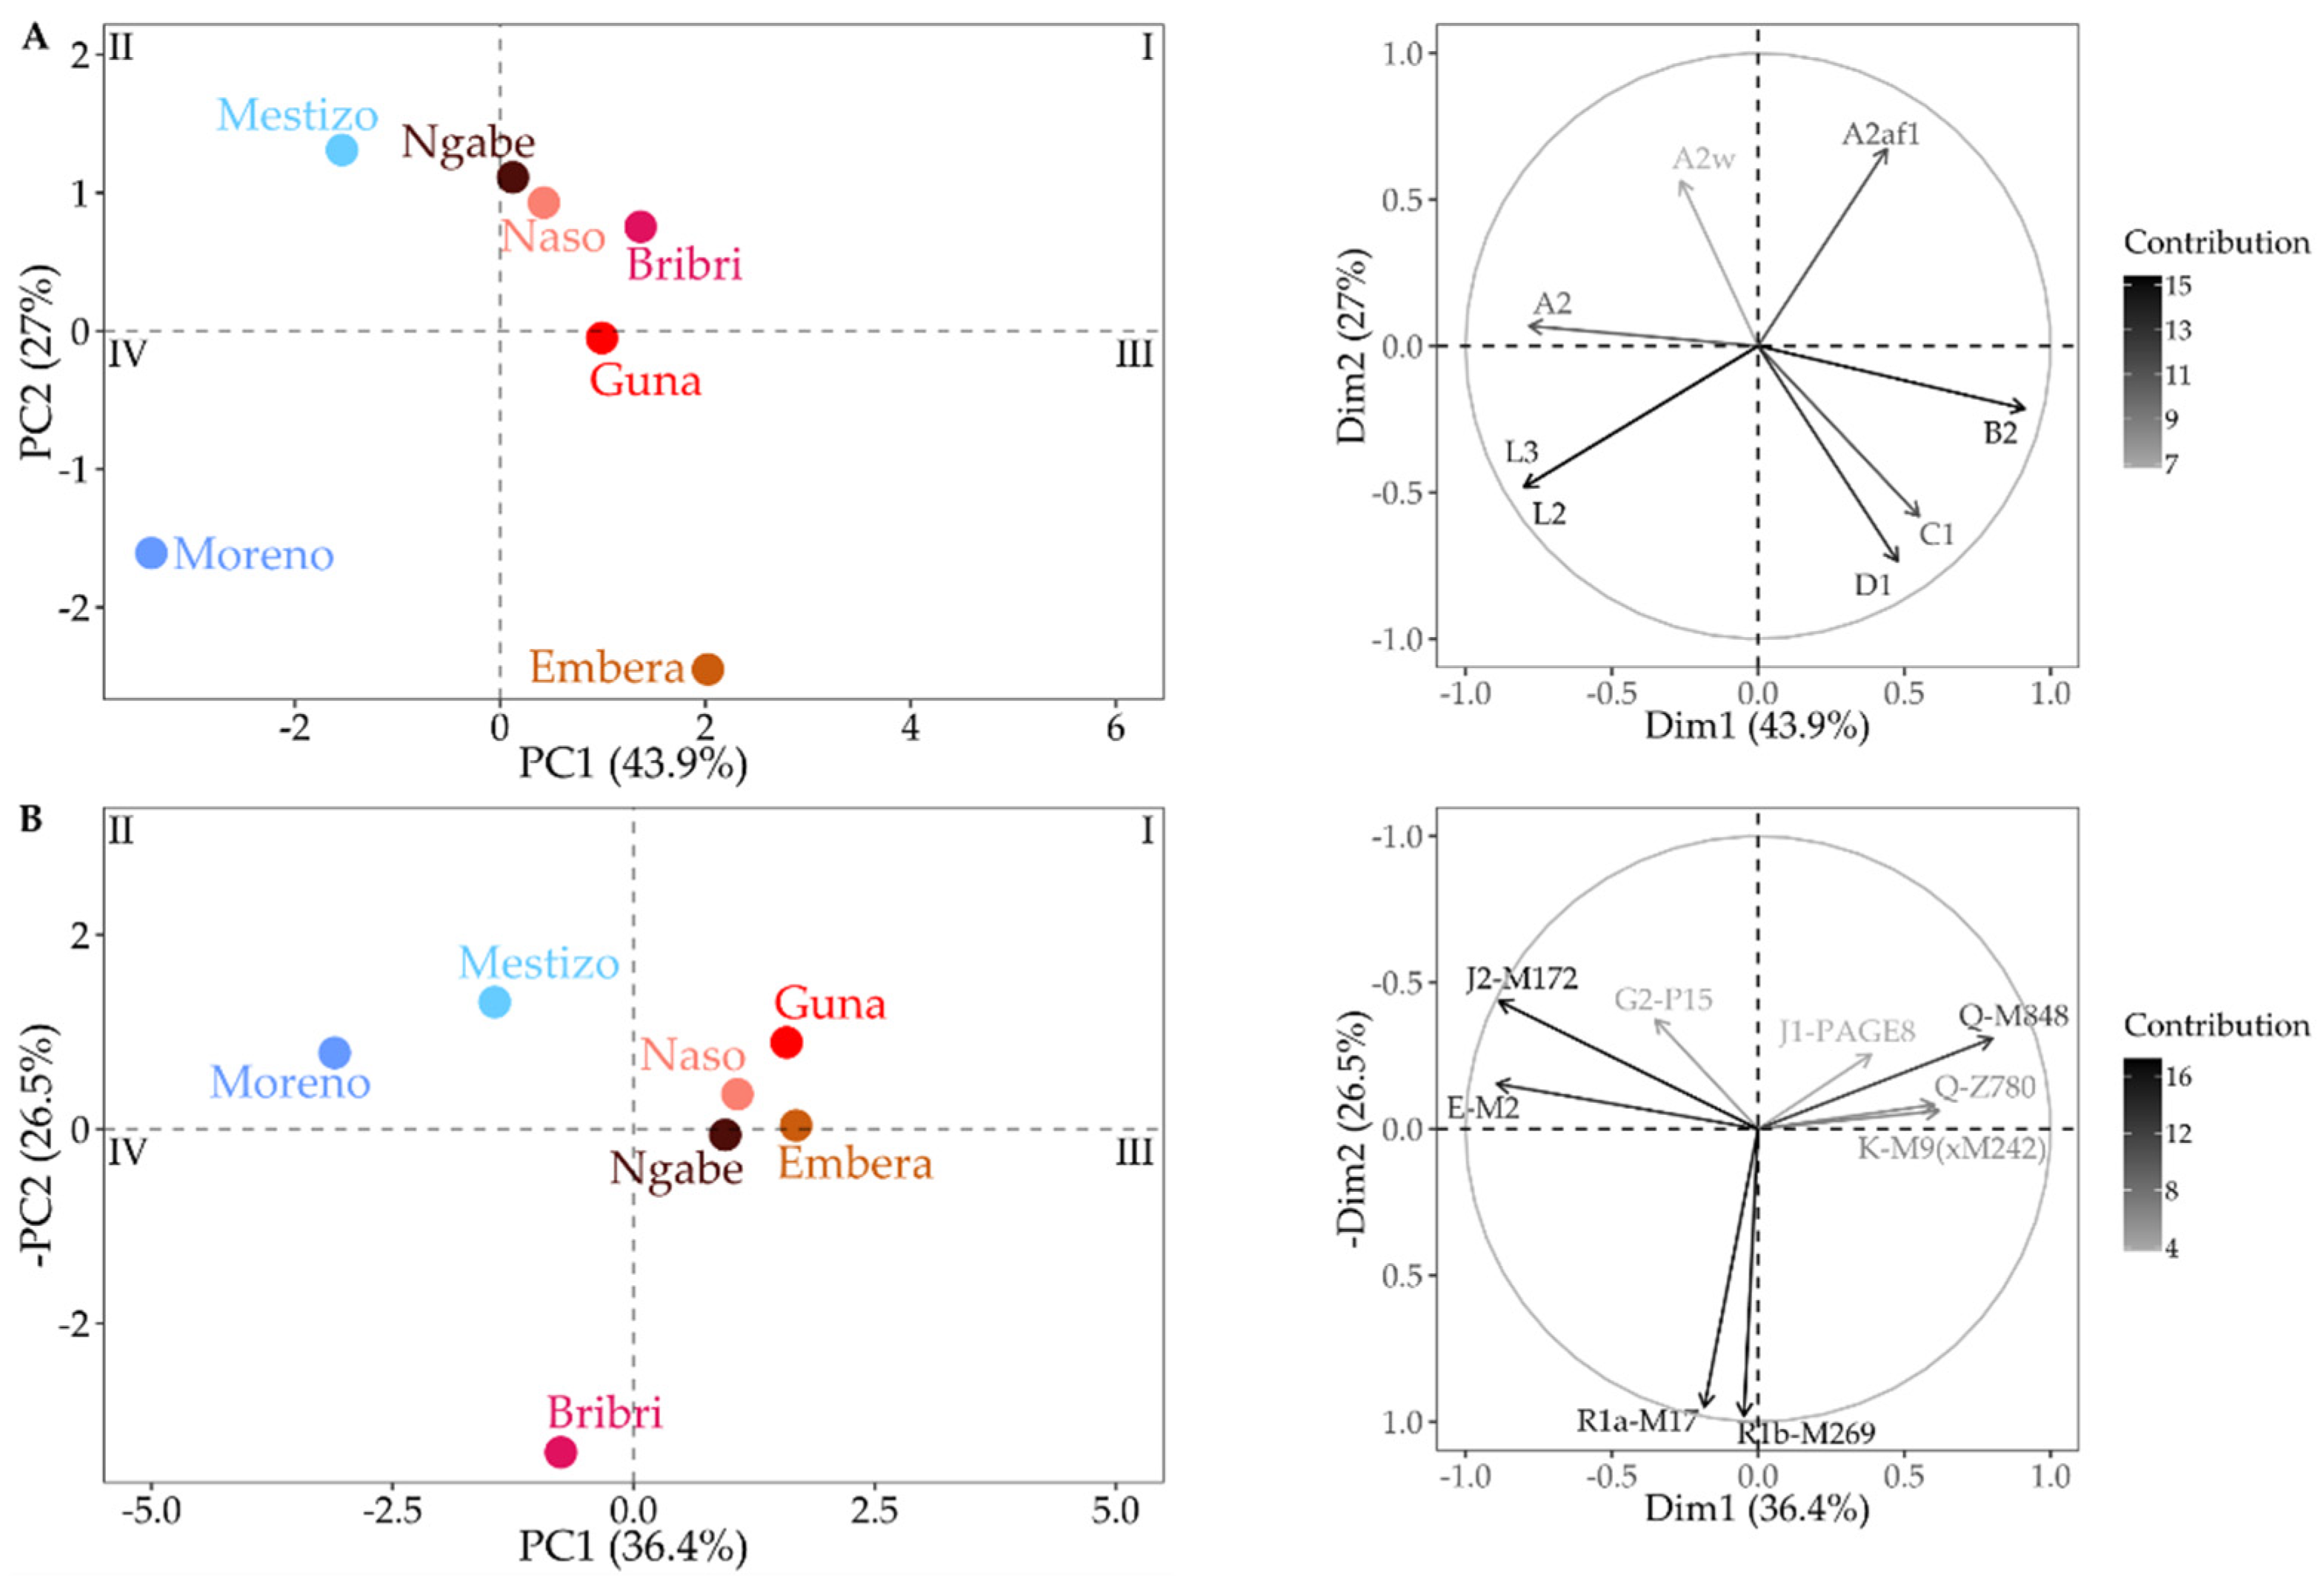
3.3. Combining MtDNA and Y-Chromosome Results
4. Discussion
5. Conclusions
Supplementary Materials
Author Contributions
Funding
Institutional Review Board Statement
Informed Consent Statement
Data Availability Statement
Acknowledgments
Conflicts of Interest
References
- Cooke, R. Prehistory of Native Americans on the Central American land bridge: Colonization, dispersal, and divergence. J. Archaeol. Res. 2005, 13, 129–187. [Google Scholar] [CrossRef]
- Cooke, R.G.; Sánchez, H.L.A.; Smith-Guzmán, N.; Lara-Kraudy, A. Panamá Prehispánico. La Nueva Historia General de Panamá; Castillero-Calvo, A., Ed.; Editora Novo Art, S.A.: Panamá City, Panama, 2019; Volume I, pp. 39–114. [Google Scholar]
- Hernández Mora, I.; Martín, J.G.; Aram, B. The first Cathedral on America’s Pacific coast. Hist. Archaeol. 2021, 55, 219–237. [Google Scholar] [CrossRef] [PubMed]
- Cooke, R.; Ranere, A.; Pearson, G.; Dickau, R. Radiocarbon chronology of early human settlement on the Isthmus of Panama (13,000–7000 BP) with comments on cultural affinities, environments, subsistence, and technological change. Quat. Int. 2013, 301, 3–22. [Google Scholar] [CrossRef]
- Ranere, A.J.; Cooke, R.G. Late glacial and Early Holocene migrations, and Middle Holocene settlement on the lower isthmian land-bridge. Quat. Int. 2021, 578, 20–34. [Google Scholar] [CrossRef]
- Piperno, D.R. Prehistoric human occupation and impacts on Neotropical forest landscapes during the Late Pleistocene and Early/Middle Holocene. In Tropical Rainforest Responses to Climatic Change; Springer: Cham, Switzerland, 2007; pp. 193–218. [Google Scholar] [CrossRef]
- Piperno, D.R. The origins of plant cultivation and domestication in the New World tropics: Patterns, process, and new developments. Curr. Anthropol. 2011, 52, S453–S470. [Google Scholar] [CrossRef]
- Ulloa, F.C. La Gran Chiriquí: Una historia cada vez más profunda. Canto Rodado 2017, 11, 27–58. [Google Scholar]
- O’Connor, L.; Muysken, P. The Native Languages of South America: Origins, Development, Typology; Cambridge University Press: Cambridge, UK, 2014. [Google Scholar]
- Costenla, A. Chibchan languages. In The Indigenous Languages of South America; Campbell, L., Grondona, V., Eds.; De Gruyter Mouton: Berlin, Germany, 2012. [Google Scholar]
- Loewen, J.A. Chocó I: Introduction and bibliography. Int. J. Am. Linguist. 1963, 29, 239–263. [Google Scholar] [CrossRef]
- Romoli, K. Los de la Lengua de Cueva; Ediciones Tercer Mundo; Instituto Colombiano de Cultura: Bogotá, Colombia, 1987; pp. 25–50. [Google Scholar]
- Cook, N.D. The Columbian exchange. In The Cambridge World History; University of California Press: Berkeley, CA, USA, 2015; pp. 103–134. [Google Scholar]
- Dobyns, H.F. Disease transfer at contact. Annu. Rev. Anthropol. 1993, 22, 273–291. [Google Scholar] [CrossRef]
- Nunn, N.; Qian, N. The Columbian exchange: A history of disease, food, and ideas. J. Econ. Perspect. 2010, 24, 163–188. [Google Scholar] [CrossRef] [Green Version]
- Castillero Calvo, A. Conquista, Evangelización y Resistencia: Triunfo o Fracaso de la Política Indigenista? Editora Nova: Panamá City, Panama, 2017. [Google Scholar]
- Castillero Calvo, A. (Ed.) La Esclavitud Negra. Nueva Historia General de Panamá; Editora Novo Art, S.A. & Comisión Panamá 500: Panamá City, Panama, 2019. [Google Scholar]
- Aram, B.; García-Falcón, M.E. Rice revisited from Colonial Panamá. Its cultivation and exportation. In American Globalization, 1492–1850. Trans-Cultural Consumption in Spanish Latin America; Yun-Casalilla, B., Berti, I., Svriz-Wucherer, O., Eds.; Taylor & Francis: Abingdon-on-Thames, UK, 2021; pp. 146–168. [Google Scholar]
- National Library of Madrid, ms. 3064, f. 53-82, Description of Panamá and Its Province, 1607. Available online: https://artempire.cica.es/historic/documents/2874 (accessed on 7 October 2021).
- Ongaro, L.; Scliar, M.O.; Flores, R.; Raveane, A.; Marnetto, D.; Sarno, S.; Gnecchi-Ruscone, G.A.; Alarc ón-Riquelme, M.E.; Patin, E.; Wangkumhang, P.; et al. The genomic impact of European colonization of the Americas. Curr. Biol. 2019, 29, 3974–3986. [Google Scholar] [CrossRef]
- Ongaro, L.; Molinaro, L.; Flores, R.; Marnetto, D.; Capodiferro, M.R.; Alarcón-Riquelme, M.E.; Moreno-Estrada, A.; Mabunda, N.; Ventura, M.; Tambets, K. Evaluating the impact of sex-biased genetic admixture in the Americas through the analysis of haplotype data. Genes 2021, 12, 1580. [Google Scholar] [CrossRef] [PubMed]
- Fortes-Lima, C.; Verdu, P. Anthropological genetics perspectives on the transatlantic slave trade. Hum. Mol. Genet. 2021, 30, R79–R87. [Google Scholar] [CrossRef]
- Melton, P.E.; Baldi, N.F.; Barrantes, R.; Crawford, M.H. Microevolution, migration, and the population structure of five Amerindian populations from Nicaragua and Costa Rica. Am. J. Hum. Biol. 2013, 25, 480–490. [Google Scholar] [CrossRef]
- Carvajal-Carmona, L.G.; Soto, I.D.; Pineda, N.; Ortíz-Barrientos, D.; Duque, C.; Ospina-Duque, J.; McCarthy, M.; Montoya, P.; Alvarez, V.M.; Bedoya, G.; et al. Strong Amerind/white sex bias and a possible Sephardic contribution among the founders of a population in northwest Colombia. Am. J. Hum. Genet. 2000, 67, 1287–1295. [Google Scholar] [CrossRef] [Green Version]
- Seielstad, M. Asymmetries in the maternal and paternal genetic histories of Colombian populations. Am. J. Hum. Genet. 2000, 67, 1062–1066. [Google Scholar] [CrossRef]
- Mesa, N.R.; Mondragón, M.C.; Soto, I.D.; Parra, M.V.; Duque, C.; Ortíz-Barrientos, D.; García, L.F.; Velez, I.D.; Bravo, M.L.; Múnera, J.G.; et al. Autosomal, mtDNA, and Y-chromosome diversity in Amerinds: Pre- and post-Columbian patterns of gene flow in South America. Am. J. Hum. Genet. 2000, 67, 1277–1286. [Google Scholar] [CrossRef] [PubMed] [Green Version]
- Perego, U.A.; Lancioni, H.; Tribaldos, M.; Angerhofer, N.; Ekins, J.E.; Olivieri, A.; Woodward, S.R.; Pascale, J.M.; Cooke, R.; Motta, J.; et al. Decrypting the mitochondrial gene pool of modern Panamanians. PLoS ONE 2012, 7, e38337. [Google Scholar] [CrossRef] [Green Version]
- Grugni, V.; Battaglia, V.; Perego, U.A.; Raveane, A.; Lancioni, H.; Olivieri, A.; Ferretti, L.; Woodward, S.R.; Pascale, J.M.; Cooke, R.; et al. Exploring the Y chromosomal ancestry of modern Panamanians. PLoS ONE 2015, 10, e0144223. [Google Scholar] [CrossRef] [Green Version]
- Castillero Calvo, A. (Ed.) Color y Movilidad Social. Nueva Historia General de Panamá; Editora Novo Art, S.A. & Comisión Panamá 500: Panamá City, Panama, 2019; Volume 1, pp. 475–516. [Google Scholar]
- Newson, L.; Minchin, S. From Capture to Sale: The Portuguese Slave Trade to Spanish South America in the Early Seventeenth Century; Brill: Leiden, The Netherlands, 2007. [Google Scholar]
- Vega Franco, M. El Tráfico de Esclavos con América (Asientos de Grillo y Lomelín, 1663–1674); Escuela de Estudios Hispano-Americanos de Sevilla: Sevilla, Spain, 1984. [Google Scholar]
- Bowser, F.P. The African Slave in Colonial Peru, 1524–1650; Stanford University Press: Palo Alto, CA, USA, 1974. [Google Scholar]
- Wheat, D. Atlantic Africa and the Spanish Caribbean, 1570–1640; UNC Press Books: Chapel Hill, NC, USA, 2016. [Google Scholar]
- García-Montón, A. The rise of Portobelo and the transformation of the Spanish American slave trade, 1640s–1730s: Transimperial connections and intra-American shipping. Hisp. Am. Hist. Rev. 2019, 99, 399–429. [Google Scholar] [CrossRef]
- Achilli, A.; Olivieri, A.; Semino, O.; Torroni, A. Ancient human genomes-keys to understanding our past. Science 2018, 360, 964–965. [Google Scholar] [CrossRef]
- Capodiferro, M.R.; Aram, B.; Raveane, A.; Rambaldi Migliore, N.; Colombo, G.; Ongaro, L.; Rivera, J.; Mendizábal, T.; Hernández-Mora, I.; Tribaldos, M.; et al. Archaeogenomic distinctiveness of the Isthmo-Colombian area. Cell 2021, 184, 1706–1723.e1724. [Google Scholar] [CrossRef] [PubMed]
- Andrews, R.M.; Kubacka, I.; Chinnery, P.F.; Lightowlers, R.N.; Turnbull, D.M.; Howell, N. Reanalysis and revision of the Cambridge reference sequence for human mitochondrial DNA. Nat. Genet. 1999, 23, 147. [Google Scholar] [CrossRef]
- Weissensteiner, H.; Pacher, D.; Kloss-Brandstätter, A.; Forer, L.; Specht, G.; Bandelt, H.J.; Kronenberg, F.; Salas, A.; Schönherr, S. HaploGrep 2: Mitochondrial haplogroup classification in the era of high-throughput sequencing. Nucleic Acids Res. 2016, 44, W58–W63. [Google Scholar] [CrossRef] [PubMed]
- Wood, M.R.; Sturk-Andreaggi, K.; Ring, J.D.; Huber, N.; Bodner, M.; Crawford, M.H.; Parson, W.; Marshall, C. Resolving mitochondrial haplogroups B2 and B4 with next-generation mitogenome sequencing to distinguish Native American from Asian haplotypes. Forensic Sci. Int. Genet. 2019, 43, 102143. [Google Scholar] [CrossRef]
- Bodner, M.; Perego, U.A.; Gomez, J.E.; Cerda-Flores, R.M.; Rambaldi Migliore, N.; Woodward, S.R.; Parson, W.; Achilli, A. The mitochondrial DNA landscape of modern Mexico. Genes 2021, 12, 1453. [Google Scholar] [CrossRef] [PubMed]
- Grugni, V.; Raveane, A.; Ongaro, L.; Battaglia, V.; Trombetta, B.; Colombo, G.; Capodiferro, M.R.; Olivieri, A.; Achilli, A.; Perego, U.A.; et al. Analysis of the human Y-chromosome haplogroup Q characterizes ancient population movements in Eurasia and the Americas. BMC Biol. 2019, 17, 3. [Google Scholar] [CrossRef] [Green Version]
- Rozas, J.; Ferrer-Mata, A.; Sánchez-DelBarrio, J.C.; Guirao-Rico, S.; Librado, P.; Ramos-Onsins, S.E.; Sánchez-Gracia, A. DnaSP 6: DNA sequence polymorphism analysis of large data sets. Mol. Biol. Evol. 2017, 34, 3299–3302. [Google Scholar] [CrossRef]
- Nei, M. Molecular Evolutionary Genetics; Columbia University Press: New York, NY, USA, 1987. [Google Scholar]
- R Core Team. A Language and Environment for Statistical Computing; R Foundation for Statistical Computing: Vienna, Austria, 2021. [Google Scholar]
- Kumar, S.; Stecher, G.; Li, M.; Knyaz, C.; Tamura, K. MEGA X: Molecular Evolutionary Genetics Analysis across Computing Platforms. Mol. Biol. Evol. 2018, 35, 1547–1549. [Google Scholar] [CrossRef]
- Le, S.; Josse, J.; Husson, F. FactoMineR: An R package for multivariate analysis. J. Stat. Softw. 2008, 25, 1–18. [Google Scholar] [CrossRef] [Green Version]
- Arias, L.; Barbieri, C.; Barreto, G.; Stoneking, M.; Pakendorf, B. High-resolution mitochondrial DNA analysis sheds light on human diversity, cultural interactions, and population mobility in Northwestern Amazonia. Am. J. Phys. Anthropol. 2018, 165, 238–255. [Google Scholar] [CrossRef]
- Wickham, H.; Chang, W.; Wickham, M.H. Package ‘ggplot2’. Create Elegant Data Visualisations Using the Grammar of Graphics. Version 2016. Volume 2, pp. 1–189. Available online: https://ggplot2.tidyverse.org/reference/ggplot2-package.html (accessed on 7 October 2021).
- Pinotti, T.; Bergström, A.; Geppert, M.; Bawn, M.; Ohasi, D.; Shi, W.; Lacerda, D.R.; Solli, A.; Norstedt, J.; Reed, K. Y chromosome sequences reveal a short Beringian Standstill, rapid expansion, and early population structure of Native American founders. Curr. Biol. 2019, 29, 149–157.e143. [Google Scholar] [CrossRef] [Green Version]
- Jota, M.S.; Lacerda, D.R.; Sandoval, J.R.; Vieira, P.P.; Ohasi, D.; Santos-Júnior, J.E.; Acosta, O.; Cuellar, C.; Revollo, S.; Paz-y-Miño, C.; et al. New native South American Y chromosome lineages. J. Hum. Genet. 2016, 61, 593–603. [Google Scholar] [CrossRef]
- Rootsi, S.; Magri, C.; Kivisild, T.; Benuzzi, G.; Help, H.; Bermisheva, M.; Kutuev, I.; Barać, L.; Pericić, M.; Balanovsky, O.; et al. Phylogeography of Y-chromosome haplogroup I reveals distinct domains of prehistoric gene flow in europe. Am. J. Hum. Genet. 2004, 75, 128–137. [Google Scholar] [CrossRef] [Green Version]
- Cruciani, F.; Trombetta, B.; Massaia, A.; Destro-Bisol, G.; Sellitto, D.; Scozzari, R. A revised root for the human Y chromosomal phylogenetic tree: The origin of patrilineal diversity in Africa. Am. J. Hum. Genet. 2011, 88, 814–818. [Google Scholar] [CrossRef] [Green Version]
- Myres, N.M.; Rootsi, S.; Lin, A.A.; Järve, M.; King, R.J.; Kutuev, I.; Cabrera, V.M.; Khusnutdinova, E.K.; Pshenichnov, A.; Yunusbayev, B.; et al. A major Y-chromosome haplogroup R1b Holocene era founder effect in Central and Western Europe. Eur. J. Hum. Genet. 2011, 19, 95–101. [Google Scholar] [CrossRef]
- Underhill, P.A.; Poznik, G.D.; Rootsi, S.; Järve, M.; Lin, A.A.; Wang, J.; Passarelli, B.; Kanbar, J.; Myres, N.M.; King, R.J.; et al. The phylogenetic and geographic structure of Y-chromosome haplogroup R1a. Eur. J. Hum. Genet. 2015, 23, 124–131. [Google Scholar] [CrossRef] [Green Version]
- Semino, O.; Magri, C.; Benuzzi, G.; Lin, A.A.; Al-Zahery, N.; Battaglia, V.; Maccioni, L.; Triantaphyllidis, C.; Shen, P.; Oefner, P.J.; et al. Origin, diffusion, and differentiation of Y-chromosome haplogroups E and J: Inferences on the neolithization of Europe and later migratory events in the Mediterranean area. Am. J. Hum. Genet. 2004, 74, 1023–1034. [Google Scholar] [CrossRef] [PubMed] [Green Version]
- King, R.J.; Di Cristofaro, J.; Kouvatsi, A.; Triantaphyllidis, C.; Scheidel, W.; Myres, N.M.; Lin, A.A.; Eissautier, A.; Mitchell, M.; Binder, D. The coming of the Greeks to Provence and Corsica: Y-chromosome models of archaic Greek colonization of the western Mediterranean. BMC Evol. Biol. 2011, 11, 69. [Google Scholar] [CrossRef] [PubMed] [Green Version]
- Sahakyan, H.; Margaryan, A.; Saag, L.; Karmin, M.; Flores, R.; Haber, M.; Kushniarevich, A.; Khachatryan, Z.; Bahmanimehr, A.; Parik, J.; et al. Origin and diffusion of human Y chromosome haplogroup J1-M267. Sci. Rep. 2021, 11, 6659. [Google Scholar] [CrossRef] [PubMed]
- Mendez, F.L.; Karafet, T.M.; Krahn, T.; Ostrer, H.; Soodyall, H.; Hammer, M.F. Increased resolution of Y chromosome haplogroup T defines relationships among populations of the Near East, Europe, and Africa. Hum. Biol. 2011, 83, 39–53. [Google Scholar] [CrossRef]
- Valverde, L.; Illescas, M.J.; Villaescusa, P.; Gotor, A.M.; García, A.; Cardoso, S.; Algorta, J.; Catarino, S.; Rouault, K.; Férec, C.; et al. New clues to the evolutionary history of the main European paternal lineage M269: Dissection of the Y-SNP S116 in Atlantic Europe and Iberia. Eur. J. Hum. Genet. 2016, 24, 437–441. [Google Scholar] [CrossRef] [Green Version]
- D’Atanasio, E.; Trombetta, B.; Bonito, M.; Finocchio, A.; Di Vito, G.; Seghizzi, M.; Romano, R.; Russo, G.; Paganotti, G.M.; Watson, E.; et al. The peopling of the last Green Sahara revealed by high-coverage resequencing of trans-Saharan patrilineages. Genome Biol. 2018, 19, 20. [Google Scholar] [CrossRef] [Green Version]
- Wood, E.T.; Stover, D.A.; Ehret, C.; Destro-Bisol, G.; Spedini, G.; McLeod, H.; Louie, L.; Bamshad, M.; Strassmann, B.I.; Soodyall, H.; et al. Contrasting patterns of Y chromosome and mtDNA variation in Africa: Evidence for sex-biased demographic processes. Eur. J. Hum. Genet. 2005, 13, 867–876. [Google Scholar] [CrossRef]
- Naidoo, T.; Xu, J.; Vicente, M.; Malmström, H.; Soodyall, H.; Jakobsson, M.; Schlebusch, C.M. Y-Chromosome variation in Southern African Khoe-San populations based on whole-genome sequences. Genome Biol. Evol. 2020, 12, 1031–1039. [Google Scholar] [CrossRef] [PubMed]
- González-Sobrino, B.Z.; Pintado-Cortina, A.P.; Sebastián-Medin, L.; Morales-Mandujano, F.; Contreras, A.V.; Aguilar, Y.E.; Chávez-Benavides, J.; Carrillo-Rodríguez, A.; Silva-Zolezzi, I.; Medrano-González, L. Genetic diversity and differentiation in urban and Indigenous populations of Mexico: Patterns of mitochondrial DNA and Y-chromosome lineages. Biodemogr. Soc. Biol. 2016, 62, 53–72. [Google Scholar] [CrossRef] [PubMed]
- Martínez-Cortés, G.; Salazar-Flores, J.; Haro-Guerrero, J.; Rubi-Castellanos, R.; Velarde-Félix, J.S.; Muñoz-Valle, J.F.; López-Casamichana, M.; Carrillo-Tapia, E.; Canseco-Avila, L.M.; Bravi, C.M.; et al. Maternal admixture and population structure in Mexican-Mestizos based on mtDNA haplogroups. Am. J. Phys. Anthropol. 2013, 151, 526–537. [Google Scholar] [CrossRef] [PubMed]
- Rangel-Villalobos, H.; Munoz-Valle, J.F.; Gonzalez-Martin, A.; Gorostiza, A.; Magana, M.T.; Paez-Riberos, L.A. Genetic admixture, relatedness, and structure patterns among Mexican populations revealed by the Y-chromosome. Am. J. Phys. Anthropol. 2008, 135, 448–461. [Google Scholar] [CrossRef]
- Alves-Silva, J.; da Silva Santos, M.; Guimarães, E.; Ferreira, A.C.; Bandelt, H.J.; Pena, S.D.; Prado, V.F. The ancestry of Brazilian mtDNA lineages. Am. J. Hum. Genet. 2000, 67, 444–461. [Google Scholar] [CrossRef] [Green Version]
- Bisso-Machado, R.; Fagundes, N.J. Uniparental genetic markers in Native Americans: A summary of all available data from ancient and contemporary populations. Am. J. Phys. Anthropol. 2021, 176, 445–458. [Google Scholar] [CrossRef]
- The Genomes Project Consortium. A global reference for human genetic variation. Nature 2015, 526, 68. [Google Scholar] [CrossRef] [Green Version]
- Behar, D.M.; van Oven, M.; Rosset, S.; Metspalu, M.; Loogväli, E.L.; Silva, N.M.; Kivisild, T.; Torroni, A.; Villems, R. A “Copernican” reassessment of the human mitochondrial DNA tree from its root. Am. J. Hum. Genet. 2012, 90, 675–684. [Google Scholar] [CrossRef] [PubMed] [Green Version]
- Lippold, S.; Xu, H.; Ko, A.; Li, M.; Renaud, G.; Butthof, A.; Schröder, R.; Stoneking, M. Human paternal and maternal demographic histories: Insights from high-resolution Y chromosome and mtDNA sequences. Investig. Genet. 2014, 5, 13. [Google Scholar] [CrossRef] [Green Version]
- Just, R.S.; Irwin, J.A.; Parson, W. Mitochondrial DNA heteroplasmy in the emerging field of massively parallel sequencing. Forensic Sci. Int. Genet. 2015, 18, 131–139. [Google Scholar] [CrossRef] [PubMed] [Green Version]
- Rieux, A.; Eriksson, A.; Li, M.; Sobkowiak, B.; Weinert, L.A.; Warmuth, V.; Ruiz-Linares, A.; Manica, A.; Balloux, F. Improved calibration of the human mitochondrial clock using ancient genomes. Mol. Biol. Evol. 2014, 31, 2780–2792. [Google Scholar] [CrossRef] [PubMed] [Green Version]
- Söchtig, J.; Álvarez-Iglesias, V.; Mosquera-Miguel, A.; Gelabert-Besada, M.; Gómez-Carballa, A.; Salas, A. Genomic insights on the ethno-history of the Maya and the ‘Ladinos’ from Guatemala. BMC Genom. 2015, 16, 131. [Google Scholar] [CrossRef] [PubMed] [Green Version]
- Willerslev, E.; Meltzer, D.J. Peopling of the Americas as inferred from ancient genomics. Nature 2021, 594, 356–364. [Google Scholar] [CrossRef] [PubMed]


Publisher’s Note: MDPI stays neutral with regard to jurisdictional claims in published maps and institutional affiliations. |
© 2021 by the authors. Licensee MDPI, Basel, Switzerland. This article is an open access article distributed under the terms and conditions of the Creative Commons Attribution (CC BY) license (https://creativecommons.org/licenses/by/4.0/).
Share and Cite
Rambaldi Migliore, N.; Colombo, G.; Capodiferro, M.R.; Mazzocchi, L.; Chero Osorio, A.M.; Raveane, A.; Tribaldos, M.; Perego, U.A.; Mendizábal, T.; Montón, A.G.; et al. Weaving Mitochondrial DNA and Y-Chromosome Variation in the Panamanian Genetic Canvas. Genes 2021, 12, 1921. https://0-doi-org.brum.beds.ac.uk/10.3390/genes12121921
Rambaldi Migliore N, Colombo G, Capodiferro MR, Mazzocchi L, Chero Osorio AM, Raveane A, Tribaldos M, Perego UA, Mendizábal T, Montón AG, et al. Weaving Mitochondrial DNA and Y-Chromosome Variation in the Panamanian Genetic Canvas. Genes. 2021; 12(12):1921. https://0-doi-org.brum.beds.ac.uk/10.3390/genes12121921
Chicago/Turabian StyleRambaldi Migliore, Nicola, Giulia Colombo, Marco Rosario Capodiferro, Lucia Mazzocchi, Ana Maria Chero Osorio, Alessandro Raveane, Maribel Tribaldos, Ugo Alessandro Perego, Tomás Mendizábal, Alejandro García Montón, and et al. 2021. "Weaving Mitochondrial DNA and Y-Chromosome Variation in the Panamanian Genetic Canvas" Genes 12, no. 12: 1921. https://0-doi-org.brum.beds.ac.uk/10.3390/genes12121921