
Patterns and Associations of Physical Activity, Screen Time, Sleep, and Dietary Habits among Saudi Females Participating in Fitness Centers

 ,
,
Abstract
:1. Introduction
2. Materials and Methods
2.1. Study Design and Participants
2.2. Sampling and Data Gathering
2.3. Anthropometric Measurement
2.4. Survey/Measures
2.5. Data and Statistical Analysis
3. Results
3.1. Anthropometric Measurements of Female Participants Attending Fitness Centers
3.2. Lifestyle Variables of Female Participants Attending Fitness Centers
3.3. Comparison of Selected Activity Energy Expenditure (MET-Minutes per Week) of Younger and Older Female Participants
3.4. Physical Activity Preferences among Female Participants
3.5. Multivariable Analysis of Selected Lifestyle Variables Relative to Breakfast Intake Frequency and Socio-Demographic Factors
3.6. Multivariable Analysis of Selected Anthropometric and Lifestyle Variables While Controlling for Age and Socio-Demographic Factors
4. Discussion
5. Conclusions
Author Contributions
Funding
Institutional Review Board Statement
Informed Consent Statement
Data Availability Statement
Conflicts of Interest
References
- Ferretti, F. Unhealthy Behaviours: An International Comparison. PLoS ONE 2015, 10, e0141834. [Google Scholar] [CrossRef] [PubMed] [Green Version]
- Maenhout, L.; Peuters, C.; Cardon, G.; Compernolle, S.; Crombez, G.; DeSmet, A. The association of healthy lifestyle behaviors with mental health indicators among adolescents of different family affluence in Belgium. BMC Public Health 2020, 20, 958. [Google Scholar] [CrossRef] [PubMed]
- Majeed, A.; El-Sayed, A.A.; Khoja, T.; Alshamsan, R.; Millett, C.; Rawaf, S. Diabetes in the Middle-East and North Africa: An update. Diabetes Res. Clin. Pract. 2014, 103, 218–222. [Google Scholar] [CrossRef]
- Rahim, H.F.A.; Sibai, A.; Khader, Y.; Hwalla, N.; Fadhil, I.; Alsiyabi, H.; Mataria, A.; Mendis, S.; Mokdad, A.H.; Husseini, A. Non-communicable diseases in the Arab world. Lancet 2014, 383, 356–367. [Google Scholar] [CrossRef]
- Atlas, D. International Diabetes Federation. IDF Diabetes Atlas, 7th ed.; International Diabetes Federation: Brussels, Belgium, 2015; Available online: https://www.idf.org/e-library/epidemiology-research/diabetes-atlas/13-diabetes-atlas-seventh-edition.html (accessed on 25 April 2021).
- Wani, K.; Alfawaz, H.; Alnaami, A.M.; Sabico, S.; Khattak, M.; Al-Attas, O.; Alokail, M.S.; Alharbi, M.; Chrousos, G.; Kumar, S.; et al. Effects of a 12-Month Intensive Lifestyle Monitoring Program in Predominantly Overweight/Obese Arab Adults with Prediabetes. Nutrients 2020, 12, 464. [Google Scholar] [CrossRef] [Green Version]
- Al-Hazzaa, H.M. Physical inactivity in Saudi Arabia revisited: A systematic review of inactivity prevalence and perceived barriers to active living. Int. J. Health Sci. 2018, 12, 50–64. [Google Scholar]
- Al-Quwaidhi, A.J.; Pearce, M.S.; Critchley, J.A.; Sobngwi, E.; O’Flaherty, M. Trends and future projections of the prevalence of adult obesity in Saudi Arabia, 1992–2022. East. Mediterr. Health J. 2014, 20, 589–595. [Google Scholar] [CrossRef]
- Moradi-Lakeh, M.; El Bcheraoui, C.; Tuffaha, M.; Daoud, F.; Al Saeedi, M.; Basulaiman, M.; Memish, Z.A.; Al Mazroa, M.A.; Al Rabeeah, A.A.; Mokdad, A.H. The health of Saudi youths: Current challenges and future opportunities. BMC Fam. Pract. 2016, 17, 26. [Google Scholar] [CrossRef] [Green Version]
- Alshaikh, M.K.; Filippidis, F.T.; Baldove, J.P.; Majeed, A.; Rawaf, S. Women in Saudi Arabia and the Prevalence of Cardiovascular Risk Factors: A Systematic Review. J. Environ. Public Health 2016, 2016, 7479357. [Google Scholar] [CrossRef] [Green Version]
- Al-Hazzaa, H.M.; Abahussain, N.A.; Al-Sobayel, H.I.; Qahwaji, D.M.; Musaiger, A.O. Physical activity, sedentary behaviors and dietary habits among Saudi adolescents relative to age, gender and region. Int. J. Behav. Nutr. Phys. Act. 2011, 8, 140. [Google Scholar] [CrossRef] [Green Version]
- El Bcheraoui, C.; Tuffaha, M.; Daoud, F.; Kravitz, H.; Al Mazroa, M.A.; Al Saeedi, M.; Memish, Z.A.; Basulaiman, M.; Al Rabeeah, A.A.; Mokdad, A.H. On Your Mark, Get Set, Go: Levels of Physical Activity in the Kingdom of Saudi Arabia, 2013. J. Phys. Act. Health 2016, 13, 231–238. [Google Scholar] [CrossRef] [PubMed]
- Saudi Arabian Ministry of Health (MOH) MOH Initiatives (2030). 2018. Available online: https://www.moh.gov.sa/en/Ministry/nehs/Pages/vision2030.aspx (accessed on 8 November 2020).
- Saudi Vision 2030 National Transformation Program (2030). 2018. Available online: http://vision2030.gov.sa/en (accessed on 8 November 2020).
- Al-Hazzaa, H.M.; Al-Sobayel, H.I.; Musaiger, A.O. Convergent validity of the Arab Teens Lifestyle Study (ATLS) physical activity questionnaire. Int. J. Environ. Res. Public Health 2011, 8, 3810–3820. [Google Scholar] [CrossRef] [PubMed] [Green Version]
- Al-Hazzaa, H.; Al-Ahmadi, M. A self-reported questionnaire for the assessment of physical activity in youth 15–25 years: Development, reliability and construct validity. Arab. J. Food Nutr. 2003, 4, 279–291. [Google Scholar]
- Hirshkowitz, M.; Whiton, K.; Albert, S.M.; Alessi, C.; Bruni, O.; DonCarlos, L.; Hazen, N.; Herman, J.; Katz, E.S.; Kheirandish-Gozal, L.; et al. National Sleep Foundation’s sleep time duration recommendations: Methodology and results summary. Sleep Health 2015, 1, 40–43. [Google Scholar] [CrossRef] [PubMed]
- World Health Organization. WHO 2020 Guidelines on Physical Activity and Sedentary Behaviour; WHO: Geneva, Switzerland, 2020; Available online: https://apps.who.int/iris/bitstream/handle/10665/336656/9789240015128eng.pdf (accessed on 8 November 2020).
- Samara, A.; Nistrup, A.; Al-Rammah, T.Y.; Aro, A.R. Lack of facilities rather than sociocultural factors as the primary barrier to physical activity among female Saudi university students. Int. J. Women’s Health 2015, 7, 279–286. [Google Scholar] [CrossRef] [Green Version]
- Moore, L.V.; Harris, C.D.; Carlson, S.A.; Kruger, J.; Fulton, J.E. Trends in no leisure-time physical activity-United States, 1988–2010. Res. Q. Exerc. Sport 2012, 83, 587–591. [Google Scholar] [CrossRef]
- Bélanger, M.; Townsend, N.; Foster, C. Age-related differences in physical activity profiles of English adults. Prev. Med. 2011, 52, 247–249. [Google Scholar] [CrossRef]
- Edwardson, C.L.; Gorely, T.; Pearson, N.; Atkin, A. Sources of activity-related social support and adolescents’ objectively measured after-school and weekend physical activity: Gender and age differences. J. Phys. Act. Health 2013, 10, 1153–1158. [Google Scholar] [CrossRef]
- Alzamil, H.A.; Alhakbany, M.A.; Alfadda, N.A.; Almusallam, S.M.; Al-Hazzaa, H.M. A Profile of Physical Activity, Sedentary Behaviors, Sleep, and Dietary Habits of Saudi College Female Students. J. Fam. Community Med. 2019, 26, 1–8. [Google Scholar]
- Alissa, E.M.; Alsawadi, H.; Zedan, A.; Alqarni, D.; Bakry, M.; Hli, N.B. Knowledge, attitude and practice of dietary and lifestyle habits among medical students in King Abdulaziz University, Saudi Arabia. Int. J. Nutr. Food Sci. 2015, 4, 650–655. [Google Scholar] [CrossRef] [Green Version]
- Ben-Ammar, A.A.; Al-Holy, M.A. Body image and lifestyle attitudes of female gymnasium users in Saudi Arabia. Nutr. Food Sci. 2013, 43, 365–373. [Google Scholar] [CrossRef]
- Groth, S.W.; David, T. New mothers’ views of weight and exercise. MCN. Am. J. Matern. Child Nurs. 2008, 33, 364–370. [Google Scholar] [CrossRef] [PubMed] [Green Version]
- Poobalan, A.S.; Aucott, L.S.; Clarke, A.; Smith, W.C.S. Physical activity attitudes, intentions and behaviour among 18–25 year olds: A mixed method study. BMC Public Health 2012, 12, 640. [Google Scholar] [CrossRef] [PubMed] [Green Version]
- Al-Hazzaa, H.M.; Al-Sobayel, H.I.; Abahussain, N.A.; Qahwaji, D.M.; Alahmadi, M.A.; Musaiger, A.O. Association of dietary habits with levels of physical activity and screen time among adolescents living in Saudi Arabia. J. Hum. Nutr. Diet. 2014, 27 (Suppl. 2), 204–213. [Google Scholar] [CrossRef] [PubMed]
- Al-Nakeeb, Y.; Lyons, M.; Dodd, L.J.; Al-Nuaim, A. An investigation into the lifestyle, health habits and risk factors of young adults. Int. J. Environ. Res. Public Health 2015, 12, 4380–4394. [Google Scholar] [CrossRef] [PubMed] [Green Version]
- Moreno-Gómez, C.; Romaguera-Bosch, D.; Tauler-Riera, P.; Bennasar-Veny, M.; Pericas-Beltran, J.; Martinez-Andreu, S.; Aguilo-Pons, A. Clustering of lifestyle factors in Spanish university students: The relationship between smoking, alcohol consumption, physical activity and diet quality. Public Health Nutr. 2012, 15, 2131–2139. [Google Scholar] [CrossRef] [PubMed] [Green Version]
- Chen, J.; Cheng, J.; Liu, Y.; Tang, Y.; Sun, X.; Wang, T.; Xiao, Y.; Li, F.; Xiang, L.; Jiang, P.; et al. Associations between breakfast eating habits and health-promoting lifestyle, suboptimal health status in Southern China: A population based, cross sectional study. J. Transl. Med. 2014, 12, 348. [Google Scholar] [CrossRef] [Green Version]
- Alhakbany, M.A.; Alzamil, H.A.; Alabdullatif, W.A.; Aldekhyyel, S.N.; Alsuhaibani, M.N.; Al-Hazzaa, H.M. Lifestyle Habits in Relation to Overweight and Obesity among Saudi Women Attending Health Science Colleges. J. Epidemiol. Glob. Health 2018, 8, 13–19. [Google Scholar] [CrossRef] [Green Version]
- Lakerveld, J.; Mackenbach, J.D.; Horvath, E.; Rutters, F.; Compernolle, S.; Bárdos, H.; De Bourdeaudhuij, I.; Charreire, H.; Rutter, H.; Oppert, J.M.; et al. The relation between sleep duration and sedentary behaviours in European adults. Obes. Rev. 2016, 17 (Suppl. 1), 62–67. [Google Scholar] [CrossRef] [Green Version]
- Fletcher, E.A.; McNaughton, S.A.; Crawford, D.; Cleland, V.; Della Gatta, J.; Hatt, J.; Dollman, J.; Timperio, A. Associations between sedentary behaviours and dietary intakes among adolescents. Public Health Nutr. 2018, 21, 1115–1122. [Google Scholar] [CrossRef] [Green Version]
- Rodríguez-Gómez, I.; Mañas, A.; Losa-Reyna, J.; Rodríguez-Mañas, L.; Chastin, S.; Alegre, L.M.; García-García, F.J.; Ara, I. Associations between sedentary time, physical activity and bone health among older people using compositional data analysis. PLoS ONE 2018, 13, e0206013. [Google Scholar] [CrossRef]
- Brunetti, V.C.; O’Loughlin, E.K.; O’Loughlin, J.; Constantin, E.; Pigeon, É. Screen and nonscreen sedentary behavior and sleep in adolescents. Sleep Health 2016, 2, 335–340. [Google Scholar] [CrossRef] [PubMed]
- Kredlow, M.A.; Capozzoli, M.C.; Hearon, B.A.; Calkins, A.W.; Otto, M.W. The effects of physical activity on sleep: A meta-analytic review. J. Behav. Med. 2015, 38, 427–449. [Google Scholar] [CrossRef] [PubMed]
- Chennaoui, M.; Arnal, P.J.; Sauvet, F.; Léger, D. Sleep and exercise: A reciprocal issue? Sleep Med. Rev. 2015, 20, 59–72. [Google Scholar] [CrossRef] [PubMed]
- Al-Hazzaa, H.M.; Abahussain, N.A.; Al-Sobayel, H.I.; Qahwaji, D.M.; Musaiger, A.O. Lifestyle factors associated with overweight and obesity among Saudi adolescents. BMC Public Health 2012, 12, 354. [Google Scholar] [CrossRef] [Green Version]
- Prather, A.A.; Leung, C.W.; Adler, N.E.; Ritchie, L.; Laraia, B.; Epel, E.S. Short and sweet: Associations between self-reported sleep duration and sugar-sweetened beverage consumption among adults in the United States. Sleep Health 2016, 2, 272–276. [Google Scholar] [CrossRef] [Green Version]
- Otsuka, Y.; Kaneita, Y.; Itani, O.; Osaki, Y.; Higuchi, S.; Kanda, H.; Nakagome, S.; Jike, M.; Ohida, T. Association between unhealthy dietary behaviors and sleep disturbances among Japanese adolescents: A nationwide representative survey. Sleep Biol. Rhythm 2019, 17, 93–102. [Google Scholar] [CrossRef]
- Memish, Z.A.; El Bcheraoui, C.; Tuffaha, M.; Robinson, M.; Daoud, F.; Jaber, S.; Mikhitarian, S.; Al Saeedi, M.; AlMazroa, M.A.; Mokdad, A.H.; et al. Obesity and associated factors–Kingdom of Saudi Arabia, 2013. Prev. Chronic Dis. 2014, 11, E174. [Google Scholar] [CrossRef] [Green Version]
- Arora, M.; Nazar, G.P.; Gupta, V.K.; Perry, C.L.; Reddy, K.S.; Stigler, M.H. Association of breakfast intake with obesity, dietary and physical activity behavior among urban school-aged adolescents in Delhi, India: Results of a cross-sectional study. BMC Public Health 2012, 12, 881. [Google Scholar] [CrossRef] [Green Version]
- Croll, J.K.; Neumark-Sztainer, D.; Story, M.; Wall, M.; Perry, C.; Harnack, L. Adolescents involved in weight-related and power team sports have better eating patterns and nutrient intakes than non-sport-involved adolescents. J. Am. Diet. Assoc. 2006, 106, 709–717. [Google Scholar] [CrossRef]


| Variable | All (N = 458) | <30 Years Old (59.9%) | 30+ Years Old (40.1%) | p-Value * |
|---|---|---|---|---|
| Age (years) | 29.2 (8.2) | 23.8 (3.4) | 37.1 (6.5) | - |
| Body weight (kg) | 69.4 (14.3) | 66.4 (13.8) | 73.7 (14.9) | <0.001 |
| Height (cm) | 158.7 (5.5) | 158.6 (5.2) | 158.8 (6.0) | 0.711 |
| Body mass index (BMI) | 27.5 (5.4) | 26.4 (5.3) | 29.2 (5.6) | <0.001 |
| Overweight or obese (%) | 62.6 | 53.3 | 76.4 | <0.001 |
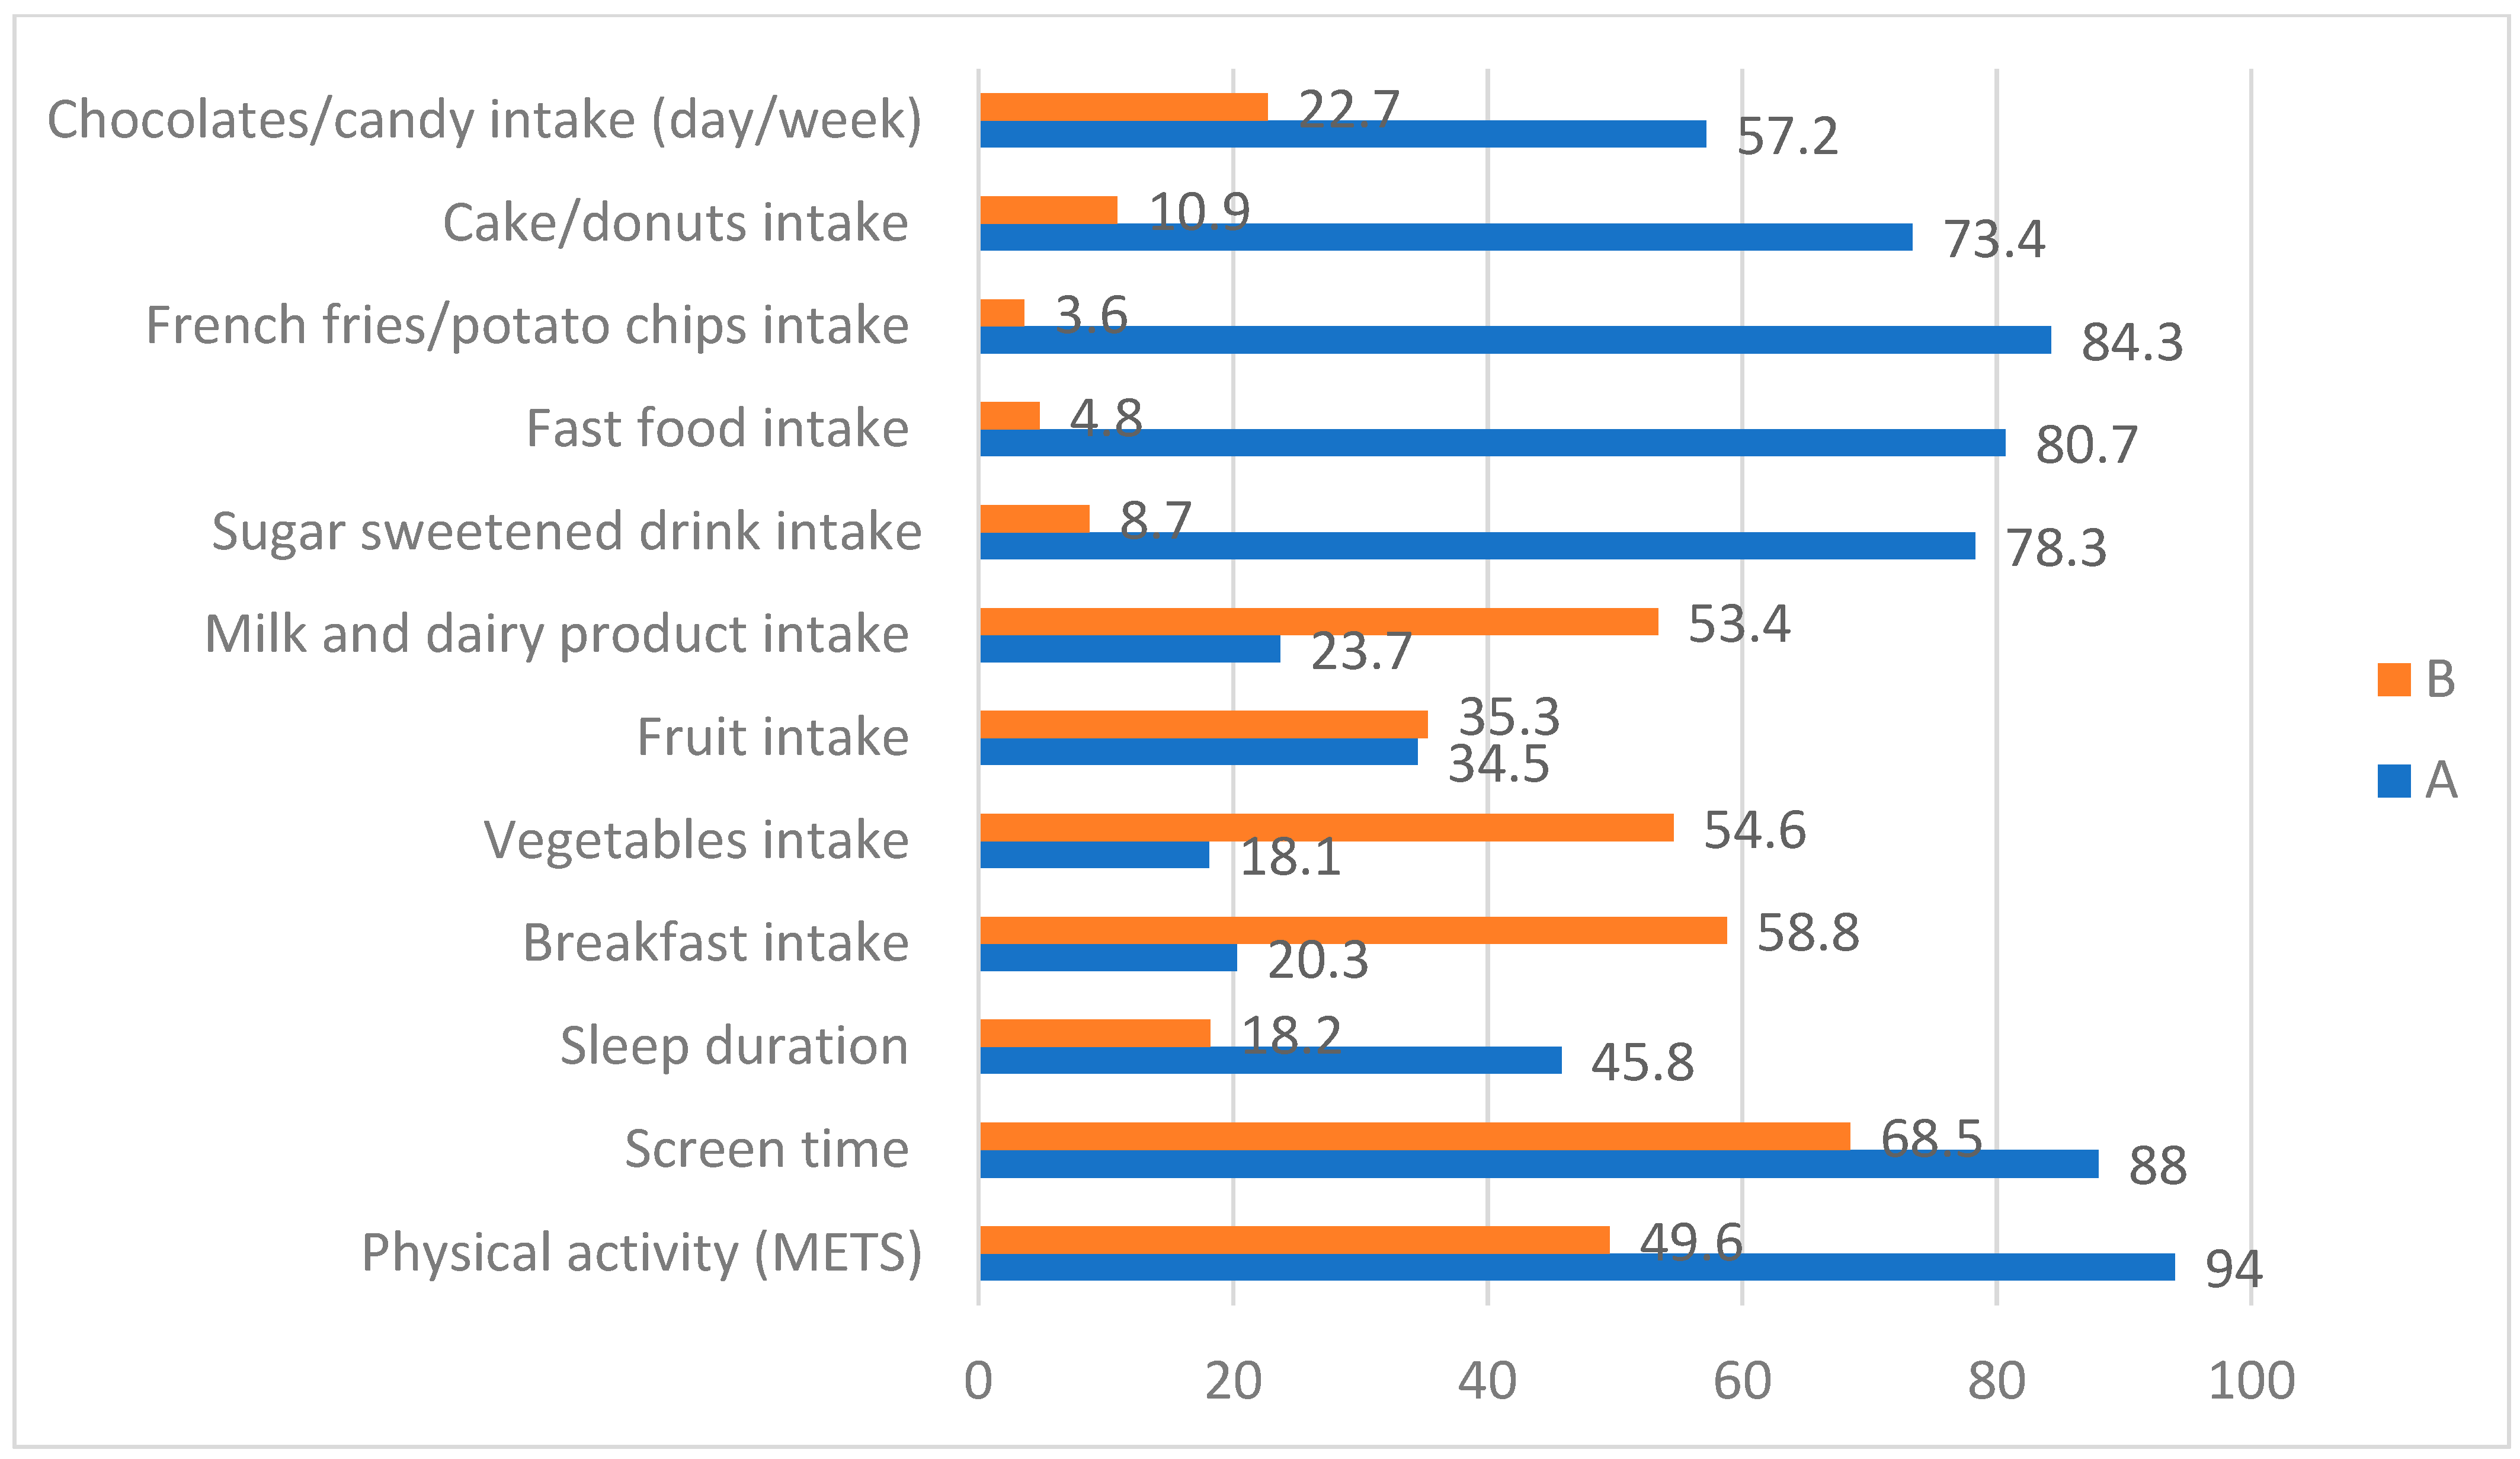
| Variable | Cut-Offs | Proportion (%) |
|---|---|---|
| PA (METs-min/week) | >600 | 94.0 |
| >1500 | 82.0 | |
| >3000 | 49.6 | |
| Screen time (hours/day) | >2 h | 88.0 |
| >3 h | 68.5 | |
| Sleep duration (hours/night) | 7+ h | 45.8 |
| 8+ h | 18.2 | |
| Breakfast intake (day/week) | 1–2 days | 20.3 |
| 3–4 days | 10.9 | |
| 5+ days | 58.8 | |
| Vegetables intake (day/week) | 1–2 days | 18.1 |
| 3–4 days | 27.3 | |
| 5+ days | 54.6 | |
| Fruit intake (day/week) | 1–2 days | 34.5 |
| 3–4 days | 30.2 | |
| 5+ days | 35.3 | |
| Milk and dairy product intake (day/week) | 1–2 days | 23.7 |
| 3–4 days | 22.9 | |
| 5+ days | 53.4 | |
| Sugar-sweetened drink intake(day/week) | 1–2 days | 78.3 |
| 3–4 days | 13.0 | |
| 5+ days | 8.7 | |
| Fast food intake (day/week) | 1–2 days | 80.7 |
| 3–4 days | 14.5 | |
| 5+ days | 4.8 | |
| French fries/potato chips intake (day/week) | 1–2 days | 84.3 |
| 3–4 days | 12.1 | |
| 5+ days | 3.6 | |
| Cake/donuts intake (day/week) | 1–2 days | 73.4 |
| 3–4 days | 15.7 | |
| 5+ days | 10.9 | |
| Chocolates/candy intake (day/week) | 1–2 days | 57.2 |
| 3–4 days | 20.0 | |
| 5+ days | 22.7 |
| Variable | All (N = 460) | <30 Years Old (59.9%) | 30+ Years Old (40.1%) | p Value * |
|---|---|---|---|---|
| Walking (METs-min/week) ** | 576.1 (629.6) | 607.9 (624.1) | 550.1 (694.5) | 0.378 |
| Stair Stepping (METs-min/week) | 92.9 (51.9) | 98.1 (58.5) | 86.7 (41.7) | 0.031 |
| Jogging (METs-min/week) | 525.2 (817.5) | 538.8 (737.7) | 490.3 (926.5) | 0.555 |
| Cycling (METs-min/week) | 346.1 (513.1) | 320.7 (514.7) | 377.9 (536.6) | 0.277 |
| Swimming (METs-min/week) | 208.6 (540.9) | 157.1 (420.4) | 268.3 (687.9) | 0.064 |
| Martial art (METs-min/week) | 54.3 (197.4) | 66.4 (235.1) | 40.5 (140.8) | 0.163 |
| Resistance training (METs-min/week) | 496.4 (645.7) | 553.6 (721.4) | 446.6 (544.3) | 0.104 |
| Household (METs-min/week) | 428.3 (809.2) | 292.2 (539.9) | 615.3 (1073.7) | <0.001 |
| Dancing (METs-min/week) | 299.7 (574.1) | 350.8 (586.2) | 199.5 (465.6) | 0.006 |
| Moderate-intensity sports (METs-min/week) | 218.6 (614.1) | 239.8 (670.4) | 159.3 (425.8) | 0.136 |
| Vigorous-intensity sports (METs-min/week) | 479.5 (003.8) | 557.5 (1021.5) | 360.6 (711.8) | 0.021 |
| Sum of all moderate-intensity physical activity (METs-min/week) | 1512.7 (1361.8) | 1408.0 (1232.1) | 1633.2 (1527.8) | 0.114 |
| Sum of all vigorous-intensity PA(METs-min/week) | 2212.9 (2154.2) | 2374.9 (2295.7) | 1961.8 (1935.7) | 0.049 |
| Total PA energy expenditure (METs-min/week) | 3725.7 (2748.8) | 3782.9 (2769.1) | 3595.0 (2735.7) | 0.496 |
| Variable (N) | Frequency | % |
|---|---|---|
| Where do you mostly exercise? | ||
| Fitness center | 294 | 73.3 |
| Sport/recreational center | 74 | 18.5 |
| At home | 23 | 5.7 |
| At university | 6 | 1.5 |
| Other than the above | 4 | 1.0 |
| Total | 401 | 100 |
| p value * | 0.647 | |
| With whom do you usually exercise? | ||
| Alone | 181 | 45.1 |
| With a friends/school mates | 150 | 37.3 |
| With relatives | 27 | 6.7 |
| With parents | 13 | 3.2 |
| Other than the above | 31 | 7.7 |
| Total | 402 | 100 |
| p value * | 0.094 | |
| When do you mostly exercise? | ||
| Afternoon | 190 | 47.3 |
| Evening | 105 | 26.1 |
| Morning | 26 | 6.5 |
| No specific time | 81 | 20.1 |
| Total | 402 | 100 |
| p value * | 0.120 | |
| Reason for being active | ||
| For health | 248 | 26.4 |
| To improve body shape | 235 | 25.0 |
| For weight loss | 233 | 24.7 |
| For recreation | 142 | 15.1 |
| For competition | 54 | 5.7 |
| For meeting friends | 29 | 3.1 |
| Total (more than one choice is allowed) | 941 | 100 |
| p value * | <0.001 |
| Variable | Breakfast Intake | p-Value * | |
|---|---|---|---|
| <5 Day/Week 1.63 (1.4) | 5+ Days/Week 6.6 (0.74) | ||
| Number of participants | 149 | 225 | - |
| Body weight (kg) | 70.0 (15.5) | 69.2 (14.5) | 0.480 |
| Body mass index | 27.8 (5.8) | 27.5 (5.6) | 0.553 |
| Total PA energy expenditure (MET-min/week) | 3381.1 (2516.2) | 3991.0 (2777.1) | 0.028 |
| Sum of all moderate-intensity physical activity (MET-min/week) | 1389.6 (1252.4) | 1610.9 (1379.4) | 0.128 |
| Sum of all vigorous-intensity PA (MET-min/week) | 1991.5 (1921.4) | 2380.2 (2233.2) | 0.065 |
| Average screen time (hours/day) | 4.49 (2.2) | 4.37 (2.2) | 0.513 |
| Average sleep duration (hours/night) | 6.63 (1.6) | 6.82 (1.5) | 0.230 |
| Vegetables intake (day/week) | 4.25 (2.2) | 5.04 (1.9) | <0.001 |
| Fruit intake (day/week) | 3.38 (2.2) | 4.02 (2.2) | 0.009 |
| Milk/dairy products intake (day/week) | 4.30 (2.4) | 4.84 (2.3) | 0.034 |
| Sweetened sugar drinks intake (day/week) | 1.70 (1.9) | 1.40 (1.8) | 0.166 |
| Fast foods intake (day/week) | 1.77 (1.5) | 1.49 (1.4) | 0.084 |
| French fries/potato chips intake (day/week) | 1.60 (1.5) | 1.12 (1.3) | 0.001 |
| Cake/donuts intake (day/week) | 2.09 (1.9) | 1.85 (1.8) | 0.238 |
| Chocolates/candy intake (day /week) | 2.83 (2.3) | 2.73 (2.3) | 0.685 |
| Variable | Screen Time | Sleep Duration | Activity Level (METs-min/Week) | p-Value * | |
|---|---|---|---|---|---|
| Low Active 1718.9 (838.4) | High Active 5715.1 (2559.5) | ||||
| Body weight (kg) | Low | Insufficient | 69.2 (12.3) | 73.7 (17.9) | Activity level: 0.779 Screen time: 0.743 Sleep: 0.440 Activity by screen:0.891 Activity by sleep: 0.505 Screen by sleep:0.873 Activity by screen by sleep interactions: 0.060 |
| Sufficient | 72.2 (9.9) | 68.8 (13.5) | |||
| High | Insufficient | 68.9 (15.9) | 67.4 (15.1) | ||
| Sufficient | 69.6 (14.0) | 69.6 (16.1) | |||
| Body mass index | Low | Insufficient | 27.8 (5.5) | 29.0 (7.0) | Activity level: 0.536 Screen time: 0.427 Sleep: 0.431 Activity by screen: 0.993 Activity by sleep: 0.704 Screen by sleep: 0.870 Activity by screen by sleep interactions: 0.177 |
| Sufficient | 28.8 (4.9) | 27.8 (5.2) | |||
| High | Insufficient | 27.4 (5.7) | 26.8 (5.5) | ||
| Sufficient | 27.6 (5.5) | 27.3 (5.7) | |||
| Total PA energy expenditure (MET-min/week) | Low | Insufficient | 1873.5 (841.9) | 5823.9 (2647.7) | Activity level: < 0.001 Screen time: 0.022 Sleep: 0.178 Activity by screen:0.141 Activity by sleep: 0.065 Screen by sleep: 0.954 Activity by screen by sleep interactions: 0.964 |
| Sufficient | 1905.6 (691.9) | 6471.2 (2609.6) | |||
| High | Insufficient | 1791.2 (835.4) | 5076.5 (2068.1) | ||
| Sufficient | 1648.6 (791.1) | 5782.6 (2667.4) | |||
| Sum of all moderate-intensity physical activity (MET-min/week) | Low | Insufficient | 776.3 (669.5) | 2379.4 (1501.2) | Activity level: < 0.001 Screen time: 0.163 Sleep: 0.924 Activity by screen: 0.184 Activity by sleep: 0.739 Screen by sleep: 0.200 Activity by screen by sleep interactions: 0.550 |
| Sufficient | 834.5 (512.3) | 2577.7 (1584.6) | |||
| High | Insufficient | 820.7 (560.0) | 2222.8 (1484.7) | ||
| Sufficient | 737.6 (574.5) | 2000.0 (1351.2) | |||
| Sum of all vigorous-intensity PA(MET-min/week) | Low | Insufficient | 1097.2 (771.9) | 3444.6 (2180.5) | Activity level: < 0.001 Screen time: 0.117 Sleep: 0.166 Activity by screen: 0.0468 Activity by sleep: 0.077 Screen by sleep: 0.442 Activity by screen by sleep interactions: 0.663 |
| Sufficient | 1071.2 (717.2) | 3893.5 (2258.9) | |||
| High | Insufficient | 970.5 (620.0) | 2853.7 (2116.4) | ||
| Sufficient | 911.1 (672.8) | 3782.7 (2612.7) | |||
| Average screen time (hours/day) | Low | Insufficient | 2.17 (0.67) | 2.31 (0.50) | Activity level: 0.363 Screen time: < 0.001 Sleep: 0.601 Activity by screen: 0.939 Activity by sleep: 0.366 Screen by sleep: 0.957 Activity by screen by sleep interactions: 0.355 |
| Sufficient | 2.45 (0.53) | 2.39 (0.52) | |||
| High | Insufficient | 5.08 (1.8) | 5.57 (2.1) | ||
| Sufficient | 5.46 (1.7) | 5.4 (2.1) | |||
| Average sleep duration (hours/night) | Low | Insufficient | 5.54 (1.1) | 5.43 (0.98) | Activity level: 0.461 Screen time: 0.078 Sleep: < 0.001 Activity by screen: 0.455 Activity by sleep: 0.701 Screen by sleep: 0.656 Activity by screen by sleep interactions: 0.575 |
| Sufficient | 8.04 (0.90) | 7.78 (0.62) | |||
| High | Insufficient | 5.67 (0.98) | 5.63 (1.0) | ||
| Sufficient | 8.150. (77) | 8.18 (0.80) | |||
| Breakfast intake (day/week) | Low | Insufficient | 4.42 (2.7) | 5.22 (2.6) | Activity level: 0.011 Screen time: 0.269 Sleep: 0.028 Activity by screen: 0.320 Activity by sleep: 0.688 Screen by sleep: 0.087 Activity by screen by sleep interactions: 0.309 |
| Sufficient | 4.84 (2.3) | 4.96 (2.7) | |||
| High | Insufficient | 3.50 (2.6) | 4.35 (2.9) | ||
| Sufficient | 4.50 (2.7) | 5.68 (2.1) | |||
| Vegetables intake (day/week) | Low | Insufficient | 4.5 (2.2) | 5.8 (1.9) | Activity level: 0.001 Screen time: 0.682 Sleep: 0.004 Activity by screen: 0.508 Activity by sleep: 0.221 Screen by sleep: 0.208 Activity by screen by sleep interactions: 0.597 |
| Sufficient | 4.32 (2.3) | 5.56 (2.1) | |||
| High | Insufficient | 4.03 (2.1) | 4.36 (2.1) | ||
| Sufficient | 4.66 (2.0) | 5.58 (1.8) | |||
| Fruit intake (day/week) | Low | Insufficient | 3.31 (2.2) | 4.69 (2.1) | Activity level: < 0.001 Screen time: 0.382 Sleep: 0.159 Activity by screen: 0.516 Activity by sleep: 0.622 Screen by sleep: 0.237 Activity by screen by sleep interactions: 0.605 |
| Sufficient | 3.37 (2.1) | 4.44 (2.3) | |||
| High | Insufficient | 2.91 (1.9) | 3.77 (2.3) | ||
| Sufficient | 3.61 (2.3) | 4.34 (2.2) | |||
| Milk/dairy products intake (day/week) | Low | Insufficient | 4.33 (2.3) | 4.47 (2.3) | Activity level: 0.669 Screen time: 0.437 Sleep: 0.021 Activity by screen: 0.456 Activity by sleep: 0.733 Screen by sleep: 0.373 Activity by screen by sleep interactions: 0.424 |
| Sufficient | 5.37 (2.2) | 5.00 (2.2) | |||
| High | Insufficient | 4.31 (2.3) | 4.50 (2.4) | ||
| Sufficient | 4.59 (2.3) | 4.98 (2.3) | |||
| Sweetened sugar drinks intake (day/week) | Low | Insufficient | 1.58 (1.9) | 1.36 (1.6) | Activity level: 0.022 Screen time: 0.252 Sleep: 0.018 Activity by screen: 0.757 Activity by sleep: 0.204 Screen by sleep: 0.773 Activity by screen by sleep interactions: 0.487 |
| Sufficient | 1.63 (1.9) | 0.67 (87) | |||
| High | Insufficient | 2.08 (2.2) | 1.70 (2.1) | ||
| Sufficient | 1.56 (1.8) | 1.10 (1.5) | |||
| Fast foods intake (day/week) | Low | Insufficient | 0.89 (0.62) | 1.25 (1.4) | Activity level: 0.002 Screen time: 0.009 Sleep: 0.833 Activity by screen: 0.088 Activity by sleep: 0.026 Screen by sleep: 0.035 Activity by screen by sleep interactions: 0.149 |
| Sufficient | 1.95 (1.8) | 1.04 (0.81) | |||
| High | Insufficient | 2.27 (1.4) | 1.64 (1.3) | ||
| Sufficient | 1.97 (1.67) | 1.26 (1.2) | |||
| French fries/potato chips intake (day/week) | Low | Insufficient | 0.83 (0.85) | 0.89 (1.1) | Activity level: 0.044 Screen time: 0.008 Sleep: 0.507 Activity by screen: 0.134 Activity by sleep: 0.129 Screen by sleep: 0.188 Activity by screen by sleep interactions: 0.650 |
| Sufficient | 1.26 (1.3) | 0.89 (93) | |||
| High | Insufficient | 1.77 (1.5) | 1.50 (1.4) | ||
| Sufficient | 1.70 (1.7) | 0.98 (1.1) | |||
| Cake/donuts intake (day/week) | Low | Insufficient | 1.69 (1.5) | 2.17 (2.0) | Activity level: 0.112 Screen time: 0.172 Sleep: 0.058 Activity by screen: 0.322 Activity by sleep: 0.159 Screen by sleep: 0.983 Activity by screen by sleep interactions: 0.279 |
| Sufficient | 1.79 (1.4) | 1.30 (1.5) | |||
| High | Insufficient | 2.42 (2.1) | 2.03 (1.9) | ||
| Sufficient | 2.08 (1.8) | 1.58 (1.7) | |||
| Chocolates/candy intake (day/week) | Low | Insufficient | 2.11 (2.0) | 2.39 (2.0) | Activity level: 0.112 Screen time: 0.001 Sleep: 0.342 Activity by screen: 0.369 Activity by sleep: 0.209 Screen by sleep: 0.277 Activity by screen by sleep interactions: 0.227 |
| Sufficient | 2.53 (1.9) | 1.96 (1.9) | |||
| High | Insufficient | 3.64 (2.3) | 2.92 (2.4) | ||
| Sufficient | 3.13 (2.3) | 2.39 (2.3) | |||
Publisher’s Note: MDPI stays neutral with regard to jurisdictional claims in published maps and institutional affiliations. |
© 2022 by the authors. Licensee MDPI, Basel, Switzerland. This article is an open access article distributed under the terms and conditions of the Creative Commons Attribution (CC BY) license (https://creativecommons.org/licenses/by/4.0/).
Share and Cite
AlMarzooqi, M.A.; Albawardi, N.M.; Altamimi, A.A.; Altalhi, A.S.; Al-Hazzaa, H.M. Patterns and Associations of Physical Activity, Screen Time, Sleep, and Dietary Habits among Saudi Females Participating in Fitness Centers. Healthcare 2022, 10, 958. https://0-doi-org.brum.beds.ac.uk/10.3390/healthcare10060958
AlMarzooqi MA, Albawardi NM, Altamimi AA, Altalhi AS, Al-Hazzaa HM. Patterns and Associations of Physical Activity, Screen Time, Sleep, and Dietary Habits among Saudi Females Participating in Fitness Centers. Healthcare. 2022; 10(6):958. https://0-doi-org.brum.beds.ac.uk/10.3390/healthcare10060958
Chicago/Turabian StyleAlMarzooqi, Mezna A., Nada M. Albawardi, Abeer A. Altamimi, Arwa S. Altalhi, and Hazzaa M. Al-Hazzaa. 2022. "Patterns and Associations of Physical Activity, Screen Time, Sleep, and Dietary Habits among Saudi Females Participating in Fitness Centers" Healthcare 10, no. 6: 958. https://0-doi-org.brum.beds.ac.uk/10.3390/healthcare10060958