
Evaluation of Global Precipitation Products over Wabi Shebelle River Basin, Ethiopia
by
 , , , and
Kindie Engdaw Tadesse
1,2,* ,
,
Assefa M. Melesse
3 ,
,
Adane Abebe
4 ,
,
Haileyesus Belay Lakew
5 and
Paolo Paron
6 1
Africa Center of Excellence for Water Management, Addis Ababa University, Addis Ababa P.O. Box 1176, Ethiopia
2
Department of Hydraulic and Water Resource Engineering, Gondar University, Gondar P.O. Box 196, Ethiopia
3
Department of Earth and Environment Sciences, Florida International University, Miami, FL 33199, USA
4
Facality of Water Resource and Irrigation Engineering, Arba Minch University, Addis Ababa P.O. Box 21, Ethiopia
5
Ethiopian Space Science and Technology Institute, Addis Ababa P.O. Box 385, Ethiopia
6
Department of Water Resource and Ecosystems, IHE, 2611 AX Delfit, The Netherlands
*
Author to whom correspondence should be addressed.
Hydrology 2022, 9(5), 66; https://0-doi-org.brum.beds.ac.uk/10.3390/hydrology9050066
Submission received: 16 March 2022
/
Revised: 8 April 2022
/
Accepted: 15 April 2022
/
Published: 19 April 2022
(This article belongs to the Special Issue Advances in Modelling of Rainfall Fields)
Abstract
:This study presents three global precipitation products and their downscaled versions (CHIRPSv2, TAMSATv3, PERSIANN_CDR, CHIRPS_D, PERSIANNN_CDR_D, and TAMSAT_D) estimated with observed values from 1983 to 2014. Performance evaluation of global precipitation products and their downscaled versions is important for accurate use of those measured values in water resource management, climate, and hydrological applications, particularly in the data-sparse Wabi Shebelle River Basin, Ethiopia. Categorical and quantitative evaluation index techniques were applied. The spatial downscaled global precipitation products outperformed raw spatial resolution estimates in all statistical indicators. TAMSAT-D had acceptable performance ratings in terms of RMSE, CC, and scatter plots (R2). CHIRPSv2 showed the least performance at a daily timestep. Performance of global precipitation products and their downscaled versions increased when daily data were aggregated to the monthly data. CHIRPS-D performed better than other products with a minimum error value (RMSE) and higher CC at a monthly timestep. On the other hand, PERSIANN_CDR_D showed a relatively good performance with a lower, positive Pbias and higher POD values compared to other products for daily and monthly timescales. For spatial mismatch analysis, the bias and RMSE from reference data (individual rain gauge station vs. the average of all available eight stations) against satellite rainfall estimates (PERSIANN_CDR) had a significantly different weight, which could be related to the position of the gauge station to provide the “true” spatial rainfall amount. Overall, TAMSATv3 and CHIRPSv2 and their downscaled version satellite estimates showed good performance at daily and monthly timesteps, respectively. PERSIANN_CDR performed best with low Pbias and the highest POD values. Thus, this study decided that the downscaled version of CHIRPSv2 and PERSIANN_CDR-D satellite estimates could be applicable as an alternative to gauge data on a monthly timestep for hydrological and drought-monitoring applications, respectively.
1. Introduction
Ranfall is an essential and fundamental primary input for the hydrologic cycle, as well as for hydro-meteorological modeling [1,2,3,4]. On the other hand, rainfall data are constrained by poor networks and uneven distribution because of the insufficient budget for operation and installation of rain gauge networks for most parts of the developing world [5]. The current meteorological network are inadequate and have poor maintenance for water resource assessment and climate studies in most tropical regions including Ethiopia [6]. The Wabi Shebelle River Basin (hereinafter WSRB) suffers from the scarce and uneven distribution of the gauge network, inadequate and low-accuracy precipitation, and incoherence of rainfall records [7]. The study area also experienced sociopolitical instability during the civil war in the region, resulting in precipitation measurements not being taken continuously. The gauge network spatial distribution is below the World Meteorological Organization (WMO) recommendations as a guideline for checking the adequacy of a meteorological network for the different physiographic units (one station per 575 km2 interior plains and 250 km2 for the mountainous regions) [8]. Therefore, satellite precipitation products are considered a significant alternative source for obtaining precipitation datasets for the nonexistence of observed data in filling spatiotemporal gaps [9,10]. Several higher global precipitation products exist at the regional and global level, including Tropical Applications of Meteorology using SATellite version three (hereinafter TAMSATv3) [11], Climate Hazards Group Infrared Precipitation with station data version two (hereinafter CHIRPSv2) [12], and Multisource and Precipitation Estimation from Remotely Sensed Information using Artificial Neutral Network Climate Data Record (PERSIANN-CDR) [13]. However, the products from these algorithms and assimilation models need to be evaluated as their precision is impacted by gauge density, orography, rainfall regime, temporal and spatial resolution, and algorithms used [14]. Global precipitation products (hereinafter GPPs) are impacted by exposure to important errors [15]. Such errors can be due to upscaling/downscaling the raw spatial resolution of global precipitation products with complicated terrain [16,17,18,19,20,21] and temporal sampling constraints [22]. Before being used as input for the hydro-meteorological modeling, global precipitation products and their downscaled versions need to be evaluated against ground measurements. For investigations of climate extremes, climate change, and water potential assessment for local-scale applications, global precipitation data with fine spatial and temporal resolution going back in time (30+ years) are required for data-scarce local basins. The Wabi Shebelle river basin is Ethiopian’s largest river basin in terms of its catchment area, but the surface water potential resource was reported as the minimum of all river basins in the master plan study [23]. The issue with this basin is that no compressive research has been conducted to determine water potential using accurate spatial and temporal rainfall datasets.
Several studies have been undertaken to evaluate the performance of global precipitation estimates, which were concentrated in the Blue Nile Basin (for instance, [6,10,24,25,26,27,28,29,30,31,32,33]) and central parts of the country [22,34,35,36,37,38], with a coarser resolution and limited time period. The performance of the global precipitation product is highly affected by spatial resolution, which is largely uncertain because of the scale discrepancy with point measurements. The authors of [39] validated 10 satellite precipitation estimates across 120 relatively dense gauge network highlands of Ethiopia. TAMSAT, CMORPH, and TRMM-3B 42 from the first (high-resolution) group had a strong performance. The authors of [40] evaluated CHIRPSv2, TRMM 3B43v7, CMORPH, ARC2, and TAMSAT across various rainfall regimes (eastern, central, western, and southern) of Ethiopia. The CHIRPSv2 precipitation products at a monthly timescale performed comparatively better across all rainfall regimes. In addition, eight satellite-based rainfall estimates were assessed over the Tekeze-Atbara Transboundary River Basin. TRMM, RFEv2, and CHIRPS precipitation products had superior performance to other products at all spatial resolutions (basin, sub-basin, and point) [14]. Similar research focused mainly on a grid-to-point technique in data-sparse regions [22,25,34,41,42]. Furthermore, this method can induce uncertainty in the performance of global precipitation products due to the comparison of two datasets on different spatial scales regardless of the location of gauges in the pixel. Uncertainty due to the mismatch of satellite-based spatial resolution scale with point measurements may affect the application of GPPs for climate study and hydrological modeling [43]. Although global precipitation products exist at a coarser resolution (larger pixel size) than required by climate studies and hydrological applications, they have to be downscaled to fine resolution for matching the sampling of GPPs with gauge data [44].
A comprehensive evaluation of global precipitation products and their downscaled versions, particularly with a spatial mismatch at different timescales, is needed for a better understanding of watershed hydrology; however, this has not been performed for the Wabi Shebelle River Basin to the best of our knowledge. Uncertainty related to the grid-to-point method can be addressed by avoiding the spatial mismatch between the global precipitation product and corresponding station measurement by downscaling the coarse resolution to a fine resolution.
Therefore, this study attempted (i) a comprehensive evaluation of native and downscaled global precipitation products against ground reference rainfall data, and (ii) a quantification of the uncertainty associated with a grid-to-point approach for the spatial scale of global precipitation products at a selected pixel scale.
2. Study Area Description and Dataset
2.1. Study Area Description
The Wabi Shebelle River Basin (WSRB) is one of the largest basins in Ethiopia, located in the southeastern part of the country. It originates from the Arsi and Bale Mountain ranges 4000 m above sea level and drains to the Indian Ocean after crossing Somalia. The basin’s absolute location is within the latitudes 4°45′–9°45′ N and longitudes 38°45′–45°30′ E. The WSRB is characterized by bimodal rainfall seasons due to the southern and northern movement of the intertropical convergence zone (ITCZ) from March to May and from July to September. According to the master plan hydrology report, the highest mean annual rainfall recorded is 1467 mm in Seru Wereda of the Arsi Zone. The lowest mean annual rainfall recorded is 220 mm in the Kelafo Area of the Somali Region [23]. In general, the spatial and temporal distribution of rainfall is not evenly distributed; it is clustered in the upper and urban areas of the basin, and tends to decrease with decreasing altitude as shown in Figure 1.
2.2. Datasets
2.2.1. Rain Gauge Data
There are about 74 meteorological stations within and around the basin which are not evenly distributed spatially, clustered in upper and urban areas. The rainfall dataset for WSRB was taken from the National Mereological Agency (NMA), covering the period 1983 to 2014. Long-term meteorological data for the WSRB are more complete in upstream parts of the basin, and these stations were taken to analyze precipitation in the area as shown (Figure 2) below.
Rain gauge stations for this study were carefully chosen on the basis of their quality control process for climate data (verification of in situ station’s geographical coordinates, checking for false zeros, checking for the presence of outliers, and homogeneity testing) using the Climate Data Tool (CDT) https://github.com/rijaf-iri/CDT (accessed on 27 June 2020). Twenty-seven out of 74 gauging stations with a percentage of available (non-missing) and continuous data greater than 80% were selected for the comparison of different GPPs in the study area.
2.2.2. Global Precipitation Products
Global precipitation data with fine spatial and temporal resolution provide optional homogeneous timeseries information for data-scarce areas, going back in time (30+ years) as far as possible for hydrological applications and climate studies [45]. Global precipitation data are a combined product of reanalysis, rain gauge data, and remote sensing estimates.
For this desired specific objective, three global precipitation products and their downscaled versions, with different temporal and spatial scales, were taken as inputs (Table 1). The selection of the GPPs was based on public availability, ease of estimation, global coverage, multiyear period, and previous record of estimate performance.
The Climate Hazards Group Infrared Precipitation with station data version two (hereinafter CHIRPSv2) was developed by the United States Geological Survey (USGS) and University of California, Santa Barbara (USCB); it merges estimates using blending satellite, global climatology, and gauge observation data from the Global Telecommunication System (GTS). The CHIRPSv2 dataset incorporates 0.05° spatial resolution with ground reference measurements to generate a daily sequence of data points for an area coverage of 50° S–50° N since 1981 [12].
The Tropical Applications of Meteorology using SATellite version three (hereinafter TAMSATv3) estimate, developed by Reading University in the UK, features Meteosat thermal infrared (TIR) fine-resolution observations on a daily timescale employing attuned cold cloud duration (CCD) data measurements for Africa by downscaling pentadal total measurements. The TAMSATv3 estimate incorporates 0.0375° spatial resolution through ground rainfall measurements to generate timeseries for all of Africa from January 1983 to date [11].
The Precipitation Estimation from Remotely Sensed Information using Artificial Neutral Network Climate Data Record (PERSIANN-CDR) system was developed by the Center for Hydrometeorology and Remote Sensing (CHRS) at the University of California, Irvine (UCI); it uses a neutral function classification procedure to determine the product of precipitation amount for each 0.25° × 0.25° grid in an IR temperature spectrum offered by a geostationary satellite. The rainfall product features an area coverage of 60° S–60° N globally from 1983 to 2015 [13].
3. Methodology
This study evaluated the performance of three global precipitation product and their downscaled versions (CHIRPSv2, TAMSATv3, PERSIANN_CDR, CHIRPS_D, TAMSAT_D, and PERSIANN_CDR_D) at different spatial and temporal scales against 27 ground gauge stations from 1983 to 2014. Categorical and quantitative evaluation index techniques were applied to WSRB, Ethiopia.
3.1. Grid-to-Point Approach
There are two typical approaches for evaluating global precipitation products, i.e., the grid-to-grid and point-to-grid methods. The first method requires the interpolation of gauge data to grid data, whereby gauge-gridded data are compared with grid data from global precipitation estimates; however, converting points to gridded interpolated data induces an error resulting from the interpolation of an uneven geospatial distribution [46,47,48,49,50]. The second approach involves an immediate comparison of station rainfall data to the respective pixel in which the gauges are located [23,34,41,42]. In an area such as the Wabi Shebelle River Basin, with a scarcely and unevenly distributed gauge network, a pixel-to-point approach is the first choice to assess the GPPs independently, considering the gauge network as representative measurements irrespective of grids from nominated GPP, without considering the location of the station in the grid. Although global precipitation products exist at coarser resolution (larger pixel size) than required by climate studies and hydrological applications, they have to be downscaled to 1 km fine spatial resolution for evaluation with point gauge rainfall in the desired application. The spatial downscaling method and satellite rainfall estimate are the two most critical aspects in determining the accuracy of downscaled findings. In the Upper Tekezie River Basin, bilinear downscaling performed marginally better than the nearest-neighbor method to integrate satellite products with observed rainfall [51]. Other studies also preferred the bilinear downscaling method for smooth interpolated satellite-derived rainfall [52,53]. Therefore, bilinear downscaling was the approach chosen to downscale the spatial resolution of pixels for this study area.
The downscaled global precipitation product is more accurate than the original coarser resolution [54,55]. Therefore, the pixel value of raw spatial resolution GPPs in their downscaled version (0.01° × 0.01°) was compared to gauge measurements.
The grid-to-point method can induce uncertainty in the performance of global satellite precipitation products due to the comparison of two datasets on different spatial scales regardless of the location of gauges in the pixel. The PERSIANN_CDR (0.25° × 0.25°) pixel contains multiple rain gauge stations (greater than 3), which allows investigating the spatial mismatch global precipitation products against station observations for the eastern upper course (blue-colored grid box in study area map.
3.2. Evaluation Performance Indices
The quantitative and categorical evaluation indicator methods were carefully selected according to robustness, common usage, and recommendation in previous studies [39]. These performance indicators are described at https://www.cawcr.gov.au/projects/verification/ (accessed on 12 May 2017), implemented within the Climate Data Tool (CDT). Performance was assessed through quantitative evaluation indicators such as the coefficient of determination (R2) (Equation (1)), percentage bias (Pbias) (Equation (3)), bias (Equation (4)), Pearson’s correlation coefficient (CC) (Equation (2)), and root-mean-square error (RMSE) (Equation (5)). CC justifies the relationship between the exact values of two variables (independent and dependent). Values range between zero (no correlation) and one (perfect correlation). R2 measures how well the independent variables explain the dependent variable in a regression. Values range between zero (no correlation) and one (perfect correlation). Bias describes the extent to which the observed value is underestimated or overestimated. The RMSE represents how closely the satellite observation predicts the measured value.
where Gi and Si represent the gauge and global precipitation data on the i-th day, i is the index, and are the average values of Si and Gi, respectively.
The ability of global precipitation estimates to determine the existence of precipitation rates was tested using the probability of detection (POD) (Equation (6)). POD was employed to evaluate the likelihood of the observed precipitation event being correctly detected by the satellite estimate. A dichotomous estimate that says “yes, an event will happen” or “no, an event will not happen” was used to quantify the metrics, as shown in Table 2. For this application, a rainfall threshold value of 1 mm was applied to decide the occurrence of a rainy or non-rainy day [25,33].
where the absolute score of POD varies from 0–1.
4. Result and Discussion
4.1. Comparison of Global Precipitation Products at Temporal Scale
This section presents a comparison of three global precipitation products and their downscaled versions vs. station data measurements according to the essential subject of gauge representativeness to identify the most reliable products for water resource assessment, climate studies, and hydrological applications across the data-scarce WSRB at different temporal scales for the period from 1983 to 2014.
4.1.1. Daily Comparison
The raw and downscaled global precipitation data were evaluated with observed rainfall at a daily timescale. Global precipitation products and their downscaled versions presented weak performance according to the majority of statistical indicator indices. The downscaled GPPs outperformed the original coarser resolutions as can be seen in Table 3. This result is similar to previous findings [54,55]. This might be due to the accuracy of the original precipitation product and the spatial downscaling method [39]. The RMSE in global precipitation products and their downscaled versions was highest in the southern and northeastern parts of the basin, with values ranging from 4 to 13 mm, as can be seen in Figure 3b. TAMSAT-D performed better than other products with a minimum RMSE for a value of 6.926 mm. The value of Pearson’s correlation coefficient (CC) showed a poor relationship for all global precipitation products, but the CC value was relatively higher in the southern and northern parts of the basin, with values between 0.05 and 0.5, as can be seen from Figure 3a. TAMSAT-D showed the best agreement with a higher CC (0.332). The highest coefficient (R2 = 0.039) was obtained by TAMSTAv3 and TAMSAT_D, as can be seen Figure 5a. The high performance of daily rainfall estimates from TAMSTAv3 and its downscaled version could be due to the loss of localized convective precipitation with the specified threshold value of the study area. This discovery is in line with the findings of previous investigations. CHIRPSv2 and its downscaled version showed the worst performance, as can be seen in Table 3. This could be attributed to the areal discrepancy of gauge observations and satellite estimates, as well as of the retrieval algorithms in disaggregating pentadal data to daily values [56]. On the other hand, PERSIANN_CDR_D showed a relatively good performance with a lower, positive Pbias compared to other products (underestimate), with a value of 3.09%, as presented in Table 3. The spatial distribution of Pbias for PERSIANN_CDR_D (Figure 3c) showed better performance than most stations.
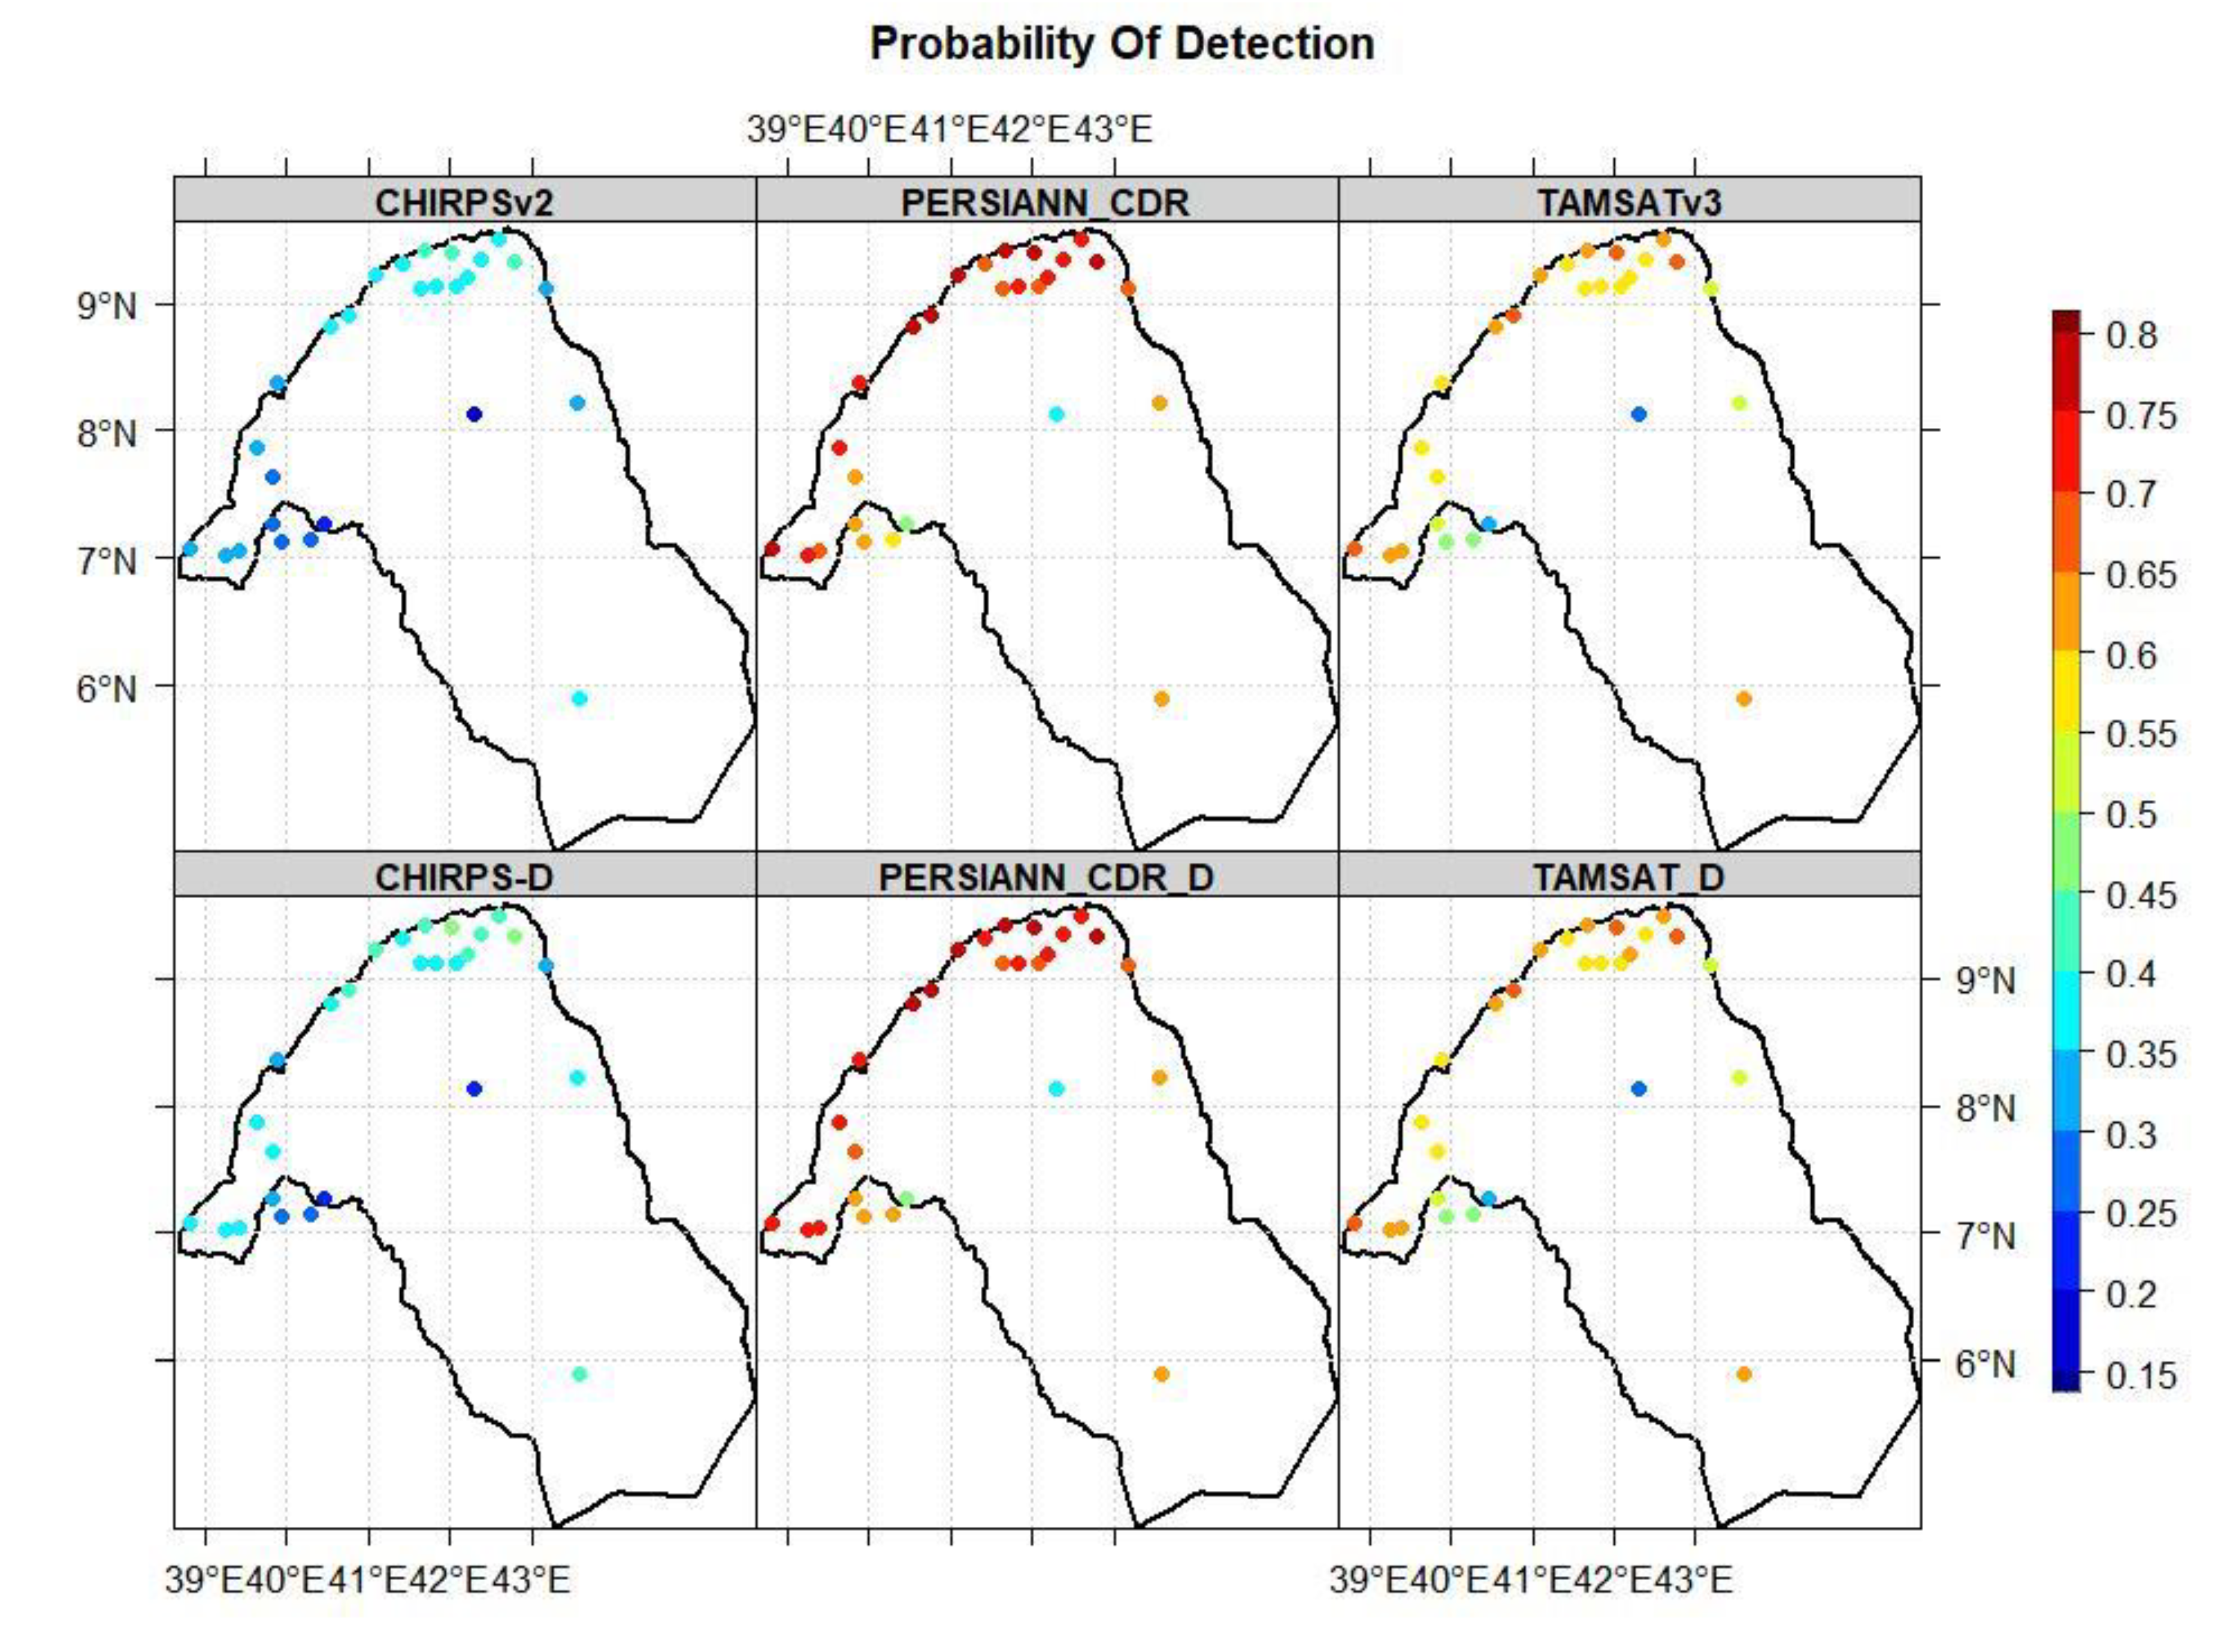
The ability of GPPs to detect the occurrence of precipitation events was also evaluated. In general, the downscaled products had better rainfall capability detection than the raw spatial resolution products in terms of the POD categorical statistical indicator. In this context, PERSIANN_CDR-D revealed a higher POD (0.691) than the PERSIANN_CDR precipitation product, as presented in Table 3. Both the raw and the downscaled precipitation products provided reasonably good PODs, varying between 0.25 and 0.893, as shown in Figure 4a. The highest POD and low Pbias indicate that PERSIANN_CDR-D is suitable for capturing the behavior of extreme precipitation events in the Wabi Shebelle River Basin, Ethiopia. The same result was also confirmed by [57]. This could be due to the adjustment of PERSIANN_CDR using GPCP monthly 2.50 precipitation products [13]. CHIRPSv3 showed extremely poor performance according to the categorical statistical indicator values.
It can be observed that, in general, the downscaled and raw products presented poor agreement with the ground reference data (r < 0.5). The scatter plots and cumulative distribution functions using the average daily timeseries gauge rainfall data against the GPPs were examined (Figure 5a,b). A relatively high coefficient (R2 = 0.039) was obtained by TAMSTAv3 and TAMSAT_D, and whereas CHIRPSv2 scored the lowest value. PERSIANN_CDR (downscaled and raw) showed reasonable agreement with the ground reference (R2 = 0.03). Furthermore, all products were comparatively symmetric to a 45° inclination. According to the CDFs (Figure 5b), all products were not comparatively denser for a 45° inclination. Furthermore, TAMSAT_D and PERSIANN_CDR_D revealed the worst correspondence with the station CDFs. This shows that these products underestimated the distribution for rainfall ≤ 10 mm/day, whereas CHIRPSv2 and CHIRPS_D overestimated the distribution for rainfall ≤ 10 mm/day.
4.1.2. Monthly Comparison
The accuracy of the global precipitation products in replicating precipitation was further investigated at a monthly timescale, as shown in Figure 6 and Table 4. The results indicate that the performance of GPPs and their downscaled versions increased when daily data were aggregated to monthly data. These findings were also confirmed by [10,58], which evaluated the performance accuracy of aggregated global precipitation products toward a coarser temporal resolution. For example, one study [36] investigated several global precipitation products over Burkina Faso with different temporal resolutions. The results indicated that the categorical and volumetric indicators significantly increased upon aggregating the timescale. Similarly, the authors of [59] evaluated the CHIRPS satellite precipitation estimates over eastern parts of the continent. In the comparison of CHIRPS estimates with ARC2 and TAMSTA, the findings exhibited reasonably better reference estimates at decadal and monthly timescales, with a better skill of detection and lower bias, while TAMSAT performed better at a daily timescale.
The downscaled GPPs outperformed their original coarser-resolution counterparts according to all statistical indicators of accuracy. CHIRPS-D performed better than other products with a minimum error value (RMSE = 53.734 mm) and higher correlation (CC = 0.748). The value of Pearson’s correlation coefficient (CC) showed a good relationship for raw and downscaled global precipitation products. Scatter plots using average monthly timeseries gauge rainfall data against the three GPPs and their downscaled versions were generated. The highest coefficient (R2 = 0.418) was obtained by CHIRPS_D. As the time resolution increased from days to months, the rainfall amount estimated by CHIRPSv2 became increasingly accurate. The best performance of CHIRPSv2 and its downscaled version could be due to the elimination of error as the data were aggregated to a coarser timescale. These findings are consistent with earlier investigations of CHIRPSv2 rainfall data at a monthly timescale [59,60].
PERSIANN-CDR showed the lowest values for RMSE, CC, and R2, as can be seen from Table 4 and Figure 6, on the daily timescale. PERSIANN_CDR_D showed relatively good performance with a lower, positive Pbias compared to other products (overestimate), with a value of 1.999%. PERSIANN_CDR_D resulted in the highest POD value of 0.993. CHIRPS_D and PERSIANN_CDR had the second better probability of detection (POD), whereas the TAMSAT group had the lowest value (Table 4). This implies that the performance of satellite estimates was influenced by the algorism and data source used.
4.2. Uncertainty Associated with a Pixel-To-To Point Method
In addition to the spatiotemporal investigation, the significant effect of the position of the stations in a pixel on the evaluation of the global precipitation product was analyzed, as shown in Figure 1 (blue-colored grid box). Furthermore, attempts were made to compare a pixel of selected GPPs (PERSIANN_CDR) against reference data, using the spatial average of all existing station data versus individual gauge stations within a pixel. Findings show that the minimum RMSE was obtained for PERSIANN_CDR when comparing the spatial average over each gauge station in the blue-colored box, with an average value of 4.667, as presented in Table 5.
PERSIANN_CDR achieved a reasonable maximum bias (overestimated by 12.6%) for the spatial average in the comparison of two datasets at the pixel level. On the other hand, the maximum bias ranged from, 40% and 31% using individual gauge stations Bisidimo and Fedis, respectively. In the comparison between the spatial average and the individual stations, Deder exhibited the smallest bias, while other stations changed the direction of the bias, with the exception of the Grawa and Bedeno gauge stations.
Generally, in terms of bias and RMSE, spatial averages estimated using rainfall data (eight stations) exhibited considerably different values to the referenced individual rain gauges in terms of magnitude. This magnitude difference may be related to the positions of the gauge stations and the uncertainty due to the representativeness of an individual rain gauge in providing the “true” spatial rainfall amount. Furthermore, the authors of [17,20,22,61] examined the variability and gauge representativeness of rainfall retrieved from the global precipitation product and showed the effect of network density on performance assessment. Therefore, it is essential to apply appropriate representative gauge data for the evaluation of products. Uncertainty related to the grid-to-point method can be addressed by avoiding the spatial mismatch between global precipitation products and the corresponding station measurements by downscaling the coarse resolution to a fine resolution [44]. In addition, installing additional rain gauges is strongly recommended within the grid [25].
5. Conclusions
In the current study, a total of six GPPs, three from raw global precipitation products (CHIRPSv2, TAMSATv3, and PERSIANN_CDR) and three from downscaled global precipitation products (CHIRPS_D, TAMSAT_D, and PERSIANN_CDR_D), were used. A bilinear method was applied to downscale the coarse spatial resolution of GPPs to 1 km resolution pixels. Categorical and quantitative evaluation index techniques were applied to WSRB, Ethiopia. The primary objective of the study was to assess the performance of the global precipitation products and their downscaled versions at different temporal scales compared to ground gauge stations.
The results indicated that the performance of global precipitation products is affected by factors such as the gauge density, spatiotemporal scale, and type of satellite algorithm. The daily evaluations were executed poorly in the majority of gauge stations. According to the evaluation parameters at the daily timescale, the downscaled GPPs performed best in terms of all statistical indicators. The evaluation assessment clearly indicated that TAMSAT_D was the best performer in terms of RMSE, CC, and scatter plots (R2). On the other hand, PERSIANN_CDR_D showed a relatively good performance with a lower, positive Pbias and higher POD values compared to other products. CHIRPSv2 showed the worst performance at a daily timescale. The results indicated that the performance of the GPPs and their downscaled versions increased when daily data were aggregated to monthly data. Therefore, CHIRPS-D performed better than other products with a minimum error value (RMSE) and higher CC and R2. However, PERSIANN_CDR_D presented a low Pbias and the highest POD values on daily and monthly timescales. In spatial mismatch analysis, the bias and RMSE estimated using rainfall data from individual rain gauges exhibited different magnitudes over the spatial average for PERSIANN_CDR, indicating that individual gauge data could not accurately estimate the product.
Overall, the performance of downscaled global precipitation products was better than that of the coarser-resolution products according to all statistical parameters. TAMSAT-D and CHIRPS-D products were the best-performing GPPs in reproducing the daily and monthly rainfall data, respectively. PERSIANN_CDR also accurately captured the extreme rainfall over the study area. This study provides a relatively long consistent and homogeneous timeseries rainfall dataset for climatology analysis and hydrological applications with a 1 km resolution for the study area. Although satellite precipitation products provide information at a high spatial resolution, they are lower in precision. On the other hand, gauges provide accurate point measurements but have limited spatial representativity. Therefore, for future studies, we recommend merging the downscaled product to improve the data availability in terms of accuracy, spatial distribution, and accumulated rainfall volume over the data-scarce Wabi Shebelle River Basin, Ethiopia, with a complex terrain, as well as other regions with a similar climate and topographical location.
Author Contributions
K.E.T. and A.M.M. conceptualized the study, framed the design, conducted data analysis, and wrote the manuscript. H.B.L., P.P. and A.A. conceptualized the study and provided satellite data. All authors have read and agreed to the published version of the manuscript.
Funding
This research received no external funding.
Institutional Review Board Statement
Not appilicable.
Informed Consent Statement
Not appilicable.
Data Availability Statement
All data models and code generated or used during the paper in the summited article.
Acknowledgments
This research was financially supported by the Africa Center of Excellence for Water Management (ACEWM) hosted by Addis Ababa University. The authors acknowledge the National Meteorological Agency (NMA) for providing a relevant data.
Conflicts of Interest
The authors declare no conflict of interest.
References
- Gioia, A.; Lioi, B.; Totaro, V.; Molfetta, M.G.; Apollonio, C.; Bisantino, T.; Iacobellis, V. Estimation of Peak Discharges under Different Rainfall Depth–Duration–Frequency Formulations. Hydrology 2021, 8, 150. [Google Scholar] [CrossRef]
- Abitew, T.A. On the Use of Remotely Sensed Products in Spatially Distributed Hydrological Models of Data Scarce Tropical Basins; VUB—Crazy Copy Center Productions: Ixelles, Belgium, 2017; ISBN 9789492312556. [Google Scholar]
- Soo, E.Z.X.; Jaafar, W.Z.W.; Lai, S.H.; Islam, T.; Srivastava, P. Evaluation of Satellite Precipitation Products for Extreme Flood Events: Case Study in Peninsular Malaysia. J. Water Clim. Chang. 2018, 10, 871–892. [Google Scholar] [CrossRef]
- Hobouchian, M.P.; Salio, P.; García Skabar, Y.; Vila, D.; Garreaud, R. Assessment of Satellite Precipitation Estimates over the Slopes of the Subtropical Andes. Atmos. Res. 2017, 190, 43–54. [Google Scholar] [CrossRef]
- Behrangi, A.; Khakbaz, B.; Chun, T.; Aghakouchak, A.; Hsu, K. Hydrologic Evaluation of Satellite Precipitation Products over a Mid-Size Basin. J. Hydrol. 2011, 397, 225–237. [Google Scholar] [CrossRef] [Green Version]
- Worqlul, A.W.; Maathuis, B.; Adem, A.A.; Demissie, S.S.; Langan, S.; Steenhuis, T.S. Comparison of Rainfall Estimations by TRMM 3B42, MPEG and CFSR with Ground-Observed Data for the Lake Tana Basin in Ethiopia. Hydrol. Earth Syst. Sci. 2014, 18, 4871–4881. [Google Scholar] [CrossRef] [Green Version]
- Gebere, S.B.; Alamirew, T.; Merkel, B.J.; Melesse, A.M. Performance of High Resolution Satellite Rainfall Products over Data Scarce Parts of Eastern Ethiopia. Remote Sens. 2015, 7, 11639–11663. [Google Scholar] [CrossRef] [Green Version]
- WMO. Guide to Hydrological Practice; Data Acqision and Processing, Analysis, Forcing and Other Appilication; World Meteorological Organization: Geneva, Switzerland, 1994. [Google Scholar]
- Nigatu, Z.M.; Rientjes, T.; Haile, A.T. Hydrological Impact Assessment of Climate Change on Lake Tana’s Water Balance, Ethiopia. Am. J. Clim. Chang. 2016, 05, 27–37. [Google Scholar] [CrossRef] [Green Version]
- Bayissa, Y.; Tadesse, T.; Demisse, G.; Shiferaw, A. Evaluation of Satellite-Based Rainfall Estimates and Application to Monitor Meteorological Drought for the Upper Blue Nile Basin, Ethiopia. Remote Sens. 2017, 9, 669. [Google Scholar] [CrossRef] [Green Version]
- Maidment, R.I.; Grimes, D.; Allan, R.P.; Tarnavsky, E.; Marcstringer, M.; Hewison, T.; Roebeling, R.; Black, E. The 30 Year TAMSAT African Rainfall Climatology and Time Series (TARCAT) Data Set. J. Geophys. Res. 2014, 119, 10–619. [Google Scholar] [CrossRef] [Green Version]
- Funk, C.; Peterson, P.; Landsfeld, M.; Pedreros, D.; Verdin, J.; Shukla, S.; Husak, G.; Rowland, J.; Harrison, L.; Hoell, A.; et al. The Climate Hazards Infrared Precipitation with Stations—A New Environmental Record for Monitoring Extremes. Sci. Data 2015, 2, 150066. [Google Scholar] [CrossRef] [Green Version]
- Ashouri, H.; Hsu, K.-L.; Sorooshian, S.; Braithwaite, D.K.; Knapp, K.R.; Cecil, L.D.; Nelson, B.R.; Prat, O.P. PERSIANN-CDR: Daily Precipitation Climate Data Record from Multisatellite Observations for Hydrological and Climate Studies. Bull. Am. Meteorol. Soc. 2015, 96, 69–83. [Google Scholar] [CrossRef] [Green Version]
- Gebremicael, T.G.; Mohamed, Y.A.; van der Zaag, P.; Berhe, A.G.; Haile, G.G.; Hagos, E.Y.; Hagos, M.K. Comparison and Validation of Eight Satellite Rainfall Products over the Rugged Topography of Tekeze-Atbara Basin at Different Spatial and Temporal Scales. Hydrol. Earth Syst. Sci. Discuss. 2017, 1–31. [Google Scholar] [CrossRef] [Green Version]
- Gumindoga, W.; Haile, A.T.; Makurira, H.; Reggiani, P. Bias Correction Schemes for CMORPH Satellite Rainfall Estimates in the Zambezi River Basin. Hydrol. Earth Syst. Sci. Discuss. 2016, 1–36. [Google Scholar] [CrossRef] [Green Version]
- Dinku, T.; Hailemariam, K.; Maidment, R.; Tarnavsky, E.; Connor, S. Combined Use of Satellite Estimates and Rain Gauge Observations to Generate High-Quality Historical Rainfall Time Series over Ethiopia. Int. J. Climatol. 2014, 34, 2489–2504. [Google Scholar] [CrossRef] [Green Version]
- Tang, G.; Behrangi, A.; Long, D.; Li, C.; Hong, Y. Accounting for Spatiotemporal Errors of Gauges: A Critical Step to Evaluate Gridded Precipitation Products. J. Hydrol. 2018, 559, 294–306. [Google Scholar] [CrossRef] [Green Version]
- Dai, Q.; Yang, Q.; Zhang, J.; Zhang, S. Impact of Gauge Representative Error on a Radar Rainfall Uncertainty Model. J. Appl. Meteorol. Climatol. 2018, 57, 2769–2787. [Google Scholar] [CrossRef]
- Peleg, N.; Ben-Asher, M.; Morin, E. Radar Subpixel-Scale Rainfall Variability and Uncertainty: Lessons Learned from Observations of a Dense Rain-Gauge Network. Hydrol. Earth Syst. Sci. 2013, 17, 2195–2208. [Google Scholar] [CrossRef] [Green Version]
- Hu, L.; Nikolopoulos, E.I.; Marra, F.; Morin, E.; Marani, M.; Anagnostou, E.N. Evaluation of MEVD-Based Precipitation Frequency Analyses from Quasi-Global Precipitation Datasets against Dense Rain Gauge Networks. J. Hydrol. 2020, 590, 125564. [Google Scholar] [CrossRef]
- Atiah, W.A.; Amekudzi, L.K.; Aryee, J.N.A.; Preko, K.; Danuor, S.K. Validation of Satellite and Merged Rainfall Data over Ghana, West Africa. Atmosphere 2020, 11, 859. [Google Scholar] [CrossRef]
- Mekonnen, K.; Melesse, A.M.; Woldesenbet, T.A. Effect of Temporal Sampling Mismatches between Satellite Rainfall Estimates and Rain Gauge Observations on Modelling Extreme Rainfall in the Upper Awash Basin, Ethiopia. J. Hydrol. 2021, 598, 126467. [Google Scholar] [CrossRef]
- MoWR (Ministry of Water Resources). Integrated Development of Wabi Shebelle River Basin Master Plan Study in Climatology; Addis Ababa University: Addis Ababa, Ethiopia, 2004. [Google Scholar]
- Sahlu, D.; Nikolopoulos, E.I.; Moges, S.A.; Anagnostou, E.N.; Hailu, D. First Evaluation of the Day-1 IMERG over the Upper Blue Nile Basin. J. Hydrometeorol. 2016, 17, 2875–2882. [Google Scholar] [CrossRef]
- Gebremichael, M.; Bitew, M.M.; Hirpa, F.A.; Tesfay, G.N. Accuracy of Satellite Rainfall Estimates in the Blue Nile Basin: Lowland Plain versus Highland Mountain. Water Resour. Res. 2014, 50, 8775–8790. [Google Scholar] [CrossRef]
- Abera, W.; Brocca, L.; Rigon, R. Evaluation of Different SREs and Bias Correction in the Upper Blue Nile; UBN: Lagos, Nigeria, 2015. [Google Scholar]
- Belete, M.; Deng, J.; Wang, K.; Zhou, M.; Zhu, E.; Shifaw, E.; Bayissa, Y. Evaluation of Satellite Rainfall Products for Modeling Water Yield over the Source Region of Blue Nile Basin. Sci. Total Environ. 2019, 708, 134834. [Google Scholar] [CrossRef]
- Abera, W.; Brocca, L.; Rigon, R. Comparative Evaluation of Different Satellite Rainfall Estimation Products and Bias Correction in the Upper Blue Nile (UBN) Basin. Atmos. Res. 2016, 178–179, 471–483. [Google Scholar] [CrossRef]
- Habib, E.; Haile, A.T.; Sazib, N.; Zhang, Y.; Rientjes, T. Effect of Bias Correction of Satellite-Rainfall Estimates on Runoff Simulations at the Source of the Upper Blue Nile. Remote Sens. 2014, 6, 6688–6708. [Google Scholar] [CrossRef] [Green Version]
- Haile, A.T. Rainfall Variability and Estimation for Hydrologic Modeling: A Remote Sensing Based Study at the Source Basin of the Upper Blue Nile River; University of Twente: Enschede, The Netherlands, 2010; p. 209. [Google Scholar]
- Haile, A.T.; Habib, E.; Rientjes, T. Evaluation of the Climate Prediction Center (CPC) Morphing Technique (CMORPH) Rainfall Product on Hourly Time Scales over the Source of the Blue Nile River. Hydrol. Processes 2013, 27, 1829–1839. [Google Scholar] [CrossRef]
- Worqlul, A.W.; Collick, A.S.; Tilahun, S.A.; Langan, S.; Rientjes, T.H.M.; Steenhuis, T.S. Comparing TRMM 3B42, CFSR and Ground-Based Rainfall Estimates as Input for Hydrological Models, in Data Scarce Regions: The Upper Blue Nile Basin, Ethiopia. Hydrol. Earth Syst. Sci. Discuss. 2015, 12, 2081–2112. [Google Scholar] [CrossRef]
- Haile, A.T.; Yan, F.; Habib, E. Accuracy of the CMORPH Satellite-Rainfall Product over Lake Tana Basin in Eastern Africa. Atmos. Res. 2015, 163, 177–187. [Google Scholar] [CrossRef] [Green Version]
- Mekonnen, K.; Melesse, A.M.; Woldesenbet, T.A. Spatial Evaluation of Satellite-Retrieved Extreme Rainfall Rates in the Upper Awash River Basin, Ethiopia. Atmos. Res. 2021, 249, 105297. [Google Scholar] [CrossRef]
- Koriche, S.A. Remote Sensing Based Hydrological Modelling for Flood Early Warning in the Upper and Middle Awash River Basin. In Proceedings of the Ethiopian Conference Center, Addis Ababa, Ethiopia, 19–20 October 2012; p. 67. [Google Scholar]
- Dinku, T.; Funk, C.; Peterson, P.; Barbara, S.; Maidment, R.; Tadesse, T. Validation of the CHIRPS Satellite Rainfall Estimates over Eastern of Africa: Validation of the CHIRPS Satellite Rainfall Estimates over Eastern Africa. Q. J. R. Meteorol. Soc. 2018, 144, 292–312. [Google Scholar] [CrossRef] [Green Version]
- Young, M.P.; Williams, C.J.R.; Christine Chiu, J.; Maidment, R.I.; Chen, S.H. Investigation of Discrepancies in Satellite Rainfall Estimates over Ethiopia. J. Hydrometeorol. 2014, 15, 2347–2369. [Google Scholar] [CrossRef] [Green Version]
- Hirpa, F.A.; Gebremichael, M.; Hopson, T. Evaluation of High-Resolution Satellite Precipitation Products over Very Complex Terrain in Ethiopia. J. Appl. Meteorol. Climatol. 2010, 49, 1044–1051. [Google Scholar] [CrossRef]
- Dinku, T.; Ceccato, P.; Grover-Kopec, E.; Lemma, M.; Connor, S.J.; Ropelewski, C.F. Validation of Satellite Rainfall Products over East Africa’s Complex Topography. Int. J. Remote Sens. 2007, 28, 1503–1526. [Google Scholar] [CrossRef]
- Lemma, E.; Upadhyaya, S.; Ramsankaran, R.A.A.J. Investigating the Performance of Satellite and Reanalysis Rainfall Products at Monthly Timescales across Different Rainfall Regimes of Ethiopia. Int. J. Remote Sens. 2019, 40, 4019–4042. [Google Scholar] [CrossRef]
- Gella, G.W. Statistical Evaluation of High Resolution Satellite Precipitation Products in Arid and Semi-Arid Parts of Ethiopia: A Note for Hydro-Meteorological Applications. Water Environ. J. 2019, 33, 86–97. [Google Scholar] [CrossRef]
- Kimani, M.W.; Hoedjes, J.C.B.; Su, Z. An Assessment of Satellite-Derived Rainfall Products Relative to Ground Observations over East Africa. Remote Sens. 2017, 9, 430. [Google Scholar] [CrossRef] [Green Version]
- Peleg, N.; Marra, F.; Fatichi, S.; Paschalis, A.; Molnar, P.; Burlando, P. Spatial Variability of Extreme Rainfall at Radar Subpixel Scale. J. Hydrol. 2018, 556, 922–933. [Google Scholar] [CrossRef] [Green Version]
- Zorzetto, E.; Marani, M.; Water Resources Research. Undefined Downscaling of Rainfall Extremes from Satellite Observations. Wiley Online Libr. 2019, 55, 156–174. [Google Scholar] [CrossRef] [Green Version]
- Bui, H.T.; Ishidaira, H.; Shaowei, N. Evaluation of the Use of Global Satellite—Gauge and Satellite—Only Precipitation Products in Stream Flow Simulations. Appl. Water Sci. 2019, 9, 53. [Google Scholar] [CrossRef] [Green Version]
- Mahbod, M.; Shirvani, A.; Veronesi, F. A Comparative Analysis of the Precipitation Extremes Obtained from Tropical Rainfall-Measuring Mission Satellite and Rain Gauges Datasets over a Semiarid Region. Int. J. Climatol. 2019, 39, 495–515. [Google Scholar] [CrossRef]
- Nastos, P.T.; Kapsomenakis, J.; Douvis, K.C. Analysis of Precipitation Extremes Based on Satellite and High-Resolution Gridded Data Set over Mediterranean Basin. Atmos. Res. 2013, 131, 46–59. [Google Scholar] [CrossRef]
- Aghakouchak, A.; Behrangi, A.; Sorooshian, S.; Hsu, K.; Amitai, E. Evaluation of Satellite-Retrieved Extreme Precipitation Rates across the Central United States. J. Geophys. Res. Atmos. 2011, 116, 3. [Google Scholar] [CrossRef]
- Mantas, V.M.; Liu, Z.; Caro, C.; Pereira, A.J.S.C. Validation of TRMM Multi-Satellite Precipitation Analysis (TMPA) Products in the Peruvian Andes. Atmos. Res. 2015, 163, 132–145. [Google Scholar] [CrossRef]
- Gebrechorkos, S.H.; Hülsmann, S.; Bernhofer, C. Evaluation of Multiple Climate Data Sources for Managing Environmental Resources in East Africa. Hydrol. Earth Syst. Sci. 2018, 22, 4547–4564. [Google Scholar] [CrossRef] [Green Version]
- Gebremedhin, M.A.; Lubczynski, M.W.; Maathuis, B.H.P.; Teka, D. Novel Approach to Integrate Daily Satellite Rainfall with In-Situ Rainfall, Upper Tekeze Basin, Ethiopia. Atmos. Res. 2021, 248, 105135. [Google Scholar] [CrossRef]
- Ulloa, J.; Ballari, D.; Campozano, L.; Samaniego, E. Two-Step Downscaling of TRMM 3b43 V7 Precipitation in Contrasting Climatic Regions with Sparse Monitoring: The Case of Ecuador in Tropical South America. Remote Sens. 2017, 9, 758. [Google Scholar] [CrossRef] [Green Version]
- Chen, S.; Zhang, L.; She, D.; Chen, J. Spatial Downscaling of Tropical Rainfall Measuring Mission (TRMM) Annual and Monthly Precipitation Data over the Middle and Lower Reaches of the Yangtze River Basin, China. Water 2019, 11, 568. [Google Scholar] [CrossRef] [Green Version]
- Chu, W.; Gao, X.; Phillips, T.J.; Sorooshian, S. Consistency of Spatial Patterns of the Daily Precipitation Field in the Western United States and Its Application to Precipitation Disaggregation. Geophys. Res. Lett. 2011, 38, 1–6. [Google Scholar] [CrossRef] [Green Version]
- Chen, F.; Gao, Y.; Wang, Y.; Qin, F.; Li, X. Downscaling Satellite-Derived Daily Precipitation Products with an Integrated Framework. Int. J. Climatol. 2019, 39, 1287–1304. [Google Scholar] [CrossRef]
- Belay, A.S.; Fenta, A.A.; Yenehun, A.; Nigate, F.; Tilahun, S.A.; Moges, M.M.; Dessie, M.; Adgo, E.; Nyssen, J.; Chen, M.; et al. Evaluation and Application of Multi-Source Satellite Rainfall Product CHIRPS to Assess Spatio-Temporal Rainfall Variability on Data-Sparse Western Margins of Ethiopian Highlands. Remote Sens. 2019, 11, 2688. [Google Scholar] [CrossRef] [Green Version]
- Miao, C.; Ashouri, H.; Hsu, K.L.; Sorooshian, S.; Duan, Q. Evaluation of the PERSIANN-CDR Daily Rainfall Estimates in Capturing the Behavior of Extreme Precipitation Events over China. J. Hydrometeorol. 2015, 16, 1387–1396. [Google Scholar] [CrossRef] [Green Version]
- Dembélé, M.; Zwart, S.J. Evaluation and Comparison of Satellite-Based Rainfall Products in Burkina Faso, West Africa. Int. J. Remote Sens. 2016, 37, 3995–4014. [Google Scholar] [CrossRef] [Green Version]
- Malede, D.A.; Agumassie, T.A.; Kosgei, J.R.; Pham, Q.B.; Andualem, T.G. Evaluation of Satellite Rainfall Estimates in a Rugged Topographical Basin Over South Gojjam Basin, Ethiopia. J. Indian Soc. Remote Sens. 2022, 50, 1–14. [Google Scholar] [CrossRef]
- Ayehu, G.T.; Tadesse, T.; Gessesse, B.; Dinku, T. Validation of New Satellite Rainfall Products over the Upper Blue Nile Basin, Ethiopia. Atmos. Meas. Tech. 2018, 11, 1921–1936. [Google Scholar] [CrossRef] [Green Version]
- Tessema, K.B.; Haile, A.T.; Amencho, N.W.; Habib, E. Effect of Rainfall Variability and Gauge Representativeness on Satellite Rainfall Accuracy in a Small Upland Watershed in Southern Ethiopia. Hydrol. Sci. J. 2020, 1–15. [Google Scholar] [CrossRef]
Figure 1.
Study area description with rain gauge station distribution and topography elevation of Wabi Shebelle River Basin, Ethiopia.
Figure 1.
Study area description with rain gauge station distribution and topography elevation of Wabi Shebelle River Basin, Ethiopia.

Figure 2.
Annual rainfall in Wabi Shebelle River Basin.

Figure 3.
The statistical parameter correlation coefficient (a), root-mean-square error (b), and percentage bias (c) for each station at a daily timescale.
Figure 3.
The statistical parameter correlation coefficient (a), root-mean-square error (b), and percentage bias (c) for each station at a daily timescale.


Figure 4.
The probability of detection for each station at a daily timescale.

Figure 5.
(a) Scatter plot of cumulative distribution function; (b) plots of observed rainfall against the global precipitation products.
Figure 5.
(a) Scatter plot of cumulative distribution function; (b) plots of observed rainfall against the global precipitation products.

Figure 6.
Scatter charts of observed precipitation versus global precipitation products at monthly timescale.
Figure 6.
Scatter charts of observed precipitation versus global precipitation products at monthly timescale.


Table 1.
Global precipitation products used for Wabi Shebelle River Bain.
| Category | Input Data | Spatial Res. (Degree) | Temporal Res. | Start Date | Designation |
|---|---|---|---|---|---|
| Raw GPPs | CHIRPSv3 | 0.05 | 1 day | 1981 | CHIRPSv3 |
| PERSIANN_CDR | 0.25 | 3 h | 1983 | PERSIANN_CDR | |
| TAMSATv3 | 0.04 | 1 day | 1983 | TAMSATv3 | |
| Downscaled GPPs | CHIRPSv3-Downscale | 0.01 * | 1 day | 1981 | CHIRPS_D |
| PERSIANN_CDR_Downscale | 0.01 * | 3 h | 1983 | PERSIANN_CDR_D | |
| TAMSATv3-Downscale | 0.01 * | 1 day | 1983 | TAMSAT_D |
* The raw spatial resolution of the selected GPPs was downscaled to 1 km.
Table 2.
Contingency table of ainy and non-rainy event prediction by global precipitation products.
| GPPs | ||||
|---|---|---|---|---|
| Station measurement | Yes | No | Total | |
| No | Misses | Correct negative | Observed no | |
| Yes | Hit | False alarm | Observed yes | |
| Total | Estimate yes | Estimate no | Total | |
Table 3.
Daily statistical indicators of validation.
| Product | CHIRPSv2 | PERSIANN-CDR | TAMSATv3 | CHIRPS_D | TAMSAT_D | PERSIANN-CDR_CDR |
|---|---|---|---|---|---|---|
| Correlation | 0.245 | 0.298 | 0.33 | 0.25 | 0.331 | 0.307 |
| Pbias | −6.739 | 3.3 | −4.974 | −7.064 | −4.92 | 3.09 |
| RMSE | 8.297 | 7.183 | 6.948 | 8.141 | 6.926 | 7.027 |
| POD | 0.334 | 0.684 | 0.569 | 0.363 | 0.575 | 0.691 |
Table 4.
Monthly statistical indicators of GPPs evaluated.
| Product | CHIRPSv2 | PERSIANN-CDR | TAMSATv3 | CHIRPS_D | TAMSAT_D | PERSIANN-CDR_D |
|---|---|---|---|---|---|---|
| Correlation | 0.745 | 0.659 | 0.699 | 0.748 | 0.709 | 0.664 |
| PBIAS | −6.729 | 2.388 | −6.066 | −7.055 | −3179 | 1.999 |
| RMSE | 53.958 | 63.739 | 58.894 | 53.734 | 57.884 | 62.0345 |
| POD | 0.984 | 0.986 | 0.897 | 0.986 | 0.897 | 0.993 |
Table 5.
Statistical indicators of global precipitation products and station measurements within the grid.
Table 5.
Statistical indicators of global precipitation products and station measurements within the grid.
| STATION | PERSIANN_CDR | |||
|---|---|---|---|---|
| LON | STATS/LAT | BIAS | RMSE | |
| Average over the pixel | 1.126 | 4.667 | ||
| Girawa | 41.83 | 9.13 | 0.938 | 7.86 |
| Gursum | 42.38 | 9.35 | 1.223 | 7.962 |
| Fedis | 42.08 | 9.13 | 1.317 | 6.897 |
| Kulubi | 41.68 | 9.42 | 1.026 | 7.519 |
| Alemaya | 42.03 | 9.4 | 1.314 | 6.557 |
| Bisidimo | 42.2 | 9.2 | 1.404 | 6.924 |
| Deder | 41.43 | 9.32 | 0.991 | 7.676 |
| Bedeno | 41.63 | 9.12 | 0.967 | 7.223 |
Publisher’s Note: MDPI stays neutral with regard to jurisdictional claims in published maps and institutional affiliations. |
© 2022 by the authors. Licensee MDPI, Basel, Switzerland. This article is an open access article distributed under the terms and conditions of the Creative Commons Attribution (CC BY) license (https://creativecommons.org/licenses/by/4.0/).
Share and Cite
MDPI and ACS Style
Tadesse, K.E.; Melesse, A.M.; Abebe, A.; Lakew, H.B.; Paron, P. Evaluation of Global Precipitation Products over Wabi Shebelle River Basin, Ethiopia. Hydrology 2022, 9, 66. https://0-doi-org.brum.beds.ac.uk/10.3390/hydrology9050066
AMA Style
Tadesse KE, Melesse AM, Abebe A, Lakew HB, Paron P. Evaluation of Global Precipitation Products over Wabi Shebelle River Basin, Ethiopia. Hydrology. 2022; 9(5):66. https://0-doi-org.brum.beds.ac.uk/10.3390/hydrology9050066
Chicago/Turabian StyleTadesse, Kindie Engdaw, Assefa M. Melesse, Adane Abebe, Haileyesus Belay Lakew, and Paolo Paron. 2022. "Evaluation of Global Precipitation Products over Wabi Shebelle River Basin, Ethiopia" Hydrology 9, no. 5: 66. https://0-doi-org.brum.beds.ac.uk/10.3390/hydrology9050066
Note that from the first issue of 2016, this journal uses article numbers instead of page numbers. See further details here.