Association between Working Hours and Self-Rated Health


1
College of Medicine, Gachon University, Incheon 21565, Korea
2
Department of Occupational and Environmental Medicine, Gil Medical Center, Gachon University College of Medicine, Incheon 21565, Korea
*
Author to whom correspondence should be addressed.
Int. J. Environ. Res. Public Health 2020, 17(8), 2736; https://0-doi-org.brum.beds.ac.uk/10.3390/ijerph17082736
Submission received: 18 March 2020
/
Revised: 10 April 2020
/
Accepted: 14 April 2020
/
Published: 15 April 2020
(This article belongs to the Section Occupational Safety and Health)
Abstract
:This study compared the association between working hours and self-rated health (SRH) according to sex, socioeconomic status, and working conditions. In all, 25,144 participants were selected from the Korea National Health and Nutrition Examination Survey (KNHANES), conducted from 2010 to 2018. The risks of poor SRH, according to working hours, were investigated using multiple logistic regression. Both short and long working hours were associated with poor SRH. Men working short hours and women working long hours were at risk of poor SRH. Workers with fewer than nine years of education were at risk of poor SRH when working short hours, whereas workers with more than nine years of education were at risk when working long hours. Similarly, simple laborers were at risk of poor SRH when working short hours, while managers and professional workers were at risk when working long hours. When working for short hours, paid employees were at risk of poor SRH. Workers with a non-fixed work schedule showed no risk of poor SRH when working long or short hours. In conclusion, workers working short hours with low education and workers working long hours with high education were at risk of poor SRH. Working conditions were significantly related to the association between SRH and working hours.
1. Introduction
The 2018 report by the Organization for Economic Cooperation and Development (OECD) indicated that the Republic of Korea (hereinafter Korea) had the third-longest number of working hours (1933 h per year) among countries in the OECD, following Mexico (2148 h) and Costa Rica (2121 h) [1]. Long working hours are a risk factor for workers’ health, leading to depressive symptoms [2,3,4], unhealthy weight gain [2,5], poor sleep condition [3,6], poor cognitive function [7], and anxiety [3]. Moreover, the associations between long working hours and several chronic diseases such as coronary heart disease [3,8], stroke [9], metabolic syndrome [10], and injury [11] were also reported.
Self-rated health (SRH) was verified as a predictor of mortality [12,13] and working sustainability [14]; owing to its simplicity and integrity, it can be employed as a general marker for many health-related factors [15]. Several studies investigated the associations between working hours and SRH. Two of these studies revealed that long working hours [16,17] and short working hours [17] were associated with poor SRH, more commonly among women. Such an association was also reported in young workers [18]. However, most of the studies investigated the trends of SRH with the stratification of only sex [16,18,19].
However, several studies showed that socioeconomic status (SES) may be related to the association between working conditions and health. According to a study, the increase in type 2 diabetes based on long working hours was greater in individuals with low SES [20]. In another study, only non-manual workers had a risk of obesity based on shift and night work [5].
Thus, to determine how personal, social, and work traits influence SRH, we investigated the trends in SRH according to working hours with stratification of sex, SES, and working conditions, employing the survey data representative of workers in Korea.
2. Materials and Methods
2.1. Data Collection and Study Participants
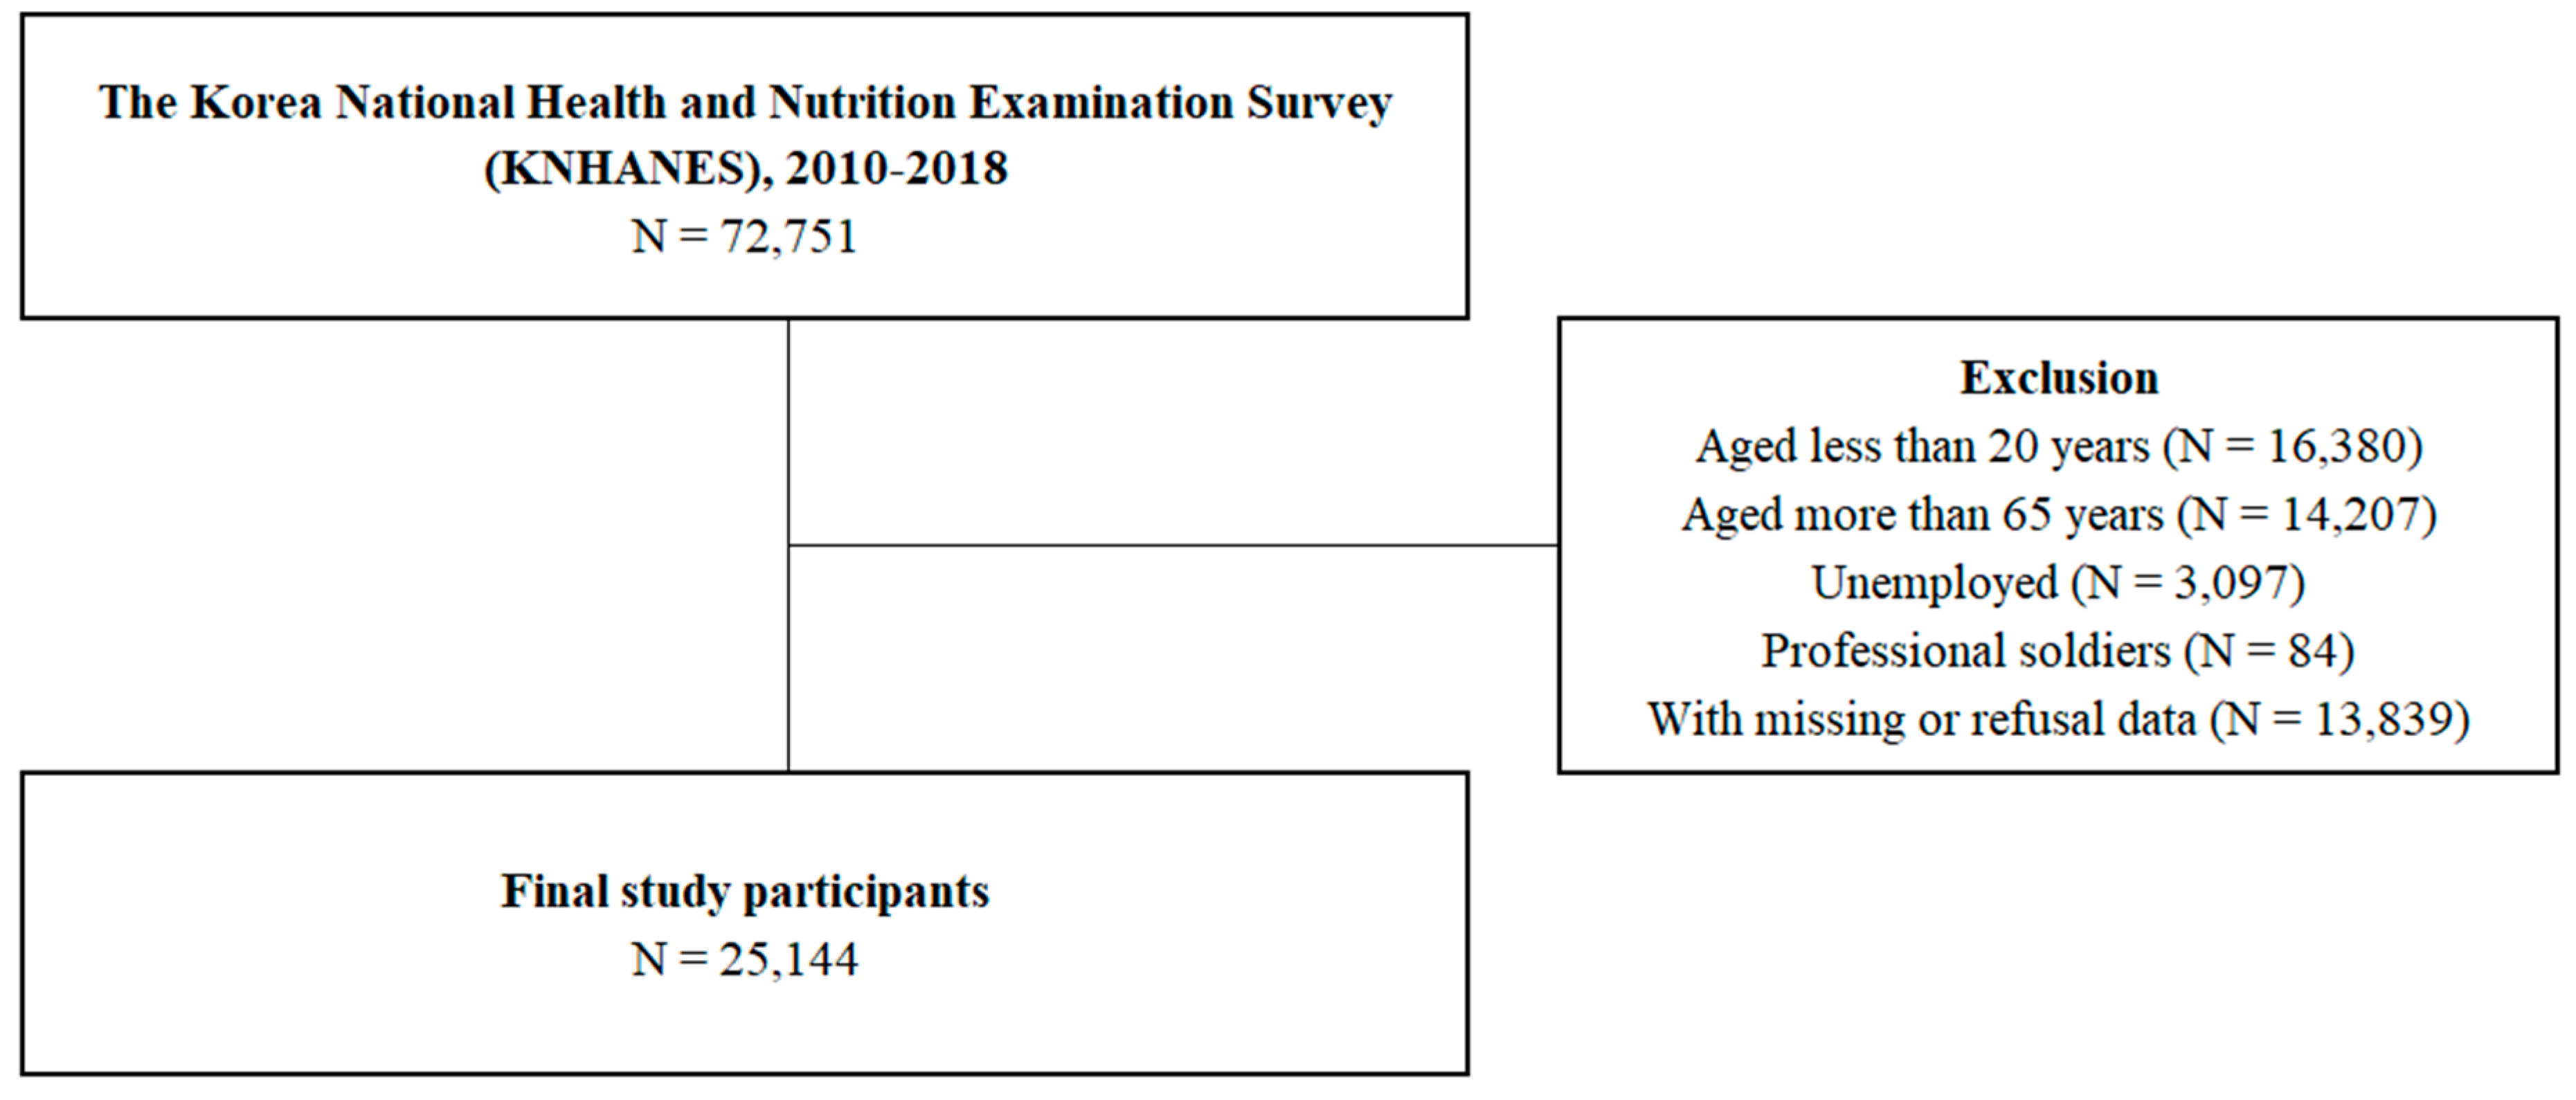
This cross-sectional study was based on the Korea National Health and Nutrition Examination Survey (KNHANES) conducted from 2010 to 2018, which included health behavioral status, SES, and working conditions as variables. The Korea Centers for Disease Control and Prevention conducted these surveys. In KNHANES, the sample design and size are estimated to represent the entire Korean population, so that the results can be employed to represent the overall population in Korea in each survey year [21]. The rates of participation in 2010–2018 ranged from 76.6% to 80.8%. Figure 1 shows the exclusion criteria used in ultimately selecting 25,144 study participants.
2.2. Measurement of Weekly Working Hours
Participants were asked about their average working hours per week, including night work and extra working time; weekly working hours were grouped into four categories: <20 h, 20–39 h, 40–59 h, and ≥60 h.
2.3. Self-Rated Health (SRH)
Participants were asked to evaluate their health using a five-point scale; “very good,” “good,” and “fair” were defined as good SRH, whereas “very poor” and “poor” were defined as poor SRH.
2.4. Categorizations of Socioeconomic Status (SES) and Working Conditions
SES (household income, education, and occupation) and working conditions (type of work and work schedule) were categorized for stratification. Household income was classified into four quartiles based on national statistics. Education was classified into four levels according to the Korean school system: “fewer than six years (elementary school),” “fewer than nine years (junior high school),” “fewer than 12 years (high school),” and “more than 12 years (college).” The occupation was classified into six categories: simple labor (Major Group 9: elementary occupations), craft, plant and machine operators, and assemblers (Major Group 7: craft and related trade workers and Major Group 8: plant and machine operators and assemblers), skilled agricultural, forestry, and fishery (Major Group 6: skilled agricultural, forestry, and fishery workers), service and sales (Major Group 5: service and sales workers), clerk (Group 4: clerical support workers), and manager and professional (Major Group 1: legislators, senior officials, and managers; Major Group 2: professionals; Major Group 3: technicians and associate professionals) based on the International Standard Classification of Occupations. Korea assigns more than 18 months of mandatory military duty to all male citizens (approximately 20–24 years old). Thus, Major Group 0: armed forces (professional soldier) was excluded due to heterogeneity in age and gender.
2.5. Measurements of Covariates
A previous study indicated that SRH was closely related to health behavioral factors (smoking and drinking), body mass index (BMI), and chronic diseases [22]. We selected covariates from both previous studies and backward stepwise selection. Smoking was classified into three categories: never, past, and current. Smokers who smoked fewer than 100 cigarettes throughout their lifetime were defined as never, and smokers who smoked before but quit were defined as past smokers. Drinking was classified into three categories: none, moderate, and severe. Drinkers who had no drinking history within the year were defined as none, and drinkers who drank five glasses (or more) of alcohol twice (or more) per week were defined as severe. Obesity was classified into three categories according to body mass index (BMI): underweight (<18.5), normal (<25), and obese (≥25). Three diseases were chosen as confounding factors to be adjusted: hypertension, diabetes, and depression.
2.6. Statistical Analysis
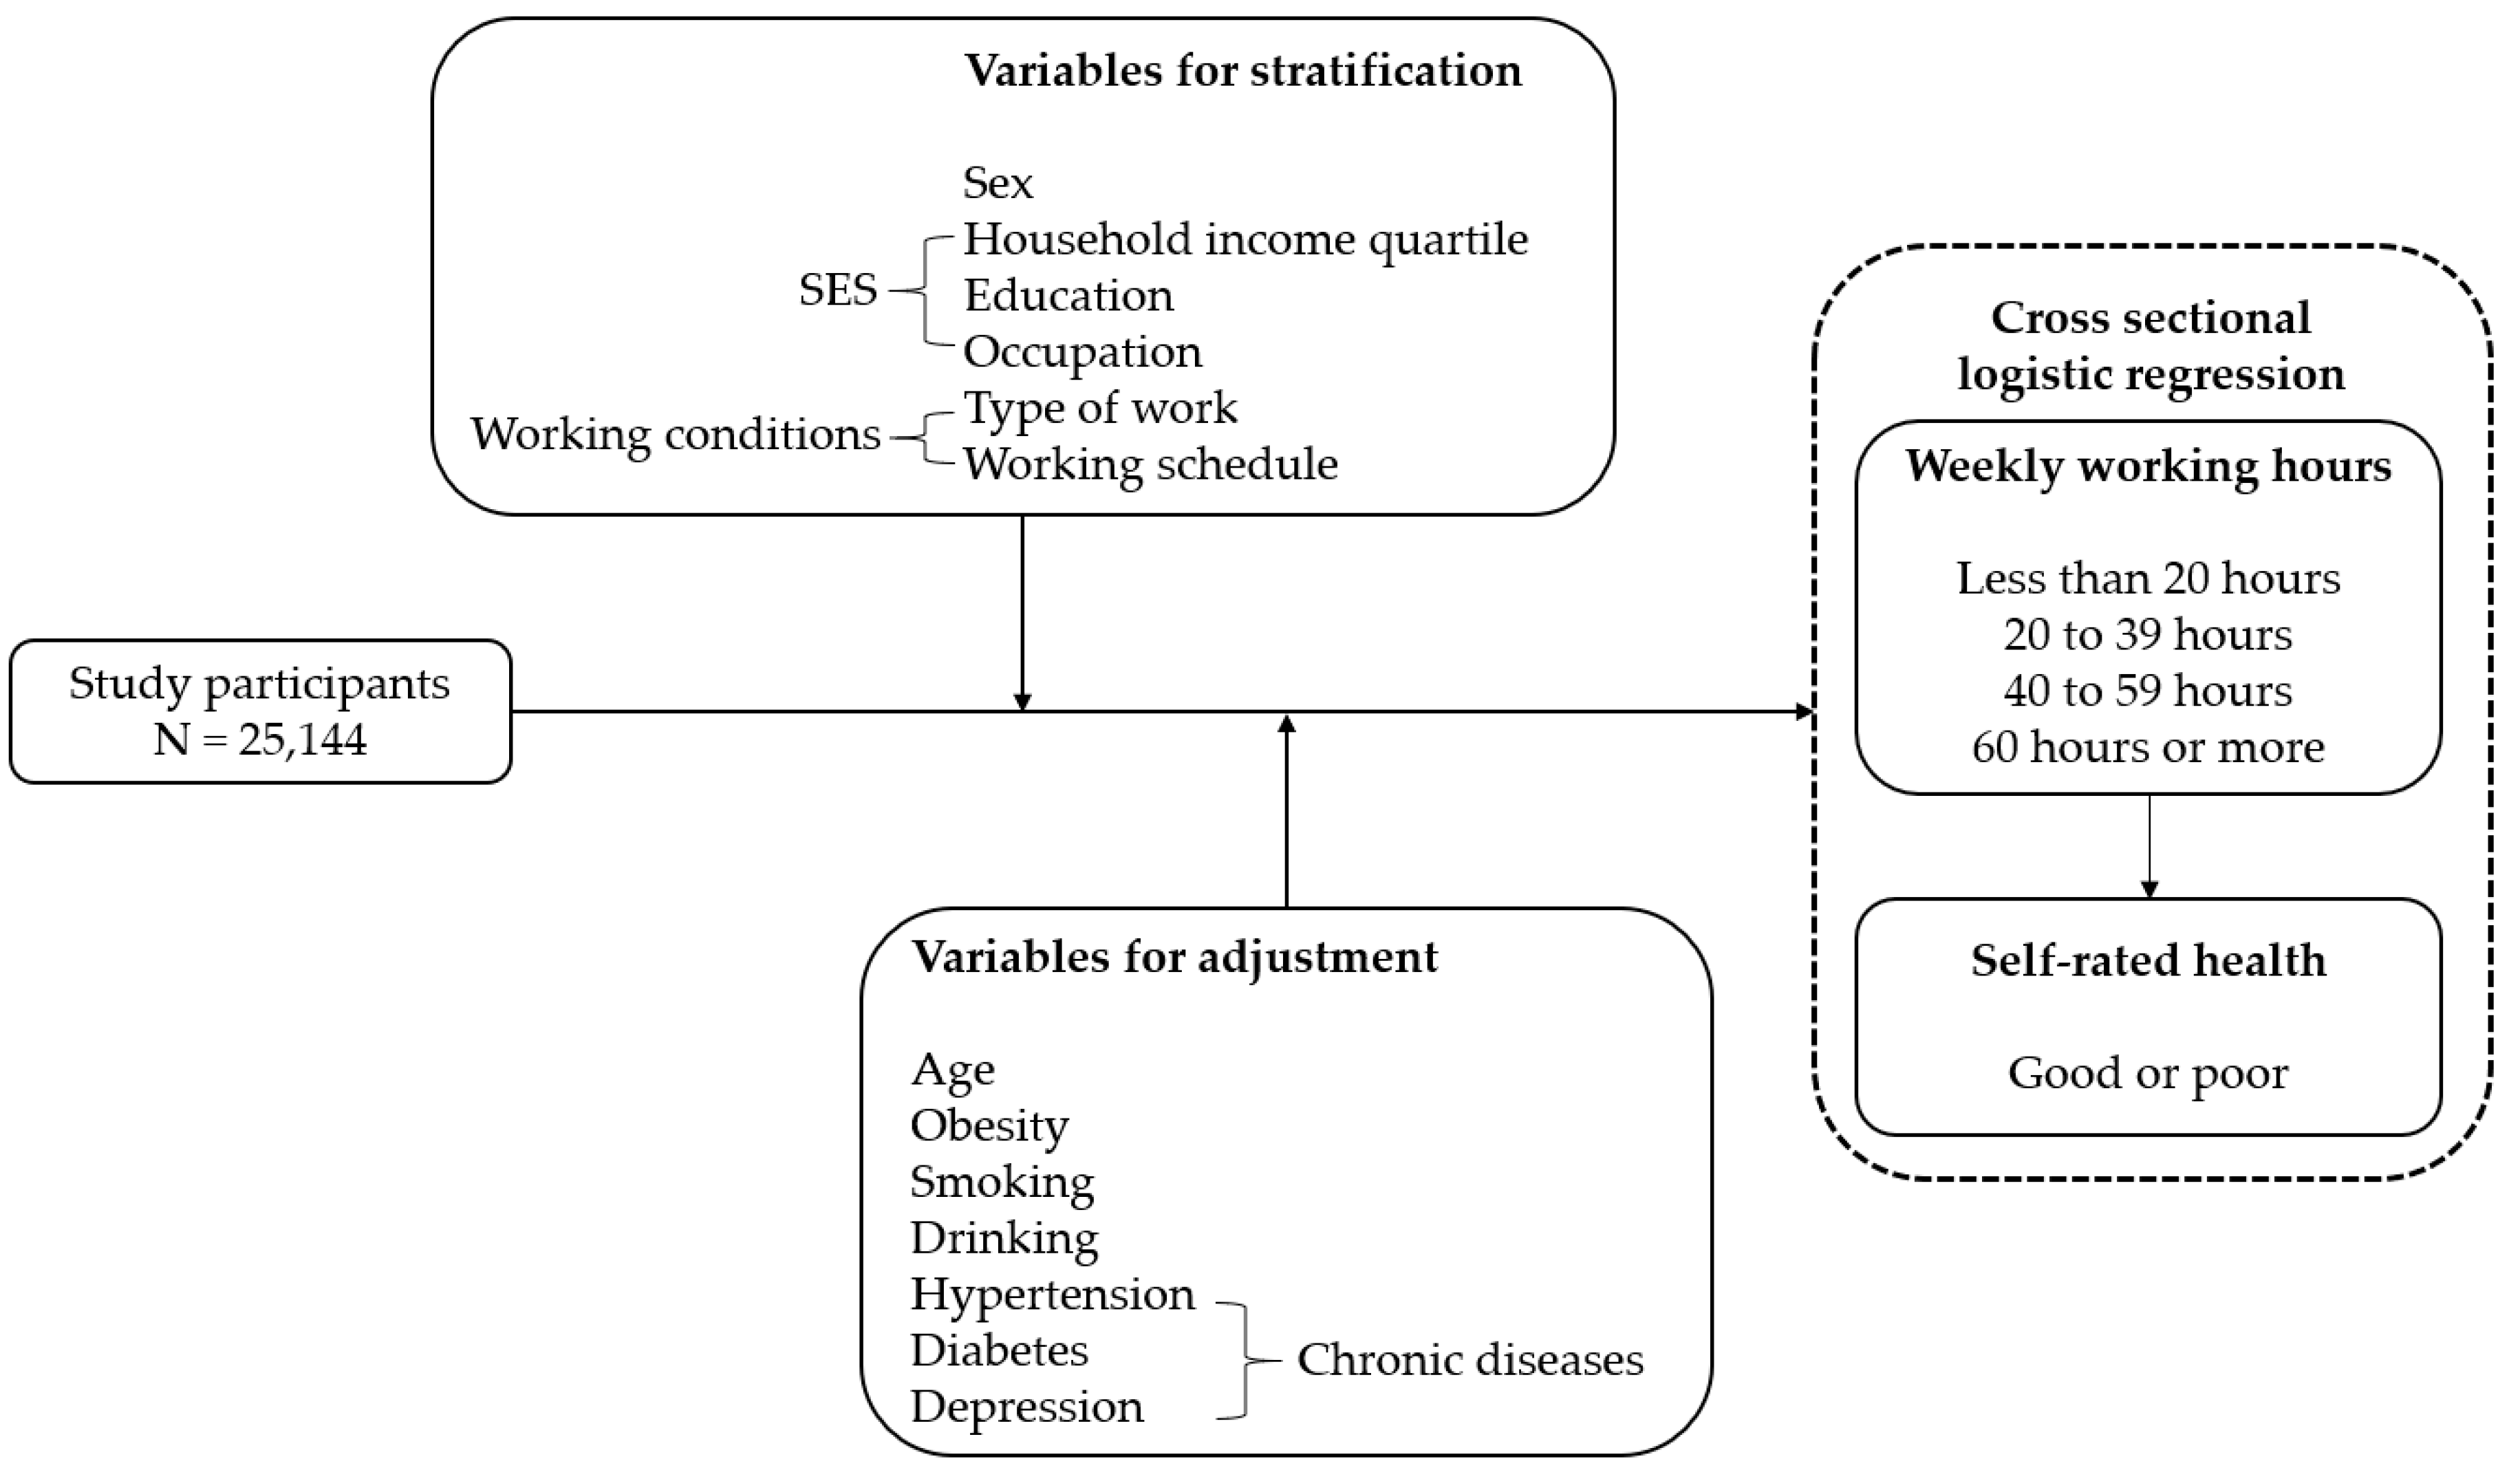
SPSS software version 25 (IBM Corp., Armonk, NY, USA) was used for statistical analyses. A p-value <0.05 was considered statistically significant. The chi-square test was used to assess the relationships between participants’ working hours and other variables. Multiple logistic regression was used to estimate odds ratios (ORs) and 95% confidence intervals (CIs) to estimate the trends of poor SRH by working hours while adjusting for age, disease, smoking, drinking, and obesity. Sex, household income quartiles, education, occupational classification, type of work, and work schedule were stratified. Figure 2 shows the analytical framework of current study.
3. Results
After excluding the unemployed, individuals aged below 20 years and above 65 years, professional soldiers, and individuals who did not answer the questionnaire, a final sample of 25,144 participants was obtained (Figure 1). Table 1 presents the participants’ general characteristics. Men worked longer than women. Workers in the first quartile of household income worked shorter hours, and workers in the third and fourth quartiles of household income tended to work for 40–59 h per week, including most Korean workers. Similarly, workers with college-level education tended to work for 40–59 h per week. For sales and service workers, the ratio of workers working ≥60 h per week was the largest; however, for simple laborers, the ratio of workers working <20 h per week was the largest. Paid employees and fixed workers tended to work 40–59 h per week.
Table 2 shows the ORs (and 95% CIs) of poor SRH according to working hours with stratification of sex, SES, and working conditions. The ORs were calculated after adjusting for age, obesity, smoking, drinking, and diseases. The reference group was workers who worked 40–59 h per week since their SRH was better than other groups. With no stratification, there were risks of poor SRH in workers working <20 h (OR = 1.299, 1.140–1.481) and ≥60 h (OR = 1.289, 1.163–1.430) per week. Men working <20 h per week were at risk of poor SRH (OR = 1.384, 1.080–1.772) in contrast to women. There were significant risks of poor SRH in both men (OR = 1.224, 1.064–1.407) and women (OR = 1.401, 1.197–1.639) working ≥60 h per week. Workers in the fourth quartile of household income and working ≥60 h per week were at risk of poor SRH (OR = 1.462, 1.221–1.751). When working <20 h per week, there were significant risks of poor SRH in workers with elementary level (OR = 1.579, 1.143–2.181) and junior high-school level education (OR = 1.433, 1.024–2.007). However, when working ≥60 h per week, there were significant risks of poor SRH among workers with high school (OR = 1.273, 1.072–1.512) and college (OR = 1.321, 1.092–1.598) level education. Simple laborers working <20 h per week were at risk of poor SRH (OR = 1.596, 1.199–2.124). In contrast, there were significant risks of poor SRH among managers and professional workers (OR = 1.371, 1.048–1.793) and service and sales workers (OR = 1.219, 1.007–1.477) working ≥60 h per week. Paid employees working <20 h per week were at risk of poor SRH (OR = 1.436, 1.226–1.682) in contrast to employers or self-employed workers. There were significant risks of poor SRH in both paid employees (OR = 1.232, 1.064–1.427) and employers or self-employed workers (OR = 1.251, 1.048–1.493) working ≥60 h per week. There were significant risks of poor SRH in fixed workers working <20 h (OR = 1.405, 1.212–1.629) and ≥60 h (OR = 1.290, 1.149–1.449) per week, as opposed to non-fixed workers.
4. Discussion
After adjusting for several demographic and health-related factors, statistically significant ORs were estimated between long or short working hours and SRH. In summary, poor SRH was related to long and short working hours in the total population. Both men and women working long hours were at risk of poor SRH, were the magnitude was greater among women. Only men were at risk of poor SRH when working for short hours. Workers with low education were at risk of poor SRH when working short hours, whereas workers with high education were at risk of poor SRH when working long hours. Additionally, occupations associated with either high or low educational level showed an identical relation. Paid employees were at risk of poor SRH when working short hours as compared to employers or self-employed workers. Compared with non-fixed workers, workers with fixed work schedules were at risk of poor SRH when working short or long hours.
Several studies indicated the adverse effects of long working hours on SRH, which is attributed to high job demands accompanied by long working hours [16,17,18,19], and the results of the present study support them. Additionally, short working hours are related to precarious working conditions [23] (temporary or daily, part-time, or contingent jobs), which are associated with poor health [16,24,25,26,27].
The result that women working long hours showed poorer SRH than men working long hours can be explained by the “double burden” of household and working duties of women [16,28]. This is why service and sales workers, of which women’s proportion was 63.7% in the present study, showed an unhealthy association with long working hours. In contrast to women working short hours, the SRH of men working short hours was poor. This was inconsistent with previous Korean studies; however, they were methodologically different from the present study. A study, confirming that only women had poor SRH with short working hours, merged workers who worked <40 h per week as one category [16]. In another study, which showed no association between short working hours and SRH in both sexes, short working hours were assessed in only one category: 20–35 h per week [19]. These differences would lead to discordance. However, considering that workers working <20 h per week accounted for 8.5% of the total participants in the present study, such workers were not negligible; therefore, a category for these workers was needed. The reason for this sex difference in short working hours is as follows: compared to unhealthy women, unhealthy men are more likely to be involuntarily thrown into precarious jobs with short working hours [23]. In Korea, there are profound gender inequalities regarding wage and housework time. In 2016, men earned more than twice what women earned, and men’s housework time was far shorter than women’s (3.2 h vs. 19.5 h) [29]. Such concentrations on men’s wage and women’s housework are so rooted that unhealthy men and women tend to work at the workplace or household, respectively, if they can barely work due to poor health. A study on the association between precarious jobs and poor SRH only included men, which also supports our interpretation [30].
High educational level and related occupations (manager and professionals, e.g., executive and physician) were associated with poor SRH when working long hours, which can be attributed to the lack of leisure-time physical activity. This shortage is related to poor health [31] and SRH [32]. White-collar workers have relatively long leisure-time physical activity [33,34]; therefore, the reduction of leisure-time physical activity due to long working hours would be greater in high educational occupations. On the contrary, low educational level and related occupations (simple labor, e.g., cleaner, helper) were associated with poor SRH when working for short hours. This can be interpreted as follows: the unhealthy effect of precarious jobs demanding short working hours is found only among workers with low education. Low educational level is related to precarious jobs [35], which are associated with short working hours and poor SRH [23]. The present study verified this chain of relationships exposing the simple association between working hours and SRH.
Paid employees working short hours showed poor SRH as opposed to employers or self-employed workers; this can be attributed to the differences in autonomy in modulating working hours. Employers or self-employed workers desiring short work can modulate their working hours at will; however, the short working hours of some employees would be involuntarily decided by the employers. Despite the fact that non-fixed work schedules were widely researched [36,37], an association of SRH according to working hours in non-fixed workers did not appear in the present study. Thus, estimating the effects of working hours on SRH in non-fixed workers appears difficult in a cross-sectional study. A study reported no relationship between shift work and SRH [38]. Thus, a longitudinal study is required.
This study has several limitations. Firstly, owing to its cross-sectional design, the causality between working hours and SRH could not be fully explained; the probability of reverse causality cannot be negligible. Secondly, due to recall bias, which inevitably occurred due to a retrospectively conducted survey, the participants’ answers could be inaccurate to a certain extent. Finally, these findings cannot be extrapolated to all participants due to differences in the reliability of self-rated health according to SES, ethnicity, gender, and age [39]. Nevertheless, this study has several novel points. This study stratified various factors, including sex, SES, and working conditions, so that the trends of SRH by working hours according to workers’ social and working traits could be predicted delicately. Additionally, by restricting age and adjusting several health-related factors, we tried to minimize the healthy worker effect.
5. Conclusions
In conclusion, long and short working hours were associated with poor SRH. Men working short hours were at risk of poor SRH, while women working short hours were not, which is attributed to the gender inequalities of wage and housework. Highly educated workers’ long working hours and less-educated workers’ short working hours were associated with poor SRH, indicating that workers’ educational level is a distinct factor in predicting SRH according to working hours. Occupations associated with either high or low educational levels had the same involvement, thus supporting the predictability of educational level. Employers or self-employed workers did not have any risk of poor SRH with short working hours, whereas paid employees did. The SRH of non-fixed workers did not worsen with long or short working hours in contrast to fixed workers; this implies that both short and long working hours are associated with workers’ health, but the magnitudes differ according to sex, SES, and working conditions. Further research is needed to clarify the causal association between working hours and self-rated health.
Author Contributions
J.J. conceptualized and designed the study, analyzed and interpreted the data, and drafted and reviewed the manuscript. W.L. designed the study, analyzed and interpreted the data, and drafted and reviewed the manuscript. W.-J.C. drafted and reviewed the manuscript. S.H. drafted and reviewed the manuscript. S.-K.K. designed the study, drafted and reviewed the manuscript, and analyzed and interpreted the data. All authors have read and agreed to the published version of the manuscript.
Funding
This research received no external funding.
Conflicts of Interest
The authors declare no conflicts of interest.
References
- OECD. Hours Worked (Indicator); OECD: Paris, France, 2018. [Google Scholar] [CrossRef]
- Shields, M. Long working hours and health. Health Rep. 1999, 11, 33–48. [Google Scholar] [PubMed]
- Bannai, A.; Tamakoshi, A. The association between long working hours and health: A systematic review of epidemiological evidence. Scand. J. Work Environ. Health 2014, 40, 5–18. [Google Scholar] [CrossRef] [PubMed]
- Virtanen, M.; Ferrie, J.E.; Singh-Manoux, A.; Shipley, M.J.; Stansfeld, S.A.; Marmot, M.G.; Ahola, K.; Vahtera, J.; Kivimäki, M. Long working hours and symptoms of anxiety and depression: A 5-year follow-up of the Whitehall II study. Psychol. Med. 2011, 41, 2485–2494. [Google Scholar] [CrossRef] [PubMed] [Green Version]
- Yoon, C.G.; Kang, M.Y.; Bae, K.J.; Yoon, J.H. Do working hours and type of work affect obesity in south Korean female workers? Analysis of the Korean community health survey. J. Womens Health 2016, 25, 173–180. [Google Scholar] [CrossRef] [PubMed]
- Nakashima, M.; Morikawa, Y.; Sakurai, M.; Nakamura, K.; Miura, K.; Ishizaki, M.; Kido, T.; Naruse, Y.; Suwazono, Y.; Nakagawa, H. Association between long working hours and sleep problems in white-collar workers. J. Sleep Res. 2011, 20, 110–116. [Google Scholar] [CrossRef]
- Virtanen, M.; Singh-Manoux, A.; Ferrie, J.E.; Gimeno, D.; Marmot, M.G.; Elovainio, M.; Jokela, M.; Vahtera, J.; Kivimäki, M. Long working hours and cognitive function: The Whitehall II study. Am. J. Epidemiol. 2009, 169, 596–605. [Google Scholar] [CrossRef]
- Virtanen, M.; Heikkilä, K.; Jokela, M.; Ferrie, J.E.; Batty, G.D.; Vahtera, J.; Kivimäki, M. Long working hours and coronary heart disease: A systematic review and meta-analysis. Am. J. Epidemiol. 2012, 176, 586–596. [Google Scholar] [CrossRef] [Green Version]
- Kivimäki, M.; Jokela, M.; Nyberg, S.T.; Singh-Manoux, A.; Fransson, E.I.; Alfredsson, L.; Bjorner, J.B.; Borritz, M.; Burr, H.; Casini, A.; et al. Long working hours and risk of coronary heart disease and stroke: A systematic review and meta-analysis of published and unpublished data for 603,838 individuals. Lancet 2015, 386, 1739–1746. [Google Scholar] [CrossRef]
- Kobayashi, T.; Suzuki, E.; Takao, S.; Doi, H. Long working hours and metabolic syndrome among Japanese men: A cross-sectional study. BMC Public Health 2012, 12, 395. [Google Scholar] [CrossRef] [Green Version]
- Park, S.; Lee, J.-H.; Lee, W. The effects of workplace rest breaks on health problems related to long working hours and shift work among male apartment janitors in Korea. Saf. Health Work 2019, 10, 512–517. [Google Scholar] [CrossRef]
- Heistaro, S.; Jousilahti, P.; Lahelma, E.; Vartiainen, E.; Puska, P. Self rated health and mortality: A long term prospective study in eastern Finland. J. Epidemiol. Community Health 2001, 55, 227–232. [Google Scholar] [CrossRef] [PubMed] [Green Version]
- Nery Guimarães, J.M.; Chor, D.; Werneck, G.L.; Carvalho, M.S.; Coeli, C.M.; Lopes, C.S.; Faerstein, E. Association between self-rated health and mortality: 10 years follow-up to the Pró-Saúdecohort study. BMC Public Health 2012, 12, 676. [Google Scholar] [CrossRef] [PubMed] [Green Version]
- Falletta, L.; Fischbein, R.; Abbruzzese, S. Work re-entry after childbirth: Predictors of self-rated health in month one among a sample of university faculty and staff. Saf. Health Work 2019, 11, 19–25. [Google Scholar] [CrossRef] [PubMed]
- Wu, S.; Wang, R.; Zhao, Y.; Ma, X.; Wu, M.; Yan, X.; He, J. The relationship between self-rated health and objective health status: A population-based study. BMC Public Health 2013, 13, 320. [Google Scholar] [CrossRef] [PubMed] [Green Version]
- Ryu, J.; Yoon, Y.; Kim, H.; Kang, C.W.; Jung-Choi, K. The change of self-rated health according to working hours for two years by gender. Int. J. Environ. Res. Public Health 2018, 15, 1984. [Google Scholar] [CrossRef] [PubMed] [Green Version]
- Song, J.T.; Lee, G.; Kwon, J.; Park, J.W.; Choi, H.; Lim, S. The association between long working hours and self-rated health. Ann. Occup. Environ. Med. 2014, 26, 2. [Google Scholar] [CrossRef] [Green Version]
- Park, S.; Oh, S.K.; Seok, H.; Kim, S.K.; Choi, J.R.; Oh, S.S.; Koh, S.B. Long working hours and poor self-rated health in the young working population in Korea. J. Occup. Environ. Med. 2019, 61, e291–e296. [Google Scholar] [CrossRef]
- Cho, S.S.; Ki, M.; Kim, K.H.; Ju, Y.S.; Paek, D.; Lee, W. Working hours and self-rated health over 7 years: Gender differences in a Korean longitudinal study. BMC Public Health 2015, 15, 1287. [Google Scholar] [CrossRef] [Green Version]
- Kivimäki, M.; Virtanen, M.; Kawachi, I.; Nyberg, S.T.; Alfredsson, L.; Batty, G.D.; Bjorner, J.B.; Borritz, M.; Brunner, E.J.; Burr, H.; et al. Long working hours, socioeconomic status, and the risk of incident type 2 diabetes: A meta-analysis of published and unpublished data from 222,120 individuals. Lancet Diabetes Endocrinol. 2015, 3, 27–34. [Google Scholar] [CrossRef]
- Kweon, S.; Kim, Y.; Jang, M.J.; Kim, Y.; Kim, K.; Choi, S.; Chun, C.; Khang, Y.H.; Oh, K. Data resource profile: The Korea national health and nutrition examination survey (KNHANES). Int. J. Epidemiol. 2014, 43, 69–77. [Google Scholar] [CrossRef] [Green Version]
- Khang, Y.-H.; Kim, H.R. Self-rated health and mortality: Gender-and age-specific contributions of explanatory factors in South Korea. Int. J. Public Health 2010, 55, 279–289. [Google Scholar] [CrossRef] [PubMed]
- Kim, M.H.; Kim, C.Y.; Park, J.K.; Kawachi, I. Is precarious employment damaging to self-rated health? Results of propensity score matching methods, using longitudinal data in South Korea. Soc. Sci. Med. 2008, 67, 1982–1994. [Google Scholar] [CrossRef] [PubMed]
- Dinh, H.; Strazdins, L.; Welsh, J. Hour-glass ceilings: Work-hour thresholds, gendered health inequities. Soc. Sci. Med. 2017, 176, 42–51. [Google Scholar] [CrossRef]
- Sekine, M.; Chandola, T.; Martikainen, P.; Marmot, M.; Kagamimori, S. Socioeconomic inequalities in physical and mental functioning of Japanese civil servants: Explanations from work and family characteristics. Soc. Sci. Med. 2006, 63, 430–445. [Google Scholar] [CrossRef]
- Menéndez, M.; Benach, J.; Muntaner, C.; Amable, M.; O’Campo, P. Is precarious employment more damaging to women’s health than men’s? Soc. Sci. Med. 2007, 64, 776–781. [Google Scholar] [CrossRef]
- Lim, H.; Kim, H.; Song, I.H. The relationship between employment status and self-rated health among wage workers in South Korea: The moderating role of household income. Health Soc. Work 2015, 40, 26–33. [Google Scholar] [CrossRef]
- Nemoto, K. Long working hours and the corporate gender divide in Japan. Gend. Work Organ. 2013, 20, 512–527. [Google Scholar] [CrossRef]
- Ryu, S.; Kim, J. Gender differences in contribution to domestic work associated with outsourcing in Korea. Consumer Interests Annu. 2019, 65, 9. [Google Scholar]
- Kim, M.H.; Kim, C.Y.; Park, J.K.; Kawachi, I. Self-rated health level comparisons by the criteria of precarious employment status: The Korean labor and income survey. Korean J. Occup. Environ. Med. 2010, 22, 240–250. [Google Scholar] [CrossRef]
- Holtermann, A.; Hansen, J.V.; Burr, H.; Søgaard, K.; Sjøgaard, G. The health paradox of occupational and leisure-time physical activity. Br. J. Sports Med. 2012, 46, 291–295. [Google Scholar] [CrossRef] [Green Version]
- Han, M.; Kim, K.S.; Park, J.; Kang, M.G.; Ryu, S.Y. Association between levels of physical activity and poor self-rated health in Korean adults: The third Korea national health and nutrition examination survey (KNHANES), 2005. Public Health 2009, 123, 665–669. [Google Scholar] [CrossRef] [PubMed]
- Takao, S.; Kawakami, N.; Ohtsu, T. Occupational class and physical activity among Japanese employees. Soc. Sci. Med. 2003, 57, 2281–2289. [Google Scholar] [CrossRef]
- Mäkinen, T.; Kestilä, L.; Borodulin, K.; Martelin, T.; Rahkonen, O.; Leino-Arjas, P.; Prättälä, R. Occupational class differences in leisure-time physical inactivity-contribution of past and current physical workload and other working conditions. Scand. J. Work Environ. Health 2010, 36, 62–70. [Google Scholar] [CrossRef] [PubMed]
- Young, M.C. Gender differences in precarious work settings. Ind. Relat. 2010, 65, 74–97. [Google Scholar]
- Kecklund, G.; Axelsson, J. Health consequences of shift work and insufficient sleep. BMJ 2016, 355, i5210. [Google Scholar] [CrossRef] [PubMed]
- Costa, G. The impact of shift and night work on health. Appl. Ergon. 1996, 27, 9–16. [Google Scholar] [CrossRef]
- Noh, D.; Wang, J.H.; Choi, H.; Lim, S.; Kim, K.; Won, C.W.; Jung-Choi, K. The effect of shift work on the level of self-rated health. Korean J. Occup. Environ. Med. 2010, 22, 200–209. [Google Scholar] [CrossRef]
- Zajacova, A.; Dowd, J.B. Reliability of self-rated health in US adults. Am. J. Epidemiol. 2011, 174, 977–983. [Google Scholar] [CrossRef] [Green Version]
Figure 1.
Schematic diagram depicting study population.

Figure 2.
Analytical framework of current study.


Table 1.
General characteristics of study participants by weekly working hours.
| Characteristics | Total | Weekly Working Hours | p-Value | |||
|---|---|---|---|---|---|---|
| (N = 25144) | <20 h | 20–39 h | 40–59 h | ≥60 h | ||
| N (%) | N (%) | |||||
| Total population | 2141 (8.5) | 5616 (22.3) | 13,515 (53.8) | 3872 (15.4) | ||
| Sex | ||||||
| Men | 13,157 (52.3) | 578 (4.4) | 2108 (16.0) | 7940 (60.3) | 2531 (19.2) | <0.001 |
| Women | 11,987 (47.7) | 1563 (13.0) | 3508 (29.3) | 5575 (46.5) | 1341 (11.2) | |
| Age | ||||||
| 20–29 | 3202 (12.7) | 459 (14.3) | 629 (19.6) | 1829 (57.1) | 285 (8.9) | <0.001 |
| 30–39 | 5673 (22.6) | 312 (5.5) | 1054 (18.6) | 3524 (62.1) | 783 (13.8) | |
| 40–49 | 6856 (27.3) | 437 (6.4) | 1479 (21.6) | 3922 (57.2) | 1018 (14.8) | |
| 50–59 | 6846 (27.2) | 585 (8.5) | 1710 (25.0) | 3257 (47.6) | 1294 (18.9) | |
| 60–64 | 2567 (10.2) | 348 (13.6) | 744 (29.0) | 983 (38.3) | 492 (19.2) | |
| Household income quartile | ||||||
| 1st quartile | 1762 (7.0) | 318 (18.0) | 558 (31.7) | 623 (35.4) | 263 (14.9) | <0.001 |
| 2nd quartile | 5889 (23.4) | 568 (9.6) | 1382 (23.5) | 2866 (48.7) | 1073 (18.2) | |
| 3rd quartile | 8201 (32.6) | 608 (7.4) | 1723 (21.0) | 4625 (56.4) | 1245 (15.2) | |
| 4th quartile | 9292 (37.0) | 647 (7.0) | 1953 (21.0) | 5401 (58.1) | 1291 (13.9) | |
| Education | ||||||
| Elementary school | 2486 (9.9) | 233 (9.4) | 724 (29.1) | 957 (38.5) | 572 (23.0) | <0.001 |
| Junior high school | 2473 (9.8) | 244 (9.9) | 629 (25.4) | 1045 (42.3) | 555 (22.4) | |
| High school | 9050 (46.0) | 899 (9.9) | 2040 (22.5) | 4572 (50.5) | 1539 (17.0) | |
| College | 11,135 (44.3) | 765 (6.9) | 2223 (20.0) | 6941 (62.3) | 1206 (10.8) | |
| Occupation | ||||||
| Simple labor | 2880 (11.5) | 426 (14.8) | 884 (30.7) | 1160 (40.3) | 410 (14.2) | <0.001 |
| Craft, plant and machine operator, and assembler | 4385 (17.4) | 121 (2.8) | 692 (15.8) | 2603 (59.4) | 969 (22.1) | |
| Skilled agricultural, forestry, and fishery | 1516 (6.0) | 148 (9.8) | 460 (30.3) | 592 (39.1) | 316 (20.8) | |
| Service and sales | 5572 (22.2) | 522 (9.4) | 1407 (25.3) | 2282 (41.0) | 1361 (24.4) | |
| Clerk | 4492 (17.9) | 270 (6.0) | 673 (15.0) | 3295 (73.4) | 254 (5.7) | |
| Manager and professional | 6299 (25.1) | 654 (10.4) | 1500 (23.8) | 3583 (56.9) | 562 (8.9) | |
| Type of work | ||||||
| Paid employee | 17,272 (68.7) | 1430 (8.3) | 3585 (20.8) | 10,447 (60.5) | 1810 (10.5) | <0.001 |
| Employer/self-employed | 6451 (25.7) | 612 (9.5) | 1582 (24.5) | 2562 (39.7) | 1695 (26.3) | |
| Unpaid family worker | 1421 (5.7) | 99 (7.0) | 449 (31.6) | 506 (35.6) | 367 (25.8) | |
| Work schedule | ||||||
| Fixed | 20,903 (83.1) | 1,560 (7.5) | 4446 (21.3) | 11,877 (56.8) | 3020 (14.4) | <0.001 |
| Non-fixed | 4241 (16.9) | 581 (13.7) | 1170 (27.6) | 1638 (38.6) | 852 (20.1) | |
| Obesity | ||||||
| Underweight (<18.5) | 944 (3.8) | 122 (12.9) | 224 (23.7) | 494 (52.3) | 104 (11.0) | <0.001 |
| Normal (<25) | 15,616 (62.1) | 1419 (9.1) | 3600 (23.1) | 8356 (53.5) | 2241 (14.4) | |
| Obese (≥25) | 8584 (34.1) | 600 (7.0) | 1792 (20.9) | 4665 (54.3) | 1527 (17.8) | |
| Smoking | ||||||
| Never | 13,935 (55.4) | 1598 (11.5) | 3663 (26.3) | 6957 (49.9) | 1717 (12.3) | <0.001 |
| Past | 4719 (18.8) | 252 (5.3) | 843 (17.9) | 2789 (59.1) | 835 (17.7) | |
| Current | 6490 (25.8) | 291 (4.5) | 1110 (17.1) | 3769 (58.1) | 1320 (20.3) | |
| Drinking | ||||||
| None | 4402 (17.5) | 533 (12.1) | 1228 (27.9) | 1928 (43.8) | 713 (16.2) | <0.001 |
| Moderate | 15,652 (62.2) | 1323 (8.5) | 3534 (22.6) | 8640 (55.2) | 2155 (13.8) | |
| Severe | 5090 (20.2) | 285 (5.6) | 854 (16.8) | 2947 (57.9) | 1004 (19.7) | |
| Hypertension | ||||||
| Not present | 22,003 (87.5) | 1843 (8.4) | 4908 (22.3) | 12,002 (54.5) | 3250 (14.8) | <0.001 |
| Present | 3141 (12.5) | 298 (9.5) | 708 (22.5) | 1,513 (48.2) | 622 (19.8) | |
| Diabetes | ||||||
| Not present | 23,964 (95.3) | 2024 (8.4) | 5321 (22.2) | 12,970 (54.1) | 3649 (15.2) | <0.001 |
| Present | 1180 (4.7) | 117 (9.9) | 295 (25.0) | 545 (46.2) | 223 (18.9) | |
| Depression | ||||||
| Not present | 24,800 (98.6) | 2086 (8.4) | 5510 (22.2) | 13,378 (53.9) | 3826 (15.4) | <0.001 |
| Present | 344 (1.4) | 55 (16.0) | 106 (30.8) | 137 (39.8) | 46 (13.4) | |
| Self-rated health | ||||||
| Good | 21,767 (86.6) | 1791 (8.2) | 4836 (22.2) | 11,893 (54.6) | 3247 (14.9) | <0.001 |
| Poor | 3377 (13.4) | 350 (10.4) | 780 (23.1) | 1622 (48.0) | 625 (18.5) | |
Table 2.
Risk of poor self-rated health according to weekly working hours from multivariable logistic regression.
Table 2.
Risk of poor self-rated health according to weekly working hours from multivariable logistic regression.
| Characteristics | Weekly Working Hours | |||
|---|---|---|---|---|
| <20 h | 20–39 h | 40–59 h | ≥60 h | |
| Odds Ratio (95% Confidence Interval) | ||||
| Total population | 1.299 (1.140–1.481) | 1.091 (0.992–1.200) | Reference | 1.289 (1.163–1.430) |
| Sex | ||||
| Men | 1.384 (1.080–1.772) | 1.123 (0.963–1.309) | 1.224 (1.064–1.407) | |
| Women | 1.098 (0.938–1.286) | 0.955 (0.844–1.081) | 1.401 (1.197–1.639) | |
| Household income quartile | ||||
| 1st quartile | 1.318 (0.939–1.850) | 1.276 (0.955–1.705) | 1.301 (0.907–1.866) | |
| 2nd quartile | 1.111 (0.861–1.435) | 1.113 (0.924–1.339) | 1.214 (0.997–1.478) | |
| 3rd quartile | 1.274 (0.994–1.632) | 0.971 (0.814–1.157) | 1.134 (0.940–1.369) | |
| 4th quartile | 1.221 (0.947–1.573) | 1.000 (0.841–1.188) | 1.462 (1.221–1.751) | |
| Education | ||||
| Elementary school | 1.579 (1.143–2.181) | 1.156 (0.918–1.457) | 1.072 (0.835–1.376) | |
| Junior high school | 1.433 (1.024–2.007) | 1.001 (0.774–1.296) | 0.990 (0.757–1.295) | |
| High school | 1.091 (0.872–1.366) | 1.110 (0.943–1.306) | 1.273 (1.072–1.512) | |
| College | 1.262 (0.992–1.605) | 0.964 (0.815–1.141) | 1.321 (1.092–1.598) | |
| Occupation | ||||
| Simple labor | 1.596 (1.199–2.124) | 1.186 (0.932–1.509) | 1.078 (0.792–1.469) | |
| Craft, plant and machine operator, and assembler | 1.222 (0.734–2.035) | 1.049 (0.812–1.356) | 1.187 (0.954–1.478) | |
| Skilled agricultural, forestry, and fishery | 1.073 (0.682–1.689) | 1.101 (0.808–1.502) | 1.216 (0.857–1.725) | |
| Service and sales | 1.180 (0.893–1.559) | 1.007 (0.826–1.229) | 1.219 (1.007–1.477) | |
| Clerk | 1.376 (0.936–2.022) | 1.150 (0.878–1.506) | 1.125 (0.754–1.680) | |
| Manager and professional | 1.248 (0.954–1.632) | 0.977 (0.793–1.204) | 1.371 (1.048–1.793) | |
| Type of work * | ||||
| Paid employee | 1.436 (1.226–1.682) | 1.119 (0.995–1.259) | 1.232 (1.064–1.427) | |
| Employer/self-employed | 1.047 (0.806–1.359) | 0.991 (0.820–1.197) | 1.251 (1.048–1.493) | |
| Work schedule | ||||
| Fixed | 1.405 (1.212–1.629) | 1.080 (0.972–1.201) | 1.290 (1.149–1.449) | |
| Non-fixed | 0.894 (0.661–1.208) | 1.044 (0.834–1.308) | 1.188 (0.939–1.502) | |
Adjusted for age, obesity, smoking, drinking, hypertension, diabetes, and depression. Variables for stratification are not adjusted. Bold implies statistically significant. * Unpaid family workers were included in all analyses, but their odds ratios (ORs) were excluded from this table due to their small sample size.
© 2020 by the authors. Licensee MDPI, Basel, Switzerland. This article is an open access article distributed under the terms and conditions of the Creative Commons Attribution (CC BY) license (http://creativecommons.org/licenses/by/4.0/).
Share and Cite
MDPI and ACS Style
Jeon, J.; Lee, W.; Choi, W.-J.; Ham, S.; Kang, S.-K. Association between Working Hours and Self-Rated Health. Int. J. Environ. Res. Public Health 2020, 17, 2736. https://0-doi-org.brum.beds.ac.uk/10.3390/ijerph17082736
AMA Style
Jeon J, Lee W, Choi W-J, Ham S, Kang S-K. Association between Working Hours and Self-Rated Health. International Journal of Environmental Research and Public Health. 2020; 17(8):2736. https://0-doi-org.brum.beds.ac.uk/10.3390/ijerph17082736
Chicago/Turabian StyleJeon, Jongha, Wanhyung Lee, Won-Jun Choi, Seunghon Ham, and Seong-Kyu Kang. 2020. "Association between Working Hours and Self-Rated Health" International Journal of Environmental Research and Public Health 17, no. 8: 2736. https://0-doi-org.brum.beds.ac.uk/10.3390/ijerph17082736
Note that from the first issue of 2016, this journal uses article numbers instead of page numbers. See further details here.