Review

Red and Processed Meat Consumption and Risk of Depression: A Systematic Review and Meta-Analysis

1
Digestive Endoscopy Unit, Veneto Institute of Oncology IOV-IRCCS, Via Gattamelata 64, 35128 Padua, Italy
2
Department of Pharmaceutical Science, University of Perugia, Via del Giochetto, 06123 Perugia, Italy
3
Department of Neuroscience, Rehabilitation, Ophthalmology, Genetics, Maternal and Child Health (DINOGMI), Section of Psychiatry, University of Genoa, 16132 Genoa, Italy
4
IRCCS Ospedale Policlinico San Martino, 16132 Genoa, Italy
5
Department of Psychiatry, Tufts University, Medford, MA 02111, USA
6
School of Medicine, Vita-Salute San Raffaele University, 20132 Milan, Italy
7
CAPHRI Care and Public Health Research Institute, Maastricht University, 6211 Maastricht, The Netherlands
*
Author to whom correspondence should be addressed.
Int. J. Environ. Res. Public Health 2020, 17(18), 6686; https://0-doi-org.brum.beds.ac.uk/10.3390/ijerph17186686
Submission received: 18 August 2020 / Revised: 8 September 2020 / Accepted: 10 September 2020 / Published: 14 September 2020
(This article belongs to the Special Issue Lifestyle and Risk of Depression)

Abstract

:
Depression is one of the leading causes of disability worldwide, with more than 264 million people affected. On average, depression first appears during the late teens to mid-20s as result of a complex interaction of social, psychological and biological factors. The aim of this systematic review with meta-analysis is to assess the association between red and processed meat intake and depression (both incident and prevalent). This systematic review was conducted according to the methods recommended by the Cochrane Collaboration and the Preferred Reporting Items for Systematic Reviews and Meta-Analyses guidelines. Relevant papers published through March 2020 were identified by searching the electronic databases MEDLINE, Embase and Scopus. All analyses were conducted using ProMeta3 software. A critical appraisal was conducted. Finally, 17 studies met the inclusion criteria. The overall effect size (ES) of depression for red and processed meat intake was 1.08 [(95% CI = 1.04; 1.12), p-value < 0.001], based on 241,738 participants. The results from our meta-analysis showed a significant association between red and processed meat intake and risk of depression. The presented synthesis will be useful for health professionals and policy makers to better consider the effect of diet on mental health status.

1. Introduction

1.1. Background

Depression is one of the leading causes of disability worldwide, with more than 264 million people affected [1]. One in six people (16.6%) experiences depression at some time in their life, more likely for women than men [2]. On average, depression first appears during the late teens to mid-20s as a result of a complex interaction of social, psychological and biological factors [3]. Depressive symptoms are often overlooked and untreated, and they are accompanied by poorer functioning compared to medical conditions [3,4]. Moreover, depression can increase the perception of poor health, the utilization of health care services and costs, as well as the burden on patients’ families and caregivers [5]. At its worst, depression can lead to suicide, the second leading cause of death in 15–29-year-olds [6].
A growing number of studies are focusing on the important role played by lifestyles and in particular diet, in both preventing and treating depression. The potential biological mechanisms underlying the association between diet and depression are still not completely understood. However, evidence in literature has pointed towards the involvement of food components in the monoamine synthesis, inflammation processes, hypothalamic–pituitary–adrenal axis (HPA) regulation, and neurogenesis [7]. Promising evidence currently focuses on the role of gut permeability and microbiota [8], and the interconnection between gut and brain [9]. Evidence has shown that dietary patterns are characterized by high intakes of fruit, vegetables, whole grains, fish and low intakes of red and processed meat could contribute to the prevention of depression, potentially due to their high content of antioxidants and folates [10], and probably due to the high content of long-chain omega-3 polyunsaturated fatty acids [11]. On the contrary, a higher consumption of refined and processed foods, as well as high-fat and high-sugar products, is associated with a higher risk of depression [12]. In particular, red and processed meats are rich in saturated fats, and a high consumption, which is typical in the so-called Western-diet, might be associated with pro-inflammatory states [13]. Evidence has shown that high levels of systemic inflammation and other factors, as for instance, the high levels of heme iron [14,15,16], the presence of exogenous N-nitroso compounds including nitrates and nitrites (especially for processed meat) [17,18], and the formation of polycyclic aromatic hydrocarbons and heterocyclic amines during cooking processes [19]—they are considered to be some of the main factors that increase the risk of cancer in high consumers of red and processed meat. According to the third World Cancer Research Fund and the American Institute for Cancer Research (WCRF/AICR) expert report published in 2018 [20], there is strong evidence that a high consumption of red and processed meat increases the risk of colorectal cancer, which is the third most commonly diagnosed cancer in males and the second in females (GLOBOCAN) worldwide [21]. In this context, it should also be considered that depression affects more than 10% of cancer patients, and presents a multifactorial pathogenesis involving psychosocial, biological and iatrogenic causes [22]. With regard to psychological and social causes, the negative effects of cancer diagnosis, prognosis and treatment on patients’ independence, abilities, family and economic status, can turn a subclinical sadness into a major depression [23]. From a biological point of view, many mechanisms seem to be implicated in the development of depression. High levels of systemic inflammation could increase the risk of several mental diseases, including depression [24]. Moreover, a high intake of saturated fatty acids seems to be associated with a lower level of brain derived neurotrophic factor (BDNF), neuroplasticity and cognitive ability [25], that are involved in the pathogenesis of depression [5,6]. However, results are not concordant, and some observational studies have highlighted a protective effect of low-moderate consumption of red meat [26,27], probably due to the high bio-availability of vitamin B12, folates and zinc [28,29]. Zinc stimulates the BDNF expression, promoting differentiation and plasticity; its deficiency, on the contrary, decreases neurogenesis and increases the risk of depressive symptoms development [30]. Vitamin B12 and folates are two of the most important coenzymes involved in the one-carbon metabolism, a metabolic pathway used to produce S-adenosylmethionine (SAM) [31]. SAM is a universal donor of methyl groups, largely implicated in several neurocognitive and neurological functions. A low availability of SAM is associated with higher depressive tendencies [32].
Considering that (i) studies’ results are not concordant; (ii) biological mechanisms behind red and processed meat intake and risk of depression are not completely known, and (iii) the important role of diet in preventing several chronic diseases, including mental diseases (such as depression), we conducted a systematic review and meta-analysis exploring the association between red and processed meat intake and the risk of depression.

1.2. Aim of the Study

The aims of the current systematic review with meta-analysis are: first to collect and retrieve previous studies focusing on red and processed meat intake and depression; and second, to estimate the strength of association between red and processed meat consumption and depression (both incident and prevalent).

2. Materials and Methods

The following systematic review and meta-analysis was conducted according to the methods recommended by the Cochrane Collaboration [33] and to the Meta-analysis Of Observational Studies in Epidemiology (MOOSE) guidelines [34], and the process and results were documented according to the Preferred Reporting Items for Systematic Reviews and Meta-Analyses [35] guidelines [36].

2.1. Information Sources and Search Strategy

In order to perform the structured computer literature search, the following databases were searched: PubMed/Medline, Excerpta Medica dataBASE (EMBASE) and Scopus. The literature search was conducted using a pre-determined combination of keywords, according to the type of database consulted. When possible, medical subject headings (MeSH or similar) or free text words were used. The keywords were selected considering two features: depression, and red and/or processed meat consumption. Then, the selected keywords were combined using Boolean operators AND/OR and NOT. The strategy was first developed in PubMed/Medline and then adapted for use in the other databases (Supplementary Table S1). The literature search was carried out in March 2020. In addition, further studies were retrieved from reference listing of relevant articles and consultation with experts in the field.

2.2. Inclusion and Exclusion Criteria

In order to be included in the systematic review, the collected references had to report the results of the primary research evaluating the association between depression (remission or relapse), either as a continuous or binary variable, in adult men and women, and the intake of red and/or processed meat. Both population-based and hospital-based studies were included. Among hospital-based studies, inpatients, day-hospital, and outpatient subjects were included, while emergency care records were excluded, as they were considered non-representative. Other restriction criteria were: had to be written in English and provide full text. No time filter was applied; however, non-human studies (animal models), non-original papers (e.g., reviews, book chapter, letters to the editor, brief note, commentaries, conference paper) were excluded. Table 1 shows a detailed description of inclusion/exclusion criteria according to the Population, Exposure, Outcomes and Study design (PEOS) [37], adjusted for observational studies extended with time and language filters, as recommended by the Cochrane Collaboration [38].

2.3. Data Extraction

A two-step process was adopted to identify relevant articles. Two authors (DN and CF) independently screened title and abstract of the retrieved publications, to collect potentially relevant articles. The full text was obtained only for selected papers, based on compliance with inclusion/exclusion criteria. Data were extracted from included studies, by two authors in blind (DN and CF), using a pre-defined spreadsheet. The spreadsheet was elaborated in Microsoft Excel® for Windows (Redmond, WA, USA, 2007) and was pre-piloted, on 10 randomly selected papers, to ensure methodological concordance among the Authors. As done before [39,40,41,42], the spreadsheet was used to systematically record qualitative and quantitative data extracted from the included studies. Quantitative data recorded included: age, sample size, depressed subjects, loss of follow-up, red and processed meat intake. For each included study, the name of the first author, year of publication, and the original country where the study was conducted were collected. In case of incomplete available data, the corresponding authors were contacted by e-mail. Any disagreement in both article screening and data extraction was solved through discussion between the two researchers. If the disagreement persisted, a third researcher was consulted (VG).

2.4. Quality Evaluation

The quality evaluation of the included publications was independently assessed by two Authors using the New–Ottawa Scale [43]. If disagreement was found among researchers, it was solved through discussion. The New–Ottawa Scale refers to three potential risks of bias: selection of participants, comparability, and outcomes/exposure. The total score can range from 0 (the poorest quality) to 10 (the highest quality). The quality assessment score was calculated for each study and tabulated with the other characteristics extracted from the studies.

2.5. Meta-Analysis

Individual study data were pooled using ProMeta3® (Internovi, Italy) software. Fixed and random effects were used in this study according to the heterogeneity. Fixed effect presumes that there is one equal true exposure effect for all the studies, whereas the random-effect model presumes that the true exposure effect in any of the analyzed studies may be different in each study [44]. Based on this assumption, it is commonly accepted to use a random effect model if heterogeneity is high. The heterogeneity was estimated through Chi2 and I2 tests. Values of I2 above 75% are classified as high heterogeneity, values between 50–75% are classified as moderate heterogeneity, values between 25–50% are classified as low heterogeneity, while below 25% as no heterogeneity. The pooled effect size (ES) was calculated as odds ratio (OR) and its relative 95% confidence interval (95% CI). We assessed publication bias with the visual inspection of a funnel plot [33] and the Begg [45] and Egger tests [46]. Statistical significance was set at p < 0.10 [46]. A “trim and fill” method was used if publication bias was detected [47]. The “trim and fill” method is a statistical approach used to adjust for publication bias [48]. It is aimed to estimate potential missing studies, causing the asymmetry of the funnel plot [49]. This method assumes that the studies with the most extreme ES have to be suppressed, adjusting the overall effect estimate [50].

2.6. Subgroup and Sensitivity Analysis

In order to exclude the potential overlapping effect due to the inclusion of datasets reporting results for different levels of outcome (minor and major depression; depression and subsyndromal depression) using the same pool of subjects, a sensitivity analysis was performed, excluding these data [51,52]. If there were three or more studies with relevant data, subgroup analyses were planned. In particular, four additional sensitivity analyses were conducted, considering the following: (i) study design, (ii) including only studies using a validated tool to assess meat intake, (iii) including only studies using a validated tool to diagnose depression, (iv) if QS was ≥8. Moreover, a subgroup analysis by gender was conducted in order to estimate potential different effects among the two groups.

3. Results

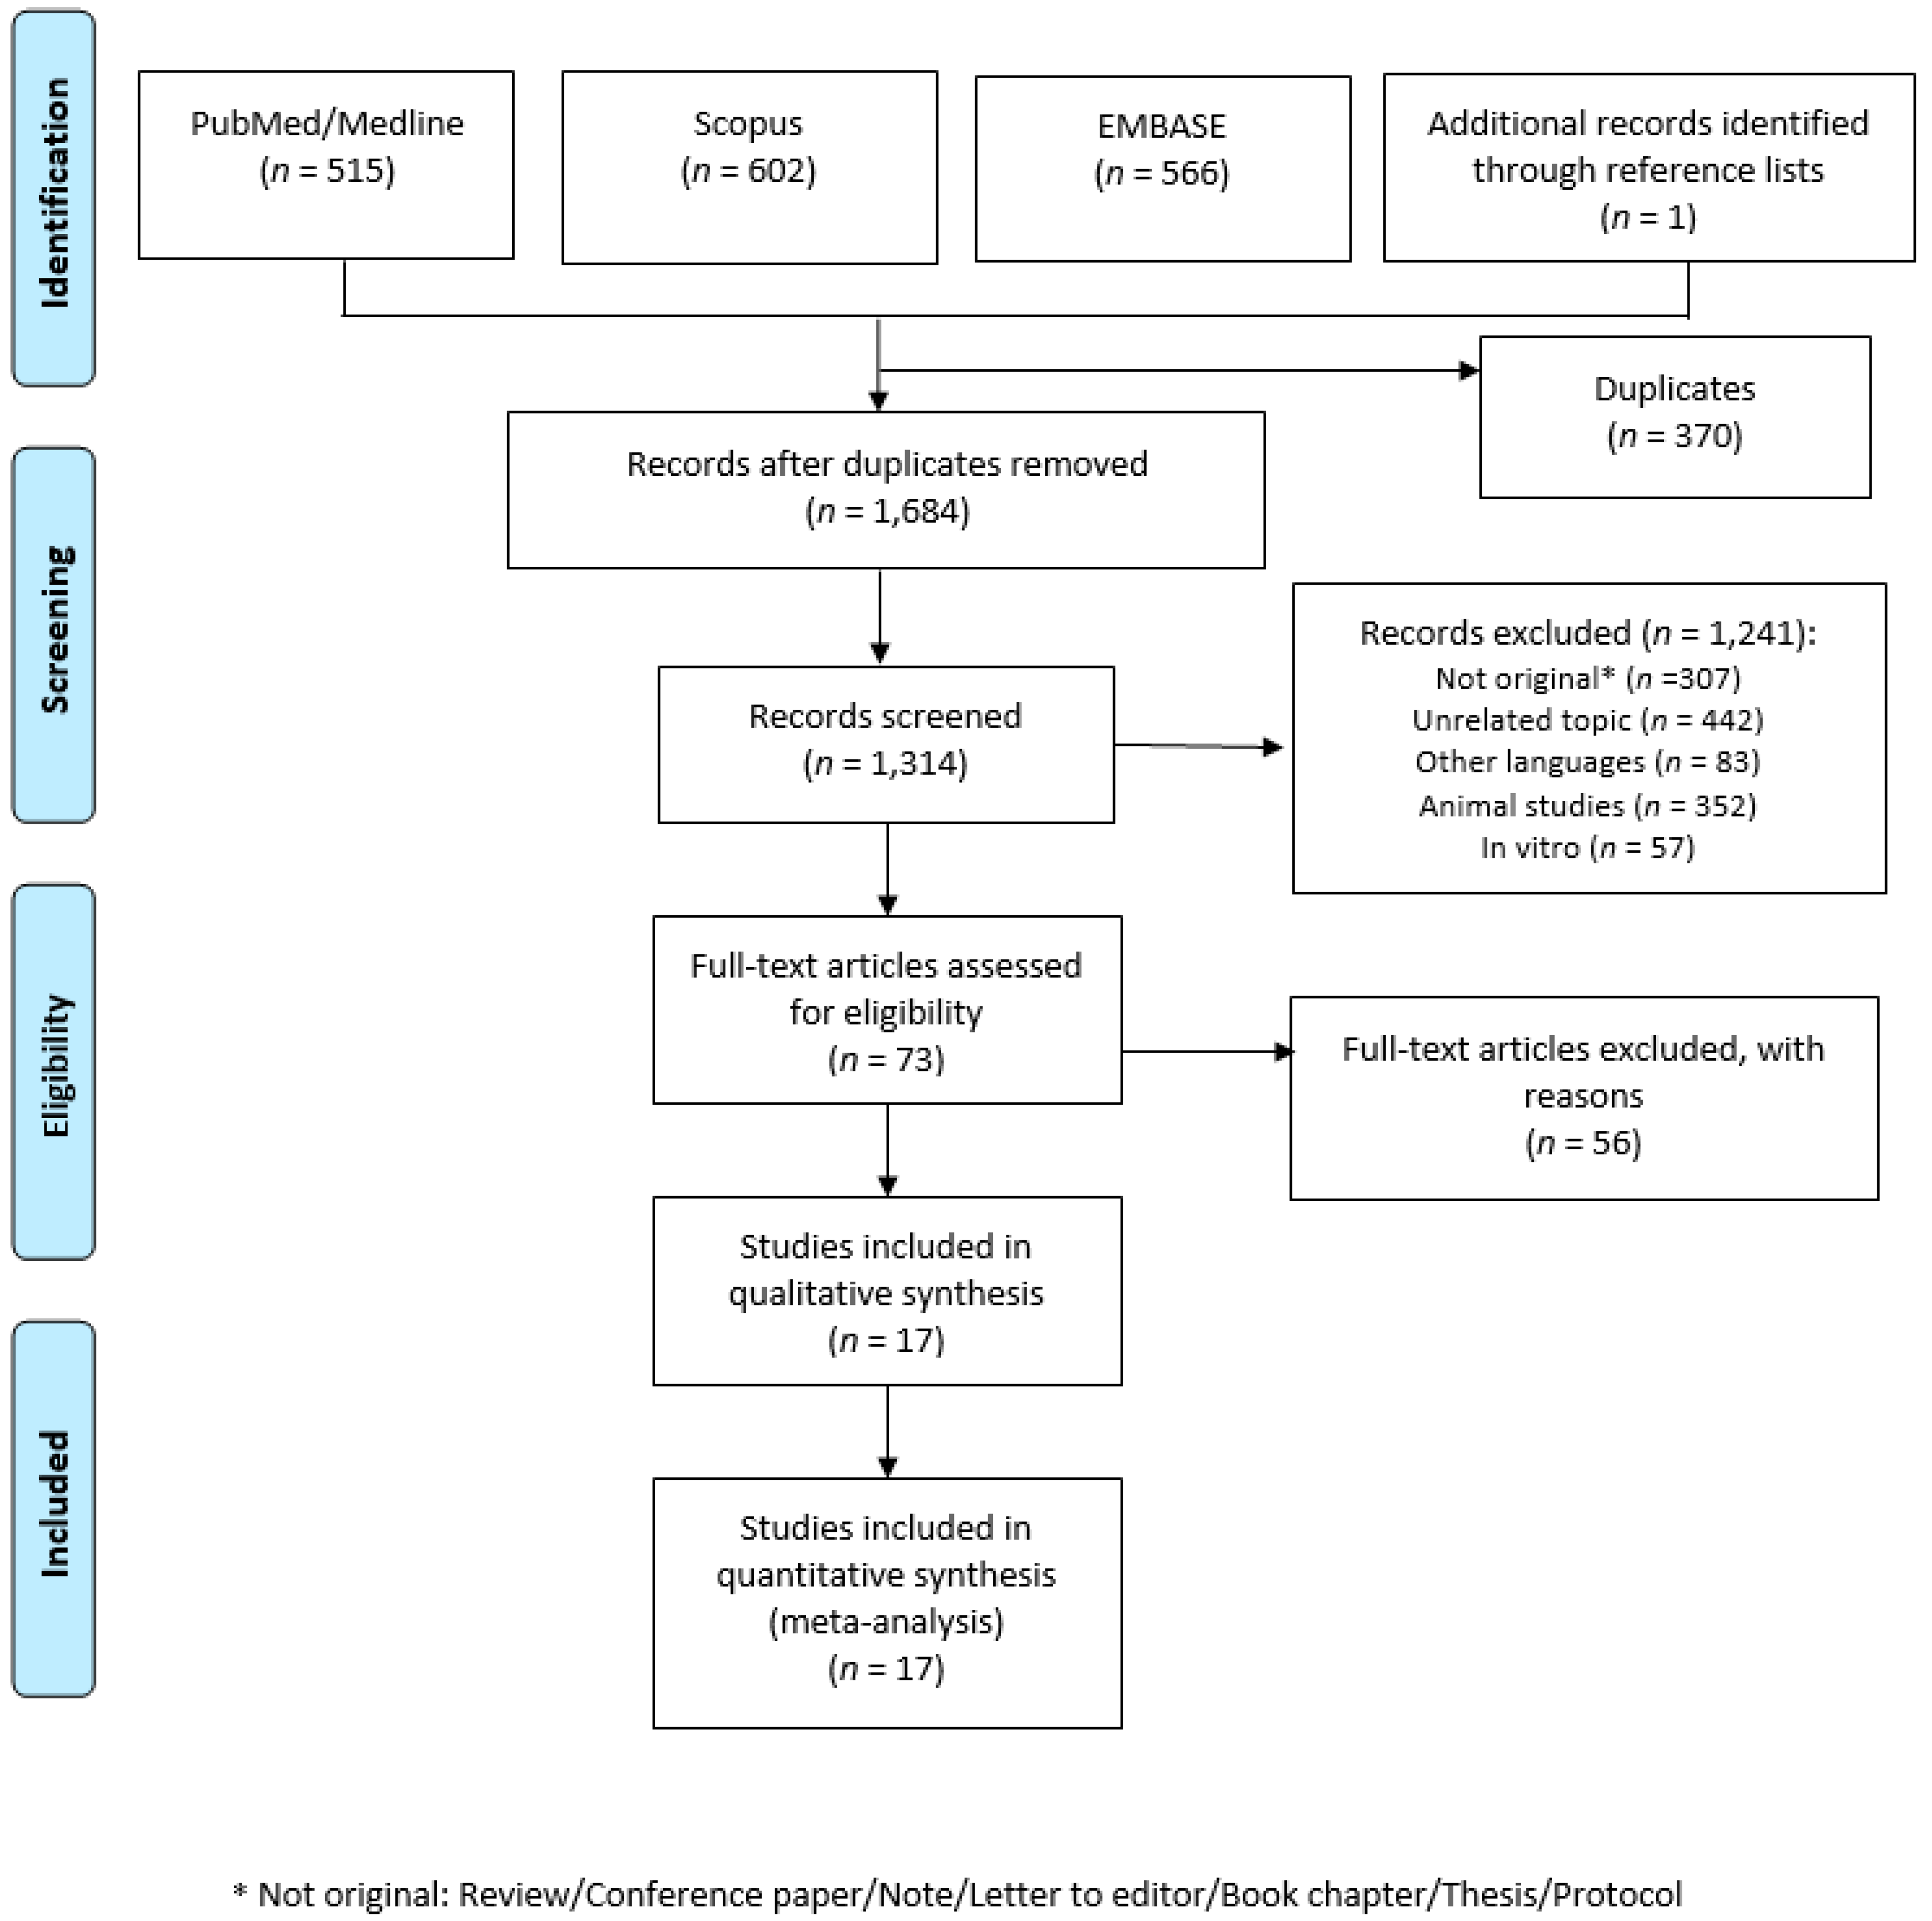
3.1. Literature Search

A total of 1684 articles were retrieved. After a preliminary screening, 370 articles were excluded because they were duplicates, 307 were not original papers (review, letter to editor, editorial, protocols, etc.), and 442 covered different topics. After title and abstract screening, a total of 73 articles were consulted in full, while at the end of the screening procedure, 17 articles were included in the systematic review [26,27,53,54,55,56,57,58,59,60,61,62,63,64,65,66,67]. Figure 1 shows the selection process. One longitudinal study reported separate data for baseline and follow-up, and for this reason it was considered separately [65]. Moreover, two studies reported separate data for men and women, and for this reason they were considered separately [26,55]. Furthermore, Barros et al. reported separate data for minor and major depression [54], and Goh reported separate data for depression and subsyndromal depression, and for this reason they were considered separately [58]. Lastly, Won et al., reported data stratified by age groups (19–29; 30–49; 50–64 years), and for this reason, it was considered separately [67], resulting in 24 datasets being included in the meta-analysis.

3.2. Characteristics of the Included Studies

Characteristics of the included studies are reported in Table 2. Seven studies were performed in Asia [27,53,58,62,63,64,67], six studies were conducted in Europe [26,55,56,57,59,66], two studies were conducted in the Americas [54,61], and two studies were conducted in Australia [60,65]. The first cross-sectional [26] and longitudinal [66] studies assessing red and processed meat intake and risk of depression were published in 2009. Most of the studies were cross-sectional studies (n = 9), followed by longitudinal (n = 5, of which one reported also cross-sectional analysis), and case-control (n = 3). Ten studies used a Food Frequency Questionnaire (FFQ) to assess red and processed meat intake, whilst one study used the 24-h dietary recall interviews performed by trained interviewers [61]. However, seven studies did not use a validated tool to assess the meat intake, or did not specify whether the adopted questionnaire had been previously validated or not. Regarding depression, the tools used to make the diagnosis were heterogeneous (as, for instance, Patient Health Questionnaire-9 (PHQ-9), Beck Depression Inventory [58], Center for Epidemiologic Studies Depression Scale (CESD)). Most of the time, PHQ-9 (n = 4) and BDI (n = 3) were used; however, almost all the studies used a validated tool (n = 15/17). Lastly, the results were expressed using different measures, as, for instance, odds ratio (OR), hazard ratio (HR), β coefficient (β), and Spearman’s rho (r). Regarding the quality assessment, the score ranged between 5 and 10.

3.3. Characteristics of the Studied Populations

The smallest sample size included in a study was 46 participants [53], whereas the largest study size was 49,025 participants [54]. The age of the subjects was reported as mean and SD in the majority of the study, while in five studies, the age range was recorded [53,58,60,61,67], and in one study, the subjects’ ages were not available [66]. The age of the participants ranged from 18–93 years. Subjects were randomly selected from the population (or a subgroup, as students in 3 [26,55,66]) in all studies, except for two studies, where they were psychiatric patients treated in a psychiatric clinic [62,64]. All studies included both men and women, but in four studies, only women were included [53,60,65,67]. However, in two studies, Authors reported the results for men and women separately. Red and processed meat intake was reported using different units in the original studies (i.e., g/day, g/kg per day or frequency per week or day), limiting the comparability of the intake.

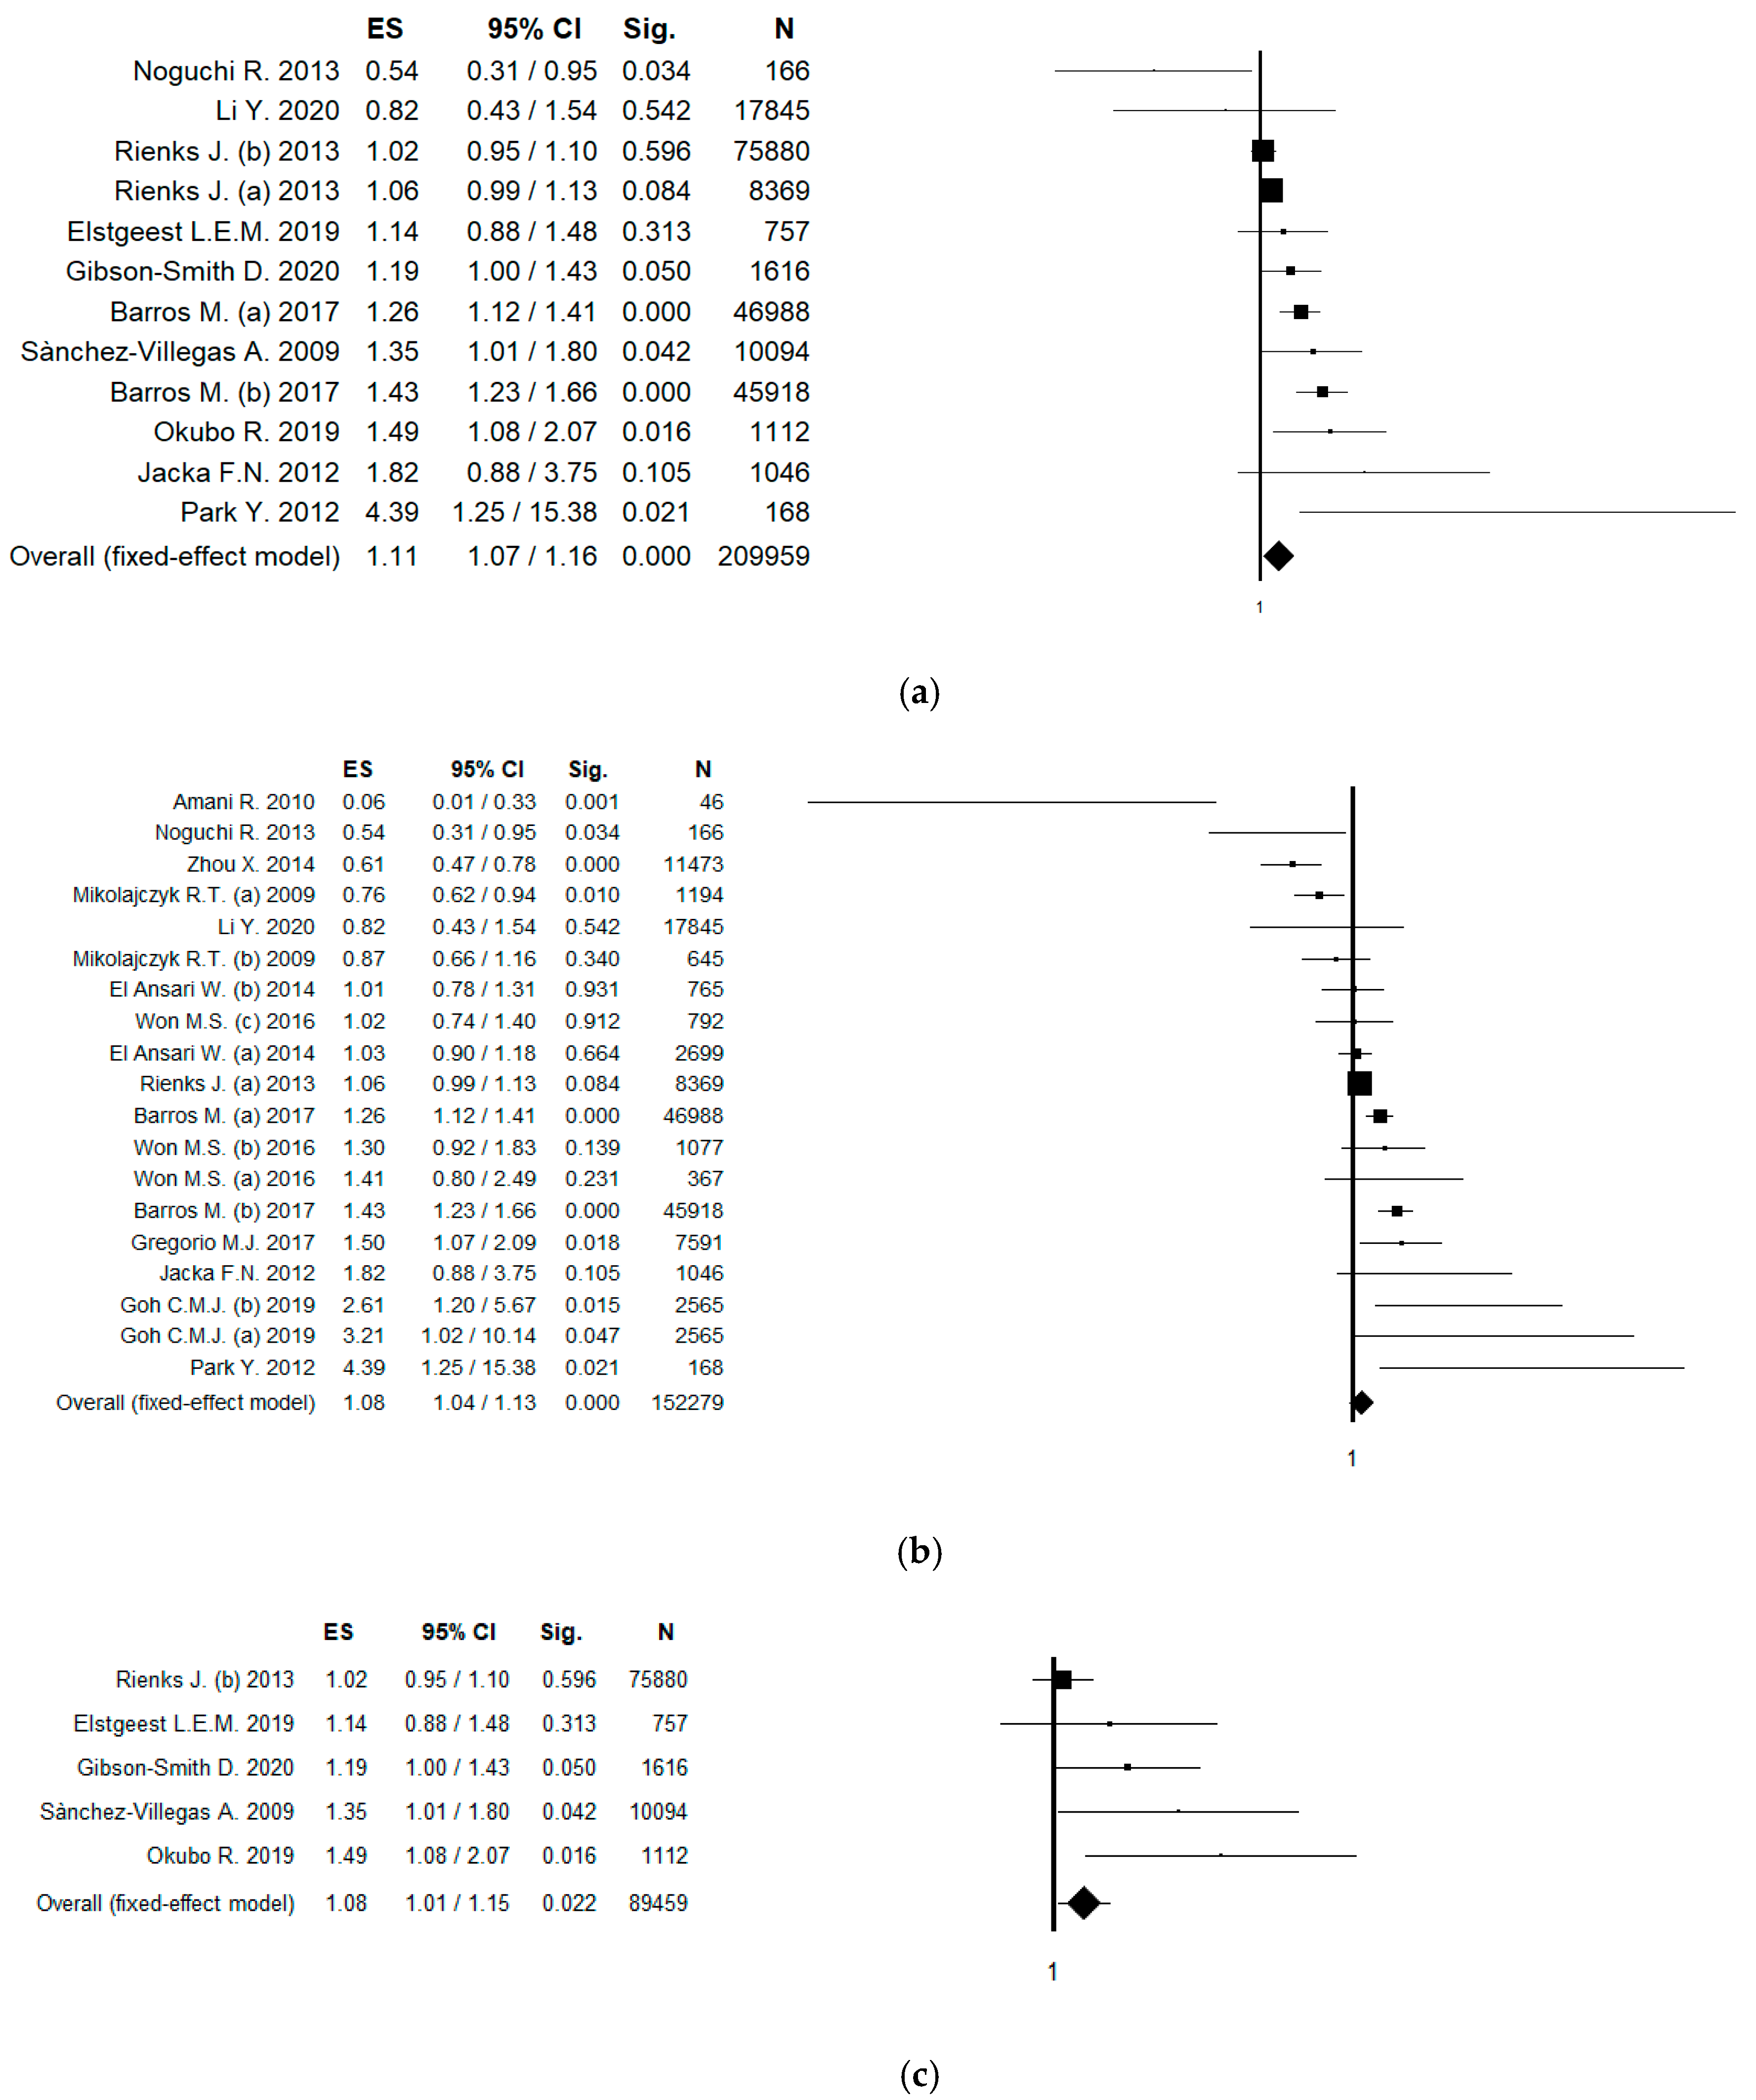
3.4. Results of Meta-Analysis

Considering all the 24 datasets, and using the fixed effect model, the pooled ES was 1.08 [(95% CI = 1.04; 1.12), p-value < 0.001] (Figure 2a); while using the random effect model, the pooled ES was 1.10 [(95% CI = 1.00; 1.22), p-value = 0.055] based on 241,738 participants with high statistical heterogeneity (Chi2 = 102.59, df = 23, I2 = 77.58, p-value < 0.001). No potential publication bias was found by the visual assessment of the funnel plot (Figure 2b), and this was confirmed by the Egger’s linear regression test (intercept 0.32, t = 0.48, p-value = 0.639).

3.5. Sensitivity Analysis

In order to estimate the effect of meat intake without potential overlapping effects, two datasets (assessing minor depression [54] and subsyndromal depression [58]) were excluded. Using the fixed effect model the pooled ES was 1.06 [(95% CI = 1.02; 1.10), p-value = 0.002], while using the random effect model, the pooled ES was 1.08 [(95% CI = 0.97; 1.29), p-value = 0.166], based on 192,185 participants with high statistical heterogeneity (Chi2 = 89.90, df = 21, I2 = 76.64, p-value < 0.001). No potential publication bias was found by the visual assessment of the funnel plot and confirmed by the Egger’s linear regression test (intercept 0.20, t = 0.29, p-value = 0.777).
In order to increase the robustness of results, a sensitivity analysis only including studies that used validated tools to assess meat intake was conducted. In this analysis, 10 studies (12 datasets) were included, and the pooled ES was 1.11 [(95% CI = 1.07; 1.16), p-value < 0.001] in the fixed effect model (Figure 3a); while using the random effect model, the pooled ES was 1.18 [(95% CI = 1.06; 1.32), p-value = 0.002], based on 209,959 participants with moderate statistical heterogeneity (Chi2 = 41.70, df = 11, I2 = 73.62, p-value < 0.001). No potential publication bias was found by the visual assessment of the funnel plot and confirmed by Egger’s linear regression test (Intercept 1.17, t = 1.39, p-value = 0.194). A sensitivity analysis only including studies that used validated tool to diagnose depression was performed. In this analysis, 15 studies (20 datasets) were included, and the pooled ES was 1.07 [(95% CI = 1.04; 1.12), p-value < 0.001] in the fixed effect model; while using the random effect model, the pooled ES was 1.08 [(95% CI = 0.97; 1.20), p-value = 0.175], based on 228,250 participants with high statistical heterogeneity (Chi2 = 98.14, df = 19, I2 = 80.64, p-value < 0.001). No potential publication bias was found by the visual assessment of the funnel plot, but a border-line statistically significant publication bias was found by the Egger’s linear regression test (Intercept 0.15, t = 0.18, p-value = 0.857).
In order to differentiate among the risk of prevalent and incident depression, a sensitivity analysis based on study design was conducted. Referring to prevalent depression, only case-control and cross-sectional studies were included. In this case, 12 studies (19 datasets) were included, and using the fixed effect model, the pooled ES was 1.08 [(95% CI = 1.04; 1.13), p-value < 0.001] (Figure 3b); while using the random effect model, the pooled ES was 1.07 [(95% CI = 0.94; 1.23), p-value = 0.317], based on 152,279 participants with high statistical heterogeneity (Chi2 = 92.71, df = 18, I2 = 80.58, p-value < 0.001). No potential publication bias was found by the visual assessment of the funnel plot and confirmed by the Egger’s linear regression test (intercept −0.06, t = −0.07, p-value = 0.946). Referring to incident depression, only cohort (longitudinal) studies were included. In this case, five studies (five datasets) were included, and using the fixed effect model, the pooled ES was 1.08 [(95% CI = 1.01; 1.15), p-value = 0.022] (Figure 3c); while using the random effect model, the pooled ES was 1.18 [(95% CI = 1.02; 1.35), p-value = 0.023], based on 89,459 participants with low statistical heterogeneity (Chi2 = 9.85, df = 4, I2 = 59.39, p-value = 0.043). A potential publication bias was found by the visual assessment of the funnel plot and confirmed by the Egger’s linear regression test (intercept 2.39, t = 4.98, p-value = 0.016). The estimated ES slightly changed after the “trim and fill” method was applied (ES = 1.03 [(95% CI = 0.97; 1.09), p-value = 0.332; ES was 1.04 [(95% CI = 0.91; 1.19), p-value = 0.568 for fixed and random effect, respectively).
Lastly, a sensitivity analysis only including studies with QS ≥8 was conducted, for a total of 12 studies (15 datasets). Using the fixed effect model, the pooled ES was 1.10 [(95% CI = 1.05; 1.14), p-value = 0.001]; while using the random effect model, the pooled ES was 1.14 [(95% CI = 1.02; 1.26), p-value = 0.018], based on 219,389 participants with high statistical heterogeneity (Chi2 = 59.907 df = 14, I2 = 76.66, p-value < 0.001). No potential publication bias was found by the visual assessment of the funnel plot and confirmed by the Egger’s linear regression test (Intercept 0.74, t = 0.86, p-value = 0.405). Results are summarized in Table 3.

3.6. Subgroup Analysis by Gender

The sub-group analysis considering only women, included six studies (nine datasets), and the pooled ES was 1.03 [(95% CI = 0.99; 1.08), p-value = 0.171]; while using the random effect model, the pooled ES was 1.02 [(95% CI = 0.91; 1.14), p-value = 0.724], based on 91,470 participants with moderate statistical heterogeneity (Chi2 = 25.14, df = 8, I2 = 68.17, p-value = 0.001). No potential publication bias was found by the visual assessment of the funnel plot and confirmed by the Egger’s linear regression test (intercept −0.45, t = 0.0–0.489, p-value = 0.645).

4. Discussion

The current paper analyzes data from a large and systematic review with meta-analysis, conducted using three medical-scientific databases (PubMed/Medline, EMBASE and Scopus). Out of 1684 retrieved articles, 17 studies were included in the quantitative and qualitative analysis; however, because some of them reported data separately (for level of depression and gender), the whole sample was based on 24 databases. The original studies included were mainly conducted in Asia, and in most of the cases, they had a cross-sectional design. The pooled data obtained from this meta-analysis suggest that red and processed meat intake might potentially be a risk factor for depression, with a small but significant increment of depression risk (ES = 1.08 [(95% CI = 1.04; 1.12), p-value < 0.001], based on 241,738 participants). However, the association was attenuated when the random effect model was applied, with a weak boarder-line statistical significance [ES = 1.10 [(95% CI = 1.00; 1.22), p-value = 0.055].
To better understand the strength of the association and to assess the robustness of our results, several sensitivity analyses have been performed: firstly removing potential overlapping data, that did not materially change the results, secondly, we only included studies that used validated tools (to assess meat intake and to diagnose depression), finding a higher strength of the association and lower heterogeneity; thirdly, we differentiated among prevalent and incident depression, confirming the consistency of our results especially for incident depression. However, it should be considered that only a small number of longitudinal studies (only five) have been retrieved. Moreover, cohort studies are more susceptible to selection bias, and maintaining a follow up might be problematic, particularly among depressed individuals, who might be less prone to taking part in the study. On the contrary, considering the natural history of depression, a chronic and remittent disease with a long latency, it could be better evaluated by employing a case-control or cross-sectional study design. However, case-control and cross-sectional studies are notoriously susceptible to potential recall bias; nevertheless, the high number of participants included, the high number of retrieved studies and the use of validated tools in most of the included studies might reduce this disadvantage. Lastly, a sensitivity analysis only including studies with QS ≥ 8 was conducted. In this case, the ES for both fixed and random effects was strongly significant, confirming the robustness of our results.
Original studies assessed the exposure (red and processed meat intake) mainly through validated food frequency questionnaires. FFQ is a cheap and manageable tool, largely used to measure dietary intake; nevertheless, it cannot be considered free of potential bias (both under- and over-estimation). Moreover, since the FFQs used in the original studies were different, the intake was reported using various units of measures and quantities (i.e., portion per week/day or g/day). For that reason, we could not perform a dose–response analysis. Furthermore, the quantity of meat intake largely differs among studies, potentially limiting the comparability of the data. This aspect might partially explain the moderate-to-high heterogeneity found in our meta-analysis. Because of the above-mentioned factors, the included studies reported mixed findings on the association between meat intake and risk of depression, which could explain the slight differences in ES obtained using fixed and random effect models.
The subgroup analysis by gender was only possible for women, since only two studies reported data for men. When only women were taken into account, the ES was not statistically significant anymore, even if the direction of the association was confirmed. The absence of statistical significance might be truly due to a lack of association between meat intake and depression among women, or it could be due to the lower number of participants; as a matter of fact, the analysis carried out among women involved a total of 91,470 subjects, compared to 241,738 participants considering both men and women.
On the whole, our effect sizes were small, indicating that, even if the association between meat intake and depression was significant, the impact of meat on depression was small at an individual level; however, it could be of clinical importance at the population level. To the best of our knowledge, this represents the first systematic and meta-analytic study evaluating the association between red and processed meat and the risk of depression. Actually, a previous meta-analysis conducted by Zhang et al. in 2017 focused on meat in general [68]. As a matter of fact, they included studies that did not differentiate among red and processed meat or poultry; furthermore, only eight studies were included, and studies including adolescent and pregnant women were also considered eligible. Moreover, they did not perform sensitivity analysis or subgroup analysis by gender.
Our results are particularly relevant considering that depression is one of the primary causes of disease burden all over the world. In the last decades, a growing body of evidence was built to identify potential lifestyle factors associated with depression, and great attention has been posed, particularly on diet and depression. Even if the potential biological mechanisms behind the association between red/processed meat and depression, our results seem to confirm that foods rich in fats (especially reach in saturated fatty acids) and processed food (such as, for instance, red and processed meat) are associated with an altered HPA [69]. Moreover, it should be considered that a high intake of fatty and processed foods is correlated with a pro-inflammatory activity, causing a detrimental effect on the cardiovascular system [70], increasing the risk of depression (if the microvascular dysfunction is located in the brain) [12].
Nevertheless, it should be considered that people who have a healthy dietary approach are usually accustomed to adopt other healthy behaviors, such as being physically active and avoiding smoking [71,72]. This is because these decisions are based on the same decision-making model, and in particular diet and physical activity share the same interconnected factors [73]. Moreover, it should be considered that both diet and physical activity play a synergic effect on body composition, which in turn seems to be associated with depression [74]. Lastly, according to a recent meta-analysis, physical activity is significantly associated with a lower risk of both prevalent and incident depression, representing a potentially useful intervention to prevent and treat depression [75]. Some of the original studies included in the current meta-analysis also considered the level of physical activity performed as a potential confounder (in the adjusted model). This could be another potential explanation for the mixed results found in literature and for the high heterogeneity obtained in our meta-analysis. However, a high I2 value implies that heterogeneity is straightly due to heterogeneity amongst studies, rather than a sampling error [76].
However, the results from our review found a marginal but significant detrimental effect of red and processed meat on depression. In this regard, nutritional education campaigns should be promoted [77,78,79], especially because adherence to a healthy diet among the adult population is still low [80,81].

Limitantions and Strengths

The main limitation of our study is the high I2 value that might limit the generalizability of our results. However, with the aim of reducing heterogeneity, we performed several sensitivity analyses obtaining a moderate and low heterogeneity when only studies adopting a validated tool to evaluate meat intake, and only longitudinal studies respectively, were considered. Moreover, the high number of sensitivity analyses performed increased the robustness of our study, since the results did not considerably change. The mixed findings reported by each included study could be due to the different tool used to assess meat intake or to the different portion considered. Moreover, for the above-mentioned reasons, it was neither feasible to conduct a dose-response analysis, nor to identify a recommended intake of meat. The main strengths of this review are: being the first systematic review with meta-analysis aiming to assess the association between red and processed meat and risk of depression; being systematic in nature, as well as the comprehensive approach used to retrieve as much evidence as possible by consulting three different medical-scientific databases, and by manually checking the listed references; have been conducted according to the Cochrane Collaboration and MOOSE guidelines, and documented according to the PRISMA guidelines. Furthermore, the sample size was particularly large, based on 241,738 participants; moreover, a subgroup analyses by sex has been conducted as well. In addition, based on study design we were able to estimate the ES for both prevalent and incident depression. Moreover, a variety of confounding variables were chosen in the original studies and, in order to control the results, we combined data with the highest level of adjustment.

5. Conclusions

To conclude, the results of this systematic review and meta-analysis show a statistically significant detrimental effect of red and processed meat intake on depression (mainly prevalent). This study is important because our results might be used by clinicians and policy makers (considering the impact at the population level of our results) to design and implement interventions aiming to reduce the burden of depression in our society. However, it should be considered that our effect sizes were small, based on very mixed findings reported by each included study, and with high heterogeneity. For these reasons, further studies are needed. Consortium studies should be encouraged in order to harmonize data collection methods and results presentation.

Supplementary Materials

The following are available online at https://0-www-mdpi-com.brum.beds.ac.uk/1660-4601/17/18/6686/s1, Table S1: Search strategy in PubMed/MEDLINE.

Author Contributions

D.N. conceptualized and designed the study, analyzed the literature, and write manuscript. C.F. contributed to data collection, A.A. and A.O. helped to assembly the paper. V.G. managed the database and performed data analysis. D.N. and V.G. interpreted data and provided important intellectual supports in various steps of the study. All authors have read and agreed to the published version of the manuscript.

Funding

This research received no external funding.

Acknowledgments

We thank Giulia Dallagiacoma for the English revision.

Conflicts of Interest

The authors declare no conflict of interest.

References

  1. Disease, G.B.D.; Injury, I.; Prevalence, C. Global, regional, and national incidence, prevalence, and years lived with disability for 354 diseases and injuries for 195 countries and territories, 1990–2017: A systematic analysis for the Global Burden of Disease Study 2017. Lancet 2018, 392, 1789–1858. [Google Scholar] [CrossRef] [Green Version]
  2. World Health Organization. Depression. Available online: https://www.who.int/news-room/fact-sheets/detail/depression#:~:text=Depression%20is%20a%20leading%20cause%20of%20disability%20worldwide,and%20pharmacological%20treatments%20for%20moderate%20and%20severe%20depression (accessed on 7 August 2020).
  3. Fornaro, M.; Solmi, M.; Stubbs, B.; Veronese, N.; Monaco, F.; Novello, S.; Fusco, A.; Anastasia, A.; De Berardis, D.; Carvalho, A.F.; et al. Prevalence and correlates of major depressive disorder, bipolar disorder and schizophrenia among nursing home residents without dementia: Systematic review and meta-analysis. Br. J. Psychiatry 2020, 216, 6–15. [Google Scholar] [CrossRef] [PubMed] [Green Version]
  4. Amerio, A.; Odone, A.; Marchesi, C.; Ghaemi, S.N. Is depression one thing or many? Br. J. Psychiatry 2014, 204, 488. [Google Scholar] [CrossRef] [PubMed] [Green Version]
  5. Wang, P.S.; Aguilar-Gaxiola, S.; Alonso, J.; Angermeyer, M.C.; Borges, G.; Bromet, E.J.; Bruffaerts, R.; de Girolamo, G.; de Graaf, R.; Gureje, O.; et al. Use of mental health services for anxiety, mood, and substance disorders in 17 countries in the WHO world mental health surveys. Lancet 2007, 370, 841–850. [Google Scholar] [CrossRef] [Green Version]
  6. Orsolini, L.; Latini, R.; Pompili, M.; Serafini, G.; Volpe, U.; Vellante, F.; Fornaro, M.; Valchera, A.; Tomasetti, C.; Fraticelli, S.; et al. Understanding the Complex of Suicide in Depression: From Research to Clinics. Psychiatry Investig. 2020, 17, 207–221. [Google Scholar] [CrossRef] [Green Version]
  7. Lopresti, A.L.; Hood, S.D.; Drummond, P.D. A review of lifestyle factors that contribute to important pathways associated with major depression: Diet, sleep and exercise. J. Affect. Disord. 2013, 148, 12–27. [Google Scholar] [CrossRef] [PubMed] [Green Version]
  8. Jacka, F.N. Nutritional Psychiatry: Where to Next? EBioMedicine 2017, 17, 24–29. [Google Scholar] [CrossRef] [PubMed] [Green Version]
  9. Sandhu, K.V.; Sherwin, E.; Schellekens, H.; Stanton, C.; Dinan, T.G.; Cryan, J.F. Feeding the microbiota-gut-brain axis: Diet, microbiome, and neuropsychiatry. Transl. Res. 2017, 179, 223–244. [Google Scholar] [CrossRef]
  10. Saghafian, F.; Malmir, H.; Saneei, P.; Milajerdi, A.; Larijani, B.; Esmaillzadeh, A. Fruit and vegetable consumption and risk of depression: Accumulative evidence from an updated systematic review and meta-analysis of epidemiological studies. Br. J. Nutr. 2018, 119, 1087–1101. [Google Scholar] [CrossRef] [Green Version]
  11. Li, F.; Liu, X.; Zhang, D. Fish consumption and risk of depression: A meta-analysis. J. Epidemiol. Community Health 2016, 70, 299–304. [Google Scholar] [CrossRef]
  12. Li, Y.; Lv, M.R.; Wei, Y.J.; Sun, L.; Zhang, J.X.; Zhang, H.G.; Li, B. Dietary patterns and depression risk: A meta-analysis. Psychiatry Res. 2017, 253, 373–382. [Google Scholar] [CrossRef]
  13. Norde, M.M.; Collese, T.S.; Giovannucci, E.; Rogero, M.M. A posteriori dietary patterns and their association with systemic low-grade inflammation in adults: A systematic review and meta-analysis. Nutr. Rev. 2020. [Google Scholar] [CrossRef] [PubMed]
  14. Chan, D.S.; Lau, R.; Aune, D.; Vieira, R.; Greenwood, D.C.; Kampman, E.; Norat, T. Red and processed meat and colorectal cancer incidence: Meta-analysis of prospective studies. PLoS ONE 2011, 6, e20456. [Google Scholar] [CrossRef] [PubMed] [Green Version]
  15. Sasso, A.; Latella, G. Role of Heme Iron in the Association between Red Meat Consumption and Colorectal Cancer. Nutr. Cancer 2018, 70, 1173–1183. [Google Scholar] [CrossRef]
  16. Seiwert, N.; Heylmann, D.; Hasselwander, S.; Fahrer, J. Mechanism of colorectal carcinogenesis triggered by heme iron from red meat. Biochim. Biophys. Acta Rev. Cancer 2020, 1873, 188334. [Google Scholar] [CrossRef]
  17. International Agency for Research on Cancer Working Group on the Evaluation of Carcinogenic Risks to Humans. In Monographs on the Evaluation of Carcinogenic Risks to Humans; Red Meat and Processed Meat; IARC: Lyon, France, 2018; pp. 107–422.
  18. Santarelli, R.L.; Pierre, F.; Corpet, D.E. Processed meat and colorectal cancer: A review of epidemiologic and experimental evidence. Nutr. Cancer 2008, 60, 131–144. [Google Scholar] [CrossRef] [PubMed] [Green Version]
  19. Chiavarini, M.; Bertarelli, G.; Minelli, L.; Fabiani, R. Dietary Intake of Meat Cooking-Related Mutagens (HCAs) and Risk of Colorectal Adenoma and Cancer: A Systematic Review and Meta-Analysis. Nutrients 2017, 9, 514. [Google Scholar] [CrossRef] [PubMed] [Green Version]
  20. World Cancer Research Fund/American Institute for Cancer Research. Diet, Nutrition, Physical Activity and Cancer: A Global Perspective; Third Expert Report, Continuous Update Project Expert Report; World Cancer Research Fund/American Institute for Cancer Research: Washington, DC, USA, 2018. [Google Scholar]
  21. Bray, F.; Ferlay, J.; Soerjomataram, I.; Siegel, R.L.; Torre, L.A.; Jemal, A. Global cancer statistics 2018: GLOBOCAN estimates of incidence and mortality worldwide for 36 cancers in 185 countries. CA Cancer J. Clin. 2018, 68, 394–424. [Google Scholar] [CrossRef] [Green Version]
  22. Ng, C.G.; Boks, M.P.; Zainal, N.Z.; de Wit, N.J. The prevalence and pharmacotherapy of depression in cancer patients. J. Affect. Disord. 2011, 131, 1–7. [Google Scholar] [CrossRef]
  23. Okamura, M.; Yamawaki, S.; Akechi, T.; Taniguchi, K.; Uchitomi, Y. Psychiatric disorders following first breast cancer recurrence: Prevalence, associated factors and relationship to quality of life. Jpn. J. Clin. Oncol. 2005, 35, 302–309. [Google Scholar] [CrossRef]
  24. Firth, J.; Veronese, N.; Cotter, J.; Shivappa, N.; Hebert, J.R.; Ee, C.; Smith, L.; Stubbs, B.; Jackson, S.E.; Sarris, J. What Is the Role of Dietary Inflammation in Severe Mental Illness? A Review of Observational and Experimental Findings. Front. Psychiatry 2019, 10, 350. [Google Scholar] [CrossRef] [PubMed]
  25. Polokowski, A.R.; Shakil, H.; Carmichael, C.L.; Reigada, L.C. Omega-3 fatty acids and anxiety: A systematic review of the possible mechanisms at play. Nutr. Neurosci. 2020, 23, 494–504. [Google Scholar] [CrossRef] [PubMed]
  26. Mikolajczyk, R.T.; El Ansari, W.; Maxwell, A.E. Food consumption frequency and perceived stress and depressive symptoms among students in three European countries. Nutr. J. 2009, 8, 31. [Google Scholar] [CrossRef] [PubMed] [Green Version]
  27. Zhou, X.; Bi, B.; Zheng, L.; Li, Z.; Yang, H.; Song, H.; Sun, Y. The prevalence and risk factors for depression symptoms in a rural Chinese sample population. PLoS ONE 2014, 9, e99692. [Google Scholar] [CrossRef] [PubMed] [Green Version]
  28. McCabe, D.; Lisy, K.; Lockwood, C.; Colbeck, M. The impact of essential fatty acid, B vitamins, vitamin C, magnesium and zinc supplementation on stress levels in women: A systematic review. JBI Database Syst. Rev. Implement Rep. 2017, 15, 402–453. [Google Scholar] [CrossRef]
  29. Petridou, E.T.; Kousoulis, A.A.; Michelakos, T.; Papathoma, P.; Dessypris, N.; Papadopoulos, F.C.; Stefanadis, C. Folate and B12 serum levels in association with depression in the aged: A systematic review and meta-analysis. Aging Ment. Health 2016, 20, 965–973. [Google Scholar] [CrossRef]
  30. Petrilli, M.A.; Kranz, T.M.; Kleinhaus, K.; Joe, P.; Getz, M.; Johnson, P.; Chao, M.V.; Malaspina, D. The Emerging Role for Zinc in Depression and Psychosis. Front. Pharmacol. 2017, 8, 414. [Google Scholar] [CrossRef] [Green Version]
  31. Selhub, J. Folate, vitamin B12 and vitamin B6 and one carbon metabolism. J. Nutr. Health Aging 2002, 6, 39–42. [Google Scholar]
  32. Esnafoglu, E.; Ozturan, D.D. The relationship of severity of depression with homocysteine, folate, vitamin B12, and vitamin D levels in children and adolescents. Child Adolesc. Ment. Health 2020. [Google Scholar] [CrossRef]
  33. Higgins, J.P.; Altman, D.G.; Gotzsche, P.C.; Juni, P.; Moher, D.; Oxman, A.D.; Savovic, J.; Schulz, K.F.; Weeks, L.; Sterne, J.A.; et al. The Cochrane Collaboration’s tool for assessing risk of bias in randomised trials. BMJ 2011, 343, d5928. [Google Scholar] [CrossRef] [Green Version]
  34. Stroup, D.F.; Berlin, J.A.; Morton, S.C.; Olkin, I.; Williamson, G.D.; Rennie, D.; Moher, D.; Becker, B.J.; Sipe, T.A.; Thacker, S.B. Meta-analysis of observational studies in epidemiology: A proposal for reporting. Meta-analysis Of Observational Studies in Epidemiology (MOOSE) group. JAMA 2000, 283, 2008–2012. [Google Scholar] [CrossRef] [PubMed]
  35. Moher, D.; Liberati, A.; Tetzlaff, J.; Altman, D.G.; Group, P. Preferred reporting items for systematic reviews and meta-analyses: The PRISMA statement. PLoS Med. 2009, 6, e1000097. [Google Scholar] [CrossRef] [PubMed] [Green Version]
  36. Liberati, A.; Altman, D.G.; Tetzlaff, J.; Mulrow, C.; Gotzsche, P.C.; Ioannidis, J.P.; Clarke, M.; Devereaux, P.J.; Kleijnen, J.; Moher, D. The PRISMA statement for reporting systematic reviews and meta-analyses of studies that evaluate health care interventions: Explanation and elaboration. Ann. Intern. Med. 2009, 151, W65–W94. [Google Scholar] [CrossRef] [Green Version]
  37. Brown, P.; Brunnhuber, K.; Chalkidou, K.; Chalmers, I.; Clarke, M.; Fenton, M.; Forbes, C.; Glanville, J.; Hicks, N.J.; Moody, J.; et al. How to formulate research recommendations. BMJ 2006, 333, 804–806. [Google Scholar] [CrossRef] [PubMed] [Green Version]
  38. Higgins, J.P.T.; Green, S. Cochrane Handbook for Systematic Reviews of Interventions; Version 5.1.0.; The Cochrane Collaboration: London, UK, 2013. [Google Scholar]
  39. Gianfredi, V.; Bragazzi, N.L.; Nucci, D.; Villarini, M.; Moretti, M. Cardiovascular diseases and hard drinking waters: Implications from a systematic review with meta-analysis of case-control studies. J. Water Health 2017, 15, 31–40. [Google Scholar] [CrossRef]
  40. Gianfredi, V.; Nucci, D.; Abalsamo, A.; Acito, M.; Villarini, M.; Moretti, M.; Realdon, S. Green Tea Consumption and Risk of Breast Cancer and Recurrence-A Systematic Review and Meta-Analysis of Observational Studies. Nutrients 2018, 10, 1886. [Google Scholar] [CrossRef] [Green Version]
  41. Gianfredi, V.; Salvatori, T.; Nucci, D.; Villarini, M.; Moretti, M. Genotoxic risk in nurses handling antiblastic drugs: Systematic review of literature and meta-analysis. Recenti Prog. Med. 2017, 108, 511–520. [Google Scholar] [CrossRef]
  42. Amerio, A.; Stubbs, B.; Odone, A.; Tonna, M.; Marchesi, C.; Nassir Ghaemi, S. Bipolar I and II Disorders; A Systematic Review and Meta-Analysis on Differences in Comorbid Obsessive-Compulsive Disorder. Iran. J. Psychiatry Behav. Sci. 2016, 10, e3604. [Google Scholar] [CrossRef] [Green Version]
  43. Wells, G.A.; Shea, B.; O’Connell, D.; Paterson, J.; Welch, V.; Losos, M.; Tugwell, P. The Newcastle-Ottawa Scale (NOS) for Assessing the Quality of Nonrandomised Studies in Meta-Analyses. Available online: http://www.ohri.ca/programs/clinical_epidemiology/oxford.asp (accessed on 14 November 2018).
  44. Hedges, L.V.; Veve, J.L. Fixed- and Random-effects models in meta-analysis. Psychol. Methods 1998, 3, 486–504. [Google Scholar] [CrossRef]
  45. Begg, C.B.; Mazumdar, M. Operating characteristics of a rank correlation test for publication bias. Biometrics 1994, 50, 1088–1101. [Google Scholar] [CrossRef]
  46. Egger, M.; Davey Smith, G.; Schneider, M.; Minder, C. Bias in meta-analysis detected by a simple, graphical test. BMJ 1997, 315, 629–634. [Google Scholar] [CrossRef] [PubMed] [Green Version]
  47. Gianfredi, V.; Nucci, D.; Fatigoni, C.; Salvatori, T.; Villarini, M.; Moretti, M. Extent of Primary DNA Damage Measured by the Comet Assay in Health Professionals Exposed to Antineoplastic Drugs: A Systematic Review and Meta-Analysis. Int. J. Environ. Res. Public Health 2020, 17, 523. [Google Scholar] [CrossRef] [Green Version]
  48. Duval, S.; Tweedie, R. Trim and fill: A simple funnel-plot-based method of testing and adjusting for publication bias in meta-analysis. Biometrics 2000, 56, 455–463. [Google Scholar] [CrossRef]
  49. Sutton, A.J.; Duval, S.J.; Tweedie, R.L.; Abrams, K.R.; Jones, D.R. Empirical assessment of effect of publication bias on meta-analyses. BMJ 2000, 320, 1574–1577. [Google Scholar] [CrossRef] [Green Version]
  50. Shi, L.; Lin, L. The trim-and-fill method for publication bias: Practical guidelines and recommendations based on a large database of meta-analyses. Medicine 2019, 98, e15987. [Google Scholar] [CrossRef]
  51. Gianfredi, V.; Nucci, D.; Salvatori, T.; Dallagiacoma, G.; Fatigoni, C.; Moretti, M.; Realdon, S. Rectal Cancer: 20% Risk Reduction Thanks to Dietary Fibre Intake. Systematic Review and Meta-Analysis. Nutrients 2019, 11, 1579. [Google Scholar] [CrossRef] [Green Version]
  52. Gianfredi, V.; Salvatori, T.; Villarini, M.; Moretti, M.; Nucci, D.; Realdon, S. Is dietary fibre truly protective against colon cancer? A systematic review and meta-analysis. Int. J. Food Sci. Nutr. 2018, 69, 904–915. [Google Scholar] [CrossRef] [PubMed]
  53. Amani, R.; Saeidi, S.; Nazari, Z.; Nematpour, S. Correlation between dietary zinc intakes and its serum levels with depression scales in young female students. Biol. Trace Elem. Res. 2010, 137, 150–158. [Google Scholar] [CrossRef] [PubMed]
  54. Barros, M.B.A.; Lima, M.G.; Azevedo, R.C.S.; Medina, L.B.P.; Lopes, C.S.; Menezes, P.R.; Malta, D.C. Depression and health behaviors in Brazilian adults—PNS 2013. Rev. Saud. Publica 2017, 51, 8s. [Google Scholar] [CrossRef] [Green Version]
  55. El Ansari, W.; Adetunji, H.; Oskrochi, R. Food and mental health: Relationship between food and perceived stress and depressive symptoms among university students in the United Kingdom. Cent. Eur. J. Public Health 2014, 22, 90–97. [Google Scholar] [CrossRef] [Green Version]
  56. Elstgeest, L.E.M.; Visser, M.; Penninx, B.; Colpo, M.; Bandinelli, S.; Brouwer, I.A. Bidirectional associations between food groups and depressive symptoms: Longitudinal findings from the Invecchiare in Chianti (InCHIANTI) study. Br. J. Nutr. 2019, 121, 439–450. [Google Scholar] [CrossRef] [PubMed]
  57. Gibson-Smith, D.; Bot, M.; Brouwer, I.A.; Visser, M.; Giltay, E.J.; Penninx, B. Association of food groups with depression and anxiety disorders. Eur. J. Nutr. 2020, 59, 767–778. [Google Scholar] [CrossRef] [PubMed] [Green Version]
  58. Goh, C.M.J.; Abdin, E.; Jeyagurunathan, A.; Shafie, S.; Sambasivam, R.; Zhang, Y.J.; Vaingankar, J.A.; Chong, S.A.; Subramaniam, M. Exploring Singapore’s consumption of local fish, vegetables and fruits, meat and problematic alcohol use as risk factors of depression and subsyndromal depression in older adults. BMC Geriatr. 2019, 19, 161. [Google Scholar] [CrossRef] [PubMed] [Green Version]
  59. Gregorio, M.J.; Rodrigues, A.M.; Eusebio, M.; Sousa, R.D.; Dias, S.; Andre, B.; Gronning, K.; Coelho, P.S.; Mendes, J.M.; Graca, P.; et al. Dietary Patterns Characterized by High Meat Consumption Are Associated with Other Unhealthy Life Styles and Depression Symptoms. Front. Nutr. 2017, 4, 25. [Google Scholar] [CrossRef] [Green Version]
  60. Jacka, F.N.; Pasco, J.A.; Williams, L.J.; Mann, N.; Hodge, A.; Brazionis, L.; Berk, M. Red meat consumption and mood and anxiety disorders. Psychother. Psychosom. 2012, 81, 196–198. [Google Scholar] [CrossRef]
  61. Li, Y.; Zhang, C.; Li, S.; Zhang, D. Association between dietary protein intake and the risk of depressive symptoms in adults. Br. J. Nutr. 2020, 1–12. [Google Scholar] [CrossRef]
  62. Noguchi, R.; Hiraoka, M.; Watanabe, Y.; Kagaw, Y. Relationship between dietary patterns and depressive symptoms: Difference by gender, and unipolar and bipolar depression. J. Nutr. Sci. Vitaminol. 2013, 59, 115–122. [Google Scholar] [CrossRef] [Green Version]
  63. Okubo, R.; Matsuoka, Y.J.; Sawada, N.; Mimura, M.; Kurotani, K.; Nozaki, S.; Shikimoto, R.; Tsugane, S. Diet quality and depression risk in a Japanese population: The Japan Public Health Center (JPHC)-based Prospective Study. Sci. Rep. 2019, 9, 7150. [Google Scholar] [CrossRef] [Green Version]
  64. Park, Y.; Kim, M.; Baek, D.; Kim, S.H. Erythrocyte n-3 polyunsaturated fatty acid and seafood intake decrease the risk of depression: Case-control study in Korea. Ann. Nutr. Metab. 2012, 61, 25–31. [Google Scholar] [CrossRef]
  65. Rienks, J.; Dobson, A.J.; Mishra, G.D. Mediterranean dietary pattern and prevalence and incidence of depressive symptoms in mid-aged women: Results from a large community-based prospective study. Eur. J. Clin. Nutr. 2013, 67, 75–82. [Google Scholar] [CrossRef] [Green Version]
  66. Sanchez-Villegas, A.; Delgado-Rodriguez, M.; Alonso, A.; Schlatter, J.; Lahortiga, F.; Serra Majem, L.; Martinez-Gonzalez, M.A. Association of the Mediterranean dietary pattern with the incidence of depression: The Seguimiento Universidad de Navarra/University of Navarra follow-up (SUN) cohort. Arch. Gen. Psychiatry 2009, 66, 1090–1098. [Google Scholar] [CrossRef] [PubMed]
  67. Won, M.S.; Kim, S.; Yang, Y.J. Comparison of Health Status and Nutrient Intake between Depressed Women and Non-depressed Women: Based on the 2013 Korea National Health and Nutrition Examination Survey. Clin. Nutr. Res. 2016, 5, 112–125. [Google Scholar] [CrossRef] [PubMed] [Green Version]
  68. Zhang, Y.; Yang, Y.; Xie, M.S.; Ding, X.; Li, H.; Liu, Z.C.; Peng, S.F. Is meat consumption associated with depression? A meta-analysis of observational studies. BMC Psychiatry 2017, 17, 409. [Google Scholar] [CrossRef] [PubMed] [Green Version]
  69. Larrieu, T.; Laye, S. Food for Mood: Relevance of Nutritional Omega-3 Fatty Acids for Depression and Anxiety. Front. Physiol. 2018, 9, 1047. [Google Scholar] [CrossRef] [PubMed]
  70. Cannon, A.R.; Hammer, A.M.; Choudhry, M.A. Chapter 29—Alcohol, Inflammation, and Depression: The Gut-Brain Axis. In Inflammation and Immunity in Depression; Baune, B.T., Ed.; Academic Press: Cambridge, MA, USA, 2018; pp. 509–524. [Google Scholar] [CrossRef]
  71. Tavares, A.I. Physical activity and healthy diet: Determinants and implicit relationship. Public Health 2014, 128, 568–575. [Google Scholar] [CrossRef]
  72. Ferravante, C.; Gianfredi, V.; Bietta, C. Nutrition in Umbria: Adherence to five-a-day. Recenti Prog. Med. 2020, 111, 539–545. [Google Scholar] [CrossRef]
  73. Dobal, M.T.; Wesley, Y.; Wilson, F.L. Decision-making process about food choices and physical activity among black women living in New York City: A qualitative study. Divers. Equal. Health Care 2017, 14, 302–312. [Google Scholar]
  74. Dreimuller, N.; Lieb, K.; Tadic, A.; Engelmann, J.; Wollschlager, D.; Wagner, S. Body mass index (BMI) in major depressive disorder and its effects on depressive symptomatology and antidepressant response. J. Affect. Disord. 2019, 256, 524–531. [Google Scholar] [CrossRef]
  75. Gianfredi, V.; Blandi, L.; Cacitti, S.; Minelli, M.; Signorelli, C.; Amerio, A.; Odone, A. Depression and Objectively Measured Physical Activity: A Systematic Review and Meta-Analysis. Int. J. Environ. Res. Public Health 2020, 17, 3738. [Google Scholar] [CrossRef]
  76. Huedo-Medina, T.B.; Sanchez-Meca, J.; Marin-Martinez, F.; Botella, J. Assessing heterogeneity in meta-analysis: Q statistic or I2 index? Psychol. Methods 2006, 11, 193–206. [Google Scholar] [CrossRef] [Green Version]
  77. Gianfredi, V.; Grisci, C.; Nucci, D.; Parisi, V.; Moretti, M. Communication in health. Recenti Prog. Med. 2018, 109, 374–383. [Google Scholar] [CrossRef] [PubMed]
  78. Gianfredi, V.; Monarca, S.; Moretti, M.; Villarini, M. Health education, what is the role for pharmacist? Results from a cross sectional study in Umbria, Italy. Recenti Prog. Med. 2017, 108, 433–441. [Google Scholar] [CrossRef] [PubMed]
  79. Gianfredi, V.; Balzarini, F.; Gola, M.; Mangano, S.; Carpagnano, L.F.; Colucci, M.E.; Gentile, L.; Piscitelli, A.; Quattrone, F.; Scuri, S.; et al. Leadership in Public Health: Opportunities for Young Generations Within Scientific Associations and the Experience of the “Academy of Young Leaders”. Front. Public Health 2019, 7, 378. [Google Scholar] [CrossRef] [PubMed] [Green Version]
  80. Jankovic, N.; Geelen, A.; Streppel, M.T.; de Groot, L.C.; Orfanos, P.; van den Hooven, E.H.; Pikhart, H.; Boffetta, P.; Trichopoulou, A.; Bobak, M.; et al. Adherence to a healthy diet according to the World Health Organization guidelines and all-cause mortality in elderly adults from Europe and the United States. Am. J. Epidemiol. 2014, 180, 978–988. [Google Scholar] [CrossRef] [PubMed]
  81. Nucci, D.; Minelli, L.; Gianfredi, V. MI NUTRO (MIgrants NUTRition knOwledge for integration): A nutrition education intervention among immigrants, Perugia (Italy)-pilot study. Recenti Prog. Med. 2020, 111, 546–552. [Google Scholar] [PubMed]
Figure 1. Flow diagram of the selection process. From: Moher D, Liberati A, Tetzlaff J, Altman DG, The PRISMA Group (2009). Preferred Reporting Items for Systematic Reviews and Meta-Analyses: The PRISMA Statement. PLoS Med 6(7): e1000097. doi:10.1371/journal.pmed1000097 [35].
Ijerph 17 06686 g001
Figure 2. (a) Forest plot, and (b) funnel plot of the meta-analysis assessing the association between meat intake and depression. ES, effect size; CI, confidence interval.
Ijerph 17 06686 g002
Figure 3. (a) Forest plot of the meta-analysis assessing the association between meat intake and depression, only including studies that used validated tools to assess meat intake; (b) forest plot and meta-analysis assessing the association between meat intake and prevalent depression (only including case-control and cross-sectional studies); (c) forest plot and meta-analysis assessing the association between meat intake and incident depression (only including longitudinal studies). ES, effect size; CI, confidence interval.
Ijerph 17 06686 g003
Table 1. Detailed description of inclusion/exclusion criteria according to a Population, Exposure, Outcomes and Study design (PEOS).
Search StrategyDetails
Inclusion criteriaP: adults (men and women)
E: high intake of red and processed meat
O: Depressive disorder
S: cohort studies, case-control, cross-sectional
Exclusion criteriaP: people < 18 years old, pregnant women, patients with chronic diseases
E: combined consumption of multiple food components (e.g., dietary pattern)
O: other psychological disorders
S: not original papers (opinion paper, review article, commentary, letter, protocols, article without quantitative data, thesis, conference papers, note, book chapter), trials
Language filterEnglish
Time filterNo filter (from inception)
DatabasePubMed/Medline; EMBASE, Scopus
Table 2. Descriptive characteristics of the included studies listed in alphabetical order.
Author,
Year [Reference]
CountryStudy DesignStudy PeriodSample Size, Gender, AgeN. Depressed Subjects, Gender, AgeAttrition+Diagnosis of DepressionValidated Tool, for DepressionTool used to Assess Meat IntakeValidated Tool, for Meat IntakePortion of MeatOR, HR, β, r (CI95%)AdjustmentQS
Amani R., 2010 [53]Irancase-control200646 F, range 20–25 y 23 mean age: 20.7 ± 1.6 y26221-BDIyes12-item semiquantitative FFQn.a.3–4 times/week2 cases/14 controls p < 0.001crude model7
Barros M., 2017 [54]Brazilcross-sectional2013–201449,025 (25,542 F; 23,483 M) mean: 37 y3107 minor depression; 2037 major depression11,177 (M; F)PHQ-9yes12-item FFQyesweekly consumptionMinor depression: OR 1.26 (1.12–1.41)age, sex, and education9
Major depression: OR 1.43 (1.23–1.66)
El Ansari W., 2014 [55]England, Walls, Irelandcross-sectional2007–20083464 (2699 F; 765 M) mean: 24.9 ±8.6 n.a.242 (M; F)20-items Modification of BDIyes12-item questionnairenoseveral times a dayF: r = 0.008 p = 0.680crude model7
M: r = −0.003 p = 0.942
Elstgeest L.E.M., 2019 [56]Italylongitudinal study 3-y FU1998–2009baseline 1058 (579 F; 479 M) mean: 65.8 ±15.2
FU1: 960, FU2: 853, FU3: 757
baseline: 187;
FU1: 231; FU2: 145; FU3: 150
148 (M; F)CES-Dyes240-FFQyesQuartiles of standardized intakeβ = −0.39 (−1.13, 0.36) p = 0.313baseline CES-D score, age, sex, marital status, education, PA, smoking, living disabilities, alcohol intake and energy intake.10
Gibson-Smith D., 2020 [57]the Netherlandslongitudinal 9-y FU20041634 (1108 F; 526 M = mean: 52.0 ± 13.2414 depressed and 886 remission435 (M; F)IDS-SRyes258-FFQyesn.a.β = −0.05 (−0.11, −0.00) p = 0.05age, sex, education, marital status, PA, smoking status9
Goh C.M.J., 2019 [58]Singaporecross-sectional20132565 (1448 F; 1117 M) range: 60–85 y425 subsyndromal; 177 depression0GMS-AGECATyesNational surveynon.a.Depression: OR = 3.21 (1.02 10.14) p = 0.05crude model7
Subsyndromal OR = 2.61 (1.20 5.67) p = 0.02
Gregorio M.J., 2017 [59]Portugalcross-sectional2013–20157591 (4784 F; 2807 M) mean: 48.02 ± 18.02n.a.2562 (M; F)HADSyesfood questionnaire not further specifiedn.a.n.a.OR = 1.50 (1.07 2.09) p = 0.018age, sex, education, employment, territorial units, smoking, PA and alcohol habits.9
Jacka F.N., 2012 [60]Australiacross-sectional20091046 F range: 20–93 y6081SCID-I/NPyesCancer Council dietary questionnaireyes>57 g/dayOR = 1.82 (0.88 3.75)age and dietary pattern score9
Li Y., 2020 [61]USAcross-sectional2007–201417,845 (9102 F; 8743 M) range: 18–65 y1647; (1070 F; 577 M)0PHQ-9yes24-h dietary recall interviews by trained interviewersyes0.20 g/kg per dayOR = 0.82 (0.43–1.54)age, sex, race, marital status, education, income, BMI, diabetes, hypertension, smoking, alcohol, energy intake, fruit intake, vegetable intake, Mg intake, Zn intake, SFA intake, MUFA intake, PUFA intake and PA10
Mikolajczyk R.T., 2009 [26]Germany, Poland-Bulgariacross-sectional20051839 (1194 F; 645 M), mean: 20.6 ± 2.3n.a.264 (M; F)M-BDIyes12-item FFQnon.a.F: r = −1.38 p = 0.01country and all the other food components8
M: r = −0.66 p = 0.34
Noguchi R., 2013 [62]Japancross-sectionaln.a.166 (62 F; 104 M) mean: 38.7 ± 10.275 (25 F; 50 M)0H-SDSyesBDHQ-56 foodsyesn.a.r = −0.159age, BMI and sex8
Okubo R., 2019 [63]Japanlongitudinal 5 y FU1990–20141112 (652 F; 460 M) mean: 73 y8511,107PHQ-9yes147-FFQyes4 times/week27 cases/244 controlscrude model8
Park Y., 2012 [64]Koreacase-control2008–2010168 (112 F; 56 M) mean: 44.85 ± 1.77 y80 (59 F; 21 M)0CESyes91-FFQyes>3.61 serving/weekOR = 4.39 (1.25–15.38)Drinking, marital status, sleeping hours, education, job and energy except for energy intake8
Rienks J., 2013 [65]Australiacross-sectional and longitudinal analysis 3-years FU2001–20048369 F in cross-sectional; mean: 52.5 ± 1.5 721 in cross-section; 660 in longitudinal2857CESyes101-FFQyesn.a.OR = 1.06 (0.99–1.13) p = 0.11;energy, smoking, PA, ability to manage on available income, occupation status, education, marital status, mean stress score and BMI10
7588 in longitudinal mean: 52.5 ± 1.5HR = 1.02 (0.95–1.10) p = 0.54
Sànchez-Villegas A., 2009 [66]Spainlongitudinal 4.4 y FU1999–200510,094 (F and M) age n.a.480 (156 M, 324 F)5347self-reportedno136-FFQyes177 g/d M; 167 g/d FHR= 1.35 (1.01–1.80) sex, age, smoking, BMI, PA, energy intake, and employment8
Won M.S., 2016 [67]Koreacase-control20132236 F range: 19–64 y315430self-reportedno112-FFQn.a.0.20 ± 0.02 servings/day19–29 y: 45 cases/322 controls;
30–49 y: 119 cases/958 controls;
50–64 y: 151 cases/641 controls
crude model5
Zhou X., 2014 [27]Chinacross-sectional 2012–201311,473 (6155 F; 5318 M) mean: 53.72n.a.0PHQ-9yesfood questionnaire not further specifiedn.a.≥500 g/week OR 0.61 (0.47–0.78)crude model7
F: female; M: male; y = years; FU: follow-up; N: number; n.a.: not available; BMI: Body Mass Index; PA: physical activity; FFQ: Food Frequency Questionnaire; Zn: Zinc; Mg: Magnesium; PUFA: Poly-unsaturated Fatty Acids; MUFA: mono-unsaturated acids; SFA: saturated fatty acids; BDI: Beck Depression Inventor; CES-D: Center for Epidemiologic Studies Depression scale; GMS-AGECAT: Geriatric Mental State with Automated Geriatric Examination for Computer Assisted Taxonomy; H-SDS: Himorogi Self-rating Depression Scale; HADS: The Hospital Anxiety and Depression Scale; IDS-SR: Inventory of Depressive Symptomatology—Self Report; PHQ-9: Patient Health Questionnaire–9; SCID-I/NP: The Structured Clinical Interview for DSM-IV-TR Research Version, non-patient edition.
Table 3. Results of sensitivity and subgroup analyses.
AnalysisN. of ParticipantsES (95% CI)
without potential overlapping effect192,185Fixed effect: 1.06 (1.02; 1.10)
Random effect: 1.08 (0.97; 1.29)
validated tool to assess meat intake209,959Fixed effect: 1.11 (1.07; 1.16)
Random effect: 1.18 (1.06; 1.32)
validated tool to diagnosis depression228,250Fixed effect: 1.07 (1.04; 1.12)
Random effect: 1.08 (0.97; 1.20)
prevalent depression152,279Fixed effect: 1.08 (1.04; 1.13)
Random effect: 1.07 (0.94; 1.23)
incident depression89,459Fixed effect: 1.08 (1.01; 1.15)
Random effect: 1.18 (1.02; 1.35)
quality score ≥ 8219,389Fixed effect: 1.10 (1.05; 1.14)
Random effect: 1.14 (1.02; 1.26)
only women91,470Fixed effect: 1.03 (0.99; 1.08)
Random effect: 1.02 (0.91; 1.14)

