
Eco-Efficiency of the English and Welsh Water Companies: A Cross Performance Assessment

 ,
,  ,
, 
Abstract
:1. Introduction
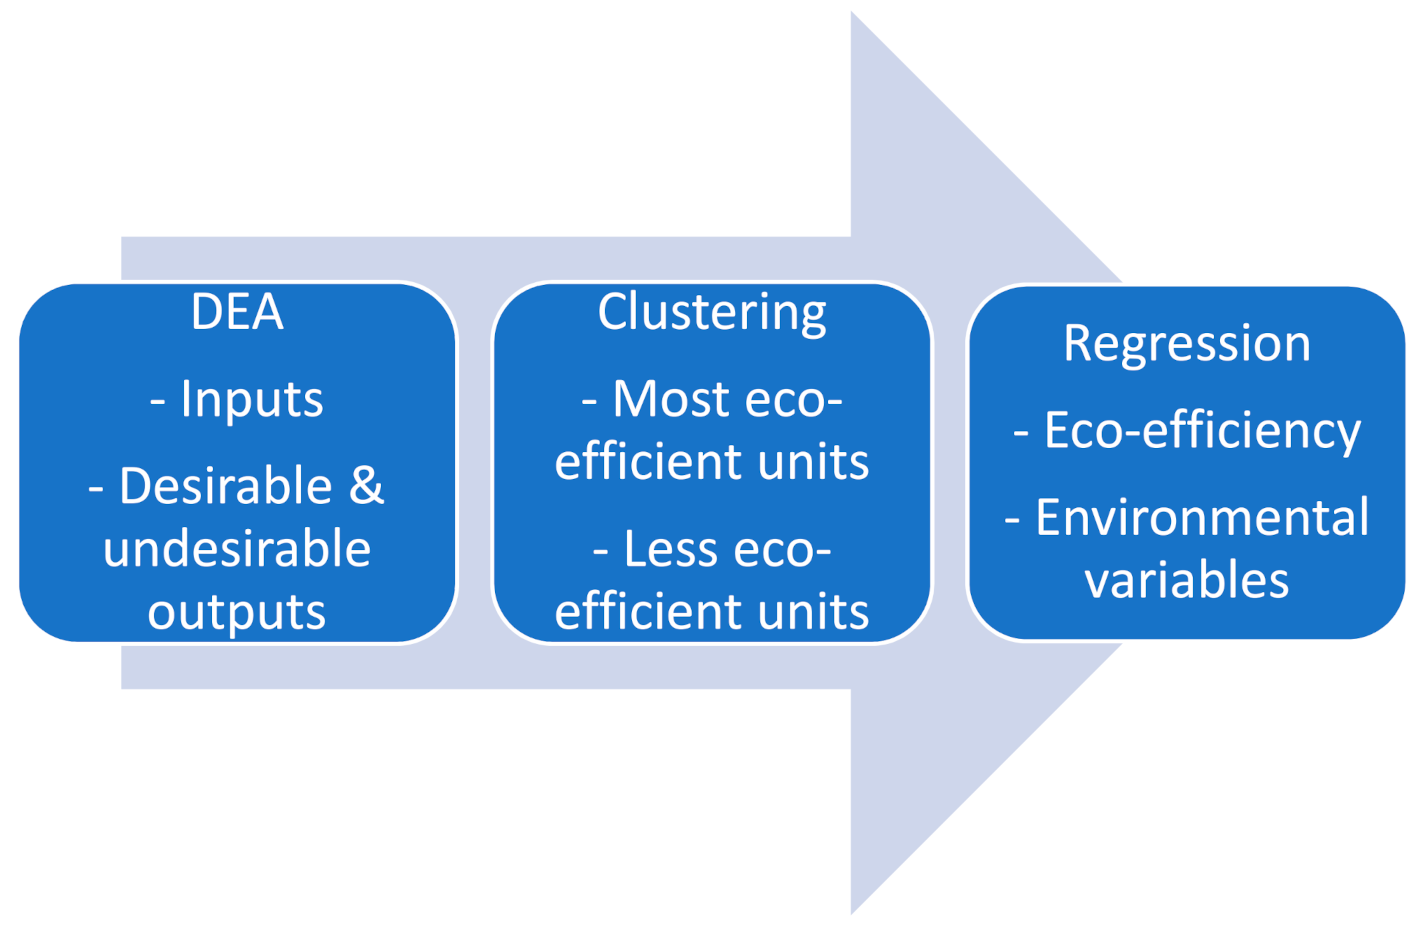
2. Methods
2.1. Eco-Efficiency Assessment
2.2. Cluster Analysis
2.3. Analysis of Eco-Efficiency Drivers
3. Case Study Description
4. Results
4.1. Eco-Efficiency Estimation
4.2. Drivers of Eco-Efficiency
5. Conclusions
Author Contributions
Funding
Institutional Review Board Statement
Informed Consent Statement
Data Availability Statement
Conflicts of Interest
References
- Kumar, A.; Thanki, A.; Padhiyar, H.; Singh, K.N.; Pandey, S.; Yadav, M.; Yu, Z.G. Greenhouse gases emission control in WWTS via potential operational strategies: A critical review. Chemosphere 2021, 273, 129694. [Google Scholar] [CrossRef] [PubMed]
- Liu, L.; Sun, X.; Chen, C.; Zhao, E. How will auctioning impact on the carbon emission abatement cost of electric power generation sector in China? Appl. Energy 2016, 168, 594–609. [Google Scholar] [CrossRef]
- Madolo, S.D.; Telukdarie, A.; Kumar, A. Energy–water and GHG nexus: A South African water industry case. Water Pract. Technol. 2018, 13, 673–691. [Google Scholar] [CrossRef]
- Sala-Garrido, R.; Mocholi-Arce, M.; Molinos-Senante, M.; Maziotis, A. Marginal abatement cost of carbon dioxide emissions in the provision of urban drinking water. Sustain. Prod. Consum. 2021, 25, 439–449. [Google Scholar] [CrossRef]
- Kumar, A.; Yang, T.; Sharma, M.P. Greenhouse gas measurement from Chinese freshwater bodies: A review. J. Clean. Prod. 2019, 233, 368–378. [Google Scholar] [CrossRef]
- Wakeel, M.; Chen, B.; Hayat, T.; Alsaedi, A.; Ahmad, B. Energy consumption for water use cycles in different countries: A review. Appl. Energy 2018, 178, 868–885. [Google Scholar] [CrossRef]
- Chen, P.-C.; Alvarado, V.; Hsu, S.-C. Water energy nexus in city and hinter- lands: Multi-regional physical input-output analysis for Hong Kong and South China. Appl. Energy 2018, 225, 986–997. [Google Scholar] [CrossRef]
- Liao, X.; Zhao, X.; Liu, W.; Li, R.; Wang, X.; Wang, W.; Tillotson, M.R. Comparing water footprint and water scarcity footprint of energy demand in China’s six megacities. Appl. Energy 2020, 269, 115137. [Google Scholar] [CrossRef]
- Ananda, J. Productivity implications of the water-energy-emissions nexus: An empirical analysis of the drinking water and wastewater sector. J. Clean. Prod. 2018, 196, 1097–1195. [Google Scholar] [CrossRef]
- Suárez-Varela, M.; de los Ángeles García-Valiñas, M.; González-Gómez, F.; Picazo-Tadeo, A.J. Ownership and Performance in Water Services Revisited: Does Private Management Really Outperform Public? Water Resour. Manag. 2018, 31, 2355–2373. [Google Scholar] [CrossRef]
- Charnes, A.; Cooper, W.W.; Rhodes, E. Measuring the efficiency of decision making units. Eur. J. Oper. Res. 1978, 2, 429–444. [Google Scholar] [CrossRef]
- Ananda, J. Explaining the environmental efficiency of drinking water and wastewater utilities. Sustain. Prod. Consum. 2019, 17, 188–195. [Google Scholar] [CrossRef]
- Ananda, J.; Hampf, B. Measuring environmentally sensitive productivity growth: An application to the urban water sector. Ecol. Econ. 2015, 116, 211–219. [Google Scholar] [CrossRef]
- Ding, L.; Yang, Y.; Wang, W.; Calin, A.C. Regional carbon emission efficiency and its dynamic evolution in China: A novel cross efficiency-malmquist productivity index. J. Clean. Prod. 2019, 241, 1–10. [Google Scholar] [CrossRef]
- Liu, X.; Chu, J.; Yin, P.; Sun, J. DEA cross-efficiency evaluation considering undesirable output and ranking priority: A case study of eco-efficiency analysis of coal-fired power plants. J. Clean. Prod. 2017, 142, 877–885. [Google Scholar] [CrossRef]
- Doyle, J.; Green, R.H. Efficiency and Cross-Efficiency in DEA: Derivations, Meanings and Uses. J. Oper. Res. Soc. 1994, 45, 567–578. [Google Scholar] [CrossRef]
- Doyle, J.R.; Green, R.H. Cross-evaluation in DEA: Improving discrimination among DMUs. INFOR 1995, 33, 205–222. [Google Scholar] [CrossRef]
- Wang, Y.-M.; Chin, K.-S. Some alternative models for DEA cross-efficiency evaluation, Int. J. Prod. Econ. 2010, 128, 332–338. [Google Scholar] [CrossRef]
- Sexton, T.R.; Silkman, R.H.; Hogan, A.J. Data envelopment analysis: Critique and extensions. New Dir. Program Eval. 1986, 32, 73–105. [Google Scholar] [CrossRef]
- Cui, Q.; Li, Y. A cross efficiency distinguishing method to explore the cooperation degree in dynamic airline environmental efficiency. Transp. Policy 2020, 99, 31–43. [Google Scholar] [CrossRef]
- Bevilacqua, M.; Ciarapica, F.E.; Mazzuto, G.; Paciarotti, C. Efficiency assessment of blanching and deep-freezing systems through data envelopment analysis. Eng. Agric. Environ. Food 2015, 8, 222–227. [Google Scholar] [CrossRef]
- Kutlu, L. Greenhouse Gas Emission Efficiencies of World Countries. Int. J. Environ. Res. Public Health 2020, 17, 8771. [Google Scholar] [CrossRef] [PubMed]
- Molinos-Senante, M.; Hernandez-Sancho, F.; Mocholi-Arce, M.; Sala-Garrido, R. Economic and environmental performance of wastewater treatment plants: Potential reductions in greenhouse gases emissions. Resour. Energy Econ. 2014, 38, 125–140. [Google Scholar] [CrossRef]
- Mukherjee, K. Measuring energy efficiency in the context of an emerging economy: The case of Indian manufacturing. Eur. J. Oper. Res. 2010, 201, 933–941. [Google Scholar] [CrossRef]
- Vlontzos, G.; Niavis, S.; Manos, B. A DEA approach for estimating the agricultural and environmental efficiency of EU countries. Renew. Sustain. Energy Rev. 2014, 40, 91–96. [Google Scholar] [CrossRef]
- Färe, R.; Grosskopf, S. Modeling undesirable factors in efficiency evaluation: Comment. Eur. J. Oper. Res. 2004, 157, 242–245. [Google Scholar] [CrossRef]
- Zhou, P.; Ang, B.W. Linear programming models for measuring economy-wide energy efficiency performance. Energy Policy 2008, 36, 2911–2916. [Google Scholar] [CrossRef]
- Liang, L.; Wu, J.; Cook, W.D.; Zhu, J. Alternative secondary goals in DEA cross-efficiency evaluation, J. Clean. Prod. 2008, 113, 1025–1030. [Google Scholar] [CrossRef]
- Wu, J.; Chu, J.; Sun, J.; Zhu, Q.; Liang, L. Extended secondary goal models for weights selection in DEA cross-efficiency evaluation. Comput. Ind. Eng. 2016, 93, 143–151. [Google Scholar] [CrossRef]
- Caballero, S.; Esclapez, R.; Galindo, N.; Mantilla, E.; Crespo, J. Use of a passive sampling network for the determination of urban NO2 spatiotemporal variation. Atmos. Environ. 2012, 63, 148–155. [Google Scholar] [CrossRef]
- Xie, L.; Chen, C.; Yu, Y. Dynamic Assessment of Environmental Efficiency in Chinese Industry: A Multiple DEA Model with a Gini Criterion Approach. Sustainability 2019, 11, 2294. [Google Scholar] [CrossRef] [Green Version]
- Bojnec, S.; Latruffe, L. Measures of farm business efficiency. Ind. Manag. Data Syst. 2007, 108, 258–270. [Google Scholar] [CrossRef]
- Sikka, V.; Luke, R.D.; Ozcan, Y.A. The efficiency of hospital based clusters: Evaluating system performance using data envelopment analysis. Health Care Manag. Rev. 2009, 34, 251–261. [Google Scholar] [CrossRef] [PubMed]
- Wu, J.; Liang, L.; Song, M. Performance Based Clustering for Benchmarking of Container Ports: An Application of Dea and Cluster Analysis Technique. Int. J. Comput. Intell. Syst. 2010, 3, 709–722. [Google Scholar] [CrossRef]
- Omrani, H.; Shafaat, K.; Emrouznejad, A. An integrated fuzzy clustering cooperative game data envelopment analysis model with application in hospital efficiency, Expert Syst. Appl. 2018, 114, 615–628. [Google Scholar]
- Cinaroglou, S. Integrated k-means clustering with data envelopment analysis of public hospital efficiency. Health Care Manag. Sci. 2020, 23, 325–328. [Google Scholar] [CrossRef]
- Kaufman, L.; Rousseeuw, P.J. Finding Groups in Data: An Introduction to Cluster Analysis; Wiley: New York, NY, USA, 1990; pp. 1–342. [Google Scholar]
- Gu, F.; Hall, P.; Nicholas, J. Performance evaluation for composites based on recycled polypropylene using principal component analysis and cluster analysis. J. Clean. Prod. 2016, 115, 343–353. [Google Scholar] [CrossRef]
- Suzuki, R.; Shimodaira, H. Pvclust: An R package for assessing the uncertainty in hierarchical clustering. Bioinformatics 2006, 22, 1540–1542. [Google Scholar] [CrossRef]
- Byrnes, J.; Crase, L.; Dollery, B.; Villano, R. The relative economic efficiency of urban water utilities in regional New South Wales and Victoria. Resour. Energy Econ. 2010, 32, 439–455. [Google Scholar] [CrossRef]
- Guerrini, A.; Romano, G.; Leardini, C.; Martini, M. The Effects of Operational and Environmental Variables on Efficiency of Danish Water and Wastewater Utilities. Water 2015, 7, 3263–3282. [Google Scholar] [CrossRef]
- Wang, X.; Han, L.; Yin, L. Environmental Efficiency and Its Determinants for Manufacturing in China. Sustainability 2017, 9, 47. [Google Scholar] [CrossRef] [Green Version]
- Ding, Z.Y.; Jo, G.S.; Wang, Y.; Yeo, G.T. The relative efficiency of container terminals in small and medium-sized ports in China. Asianj. Ship. Log. 2015, 31, 231–251. [Google Scholar] [CrossRef] [Green Version]
- Luo, J.H.; Cui, E.; Ji, J.H. Analysis on container ports efficiency and its influencing factors on two stage method of DEA-TOBIT. Sci. Technol. Manag. Res. 2013, 33, 236–239. [Google Scholar]
- Wang, L.; Zhou, Z.; Yang, Y.; Wu, J. Green efficiency evaluation and improvement of Chinese ports: A cross-efficiency model. Transp. Res. Part D 2020, 88, 102590. [Google Scholar] [CrossRef]
- Zhang, J.; Fang, H.; Peng, B.; Wang, X.; Fang, S. Productivity Growth-Accounting for Undesirable Outputs and Its Influencing Factors: The Case of China. Sustainability 2016, 8, 116. [Google Scholar] [CrossRef] [Green Version]
- Stone and Webster Consultants. Investigation into Evidence for Economies of Scale in the Water and Sewerage Industry in England and Wales; Final Report Prepared for Ofwat; Ofwat: London, UK, 2004; pp. 1–62. [Google Scholar]
- Molinos-Senante, M.; Porcher, S.; Maziotis, A. Impact of Regulation on English and Welsh Water-Only Companies: An Input Distance Function Approach. Environ. Sci. Pollut. Res. 2017, 24, 16994–17005. [Google Scholar] [CrossRef]
- Molinos-Senante, M.; Maziotis, A. Assessing the influence of exogenous and quality of service variables on water companies’ performance using a true-fixed stochastic frontier approach. Urban Water J. 2018, 15, 682–691. [Google Scholar] [CrossRef]
- Brea-Solis, H.; Perelman, S.; Saal, D.S. Regulatory incentives to water losses reduction: The case of England and Wales. J. Prod. Anal. 2017, 47, 259–276. [Google Scholar] [CrossRef] [Green Version]
- Molinos-Senante, M.; Guzman, C. Reducing CO2 emissions from drinking water treatment plants: A shadow price approach. Appl. Energy 2018, 210, 623–631. [Google Scholar] [CrossRef]
- Saal, D.S.; Parker, D.; Weyman-Jones, T. Determining the contribution of technical efficiency, and scale change to productivity growth in the privatized English and Welsh water and sewerage industry: 1985–2000. J. Product. Anal. 2007, 28, 127–139. [Google Scholar] [CrossRef]
- Thanassoulis, E. Use of data envelopment analysis in the regulation of UK water utilities: Water distribution. Eur. J. Oper. Res. 2000, 126, 436–453. [Google Scholar] [CrossRef]
- Thanassoulis, E. Comparative performance measurement in regulation: The case of English and Welsh sewerage services. J. Oper. Res. Soc. 2002, 53, 292–302. [Google Scholar] [CrossRef]
- Molinos-Senante, M.; Hanley, N.; Sala-Garrido, R. Measuring the CO2 shadow price for wastewater treatment: A directional distance function approach. Appl. Energy 2015, 144, 241–249. [Google Scholar] [CrossRef]
- HM Government. Environmental Reporting Guidelines: Including Streamlined Energy and Carbon Reporting Guidance March 2019 (Updated Introduction and Chapters 1 and 2); HM Government: London, UK, 2019; pp. 1–152. [Google Scholar]
- Ofwat. Preparing for the Future –Ofwat’s Climate Change Policy Statement; The Water Services Regulation Authority: Birmingham, UK, 2010; pp. 1–16. [Google Scholar]
- Ofwat. Playing Our Part—Reducing Greenhouse Gas Emissions in the Water and Sewerage Sectors Supporting Information; The Water Services Regulation Authority: Birmingham, UK, 2010; pp. 1–43. [Google Scholar]
- Molinos-Senante, M.; Maziotis, A. Drivers of productivity change in water companies: An empirical approach for England and Wales. Int. J. Water Resour. Dev. 2020, 36, 972–991. [Google Scholar] [CrossRef]
- Villegas, A.; Molinos-Senante, M.; Maziotis, A. Impact of environmental variables on the efficiency of water companies in England and Wales: A double-bootstrap approach. Environ. Sci. Pollut. Res. 2019, 26, 31014–31025. [Google Scholar] [CrossRef] [PubMed]
- Ofwat. Cost Assessment for PR19: A Consultation on Econometric Cost Modelling; The Water Services Regulation Authority: Birmingham, UK, 2018; pp. 1–29. [Google Scholar]
- Ofwat. PR19 Final Determinations: Securing Cost Efficiency Technical Appendix; The Water Services Regulation Authority: Birmingham, UK, 2019; pp. 1–222. [Google Scholar]
- Ofwat. PR19 Final Determinations: Supplementary Technical Appendix: Econometric Approach; The Water Services Regulation Authority: Birmingham, UK, 2019; pp. 1–42. [Google Scholar]
- Ofwat. RAG 4.0—Guideline for the Table Definitions in the Annual Performance Report; The Water Services Regulation Authority: Birmingham, UK, 2019; pp. 1–123. [Google Scholar]
- Molinos-Senante, M.; Porcher, S.; Maziotis, A. Productivity change and its drivers for the Chilean water companies: A comparison of full private and concessionary companies. J. Clean. Prod. 2018, 183, 908–916. [Google Scholar] [CrossRef]
- Molinos-Senante, M.; Villegas, A.; Maziotis, A. Are water tariffs sufficient incentives to reduce water leakages? An empirical approach for Chile. Util. Policy 2019, 61, 1–10. [Google Scholar] [CrossRef]


| Variables | Unit of Measurement | Mean | Std. Dev. | Min. | Max. |
|---|---|---|---|---|---|
| Volume of water delivered | 000 s m3/year | 713 | 555 | 56 | 2169 |
| Number of water connected properties | 000 s/year | 1499 | 1125 | 124 | 3826 |
| Length of water mains | 000 s km | 20,451 | 14,099 | 2024 | 47,817 |
| Greenhouse gas emissions | tonCO2eq/year | 82,845 | 69,062 | 4542 | 275,900 |
| Energy costs | ₤m/year | 20 | 15 | 2 | 60 |
| Other costs | ₤m/year | 93 | 79 | 8 | 332 |
| Water taken from rivers | % | 22.9 | 20.9 | 0.1 | 73.2 |
| Water taken from boreholes | % | 40.0 | 30.8 | 3.5 | 92.1 |
| Surface water treatment works | nr | 16 | 15 | 1 | 54 |
| Water receiving high levels of treatment | % | 93.1 | 5.4 | 81.0 | 100.0 |
| Average pumping head | nr | 147 | 44 | 65 | 256 |
| Population density | 000 s/km | 0.167 | 0.048 | 0.107 | 0.316 |
| Observations | 108 |
| Estimates | Model (1) | Model (3) | ||||
|---|---|---|---|---|---|---|
| WaSCs | WoCs | All Water Companies | WaSCs | WoCs | All Water Companies | |
| Average eco-efficiency | 0.930 | 0.896 | 0.916 | 0.918 | 0.892 | 0.907 |
| Number of DMUs whose sum of weights of desirable outputs takes zero values | 8 | 5 | 13 | 0 | 0 | 0 |
| Number of DMUs whose sum of weights of undesirable outputs takes zero values | 20 | 4 | 24 | 0 | 0 | 0 |
| Water Company | Eco-Efficiency Score | Sum of Weights of Desirable Outputs | Sum of Weights of Undesirable Output |
|---|---|---|---|
| WaSC1 | 0.978 | 0.440 | 0.538 |
| WaSC2 | 0.795 | 0.650 | 0.145 |
| WaSC3 | 0.936 | 0.714 | 0.222 |
| WaSC4 | 0.875 | 0.375 | 0.500 |
| WaSC5 | 0.952 | 0.640 | 0.312 |
| WaSC6 | 0.930 | 0.915 | 0.015 |
| WaSC7 | 0.841 | 0.645 | 0.196 |
| WaSC8 | 0.930 | 0.856 | 0.074 |
| WaSC9 | 1.000 | 0.100 | 0.900 |
| WaSC10 | 0.941 | 0.636 | 0.305 |
| WoC1 | 0.865 | 0.390 | 0.475 |
| WoC2 | 0.776 | 0.423 | 0.353 |
| WoC3 | 0.797 | 0.416 | 0.381 |
| WoC4 | 1.000 | 0.590 | 0.410 |
| WoC5 | 0.885 | 0.786 | 0.100 |
| WoC6 | 0.968 | 0.349 | 0.619 |
| WoC7 | 0.952 | 0.231 | 0.721 |
| Average WaSC | 0.918 | 0.597 | 0.321 |
| Average WoC | 0.892 | 0.455 | 0.437 |
| Average | 0.907 | 0.539 | 0.369 |
| Water Company | Model (3) | Model (5) | ||
|---|---|---|---|---|
| Eco-Efficiency Score () | Rank | Eco-Efficiency Score () | Rank | |
| WaSC1 | 0.905 | 3 | 0.890 | 1 |
| WaSC2 | 0.670 | 15 | 0.639 | 15 |
| WaSC3 | 0.790 | 8 | 0.767 | 8 |
| WaSC4 | 0.764 | 9 | 0.744 | 9 |
| WaSC5 | 0.870 | 4 | 0.835 | 4 |
| WaSC6 | 0.601 | 17 | 0.618 | 16 |
| WaSC7 | 0.648 | 16 | 0.591 | 17 |
| WaSC8 | 0.708 | 12 | 0.723 | 10 |
| WaSC9 | 0.907 | 2 | 0.882 | 3 |
| WaSC10 | 0.851 | 5 | 0.826 | 5 |
| WoC1 | 0.742 | 10 | 0.710 | 12 |
| WoC2 | 0.692 | 13 | 0.667 | 14 |
| WoC3 | 0.725 | 11 | 0.712 | 11 |
| WoC4 | 0.910 | 1 | 0.885 | 2 |
| WoC5 | 0.684 | 14 | 0.668 | 13 |
| WoC6 | 0.832 | 6 | 0.783 | 6 |
| WoC7 | 0.820 | 7 | 0.777 | 7 |
| Average WaSC | 0.772 | 0.752 | ||
| Average WoC | 0.772 | 0.743 | ||
| Average | 0.772 | 0.748 | ||
| Clusters | Average | Min | Max | Water Companies |
|---|---|---|---|---|
| Cluster I | 0.831 | 0.767 | 0.890 | WaSC1, WaSC3, WaSC5, WaSC9, WaSC10, WoC14, WoC16, WoC17 |
| Cluster II | 0.675 | 0.591 | 0.744 | WaSC2, WaSC4, WaSC6, WaSC7, WaSC8, WoC11, WoC12, WoC13, WoC15 |
| Variables | Coef. | Std. Err. | Z-Stat. | p-Value |
|---|---|---|---|---|
| Constant | −0.156 | 0.383 | −0.410 | 0.684 |
| % of water taken from boreholes | 0.084 | 0.070 | 1.190 | 0.234 |
| Water treatment complexity | −0.571 | 0.340 | −1.680 | 0.093 |
| % of water taken from rivers | 0.041 | 0.077 | 0.540 | 0.592 |
| Number of SW treatment works | −0.003 | 0.002 | −2.000 | 0.046 |
| Population density | −0.293 | 0.075 | −3.920 | <0.001 |
| Average pumping head | −0.001 | <0.001 | −2.690 | 0.007 |
| Year | ||||
| 2014 | 0.021 | 0.023 | 0.950 | 0.343 |
| 2015 | 0.009 | 0.023 | 0.390 | 0.694 |
| 2016 | 0.003 | 0.023 | 0.150 | 0.881 |
| 2017 | −0.007 | 0.023 | −0.310 | 0.760 |
| 2018 | −0.047 | 0.026 | −1.830 | 0.067 |
| Log-likelihood | 120.05 | |||
| X2(11) | 24.95 | |||
| Prob > X2(11) | 0.009 |
Publisher’s Note: MDPI stays neutral with regard to jurisdictional claims in published maps and institutional affiliations. |
© 2021 by the authors. Licensee MDPI, Basel, Switzerland. This article is an open access article distributed under the terms and conditions of the Creative Commons Attribution (CC BY) license (http://creativecommons.org/licenses/by/4.0/).
Share and Cite
Sala-Garrido, R.; Mocholi-Arce, M.; Molinos-Senante, M.; Smyrnakis, M.; Maziotis, A. Eco-Efficiency of the English and Welsh Water Companies: A Cross Performance Assessment. Int. J. Environ. Res. Public Health 2021, 18, 2831. https://0-doi-org.brum.beds.ac.uk/10.3390/ijerph18062831
Sala-Garrido R, Mocholi-Arce M, Molinos-Senante M, Smyrnakis M, Maziotis A. Eco-Efficiency of the English and Welsh Water Companies: A Cross Performance Assessment. International Journal of Environmental Research and Public Health. 2021; 18(6):2831. https://0-doi-org.brum.beds.ac.uk/10.3390/ijerph18062831
Chicago/Turabian StyleSala-Garrido, Ramon, Manuel Mocholi-Arce, Maria Molinos-Senante, Michail Smyrnakis, and Alexandros Maziotis. 2021. "Eco-Efficiency of the English and Welsh Water Companies: A Cross Performance Assessment" International Journal of Environmental Research and Public Health 18, no. 6: 2831. https://0-doi-org.brum.beds.ac.uk/10.3390/ijerph18062831