
Analysis of China’s Industrial Green Development Efficiency and Driving Factors: Research Based on MGWR


Abstract
:1. Introduction
1.1. Literature Review
1.1.1. Discussion about Industrial Green Development Efficiency
1.1.2. Influencing Factors of Industrial Green Development Efficiency
1.1.3. Summary
2. Materials and Methods
2.1. Research Methods
2.1.1. Super-Efficiency SBM
2.1.2. Spatial Cold/Hot Spot Analysis
2.1.3. Multiscale Geographically Weighted Regression (MGWR)
2.2. Variable Selection
2.2.1. Calculation of Industrial Green Development Efficiency
2.2.2. Influencing Factors
3. Results
3.1. Spatiotemporal Pattern and Evolution Analysis of Industrial Green Development Efficiency
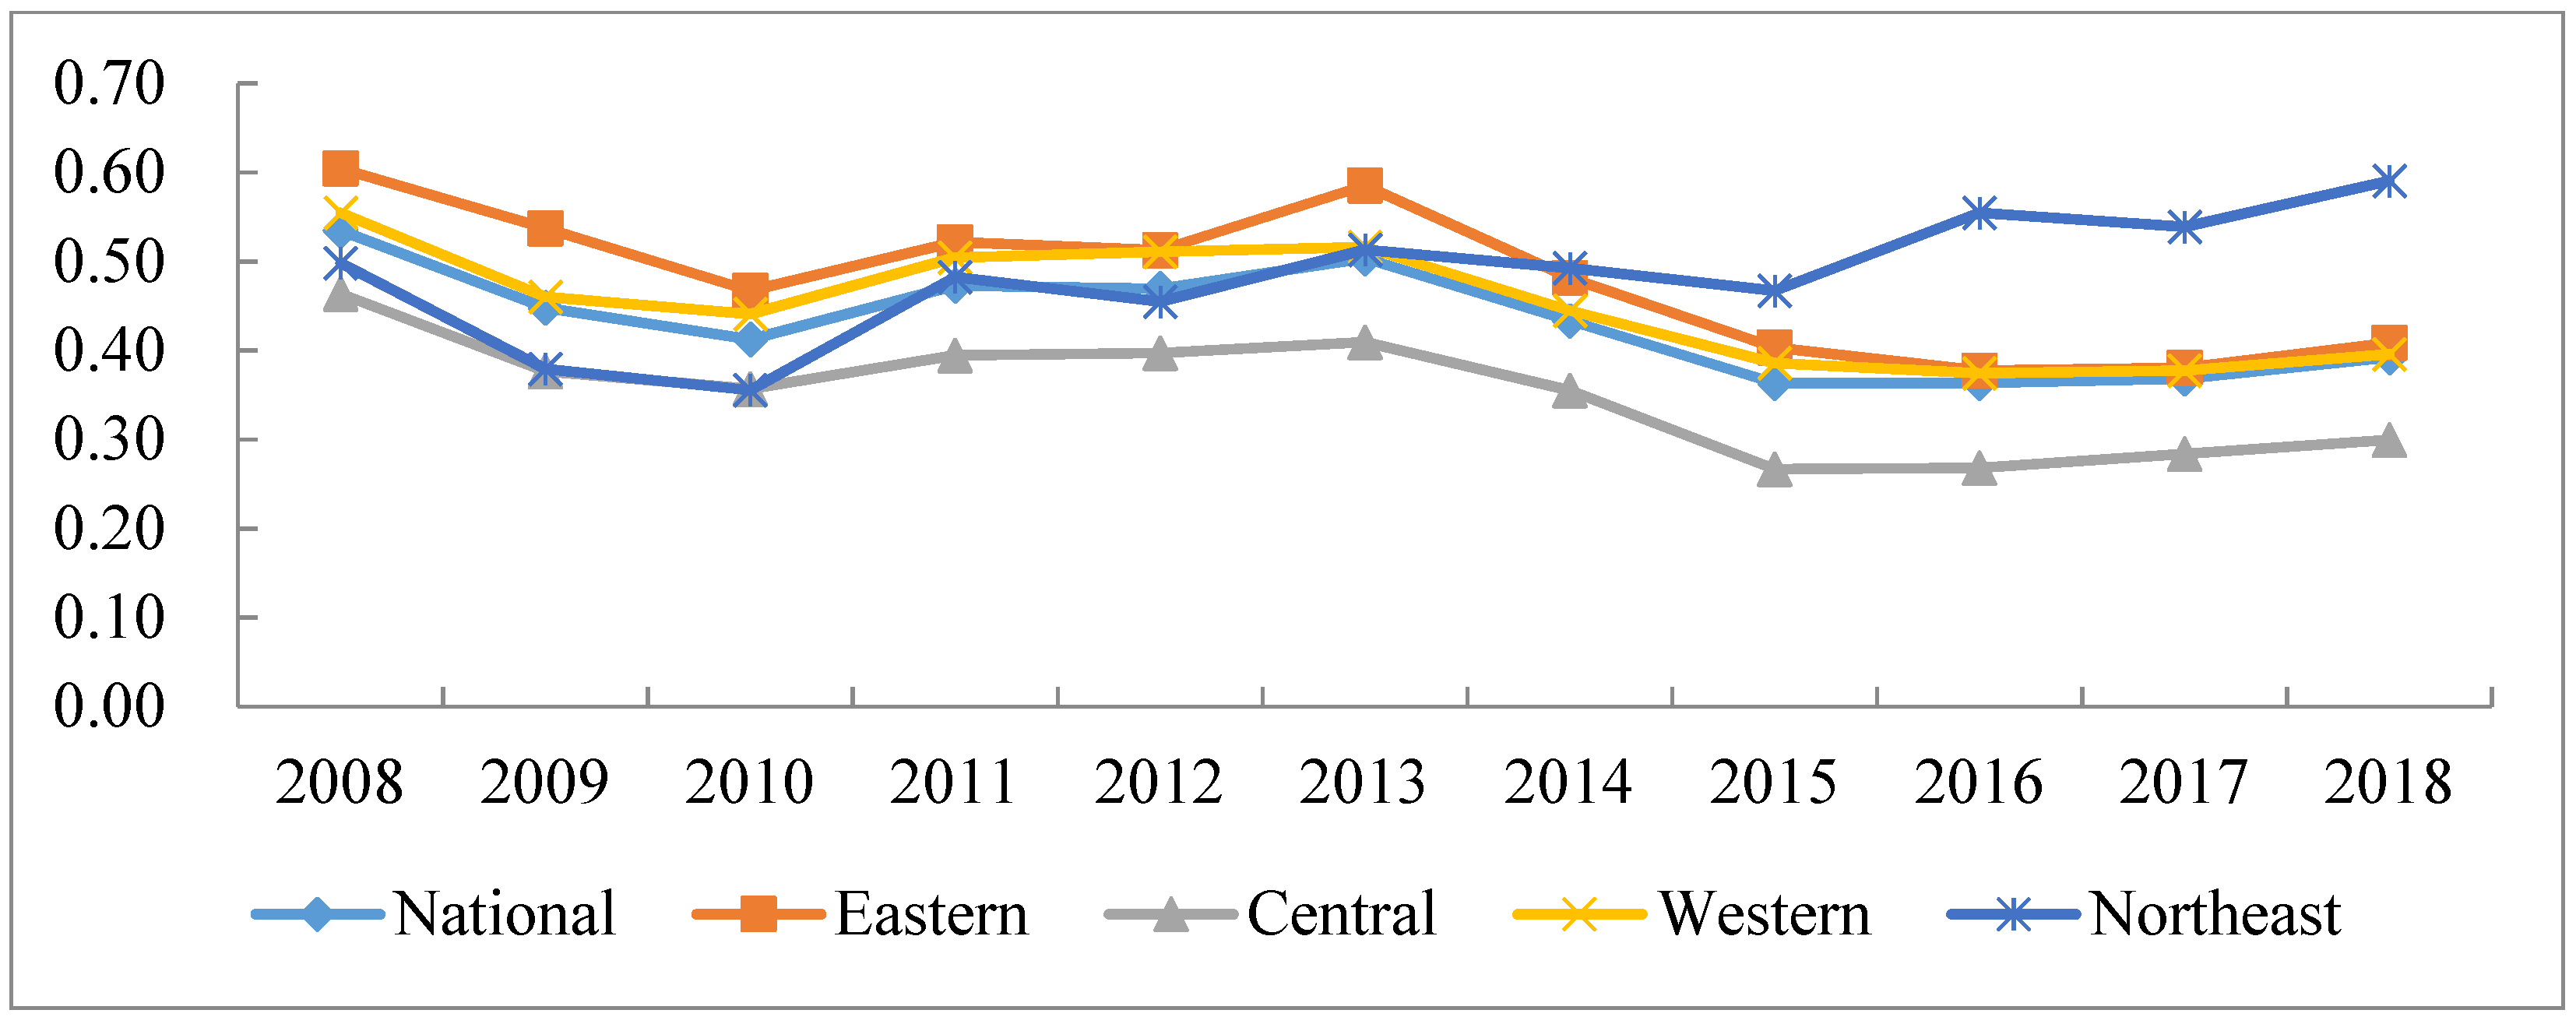
3.1.1. Analysis of Regions
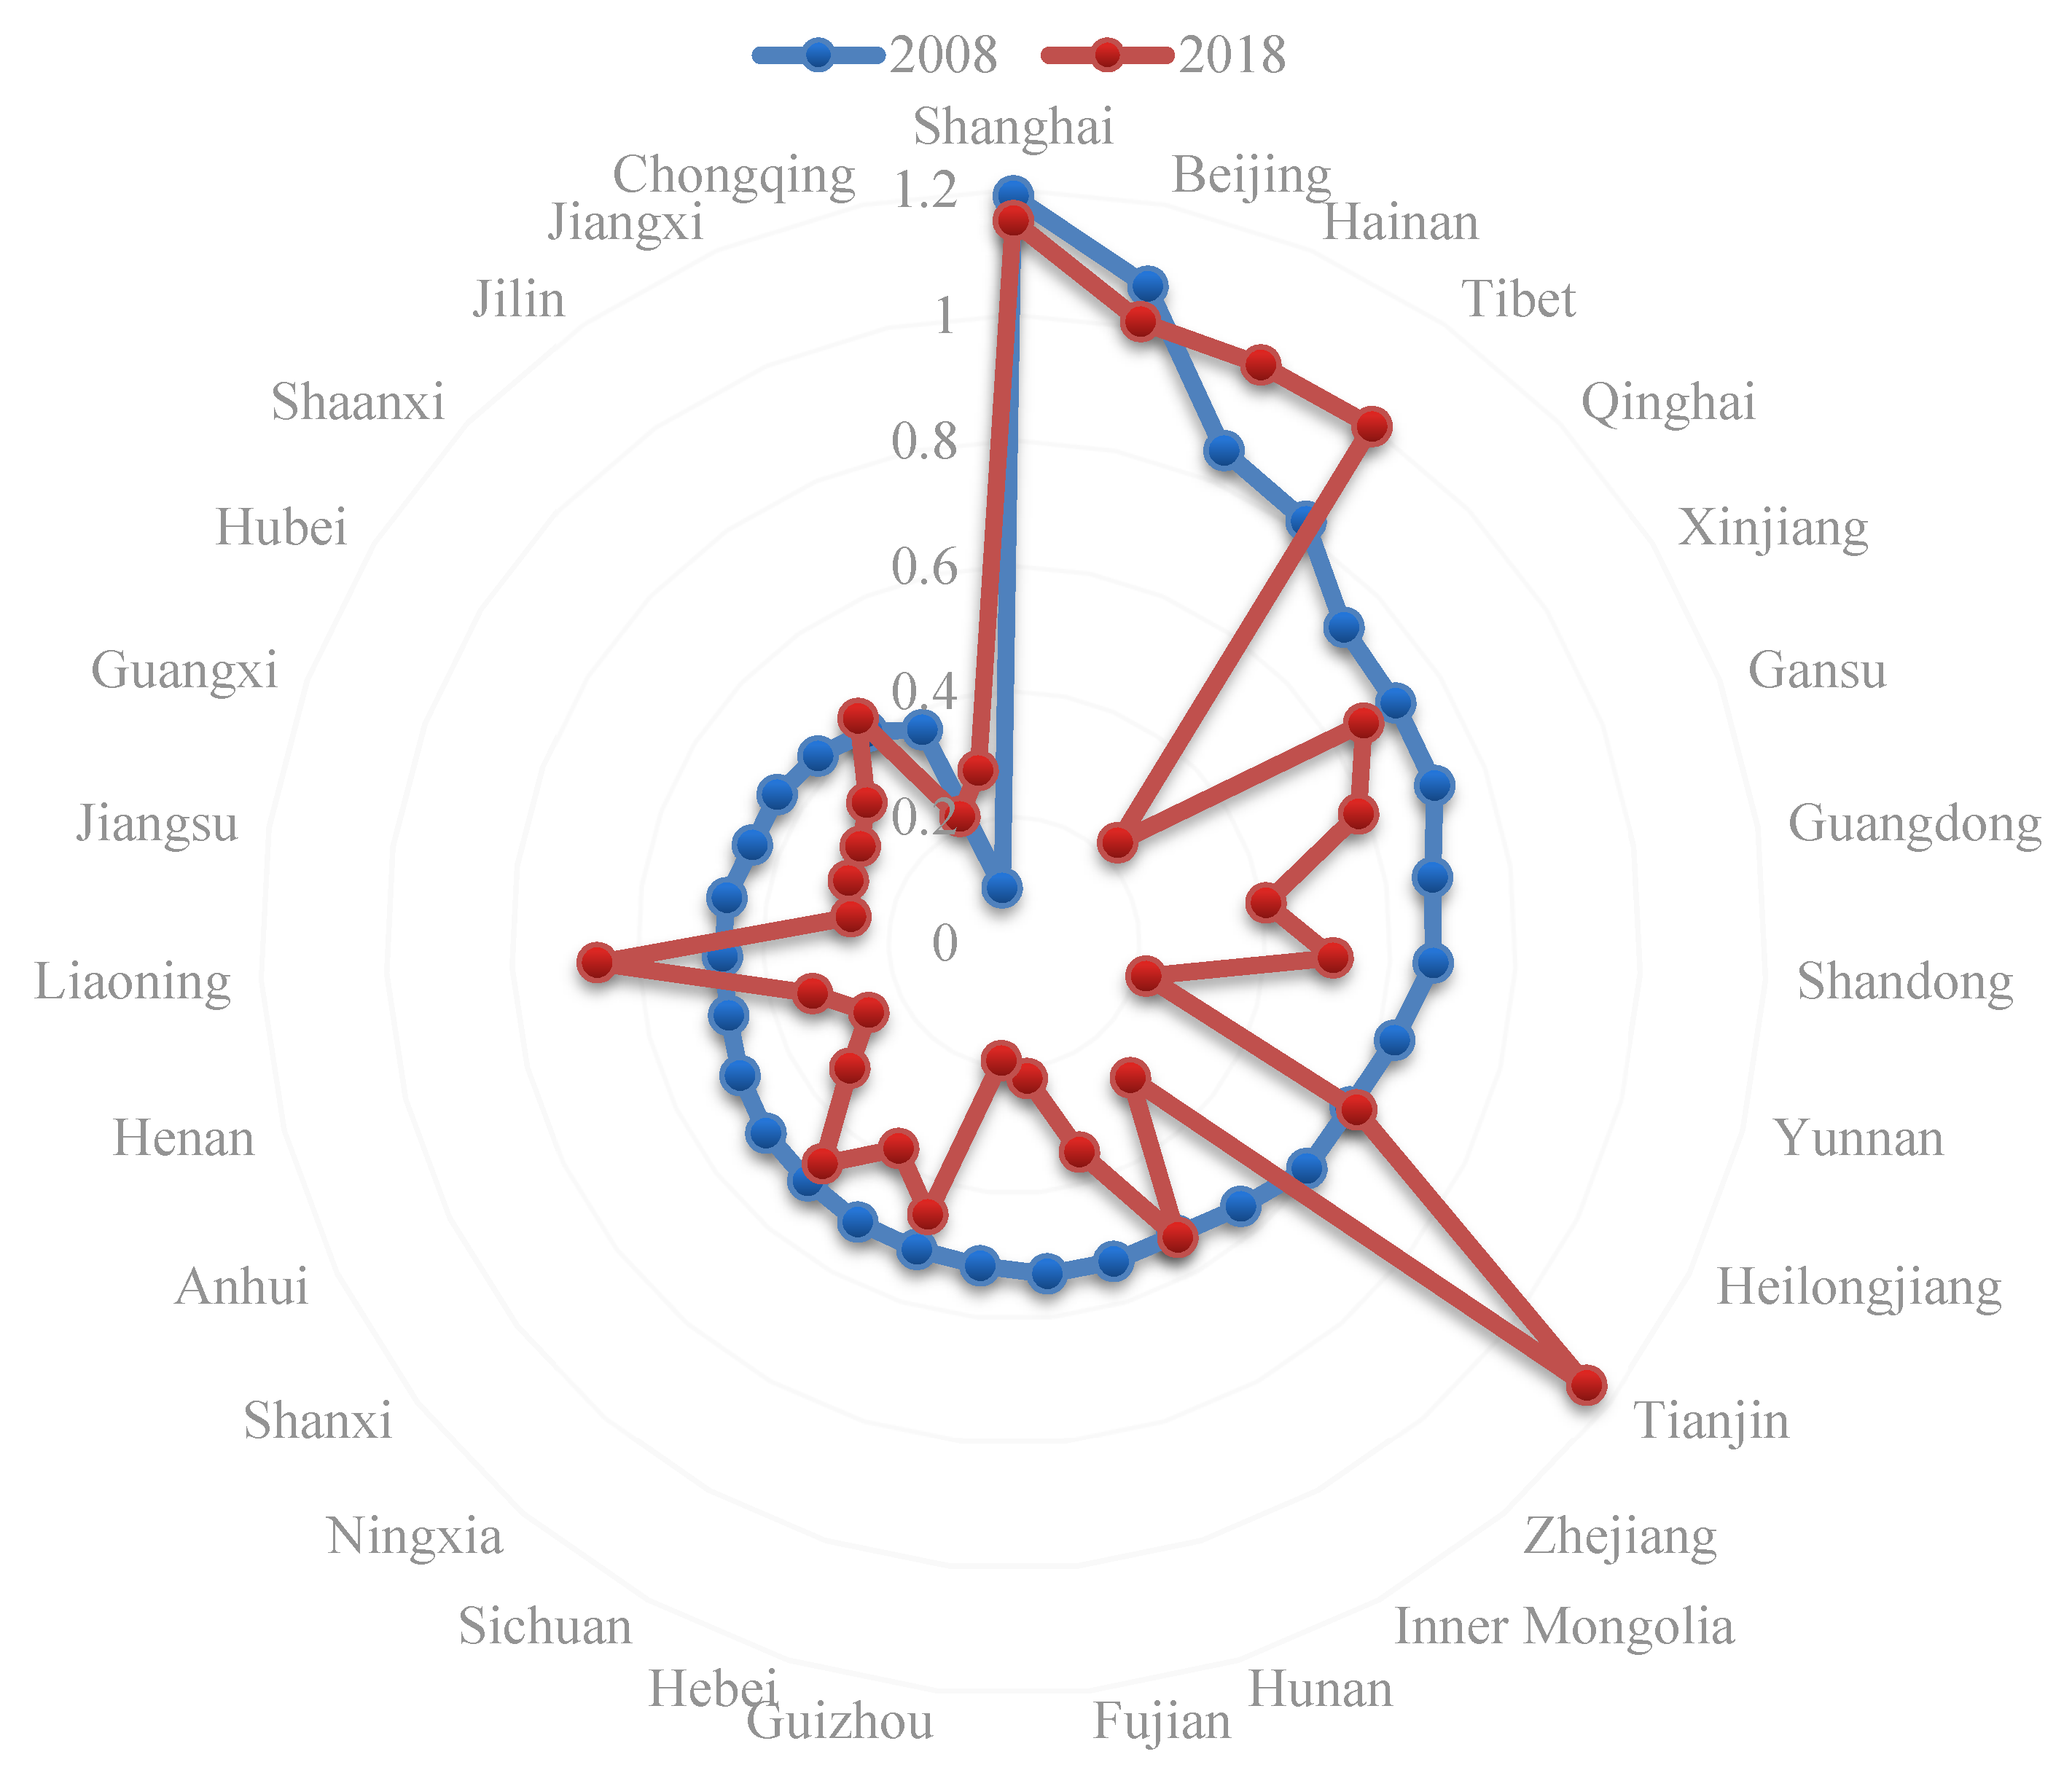
3.1.2. Analysis of Provinces
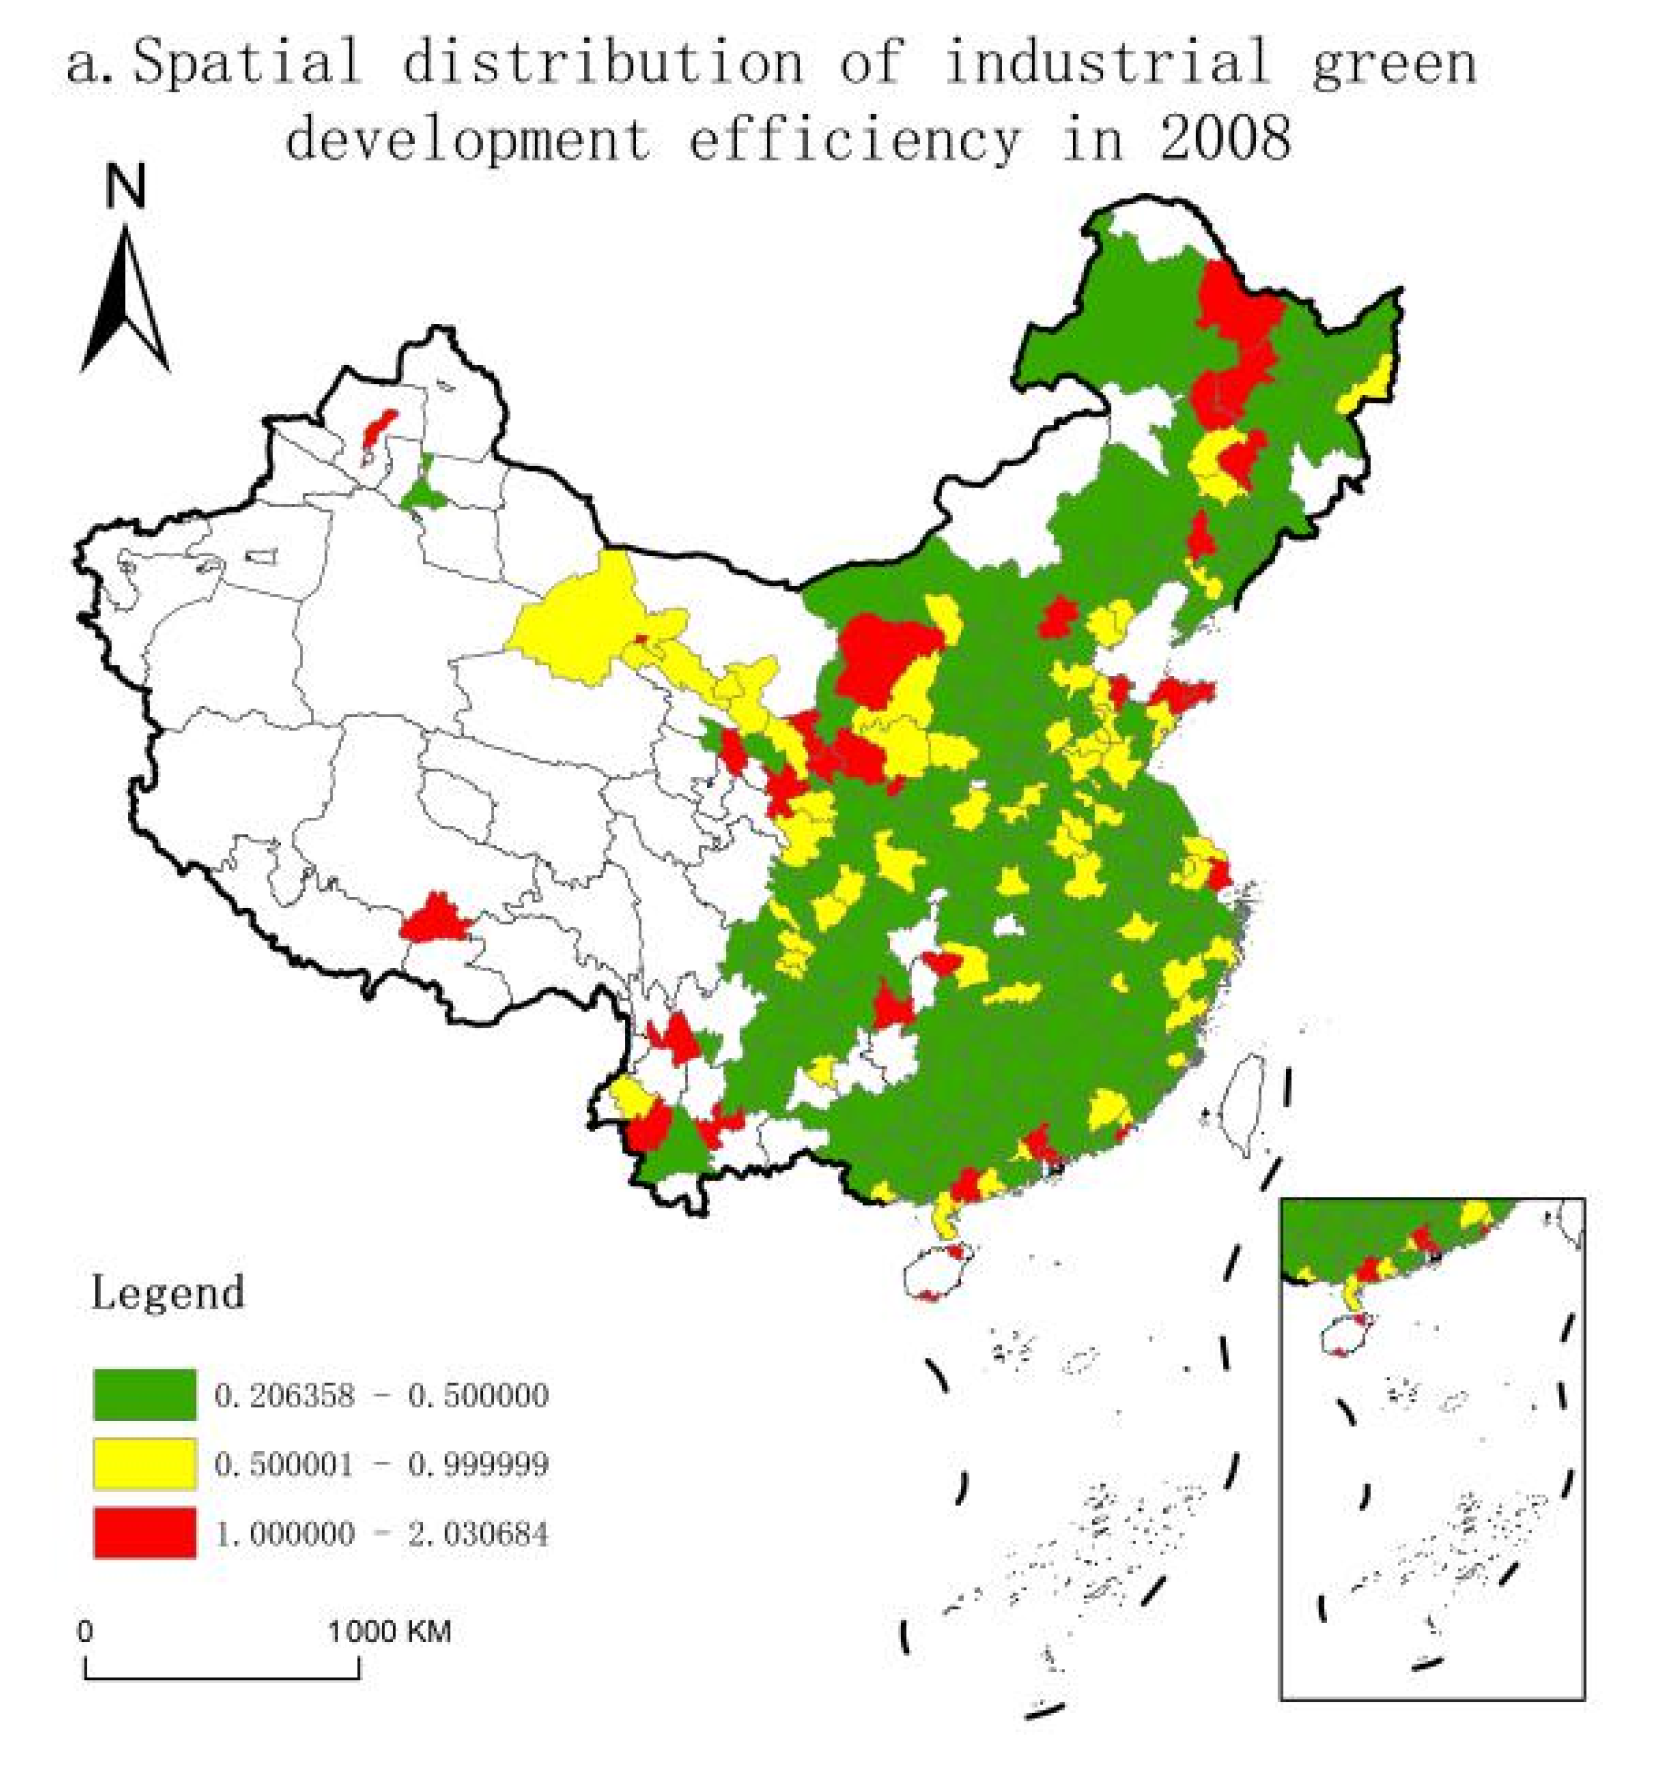
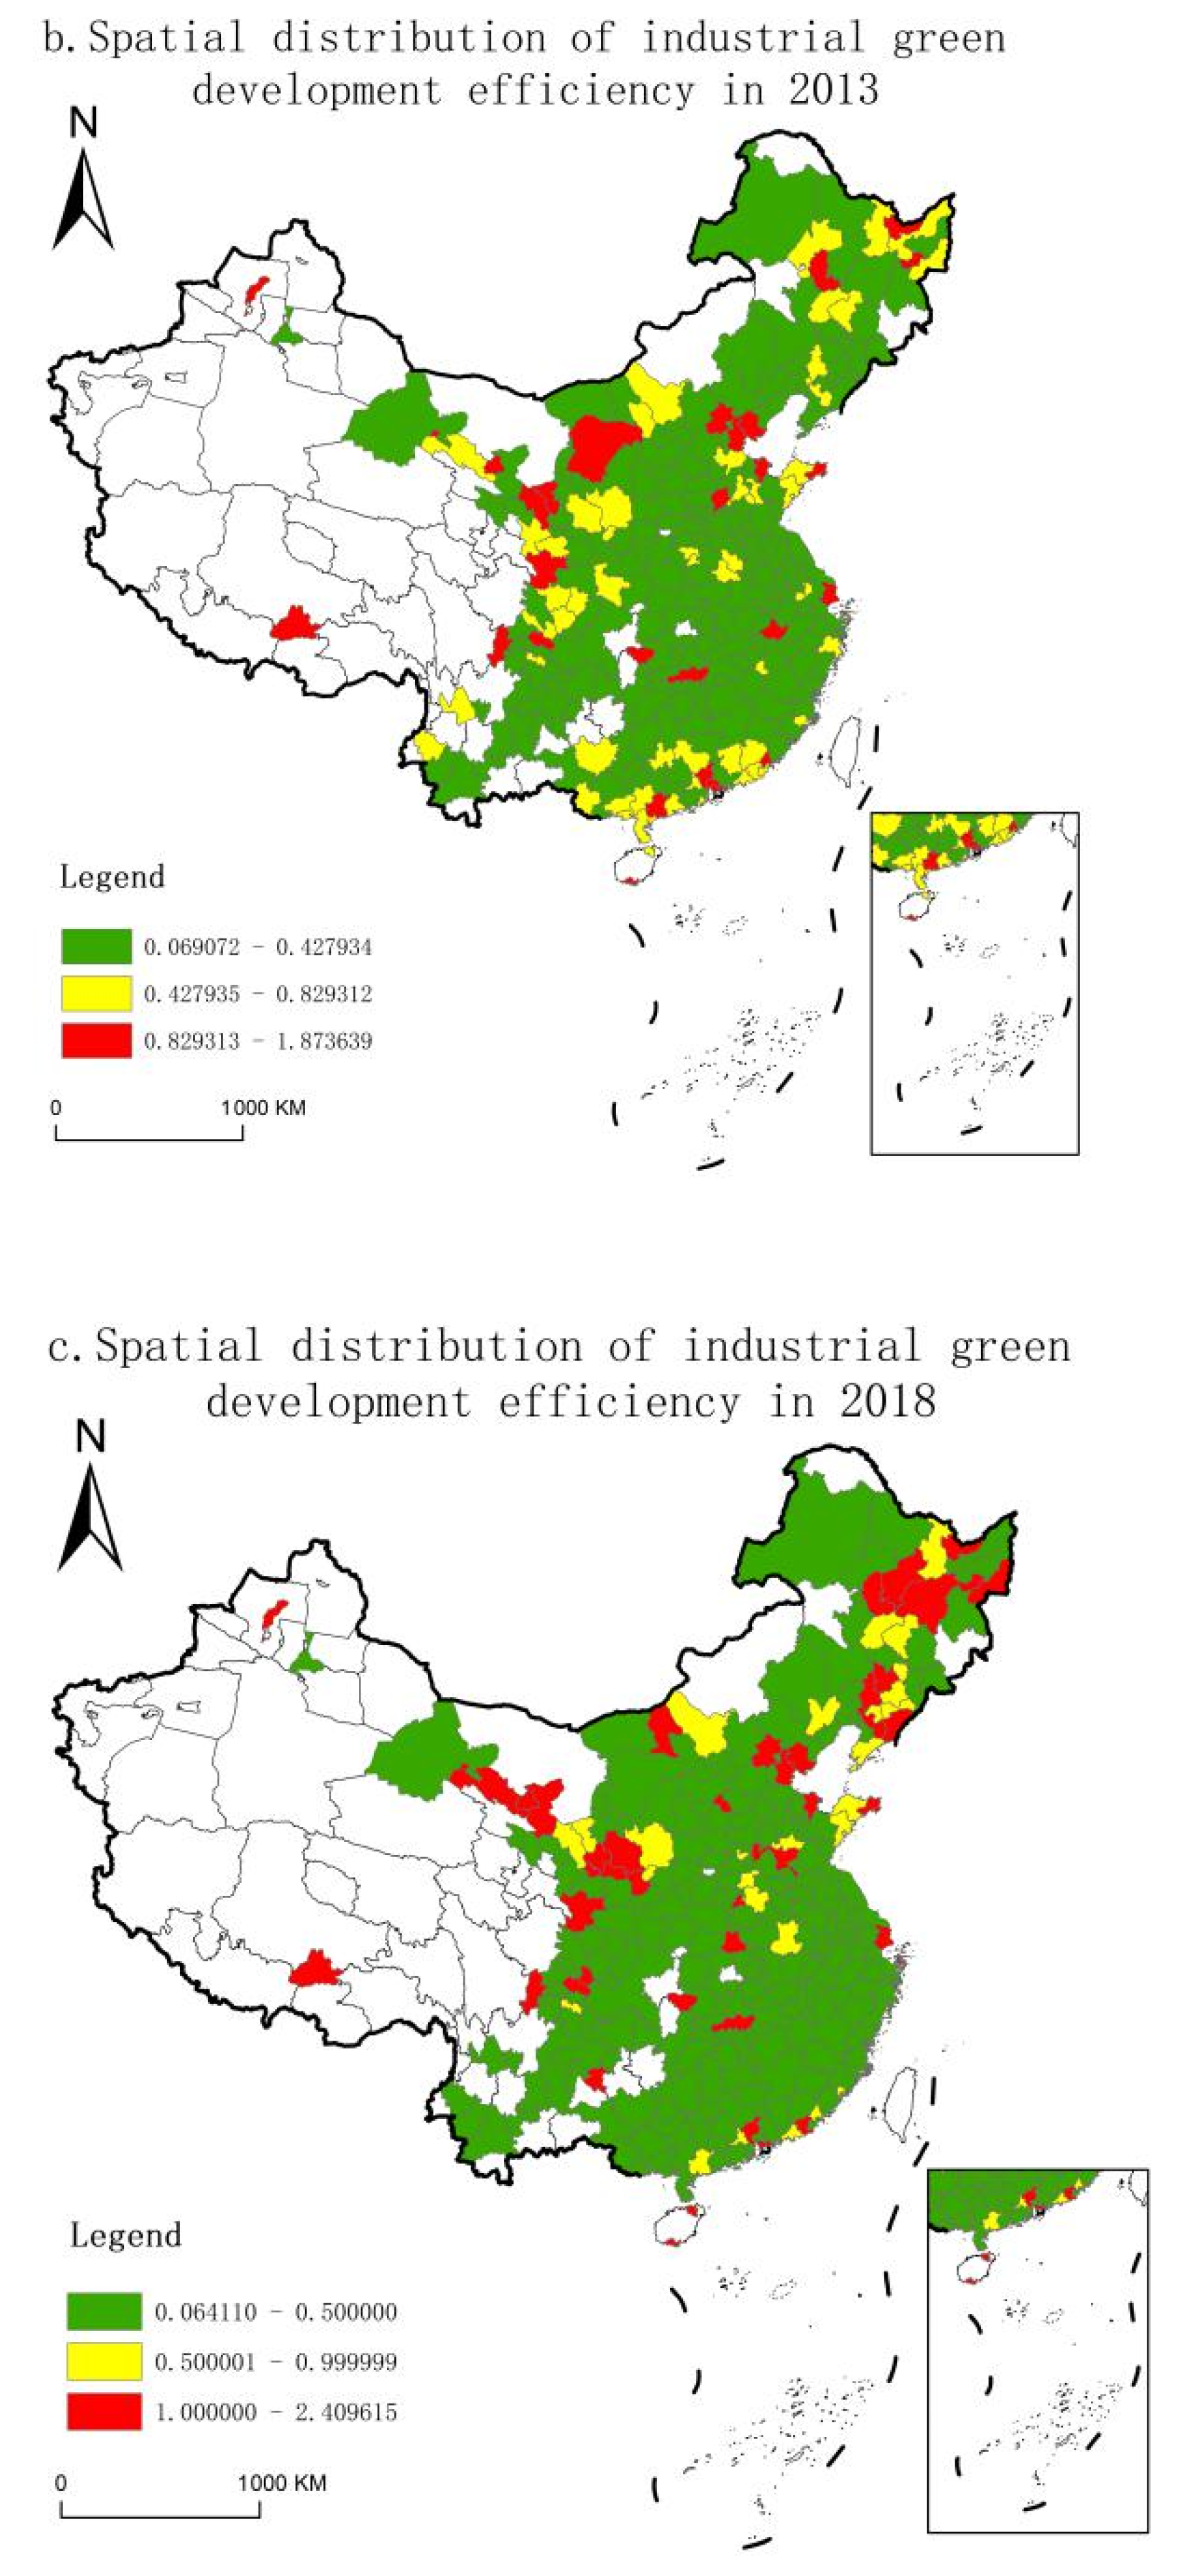
3.1.3. Analysis of Cities
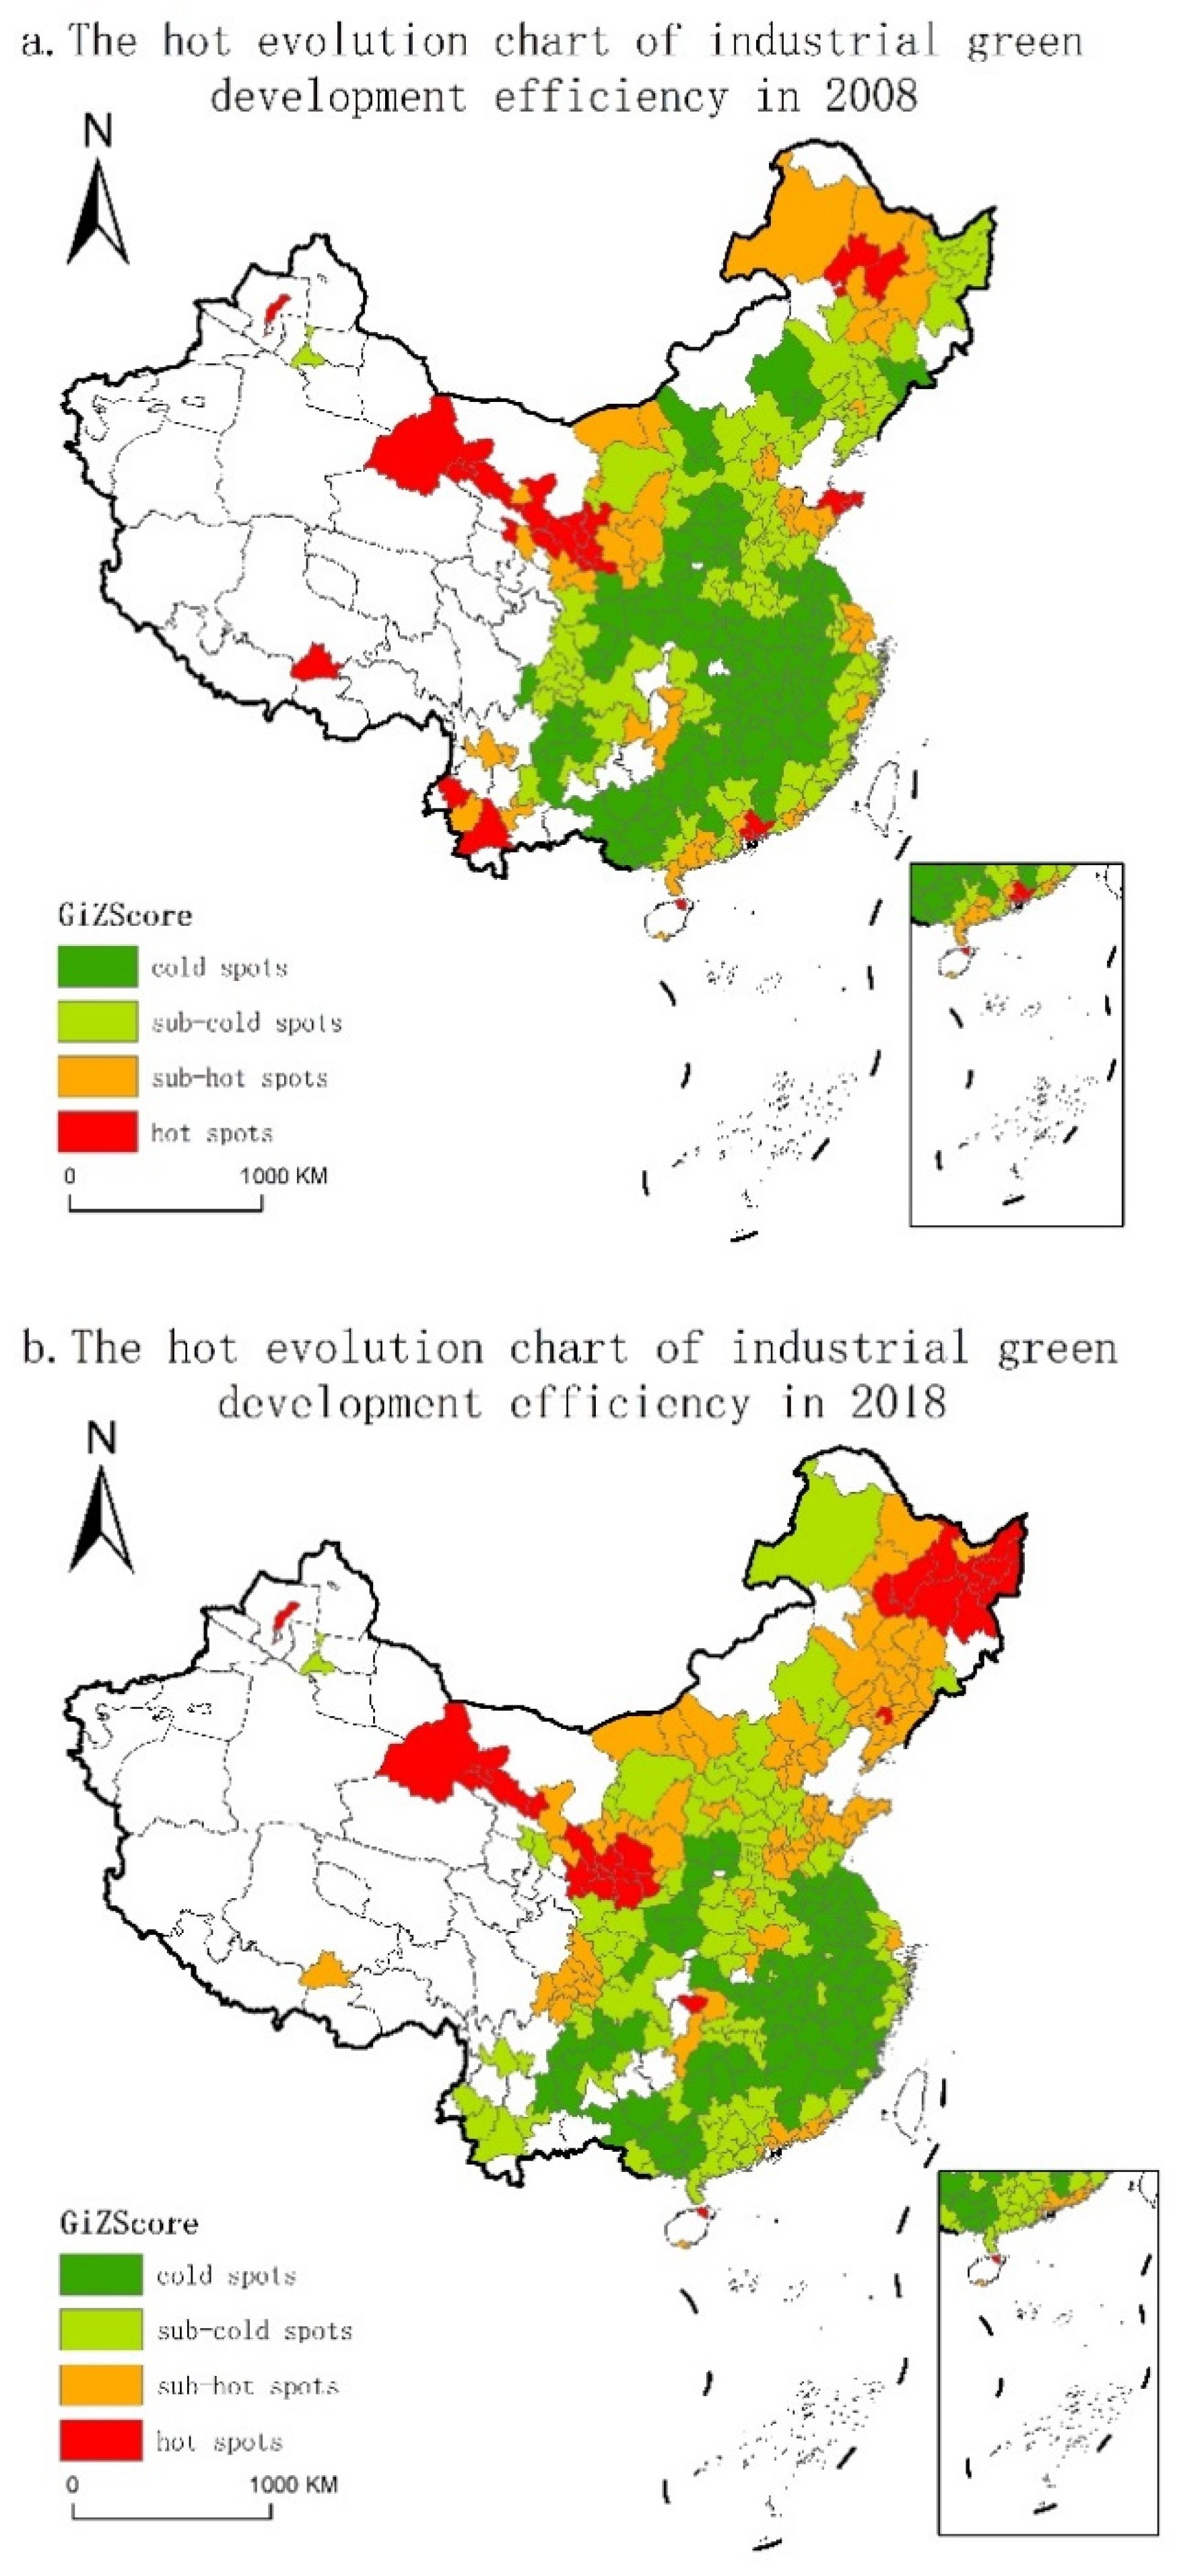
3.2. Spatial Exploration of Industrial Green Development Efficiency
3.3. Spatial Pattern Analysis of Driving Factors
3.3.1. Model Comparison
3.3.2. Scale Analysis
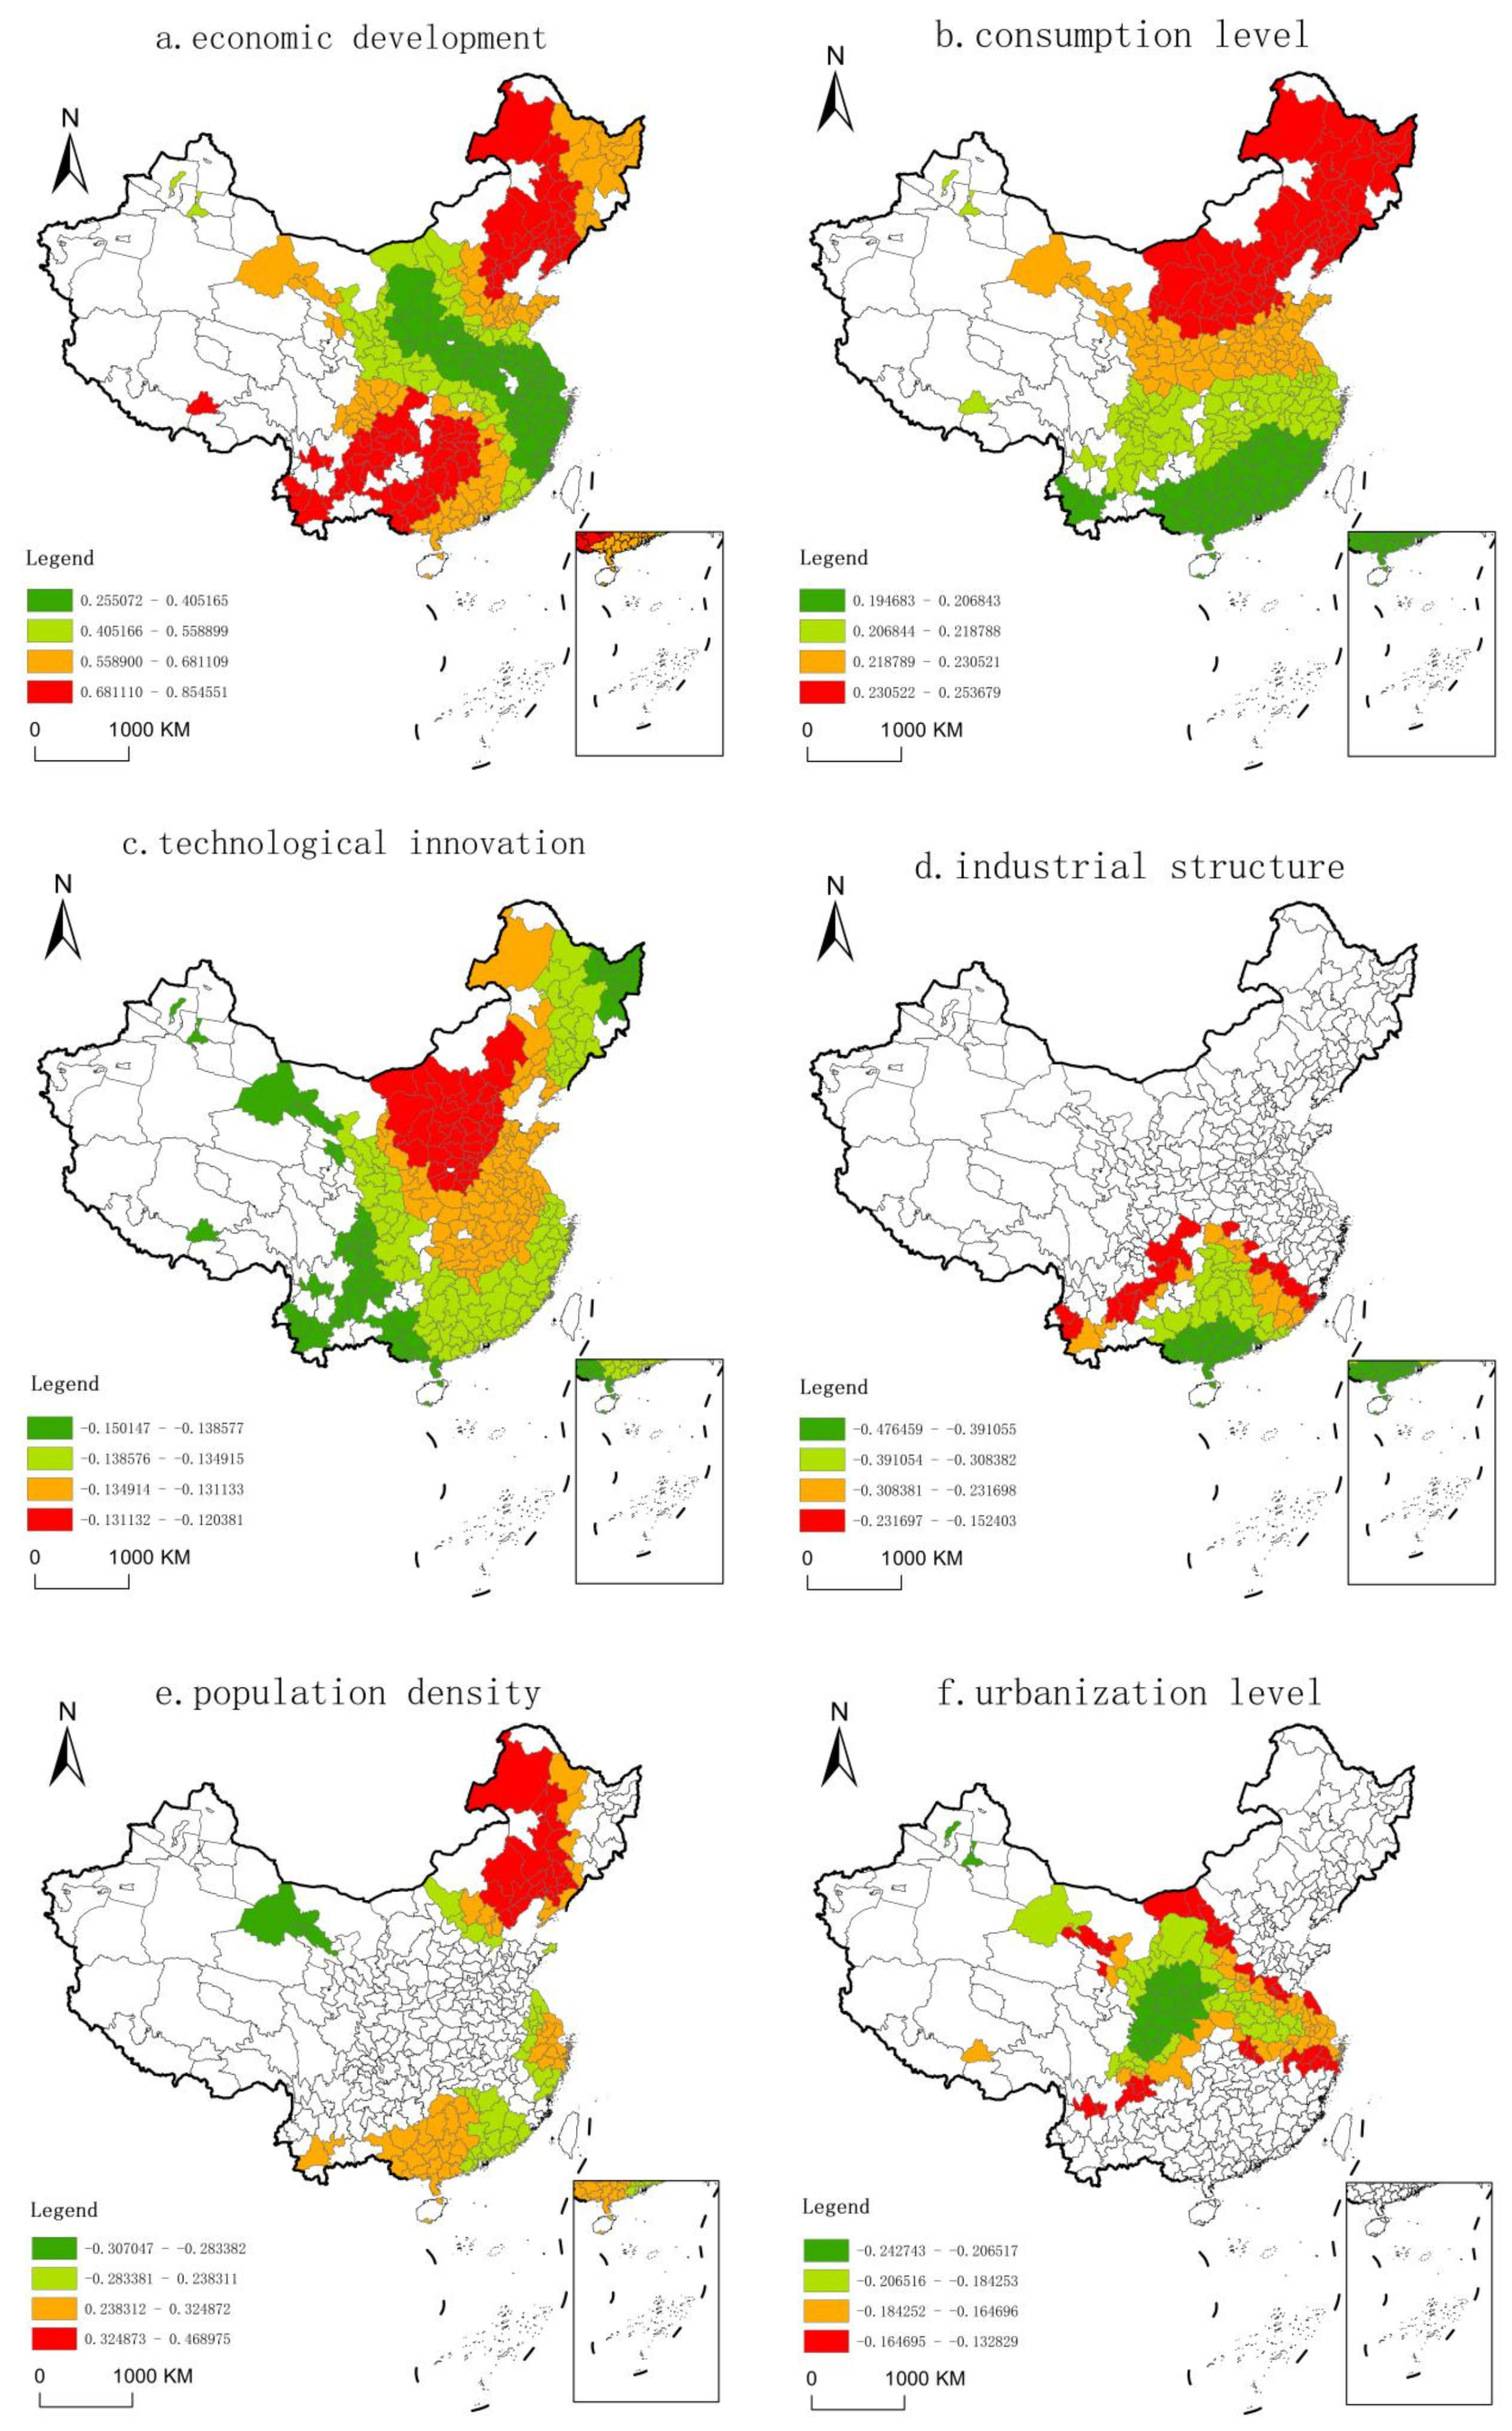
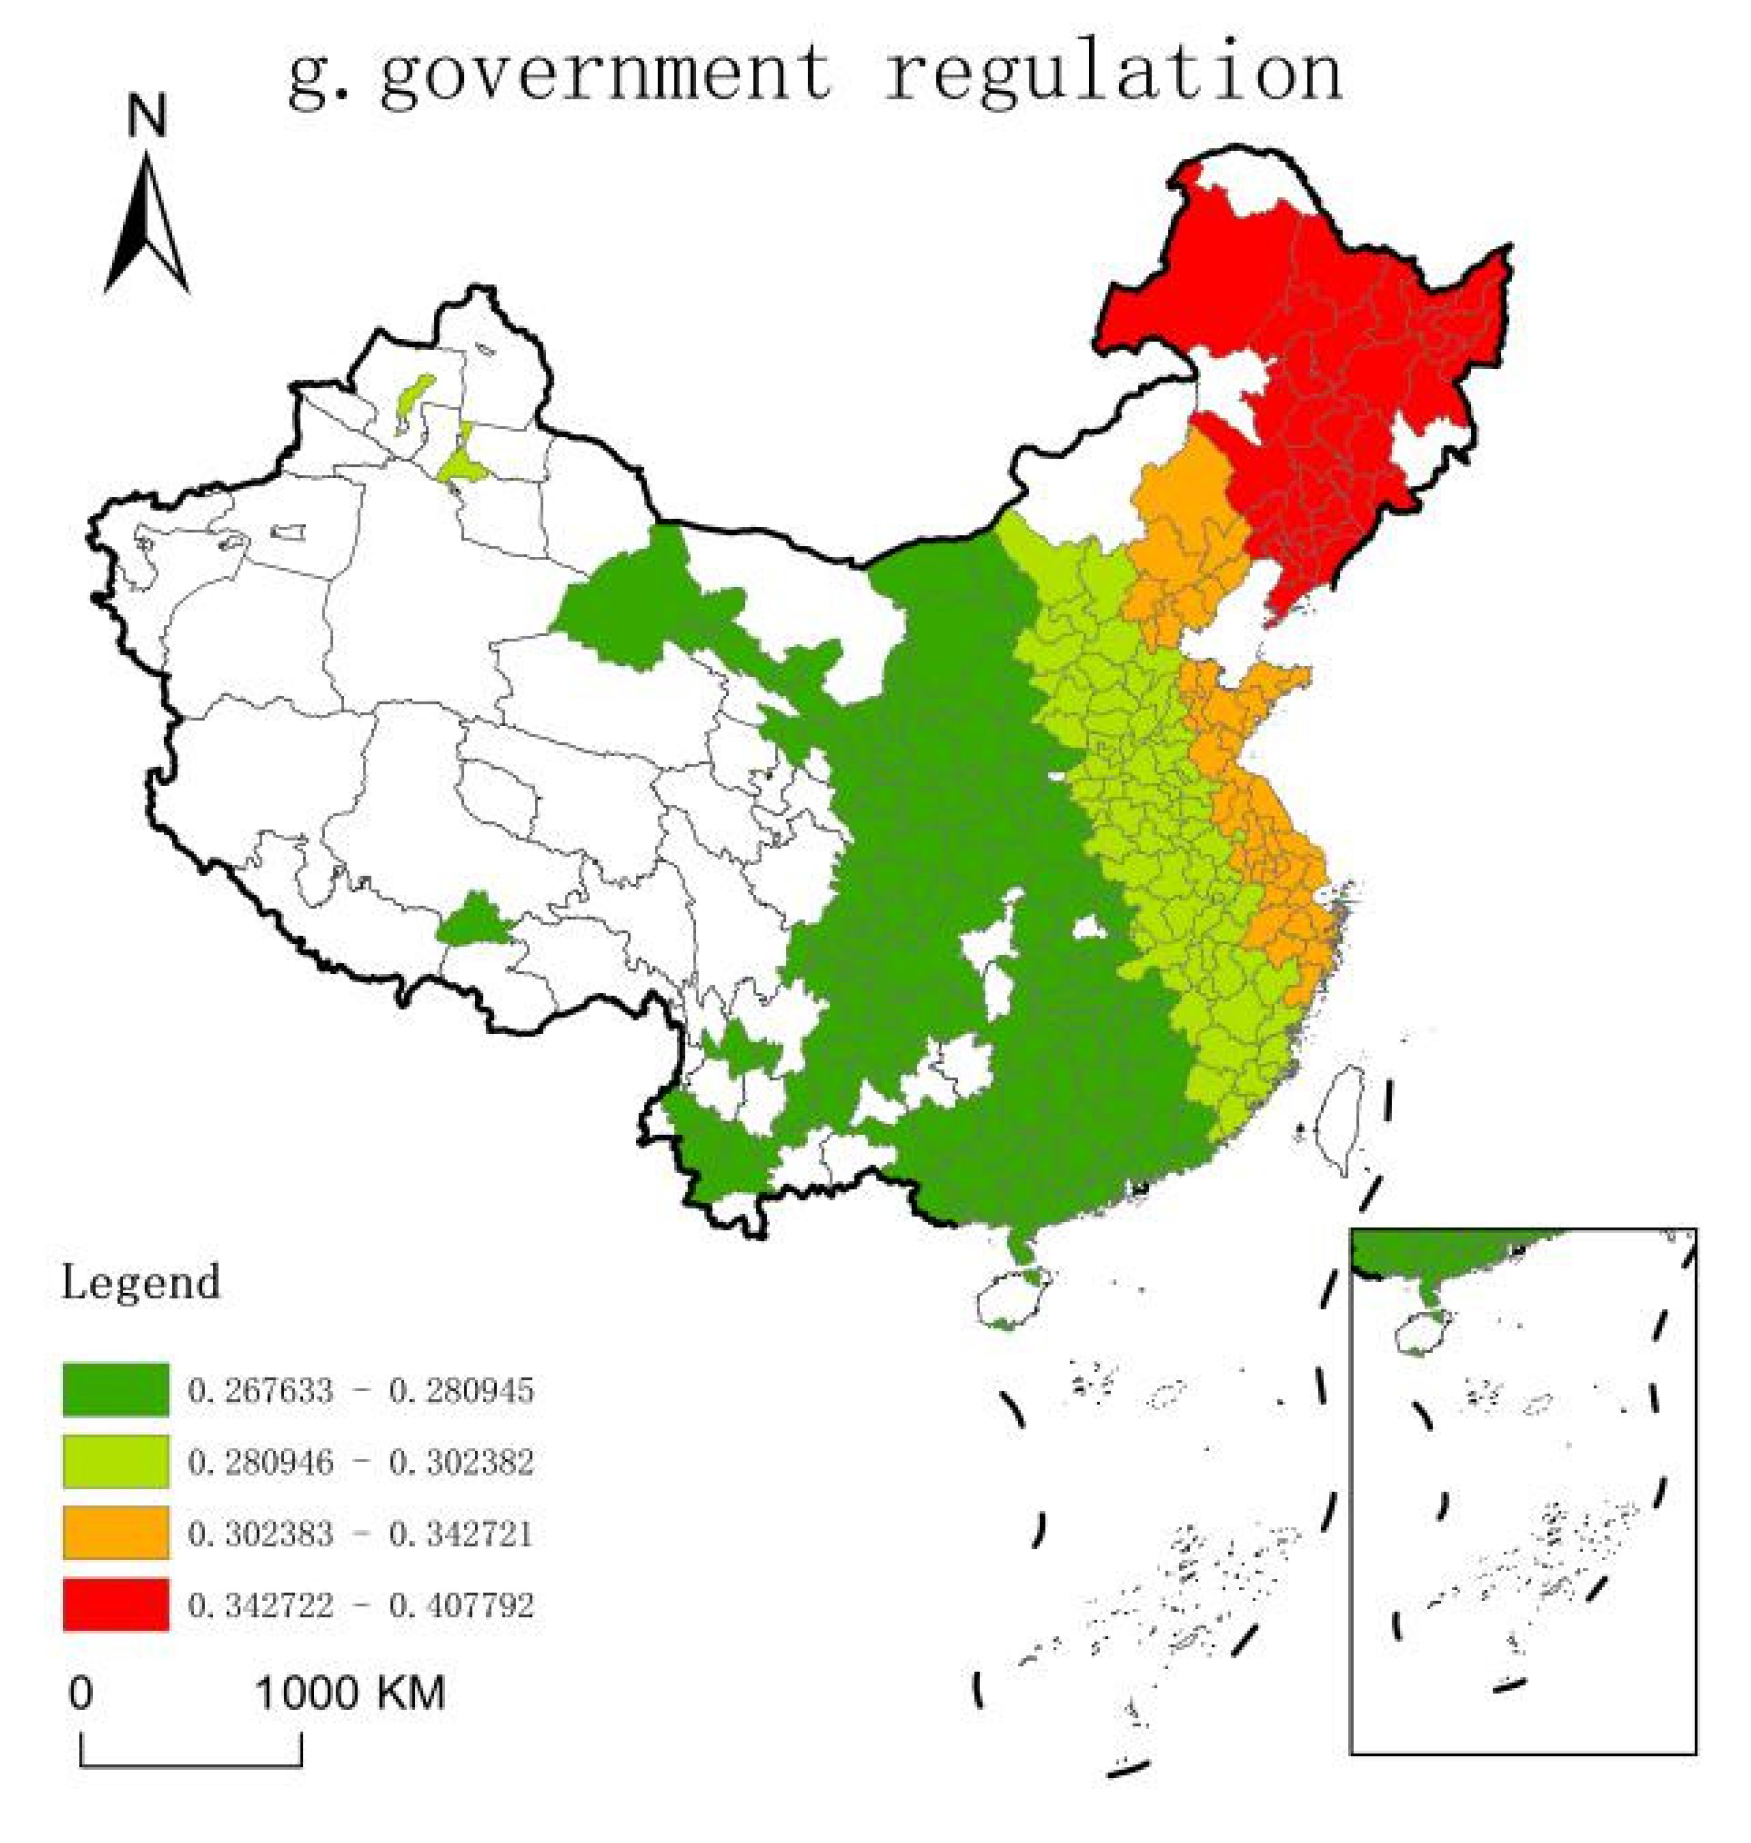
3.3.3. Spatial Pattern Analysis of Coefficients
4. Discussion
4.1. Contribution
4.2. Limitations
5. Conclusions
- (1)
- From the regional perspective, IGDE is at a low level in China. All regions showed different degrees of decline except for the northeast region, while the east and the central regions showed the most obvious decline. The ranking of IGDE was as follows: northeast > eastern > western > national > central region. From the perspective of provinces, the IGDE in 2018 increased in some provinces and decreased in others compared with 2008, presenting a “contraction” trend. This was consistent with regional changes. From the perspective of cities, from 2008 to 2018, the number of high-efficiency and low-efficiency cities increased, while that of medium-efficiency cities greatly decreased. There was a serious polarization.
- (2)
- The IGDE presented obvious positive spatial correlation. Compared with OLS and GWR, the MGWR model can better analyze the spatial heterogeneity of the influencing factors. In the MGWR regression results, all variables were significant except for openness. Technological innovation, government regulation, and consumption level belonged to the global scale, with almost no heterogeneity in space. Other influencing factors with spatial heterogeneity were urbanization, industrial structure, economic development, and population density.
- (3)
- The influences of economic development, government regulation, population density, and consumption level on IGDE were positive, while other variables were negative. In terms of the absolute value of the mean coefficient, economic development had the strongest influence, followed by government regulation and consumption level, and openness had the weakest influence. The spatial influence of economic development and technological innovation had a certain circle structure. The influence of population density was mainly concentrated in Gansu, northeast China, the Beijing–Tianjin–Hebei region, the pan-Yangtze River Delta, and the pan-Pearl River Delta. The impact of urbanization level is obvious in most provinces north of the Yangtze River, while the impact of industrial structure is mainly concentrated in most cities south of the YREB. The influence of consumption level was manifested as a distribution trend of decreasing from north to south, and the government regulation had a trend of increasing from west to east and then to northeast.
Policy Suggestions
Author Contributions
Funding
Institutional Review Board Statement
Informed Consent Statement
Data Availability Statement
Conflicts of Interest
References
- Lloyd, E.A.; Shepherd, T.G. Environmental catastrophes, climate change, and attribution. Ann. N. Y. Acad. Sci. 2020, 1469, 105–124. [Google Scholar] [CrossRef] [Green Version]
- Song, Z.G. Economic growth and carbon emissions: Estimation of a panel threshold model for the transition process in China. J. Clean. Prod. 2021, 278, 123773. [Google Scholar] [CrossRef]
- Ministry of Industry and Information Technology of the People’s Republic of China. Green Development Plan for Industry (2016–2020). Available online: https://www.miit.gov.cn/jgsj/jns/gzdt/art/2020/art_4290757b7785460795cc49f4fc3ecba4.html (accessed on 18 July 2016).
- National Bureau of Statistics. Statistical Bulletin of the People’s Republic of China on National Economic and Social Development 2019. Available online: http://www.yunfu.gov.cn/yftjj/gkmlpt/content/1/1299/post_1299760.html (accessed on 28 February 2020).
- Pearce, D.W.; Barbiere, M.A. Blueprint for A Green Economy; Routledge: London, UK; New York, NY, USA, 1989. [Google Scholar]
- Kates, R.W.; Parris, T.M.; Leiserowitz, A.A. What is sustainable development? Goals, indicators, values, and practice. Environment 2005, 47, 8–21. [Google Scholar]
- Chen, Y.; Chen, C.Y.; Hsieh, T. Exploration of sustainable development by applying green economy indicators. Environ. Monit. Assess. 2011, 182, 279–289. [Google Scholar] [CrossRef] [PubMed]
- World Bank. Inclusive Green Growth: The Pathway to Sustainable Development; Org Z: Washington, DC, USA, 2012. [Google Scholar]
- Cui, H.R.; Liu, Z.L. Spatial-Temporal Pattern and Influencing Factors of the Urban Green Development Efficiency in Jing-Jin-Ji Region of China. Pol. J. Environ. Stud. 2021, 30, 1079–1093. [Google Scholar] [CrossRef]
- Chen, C.; Wang, K.; Feng, M. Research on China’s Industrial Green Development based on the Pressure-State-Response Model. J. Sci. Ind. Res. 2020, 79, 541–546. [Google Scholar]
- Farrell, M.J. The Measurement of Productive Efficiency. J. R. Statist. Soc. 1957, 120, 253–290. [Google Scholar] [CrossRef]
- Li, P.; Tong, L.J.; Guo, Y.H.; Guo, F.Y. Spatial-temporal Characteristics of Green Development Efficiency and Influencing Factors in Restricted Development Zones: A Case Study of Jilin Province, China. Chin. Geogr. Sci. 2020, 30, 736–748. [Google Scholar] [CrossRef]
- Ramakrishnan, R. An analysis of energy consumption and carbon dioxide emissions in countries of the Middle East and North Africa. Energy 2005, 30, 2831–2842. [Google Scholar]
- Zhou, P.; Ang, B.W.; Han, J.Y. Total factor carbon emission performance: A Malmquist index analysis. Energy Econ. 2009, 32, 194–201. [Google Scholar] [CrossRef]
- Liu, Y.; Yang, J.L.; Liang, Y. Efficiency Evaluation and Equilibrium Characteristics of Green Development in Chinese urban agglomerations. Econ. Geogr. 2019, 39, 110–117. [Google Scholar]
- Liu, Z.; Zhang, H.; Zhang, Y.J. How does industrial policy affect the eco-efficiency of industrial sector? Evidence from China. Apply Energy 2020, 272, 115206. [Google Scholar] [CrossRef]
- Ezici, B.; Egilmez, G.; Gedik, R. Assessing the eco-efciency of U.S. manufacturing industries with a focus on renewable vs. nonrenewable energy use: An integrated time series MRIO and DEA approach. J. Clean. Prod. 2020, 253, 119630. [Google Scholar] [CrossRef]
- Park, J.; Park, J.M.; Park, H.S. Scaling-Up of Industrial Symbiosis in the Korean National Eco-Industrial Park Program: Examining Its Evolution over the 10 Years between 2005–2014. J. Ind. Ecol. 2019, 23, 197–207. [Google Scholar] [CrossRef] [Green Version]
- Haider, S.; Danish, M.S.; Sharma, R. Assessing energy efciency of Indian paper industry and infuencing factors: A slack-based firm-level analysis. Energy Econ. 2019, 81, 454–464. [Google Scholar] [CrossRef]
- Tenente, M.; Henriques, C.; Silva, P.P. Eco-efciency assessment of the electricity sector: Evidence from 28 European Union countries. Econ. Anal. Policy 2020, 66, 293–314. [Google Scholar] [CrossRef]
- Aigner, D.J.; Lovell, C.A.K.; Schmidt, P. Formulation and estimation of stochastic frontier production function models. J. Econom. 1977, 6, 21–37. [Google Scholar] [CrossRef]
- Battese, G.E.; Coelli, T.J. Prediction of farm-level technical efficiencies with a generalized frontier production function and panel data. J. Econom. 1988, 38, 387–399. [Google Scholar] [CrossRef]
- Chen, W.; Ning, S.Y.; Chen, W.J.; Liu, E.N.; Wang, Y.N.; Zhao, M.J. Spatial-temporal characteristics of industrial land green efficiency in China: Evidence from prefecture-level cities. Ecol. Indic. 2020, 113, 106256. [Google Scholar] [CrossRef]
- Liu, R.Y.; Wang, D.Q.; Zhang, L.; Zhang, L.H. Can green financial development promote regional ecological efficiency? A case study of China. Nat. Hazards 2019, 95, 325–341. [Google Scholar] [CrossRef]
- Gao, Y.; Tsai, S.B.; Xue, X.Q.; Ren, T.Z.; Du, X.M.; Chen, Q.; Wang, J.T. An Empirical Study on Green Innovation Efficiency in the Green Institutional Environment. Sustainability 2018, 10, 724. [Google Scholar] [CrossRef] [Green Version]
- Fu, J.P.; Xiao, G.R.; Guo, L.L.; Wu, C.Y. Measuring the Dynamic Efficiency of Regional Industrial Green Transformation in China. Sustainability 2018, 10, 628. [Google Scholar] [CrossRef] [Green Version]
- Guo, Y.H.; Tong, L.J.; Mei, L. The effect of industrial agglomeration on green development efficiency in Northeast China since the revitalization. J. Clean. Prod. 2020, 258, 2584. [Google Scholar] [CrossRef]
- Zhu, B.Z.; Zhang, M.F.; Zhou, Y.H.; Wang, P.; Sheng, J.C.; He, K.J.; Wei, Y.M.; Xie, R. Exploring the effect of industrial structure adjustment on interprovincial green development efficiency in China: A novel integrated approach. Energy Policy 2019, 134, 110946. [Google Scholar] [CrossRef]
- Wang, X.Q.; Wu, Q.M.; Majeed, S.; Sun, D.H. Fujian’s Industrial Eco-Efficiency: Evaluation Based on SBM and the Empirical Analysis of lnfluencing Factors. Sustainability 2018, 10, 3333. [Google Scholar] [CrossRef] [Green Version]
- Lu, Y.Y.; Cao, B.; Hua, Y.D.; Ding, L. Efficiency Measurement of Green Regional Development and Its Influencing Factors: An Improved Data Envelopment Analysis Framework. Sustainability 2020, 12, 4361. [Google Scholar] [CrossRef]
- Sun, Z.Q.; Sun, T. Financial Development, Industrial Structure Optimization, and Eco-efficiency Promotion. Fresenius Environ. Bull. 2019, 28, 6231–6238. [Google Scholar]
- Tone, K.A. slacks-based measure of super-efficiency in data envelopment analysis. Eur. J. Oper. Res. 2002, 143, 32–41. [Google Scholar] [CrossRef] [Green Version]
- Liu, K.; Qiao, Y.R.; Shi, T.; Zhou, Q. Study on coupling coordination and spatiotemporal heterogeneity between economic development and ecological environment of cities along the Yellow River Basin. Environ. Sci. Pollut. Res. 2020, 28, 6898–6912. [Google Scholar] [CrossRef] [PubMed]
- Shen, T.Y.; Yu, H.C.; Zhou, L.; Gu, H.Y.; He, H.H. Influence Mechanism of Second-hand Housing Price in Beijing—A Study based on Multi-scale Geo-weighted Regression Model (MGWR). Econ. Geogr. 2020, 40, 75–83. [Google Scholar]
- Huang, L.; Wu, C.Q. Study on urban industrial green development efficiency and its spatial driving mechanism in the Yangtze River Economic Belt. China Popul. Resour. Environ. 2019, 29, 40–49. [Google Scholar]
- Wang, K.L.; Huang, Q.Q.; Meng, X.R. Industrial ecological efficiency of mining cities based on environmental pressure. Syst. Eng. 2017, 35, 36–44. [Google Scholar]
- Ott, I.; Soretz, S. Green Attitude and Economic Growth. Environ. Resour. Econ. 2018, 70, 757–779. [Google Scholar] [CrossRef] [Green Version]
- Wang, G.; Liu, S. Is technological innovation the effective way to achieve the “double dividend” of environmental protection and industrial upgrading? Environ. Sci. Pollut. Res. 2020, 7, 18541–18556. [Google Scholar] [CrossRef] [PubMed]
- Xie, H. Spatial Heterogeneity Strategies for Pollution Agglomeration Control in China: Based on the Coordination Between Industrialization and Urbanization. Arab. J. Geosci. 2020, 13, 1003. [Google Scholar] [CrossRef]
- Eriksson, C.; Zehaie, F. Population Density, Pollution and Growth. Environ. Resource. Econ. 2005, 30, 465–484. [Google Scholar] [CrossRef]
- Kolomak, E.A. Assessment of the urbanization impact on economic growth in Russia. Reg. Res. Russ. 2012, 2, 292–299. [Google Scholar] [CrossRef]
- Liu, C.; Ma, C.; Xie, R. Structural, Innovation and Efficiency Effects of Environmental Regulation: Evidence from China’s Carbon Emissions Trading Pilot. Environ. Resource. Econ. 2020, 75, 741–768. [Google Scholar] [CrossRef]
- Wang, Z.Y.; Zhang, M.Y.; Wang, Y.X.; Fan, Y.X. Spatial and temporal Differentiation of China’s Marine economic elasticity and analysis of influencing Factors. Econ. Geogr. 2019, 39, 139–145. [Google Scholar]
- Lee, J. The contribution of foreign direct investment to clean energy use, carbon emissions and economic growth. Energy Policy 2013, 55, 483–489. [Google Scholar] [CrossRef]
- Wang, X.; Li, Y. Research on measurement and improvement path of industrial green development in China: A perspective of environmental welfare efficiency. Environ. Sci. Pollut. Res. 2020, 27, 42738–42749. [Google Scholar] [CrossRef] [PubMed]
- Qiu, F.; Chen, Y.; Tan, J.; Liu, J.; Zheng, Z.; Zhang, X. Spatial-temporal Heterogeneity of Green Development Efficiency and Its Influencing Factors in Growing Metropolitan Area: A Case Study for the Xuzhou Metropolitan Area. Chin. Geogr. Sci. 2020, 30, 352–365. [Google Scholar] [CrossRef]
- Chen, Y.; Zhu, B.; Sun, X.; Xu, G. Industrial environmental efficiency and its influencing factors in China: Analysis based on the Super-SBM model and spatial panel data. Environ. Sci. Pollut. Res. 2020, 27, 44267–44278. [Google Scholar] [CrossRef] [PubMed]
- Alam, M.S.; Atif, M.; Chien-Chi, C.; Soytaş, U. Does corporate R&D investment affect firm environmental performance? Evidence from G-6 countries. Energy Econ. 2019, 78, 401–411. [Google Scholar]
- Shen, Y.; Sun, S.; Yue, S.; Sun, X. Ecological development efficiency index of tropics and subtropics in China. Environ. Sci. Pollut. Res. 2020, 27, 14160–14174. [Google Scholar] [CrossRef]
- Wang, J.; Zhao, T.; Zhang, X. Environmental assessment and investment strategies of provincial industrial sector in China: Analysis based on DEA model. Environ. Impact Asses. 2016, 60, 56–168. [Google Scholar] [CrossRef]
- Yang, G.; Zhang, F.; Zhang, F.; Ma, D.; Gao, L.; Chen, Y.; Luo, Y.; Yang, Q. Spatiotemporal changes in efficiency and influencing factors of China’s industrial carbon emissions. Environ. Sci. Pollut. Res. 2021. [Google Scholar] [CrossRef]


| Target Layer | Rule Layer | Factor Layer | Index Layer |
|---|---|---|---|
| Input–output index system of IGDE | Input | Labor input | Quantity of employment |
| Capital input | Fixed investments | ||
| Desirable Output | Industrial output value | The added value of three industries | |
| Undesirable Output | Wastewater | The discharge of industrial waste water | |
| Waste gas | The discharge of industrial SO2 | ||
| Waste residue | The discharge of industrial smoke and dust |
| IGDE Values | 2008 | 2009 | 2010 | 2011 | 2012 | 2013 | 2014 | 2015 | 2016 | 2017 | 2018 |
|---|---|---|---|---|---|---|---|---|---|---|---|
| National | 0.5346 | 0.4478 | 0.4125 | 0.4728 | 0.4695 | 0.5033 | 0.4335 | 0.3634 | 0.3633 | 0.3682 | 0.3925 |
| Eastern | 0.6044 | 0.5369 | 0.4671 | 0.5217 | 0.5127 | 0.5850 | 0.4814 | 0.4032 | 0.3773 | 0.3806 | 0.4083 |
| Central | 0.4637 | 0.3767 | 0.3567 | 0.3946 | 0.3973 | 0.4095 | 0.3550 | 0.2666 | 0.2679 | 0.2840 | 0.2995 |
| Western | 0.5545 | 0.4602 | 0.4410 | 0.5043 | 0.5109 | 0.5161 | 0.4450 | 0.3856 | 0.3746 | 0.3773 | 0.3959 |
| Northeast | 0.4981 | 0.3792 | 0.3554 | 0.4825 | 0.4550 | 0.5129 | 0.4926 | 0.4670 | 0.5546 | 0.5387 | 0.5904 |
| Model Indices | MGWR | GWR | OLS |
|---|---|---|---|
| R2 | 0.617 | 0.579 | 0.426 |
| AICc | 641.407 | 647.581 | 680.373 |
| Residual Sum of Squares (RSS) | 115.910 | 116.459 | 165.809 |
| Number of effective parameters | 36.035 | 44.052 | / |
| Variable | The Bandwidth of MGWR | The Bandwidth of GWR |
|---|---|---|
| Constant term | 118 | 140 |
| Economic development. | 92 | 140 |
| Consumption level | 287 | 140 |
| Technological innovation | 288 | 140 |
| Industrial structure | 131 | 140 |
| Population density | 82 | 140 |
| Urbanization level | 167 | 140 |
| Government regulation | 276 | 140 |
| Openness | 288 | 140 |
| Variable | Min | Median | Max | Mean | Standard Deviation |
|---|---|---|---|---|---|
| Constant term | −0.286 | −0.036 | 0.399 | −0.021 | 0.158 |
| Economic development | 0.253 | 0.600 | 0.855 | 0.549 | 0.162 |
| Consumption level | 0.195 | 0.219 | 0.254 | 0.219 | 0.013 |
| Technological innovation | −0.150 | −0.135 | −0.120 | −0.135 | 0.004 |
| Industrial structure | −0.476 | −0.056 | 0.103 | −0.107 | 0.150 |
| Population density | −0.307 | 0.148 | 0.469 | 0.141 | 0.142 |
| Urbanization level | −0.243 | −0.131 | 0.028 | −0.117 | 0.072 |
| Government regulation | 0.268 | 0.282 | 0.408 | 0.295 | 0.034 |
| Openness | −0.061 | −0.053 | −0.048 | −0.053 | 0.003 |
Publisher’s Note: MDPI stays neutral with regard to jurisdictional claims in published maps and institutional affiliations. |
© 2021 by the authors. Licensee MDPI, Basel, Switzerland. This article is an open access article distributed under the terms and conditions of the Creative Commons Attribution (CC BY) license (https://creativecommons.org/licenses/by/4.0/).
Share and Cite
Liu, K.; Qiao, Y.; Zhou, Q. Analysis of China’s Industrial Green Development Efficiency and Driving Factors: Research Based on MGWR. Int. J. Environ. Res. Public Health 2021, 18, 3960. https://0-doi-org.brum.beds.ac.uk/10.3390/ijerph18083960
Liu K, Qiao Y, Zhou Q. Analysis of China’s Industrial Green Development Efficiency and Driving Factors: Research Based on MGWR. International Journal of Environmental Research and Public Health. 2021; 18(8):3960. https://0-doi-org.brum.beds.ac.uk/10.3390/ijerph18083960
Chicago/Turabian StyleLiu, Ke, Yurong Qiao, and Qian Zhou. 2021. "Analysis of China’s Industrial Green Development Efficiency and Driving Factors: Research Based on MGWR" International Journal of Environmental Research and Public Health 18, no. 8: 3960. https://0-doi-org.brum.beds.ac.uk/10.3390/ijerph18083960