Article

Efficiency Measurement of Green Regional Development and Its Influencing Factors: An Improved Data Envelopment Analysis Framework

1
Institute of Environmental Economics Research, Ningbo Polytechnic, Ningbo 315800, China
2
Department of Public Course Teaching, Ningbo Polytechnic, Ningbo 315800, China
*
Author to whom correspondence should be addressed.
Sustainability 2020, 12(11), 4361; https://0-doi-org.brum.beds.ac.uk/10.3390/su12114361
Submission received: 23 April 2020 / Revised: 20 May 2020 / Accepted: 23 May 2020 / Published: 26 May 2020

Abstract

:
Reasonably assessing the efficiency of green regional development is a key to improving environmental management and implementing sustainable development strategies. From the perspectives of environmental pollutant emissions, energy consumption, and production factor cost, the non-radial data envelopment analysis model based on the Malmquist index was applied to measure the green development efficiency and regional differences of 11 cities in Zhejiang from 2007 to 2016 from both static and dynamic aspects. This paper further analyzes the inherent influencing factors through the panel data model. The result shows: (1) The average static efficiency of green development in Zhejiang Province is 0.844. There is still 15.6% of improvement space from the frontier of production. Pollution emission management has the greatest improvement potential. Pure technical efficiency is the main factor restricting the static efficiency. (2) The dynamic efficiency of Zhejiang’s green development achieves an average annual rate of 0.26%, with a cumulative growth of 2.33%. The improvement of green development efficiency mainly depends on scale efficiency change. (3) The inherent factors affecting the efficiency of green development in the 11 cities mainly include three factors: the industrial structure, environmental regulation, and the urbanization level. The industrial structure has a positive effect, while environmental regulation and the urbanization level have negative effects. (4) The 11 cities are relatively evenly distributed in the four “static–dynamic efficiency” classification quadrants, and there is no "Matthew effect" of high–high, low–low polarization.

1. Introduction

Over the 40 years of reform and opening up, China has experienced rapid economic and social development, but this has also caused some losses in terms of the ecological environment. With the prominent problems of environmental pollution and resource consumption, where China is heading and how to achieve sustainable development of the green economy are the main issues that the country is facing today. Therefore, how to take a path of sustainable and green development is a focus of the government in all regions and at all levels [1,2], for example, the ecological civilization plan that is being vigorously promoted.
The concept of the "green economy" was first proposed in 1989 [3,4], and the concept of green development has been continuously expanded since then. Broadly speaking, green development refers to achieving the highest economic and scientific benefits with the least environmental pollution costs, energy consumption, and input of production factors [5,6]. After the global financial crisis in 2008, promoting green development has become an important consensus reached by countries and regions on improving economic competitiveness, coping with the financial crisis, and solving resource and environmental problems [7]. Some developed countries in the European Union and the United States have developed green energy technology along with green manufacturing industry as the core of a series of strategic plans, actively promoting the Green New Deal strategy in order to boost their economic recovery and be predominant in the new round of global competition by changing the industrial structure [8,9]. Implementing green transportation and reducing carbon emissions are also hot topics in current green development research [10]. In Mersin, Turkey, research on green public transportation is being actively promoted. These studies are undoubtedly of great significance for improving the utilization of public transportation to achieve a sustainable outcome [11,12,13,14]. As a developing country with large energy consumption, China signed the "Kyoto Protocol" as early as 1998, and also promised to reach the peak of carbon dioxide emissions by 2030, when carbon dioxide emissions per unit of GDP will decrease by 60% to 65% compared to 2005. In order to achieve harmonious, sustainable economic growth and social development, the Chinese government put forward the concept of green development at the Fifth Plenary Session of the 18th Communist Party of China Central Committee [15], and regarded green development as the basic strategy of China’s economic and social development during the “13th Five-Year Plan” and even after [16,17]. At the G20 Business Summit in 2016, the Chinese government once again clearly pointed out that it was necessary to build together a green and low-carbon global energy governance structure and promote global green development cooperation so as to achieve the goal of implementing the UN’s 2030 sustainable development agenda [18,19] and build a linked global governance.
The report of the 19th National Congress of the People’s Republic of China regards green development as the first step in building an ecological civilization. As one of the smallest areas, but meanwhile the earliest provinces, to develop its economy, Zhejiang Province took the lead in promoting green development and is striving to build a "Beautiful China" demonstration zone. Therefore, we take Zhejiang Province as a case study in this paper. Zhejiang Province is located on the southeast coast of China and on the southern wing of the Yangtze River Delta, which has an area of 105,500 square kilometers, making up 1.1% of China. As of 2018, Zhejiang’s regional gross domestic product (GDP) was 5.62 trillion yuan, accounting for 6.14% of the whole country’s GDP, and the per capita disposable income of residents was 62.39%—higher than the national average in the same period [20]. Although the development of Zhejiang Province is at a national leading level, there are problems of a low resource utilization rate and sharp increase in resource consumption. Coal consumption in Zhejiang Province increased from 55.27 million tons in 2001 to 139.948 million tons in 2016—an increase of almost 152.37%. Gasoline consumption increased from 2.1287 million tons to 7.9692 million tons—an increase of nearly 274.37%. Kerosene consumption was nearly 13 times the original, and electricity consumption was about 4.57 times the original. While resource consumption has increased dramatically, the problem of environmental pollution is also severe [21,22]. In 2017, wastewater discharge in Zhejiang Province accounted for 6.49% of the country’s total wastewater discharge, meanwhile total nitrogen discharge in wastewater accounted for 5.55% of the country’s total, and nitrogen oxide emissions in waste gas accounted for 3.43% of the country’s total.
In the context of ecological priority and green development, this paper attempts to explore the green development efficiency of Zhejiang Province and makes the following contributions: (1) Constructing a comprehensive evaluation indicator system for green development efficiency. (2) Building a non-radial data envelopment analysis (DEA) model (NRDEA) combined with the Malmquist index, so the dynamic and static green development efficiency of 11 cities in Zhejiang Province is studied and compared. The superiority of the NRDEA is that it can analyze the input efficiency of each input variable separately, thus it is named a non-radial model. (3) Establishing a short panel data model for exploring the driving factors affecting the green development efficiency of Zhejiang Province, thus providing countermeasures for improving the efficiency of green development in Zhejiang Province and other related regions. This is of great significance for promoting high-quality sustainable development between the ecological environment and economic construction.

2. Literature Review

The core of green development is to improve people’s quality of life. On the basis of respecting, protecting, and making efficient use of resources and the environment, richer, better, more economical and sustainable economic wealth and social well-being is the goal for human beings. At present, the existing scholars’ research on green development mainly focuses on regional selection, model evaluation, impact mechanism, and optimization countermeasures, and they have made promising research results.

2.1. Green Development and Evaluation of Efficiency

The diagnosis and evaluation of green development in the study can help to further assess the state of the green process, and also lay an important foundation for the dynamic prediction of green development and the practical logic and realization path of green development [23,24]. The current assessment mainly consists of the selection of green development indicators and efficiency evaluation. The selection of indicators generally includes the establishment of a clear multi-indicator comprehensive system, including the Human Green Development Index [25,26], Total Environmental Load Index [27,28,29], ecological footprint [30,31] and other indicators. It also includes the green gross domestic product (GDP) index, which is achieved by incorporating resource consumption and environmental pollution into the cost of economic development [32,33]. In addition, many scholars focus on the evaluation of green development efficiency, which is based on an ecological efficiency conceptual model [24,34]. At present, the research on the efficiency of green development has achieved a large yield. Different scholars on green economic efficiency [35,36], green production efficiency, green innovation efficiency [37,38], green technology efficiency [39], and green water resource utilization efficiency [40] have empirically analyzed the green development efficiency issues of various industrial sectors, such as the finance, manufacturing, industrial, and agricultural sectors. In particular, in terms of the efficiency of green transportation development, many scholars have conducted systematic research on the use of new energy vehicles, the improvement of public transportation systems, the improvement of the efficiency of land use for transportation infrastructure, and the construction of a green transportation development system guarantee systems [41,42,43,44].
The efficiency evaluation of green development was mainly accomplished by constructing input‒output indicator system. These existing studies have provided the basis for our selection of indicators, which allows us to delve into this topic. However, most of the literature evaluates the efficiency of green development from the dimensions of production factors, energy input, pollution emissions, and economic output but often only use one of these factors to represent green development, neglecting other important factors that reflect these dimensions. There is also a lack of special analysis of the above perspectives. In order to avoid the singularity of indicator selection, we adopt the entropy method to integrate different individual indices into one system variable and construct a comprehensive index system in this paper.

2.2. Evaluation Methods of Green Development

The research methods of green development mainly include entropy weight by the Technique for Order Preference by Similarity to an Ideal Solution, a projection pursuit model, an input‒output model, and a cost-benefit model [45]. Furthermore, stochastic frontier analysis, total factor productivity, the data envelopment analysis (DEA) model and the Malmquist index are used to measure the static and dynamic efficiency of green development [24,36,46], and the influencing factors are analyzed by the panel Tobit model, geographically weighted regression model, Grey relational model, etc. [13,47,48]. Regional differences and spatial driving mechanisms of green development efficiency are generally explored through spatial autoregressive models, spatial Dubin models, etc. [29,49,50,51]. These results reveal that industrial structure, economic development, human capital, opening up, technology investment, and environmental regulation are the main factors affecting the efficiency of green development. These provide us with a reference when studying the influencing factors. The traditional measurement efficiency of basic DEA models is a radial efficiency that mainly adopts the degree by which the input decision-making unit and the output need to be improved in proportion when the evaluated decision-making unit is compared with the target value, and there is a defect of overestimating efficiency. Considering this problem, most scholars have adopted DEA models based on a directional distance function, such as the slack-based measure (SBM) model, super-efficient SBM, and the undesirable output SBM model, which measures the static efficiency of green development [36,52,53,54]. Although the improved DEA models avoid scaling of input and output, the following problems remain: first, the efficiency ultimately gained is an overall efficiency, but the efficiency of each input is not further calculated. This efficiency is called non-radial efficiency based on input. Second, in some cases there are multiple decision units with an efficiency value of 1 that cannot be further compared and analyzed. Third, when calculating the dynamic efficiency based on the Malmquist index, because the calculation software such as DEAP2.1 sets the basic DEA model to calculate the Malmquist index, the non-radial perspective is often ignored.

2.3. Research Scale and Regional Selection of Green Development

At present, the research on green development mainly focuses on global [8], national, and provincial levels [49,50,52]; important economic zones level and urban agglomeration [45,55]; and tends to the medium and macro scales. Although empirical studies on the efficiency of green development have begun to focus on regional differences and spatial relevance, comparative studies at the micro level of cities and counties are still lacking. Cities are the main carrier for realizing green regional development. The study on the efficiency of green development on the urban scale can lay a foundation for promoting the construction of ecological civilization effectively [50,51]. Therefore, from the perspective of the urban scale, exploring and comparing the green development efficiency between cities can provide policy reference for formulating differentiated regional sustainable development strategies.

3. Methodology and Data

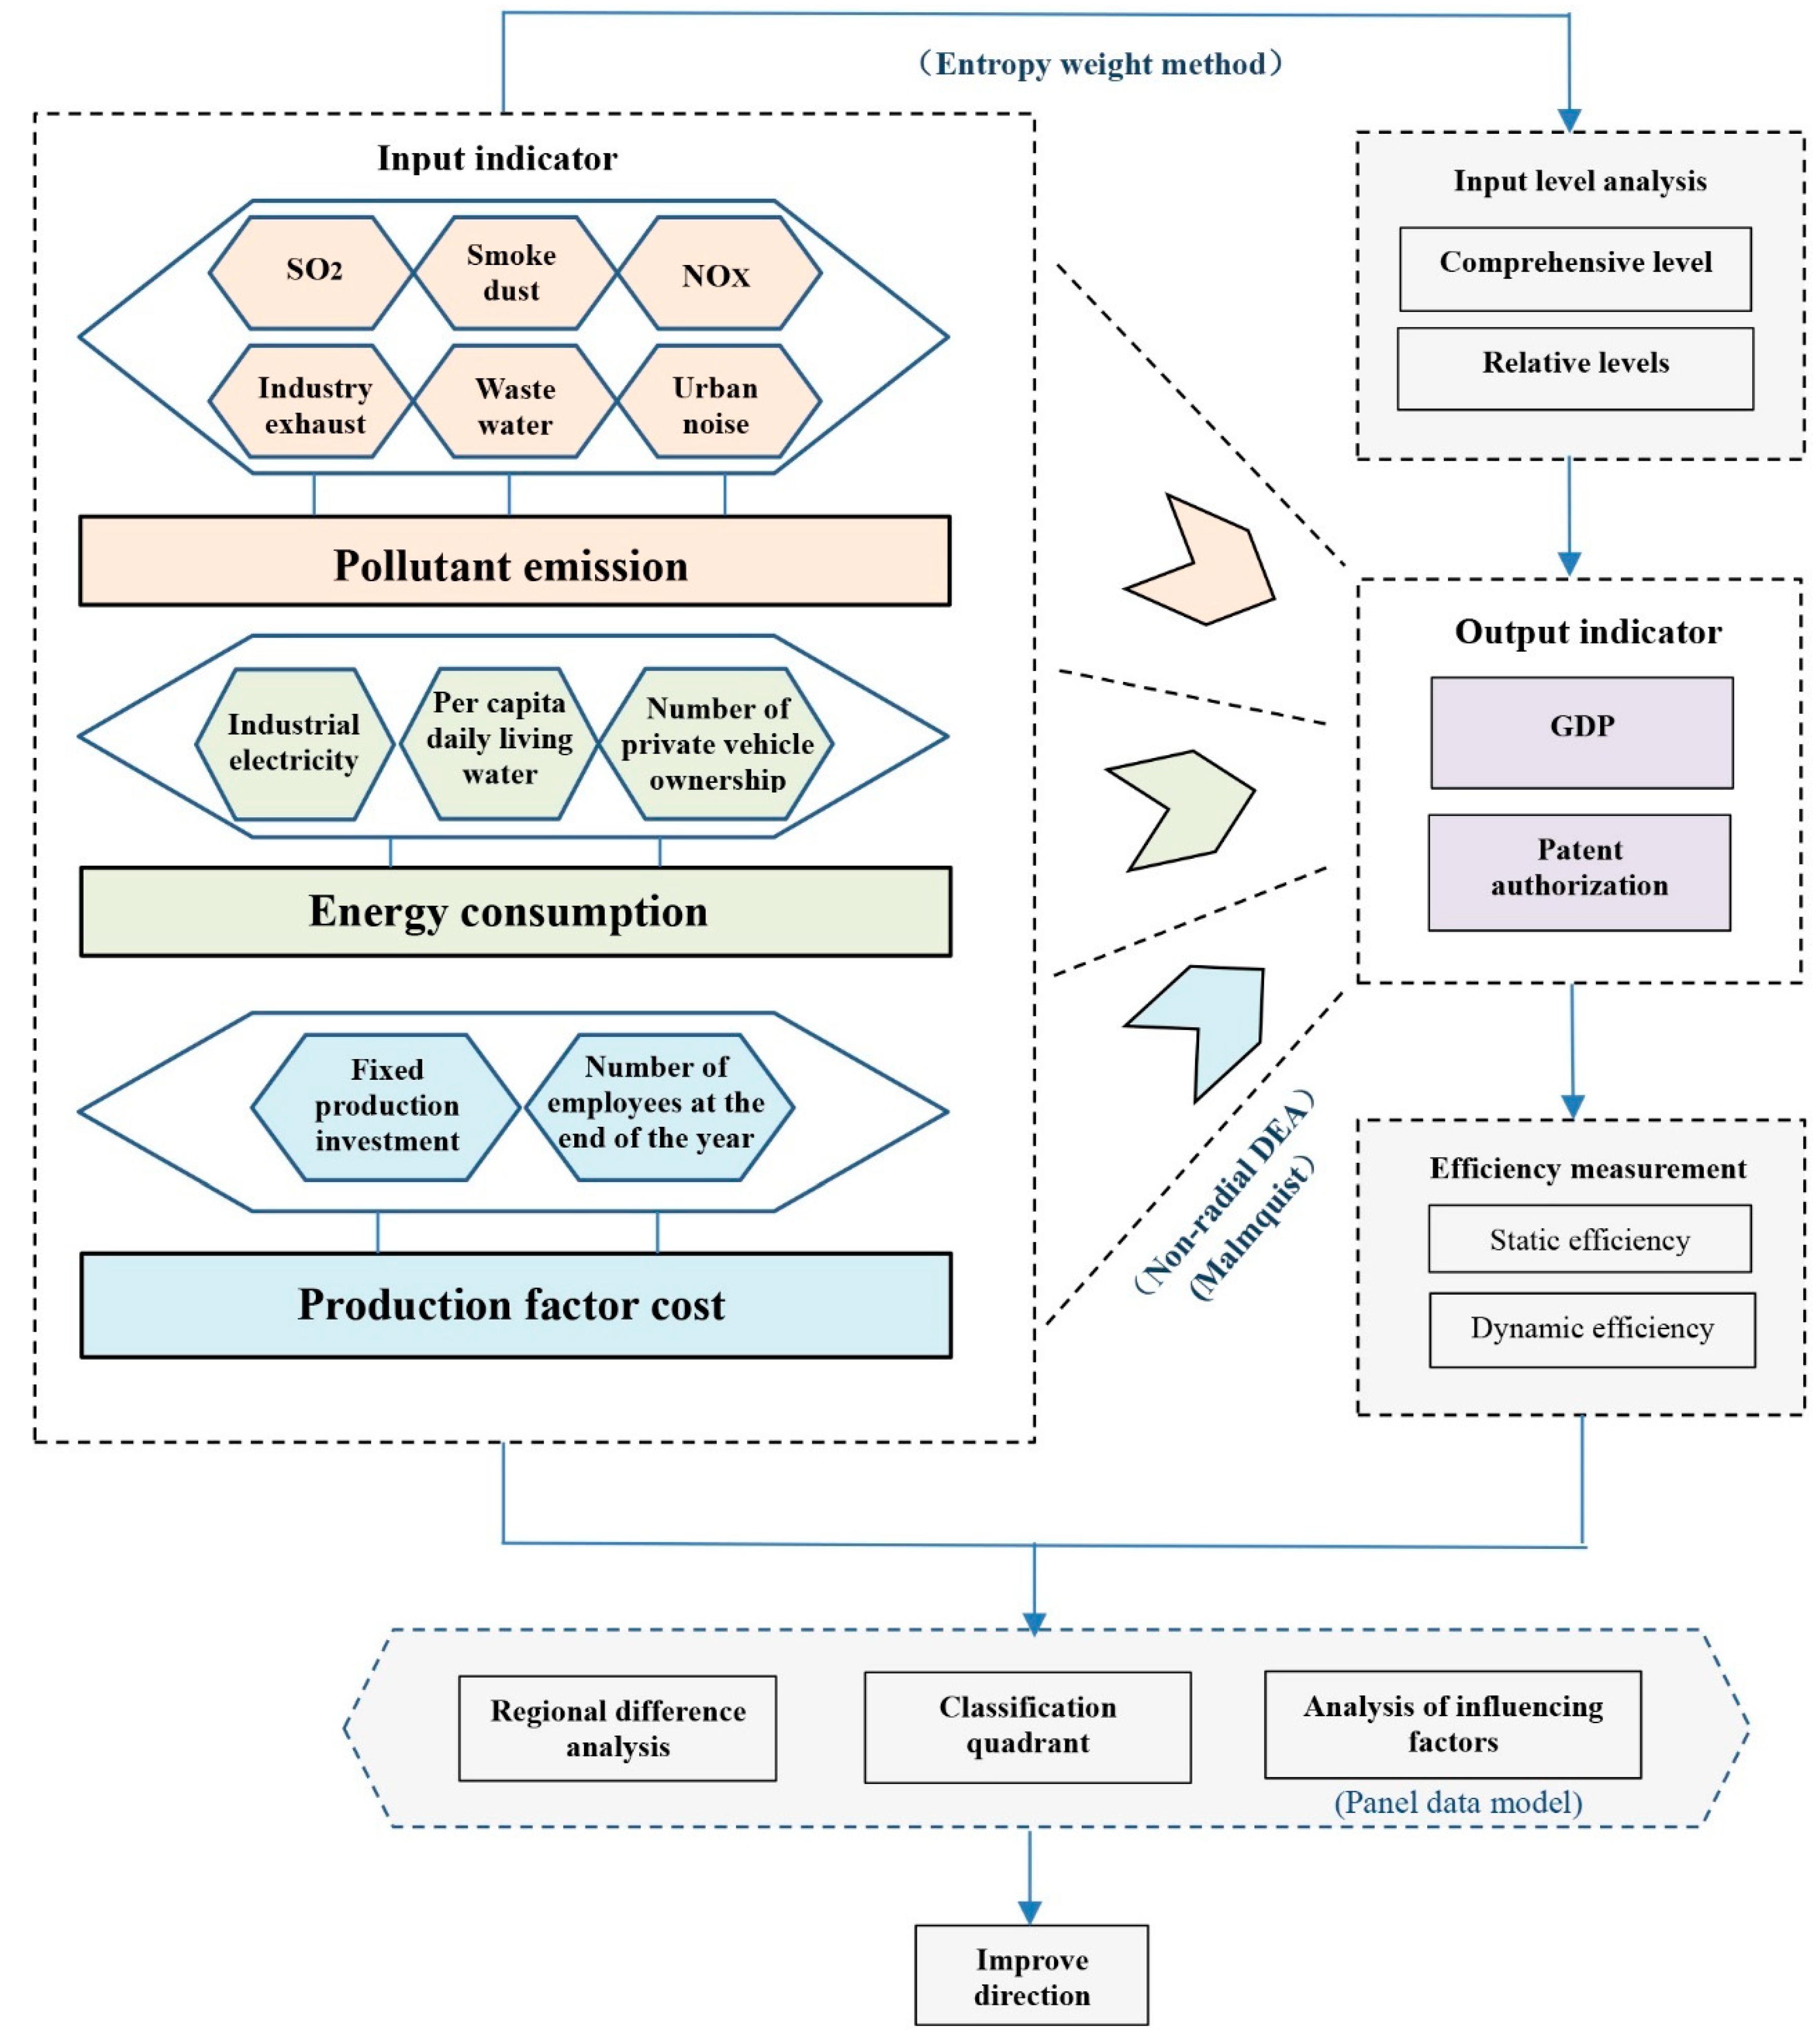
3.1. Efficiency Evaluation Framework of Green Development

Green development efficiency mainly measures the relationship between input and output. On the basis of overcoming the above problems, the main work done in this article is: (1) The entropy weight method was used to integrate multiple input indicators into three variables: pollutant emissions, energy consumption, and production factor cost, and the regional differences of absolute levels, relative economic levels, and relative technological levels were compared for each city. (2) Based on the improved non-radial DEA model, 3 input variables and 2 output variables were used to measure the static green development efficiency, pure technology efficiency, and scale efficiency of each city, and the regional difference comparison was performed. (3) Based on the NRDEA and the Malmquist index, the dynamic efficiency measurement was performed to calculate the total factor productivity, pure technical efficiency change, scale efficiency change, and technical change. The above factors from three input perspectives were considered, the factors that restrict and promote dynamic efficiency were analyzed, and further regional differences were compared. (4) The panel data model was used to explore the main economic and social factors that affect the efficiency of green development and point out the way to improve green development efficiency. (5) According to the static and dynamic efficiency of each city, they were classified into advantage and disadvantage quadrants, and further policy recommendations are given. The research route of this paper is shown in Figure 1.

3.2. Indicator System and Weight Determination

In order to measure the pollutant emission, energy consumption, and production factor cost of each city in Zhejiang Province under certain economic and scientific output, this paper selected three types of inputs from the three perspectives of emissions reduction, energy conservation, and development. The results are shown in Table 1.
The entropy weight method [56] was used to calculate the environmental pollution discharge, energy consumption, and input of production factor in each city. The calculation process was as follows:
Step 1: Calculate the proportion of the i-th city in the j-th indicator, pij:
p i j = r i j / i = 1 m r i j
Step 2: Calculate the entropy value of the j-th indicator, ej:
e j = k i = 1 m p i j ln p i j ,   where   k = 1 / ln m
Step 3: Calculate the entropy weight of the j-th indicator, wj:
w j = ( 1 e j ) / j = 1 n ( 1 e j )
Step4: Determine the comprehensive weight of the j-th indicator, βj:
β j = α j w j j = 1 n α j w j
where α j is the subjective weight set by the evaluator according to his own requirements and objectives. Through formulas (4), the subjective and objective assignment methods can be effectively combined. For subjective weighting method, we selected the structure entropy weight (SEW) method. The basic principle of the SEW method was to rank the importance degree of each indicator and then use the entropy method to quantitatively analyze the uncertainty of the typical order [57,58]. The specific calculation process of this method can refer to the description of two existing literatures. Among them, we obtained the judgments of the index’s importance ratings from 15 experts in the fields of urban planning, regional economics, environmental geography, and environmental science and sustainable development based on the Delphi procedure.
Step 5: Calculate the comprehensive score of pollutant emission, energy consumption, and production factor cost of the i-the city, si:
s i = j = 1 n β j p i j
A numerical example is given below:
If there are four cities and three indicators as R = [ 5 1 . 4 6 9 2 30 8 1 . 8 11 12 2 . 5 18 ] , then P = [ 0.1471 0.1818 0.0923 0.2647 0.2597 0.4615 0.2353 0.2338 0.1692 0.3529 0.3247 0.2769 ] is obtained by formula (1). k = 1 / ln 4 = 0.7213 . The entropy value E = [ 0.9678 0.9846 0.8894 ] is obtained by formula (2). The entropy weight W = [ 0.2035 0.0970 0.6994 ] is obtained by formula (3). If the subjective weight α = [ 0.4 0.3 0.3 ] , then the comprehensive weight β = [ 0.2541 0.0909 0.6550 ] is obtained by formula (4). Finally, the comprehensive score s = [ 0.1144 0.3932 0.1919 0.3006 ] of four cities is obtained by formula (5).

3.3. Static Efficiency of Green Development

The non-radial DEA model which was used to measure the static efficiency of green development is as follows:
min θ = θ i m s . t . { j = 1 n λ j x i j + s i - = θ i x i k , i = 1 , , m j = 1 n λ j y l j s l + = y l k , l = 1 , , s λ j 0 , j = 1 , 2 , , n s i - 0 ,   s l + 0 ,   i = 1 , , m ,   l = 1 , , s
where n is the number of decision units, m is the number of inputs, and s indicates the number of outputs. x i j is the i-th input of the j-th decision unit and y l j is the j-th output of the l-th decision unit. λ j is the connection coefficient, which connects the effective points of each input and output to form an effective frontier. s and s + are the relaxation vectors of input and output, θ is the green development efficiency of the evaluated unit, and θ i is the efficiency of the i-th input, namely the pollutant emission efficiency, energy consumption efficiency, and production factor cost efficiency, and green development efficiency θ is the geometric mean of the pollutant emission efficiency, energy consumption efficiency, and production factor cost efficiency.
The above model is input oriented and measures the degree to which input can be reduced without reducing output. Because it was carried out under the assumption that the scale returns are constant, the green development efficiency θ of the measure was the comprehensive efficiency (E). If the variable compensation of scale returns is added to this model, that is, the constraint of j = 1 n λ j = 1 is increased, the obtained efficiency is pure technical efficiency (pe), and further, the scale efficiency (se) can be separated, i.e.,
E = p e × s e

3.4. Malmquist Dynamic Model Based on NRDEA

To explore the dynamic efficiency of green development, this paper used the Malmquist model based on the NRDEA model for quantitative analysis. The Malmquist index was originally proposed by Malmquist and later applied by Caves et al. to the measurement of production efficiency changes [59]. Its expression is as follows:
M ( y t + 1 , x t + 1 , y t , x t ) = [ D t ( x t + 1 , y t + 1 ) D t ( x t , y t ) × D t + 1 ( x t + 1 , y t + 1 ) D t + 1 ( x t , y t ) ] 1 2
where M ( y t + 1 , x t + 1 , y t , x t ) represents the total factor productivity (TFP) from the t period to the t + 1 period. TFP>1 indicates that the green development efficiency is increasing, and TFP < 1 indicates that the green development efficiency is declining. D t ( x t , y t ) indicates the validity of the evaluation unit of the t period when referring to the technique T t of the t period, and D t ( x t + 1 , y t + 1 ) indicates the validity of the evaluation unit in the t + 1 period with reference to the technique T t of the t period. The Malmquist index can be decomposed into technical efficiency change (effch) and technological change (techch). Technical efficiency change can be further divided into pure technical efficiency change (pech) and scale efficiency change (sech), which is
M ( y t + 1 , x t + 1 , y t , x t ) = D t + 1 ( x t + 1 , y t + 1 ) D t ( x t , y t ) [ D t ( x t + 1 , y t + 1 ) D t + 1 ( x t + 1 , y t + 1 ) × D t ( x t , y t ) D t + 1 ( x t , y t ) ] 1 2 = D t + 1 ( x t + 1 , y t + 1 | V R S ) D t ( x t , y t | V R S ) D t + 1 ( x t + 1 , y t + 1 | C R S ) D t + 1 ( x t + 1 , y t + 1 | V R S ) D t ( x t , y t | V R S ) D t ( x t , y t | C R S ) [ D t ( x t + 1 , y t + 1 ) D t + 1 ( x t + 1 , y t + 1 ) × D t ( x t , y t ) D t + 1 ( x t , y t ) ] 1 2 = p e c h × s e c h × t e c h c h
D t ( x t , y t ) , D t + 1 ( x t + 1 , y t + 1 ) , D t ( x t + 1 , y t + 1 ) , and D t + 1 ( x t , y t ) can be obtained from the following four NRDEA models:
D t ( x t , y t ) = min θ 1 * = θ i m s . t . { j = 1 n λ j x i j t + s i - = θ i x i k t , i = 1 , , m j = 1 n λ j y l j t s l + = y l k t , l = 1 , , s λ j 0 , j = 1 , 2 , , n s i - 0 , s l + 0 , i = 1 , , m , l = 1 , , s D t + 1 ( x t + 1 , y t + 1 ) = min θ 2 * = θ i m s . t . { j = 1 n λ j x i j , t + 1 + s i - = θ i x i k , t + 1 , i = 1 , , m j = 1 n λ j y l j , t + 1 s l + = y l k , t + 1 , l = 1 , , s λ j 0 , j = 1 , 2 , , n s i - 0 , s l + 0 , i = 1 , , m , l = 1 , , s D t ( x t + 1 , y t + 1 ) = min θ 3 * = θ i m s . t . { j = 1 n λ j x i j t + s i - = θ i x i k , t + 1 , i = 1 , , m j = 1 n λ j y l j t s l + = y l k , t + 1 , l = 1 , , s λ j 0 , j = 1 , 2 , , n s i - 0 , s l + 0 , i = 1 , , m , l = 1 , , s D t + 1 ( x t , y t ) = min θ 4 * = θ i m s . t . { j = 1 n λ j x i j , t + 1 + s i - = θ i x i k t , i = 1 , , m j = 1 n λ j y l j , t + 1 s l + = y l k t , l = 1 , , s λ j 0 , j = 1 , 2 , , n s i - 0 , s l + 0 , i = 1 , , m , l = 1 , , s
Similarly, by adding the variable scale variable constraint j = 1 n λ j = 1 in each model, the TFP, techch, pech, and sech of the total and three input variables can be obtained.

3.5. Panel Data Model

The factors that influence the spatial and temporal pattern of green regional development efficiency are complex and diverse. In order to further explore the influencing factors of Zhejiang’s green development efficiency, green development efficiency was used as the explanatory variable, and the logarithm of the important influencing factors was used as the explanatory variable to establish a short panel data model for analysis. After testing the individual effects by performing the lagrange multiplier test and Hausman test on the model [60,61,62], the two-way fixed effect model was finally selected as follows:
ln E F F I i t = β 1 ln R G D P i t + β 2 ln I N D i t + β 3 ln G O V i t + β 4 ln T E C i t + β 5 ln U R B i t + β 6 ln F D I i t + λ t + α i + ε i t
Where i is the i-th city, t is the t-th period, α i is the unobservable individual effect, λ t is the time effect, ε i t is the random error term, β i is the regression coefficient of different influencing factors, and E F F I i t is the efficiency of green development of the i-th city in the t-th period.
R G D P i t represents the level of economic development and is represented by GDP per capita data; I N D i t represents the industrial structure and is represented by the proportion of GDP in industrial output; G O V i t represents environmental regulation, represented by the proportion of investment in environmental pollution treatment to GDP; T E C i t represents scientific research investment, represented by the proportion of research and development (R&D) expenditure in GDP; U R B i t represents the level of urbanization, which is represented by the population urbanization rate; and F D I i t represents foreign direct investment, which is represented by the proportion of total foreign investment in GDP. To eliminate the effect of heteroscedasticity, all data are logarithmic.

3.6. Data Source

This research collected related data of input and output proxy variables in the 11 cities of Zhejiang Province in the time period of 2007–2016. The statistics mainly came from the Zhejiang Statistic Yearbook (2007–2016), Zhejiang Natural Resources, and the Statistical Yearbook on Environment (2007–2016), and some additional data were available on Zhejiang and the 11 cities’ Environmental Quality Bulletin [63,64,65] as well as related official statistical websites.

4. Empirical Analysis

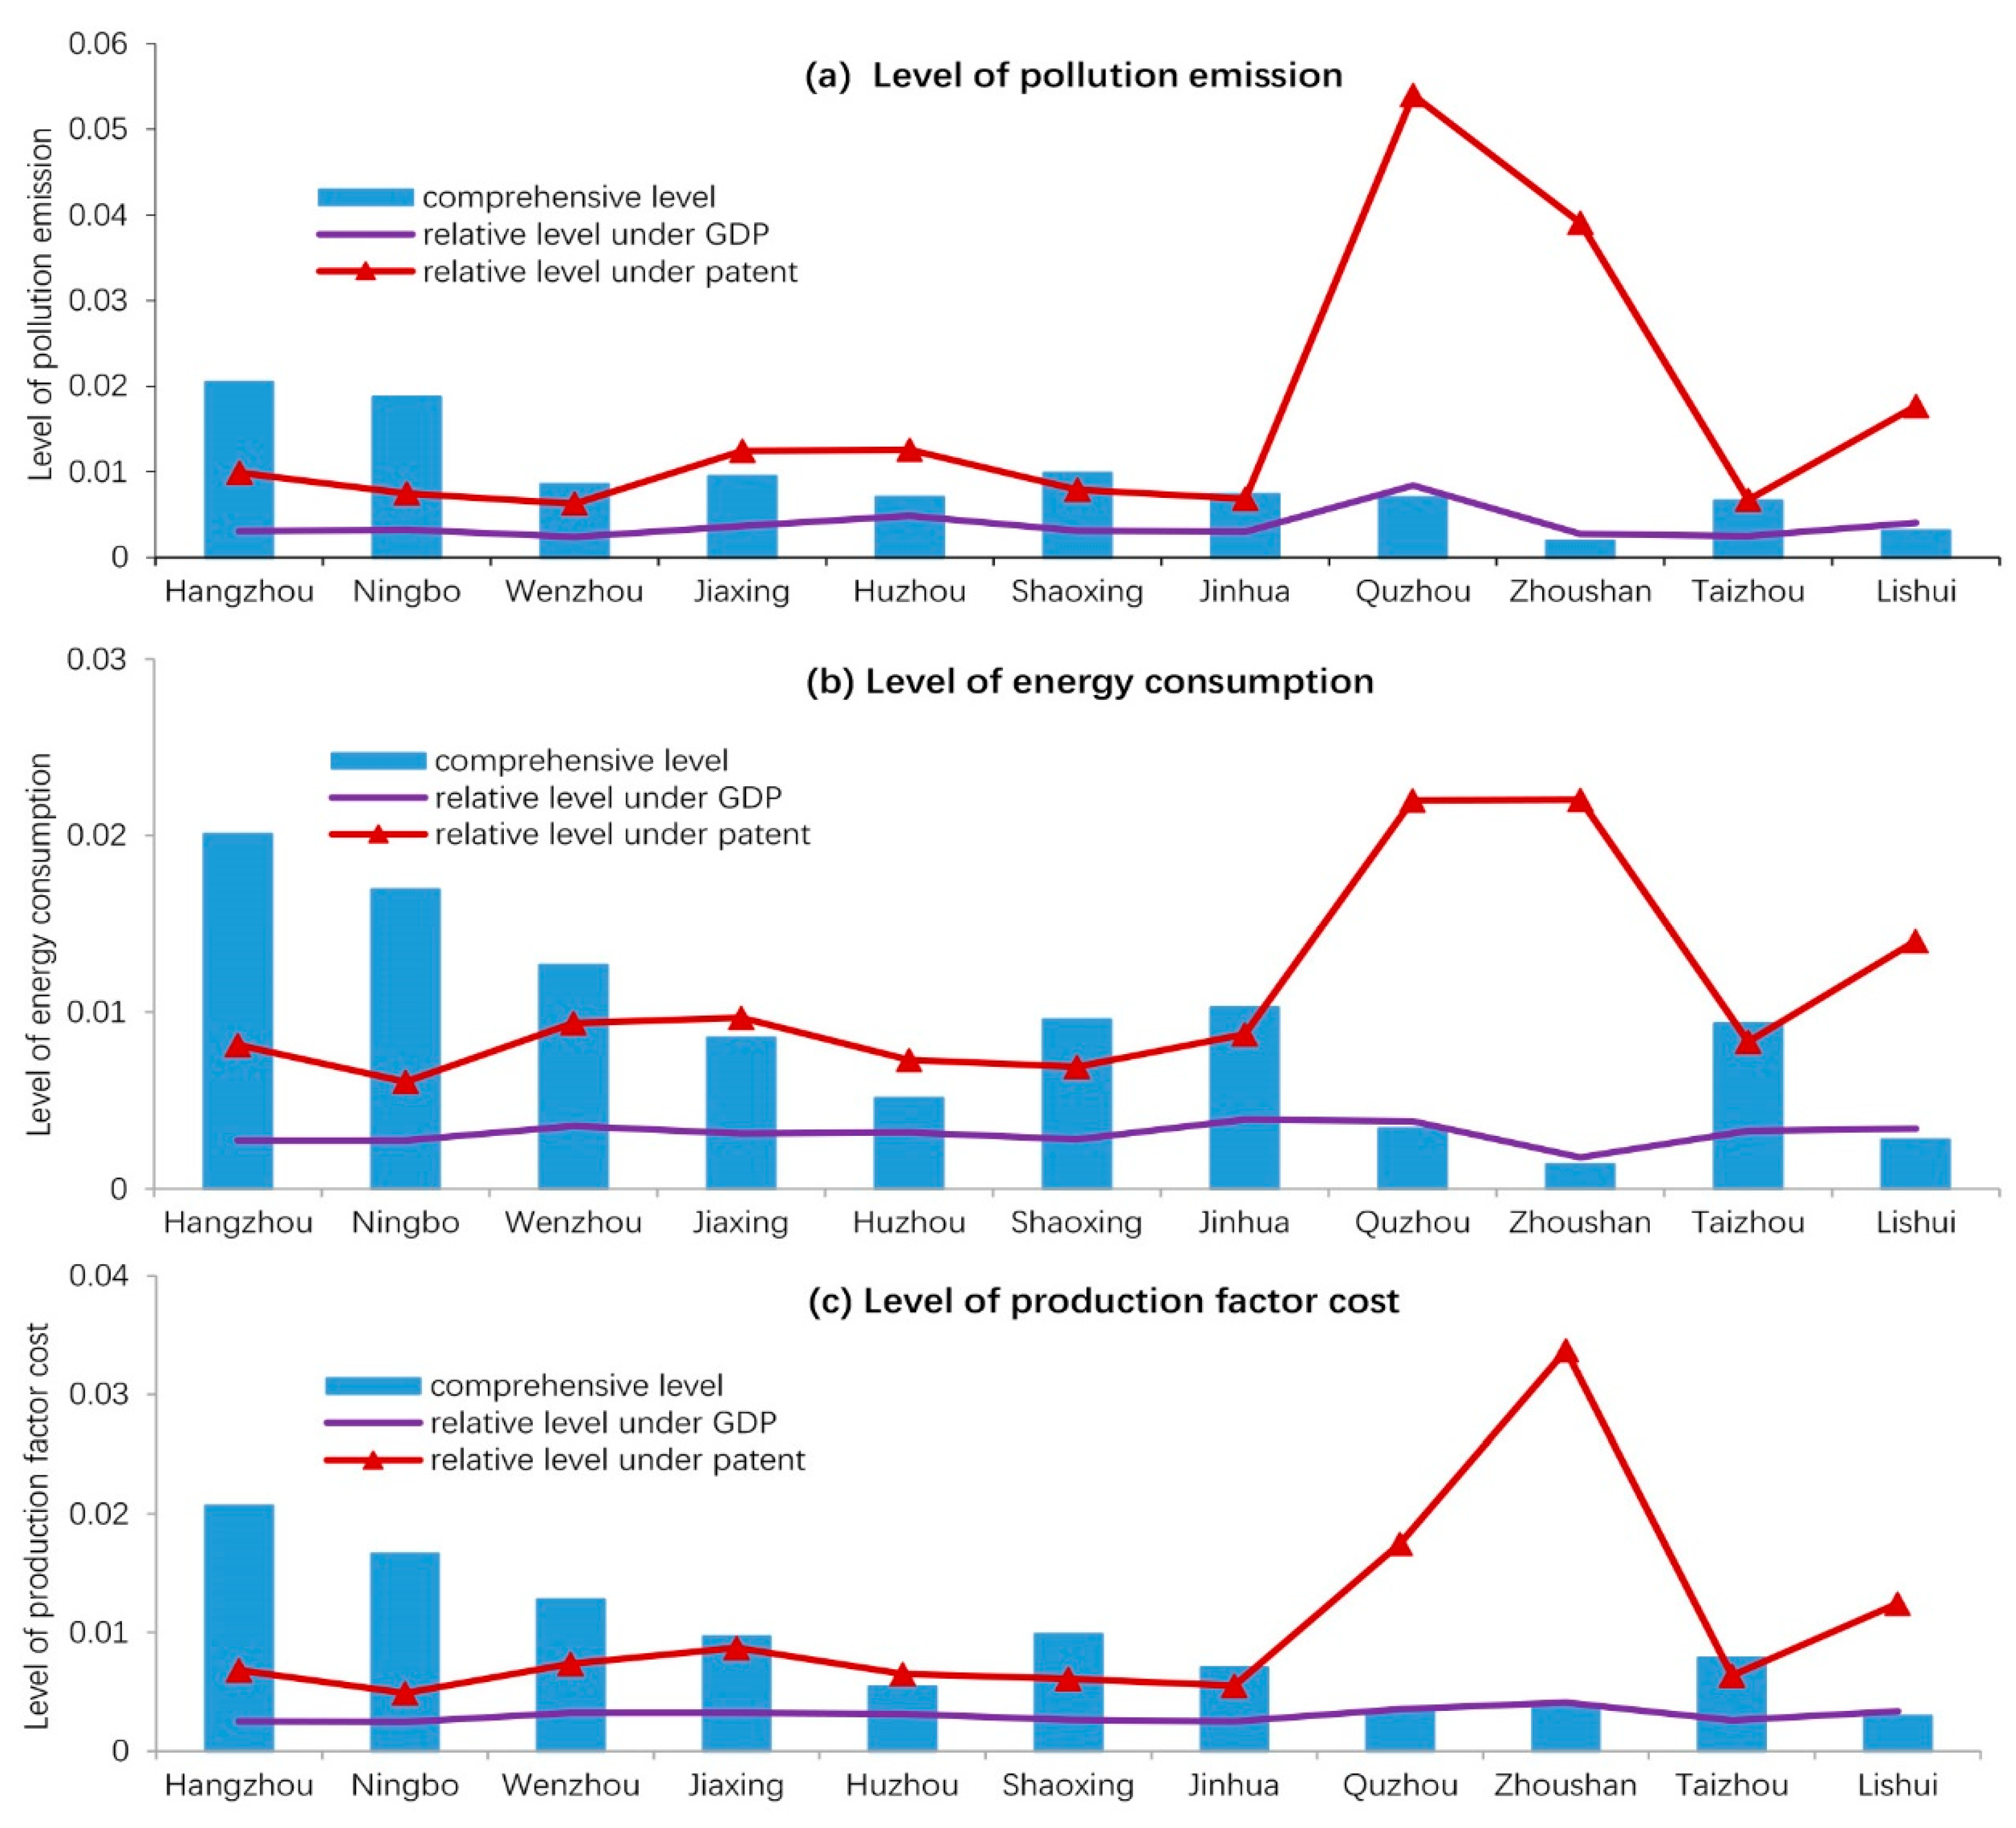
4.1. Input Level Analysis of 11 Cities in Zhejiang Province

Using the entropy method described in Method 3.2 to integrate the input indicators of cities in Zhejiang Province, obtaining the comprehensive level of pollutant emission, energy consumption, and production factor cost, and further obtaining the relative level of various input per 100 billion GDP and the relative level of various input under each 10,000 patent grants, the results are shown in Figure 2a–c. For the comprehensive level, Hangzhou and Ningbo had higher pollutant emission, higher energy consumption, and more production factor costs than other cities; Zhoushan and Lishui had lower pollutant emission, lower energy consumption, and lower production factor costs. Green development should not only focus on “green” but also on the “development”, thus economic production and technical development are also important. Taking these two factors into consideration, Quzhou had the highest pollutant emission while Wenzhou had the lowest when it is relative to regional GDP and grant patent approval. Zhoushan had the smallest energy consumption relative to GDP while it had the largest relative to grant patent approval. Production factor costs showed no significant regional difference relative to GDP, with Zhoushan’s costs the largest production factor while Ningbo’s costs were the smallest amount of production factor relative to grant patent approval. Detailed information on the 11 cities can be seen in Figure 2.

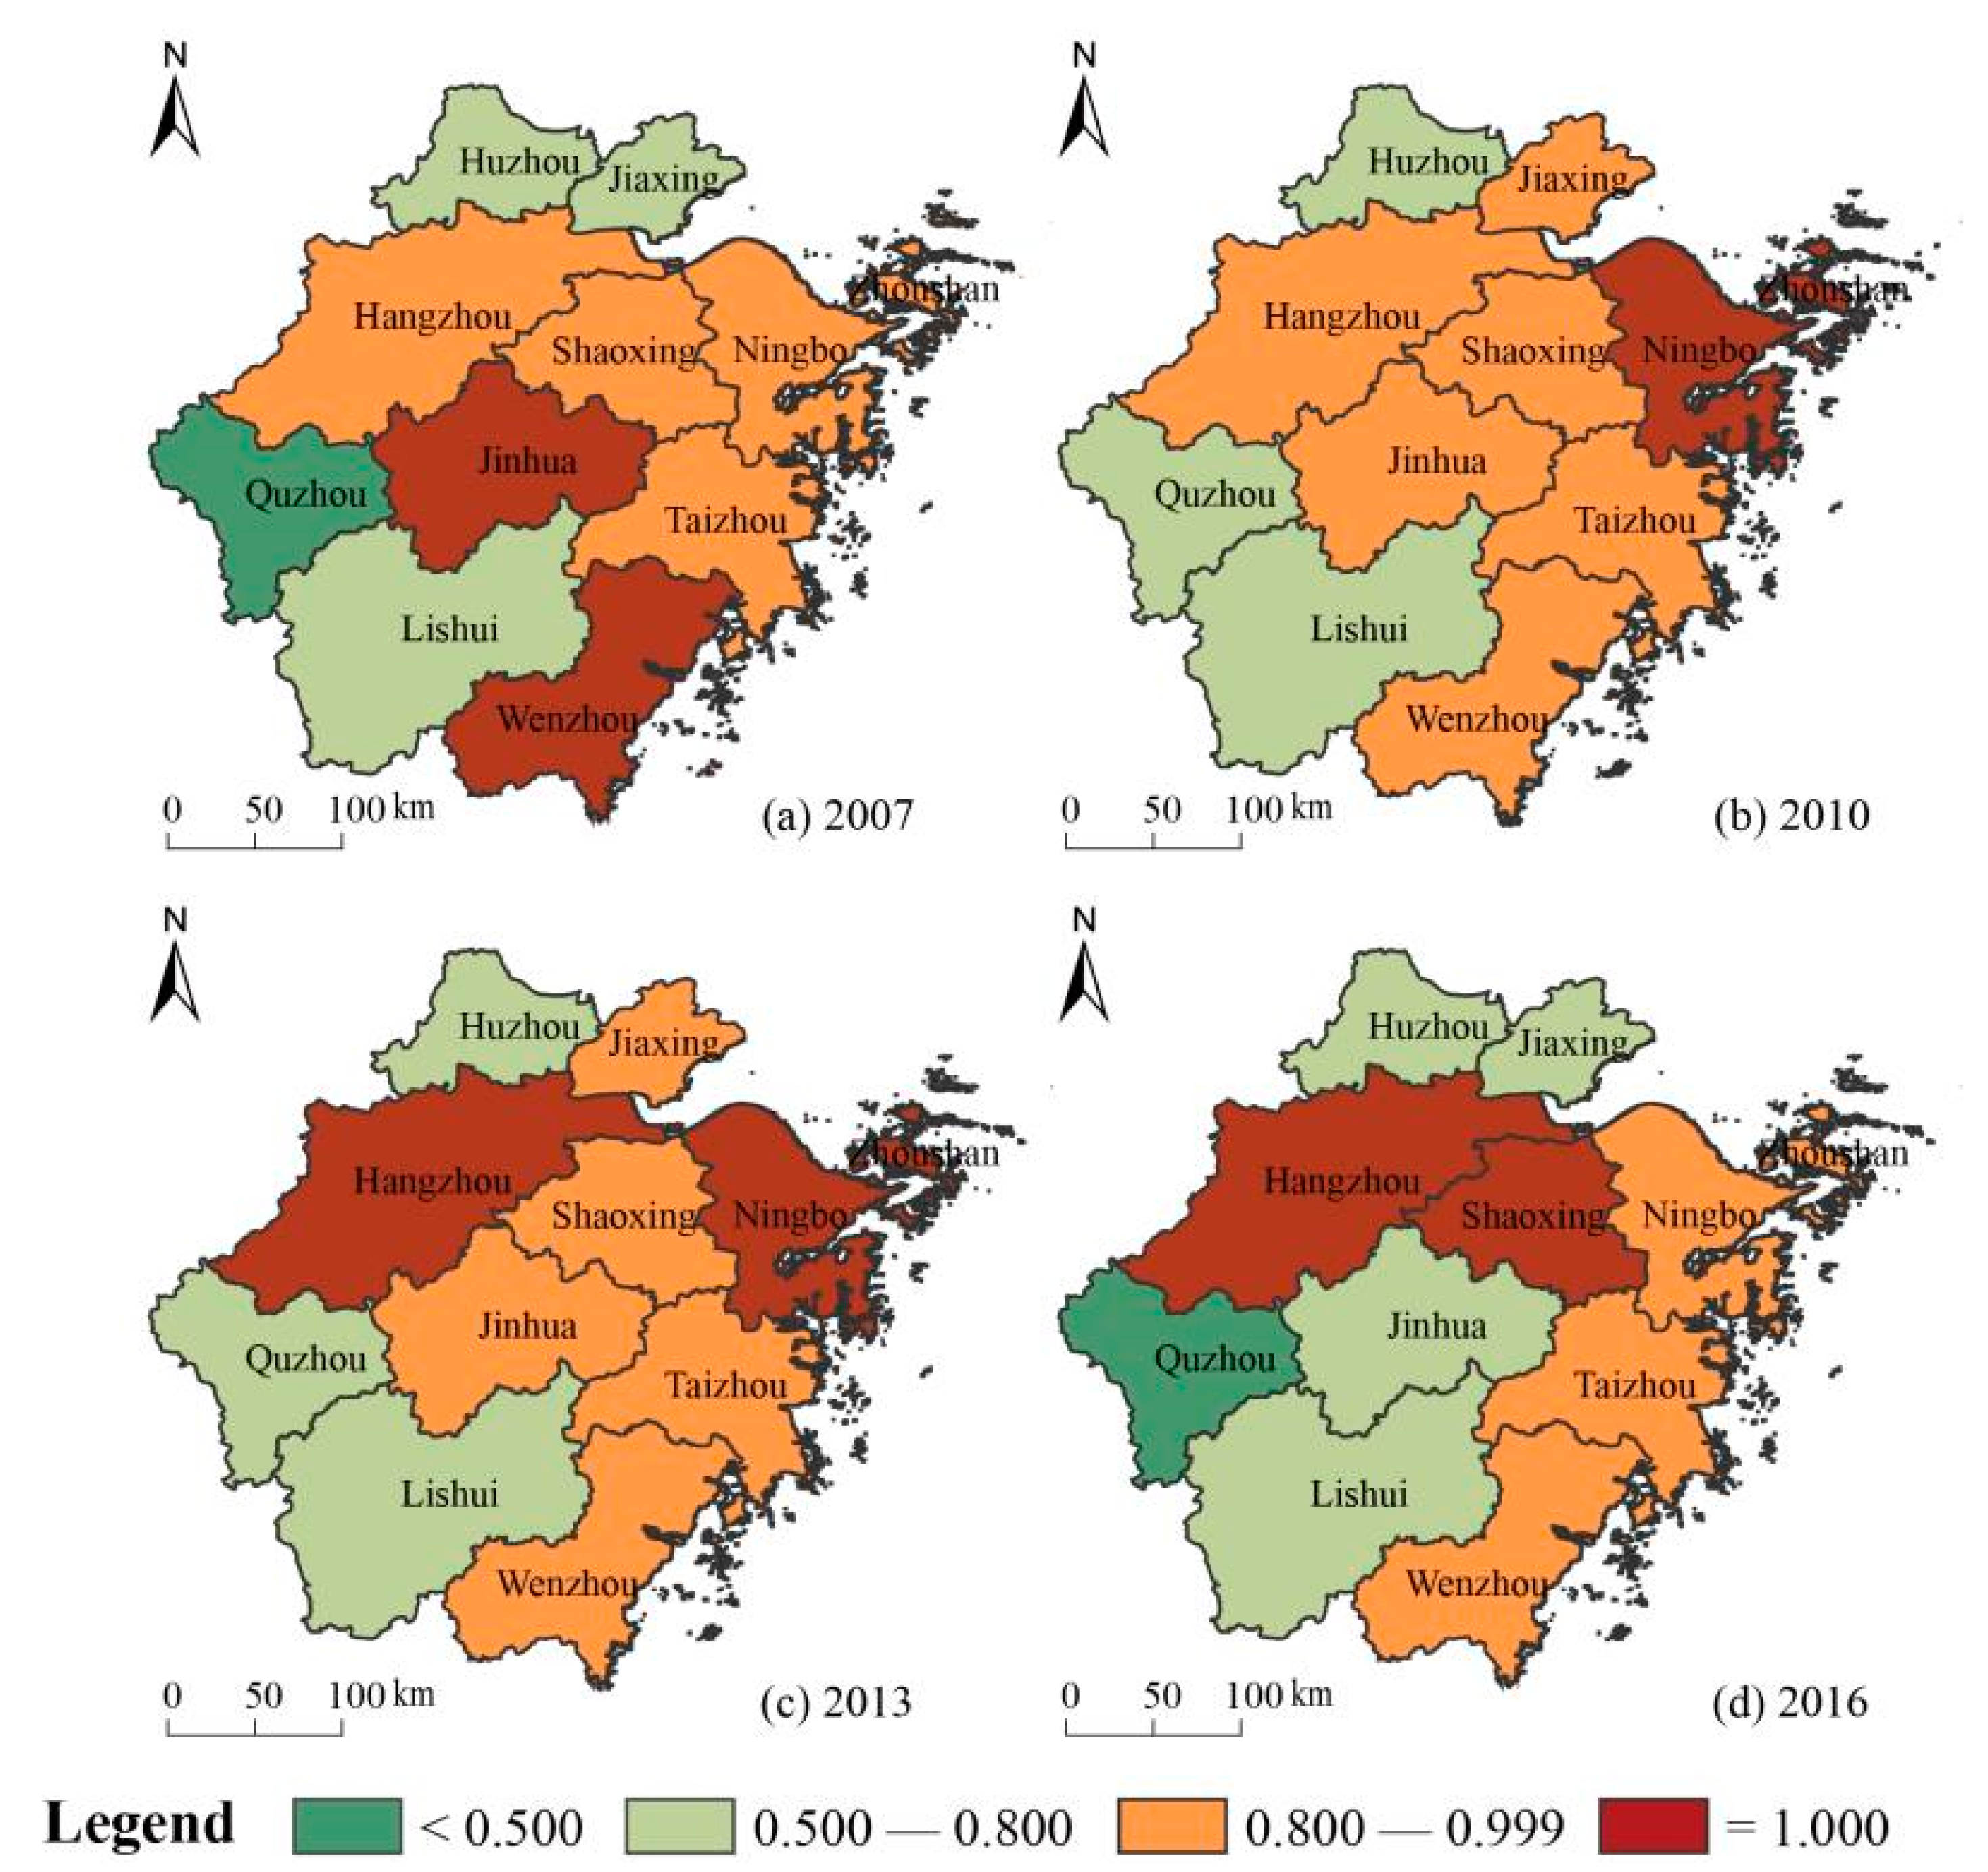
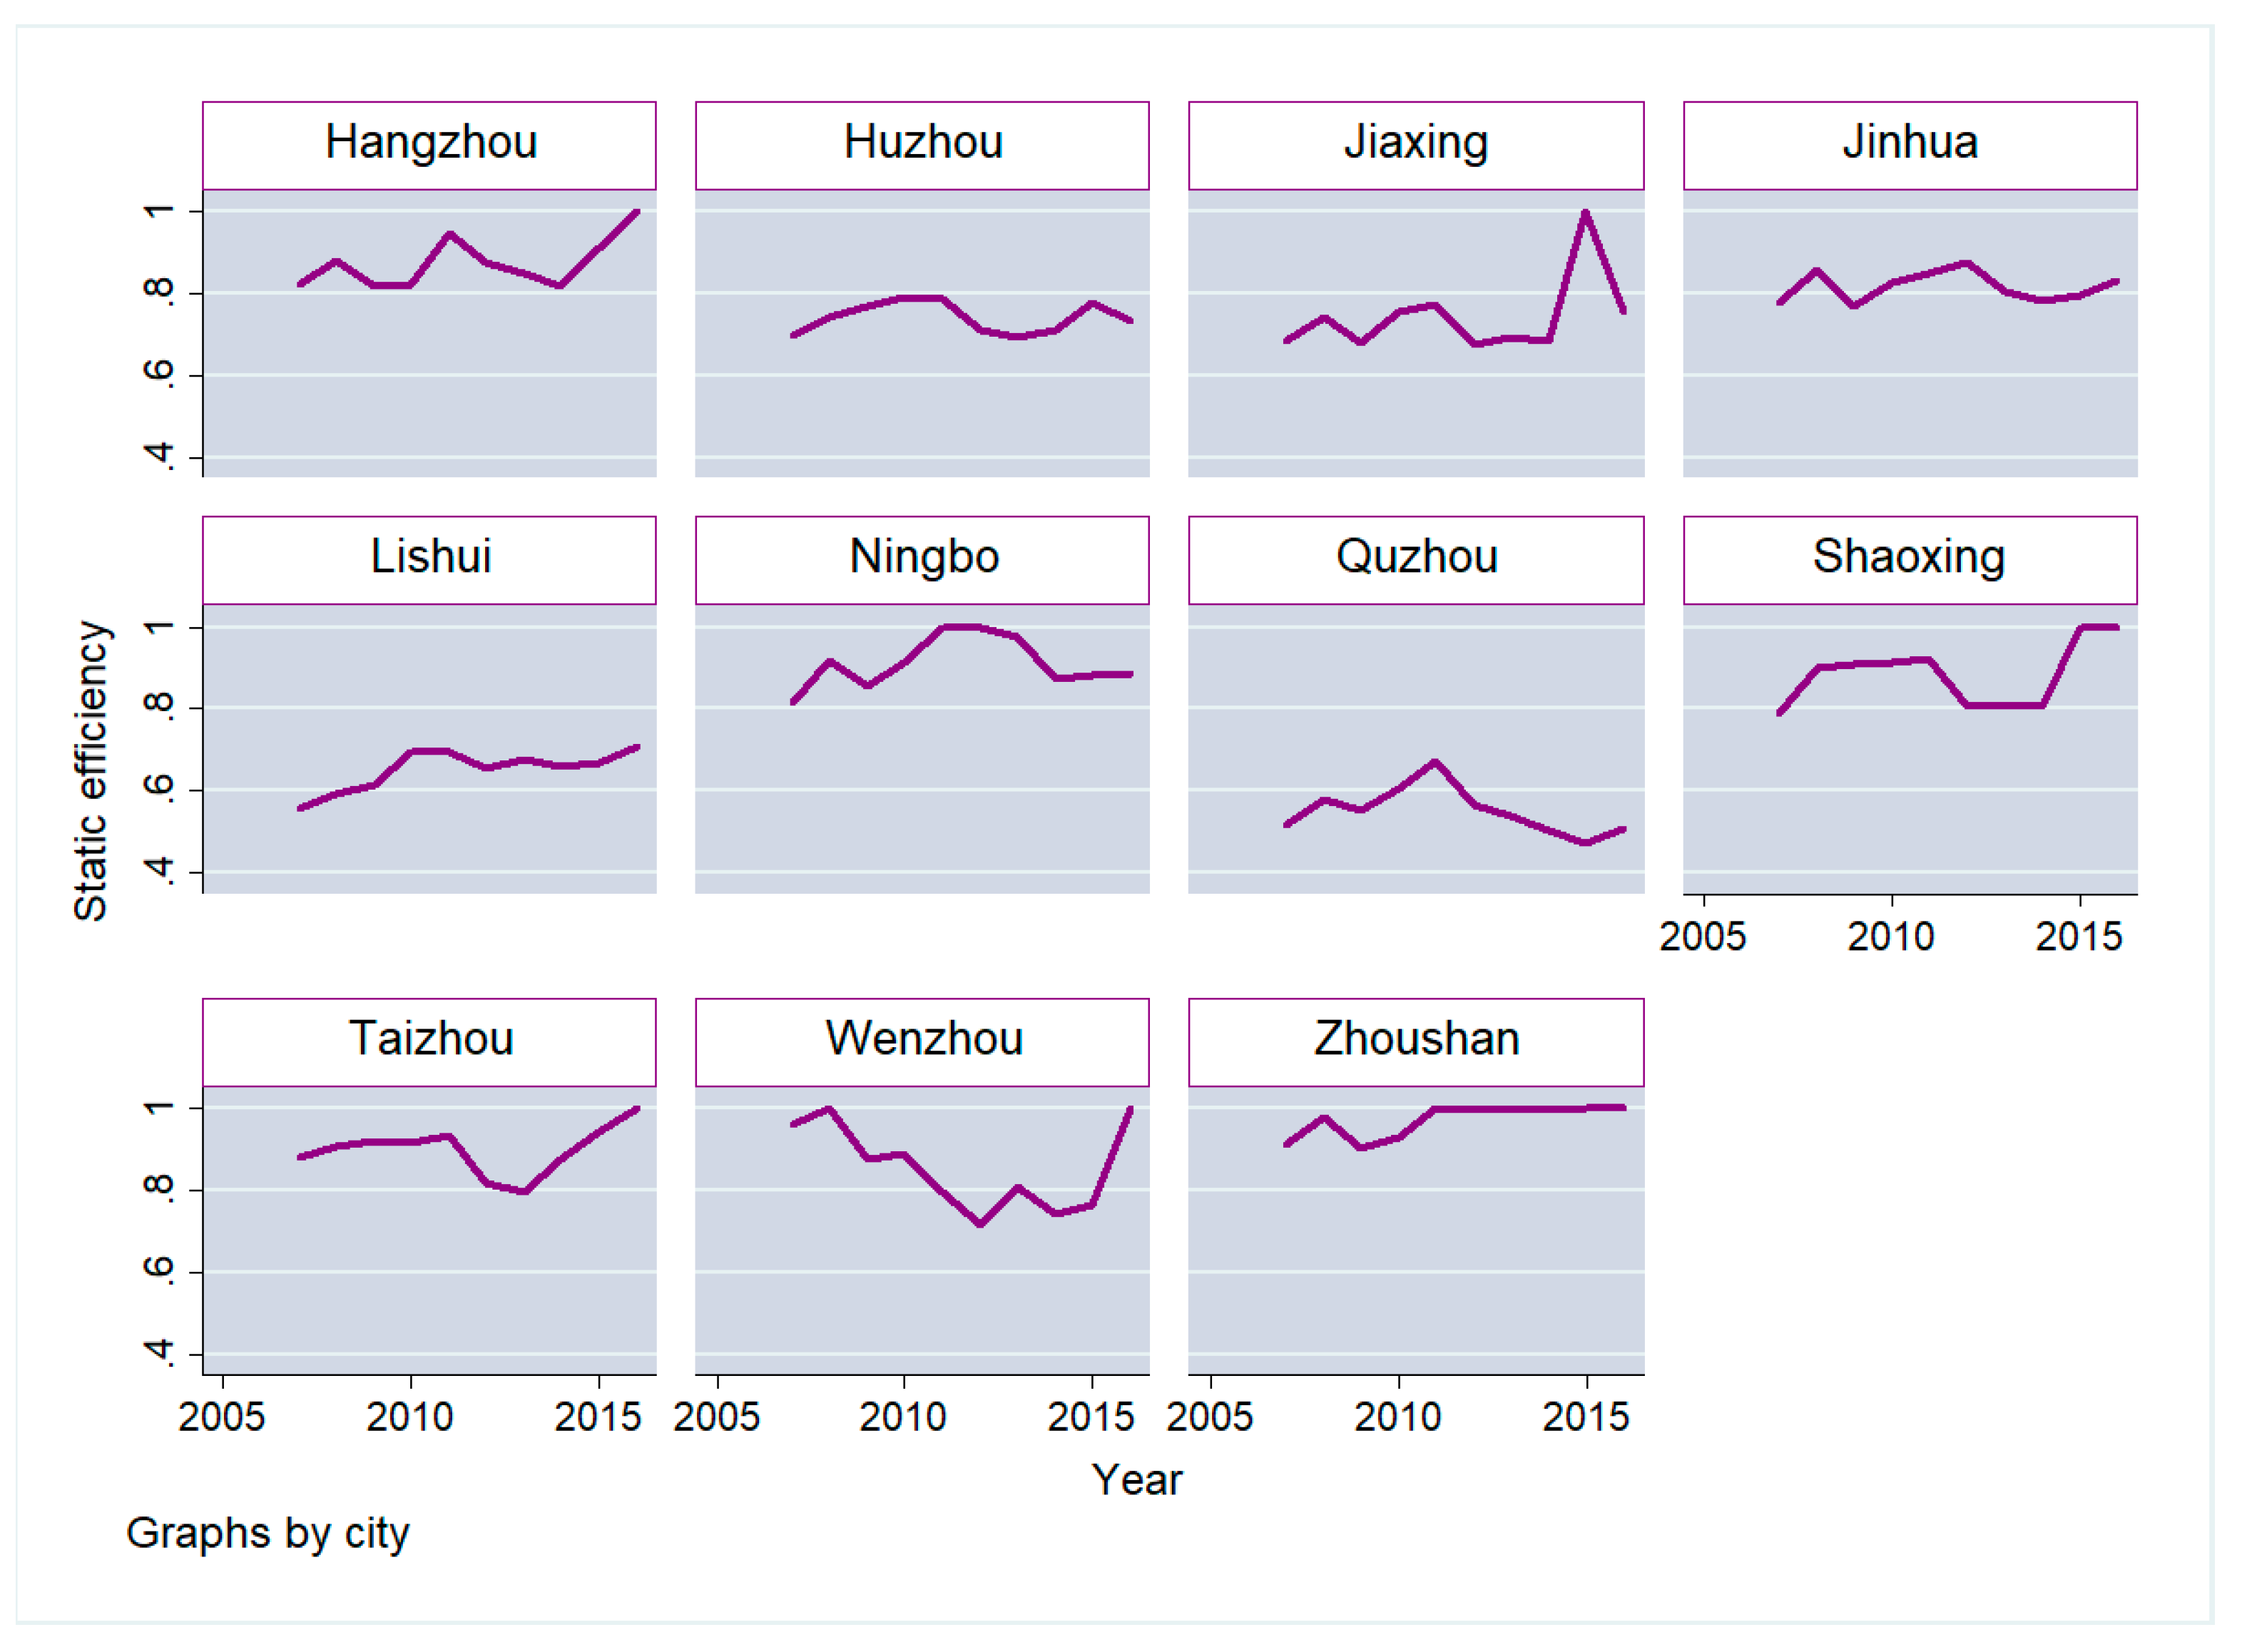
4.2. Static Efficiency of Zhejiang’s Green Development and Its Regional Difference

Matlab2016A was used to evaluate efficiencies of green development in 11 Zhejiang cities and the three types of input in the time period 2007–2016. The results are shown in the Table 2.
From the Table 2, it was found that the overall static efficiency of Zhejiang was 0.844 in the time period of 2007–2016, which was 15.6% from the production frontier. No city reached 1, which means every city had improvement potential. Nevertheless, there were significant regional differences among the 11 cities (as shown in Figure 3). Shaoxing had the highest overall static efficiency, and it reached the production frontier in terms of the production factor. In addition, Zhoushan, Ningbo, Taizhou, and Hangzhou had a high overall efficiency (higher than 0.9). Quzhou had the lowest overall efficiency (below 0.6). From the perspective of single input efficiency, the production factor cost had the highest efficiency of 0.958, followed by an energy consumption efficiency and pollutant emission efficiency of 0.877 and 0.786, respectively. This indicates that environmental pollution was the most significant factor to inhibit green development in Zhejiang, followed by energy consumption. Additionally, static efficiencies of pollutant emission, energy consumption, and production factor cost showed significant regional difference. Wenzhou and Taizhou reached the production frontier while Quzhou, Huzhou, and Lishui had lower pollutant emission efficiency. It can be found in Figure 2 that Quzhou, Huzhou, and Lishui had a low amount of pollutant emission. However, the economic and technical output of these three cities are quite low, which makes the efficiencies of pollutant emission relatively low. Therefore, these three cities should not only control pollutant emission but also pay more attention to economic and technical development. From the perspective of energy consumption, Ningbo and Zhoushan reached the production frontier and Quzhou and Jinhua had much more potential to improve. From the perspective of efficiencies of production factor cost, Hangzhou, Ningbo, Shaoxing, Jinhua, and Taizhou reached the production frontier while Lishui and Jiaxing were relatively low.
The static efficiency can be divided into pure technical efficiency and scale efficiency. In particular, the NRDEA model can further obtain PE and SE of three input variables, and the results are shown in the Table 3. The average value of pure technical efficiency in Zhejiang’s 11 cities reached 0.893, while the average value of scale efficiency was 0.944. Among the three inputs, the production factor cost had the highest PE and its average level reached the production frontier. PE of pollutant emission and energy consumption had approximately 13% and 15% of improving potential, respectively. The SE of energy consumption was the highest and reached the production frontier, followed by the production factor, with a value of 0.961. Pollutant emission had the lowest SE, which was 0.899. In the pollutant emission system and energy consumption system, PE was lower than SE, which means the promotion efforts of energy saving and pollutant reduction are good but the techniques are lagging behind. Thus, not only promotion is needed, but also much attention should be paid to technical innovation and progress. The average PE of production factor has reached the production frontier, while the SE of production factor has a 4% potential increase. This indicates that increasing the input of capital and human resource can further improve the efficiency of green development.
The efficiency of green development showed significant regional difference. From the perspective of PE, the standard deviation of PE was 0.122 and larger than the deviation of SE. In terms of PE, the deviation of pollutant emission was the largest (0.205) followed by energy consumption (0.147) and production factor cost (0.101). For production factor cost, the efficiencies of all the cities were not bad, and Jiaxing, the lowest city, also reached 0.854. From the perspective of SE, the deviation of production factor cost was the largest (SD 0.111) followed by energy consumption (0.085) and pollutant emission (0.083). In terms of pollutant emissions, the SE in all cities had not yet reached the frontier of production, with Lishui the lowest (0.746). For energy consumption, the efficiencies of all the cites reached 0.9, which showed barely no significant regional difference.

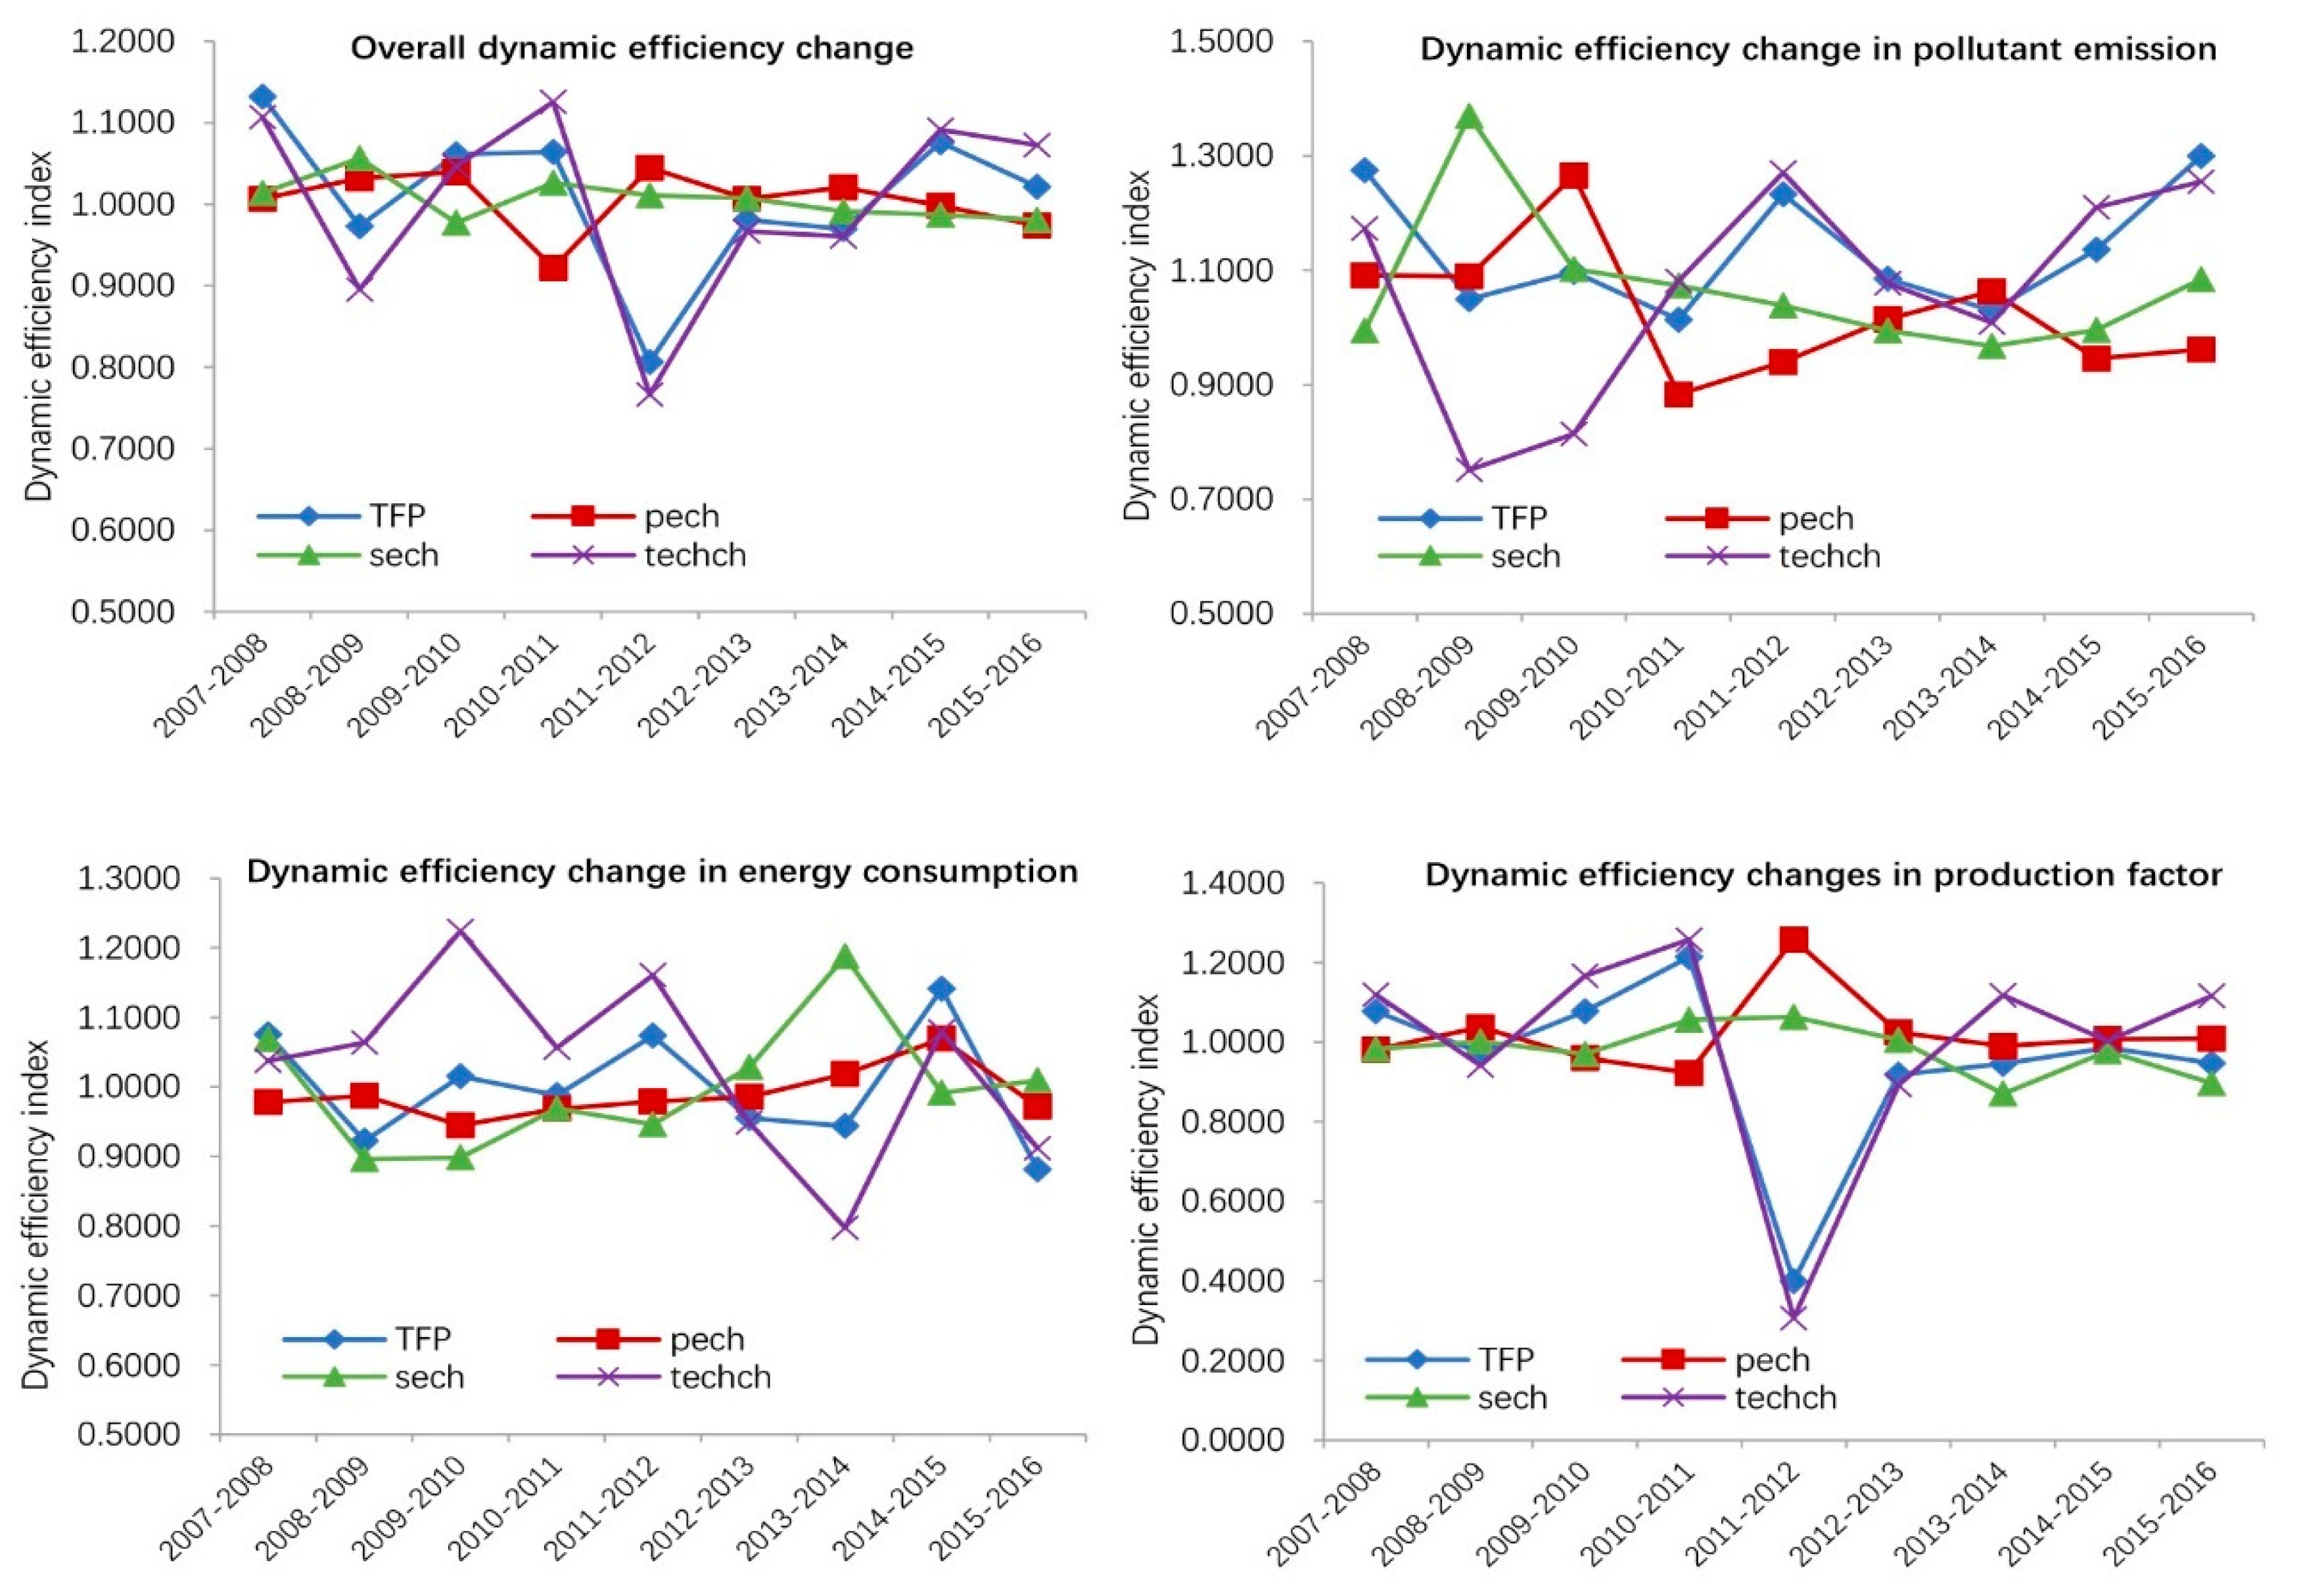
4.3. Dynamic Efficiency Evolution of Green Development in Zhejiang Province

In order to better analyze the dynamic efficiency evolution process of Zhejiang’s green development, the NRDEA model based on the Malmquist index was used to measure the total factor productivity of green development and decomposed it into pure technical efficiency change, scale efficiency change, and technological change. Figure 4 is the TFP and decomposition index of the green development efficiency of Zhejiang Province as a whole and various inputs.
It can be seen from Figure 4 that over the ten years, the TFP fluctuated around 1 and the average was greater than 1. This shows that in the past ten years, the green development efficiency of Zhejiang has shown volatile growth. Among them, the pure technical efficiency change and scale efficiency change showed fluctuating growth, while the technological change showed a fluctuating decline. The technological change curve was consistent with the overall TFP curve. Technical change was the most important factor driving the change in total factor productivity. Regarding the dynamic efficiency of pollutant emission, from 2007 to 2016, the TFP of each year was greater than 1. The pure technical efficiency change, scale efficiency change, and technological change all showed fluctuating growth. Regarding the dynamic efficiency of energy consumption, its pure technical efficiency and scale efficiency fluctuated downward, while the technological change fluctuated upward. The TFP fluctuated and the average was greater than 1, which means the efficiency showed fluctuating growth. Regarding the dynamic changes of production factor cost, although pure technology efficiency fluctuated and increased, due to changes in scale efficiency and technological changes, most of them have a TFP of less than 1, especially from 2011 to 2012.
The specific annual decomposition index of each input variable is further listed, as shown in Table 4. For the dynamic efficiency growth index, Malmquist’s annual average total factor growth rate of pollutant emission was the highest, with an average annual growth rate of 12.06%, while energy consumption and production factor cost had negative growth of −1.11% and -9.52%, respectively. For the pure technology efficiency change index, production factor cost (1.44%) had a small growth, followed by pollutant emission (1.28%), while energy consumption (−1.90%) had a small decline, and the overall annual average pure technology efficiency change slightly increased. For the change in scale efficiency, pollutant emission (5.61%) increased and energy consumption (−1.01%) and production factor cost (−2.86%) decreased. For technological change, pollutant emission (4.92%) experienced a certain degree of technological change, energy consumption (1.84%) had a small growth, and production factor cost (−7.53%) decreased significantly. Among the three decomposition indices, the contribution to the improvement of the dynamic efficiency of green development in Zhejiang Province was scale efficiency change (0.46%) and pure technology efficiency (0.22%). Technology (−0.43%) restricted the dynamic efficiency of green development. This was mainly caused by the inefficiency of production factor cost. In addition, there were also significant differences in the decomposition index of different input perspectives. The improvement of total factor productivity in pollutant emission was mainly driven by three-wheeled changes in pure technological efficiency, scale efficiency, and technological change, while energy consumption was driven mainly by one-wheeled technical changes; production factor cost was driven by single-wheeled pure technology efficiency change. Therefore, in the improvement of the green development efficiency in Zhejiang Province, it is necessary to pay attention to the coordinated development among pure technical efficiency changes, scale efficiency changes, and technological changes. On the one hand, it is necessary to maintain or increase the technological change index through measures such as training professional talents and actively researching and using new energy; on the other hand, it is necessary to accelerate the elimination of backward production capacity and adjust the industrial structure to improve the pure technical efficiency change index of energy consumption. By optimizing investment quality and resource element allocation, the scale efficiency index of energy consumption and production factor cost can be improved.

4.4. Regional Differences in the Dynamic Evolution of Green Development Efficiency in Zhejiang Province

Due to the different energy structure, industrial structure, factor allocation, and degree of urbanization development in different cities, there are regional differences in the dynamic evolution of green development. Table 5 shows the calculation and decomposition results of the average annual dynamic efficiency of green development in cities in Zhejiang Province. It can be seen that, the overall efficiencies of Hangzhou, Huzhou, Shaoxing, Quzhou, Zhoushan, and Lishui improved from 2007 to 2016. The fastest growth rate was Shaoxing (1.052) followed by Hangzhou (1.018) and Lishui (1.016). From the perspective of input, the dynamic efficiency of pollutant emission in all cities was greater than 1, which was an increasing trend, while the production factor cost in all cities had a downward trend. The reason may be, on the one hand, because Zhejiang Province had been deepening the supply-side structural reforms and the market environment had undergone adjustment and adaptation in the previous 10 years, which had led many conservative companies to hesitate in investing in production factors on a large scale. On the other hand, with the sharp increase in university graduates, the number of available jobs had decreased, and the levels of economic development in cities had been inconsistent, resulting in uneven talent allocation and insufficient optimization efforts.
Further study of the regional differences of the decomposed indices showed that, in terms of changes in pure technology efficiency, the changes in the pure technology efficiency indices of Huzhou, Shaoxing, Lishui, Jiaxing, and Quzhou were greater than 1, which indicated an upward trend; Hangzhou, Ningbo, and Zhoushan were 1.000, which indicated a steady development trend; and Jinhua, Wenzhou, and Taizhou were less than 1, which means that they were going backwards, indicating that these three cities had not fully realized their potential for new products and technologies. Regarding the change in scale efficiency, except for Wenzhou, Jinhua, Huzhou, and Taizhou, which were slightly less than 1, the remaining cities were all greater than 1, which shows a slight improvement. From the perspective of technological change, all cities except Shaoxing and Jinhua were less than 1, and technological progress is the most important factor that restricts overall efficiency growth. This also shows that Zhejiang has not fully relied on production and technological progress in the past decade to eliminate backward production capacity and adjust the industrial structure.

4.5. Analysis of Influencing Factors of Green Development Efficiency in Zhejiang Province

From the above analysis, it can be seen that there are significant differences in the green development efficiency of the 11 cities in Zhejiang Province. Therefore, it is of great practical significance to explore the influencing factors of the green development efficiency of each city to reveal the internal causes of regional differences. In order to make the static efficiency data of each year comparable, the input‒output indicators of the 11 cities were first aggregated, and then the DEA model efficiency measurement was performed based on a fictional common frontier (Figure 5).
The regression analysis was performed by Stata14 software, and the results are shown in Table 6. The model was tested for cross-section correlation and heteroscedasticity, so Driscoll‒Kraay standard error estimation results were used.
According to the regression results, specific indicators were analyzed. The indicators that had a significant impact on the green development effect were industrial structure, environmental regulations, and urbanization levels. Among them, (1) the industrial structure had a positive effect on green development efficiency, which shows that industrialization has a significant role in promoting green development efficiency in Zhejiang Province. Zhejiang Province is vigorously promoting various new high-tech green industries and upgrading traditional industries. Industrial structure transformation and upgrading has become the most important driving force for improving the green development efficiency of Zhejiang Province. However, environmental regulations had a negative effect on the efficiency of green development. The reasons might be as follows: First, increasing investment in pollution treatment increases production costs in terms of equipment and manpower to a certain extent, thereby hindering economic growth; Second, environmental regulations are still in the stage of pollution first and then governance. The higher the proportion of pollution treatment investment in GDP, the more severe pollution exists, which means it is hard for it to play a role in promoting green development. The level of urbanization had a deterrent effect on the efficiency of green development. This is because the process of urbanization since China’s reform and opening up has adopted extensive development with disorderly expansion. The process of urbanization is faster than the process of industrialization, while the degree of coupling and coordination between the level of urbanization and the level of green development is low. The agricultural ecological space and the green ecological space have shrunk sharply, and urban construction also brings environmental pollution, which causes greater resource and environmental problems [66]. Economic development, scientific research investment, and foreign investment have not yet made a significant contribution to the green development efficiency of Zhejiang Province. In the past ten years, Zhejiang Province’s rapid economic growth and increasing technological investment have not significantly promoted the efficiency of green development. This might be due to the over-aggregation of high-end green production factors such as talent, information, and funds, resulting in mismatched factors. The effect of foreign investment on the green development efficiency of Zhejiang Province is extremely weak. There is no obvious "pollution refuge" phenomenon, and there is no obvious FDI technology spillover to promote green development effects.

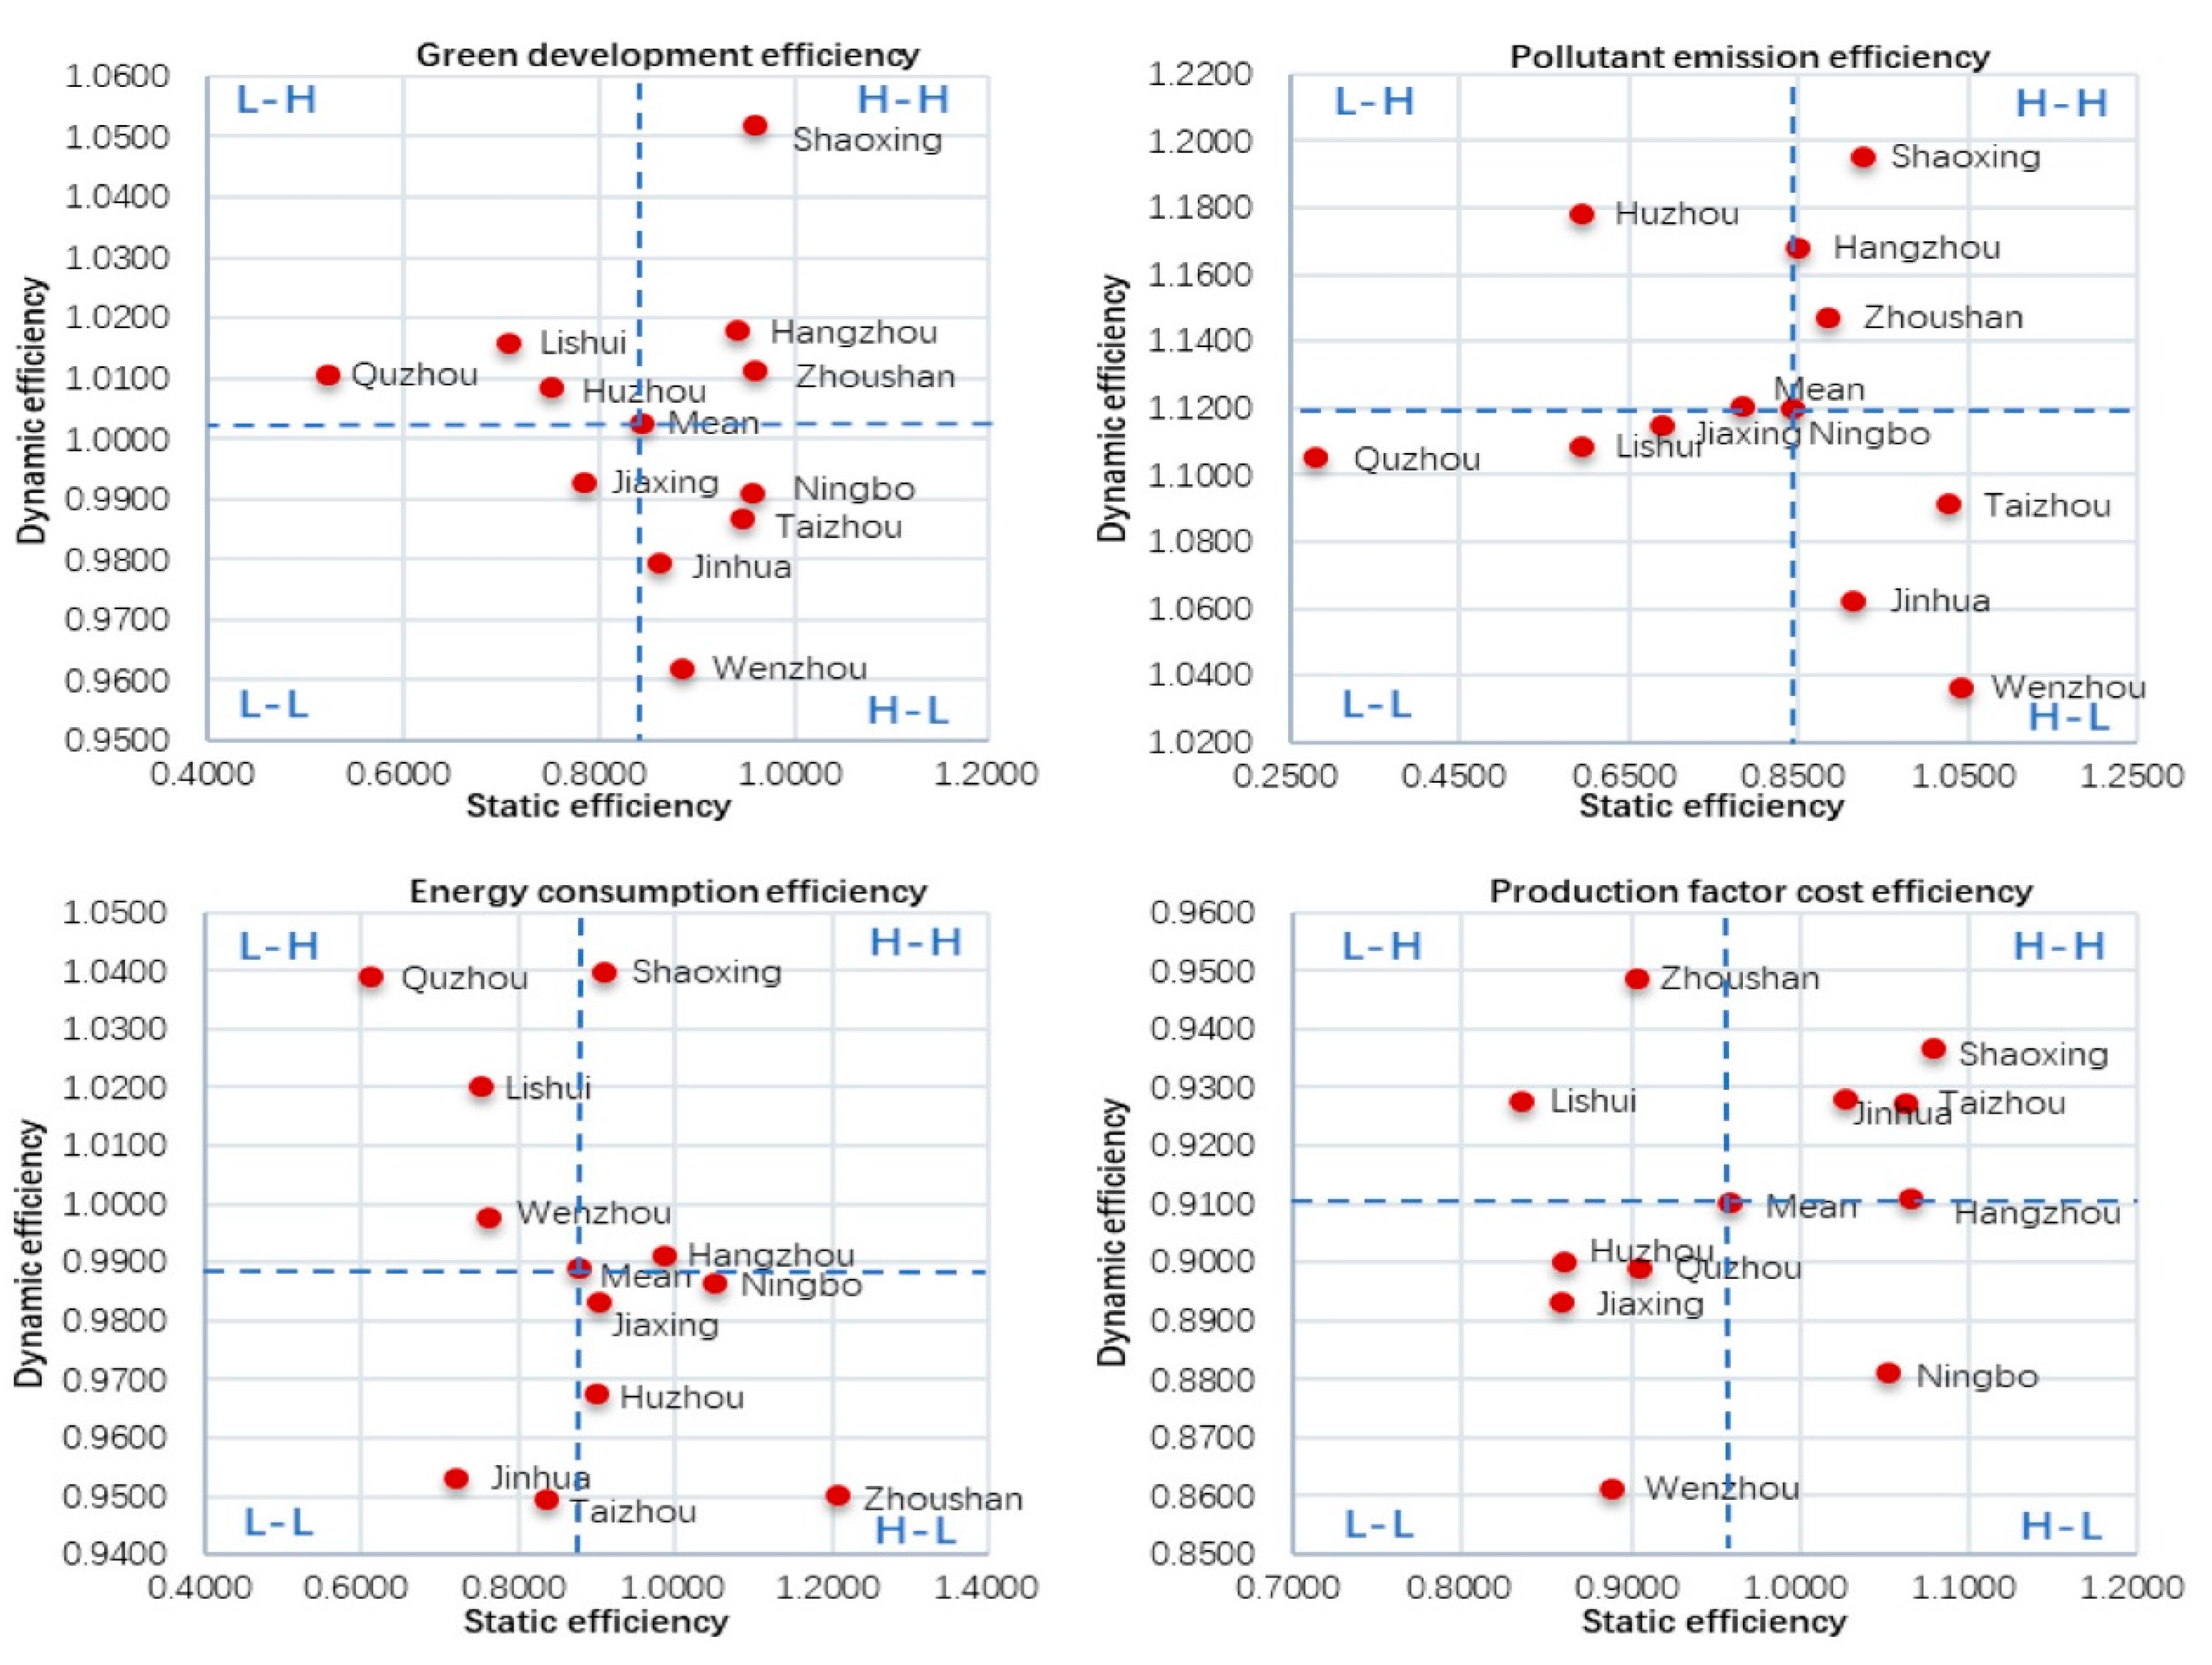
4.6. Classification Quadrants of Green Development in Zhejiang Province

Combining the static and dynamic efficiency characteristics of the 11 cities in Zhejiang Province with the overall average level of the 11 cities as the boundary, those that are greater than the mean were classified as H, and those that are less than the mean were classified as L. The quadrants of the 11 cities in Zhejiang Province were divided into 4 categories, and the quadrants of classification of the overall green development efficiency, pollution discharge efficiency, energy consumption efficiency, and production factor input efficiency of the 11 cities in Zhejiang Province were plotted. The results are shown in Figure 6.
It can be seen from Figure 6 that the number of the four types of cities with green development in Zhejiang Province was relatively even. Among them, Jiaxing was in the L‒L quadrant. It not only had low static efficiency, but also had low dynamic efficiency and a lack of catch-up potential. The reason is that its static and dynamic efficiency in terms of pollutant emission and production factor cost were both at backward levels. Quzhou, Lishui, and Huzhou were located in the L‒H quadrant. Although these three cities had low static efficiency, they had the potential to be upgraded quickly and had great potential for future development. It can be seen from the following three graphs that at a certain output value, Quzhou’s improvement in emission reduction and production factor cost was seriously insufficient, and Huzhou had a relatively low efficiency in the production factor cost. The cities in the H‒L quadrant included Ningbo, Taizhou, Jinhua, and Wenzhou. Although these cities had high static efficiency, they had low dynamic efficiency and tended to be surpassed by other cities. Shaoxing, Hangzhou, and Zhoushan were in the H‒H quadrant. These cities not only had high static efficiency, but also increased quickly, so they were leading the way in green development.

5. Discussion and Policy Implications

Compared with the existing research on the green development efficiency from a single pollution emission factor, energy consumption factor, and economic factor, this study uses the entropy weight method to optimize the input variables and measures the efficiency through the NRDEA model, and therefore the results are more objective. The results show that pollution emission has the greatest potential for improvement, and cities in Zhejiang Province are evenly distributed in the “static‒dynamic efficiency” classification quadrants, which are consistent with previous research results [21]. Due to the limitation of relevant data sources, when considering the impact of transportation on energy consumption, this study uses the number of private vehicle ownership as a measurement, and the positive impact of public transportation and new energy transportation have not been discussed in depth. This is where we need further attention in the future.
Based on the foregoing results, the following policy implications are: (1) A reasonable industrial structure has a positive effect on green development. Pure technical efficiency is the main factor limiting static efficiency, and technological progress is not enough to promote dynamic efficiency in green development. Therefore, cities should further improve production technology and adjust and upgrade industrial structure. (2) Environmental regulation that first pollutes and then treats cannot effectively promote green regional development. Therefore, more environmentally friendly production technologies should be implemented. At the same time, supervision must be strengthened, emission standards must be strictly controlled, and efforts must be made from the source of pollution. (3) The level of urbanization has a negative effect on green regional development. The government should pay attention to the rational layout of urban functions and industries and coordinate the development of the ecological environment and urbanization. (4) There are regional differences among cities, so we should proceed from the classification quadrant where we are located and take corresponding measures to address our own deficiencies. For example, in terms of pollution discharge, industry development standards such as environmental protection, energy saving, safety, and high quality should be strictly implemented, and pollution control efforts should be increased. In terms of energy consumption, measures such as accelerating the development of urban public transportation, formulating green transportation policies, and encouraging car buyers to preferentially select new-energy vehicles can be taken. In terms of production factors, we can focus on introducing and cultivating scientific and technological innovation talents and forming a talent team that supports green urbanization. In addition, for H‒H cities, they should also give full play to their regional advantages and export advanced innovation and management experience to other cities.

6. Conclusions

This article starts with the internal mechanism of improving the efficiency of green development in Zhejiang Province and looks at it from three perspectives: environmental pollutant emission, energy consumption, and production factor cost. Based on the non-radial DEA model, Malmquist index, and panel data model, the spatial and temporal evolution pattern of green development efficiency in 11 cities in Zhejiang Province from 2007 to 2016 was evaluated and analyzed, and the internal factors were further analyzed. The conclusions are as follows:
(1)
The average static efficiency of green development in Zhejiang Province from 2007 to 2016 was 0.844. There is still a 15.6% improvement space from the frontier of production. Pollution emission management has the greatest improvement potential followed by energy conservation and consumption reduction. Pure technical efficiency is the main factor restricting the static efficiency of Zhejiang’s green development.
(2)
The dynamic efficiency of green development achieved an average annual rate of 0.26%, with a cumulative growth of 2.33%. Shaoxing had the fastest pace, followed by Hangzhou and Lishui. Of the three inputs, the greatest contribution to overall efficiency improvement is the efficiency of pollutant emission, while the efficiency of energy consumption and production factor cost play negative roles. The improvement of green development efficiency mainly depends on scale efficiency change.
(3)
The inherent factors affecting the efficiency of green development in the 11 cities mainly include three factors: industrial structure, environmental regulation, and urbanization level. The industrial structure has a positive effect, and environmental regulation and urbanization level have a negative effect. It is necessary to improve the efficiency of green development by further promoting industrial upgrading and transformation, adjusting environmental policies, and enhancing the synergy between green development and urbanization.
(4)
The 11 cities are relatively evenly distributed in the four “static-dynamic efficiency” classification quadrants, and there is no “Matthew effect” of High–High, Low–Low polarization. In the future, we should fully consider the actual conditions of different cities, formulate differentiated environmental protection and energy and talent policies, and effectively improve the efficiency of green development.
Based on the above results, we can conclude that the main ways to improve the green development efficiency of Zhejiang Province are as follows: first, while developing the economy, we must adhere to the consideration of ecological benefits. Industrial transformation and upgrading must be accelerated to achieve a better green development outcome. Second, we should consider the characteristics of regional differences, taking into account transportation, industry, and residents’ living conditions and implement a regional, diversified, and comprehensive green development strategy. Third, the government should pay attention to the rational distribution of urban functions and industries and coordinate the ecological environment and urbanization development. Exchanges and cooperation between technological innovation and environmental governance should be strengthened and advanced pollution control experience and technology should be shared, along with green innovation in high-polluting enterprises being promoted. Fourth, we must focus on cultivating and introducing scientific and technological innovation talents and promote green regional development by forming a team of talents that support green urbanization.

Author Contributions

Conceptualization, Y.L. and Y.H.; methodology and software, Y.L.; validation, B.C.; formal analysis, L.D.; investigation, B.C. and Y.H.; data curation, Y.L. and L.D.; writing—original draft preparation, Y.L. and L.D.; writing—review and editing, Y.L. and L.D.; visualization, Y.L. and L.D.; supervision, L.D.; funding acquisition, Y.L. All authors have read and agreed to the published version of the manuscript.

Funding

This research was funded by the Project of Philosophy and Social Planning in Ningbo (Grant No. G20-ZX16), the Project of Ningbo Polytechnic (Grant No. NZ20Q012) and the Soft Science Research Project in Zhejiang Province (Grant No.2019C35108).

Conflicts of Interest

The authors declare no conflict of interest.

References

  1. Wu, H.; Li, Y.; Hao, Y.; Ren, S.; Zhang, P. Environmental decentralization, local government competition, and regional green development: Evidence from China. Sci. Total Environ. 2020, 708, 135085. [Google Scholar] [CrossRef]
  2. Hua, C.; Chen, J.; Wan, Z.; Xu, L.; Bai, Y.; Zheng, T.; Fei, Y. Evaluation and governance of green development practice of port: A sea port case of China. J. Clean. Prod. 2020, 249, 119434. [Google Scholar] [CrossRef]
  3. Pearce, D.; Markandya, A.; Barbier, E.B. Blueprint for a Green Economy Earthscan; Publications Limited: London, UK, 1989. [Google Scholar]
  4. Pearce, D. Blueprint 2: Greening the World Economy; Routledge: London, UK, 2013. [Google Scholar]
  5. Adams, B. Green Development: Environment and Sustainability in a Developing World; Routledge: London, UK, 2008. [Google Scholar]
  6. Wang, M.X.; Zhao, H.H.; Cui, J.X.; Fan, D.; Lv, B.; Wang, G.; Li, Z.H.; Zhou, G.J. Evaluating green development level of nine cities within the Pearl River Delta, China. J. Clean. Prod. 2018, 174, 315–323. [Google Scholar] [CrossRef]
  7. Brown, D.; McGranahan, G. The urban informal economy, local inclusion and achieving a global green transformation. Habitat Int. 2016, 53, 97–105. [Google Scholar] [CrossRef] [Green Version]
  8. Feng, C.; Wang, M.; Liu, G.C.; Huang, J.B. Green development performance and its influencing factors: A global perspective. J. Clean. Prod. 2017, 144, 323–333. [Google Scholar] [CrossRef]
  9. Grillitsch, M.; Hansen, T. Green industry development in different types of regions. Eur. Plan. Stud. 2019, 27, 2163–2183. [Google Scholar] [CrossRef] [Green Version]
  10. Wang, C.; Wood, J.; Wang, Y.J.; Geng, X.R.; Long, X.L. CO2 emission in transportation sector across 51 countries along the Belt and Road from 2000 to 2014. J. Clean. Prod. 2020, 266, 122000. [Google Scholar] [CrossRef]
  11. Moslem, S.; Ghorbanzadeh, O.; Blaschke, T.; Duleba, S. Analysing Stakeholder Consensus for a Sustainable Transport Development Decision by the Fuzzy AHP and Interval AHP. Sustainability 2019, 11, 3271. [Google Scholar] [CrossRef] [Green Version]
  12. Ghobanzadeh, O.; Moslem, S.; Blaschke, T.; Duleba, S. Sustainable urban transport planning considering different stakeholder groups by an interval-AHP decision support model. Sustainability 2019, 11, 9. [Google Scholar] [CrossRef] [Green Version]
  13. Duleba, S.; Moslem, S. Examining Pareto optimality in analytic hierarchy process on real Data: An application in public transport service development. Expert Syst. Appl. 2019, 116, 21–30. [Google Scholar] [CrossRef]
  14. Duleba, S.; Moslem, S. Sustainable Urban Transport Development with Stakeholder Participation, an AHP-Kendall Model: A Case Study for Mersin. Sustainability 2018, 10, 3647. [Google Scholar] [CrossRef] [Green Version]
  15. Guo, W. Insights from the Fifth Plenary Session of the 18th CPC Central Committee on indigenization of the path of development of social work in China. China J. Soc. Work 2016, 9, 92–95. [Google Scholar] [CrossRef]
  16. Zheng, X. Promoting the Concept of Innovative, Coordinated, Green, Open and Shared Development. In China’s 40 Years of Economic Reform and Development; Springer: Singapore, 2018; pp. 165–172. [Google Scholar]
  17. Li, X.; Du, J.; Long, H. A comparative study of Chinese and foreign green development from the perspective of mapping knowledge domains. Sustainability 2018, 10, 4357. [Google Scholar] [CrossRef] [Green Version]
  18. Colglazier, W. Sustainable development agenda: 2030. Science 2015, 349, 1048–1050. [Google Scholar] [CrossRef]
  19. Schneider, F.; Kläy, A.; Zimmermann, A.B.; Buser, T.; Ingalls, M.; Messerli, P. How can science support the 2030 Agenda for Sustainable Development? Four tasks to tackle the normative dimension of sustainability. Sustain. Sci. 2019, 14, 1593–1604. [Google Scholar] [CrossRef] [Green Version]
  20. National Bureau of Statistics of China. China Statistic Yearbook; China Statistics Press: Beijing, China, 2019. [Google Scholar]
  21. Lu, Y.-Y.; He, Y.; Wang, B.; Ye, S.-S.; Hua, Y.; Ding, L. Efficiency Evaluation of Atmospheric Pollutants Emission in Zhejiang Province China: A DEA-Malmquist Based Approach. Sustainability 2019, 11, 4544. [Google Scholar] [CrossRef] [Green Version]
  22. Ding, L.; Chen, K.; Hua, Y.; Dong, H.; Wu, A. Investigating the Relationship between the Industrial Structure and Atmospheric Environment by an Integrated System: A Case Study of Zhejiang, China. Sustainability 2020, 12, 1278. [Google Scholar] [CrossRef] [Green Version]
  23. Brito, V.T.; Ferreira, F.A.; Pérez-Gladish, B.; Govindan, K.; Meidutė-Kavaliauskienė, I. Developing a green city assessment system using cognitive maps and the Choquet Integral. J. Clean. Prod. 2019, 218, 486–497. [Google Scholar] [CrossRef]
  24. Yang, Q.; Wan, X.; Ma, H. Assessing green development efficiency of municipalities and provinces in China integrating models of super-efficiency DEA and malmquist index. Sustainability 2015, 7, 4492–4510. [Google Scholar] [CrossRef] [Green Version]
  25. Li, X.; Cai, N.; Liu, Y. Approaches to Measure HGDI; Human Green Development Report 2014; Springer: Berlin/Heidelberg, Germany, 2014; pp. 17–20. [Google Scholar]
  26. Wang, N.; Lee JC, K.; Zhang, J.; Chen, H.; Li, H. Evaluation of Urban circular economy development: An empirical research of 40 cities in China. J. Clean. Prod. 2018, 180, 876–887. [Google Scholar] [CrossRef]
  27. Brown, M.T.; Ulgiati, S. Emergy evaluations and environmental loading of electricity production systems. J. Clean. Prod. 2002, 10, 321–334. [Google Scholar] [CrossRef]
  28. Siche, J.R.; Agostinho, F.; Ortega, E.; Romeiro, A. Sustainability of nations by indices: Comparative study between environmental sustainability index, ecological footprint and the energy performance indices. Ecol. Econ. 2008, 66, 628–637. [Google Scholar] [CrossRef]
  29. Zhang, J.; Chang, Y.; Zhang, L.; Li, D. Do technological innovations promote urban green development?—A spatial econometric analysis of 105 cities in China. J. Clean. Prod. 2018, 182, 395–403. [Google Scholar] [CrossRef]
  30. Viglia, S.; Civitillo, D.F.; Cacciapuoti, G.; Ulgiati, S. Indicators of environmental loading and sustainability of urban systems. An emergy-based environmental footprint. Ecol. Indic. 2018, 94, 82–99. [Google Scholar] [CrossRef]
  31. Pan, H.; Zhuang, M.; Geng, Y.; Wu, F.; Dong, H. Emergy-based ecological footprint analysis for a mega-city: The dynamic changes of Shanghai. J. Clean. Prod. 2019, 210, 552–562. [Google Scholar] [CrossRef]
  32. Boyd, J. Nonmarket benefits of nature: What should be counted in green GDP? Ecol. Econ. 2007, 61, 716–723. [Google Scholar] [CrossRef]
  33. Yu, Y.; Yu, M.; Lin, L.; Chen, J.; Li, D.; Zhang, W.; Cao, K. National Green GDP Assessment and Prediction for China Based on a CA-Markov Land Use Simulation Model. Sustainability 2019, 11, 576. [Google Scholar] [CrossRef] [Green Version]
  34. Blengini, G.A.; Busto, M.; Fantoni, M.; Fino, D. Eco-efficient waste glass recycling: Integrated waste management and green product development through LCA. Waste Manag. 2012, 32, 1000–1008. [Google Scholar] [CrossRef]
  35. Qian, Z.M.; Liu, X.C. A study of regional differences and convergence of green economic efficiency in China. J. Xiamen Univ. Arts Soc. Sci. 2014, 1, 110–118. (In Chinese) [Google Scholar]
  36. Tao, X.; Wang, P.; Zhu, B. Provincial green economic efficiency of China: A non-separable input–output SBM approach. Appl. Energy 2016, 171, 58–66. [Google Scholar] [CrossRef]
  37. Mu, X.Y.; Liu, K.; Ren, J.L. Spatial differentiation and change of green production efficiency in China. Prog. Geogr. 2017, 36, 1006–1014. (In Chinese) [Google Scholar]
  38. Zhang, J.; Chang, Y.; Wang, C.; Zhang, L. The green efficiency of industrial sectors in China: A comparative analysis based on sectoral and supply-chain quantifications. Resour. Conserv. Recycl. 2018, 132, 269–277. [Google Scholar] [CrossRef]
  39. Luo, L.W.; Liang, S.R. Green technology innovation efficiency and factor decomposition of China’s industrial enterprises. China Popul. Resour. Environ. 2016, 26, 149–157. (In Chinese) [Google Scholar]
  40. Yao, X.; Feng, W.; Zhang, X.; Wang, W.; Zhang, C.; You, S. Measurement and decomposition of industrial green total factor water efficiency in China. J. Clean. Prod. 2018, 198, 1144–1156. [Google Scholar] [CrossRef]
  41. Lin, X.; Yang, J. Supporting green transportation with transport impact assessment: Its deficiency in Chinese cities. Transp. Res. Part D Transp. Environ. 2019, 73, 67–75. [Google Scholar] [CrossRef]
  42. Musolino, G.; Rindone, C.; Vitetta, A. Passengers and freight mobility with electric vehicles: A methodology to plan green transport and logistic services near port areas. Transp. Res. Procedia 2019, 37, 393–400. [Google Scholar] [CrossRef]
  43. Quan, B.; Xu, D. China’s urban transport policy: From car-oriented to people-oriented cities. In Handbook on Transport and Urban Transformation in China; Edward Elgar Publishing: Cheltenham, UK, 2020. [Google Scholar]
  44. Wang, M.; Lin, X.; Yu, L. Comprehensive evaluation of green transportation in Chongqing main urban area based on sustainable development theory. Syst. Sci. Control Eng. 2019, 7, 369–378. [Google Scholar] [CrossRef]
  45. Cheng, Y.; Shao, T.; Lai, H.; Shen, M.; Li, Y. Total-Factor Eco-Efficiency and Its Influencing Factors in the Yangtze River Delta Urban Agglomeration, China. Int. J. Environ. Res. Public Health 2019, 16, 3814. [Google Scholar] [CrossRef] [Green Version]
  46. Halkos, G.E.; Tzeremes, N.G.; Kourtzidis, S.A. Measuring sustainability efficiency using a two-stage data envelopment analysis approach. J. Ind. Ecol. 2016, 20, 1159–1175. [Google Scholar] [CrossRef]
  47. Wu, C.Y.; Guo, L.L.; Yu, J.T. Evaluation model and empirical study of regional green growth system based on TOPSIS and Grey Relational Analysis. Manag. Rev. 2017, 1, 23. (In Chinese) [Google Scholar]
  48. Yuan, W.; Li, J.; Meng, L.; Qin, X.; Qi, X. Measuring the area green efficiency and the influencing factors in urban agglomeration. J. Clean. Prod. 2019, 241, 118092. [Google Scholar] [CrossRef]
  49. Che, L.; Bai, Y.; Zhou, L. Spatial Pattern and Spillover Effects of Green Development Efficiency in China. Sci. Geogr. Sin. 2018, 38, 1788–1798. (In Chinese) [Google Scholar]
  50. Cheng, Y.; Wang, J.J.; Wang, Y.P.; Ren, J.L. A comparative research of the spatial-temporal evolution track and influence mechanism of green development in China. Geogr. Res. 2019, 38, 2745–2765. (In Chinese) [Google Scholar]
  51. Ma, L.; Long, H.; Chen, K.; Tu, S.; Zhang, Y.; Liao, L. Green growth efficiency of Chinese cities and its spatio-temporal pattern. Resour. Conserv. Recycl. 2019, 146, 441–451. [Google Scholar] [CrossRef]
  52. Huang, J.; Yang, X.; Cheng, G.; Wang, S. A comprehensive eco-efficiency model and dynamics of regional eco-efficiency in China. J. Clean. Prod. 2014, 67, 228–238. [Google Scholar] [CrossRef]
  53. Bai, Y.; Hua, C.; Jiao, J.; Yang, M.; Li, F. Green efficiency and environmental subsidy: Evidence from thermal power firms in China. J. Clean. Prod. 2018, 188, 49–61. [Google Scholar] [CrossRef]
  54. Zhu, B.; Zhang, M.; Huang, L.; Wang, P.; Su, B.; Wei, Y.M. Exploring the effect of carbon trading mechanism on China’s green development efficiency: A novel integrated approach. Energy Econ. 2019, 85, 104601. [Google Scholar] [CrossRef]
  55. Wang, Z.; Wang, X.; Liang, L. Green economic efficiency in the Yangtze River Delta: Spatiotemporal evolution and influencing factors. Ecosyst. Health Sustain. 2019, 5, 20–35. [Google Scholar] [CrossRef] [Green Version]
  56. Yan, J.H.; Feng, C.H.; Li, L. Sustainability assessment of machining process based on extension theory and entropy weight approach. Int. J. Adv. Manuf. Technol. 2014, 71, 1419–1431. [Google Scholar] [CrossRef]
  57. Jiang, B.; Ding, L.; Fang, X. Sustainable development of new urbanization from the perspective of coordination: A new complex system of Urbanization‒Technology Innovation and the Atmospheric Environment. Atmosphere 2019, 10, 652. [Google Scholar] [CrossRef] [Green Version]
  58. Liang, X.; Liang, W.; Zhang, L.; Guo, X. Risk assessment for long-distance gas pipelines in coal mine gobs based on structure entropy weight method and multi-step backward cloud transformation algorithm based on sampling with replacement. J. Clean. Prod. 2019, 227, 218–228. [Google Scholar] [CrossRef]
  59. Caves, D.W.; Christensen, L.R.; Diewert, W.E. Multilateral comparisons of output, input, and productivity using superlative index numbers. Econ. J. 1982, 92, 73–86. [Google Scholar] [CrossRef]
  60. Breusch, T.S.; Pagan, A.R. The lagrange multiplier test and its applications to model specification in econometrics. Rev. Econ. Stud. 1980, 47, 239–253. [Google Scholar] [CrossRef]
  61. Dong, J.C.; He, J.; Li, X.T.; Mou, X.D.; Dong, Z. The Effect of Industrial Structure Change on Carbon Dioxide Emissions: A Cross-Country Panel Analysis. J. Syst. Sci. Inf. 2020, 8, 1–16. [Google Scholar] [CrossRef]
  62. Wang, J.Y.; Wang, S.J.; Li, S.J.; Cai, Q.X.; Gao, S. Evaluating the energy-environment efficiency and its determinants in Guangdong using a slack-based measure with environmental undesirable outputs and panel data model. Sci. Total Environ. 2019, 663, 878–888. [Google Scholar] [CrossRef]
  63. Zhejiang Statistical Bureau of China. Zhejiang Statistical Yearbook (2007–2016); China Statistical Publishing House: Beijing, China, 2019. [Google Scholar]
  64. Zhejiang Statistical Bureau of China. Zhejiang Natural Resources and Statistical Yearbook on Environment (2007–2016); China Statistical Publishing House: Beijing, China, 2019. [Google Scholar]
  65. Environmental Protection Department of Zhejiang Province. Zhejiang Environmental Quality Bulletin; China Environmental Science Press: Beijing, China, 2016. [Google Scholar]
  66. Wang, B.; Tang, W.S.; WU, Y.; Zhang, N. Does Urbanization Increase China’s Green Development Efficiency? Econ. Rev. 2014, 4, 38–49. (In Chinese) [Google Scholar]
Figure 1. Zhejiang’s green development efficiency research route.
Sustainability 12 04361 g001
Figure 2. Basic levels of three types of inputs in 11 cities in Zhejiang Province from 2007 to 2016.
Sustainability 12 04361 g002
Figure 3. Overall static efficiency distribution of green development in cities in Zhejiang Province in 2007, 2010, 2013, and 2016.
Sustainability 12 04361 g003
Figure 4. Total factor productivity and decomposition indicators of the dynamic efficiency of green development in Zhejiang Province.
Sustainability 12 04361 g004
Figure 5. Common frontier-based static efficiency of Zhejiang’s 11 cities.
Sustainability 12 04361 g005
Figure 6. Quadrants of the classification of green development efficiency in the 11 cities in Zhejiang Province.
Sustainability 12 04361 g006
Table 1. Input‒output indicator system and their weight.
Indicator TypeIndicatorEntropy WeightSubjective WeightComprehensive Weight
Input variablePollutant emissionSO2 emissions/ton0.1530.0980.099
NOx emissions/ton0.1410.1000.094
Smoke dust emissions/10,000 tons0.2680.1020.181
Industrial exhaust emissions/100 million cubic meters0.2140.1120.159
Waste-water discharge/100 million tons0.2230.3150.466
Urban noise average/db0.0010.2750.001
Energy consumptionIndustrial electricity consumption/billion kilowatt hours0.3560.2730.277
Average daily water consumption/liter0.0690.3250.064
Number of private vehicle ownership0.5760.4010.659
Production factor costFixed assets investment/100 million yuan0.3490.5330.380
Number of employees at the end of the year/10,000 people0.6510.4670.620
Output variableEconomic outputRegional GDP/100 million yuan1.0001.000
Technological outputPatent authorization amount/item1.0001.000
Table 2. Static efficiency of Zhejiang’s green development in 11 Cities from 2007–2016.
CitiesPollutant EmissionEnergy ConsumptionProduction Factor CostOverall
Hangzhou0.8480.9871.0670.942
Ningbo0.8421.0511.0520.957
Wenzhou1.0420.7630.8890.887
Jiaxing0.6880.9040.8590.784
Huzhou0.5940.9010.8600.753
Shaoxing0.9270.9091.0800.961
Jinhua0.9140.7211.0270.863
Quzhou0.2820.6120.9060.524
Zhoushan0.8851.2070.9040.960
Taizhou1.0260.8371.0630.948
Lishui0.5940.7520.8360.708
Mean0.7860.8770.9580.844
SD0.2160.1590.0930.133
Table 3. pure technical efficiency and scale efficiency of green development in 11 Cities in Zhejiang.
CitiesPollutant EmissionEnergy ConsumptionProduction Factor CostOverall (E)
pesepesepesepese
Hangzhou1.0000.8481.0000.9871.0001.0671.0000.942
Ningbo1.0000.8421.0001.0511.0001.0521.0000.957
Wenzhou1.0540.9920.8210.9270.8551.0480.9000.985
Jiaxing0.7020.9740.9060.9610.8541.0120.8010.980
Huzhou0.7340.8050.8961.0020.9870.8730.8570.882
Shaoxing0.9430.9840.9850.9241.0071.0800.9700.991
Jinhua0.9400.9770.6991.0111.0890.9410.8860.974
Quzhou0.3350.8510.5311.1361.0540.8720.5660.924
Zhoushan1.0000.8851.0001.2071.0000.9041.0000.960
Taizhou1.0420.9810.8560.9551.0461.0200.9650.982
Lishui0.8220.7460.7011.0821.2400.6980.8810.802
Mean0.8700.8990.8541.0221.0120.9610.8930.944
SD0.2050.0830.1470.0850.1010.1110.1220.054
Table 4. Dynamic environmental efficiency of each input variable and the growth rate of its decomposition index (2007–2016).
IndexPollutant EmissionEnergy ConsumptionProduction Factor CostOverall
Annual Average (%)Cumulative ValueAnnual Average (%)Cumulative ValueAnnual Average (%)Cumulative ValueAnnual Average (%)Cumulative Value
TFP12.06178.57−1.11−9.59−8.97−57.080.262.33
pech1.2812.11−1.90−15.841.4413.760.222.04
sech5.6163.40−1.01−8.71−2.86−23.000.464.26
techch4.9254.081.8417.81−7.53−50.57−0.43−3.85
Table 5. Dynamic efficiency and decomposition results of green development in cities in Zhejiang Province (annual mean).
CityPollutant EmissionEnergy ConsumptionProduction Factor CostTPIPechSechTechch
Hangzhou1.1680.9910.9111.0181.0001.0230.995
Ningbo1.1200.9860.8810.9911.0001.0010.990
Wenzhou1.0360.9980.8610.9620.9900.9950.977
Jiaxing1.1150.9830.8930.9931.0071.0010.985
Huzhou1.1780.9680.9001.0091.0240.9990.985
Shaoxing1.1951.0400.9371.0521.0181.0001.033
Jinhua1.0620.9530.9280.9790.9750.9961.009
Quzhou1.1051.0390.8991.0111.0071.0080.997
Zhoushan1.1470.9500.9491.0111.0001.0150.996
Taizhou1.0910.9490.9270.9870.9960.9990.991
Lishui1.1081.0200.9281.0161.0081.0140.994
Mean1.1210.9890.9101.0031.0021.0050.996
Table 6. Regression coefficients and significance levels under different standard errors.
Driscoll‒KraayRogersWhite
lnrgdp0.198(0.580)0.198(0.570)0.198(0.570)
lnind0.173(0.040) **0.173(0.367)0.173(0.367)
lngov−0.052(0.000) ***−0.052(0.093) *−0.052(0.093) *
lntec0.057(0.251)0.057(0.273)0.057(0.273)
lnurb−0.406(0.090) *−0.406(0.287)−0.406(0.287)
lnfdi−0.001 (0.900)−0.001(0.937)−0.001(0.937)
N110110110
p-values in parentheses, * p < 0.1, ** p < 0.05, *** p < 0.01.

