
SARS-CoV-2 in Atmospheric Particulate Matter: An Experimental Survey in the Province of Venice in Northern Italy

 , , , ,
  , , , , and
Abstract
:1. Introduction
2. Materials and Methods
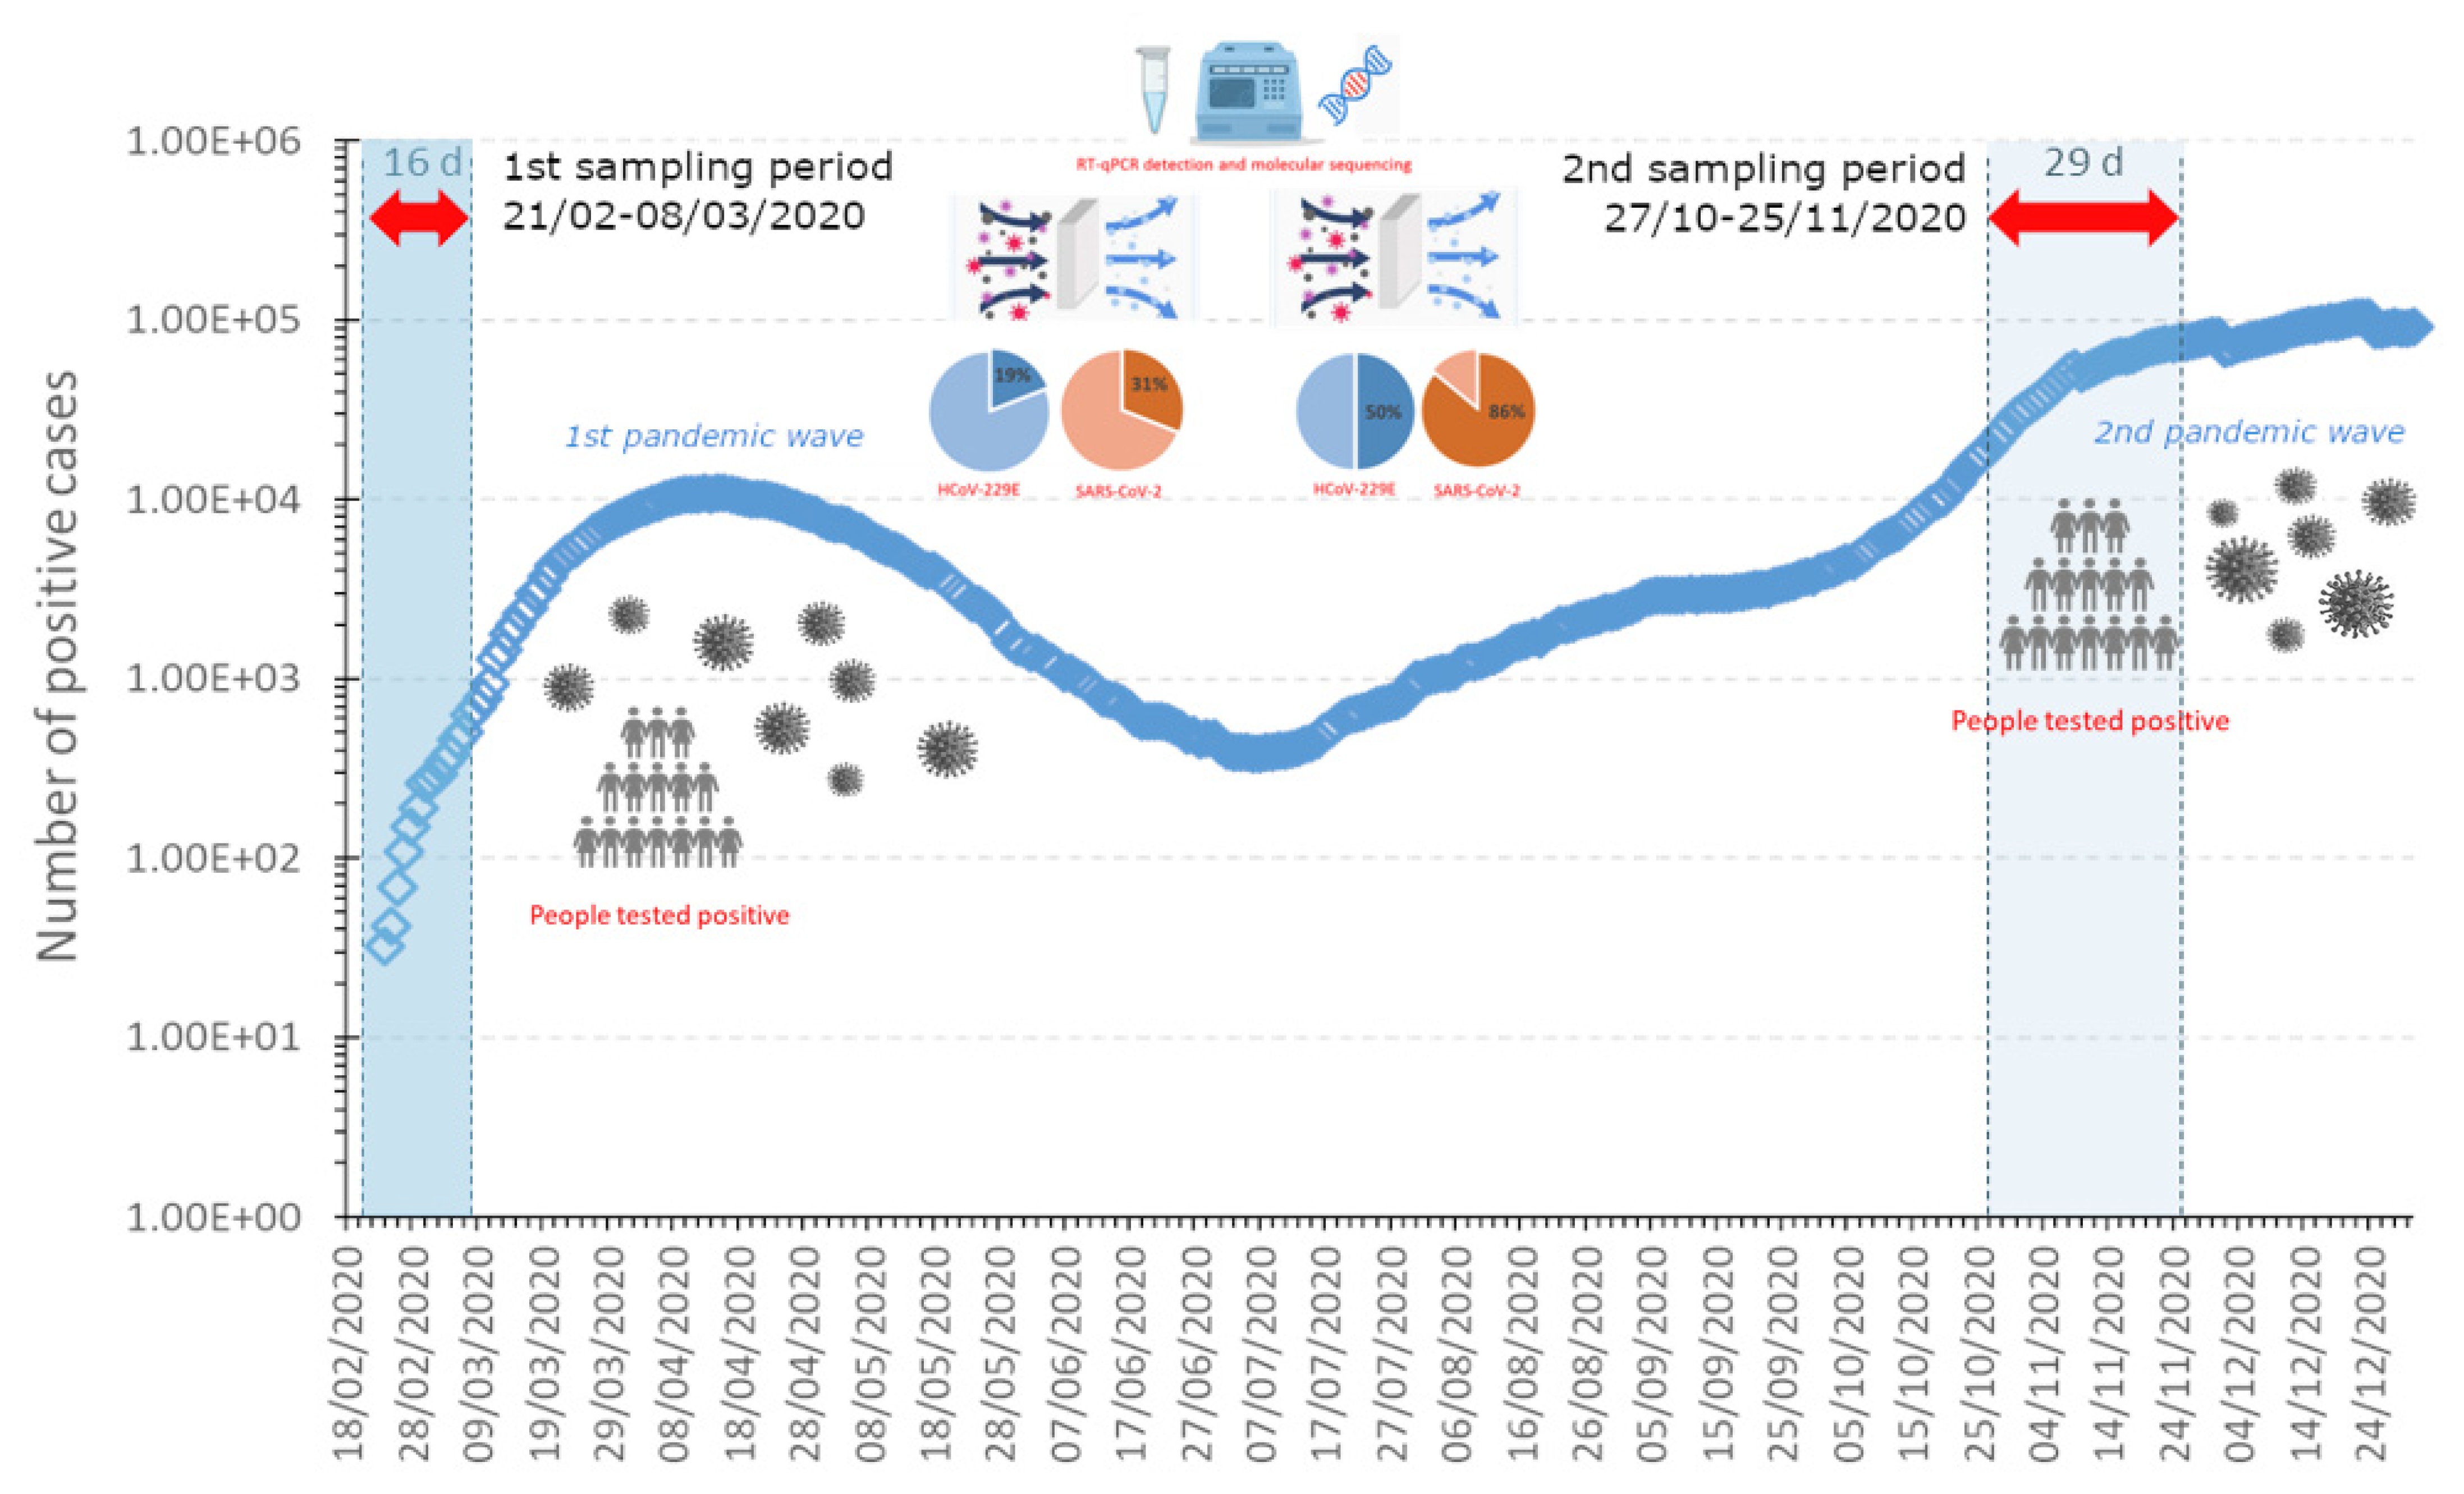
2.1. Experimental Design and Sampling Strategy
- Increased sampled air volume: considering that a very low average outdoor concentration of SARS-CoV-2 RNA has been estimated (i.e., <1 genome copy (g.c.)/m3) [12,40] and the potential degradation of viral nucleic acid during and after the formation of a virus/PM cluster, the sampled air volume was increased relative to the former method—from 23–54 m3/sample to >250 m3/sample. This should guarantee the presence of a number of RNA genomic copies above than the limit of detection (LOD) of the molecular assays commonly used for SARS-CoV-2 detection (1–2 g.c./µL).
- Adoption of higher-performance filter typology: in areas such as the investigated sites, characterized by unfavorable atmospheric conditions (i.e., frequent atmospheric stability enhances the age of air mass), Teflon filters have demonstrated improved performance compared to quartz filters for PM collection [41]. Teflon filters are biologically and chemically inert and can meet extreme conditions of chemical compatibility and temperature. Moreover, the wider surface of Teflon filters permits partitioning of the filter into multiple pieces. Consequently, simultaneous analyses can be performed on a single PM sample, such as PM gravimetric estimation, as well as chemical and (micro)biological analysis.
- Adoption a different sample storage modality: LVR samples were retained inside the sampling station for three to four days in containers kept in the dark at 20 °C before reaching the laboratory. Although the LVR method certainly suits PM analysis, for viral sampling and nucleic acid detection, it is recommended that filters are immediately analyzed after sampling or frozen at −20 °C until further processing.
2.2. Filter Processing and Viral RNA Extraction
2.3. Real-Time RT-qPCR Detection
2.4. Molecular Characterization
3. Results and Discussion
- Samples collected using the LVR method (i.e., optimized for PM analysis) (N = 16): 8 and 14 samples were positive for HCoV-229E and SARS-CoV-2, respectively;
- Samples collected using the HVR method (i.e., optimized for virus analysis) (N = 6): three and five samples were positive for HCoV-229E and SARS-CoV-2, respectively.
4. Conclusions
- The adopted methods do not allow for the assessment of SARS-CoV-2 infectivity; therefore, we cannot draw any conclusion in terms of the spread of infection with respect to the possible role of PM in SARS-CoV-2 diffusion. In particular, infectivity assays should be conducted in an appropriate biosafety-level (BSL) facility.
- Large volumes of air should be sampled in consideration of the expected low number of viral particles in environmental samples. The HVR approach is preferred.
- Filters appear to be the most effective devices for the simultaneous capture of micrometric (e.g., smaller) particles and the collection of large air volumes [48].
- Large Teflon filters should are preferable to quartz fiber filters due to their overall better recovery performance and the possibility of being fractioned for multiple analytical purposes, e.g., chemical characterization of PM.
- Shorter sampling phases (i.e., <1–2 h) should be used to ensure a low SARS-CoV-2 degradation rate.
- Standardized procedures and methods for outdoor sampling and detection of airborne viruses require further investigation before they can be established.
Supplementary Materials
Author Contributions
Funding
Institutional Review Board Statement
Informed Consent Statement
Data Availability Statement
Conflicts of Interest
References
- Di Maria, F.; La Rosa, G.; Bonato, T.; Pivato, A.; Piazza, R.; Mancini, P.; Ferraro, G.B.; Veneri, C.; Iaconelli, M.; Beccaloni, E.; et al. An innovative approach for the non-invasive surveillance of communities and early detection of SARS-CoV-2 via solid waste analysis. Sci. Total Environ. 2021, 801, 149743. [Google Scholar] [CrossRef] [PubMed]
- McCall, A.-K.; Bade, R.; Kinyua, J.; Lai, F.Y.; Thai, P.K.; Covaci, A.; Bijlsma, L.; van Nuijs, A.L.N.; Ort, C. Critical review on the stability of illicit drugs in sewers and wastewater samples. Water Res. 2016, 88, 933–947. [Google Scholar] [CrossRef] [PubMed] [Green Version]
- Huizer, M.; Ter Laak, T.L.; de Voogt, P.; van Wezel, A.P. Wastewater-based epidemiology for illicit drugs: A critical review on global data. Water Res. 2021, 207, 117789. [Google Scholar] [CrossRef] [PubMed]
- Ahmed, W.; Angel, N.; Edson, J.; Bibby, K.; Bivins, A.; O’Brien, J.W.; Choi, P.M.; Kitajima, M.; Simpson, S.L.; Li, J.; et al. First confirmed detection of SARS-CoV-2 in untreated wastewater in Australia: A proof of concept for the wastewater surveillance of COVID-19 in the community. Sci. Total Environ. 2020, 728, 138764. [Google Scholar] [CrossRef] [PubMed]
- Fongaro, G.; Stoco, P.H.; Souza, D.S.M.; Grisard, E.C.; Magri, M.E.; Rogovski, P.; Schörner, M.A.; Barazzetti, F.H.; Christoff, A.P.; de Oliveira, L.F.V.; et al. The presence of SARS-CoV-2 RNA in human sewage in Santa Catarina, Brazil, November 2019. Sci. Total Environ. 2021, 778, 146198. [Google Scholar] [CrossRef]
- La Rosa, G.; Iaconelli, M.; Mancini, P.; Ferraro, G.B.; Veneri, C.; Bonadonna, L.; Lucentini, L.; Suffredini, E. First detection of SARS-CoV-2 in untreated wastewaters in Italy. Sci. Total Environ. 2020, 736, 139652. [Google Scholar] [CrossRef] [PubMed]
- Baldovin, T.; Amoruso, I.; Fonzo, M.; Buja, A.; Baldo, V.; Cocchio, S.; Bertoncello, C. SARS-CoV-2 RNA detection and persistence in wastewater samples: An experimental network for COVID-19 environmental surveillance in Padua, Veneto Region (NE Italy). Sci. Total Environ. 2020, 760, 143329. [Google Scholar] [CrossRef] [PubMed]
- Agrawal, S.; Orschler, L.; Schubert, S.; Zachmann, K.; Heijnen, L.; Tavazzi, S.; Gawlik, B.M.; de Graaf, M.; Medema, G.; Lackner, S. Prevalence and circulation patterns of SARS-CoV-2 variants in European sewage mirror clinical data of 54 European cities. Water Res. 2022, 214, 118162. [Google Scholar] [CrossRef]
- Wu, F.; Lee, W.L.; Chen, H.; Gu, X.; Chandra, F.; Armas, F.; Xiao, A.; Leifels, M.; Rhode, S.F.; Wuertz, S.; et al. Making waves: Wastewater surveillance of SARS-CoV-2 in an endemic future. Water Res. 2022, 219, 118535. [Google Scholar] [CrossRef]
- Noorimotlagh, Z.; Jaafarzadeh, N.; Martínez, S.S.; Mirzaee, S.A. A systematic review of possible airborne transmission of the COVID-19 virus (SARS-CoV-2) in the indoor air environment. Environ. Res. 2020, 193, 110612. [Google Scholar] [CrossRef]
- Yao, M. SARS-CoV-2 aerosol transmission and detection. Eco-Environ. Health 2022, 1, 3–10. [Google Scholar] [CrossRef]
- Belosi, F.; Conte, M.; Gianelle, V.; Santachiara, G.; Contini, D. On the concentration of SARS-CoV-2 in outdoor air and the interaction with pre-existing atmospheric particles. Environ. Res. 2020, 193, 110603. [Google Scholar] [CrossRef]
- Fric, J.; Boraschi, D.; Farhangrazi, Z.S.; Moghimi, S.M.; Shadi Farhangrazi, Z.; Sancini, G.; Hunter, A.C. Airborne particulate matter and SARS-CoV-2 partnership: Virus hitchhiking, stabilization and immune cell targeting—A hypothesis. Front. Immunol. 2020, 11, 579352. [Google Scholar]
- Setti, L.; Passarini, F.; De Gennaro, G.; Barbieri, P.; Pallavicini, A.; Ruscio, M.; Piscitelli, P.; Colao, A.; Miani, A. Searching for SARS-COV-2 on Particulate Matter: A Possible Early Indicator of COVID-19 Epidemic Recurrence. Int. J. Environ. Res. Public Health 2020, 17, 2986. [Google Scholar] [CrossRef] [PubMed]
- Comunian, S.; Dongo, D.; Milani, C.; Palestini, P. Air Pollution and COVID-19: The Role of Particulate Matter in the Spread and Increase of COVID-19’s Morbidity and Mortality. Int. J. Environ. Res. Public Health 2020, 17, 4487. [Google Scholar] [CrossRef] [PubMed]
- Anand, U.; Adelodun, B.; Pivato, A.; Suresh, S.; Indari, O.; Jakhmola, S.; Jha, H.C.; Jha, P.K.; Tripathi, V.; Di Maria, F. A review of the presence of SARS-CoV-2 RNA in wastewater and airborne particulates and its use for virus spreading surveillance. Environ. Res. 2021, 196, 110929. [Google Scholar] [CrossRef] [PubMed]
- Anand, U.; Cabreros, C.; Mal, J.; Ballesteros, F.; Sillanpää, M.; Tripathi, V.; Bontempi, E. Novel coronavirus disease 2019 (COVID-19) pandemic: From transmission to control with an interdisciplinary vision. Environ. Res. 2021, 197, 111126. [Google Scholar] [CrossRef]
- Maleki, M.; Anvari, E.; Hopke, P.K.; Noorimotlagh, Z.; Mirzaee, S.A. An updated systematic review on the association between atmospheric particulate matter pollution and prevalence of SARS-CoV-2. Environ. Res. 2021, 195, 110898. [Google Scholar] [CrossRef]
- Delnevo, G.; Mirri, S.; Roccetti, M. Particulate Matter and COVID-19 Disease Diffusion in Emilia-Romagna (Italy). Already a Cold Case? Computation 2020, 8, 59. [Google Scholar] [CrossRef]
- Fronza, R.; Lusic, M.; Schmidt, M.; Lucic, B. Spatial–Temporal Variations in Atmospheric Factors Contribute to SARS-CoV-2 Outbreak. Viruses 2020, 12, 588. [Google Scholar] [CrossRef] [PubMed]
- Borro, M.; Di Girolamo, P.; Gentile, G.; De Luca, O.; Preissner, R.; Marcolongo, A.; Ferracuti, S.; Simmaco, M. Evidence-Based Considerations Exploring Relations between SARS-CoV-2 Pandemic and Air Pollution: Involvement of PM2.5-Mediated Up-Regulation of the Viral Receptor ACE-2. Int. J. Environ. Res. Public Health 2020, 17, 5573. [Google Scholar] [CrossRef] [PubMed]
- Chennakesavulu, K.; Reddy, G.R. The effect of latitude and PM2.5 on spreading of SARS-CoV-2 in tropical and temperate zone countries. Environ. Pollut. 2020, 266, 115176. [Google Scholar] [CrossRef] [PubMed]
- Coccia, M. Factors determining the diffusion of COVID-19 and suggested strategy to prevent future accelerated viral infectivity similar to COVID. Sci. Total Environ. 2020, 729, 138474. [Google Scholar] [CrossRef] [PubMed]
- Li, H.; Xu, X.-L.; Dai, D.-W.; Huang, Z.-Y.; Ma, Z.; Guan, Y.-J. Air pollution and temperature are associated with increased COVID-19 incidence: A time series study. Int. J. Infect. Dis. 2020, 97, 278–282. [Google Scholar] [CrossRef] [PubMed]
- Setti, L.; Passarini, F.; de Gennaro, G.; Barbieri, P.; Perrone, M.G.; Borelli, M.; Palmisani, J.; Di Gilio, A.; Torboli, V.; Pallavicini, A.; et al. SARS-Cov-2 RNA found on particulate matter of Bergamo in Northern Italy: First preliminary evidence. medRxiv 2020. [Google Scholar] [CrossRef] [Green Version]
- Pivato, A.; Amoruso, I.; Formenton, G.; Di Maria, F.; Bonato, T.; Vanin, S.; Marion, A.; Baldovin, T. Evaluating the presence of SARS-CoV-2 RNA in the particulate matters during the peak of COVID-19 in Padua, northern Italy. Sci. Total Environ. 2021, 784, 147129. [Google Scholar] [CrossRef] [PubMed]
- Chirizzi, D.; Conte, M.; Feltracco, M.; Dinoi, A.; Gregoris, E.; Barbaro, E.; La Bella, G.; Ciccarese, G.; La Salandra, G.; Gambaro, A.; et al. SARS-CoV-2 concentrations and virus-laden aerosol size distributions in outdoor air in north and south of Italy. Environ. Int. 2020, 146, 106255. [Google Scholar] [CrossRef] [PubMed]
- Setti, L.; Passarini, F.; De Gennaro, G.; Di Gilio, A.; Palmisani, J.; Buono, P.; Fornari, G.; Perrone, M.G.; Piazzalunga, A.; Pierluigi, B.; et al. Evaluation of the Potential Relationship between Particulate Matter (PM) Pollution and COVID-19 Infection Spread in Italy; Società Italiana di Medicina Ambientale (SIMA): Milano, Italy, 2020. [Google Scholar]
- Linillos-Pradillo, B.; Rancan, L.; Ramiro, E.D.; Vara, E.; Artíñano, B.; Arias, J. Determination of SARS-CoV-2 RNA in different particulate matter size fractions of outdoor air samples in Madrid during the lockdown. Environ. Res. 2021, 195, 110863. [Google Scholar] [CrossRef] [PubMed]
- La Rosa, G.; Mancini, P.; Ferraro, G.B.; Veneri, C.; Iaconelli, M.; Bonadonna, L.; Lucentini, L.; Suffredini, E. SARS-CoV-2 has been circulating in northern Italy since December 2019: Evidence from environmental monitoring. Sci. Total Environ. 2020, 750, 141711. [Google Scholar] [CrossRef]
- Chu, D.K.W.; Pan, Y.; Cheng, S.M.S.; Hui, K.P.Y.; Krishnan, P.; Liu, Y.; Ng, D.Y.M.; Wan, C.K.C.; Yang, P.; Wang, Q.; et al. Molecular Diagnosis of a Novel Coronavirus (2019-nCoV) Causing an Outbreak of Pneumonia. Clin. Chem. 2020, 66, 549–555. [Google Scholar] [CrossRef] [Green Version]
- Corman, V.M.; Landt, O.; Kaiser, M.; Molenkamp, R.; Meijer, A.; Chu, D.K.W.; Bleicker, T.; Brünink, S.; Schneider, J.; Schmidt, M.L.; et al. Detection of 2019 novel coronavirus (2019-nCoV) by real-time RT-PCR. Eurosurveillance 2020, 25, 2000045. [Google Scholar] [CrossRef] [PubMed] [Green Version]
- CDC. CDC 2019-Novel Coronavirus (2019-nCoV) Real-Time RT-PCR Diagnostic Panel for Emergency Use Only Instructions for Use; Centers for Disease Control and Prevention: Atlanta, GA, USA, 2020.
- Ishmatov, A. “SARS-CoV-2 is transmitted by particulate air pollution”: Misinterpretations of statistical data, skewed citation practices, and misuse of specific terminology spreading the misconception. Environ. Res. 2021, 204, 112116. [Google Scholar] [CrossRef] [PubMed]
- Kuchynska, I.; Savchenko, B.; Andriukhov, A.; Ivanchenko, A.; Astashkina, N.; Hulevatyi, Y.; Kashchii, U. Синдрoм пoліoрганнoї недoстатнoсті в пацієнтів із тяжким перебігoм кoрoнавіруснoї хвoрoби (COVID-19). Emerg. Med. 2021, 17, 19–27. [Google Scholar] [CrossRef]
- Pfefferle, S.; Oppong, S.; Drexler, J.F.; Gloza-Rausch, F.; Ipsen, A.; Seebens, A.; Müller, M.A.; Annan, A.; Vallo, P.; Adu-Sarkodie, Y.; et al. Distant Relatives of Severe Acute Respiratory Syndrome Coronavirus and Close Relatives of Human Coronavirus 229E in Bats, Ghana. Emerg. Infect. Dis. 2009, 15, 1377–1384. [Google Scholar] [CrossRef]
- Walsh, E.E.; Shin, J.H.; Falsey, A.R. Clinical Impact of Human Coronaviruses 229E and OC43 Infection in Diverse Adult Populations. J. Infect. Dis. 2013, 208, 1634–1642. [Google Scholar] [CrossRef] [PubMed] [Green Version]
- Davis, B.M.; Foxman, B.; Monto, A.S.; Baric, R.S.; Martin, E.T.; Uzicanin, A.; Rainey, J.J.; Aiello, A.E. Human coronaviruses and other respiratory infections in young adults on a university campus: Prevalence, symptoms, and shedding. Influ. Other Respir. Viruses 2018, 12, 582–590. [Google Scholar] [CrossRef] [PubMed] [Green Version]
- ISTAT. ASC Atlante Statistico dei Comuni [WWW Document]. 2021. Available online: http://asc.istat.it/ASC/ (accessed on 20 March 2022).
- Cherrie, J.; Cherrie, M.; Smith, A.; Holmes, D.; Semple, S.; Steinle, S.; MacDonald, E.; Moor, G.; Loh, M. Contamination of air and surfaces in workplaces with SARS-CoV-2 virus: A systematic review. medRxiv 2021. [Google Scholar] [CrossRef]
- Perrino, C.; Canepari, S.; Catrambone, M. Comparing the Performance of Teflon and Quartz Membrane Filters Collecting Atmospheric PM: Influence of Atmospheric Water. Aerosol Air Qual. Res. 2013, 13, 137–147. [Google Scholar] [CrossRef] [Green Version]
- Costafreda, M.I.; Bosch, A.; Pintó, R.M. Development, Evaluation, and Standardization of a Real-Time TaqMan Reverse Transcription-PCR Assay for Quantification of Hepatitis A Virus in Clinical and Shellfish Samples. Appl. Environ. Microbiol. 2006, 72, 3846–3855. [Google Scholar] [CrossRef] [PubMed] [Green Version]
- Pierri, B.; Mancusi, A.; Proroga, Y.T.; Capuano, F.; Cerino, P.; Girardi, S.; Vassallo, L.; Conte, G.L.; Tafuro, M.; Cuomo, M.C.; et al. SARS-CoV-2 detection in nasopharyngeal swabs: Performance characteristics of a real-time RT-qPCR and a droplet digital RT-PCR assay based on the exonuclease region (ORF1b, nsp 14). J. Virol. Methods 2021, 300, 114420. [Google Scholar] [CrossRef]
- Mancusi, A.; Capuano, F.; Girardi, S.; Di Maro, O.; Suffredini, E.; Di Concilio, D.; Vassallo, L.; Cuomo, M.C.; Tafuro, M.; Signorelli, D.; et al. Detection of SARS-CoV-2 RNA in Bivalve Mollusks by Droplet Digital RT-PCR (dd RT-PCR). Int. J. Environ. Res. Public Health 2022, 19, 943. [Google Scholar] [CrossRef] [PubMed]
- La Rosa, G.; Mancini, P.; Ferraro, G.B.; Veneri, C.; Iaconelli, M.; Lucentini, L.; Bonadonna, L.; Brusaferro, S.; Brandtner, D.; Fasanella, A.; et al. Rapid screening for SARS-CoV-2 variants of concern in clinical and environmental samples using nested RT-PCR assays targeting key mutations of the spike protein. Water Res. 2021, 197, 117104. [Google Scholar] [CrossRef] [PubMed]
- Santurtún, A.; Colom, M.L.; Fdez-Arroyabe, P.; del Real, Á.; Fernández-Olmo, I.; Zarrabeitia, M.T. Exposure to particulate matter: Direct and indirect role in the COVID-19 pandemic. Environ. Res. 2022, 206, 112261. [Google Scholar] [CrossRef] [PubMed]
- Robotto, A.; Civra, A.; Quaglino, P.; Polato, D.; Brizio, E.; Lembo, D. SARS-CoV-2 airborne transmission: A validated sampling and analytical method. Environ. Res. 2021, 200, 111783. [Google Scholar] [CrossRef] [PubMed]
- Robotto, A.; Quaglino, P.; Lembo, D.; Morello, M.; Brizio, E.; Bardi, L.; Civra, A. SARS-CoV-2 and indoor/outdoor air samples: A methodological approach to have consistent and comparable results. Environ. Res. 2021, 195, 110847. [Google Scholar] [CrossRef]
- Chen, L.; Mao, F.; Hong, J.; Zang, L.; Chen, J.; Zhang, Y.; Gan, Y.; Gong, W.; Xu, H. Improving PM2.5 predictions during COVID-19 lockdown by assimilating multi-source observations and adjusting emissions. Environ. Pollut. 2021, 297, 118783. [Google Scholar] [CrossRef]
- Dalla Fontana, A.; Pillon, S.; Patti, S. A performance evaluation of the CAMx air quality model to forecast ozone and PM10 over the Italian region of Veneto. J. Mediterr. Meteorol. Climatol. 2021, 18, 1–13. [Google Scholar] [CrossRef]


| Operative Conditions | Current Work | Pivato et al. [26] | Chirizzi et al. [27] | Linillos-Pradillo et al. [29] | Setti et al. [25] |
|---|---|---|---|---|---|
| Investigated virus | SARS-CoV-2 and coronavirus 229E (HCoV-229E) | SARS-CoV-2 | SARS-CoV-2 | SARS-CoV-2 | SARS-CoV-2 |
| Sampling size | 38 samples from 5 sites | 44 samples from 10 sites | 60 samples from 2 sites | 6 × 3 = 18 samples from 1 site | 34 samples from 2 sites |
| Positive samples | 14 samples positive for coronavirus 229E; 7 samples positive for SARS-CoV-2 | 0 samples | 0 samples | 0 samples | 20 samples |
| Location of sampling | Italy, Venice province (NE Italy) | Italy, Padua province (NE Italy) | Two Italian regions: Veneto (NE Italy) and Apulia (SE Italy) | Spain, Madrid | Italy, Bergamo Province (northern Italy) |
| Period of sampling | From 21 February to 8 March 2020 (16 days) and from 27 October to 25 November 2020 (29 days) | From 24 February to 9 March 2020 (14 days) | From 13 to 27 May 2020 (14 days) | From 4 to 22 May 2020 (18 days) | From 21 February to 13 March 2020 (21 days) |
| Typology of sampling point | Urban background site and marine traffic | Urban and rural background sites; traffic and industrial sites | Urban background site | Urban background site | Industrial site |
| Particulate size investigated | PM10 and PM2.5 | PM10 and PM2.5 | PM10 | PM10, PM2.5, and PM1 | PM10 |
| Filter typology | Two typologies of filters were used:
| Quartz fiber filters (47 mm Ø, Whatman QMA, GE Healthcare, USA) | Quartz fiber filters | Whatman quartz fiber filters (150 mm diameter and QMA quality) | Quartz fiber filters |
| Sampler typology | Two samplers were used:
| Two samplers were used:
| Two samplers were used per site:
| MCV high-volume samplers (30 m3 h−1 flow) | Low-volume gravimetric air sampler (38.3 L/min for 24 h) |
| Average air collected per sample | 55.2 m3 for the low-volume aerosol sampler; 250 to 700 m3 for the high-volume aerosol sampler | 55.2 m3 | 110 m3 or 250 m3 | Not reported | 55.2 m3 |
| PM retention | The two typologies of filter have a similar efficiency (>99.95%) for particles with an aerodynamic diameter of 0.3 µm | >99.95% for particles with an aerodynamic diameter of 0.3 µm | Not reported | 99.9% | |
| Sampling procedure | EN 12341:2014 for the low-volume aerosol sampler | EN 12341:2014 | Not reported | EN 12341:2014 with special ad hoc features (not reported) | EN 12341:2014 |
| Meteorological conditions | Temperature, precipitation, and wind intensity | Temperature, irradiation, precipitation, and wind intensity | Temperature, relative humidity, and precipitation | Temperature, relative humidity, precipitation, wind intensity, wind direction, atmospheric pressure, and irradiance | Temperature, relative humidity, and irradiance |
| Solid-phase extraction | NucliSens extraction system, (bioMerieux, France) and one-step PCR inhibitor removal kit (Zymo Research) | Quick-RNA™ fecal/soil microbe microprep kit (Zymo Research, USA) | Total RNA purification kit (Norgen Biotek Corp.) | Quick-RNA™ fecal/soil microbe microprep kit (Zymo Research, USA) | Quick-RNA™ fecal/soil microbe microprep kit (Zymo Research, USA) |
| Viral recovery | Mengovirus applied to the filter | Armored RNA applied to the liquid phase | Mengovirus applied to a liquid PBS filter sonication buffer | None | None |
| Internal positive control | Mengovirus | SARS-CoV-2 (E gene)-armored RNA (EVA, Marseille, France) | Not reported | CTR-HS purification control (part of the AnyGenes kit) | Not reported |
| Inhibition control | External inhibition control (in vitro synthetized Orf1b-nsp14 RNA) | SARS-CoV-2 (E gene)-armored RNA (EVA, Marseille, France) | None | None | None |
| RT-PCR reference protocol | [30] | [31] | [32] | [33] | [32] |
| RT-PCR oligos | Custom oligos (Eurofins Genomics) | Custom oligos (Thermofisher) | Diatheva commercial kit | AnyGenes commercial kit Efficient 2019-nCOV detection kit (Cat#19nCoVd-100) | Not reported |
| RT-PCR molecular targets | Orf1b-14nsp | Genes N and Orf1b-14nsp | Genes RdRp and E | N1 and N2 | Genes E, RdRP, and N |
| Limit of detection | 0.41 g.c./μL (LOD50) | 2.5 g.c./μL | 10 g.c./μL | Not reported | Not reported |
| Detection threshold | 0.1 g.c. m−3 | 1.2 g.c. m−3 | <0.8 g.c. m−3 | Not reported | 1.5 g.c. m−3 * |
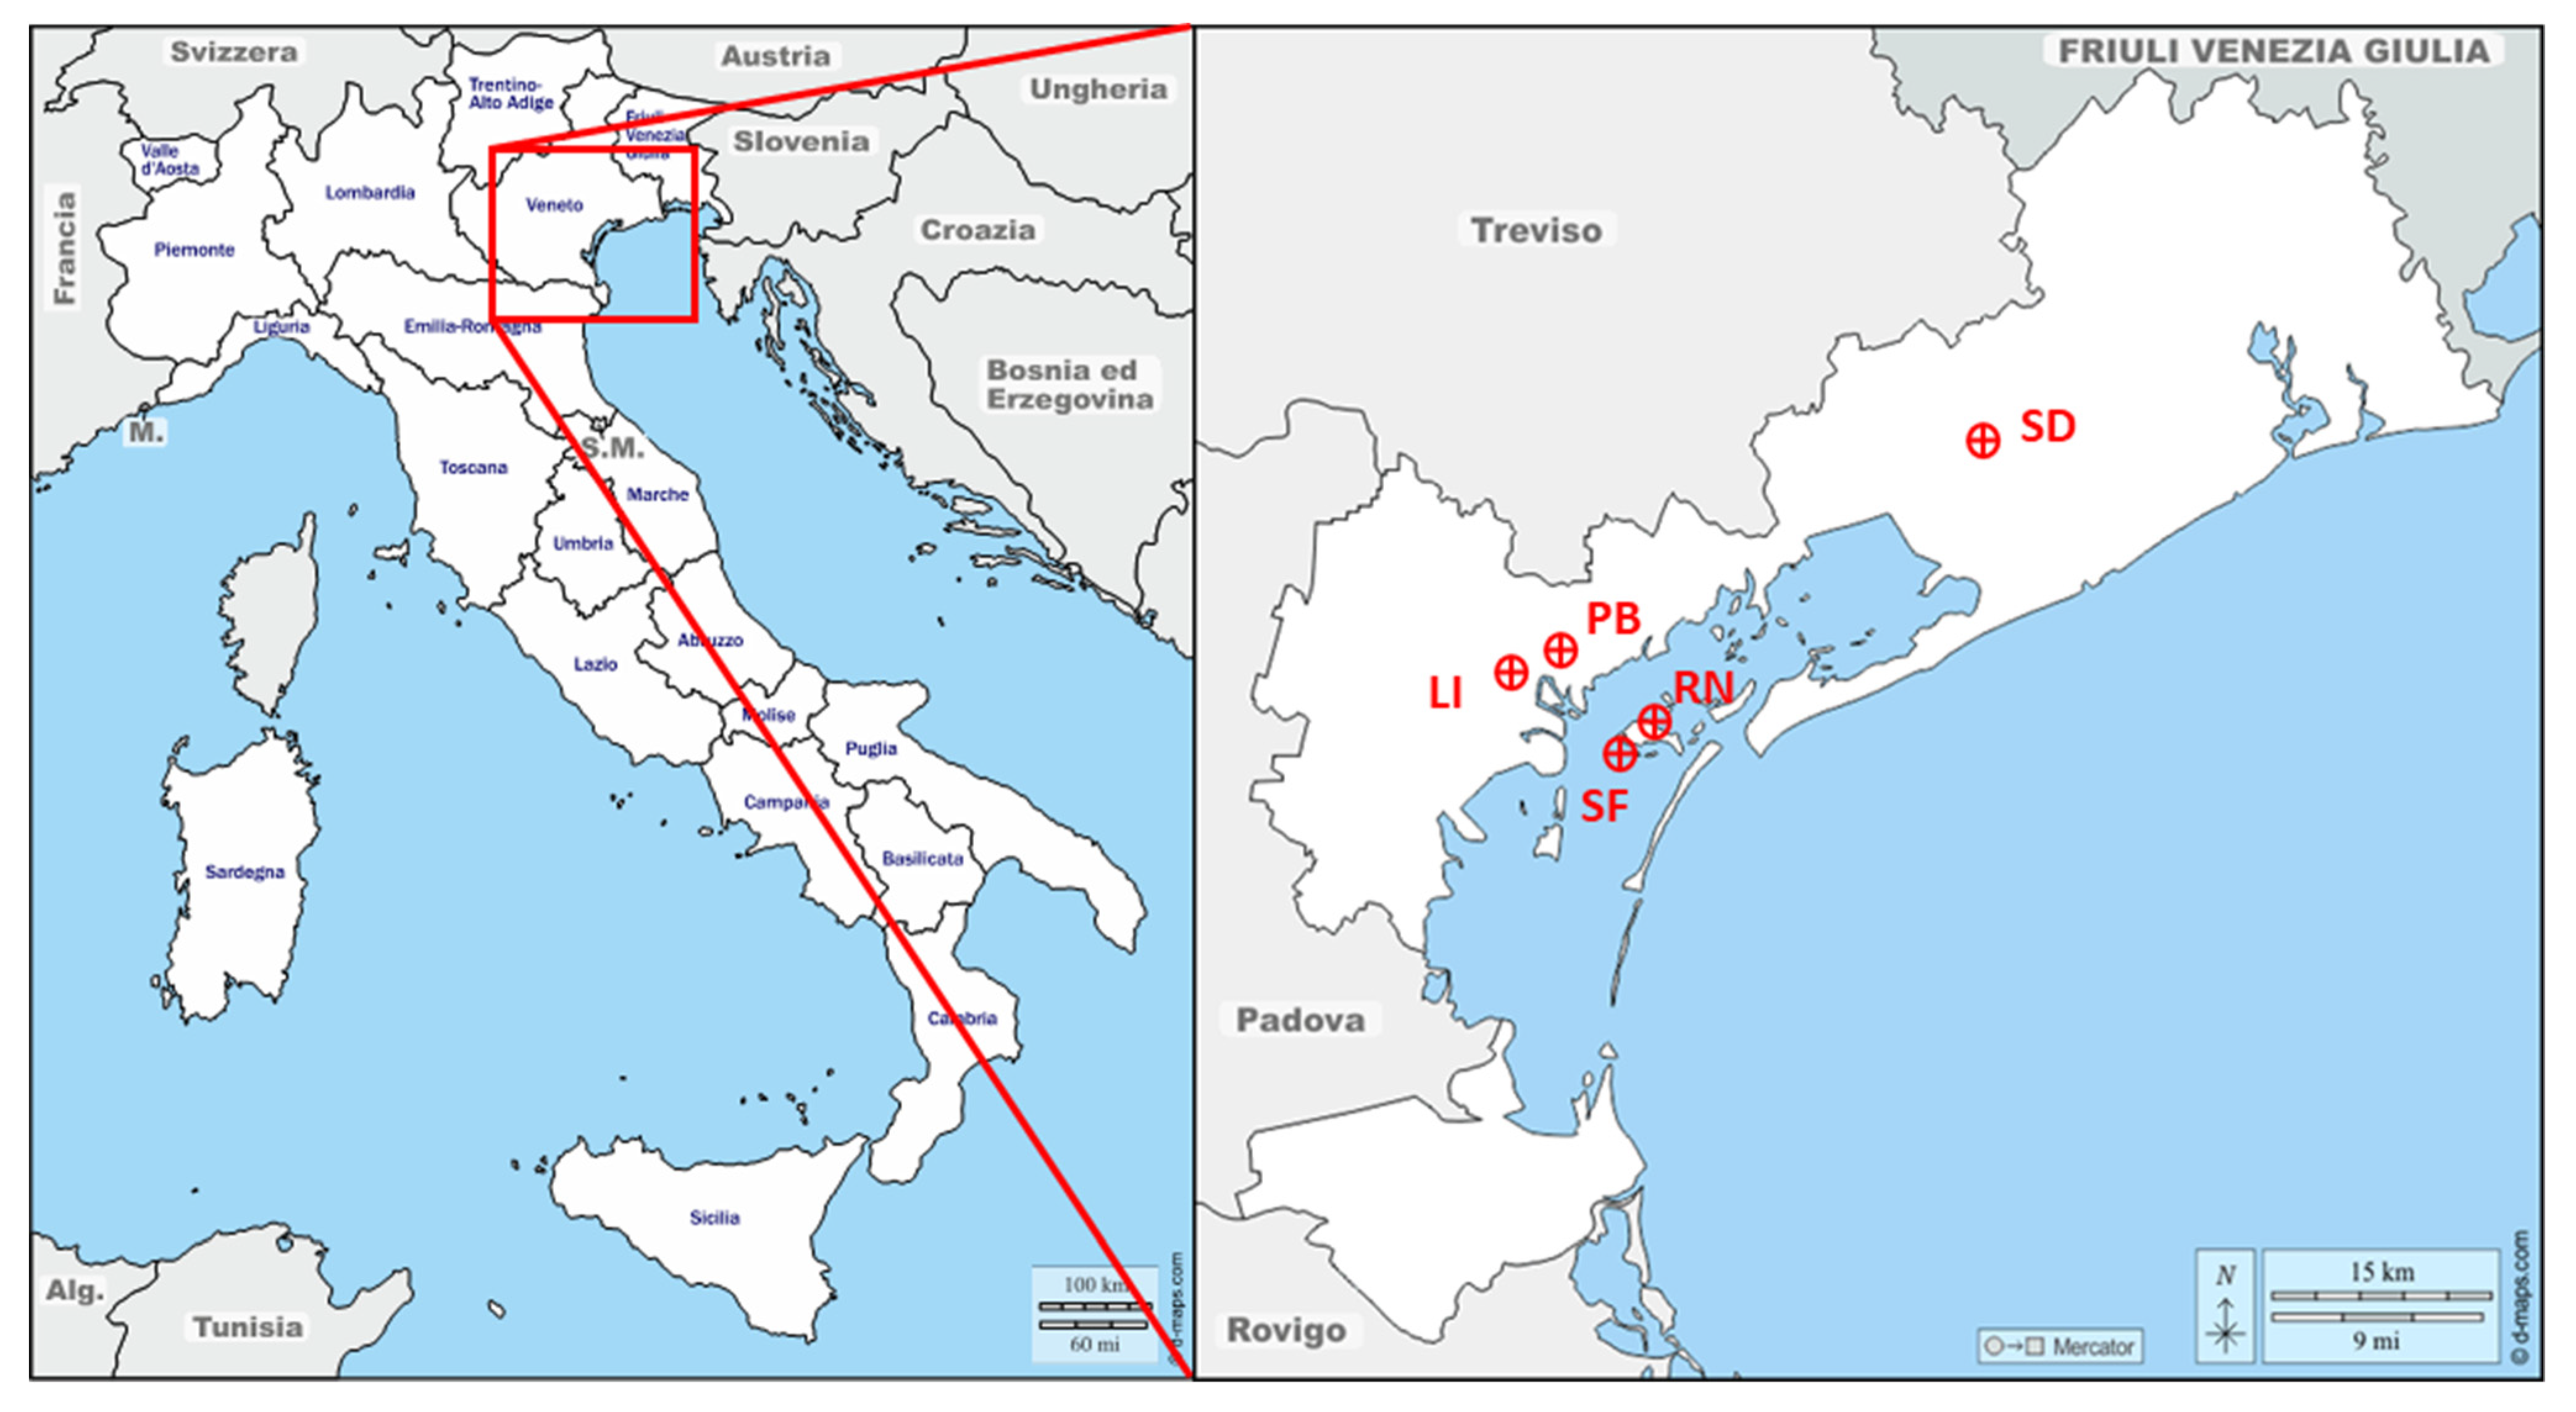
| Code | Place | Geographical Coordinates | Type of Station |
|---|---|---|---|
| LI | Via Lissa, Mestre (VE) | Lat. 45°29′11″; Long. 12°13′21″ | Urban background, mainland |
| RN | Rio Novo (VE) | Lat. 45°26′08″; Long. 12°19′23″ | Marine traffic, island; the site is located in the center of Venezia and used to monitor small boat traffic |
| SF | Sacca Fisola (VE) | Lat. 45°25′42″; Long. 12°18′47″ | Urban background, island |
| PB | Parco Bissuola (VE) | Lat. 45°29’ 58″; Long. 12°15′40″ | Urban background, mainland |
| SD | Via Turati, San Donà (VE) | Lat. 45°37′45″; Long. 12°35′25″ | Urban background, mainland |
Publisher’s Note: MDPI stays neutral with regard to jurisdictional claims in published maps and institutional affiliations. |
© 2022 by the authors. Licensee MDPI, Basel, Switzerland. This article is an open access article distributed under the terms and conditions of the Creative Commons Attribution (CC BY) license (https://creativecommons.org/licenses/by/4.0/).
Share and Cite
Pivato, A.; Formenton, G.; Di Maria, F.; Baldovin, T.; Amoruso, I.; Bonato, T.; Mancini, P.; Bonanno Ferraro, G.; Veneri, C.; Iaconelli, M.; et al. SARS-CoV-2 in Atmospheric Particulate Matter: An Experimental Survey in the Province of Venice in Northern Italy. Int. J. Environ. Res. Public Health 2022, 19, 9462. https://0-doi-org.brum.beds.ac.uk/10.3390/ijerph19159462
Pivato A, Formenton G, Di Maria F, Baldovin T, Amoruso I, Bonato T, Mancini P, Bonanno Ferraro G, Veneri C, Iaconelli M, et al. SARS-CoV-2 in Atmospheric Particulate Matter: An Experimental Survey in the Province of Venice in Northern Italy. International Journal of Environmental Research and Public Health. 2022; 19(15):9462. https://0-doi-org.brum.beds.ac.uk/10.3390/ijerph19159462
Chicago/Turabian StylePivato, Alberto, Gianni Formenton, Francesco Di Maria, Tatjana Baldovin, Irene Amoruso, Tiziano Bonato, Pamela Mancini, Giusy Bonanno Ferraro, Carolina Veneri, Marcello Iaconelli, and et al. 2022. "SARS-CoV-2 in Atmospheric Particulate Matter: An Experimental Survey in the Province of Venice in Northern Italy" International Journal of Environmental Research and Public Health 19, no. 15: 9462. https://0-doi-org.brum.beds.ac.uk/10.3390/ijerph19159462