
Integration of an InSAR and ANN for Sinkhole Susceptibility Mapping: A Case Study from Kirikkale-Delice (Turkey)

 , ,
, , 
Abstract
:1. Introduction
2. Study Area and Datasets
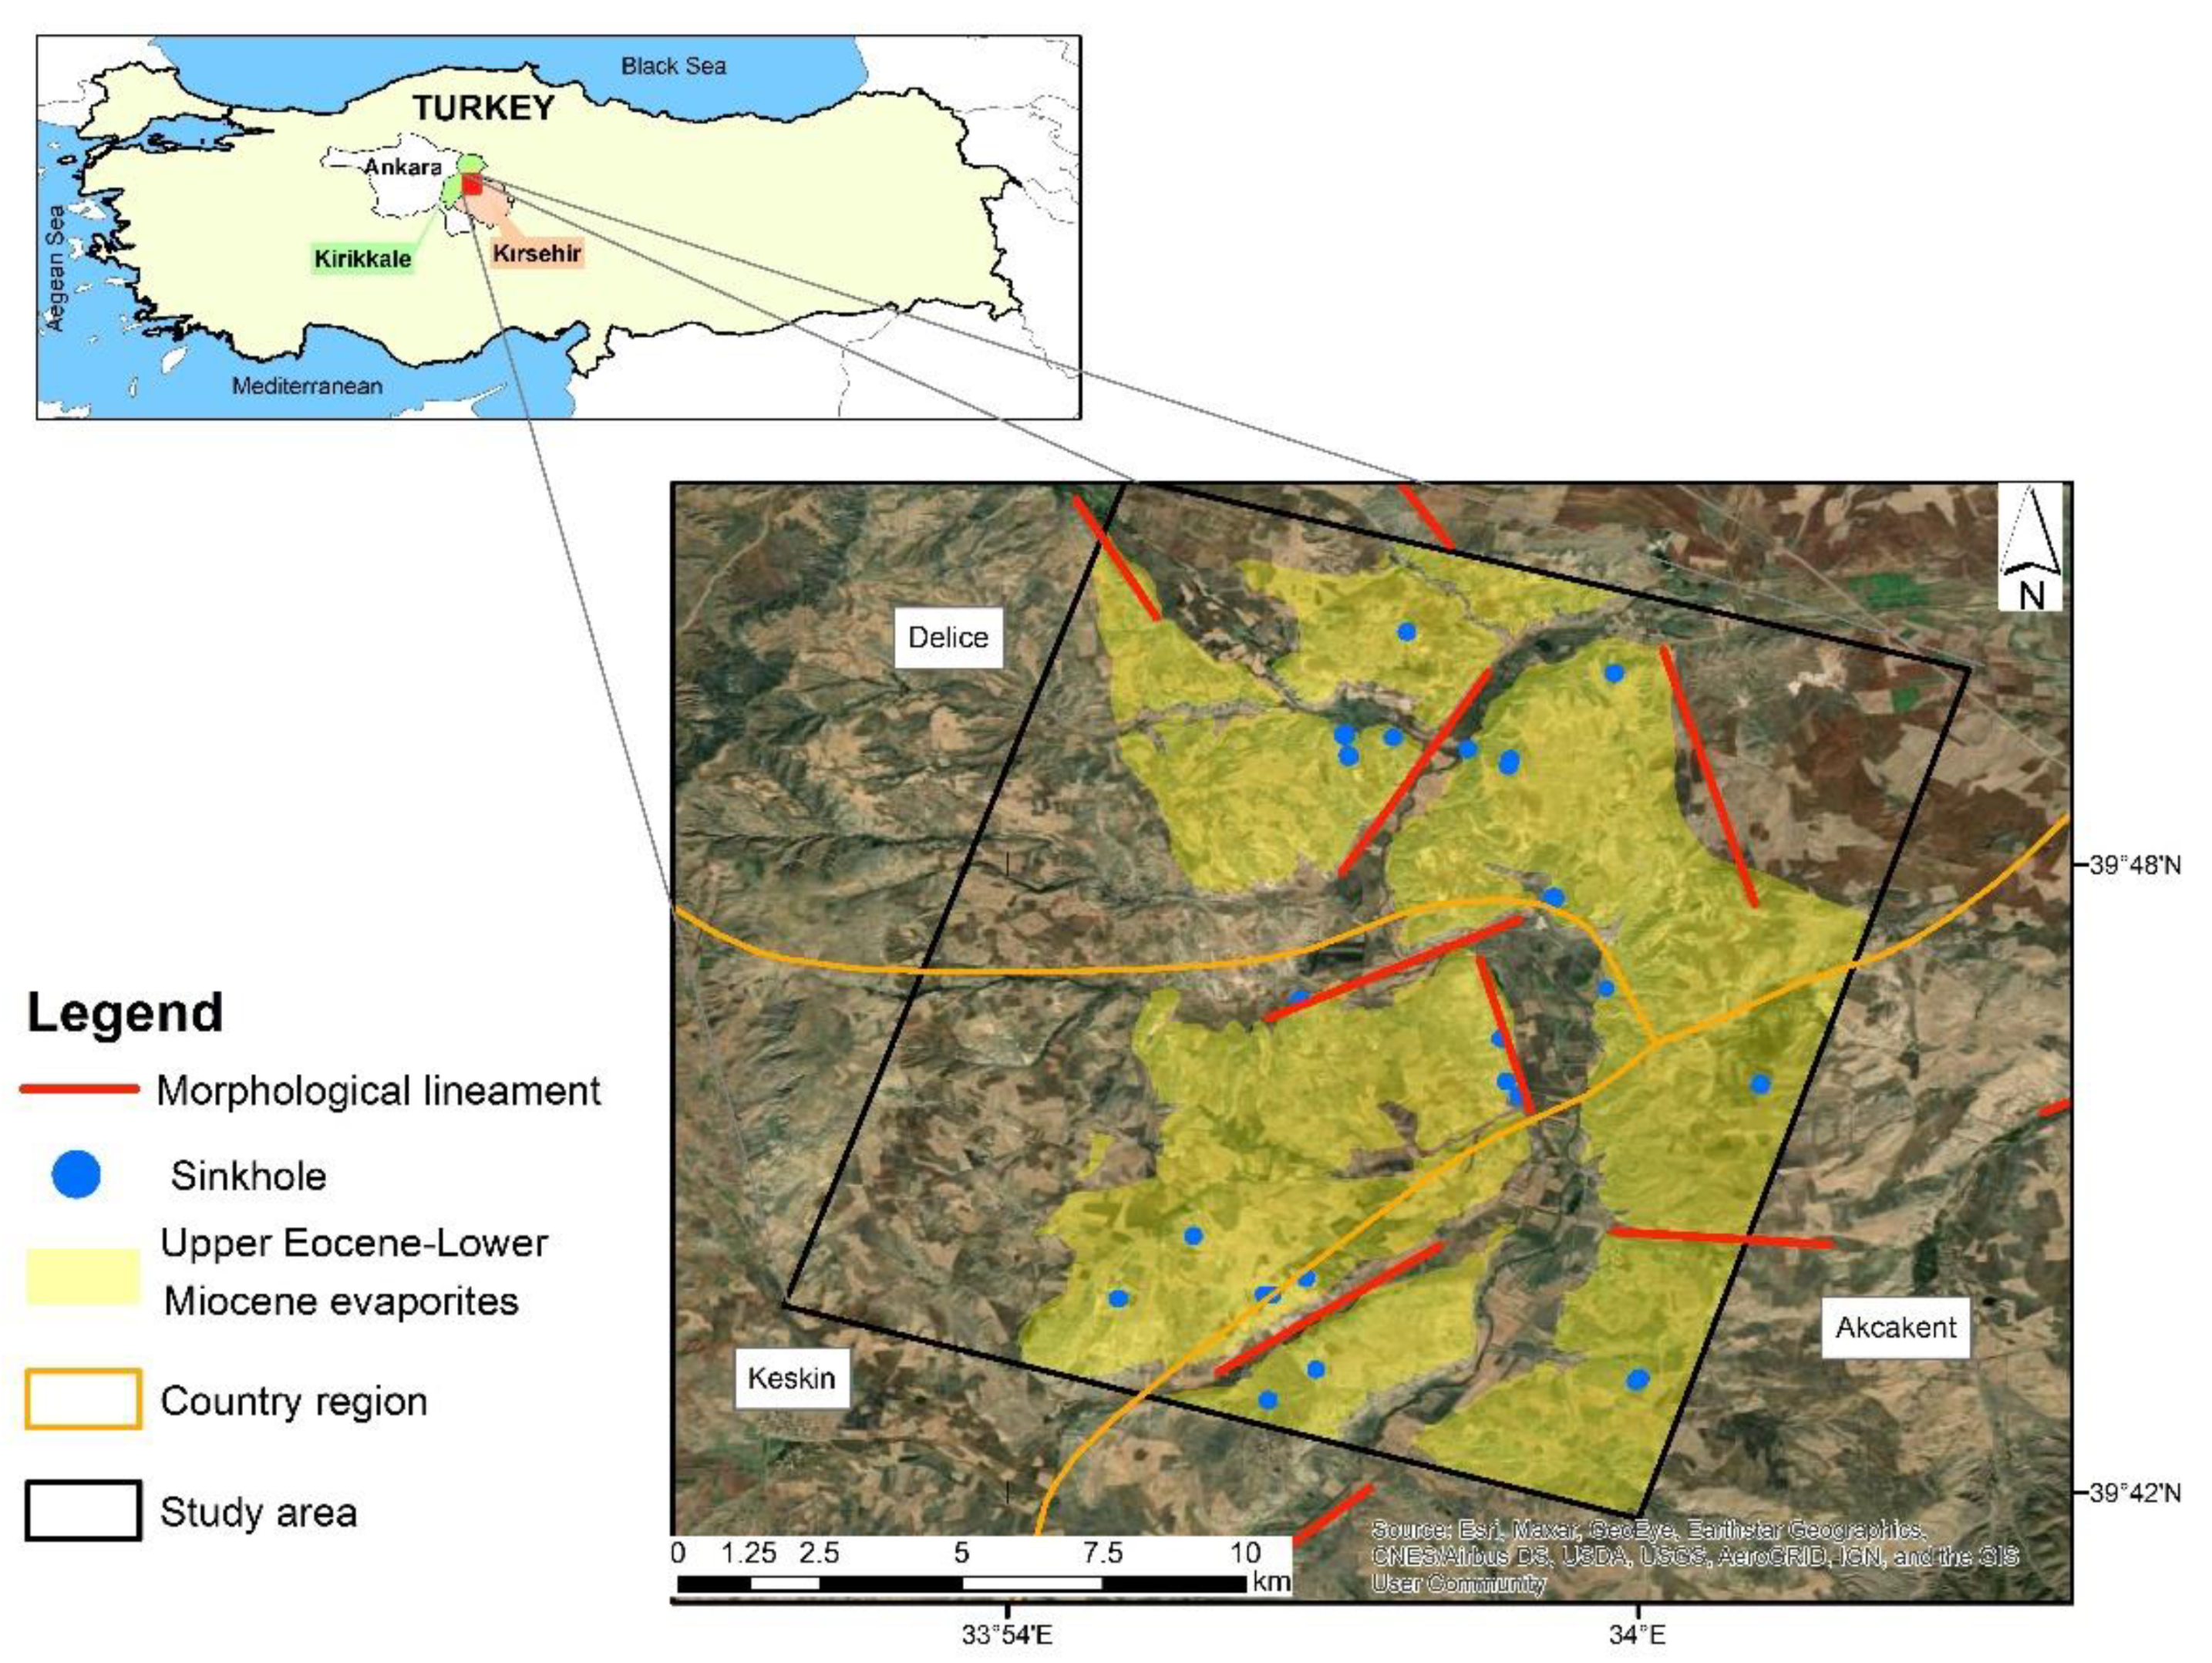
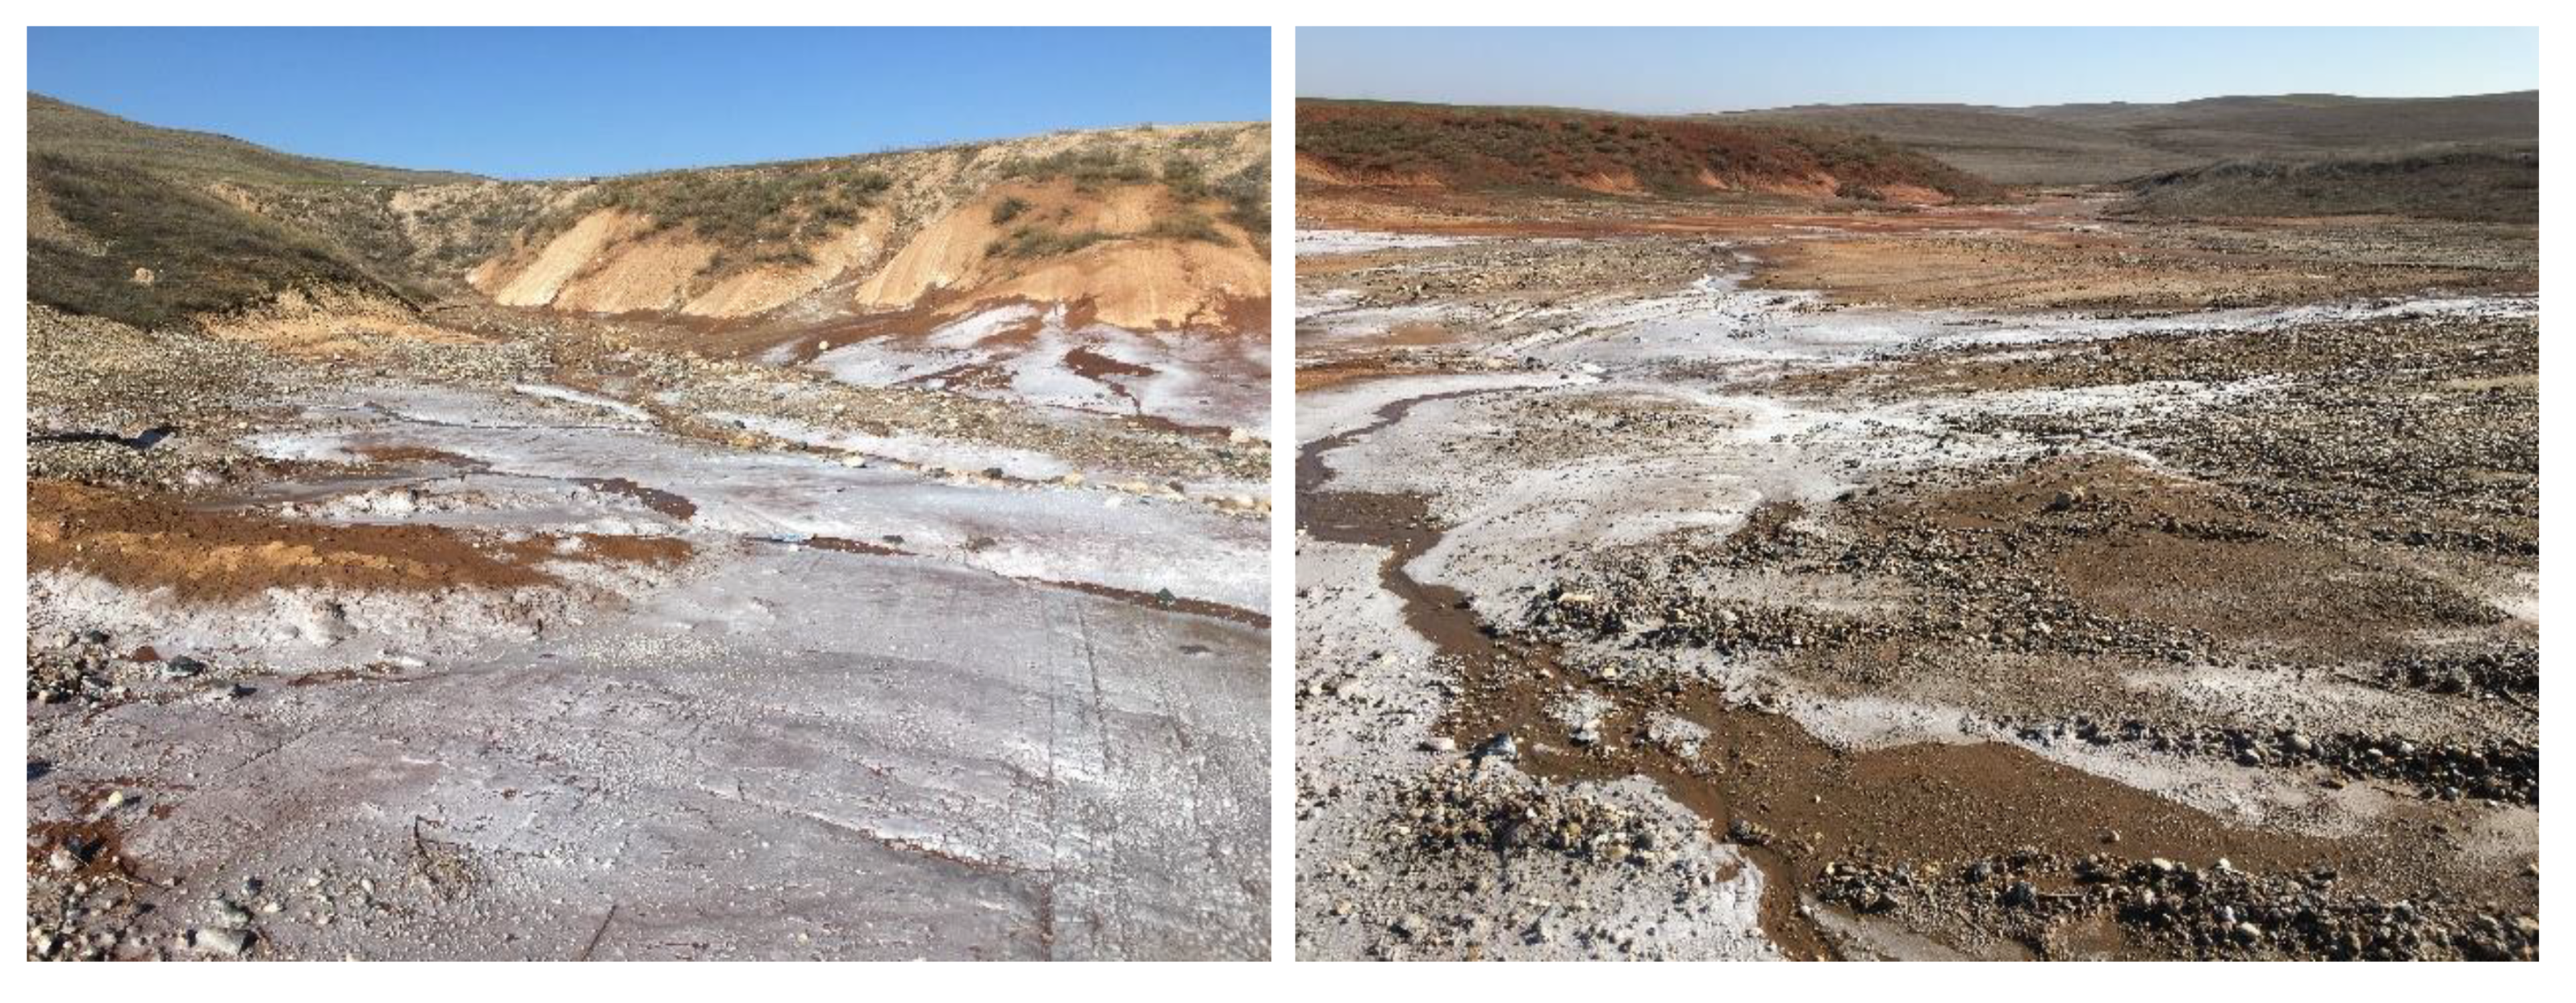
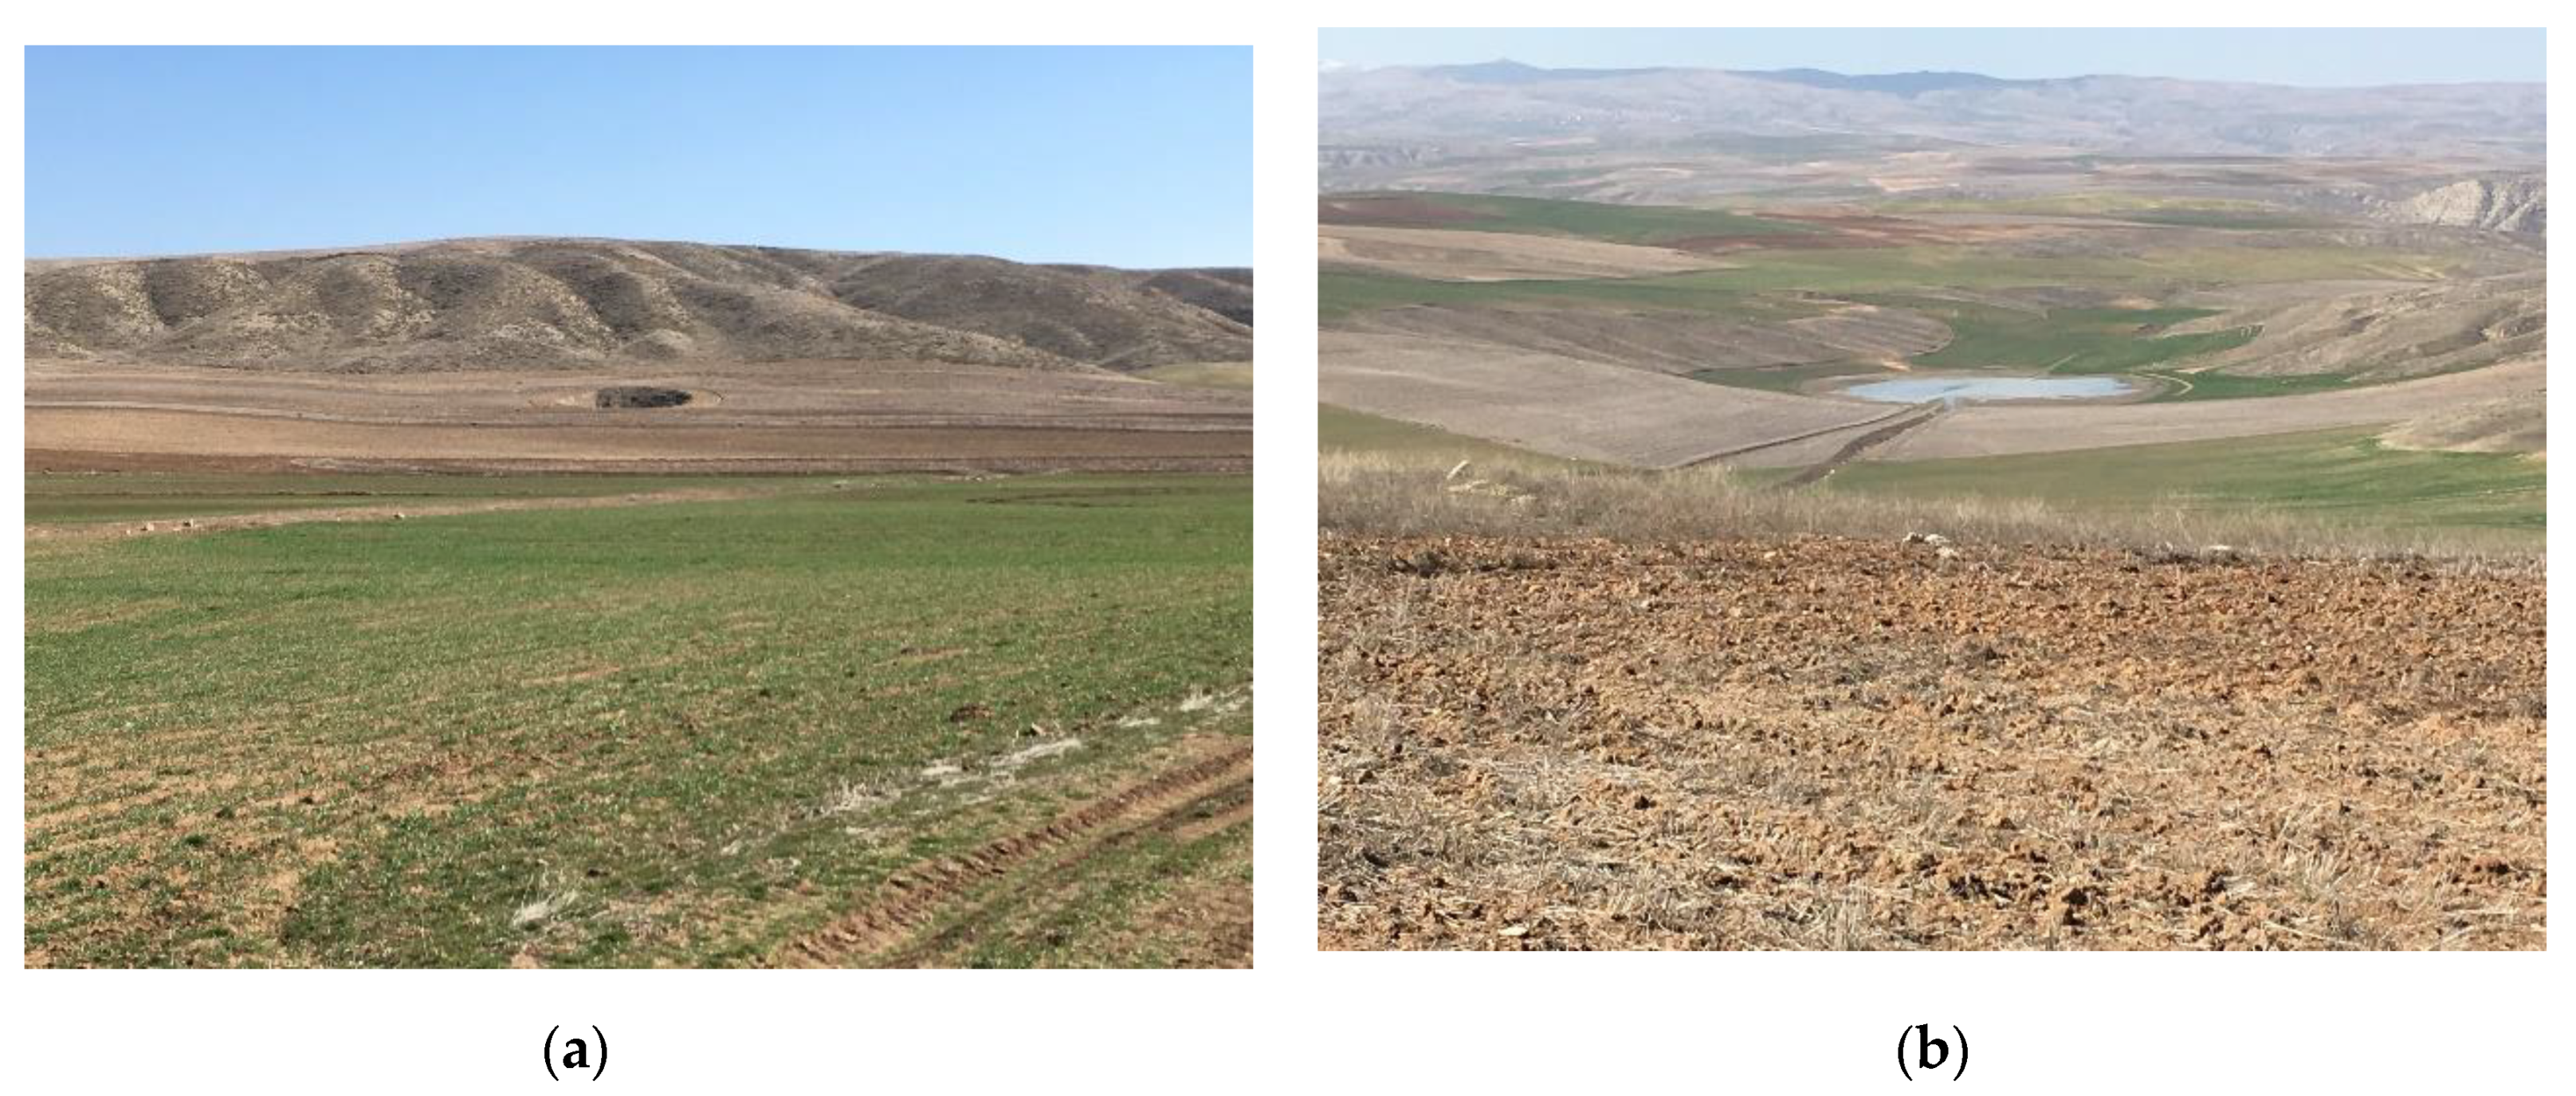
2.1. Study Area and Sinkhole Inventory
2.2. Sentinel-1 Characteristics and the SAR Datasets
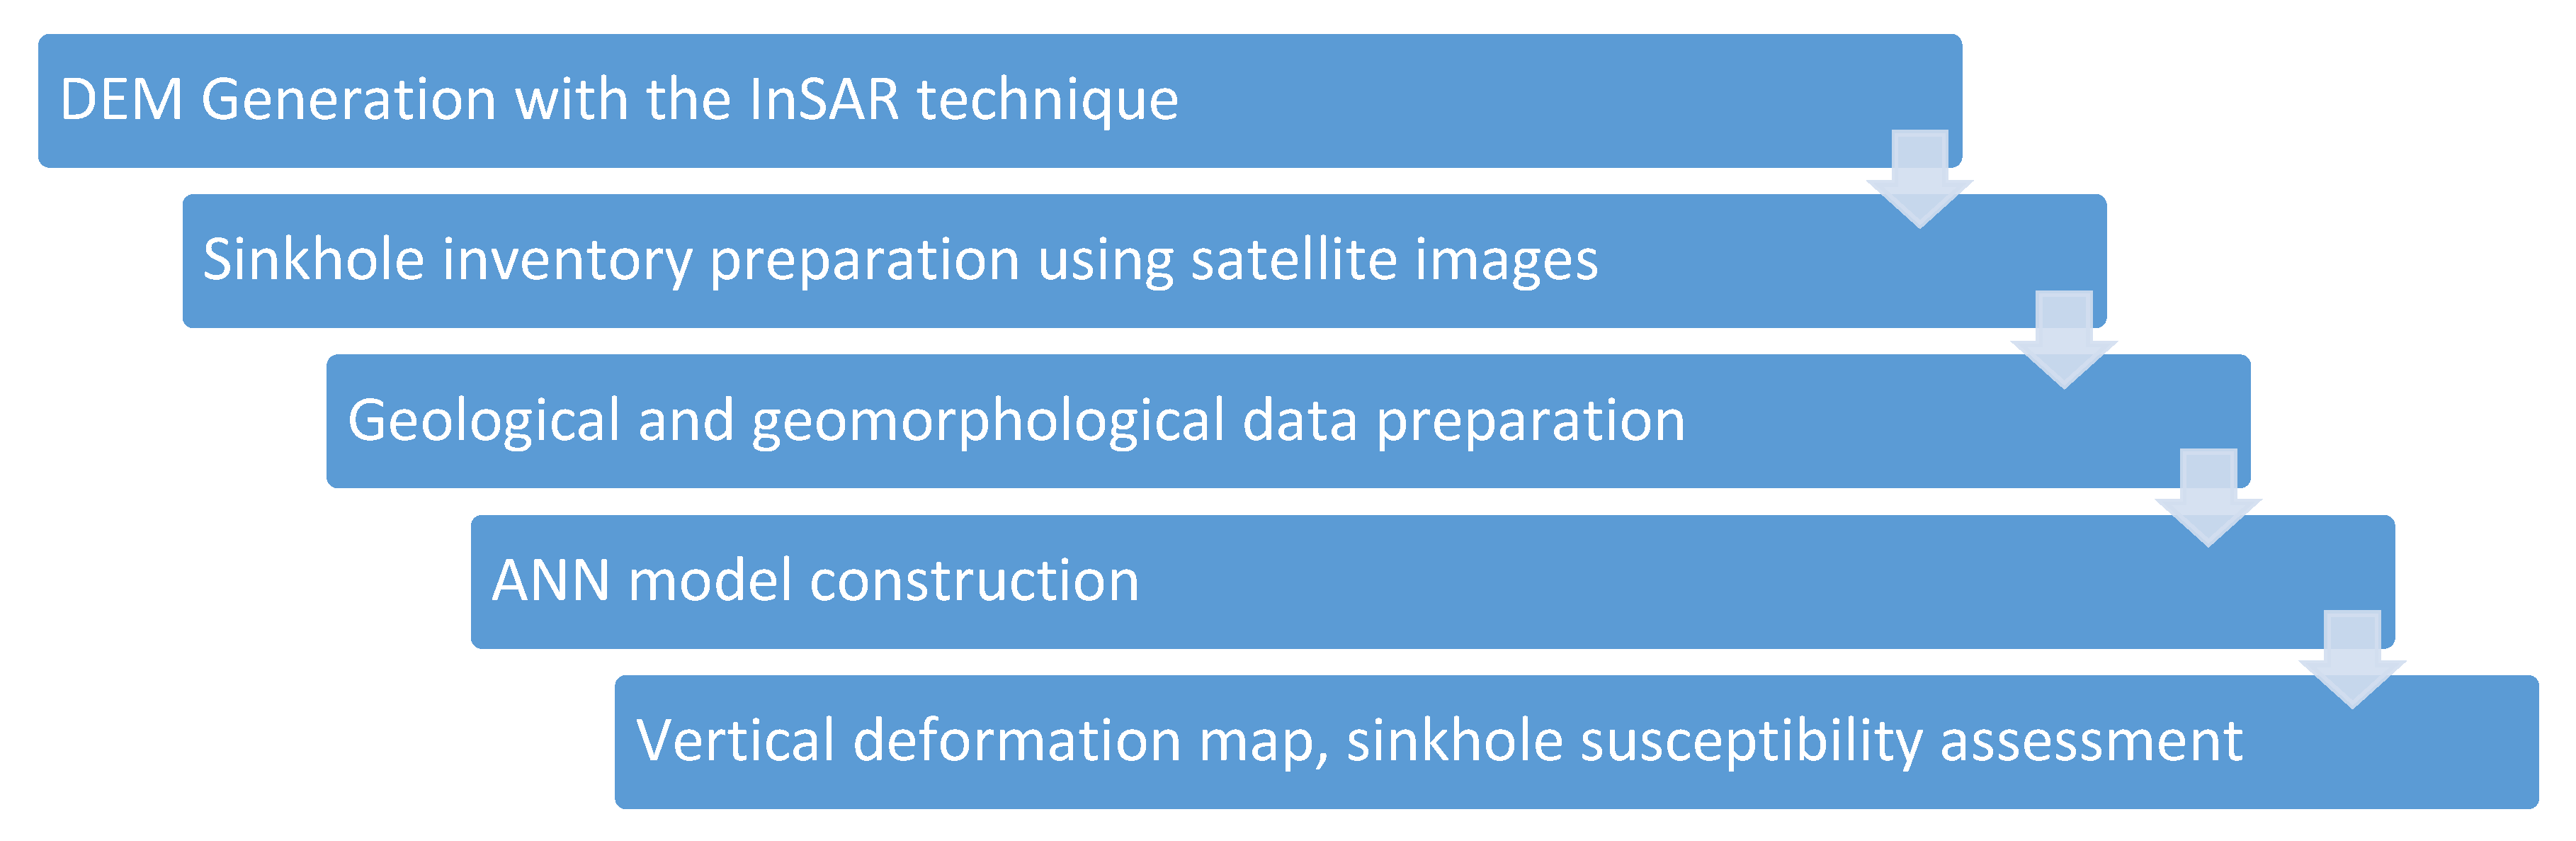
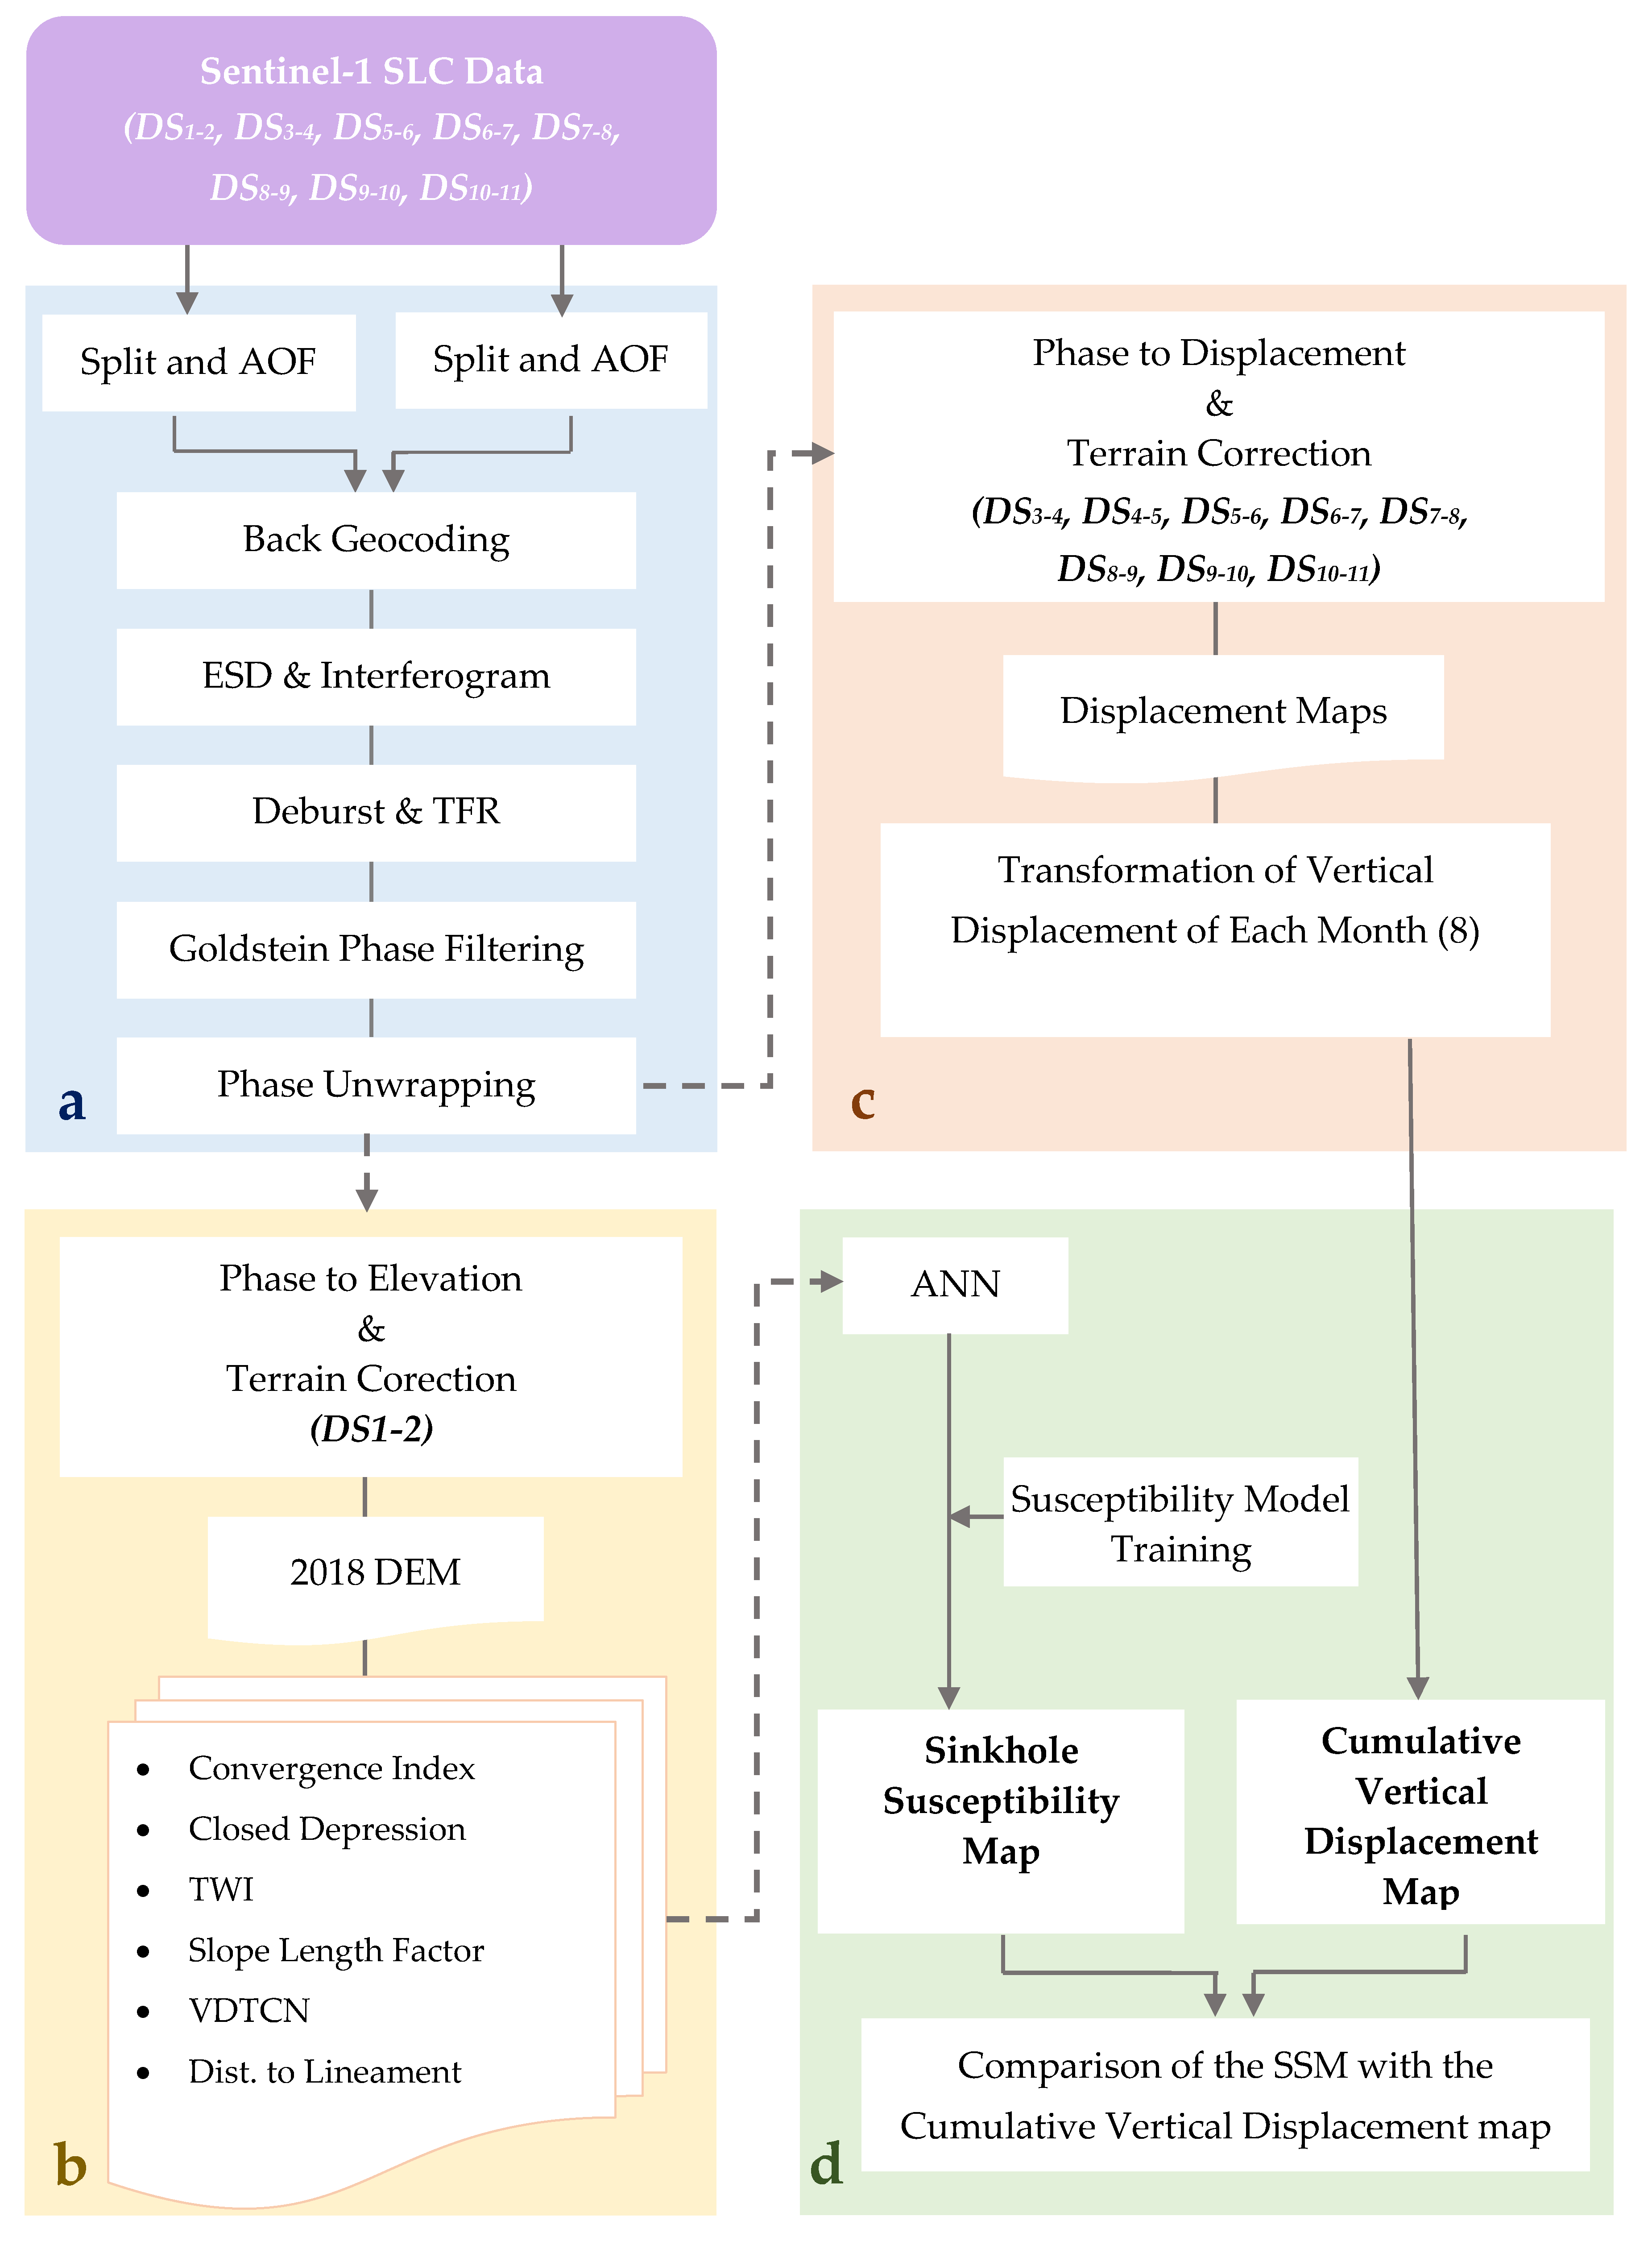
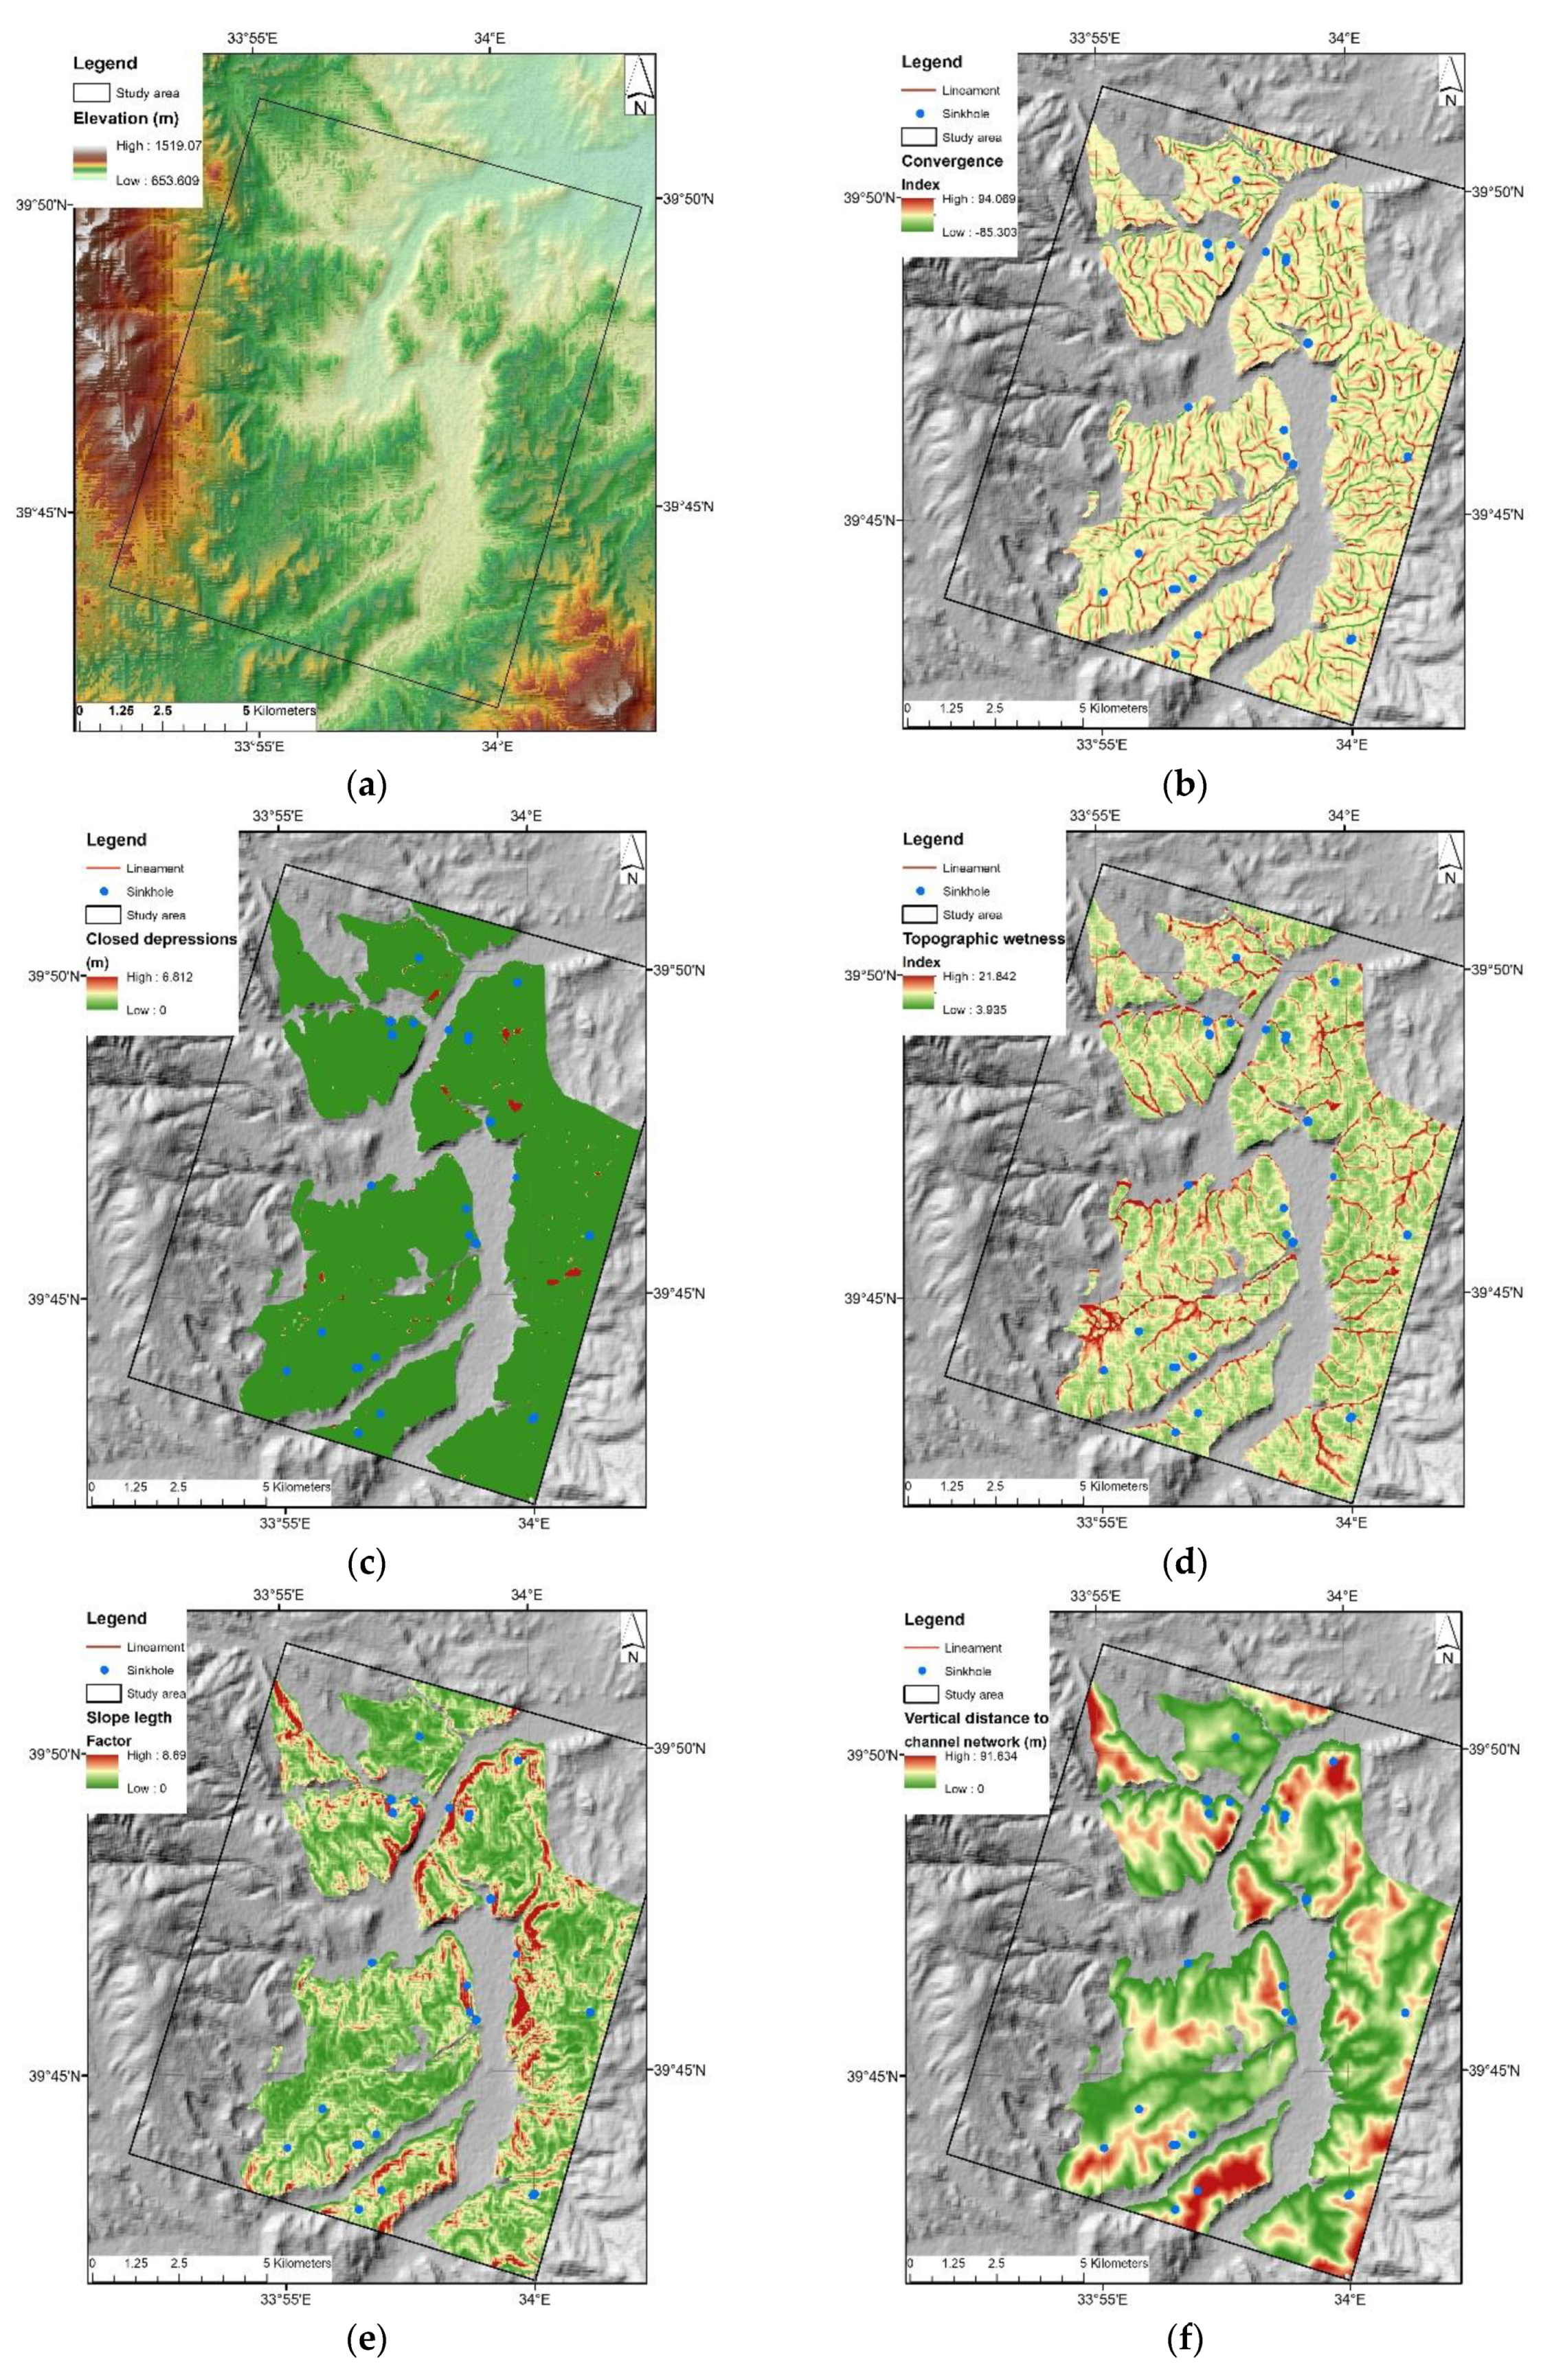
3. Methodology
3.1. Processing of Sentinel-1 Datasets
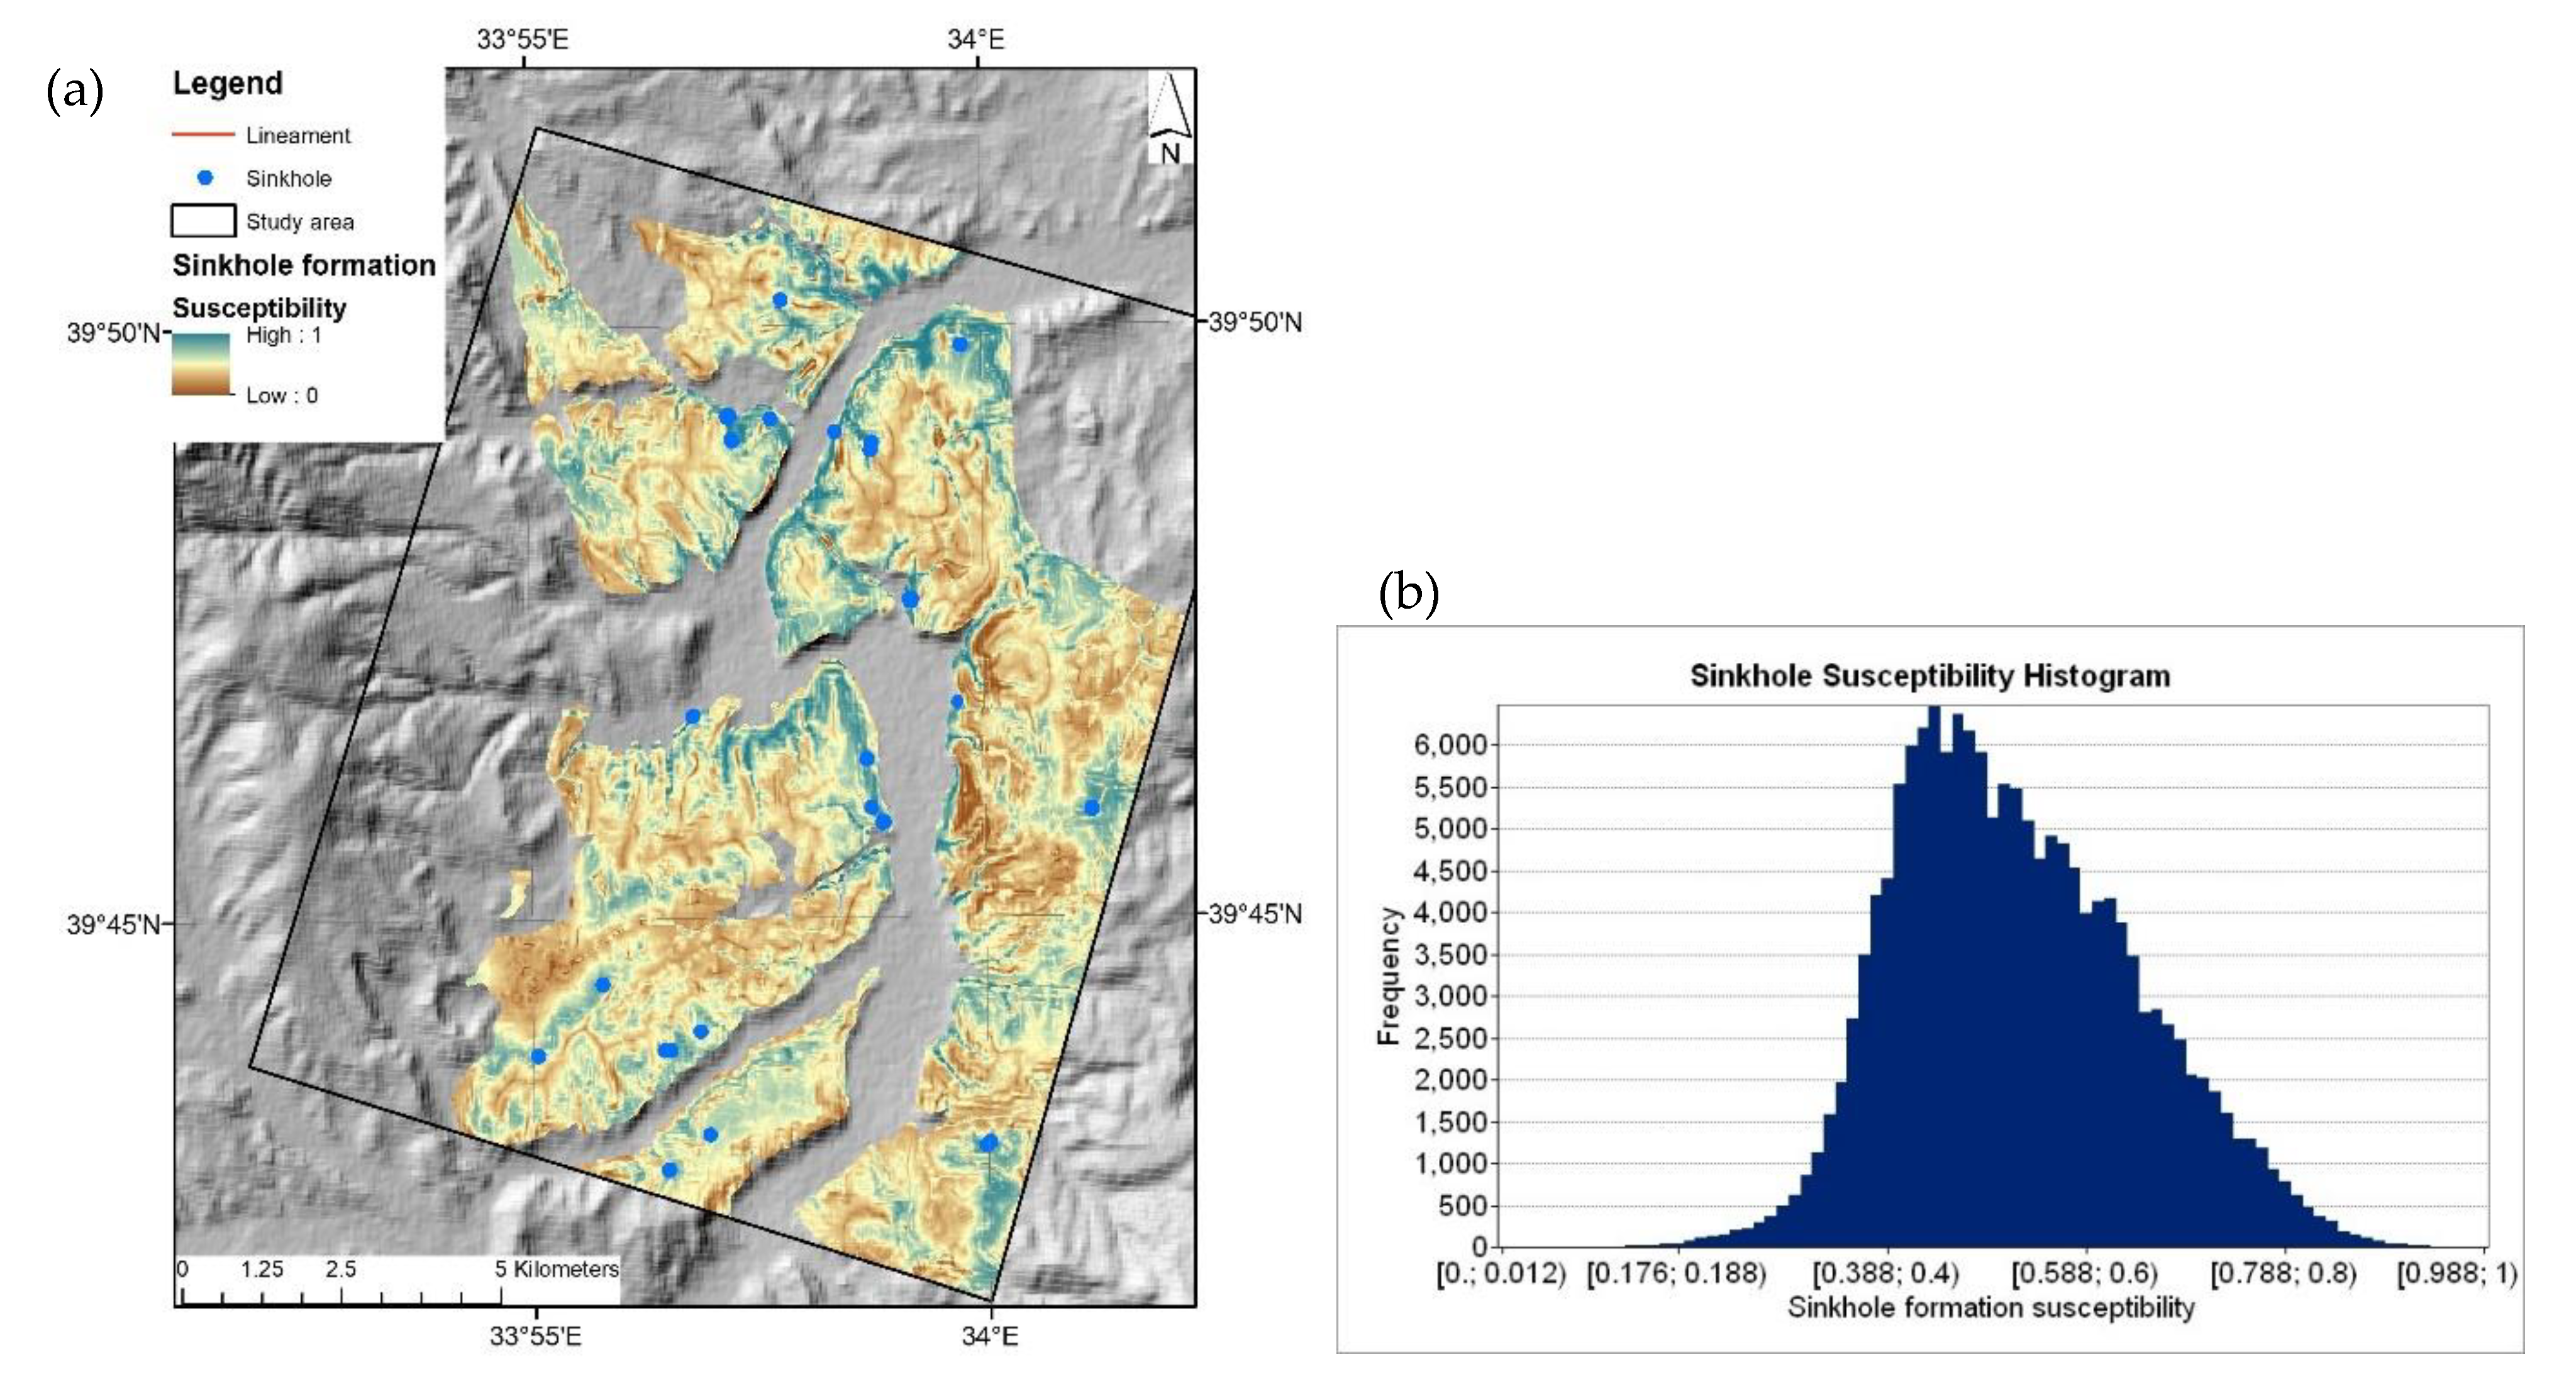
3.2. Sinkhole Susceptibility Assessment with the ANN Model
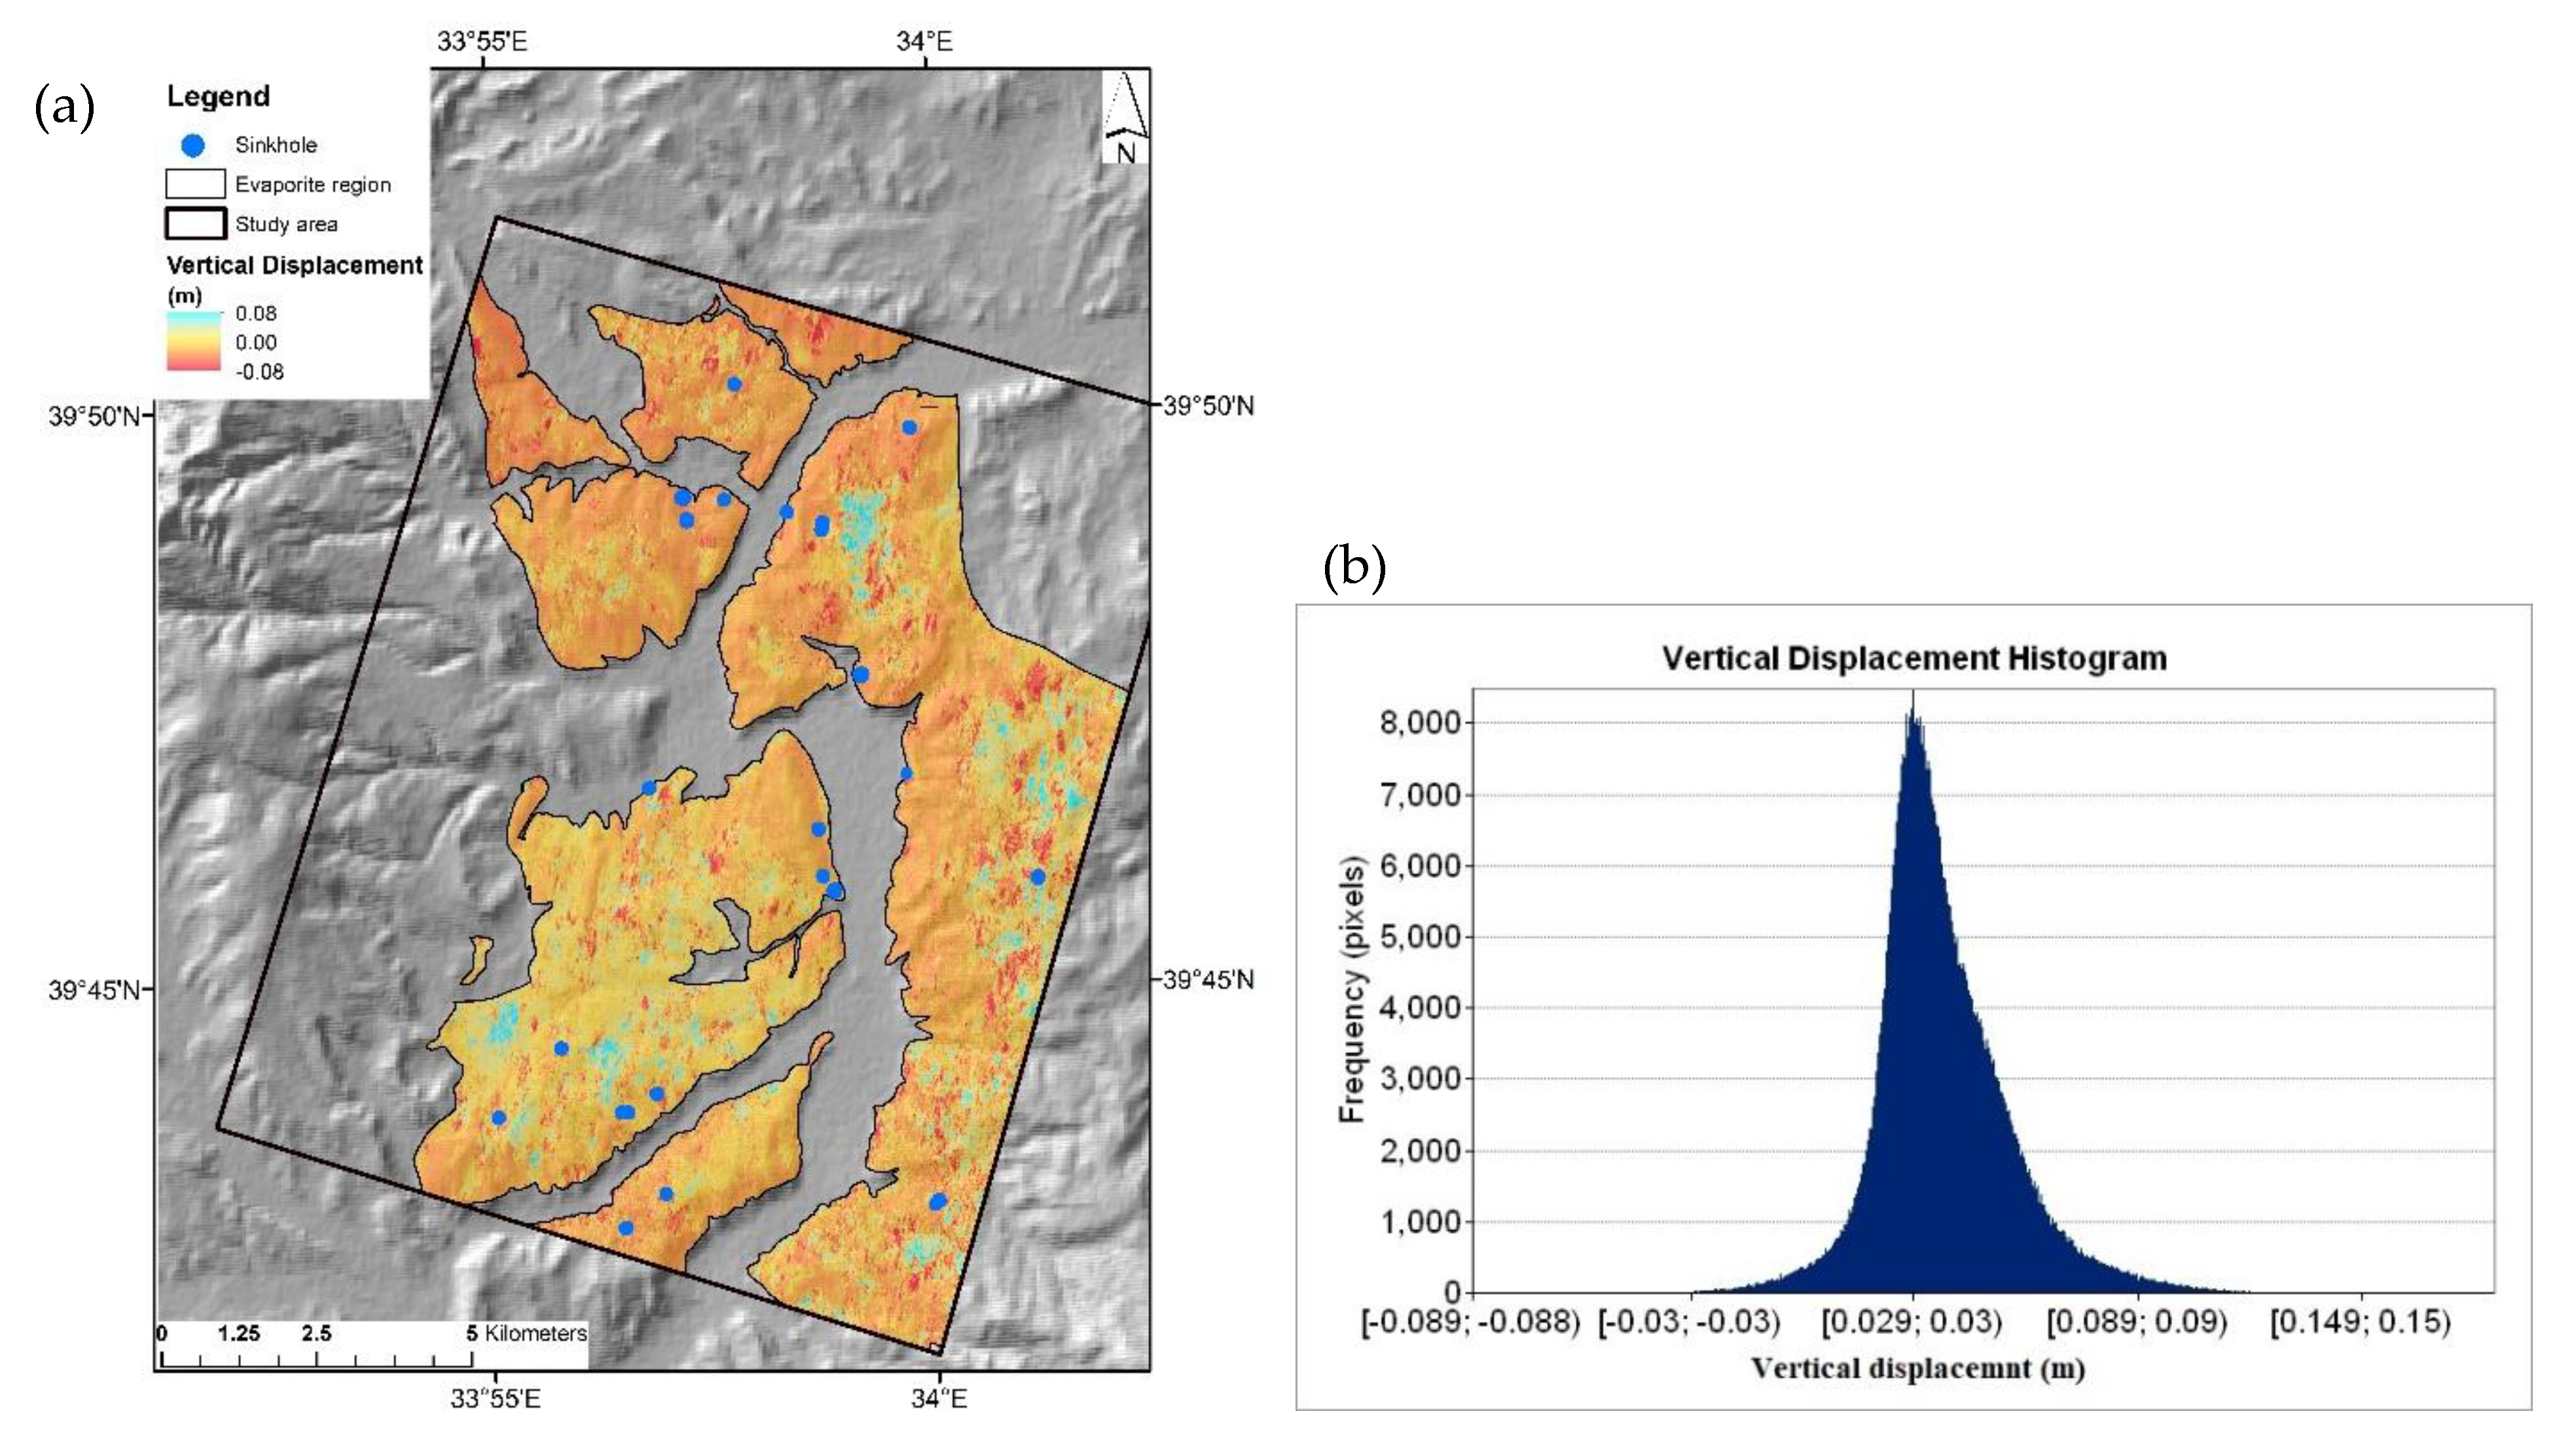
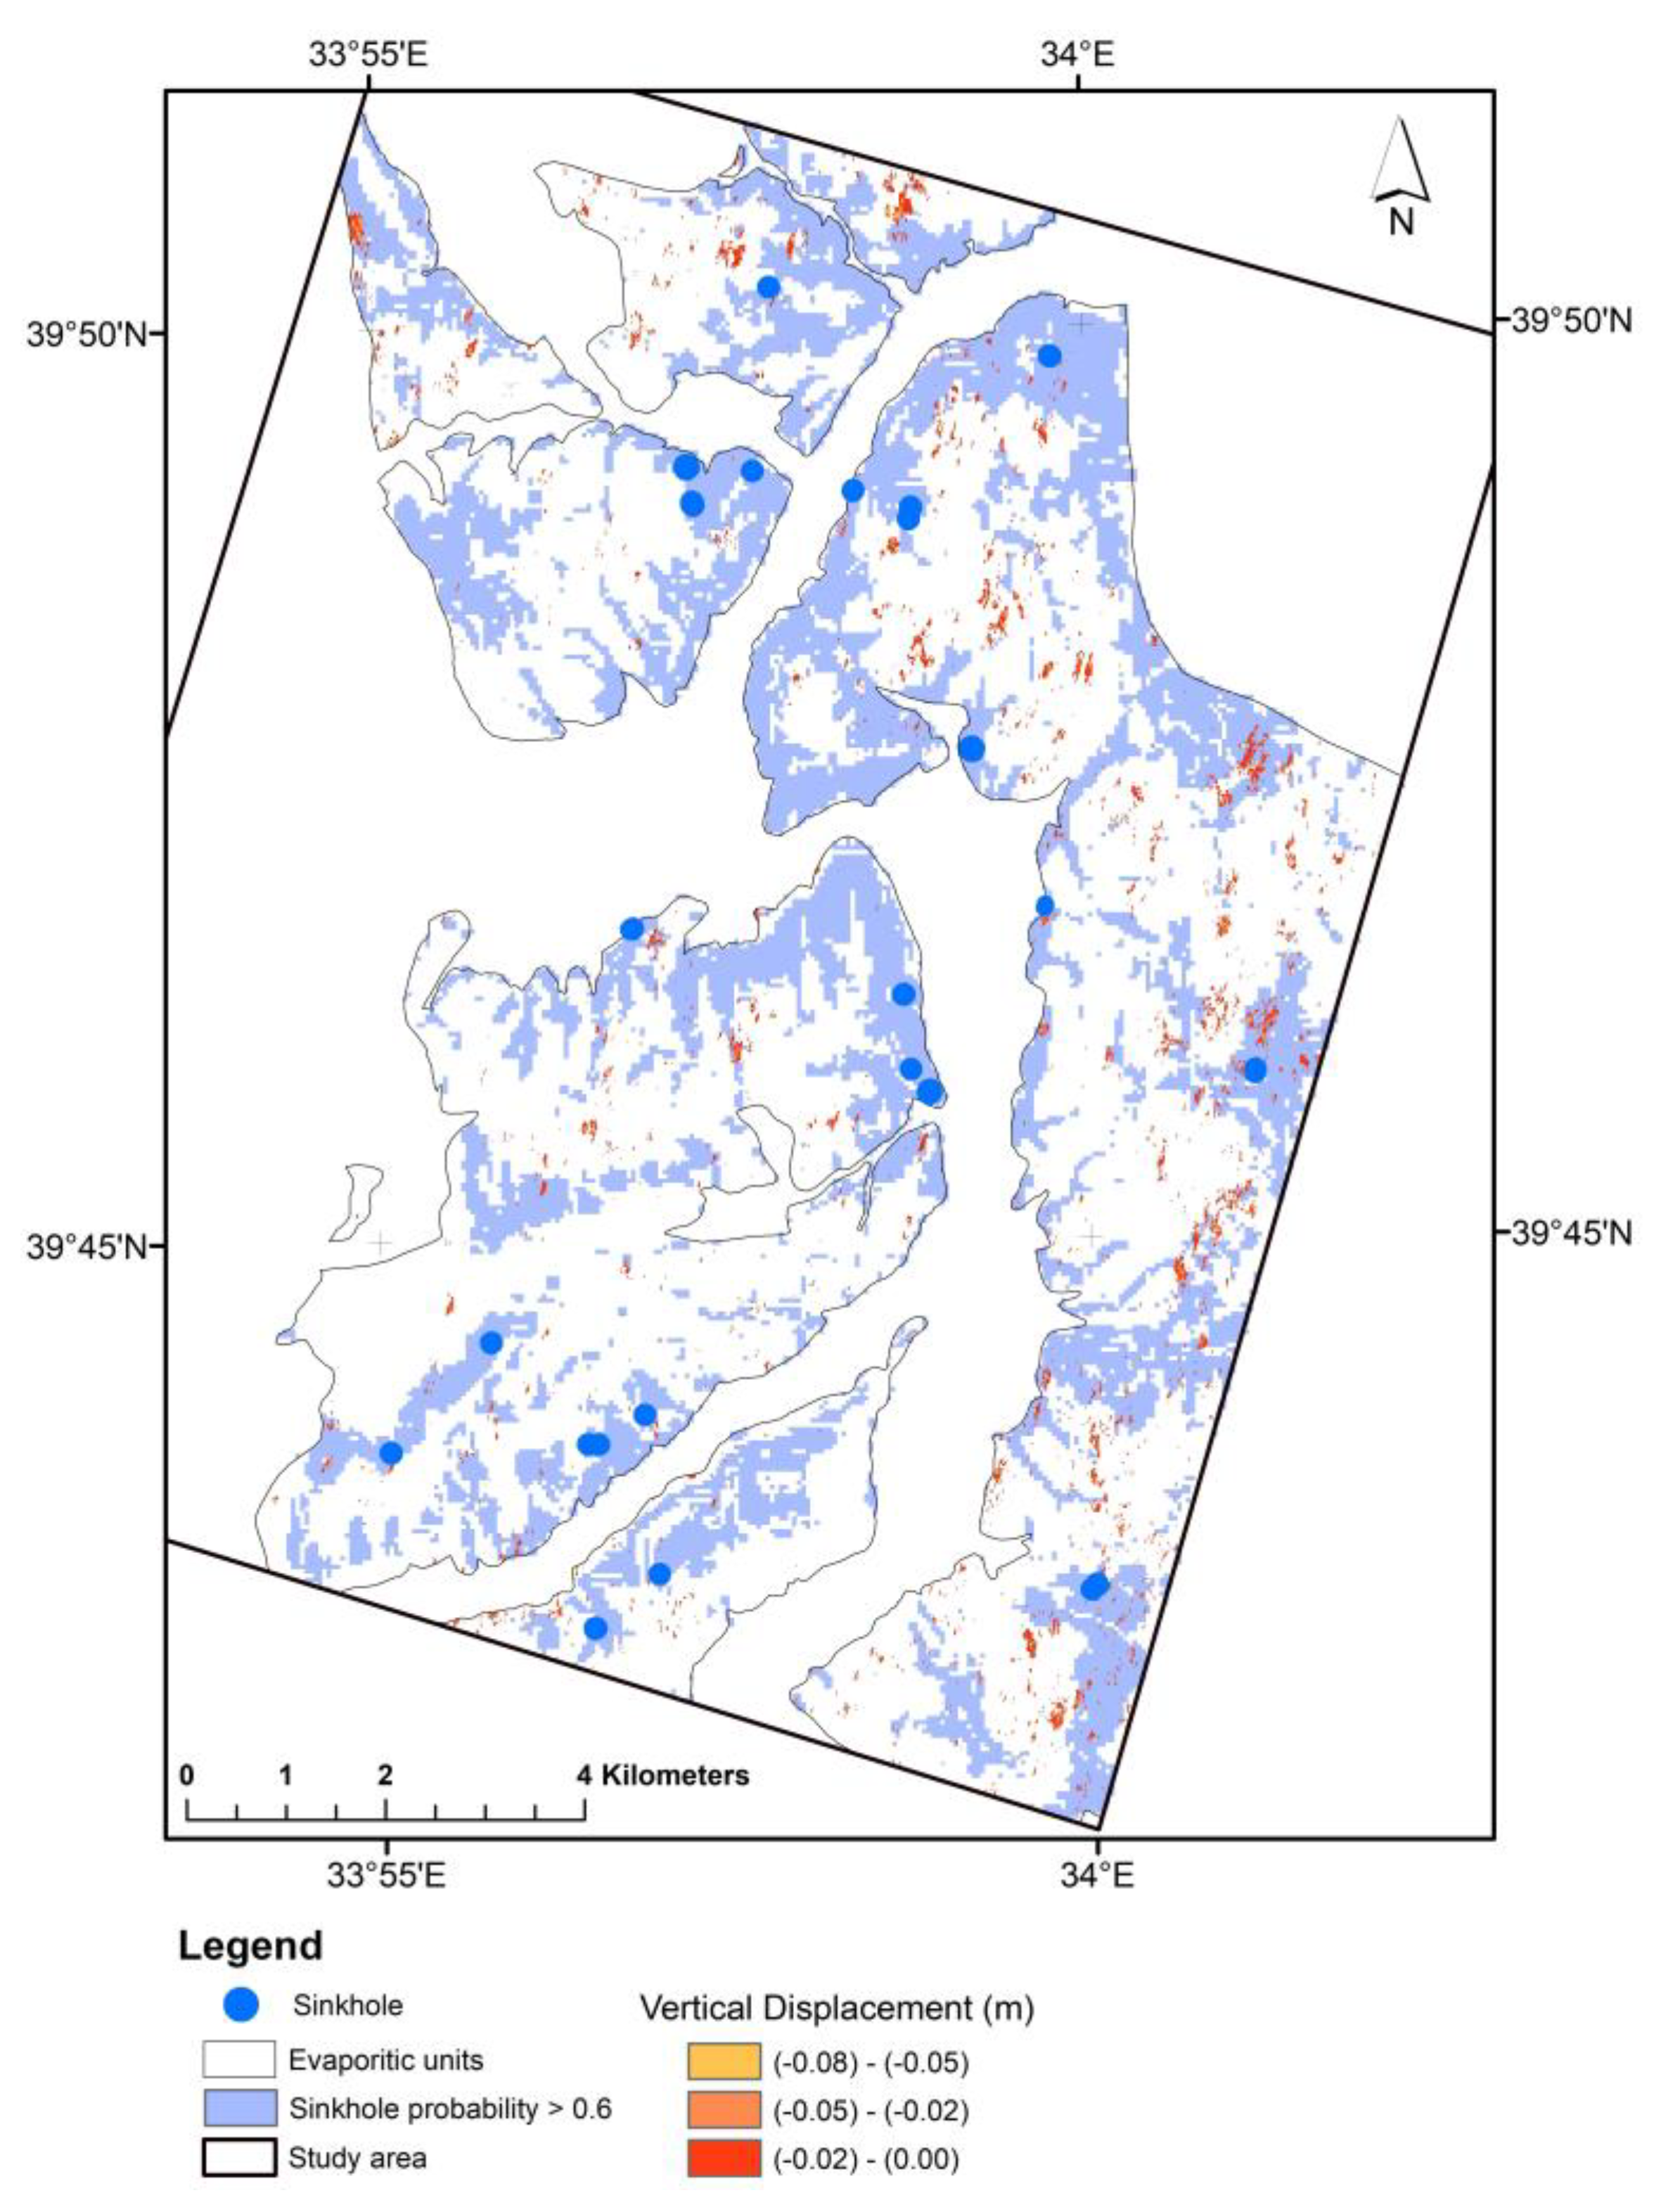
4. Results
5. Discussion and Conclusions
Author Contributions
Funding
Data Availability Statement
Conflicts of Interest
References
- Gutiérrez, F.; Galve, J.P.; Lucha, P.; Castañeda, C.; Bonachea, J.; Guerrero, J. Integrating geomorphological mapping, trenching, InSAR and GPR for the identification and characterization of sinkholes: A review and application in the mantled evaporite karst of the Ebro Valley (NE Spain). Geomorphology 2011, 134, 144–156. [Google Scholar] [CrossRef] [Green Version]
- Galve, J.P.; Castañeda, C.; Gutiérrez, F.; Herrera, G. Assessing Sinkhole Activity in The Ebro Valley Mantled Evaporite Karst Using Advanced DInSAR. Geomorphology 2014, 229, 30–44. [Google Scholar] [CrossRef] [Green Version]
- Berardino, P.; Costantini, M.; Franceschetti, G.; Iodice, A.; Pietranera, L.; Rizzo, V. Use of Differential SAR Interferometry in Monitoring and Modelling Large Slope Instability at Maratea (Basilicata, Italy). Eng. Geol. 2003, 68, 31–51. [Google Scholar] [CrossRef]
- Bovenga, F.; Nutricato, R.; Refice, A.; Wasowski, J. Application of Multi-Temporal Differential Interferometry to Slope Instability Detection in Urban/Peri-Urban Areas. Eng. Geol. 2006, 88, 218–239. [Google Scholar] [CrossRef]
- Wasowski, J.; Bovenga, F. Investigating Landslides and Unstable Slopes with Satellite Multi Temporal Interferometry: Current Issues and Future Perspectives. Eng. Geol. 2014, 174, 103–138. [Google Scholar] [CrossRef]
- Kang, Y.; Zhao, C.; Zhang, Q.; Lu, Z.; Li, B. Application of InSAR Techniques to an Analysis of the Guanling Landslide. Remote Sens. 2017, 9, 1046. [Google Scholar] [CrossRef] [Green Version]
- Hao, J.; Wu, T.; Wu, X.; Hu, G.; Zou, D.; Zhu, X.; Zhao, L.; Li, R.; Xie, C.; Ni, J.; et al. Investigation of a Small Landslide in the Qinghai-Tibet Plateau by InSAR and Absolute Deformation Model. Remote Sens. 2019, 11, 2126. [Google Scholar] [CrossRef] [Green Version]
- Bakon, M.; Czikhardt, R.; Papco, J.; Barlak, J.; Rovnak, M.; Adamisin, P.; Perissin, D. remotIO: A Sentinel-1 Multi-Temporal InSAR Infrastructure Monitoring Service with Automatic Updates and Data Mining Capabilities. Remote Sens. 2020, 12, 1892. [Google Scholar] [CrossRef]
- Zhao, J.; Wu, J.; Ding, X.; Wang, M. Elevation Extraction and Deformation Monitoring by Multitemporal InSAR of Lupu Bridge in Shanghai. Remote Sens. 2017, 9, 897. [Google Scholar] [CrossRef] [Green Version]
- Bozzano, F.; Carabella, C.; De Pari, P.; Discenza, M.E.; Fantucci, R.; Mazzanti, P.; Miccadei, E.; Rocca, A.; Romano, S.; Sciarra, N. Geological and geomorphological analysis of a complex landslides system: The case of San Martino sulla Marruccina (Abruzzo, Central Italy). J. Maps 2020, 16, 126–136. [Google Scholar] [CrossRef] [Green Version]
- Bozzano, F.; Mazzanti, P.; Perissin, D.; Rocca, A.; De Pari, P. Basin scale assessment of landslides geomorphological setting by advanced InSAR analysis. Remote Sens. 2017, 9, 267. [Google Scholar] [CrossRef] [Green Version]
- Ferretti, A.; Prati, C.; Rocca, F. Permanent Scatterers in SAR Interferometry. IEEE Trans. Geosci. Remote Sens. 2001, 39, 8–20. [Google Scholar] [CrossRef]
- Castañeda, C.; Pourthié, N.; Souyris, J.C. Dedicated SAR interferometric analysis to detect subtle deformation in evaporite areas around Zaragoza, NE Spain. Int. J. Remote Sens. 2010, 32. [Google Scholar] [CrossRef] [Green Version]
- Intrieri, E.; Gigli, G.; Nocentini, M.; Lombardi, L.; Mugnai, F.; Fidolini, F.; Casagli, N. Sinkhole monitoring and early warning: An experimental and successful GB-InSAR application. Geomorphology 2015, 241, 304–314. [Google Scholar] [CrossRef] [Green Version]
- Atzori, S.; Antonioli, A.; Salvi, S.; Baer, G. InSAR-based modeling and analysis of sinkholes along the Dead Sea coastline. Geophys. Res. Lett. 2015, 42, 8383–8390. [Google Scholar] [CrossRef] [Green Version]
- Nof, R.N.; Abelson, M.; Raz, E.; Magen, Y.; Atzori, S.; Salvi, S.; Baer, G. SAR interferometry for sinkhole early warning and susceptibility assessment along the Dead Sea, Israel. Remote Sens. 2019, 11, 89. [Google Scholar] [CrossRef] [Green Version]
- Derauw, D.; Moxhet, J. Preliminary results of Tandem SAR Interferometry and Differential Interferometry Over the Dead Sea area. In Fringe’96 ESA Workshop on Applications of ERS SAR Interferometry Remote Sensing Laboratories; University of Zurich: Zurich, Switzerland, 1996. [Google Scholar]
- Derauw, D.; Moxhet, J. Multiple image SAR interferometry. In Fringe’96 ESA Workshop on Applications of ERS SAR Interferometry Remote Sensing Laboratories; University of Zurich: Zurich, Switzerland, 1996; Digital. [Google Scholar]
- Baer, G.; Schattner, U.; Wachs, D.; Sandwell, D.; Wdowinski, S.; Frydman, S. The Lowest Place on Earth is Subsiding- an InSAR (interferometric synthetic aperture radar) Perspective. Geol. Soc. Am. Bull. 2002, 114, 12–23. [Google Scholar] [CrossRef] [Green Version]
- Closson, D. Structural Control of Sinkholes and Subsidence Hazards Along the Jordanian Dead Sea Coast. Environ. Geol. 2005, 47, 290–301. [Google Scholar] [CrossRef]
- Closson, D.; Karaki, N.A.; Milisavljevic, N.; Hallot, F.; Acheroy, M. Salt-Dissolution-Induced Subsidence in the Dead Sea Area Detected by Applying Interferometric Techniques to ALOS PALSAR Synthetic Aperture Radar Images. Geodin. Acta 2010, 23, 65–78. [Google Scholar] [CrossRef] [Green Version]
- Paine, J.G.; Buckley, S.M.; Collins, E.W.; Wilson, C.R.; Box, X. Assessing Collapse Risk in Evaporite Sinkhole-Prone Areas Using Microgravimetry and Radar Interferometry. J. Environ. Eng. Geophys. 2012, 17, 75–87. [Google Scholar] [CrossRef] [Green Version]
- Elmahdy, S.I.; Mohamed, M.M.; Ali, T.A.; Abdalla, J.E.D.; Abouleish, M. Land Subsidence and Sinkholes Susceptibility Mapping and Analysis Using Random Forest and Frequency Ratio Models in Al Ain, UAE. Geocarto Int. 2020, 1–17. [Google Scholar] [CrossRef]
- Theron, A.; Engelbrecht, J.; Kemp, J.; Kleynhans, W.; Turnbull, T. Detection of Sinkhole Precursors through SAR Interferometry: Radar and Geological Considerations. IEEE Geosci. Remote Sens. Lett. 2017, 14, 871–875. [Google Scholar] [CrossRef] [Green Version]
- Malinowska, A.A.; Witkowski, W.T.; Hejmanowski, R.; Chang, L.; Van Leijen, F.J.; Hanssen, R.F. Sinkhole occurrence Monitoring Over Shallow Abandoned Coal Mines with Satellite-Based Persistent Scatterer Interferometry. Eng. Geol. 2019, 262, 105336. [Google Scholar] [CrossRef]
- Kim, J.W.; Lu, Z.; Degrandpre, K. Ongoing Deformation of Sinkholes in Wink, Texas, Observed by Time-Series Sentinel-1A SAR Interferometry (Preliminary Results). Remote Sens. 2016, 8, 313. [Google Scholar] [CrossRef] [Green Version]
- Castañeda, C.; Gutiérrez, F.; Manunta, M.; Galve, J.P. DInSAR Measurements of Ground Deformation by Sinkholes, Mining Subsidence, and Landslides, Ebro River, Spain. Earth Surf. Process. Landf. 2009, 34, 1562–1574. [Google Scholar] [CrossRef] [Green Version]
- Chang, L.; Hanssen, R.F. Detection of cavity migration and sinkhole risk using radar interferometric time series. Remote Sens. Environ. 2014, 147, 56–64. [Google Scholar] [CrossRef]
- SNAP Tool. Sentinel Application Platform (SNAP). 2020. Available online: step.esa.int/main/toolboxes/snap/ (accessed on 16 November 2020).
- Donmez, M.; Bilgin, Z.R.; Akcay, A.E.; Kara, H.; Yergok, A.F.; Esenturk, K. 1:100 000 Olcekli Turkiye Jeoloji Haritalari, No: 47, Kirşehir-I32 Paftasi; Maden Tetkik Arama Genel Mudurlugu: Ankara, Turkey, 2005. [Google Scholar]
- Kara, H. 1/100.000 Olcekli Acinsama Nitelikli Türkiye Jeoloji Haritalari Serisi, Kirsehir-G 18 Paftasi, No: 37; MTA: Ankara, Turkey, 1991. [Google Scholar]
- Waltham, T.; Bell, F.; Culshaw, M. Sinkholes and subsidence, Karst and Cavernous Rocks in Engineering and Construction; Springer: Berlin/Heidelberg, Germany; Praxis Publishing: Chichester, UK, 2005; p. 382. [Google Scholar]
- Plank, S. Rapid damage assessment by means of multi-temporal SAR—A comprehensive review and outlook to Sentinel-1. Remote Sens. 2014, 6, 4870–4906. [Google Scholar] [CrossRef] [Green Version]
- De Zan, F.; Guarnieri, A.M. TOPSAR: Terrain Observation by Progressive Scans. IEEE Trans. Geosci. Remote Sens. 2006, 44, 2352–2360. [Google Scholar] [CrossRef]
- ESA 2013. European Space Agency Sentinel-1 User Handbook, GMES-S1OP-EOPG-TN-13-0001. Available online: sentinel.esa.int/ (accessed on 26 February 2021).
- Geudtner, D.; Prats, P.; Yague-Martinez, N.; Navas-Traver, I.; Barat, I.; Torres, R. Sentinel-1 SAR Interferometry Performance Verification. In Proceedings of the EUSAR 2016: 11th European Conference on Synthetic Aperture Radar, Hamburg, Germany, 6–9 June 2016; pp. 1–4. [Google Scholar]
- ASF Software. University of Alaska, USA, Alaska Satellite Facility Software. 2020. Available online: search.asf.alaska.edu (accessed on 26 February 2021).
- Subedi, P.; Subedi, K.; Thapa, B.; Subedi, P. Sinkhole susceptibility mapping in Marion County, Florida: Evaluation and comparison between analytical hierarchy process and logistic regression based approaches. Sci. Rep. 2019, 9, 7140. [Google Scholar] [CrossRef] [Green Version]
- Benson, R.C.; Yuhr, L.; Kaufmann, R.D. Assessing the risk of karst subsidence and collapse. Am. Soc. Civ. Eng. Geotech. Spec. Publ. 2003, 122, 31–39. [Google Scholar]
- Saga GIS Library Documentation. SAGA-GIS Tool Library Documentation (v7.9.0). 2020. Available online: http://www.saga-gis:saga_tool_doc/7.9.0/index.html (accessed on 2 February 2021).
- Olaya, V.; Conrad, O. Chapter 12 Geomorphometry in SAGA. Dev. Soil Sci. 2009, 33, 293–308. [Google Scholar]
- Gruber, S.; Peckham, S. Chapter 7 Land-Surface Parameters and Objects in Hydrology. Dev. Soil Sci. 2009, 33, 171–194. [Google Scholar]
- Goldstein, R.M.; Zebker, H.A.; Werner, C.L. Satellite radar interferometry: Two-dimensional phase unwrapping. Radio Sci. 1988, 23, 713–720. [Google Scholar] [CrossRef] [Green Version]
- Braun, A. DEM Generation with Sentinel-1 Workflow and Challenges; SkyWatch Space Applications Inc.: Waterloo, ON, Canada, 2020; Available online: http://step.esa.int/docs/tutorials/S1TBX%20DEM%20generation%20with%20Sentinel-1%20IW%20Tutorial.pdf (accessed on 2 February 2021).
- Sefercik, U.G.; Buyuksalih, G.; Atalay, C.; Jacobsen, K. Validation of Sentinel-1A and AW3D30 DSMs for the metropolitan area of Istanbul, Turkey. PFG J. Photogramm. Remote Sens. Geoinf. Sci. 2018, 86, 141–155. [Google Scholar] [CrossRef]
- Wright, T.J.; Parsons, B.E.; Lu, Z. Toward Mapping Surface Deformation in Three Dimensions Using InSAR. Geophys. Res. Lett. 2004, 31, 1–5. [Google Scholar] [CrossRef] [Green Version]
- Zheng, M.N.; Deng, K.Z.; Fan, H.D.; Du, S. Monitoring and Analysis of Surface Deformation in Mining Area Based on InSAR and GRACE. Remote Sens. 2018, 10, 1392. [Google Scholar] [CrossRef] [Green Version]
- Pepe, P.; Manuela, B.; Zhao, Q.; Yang, T.L.; Wang, H.M. The Use of C-/X-band Time-Gapped SAR Data and Geotechnical Models for the Study of Shanghai’s Ocean-Re-Claimed Lands Through the SBAS-DInSAR Technique. Remote Sens. 2016, 8, 911. [Google Scholar] [CrossRef] [Green Version]
- Mario, F.; Alessandro, F.; Giulia, T.; Mulè, M. Subsidence Zonation Through Satellite Interferometry in Coastal Plain Environments of NE Italy: A Possible Tool for Geological and Geomorphological Mapping in Urban Areas. Remote Sens. 2019, 11, 165. [Google Scholar] [CrossRef] [Green Version]
- Ren, H.; Feng, X. Calculating Vertical Deformation Using Single InSAR Pair Based on Singular Value Decomposition in Mining Areas. Int. J. Appl. Earth Obs. Geoinf. 2020, 92, 102115. [Google Scholar] [CrossRef]
- Sun, W.; Bocchini, P.; Davison, B.D. Applications of artificial intelligence for disaster management. Nat. Hazards 2020, 103, 2631–2689. [Google Scholar] [CrossRef]
- Chang, T.C.; Chao, R.J. Application of Back–Propagation Networks in Debris Flow Prediction. Eng. Geol. 2006, 85, 270–280. [Google Scholar] [CrossRef]
- Nefeslioglu, H.A.; Gokceoglu, C.; Sonmez, H. An Assessment on the Use of Logistic Regression and Artificial Neural Networks with Different Sampling Strategies for the Preparation of Landslide Susceptibility Maps. Eng. Geol. 2008, 97, 171–191. [Google Scholar] [CrossRef]
- Aditian, A.; Kubota, T.; Shinohara, Y. Comparison of GIS-based landslide susceptibility models using frequency ratio, logistic regression, and artificial neural network in a tertiary region of Ambon, Indonesia. Geomorphology 2018, 318, 101–111. [Google Scholar] [CrossRef]
- Fanos, A.M.; Pradhan, B. A novel rockfall hazard assessment using laser scanning data and 3D modelling in GIS. Catena 2019, 172, 435–450. [Google Scholar] [CrossRef]
- Nam, B.H.; Kim, Y.J.; Youn, H. Identification and quantitative analysis of sinkhole contributing factors in Florida’s Karst. Eng. Geol. 2020, 271, 105610. [Google Scholar] [CrossRef]
- Negnevitsky, M. Artificial Intelligence–A Guide to Intelligent Systems; Addison–Wesley Co.: Boston, MA, USA, 2002; p. 394. [Google Scholar]
- Hecht-Nielsen, R. Neurocomputing Reading; Addison-Wesley: Boston, MA, USA, 1990. [Google Scholar]
- Schalkoff, R.J. Artificial Neural Networks; McGraw-Hill Higher Education: New York, NY, USA, 1997; ISBN 978-0070571181. [Google Scholar]
- Basheer, I.A.; Hajmeer, M. Artificial Neural Networks: Fundamentals, Computing, Design, and Application. J. Microbiol. Methods 2000, 43, 3–31. [Google Scholar] [CrossRef]
- Moore, I.D.; Burch, G.J. Sediment transport capacity of sheet and rill flow: Application of unit stream power theory. Water Resour. Res. 1986, 22, 1350–1360. [Google Scholar] [CrossRef]
- Gutiérrez, F.; Cooper, A.H.; Johnson, K.S. Identification, prediction, and mitigation of sinkhole hazards in evaporite karst areas. Environ. Geol. 2008, 53, 1007–1022. [Google Scholar] [CrossRef] [Green Version]
- Guerrero, J.; Gutiérrez, F.; Lucha, P. Paleosubsidence and active subsidence due to evaporite dissolution in the Zaragoza area (Huerva River valley, NE Spain): Processes, spatial distribution and protection measures for transport routes. Eng. Geol. 2004, 72, 309–329. [Google Scholar] [CrossRef]
- Mohammadi, A.; Karimzadeh, S.; Jalal, S.J.; Kamran, K.V.; Shahabi, H.; Homayouni, S.; Al-Ansari, N. A Multi-Sensor Comparative Analysis on the Suitability of Generated DEM from Sentinel-1 SAR Interferometry Using Statistical and Hydrological Models. Sensors 2020, 20, 7214. [Google Scholar] [CrossRef]
- Nikolakopoulos, K.; Kyriou, A. Preliminary results of using Sentinel-1 SAR data for DSM generation. Eur. J. Geogr. 2015, 6, 52–68. [Google Scholar]
- El Hajj, M.; Baghdadi, N.; Bazzi, H.; Zribi, M. Penetration analysis of SAR signals in the C and L bands for wheat, maize, and grasslands. Remote Sens. 2019, 11, 31. [Google Scholar] [CrossRef] [Green Version]


| Property | Min. | Max. | Mean | Standard Deviation |
|---|---|---|---|---|
| Area (m2) | 168.6 | 7266.0 | 3276.5 | 1543.0 |
| Perimeter (m) | 84.5 | 305.5 | 199.7 | 45.4 |
| Long axis (m) | 35.3 | 97.9 | 65.5 | 15.0 |
| Short axis (m) | 5.6 | 95.1 | 60.4 | 16.1 |
| Dataset ID | Satellite | Acquisition Date | Data Type/Mode | Pass Direction | Use Purpose in the Study |
|---|---|---|---|---|---|
| DS1 | Sentinel 1-A | 01/11/18 | SLC-IW | Descending | DEM Generation |
| DS2 | Sentinel 1-B | 07/11/18 | SLC-IW | Descending | |
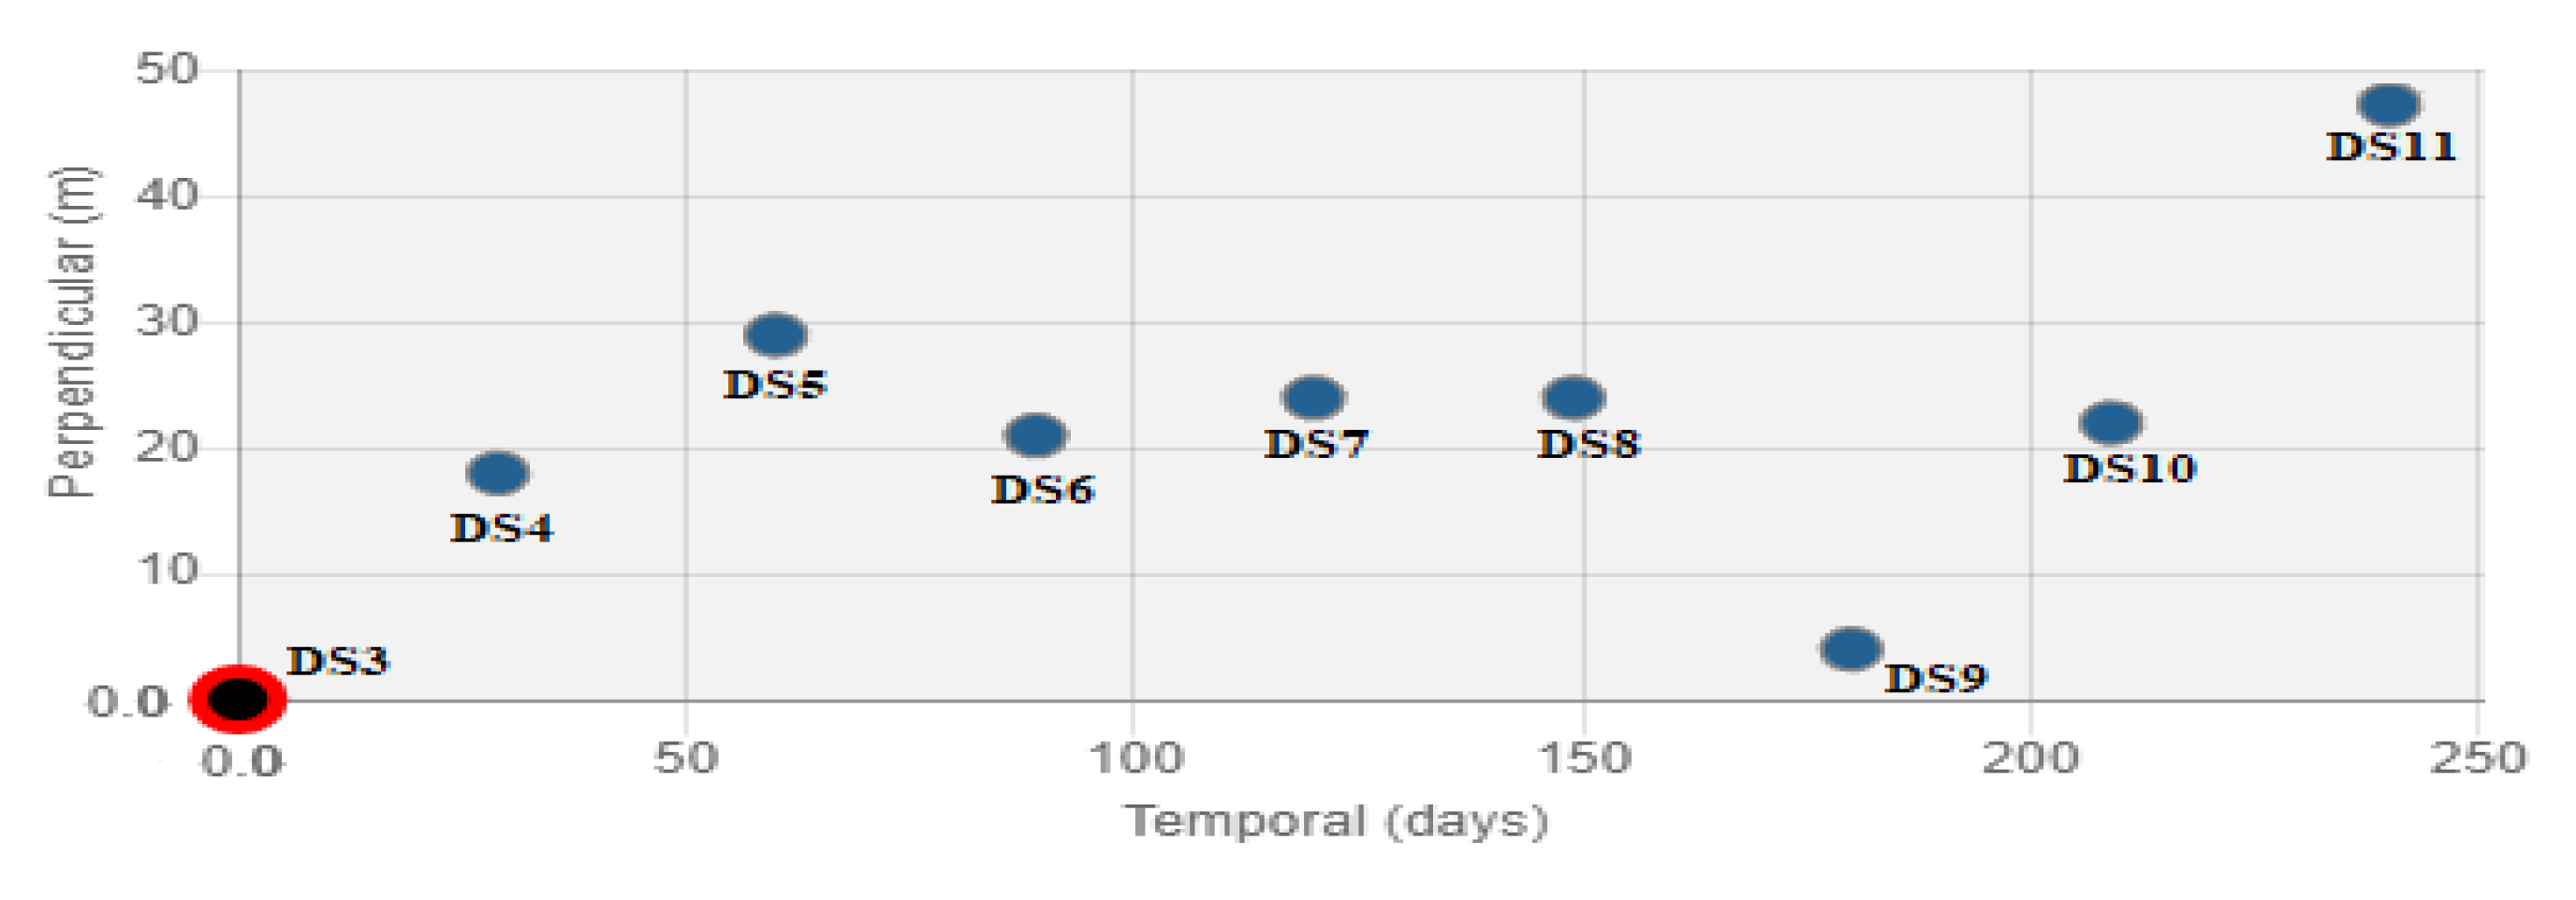
| DS3 | Sentinel 1-A | 23/07/19 | SLC-IW | Descending | Displacement Map Generation |
| DS4 | Sentinel 1-B | 22/08/19 | SLC-IW | Descending | |
| DS5 | Sentinel 1-A | 21/09/19 | SLC-IW | Descending | |
| DS6 | Sentinel 1-B | 21/10/19 | SLC-IW | Descending | |
| DS7 | Sentinel 1-A | 20/11/19 | SLC-IW | Descending | |
| DS8 | Sentinel 1-B | 20/12/19 | SLC-IW | Descending | |
| DS9 | Sentinel 1-A | 19/01/20 | SLC-IW | Descending | |
| DS10 | Sentinel 1-B | 18/02/20 | SLC-IW | Descending | |
| DS11 | Sentinel 1-A | 19/03/20 | SLC-IW | Descending |
Publisher’s Note: MDPI stays neutral with regard to jurisdictional claims in published maps and institutional affiliations. |
© 2021 by the authors. Licensee MDPI, Basel, Switzerland. This article is an open access article distributed under the terms and conditions of the Creative Commons Attribution (CC BY) license (http://creativecommons.org/licenses/by/4.0/).
Share and Cite
Nefeslioglu, H.A.; Tavus, B.; Er, M.; Ertugrul, G.; Ozdemir, A.; Kaya, A.; Kocaman, S. Integration of an InSAR and ANN for Sinkhole Susceptibility Mapping: A Case Study from Kirikkale-Delice (Turkey). ISPRS Int. J. Geo-Inf. 2021, 10, 119. https://0-doi-org.brum.beds.ac.uk/10.3390/ijgi10030119
Nefeslioglu HA, Tavus B, Er M, Ertugrul G, Ozdemir A, Kaya A, Kocaman S. Integration of an InSAR and ANN for Sinkhole Susceptibility Mapping: A Case Study from Kirikkale-Delice (Turkey). ISPRS International Journal of Geo-Information. 2021; 10(3):119. https://0-doi-org.brum.beds.ac.uk/10.3390/ijgi10030119
Chicago/Turabian StyleNefeslioglu, Hakan A., Beste Tavus, Melahat Er, Gamze Ertugrul, Aybuke Ozdemir, Alperen Kaya, and Sultan Kocaman. 2021. "Integration of an InSAR and ANN for Sinkhole Susceptibility Mapping: A Case Study from Kirikkale-Delice (Turkey)" ISPRS International Journal of Geo-Information 10, no. 3: 119. https://0-doi-org.brum.beds.ac.uk/10.3390/ijgi10030119