
A Technical and Operational Perspective on Quality Analysis of Stitching Images with Multi-Row Panorama and Multimedia Sources for Visualizing the Tourism Site of Onshore Wind Farm


Abstract
:1. Introduction
1.1. Challenge and Motivation
1.2. Green Energies and the Tourism Site
1.3. Information-Technology-Based Visualizations
1.4. Research Scopes
2. Materials and Methods
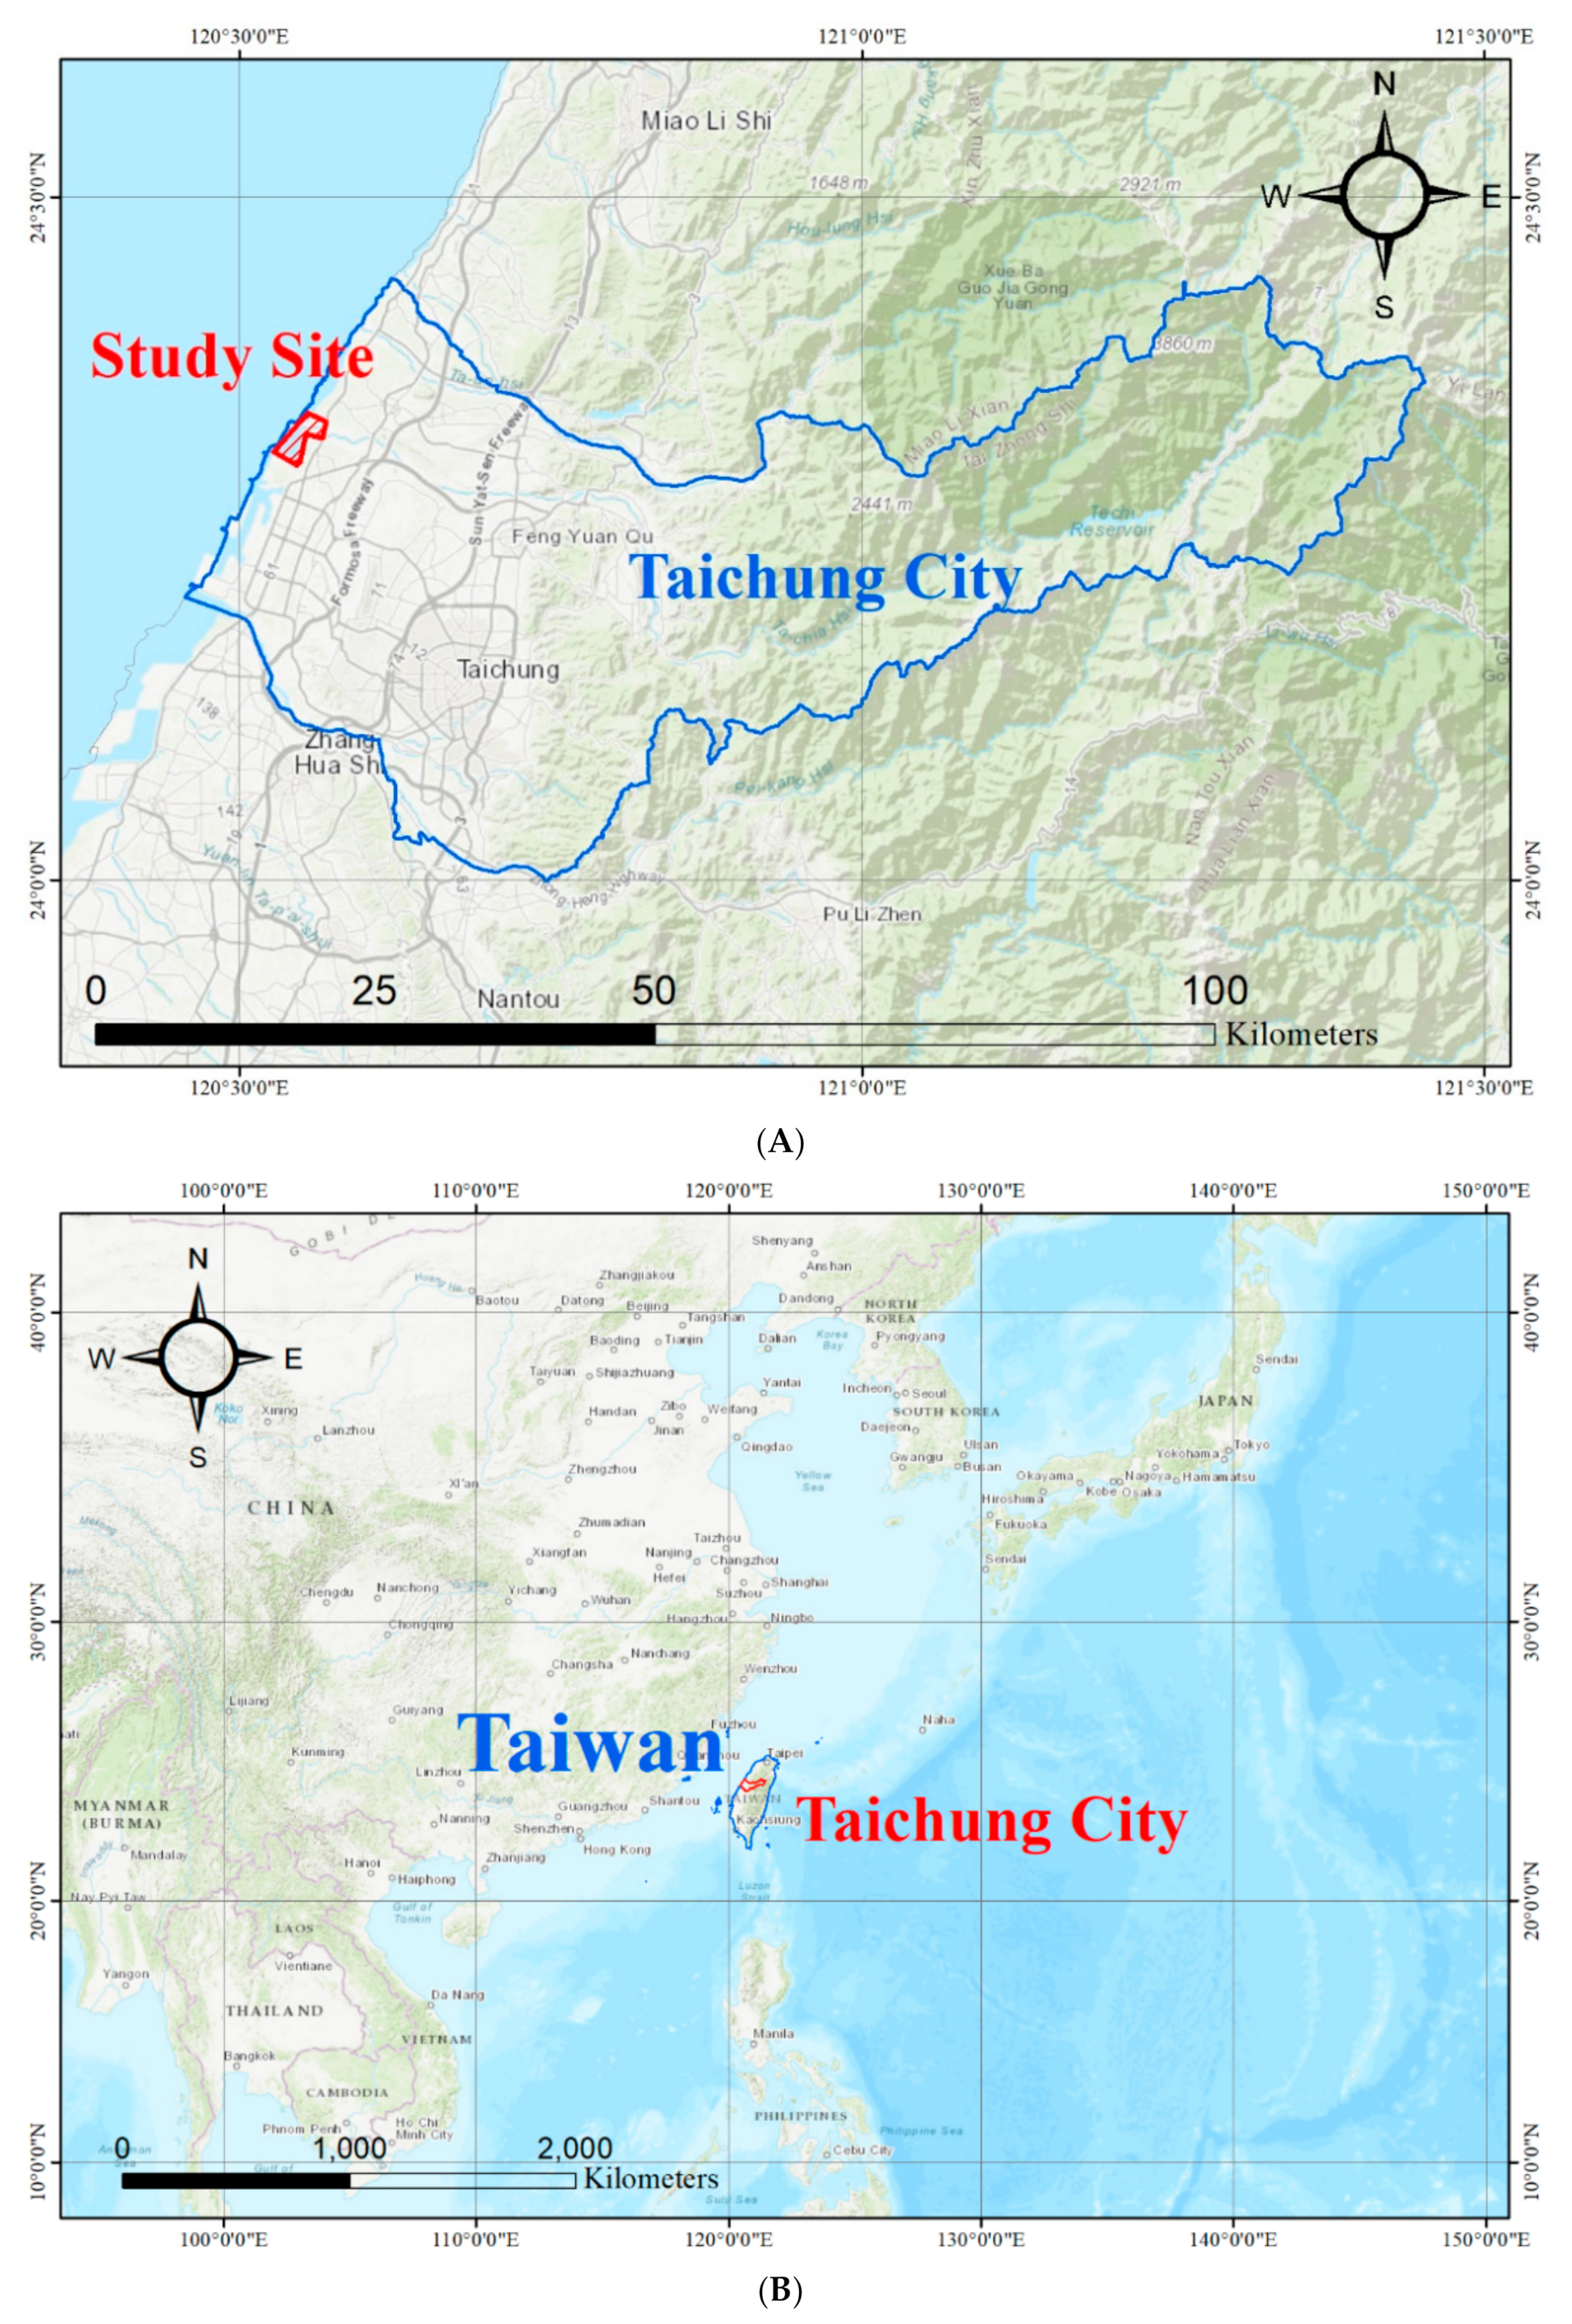
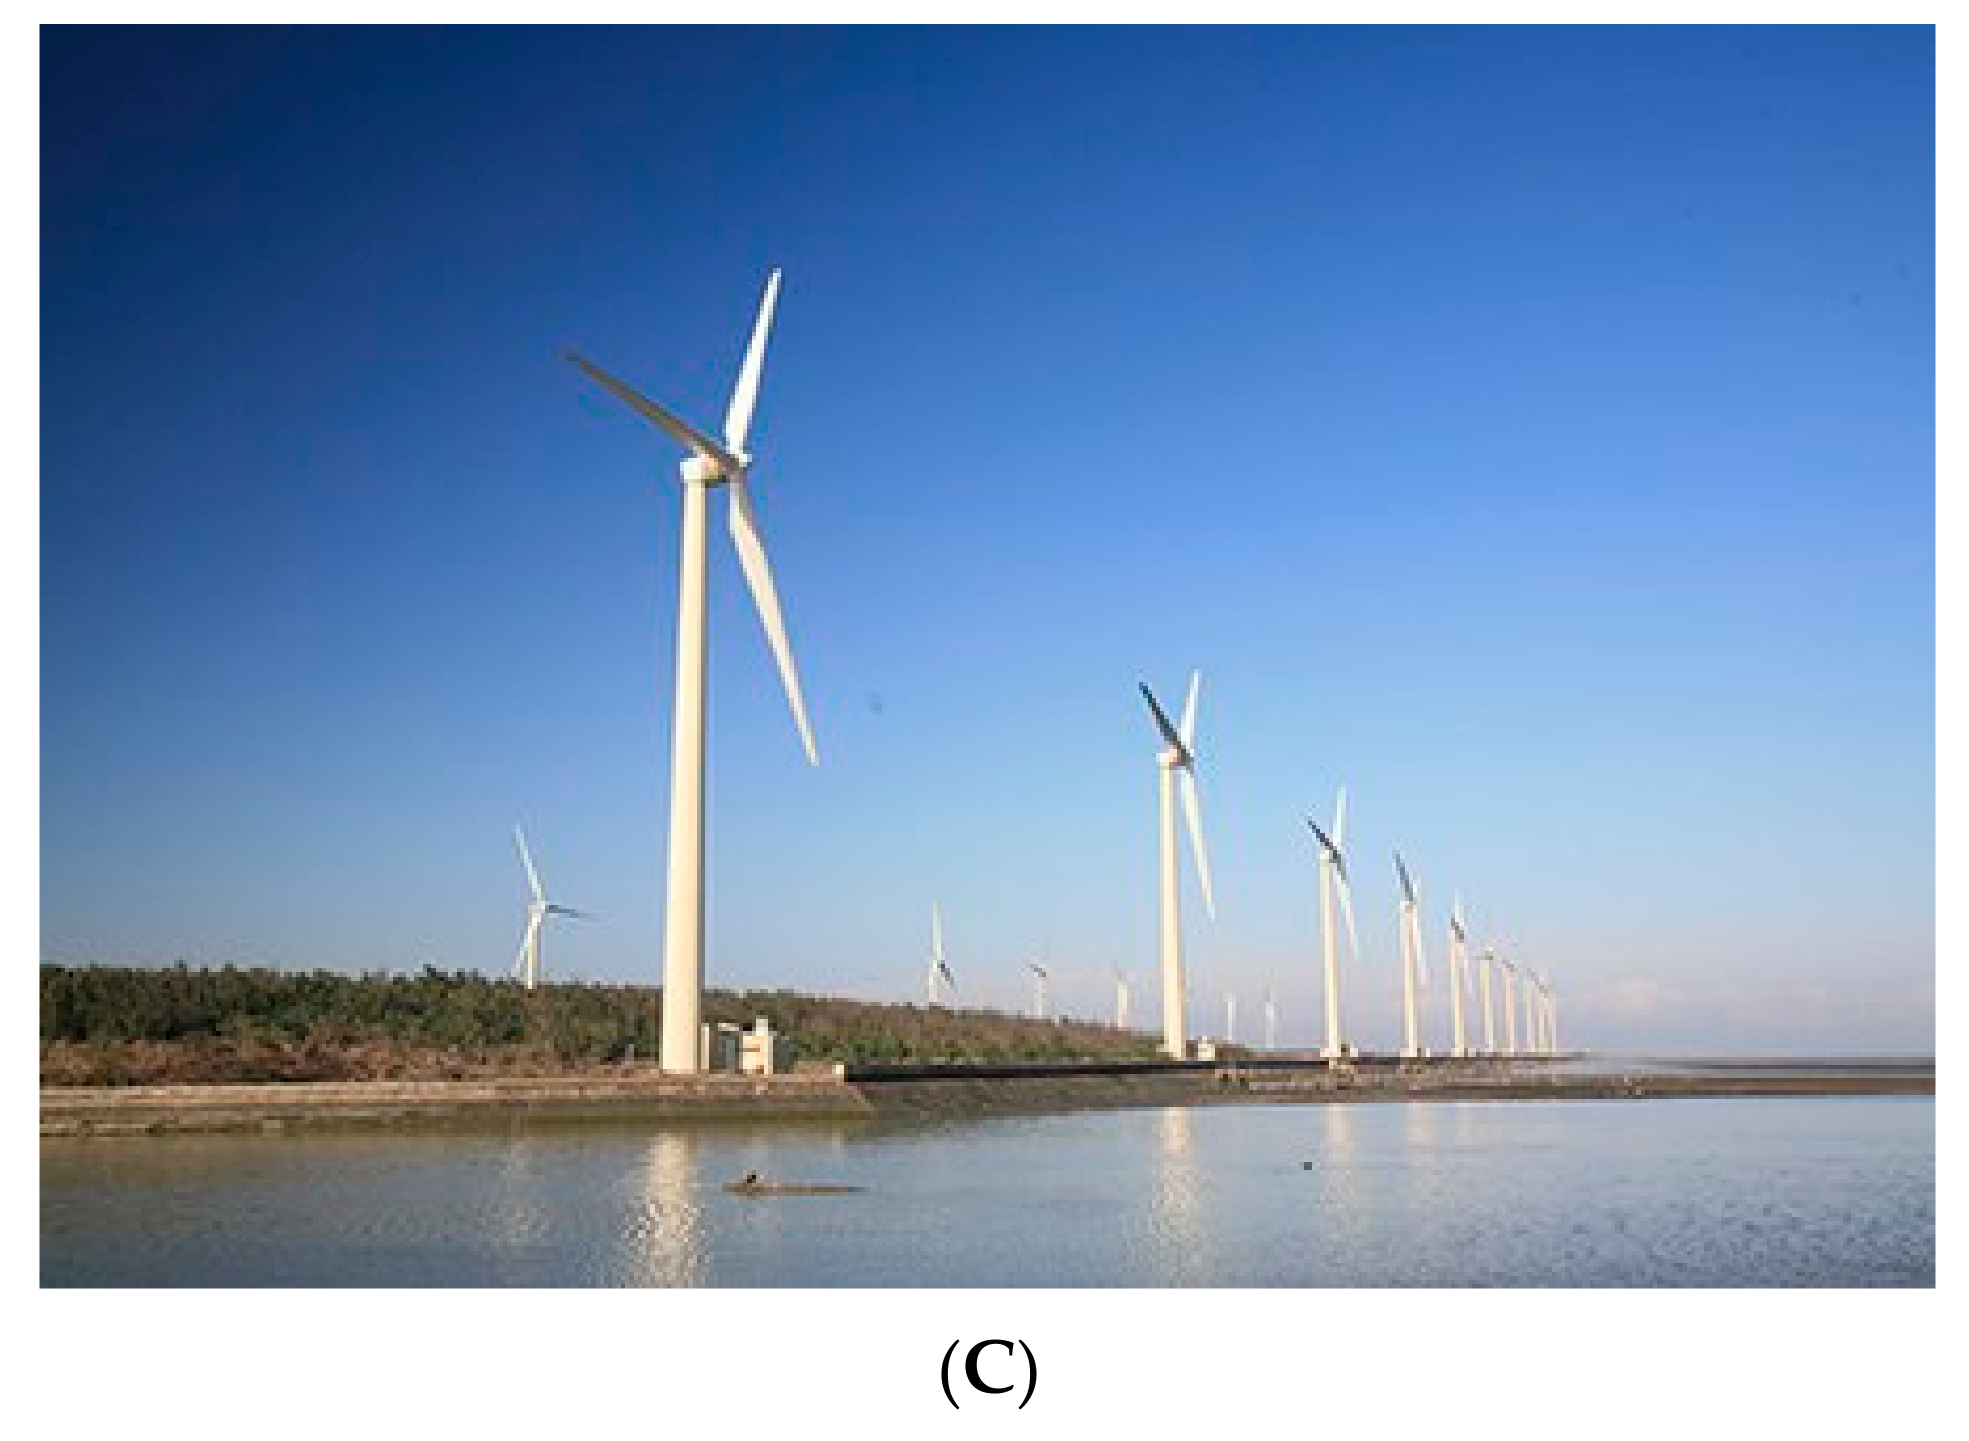
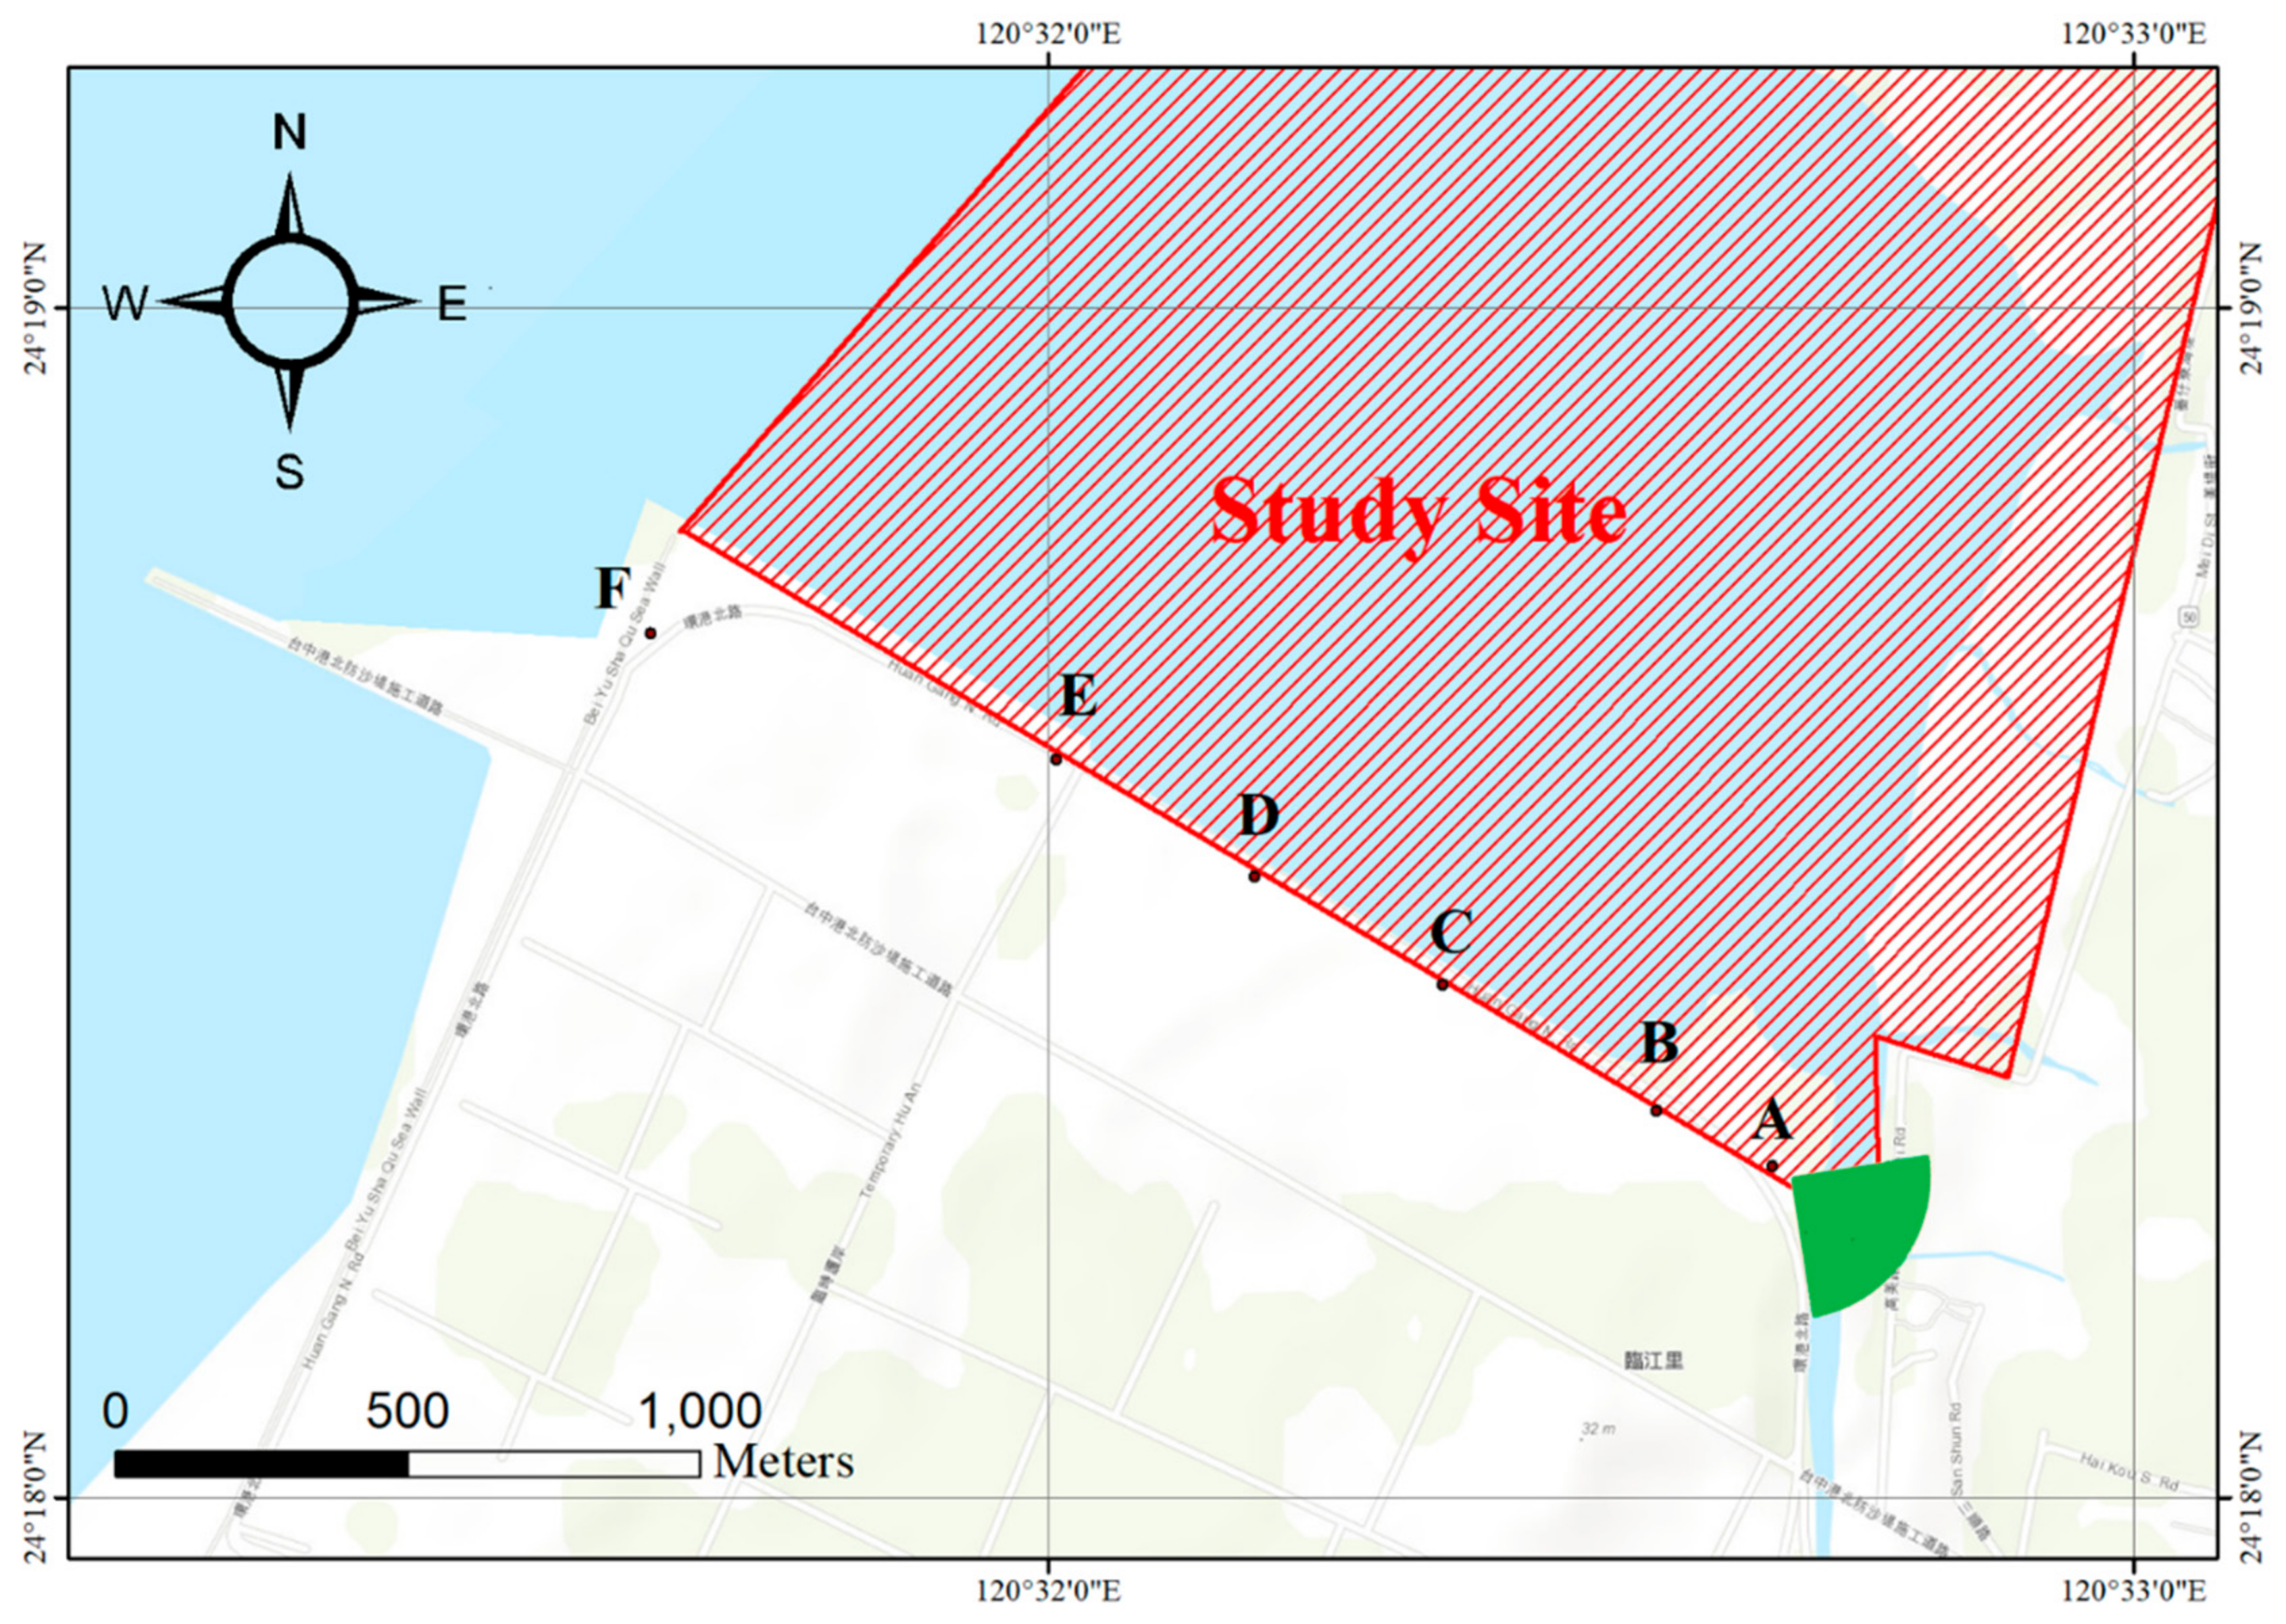
2.1. Study Area
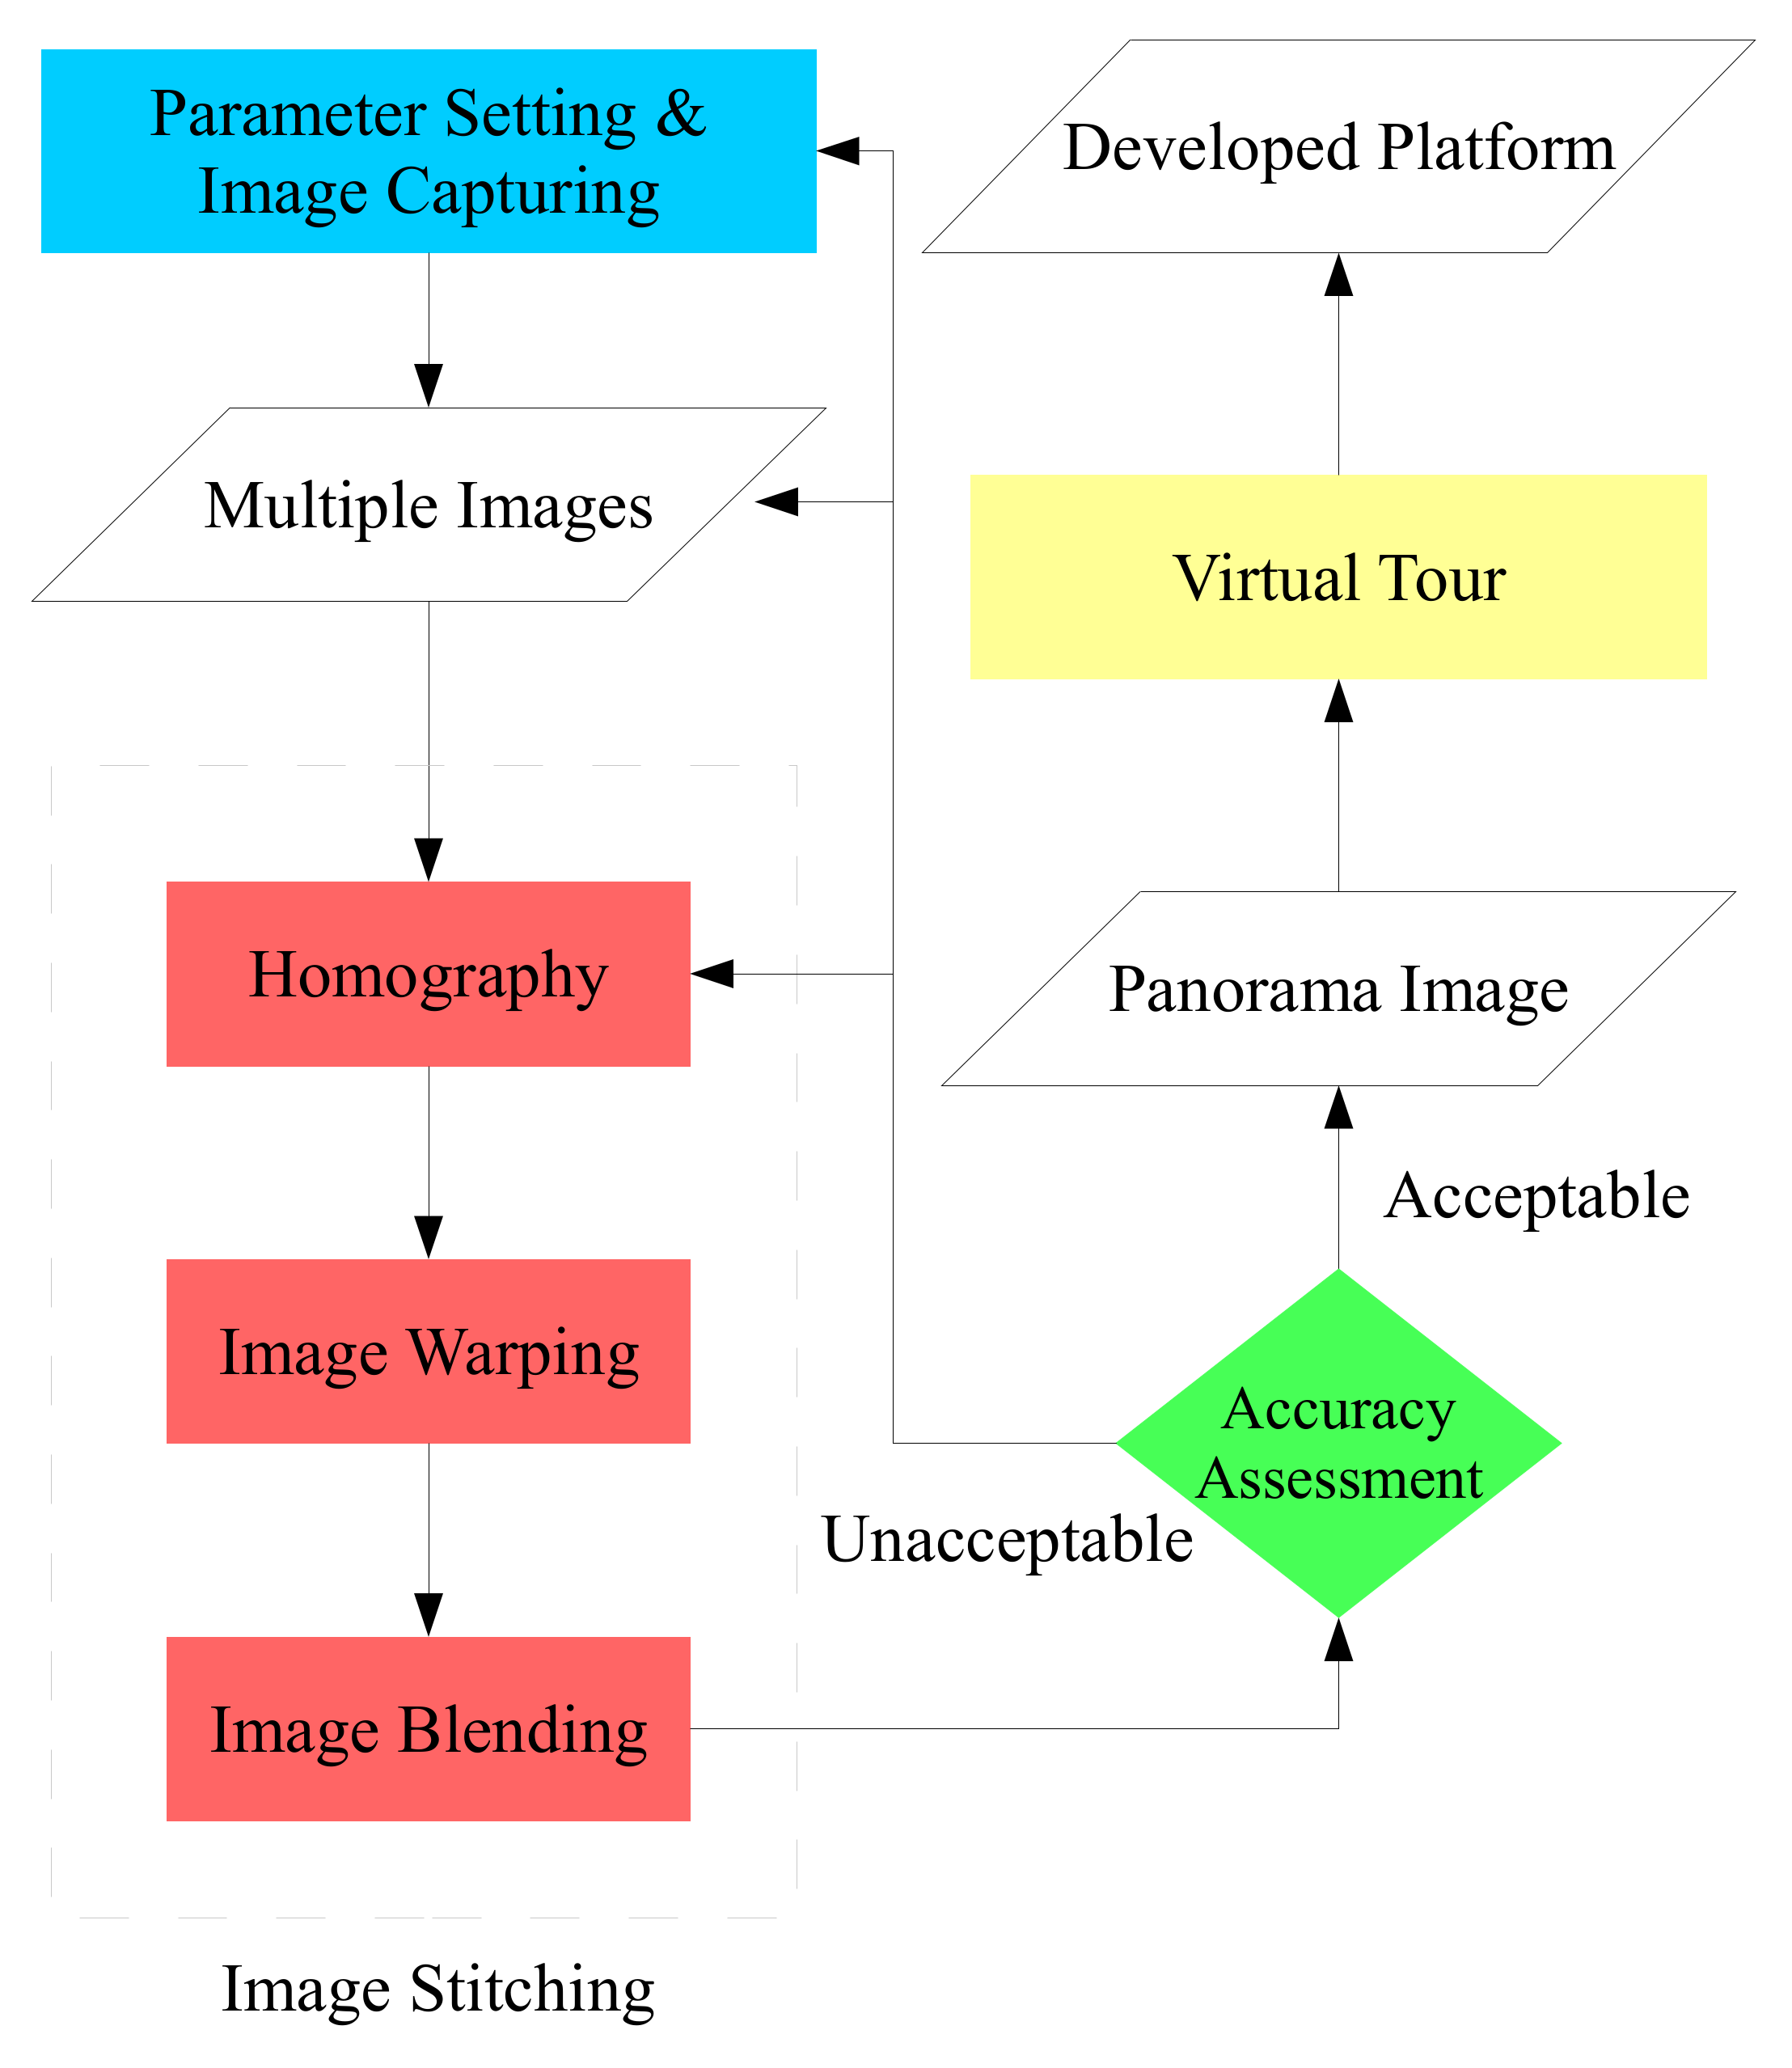
2.2. Procedure
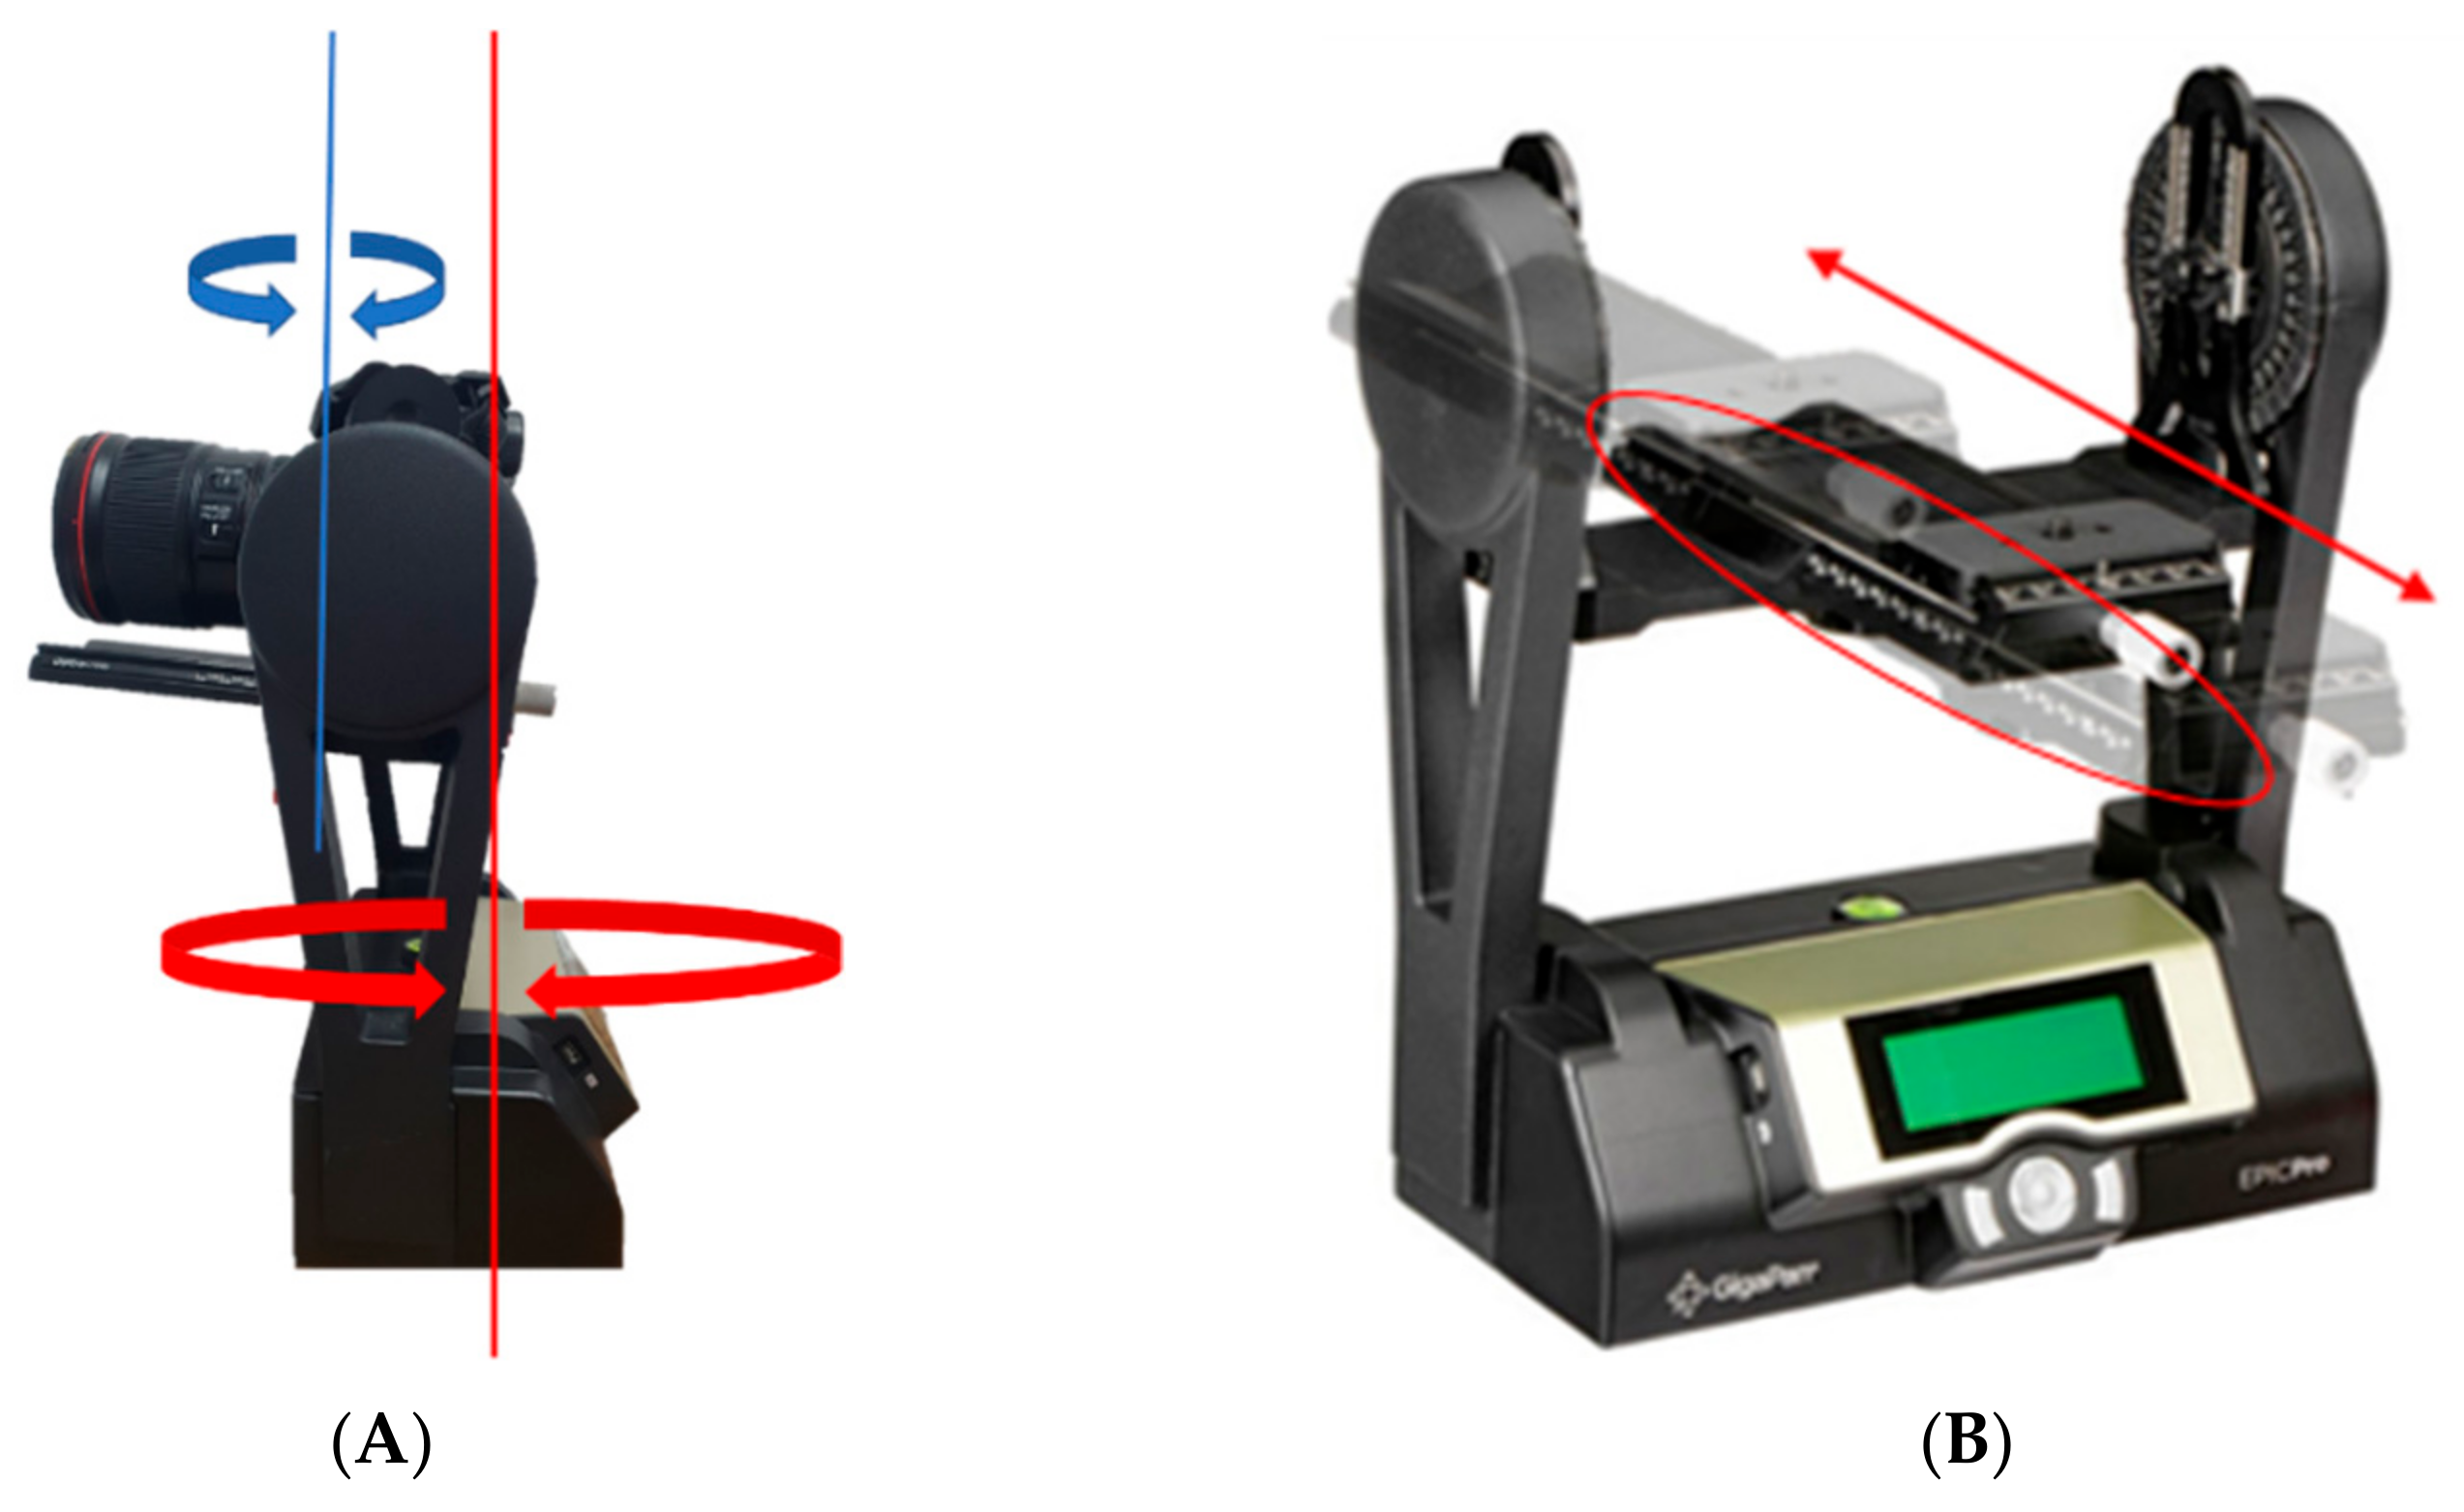
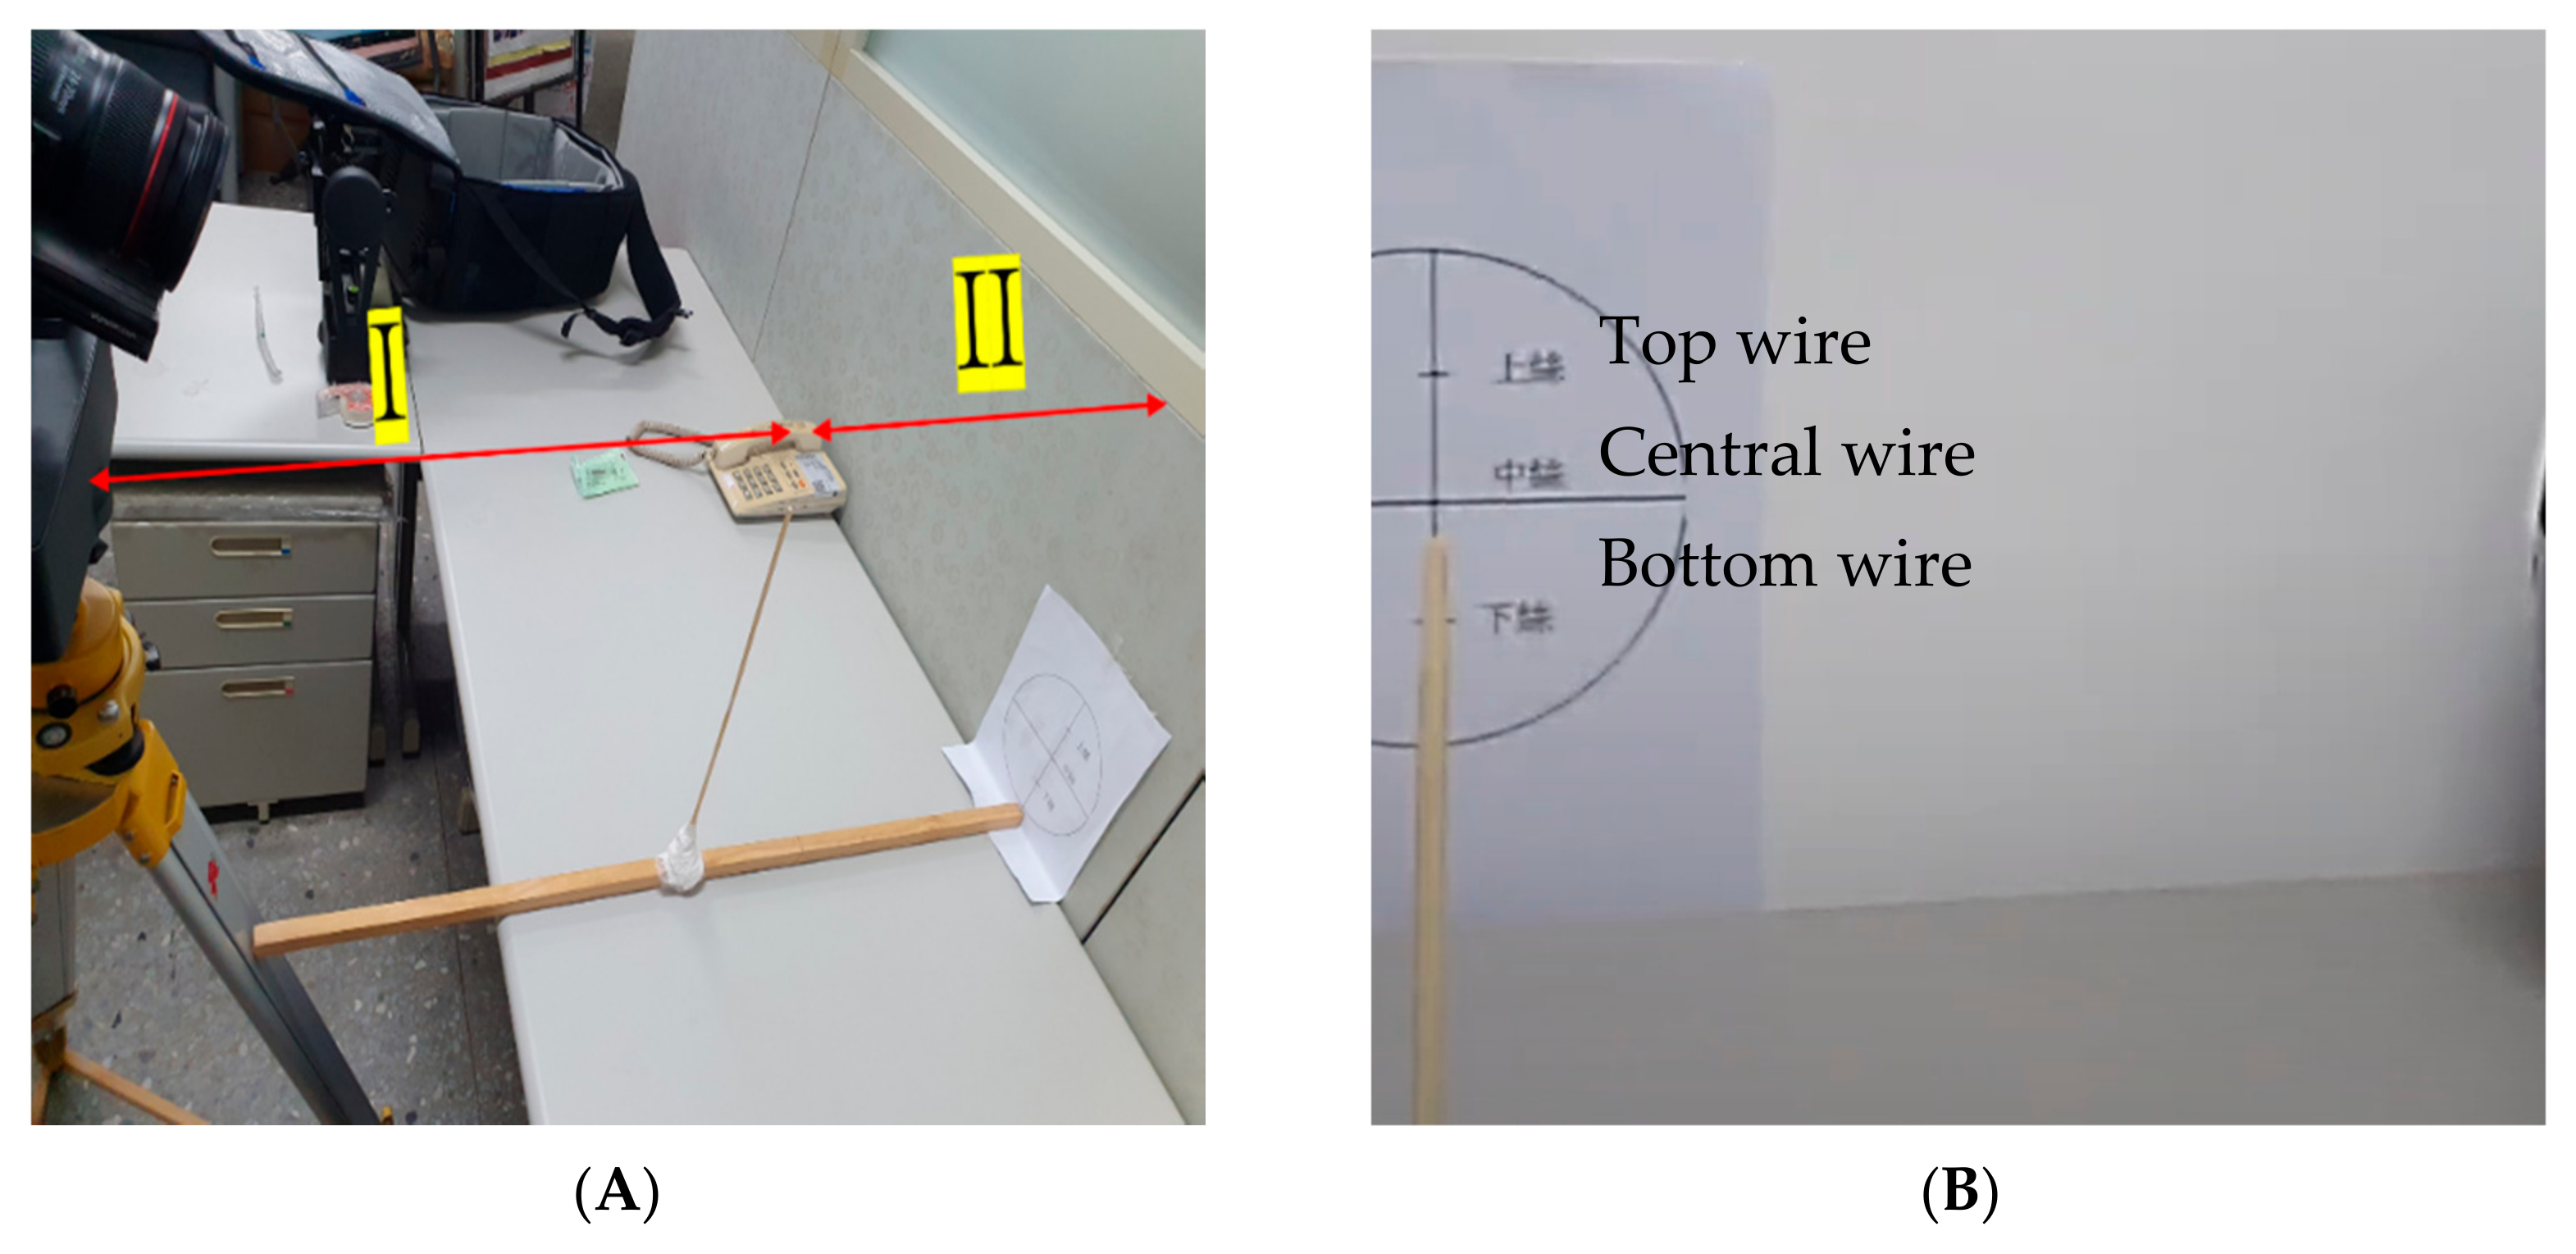
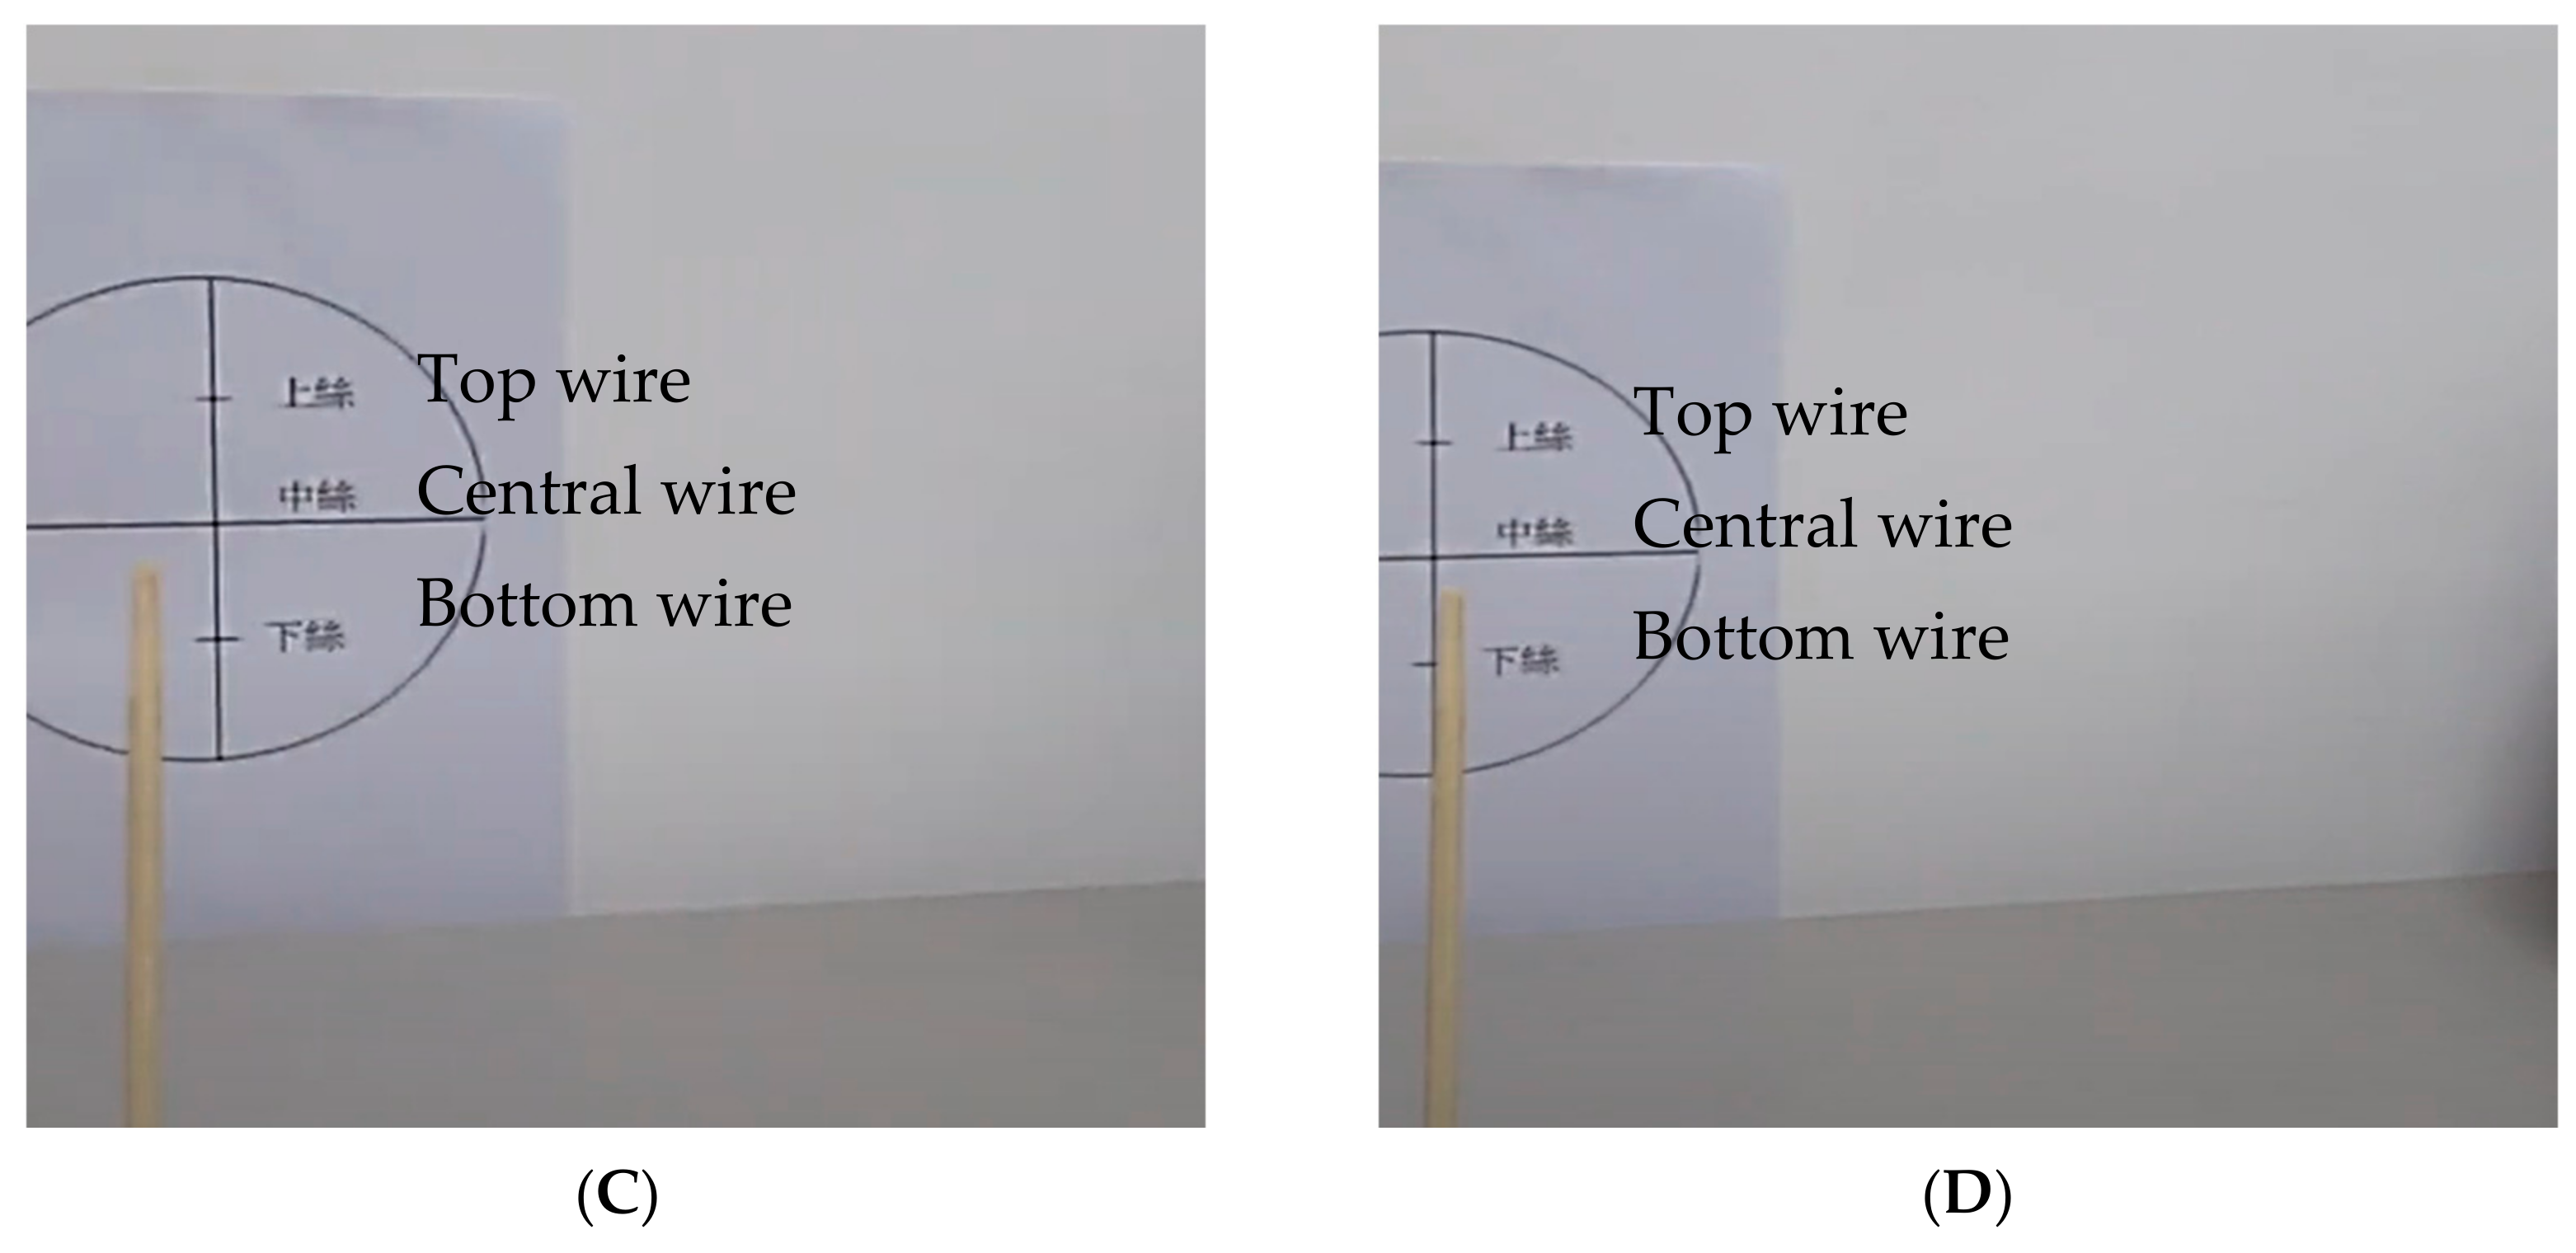
2.2.1. Parameter Setting and Image Capturing
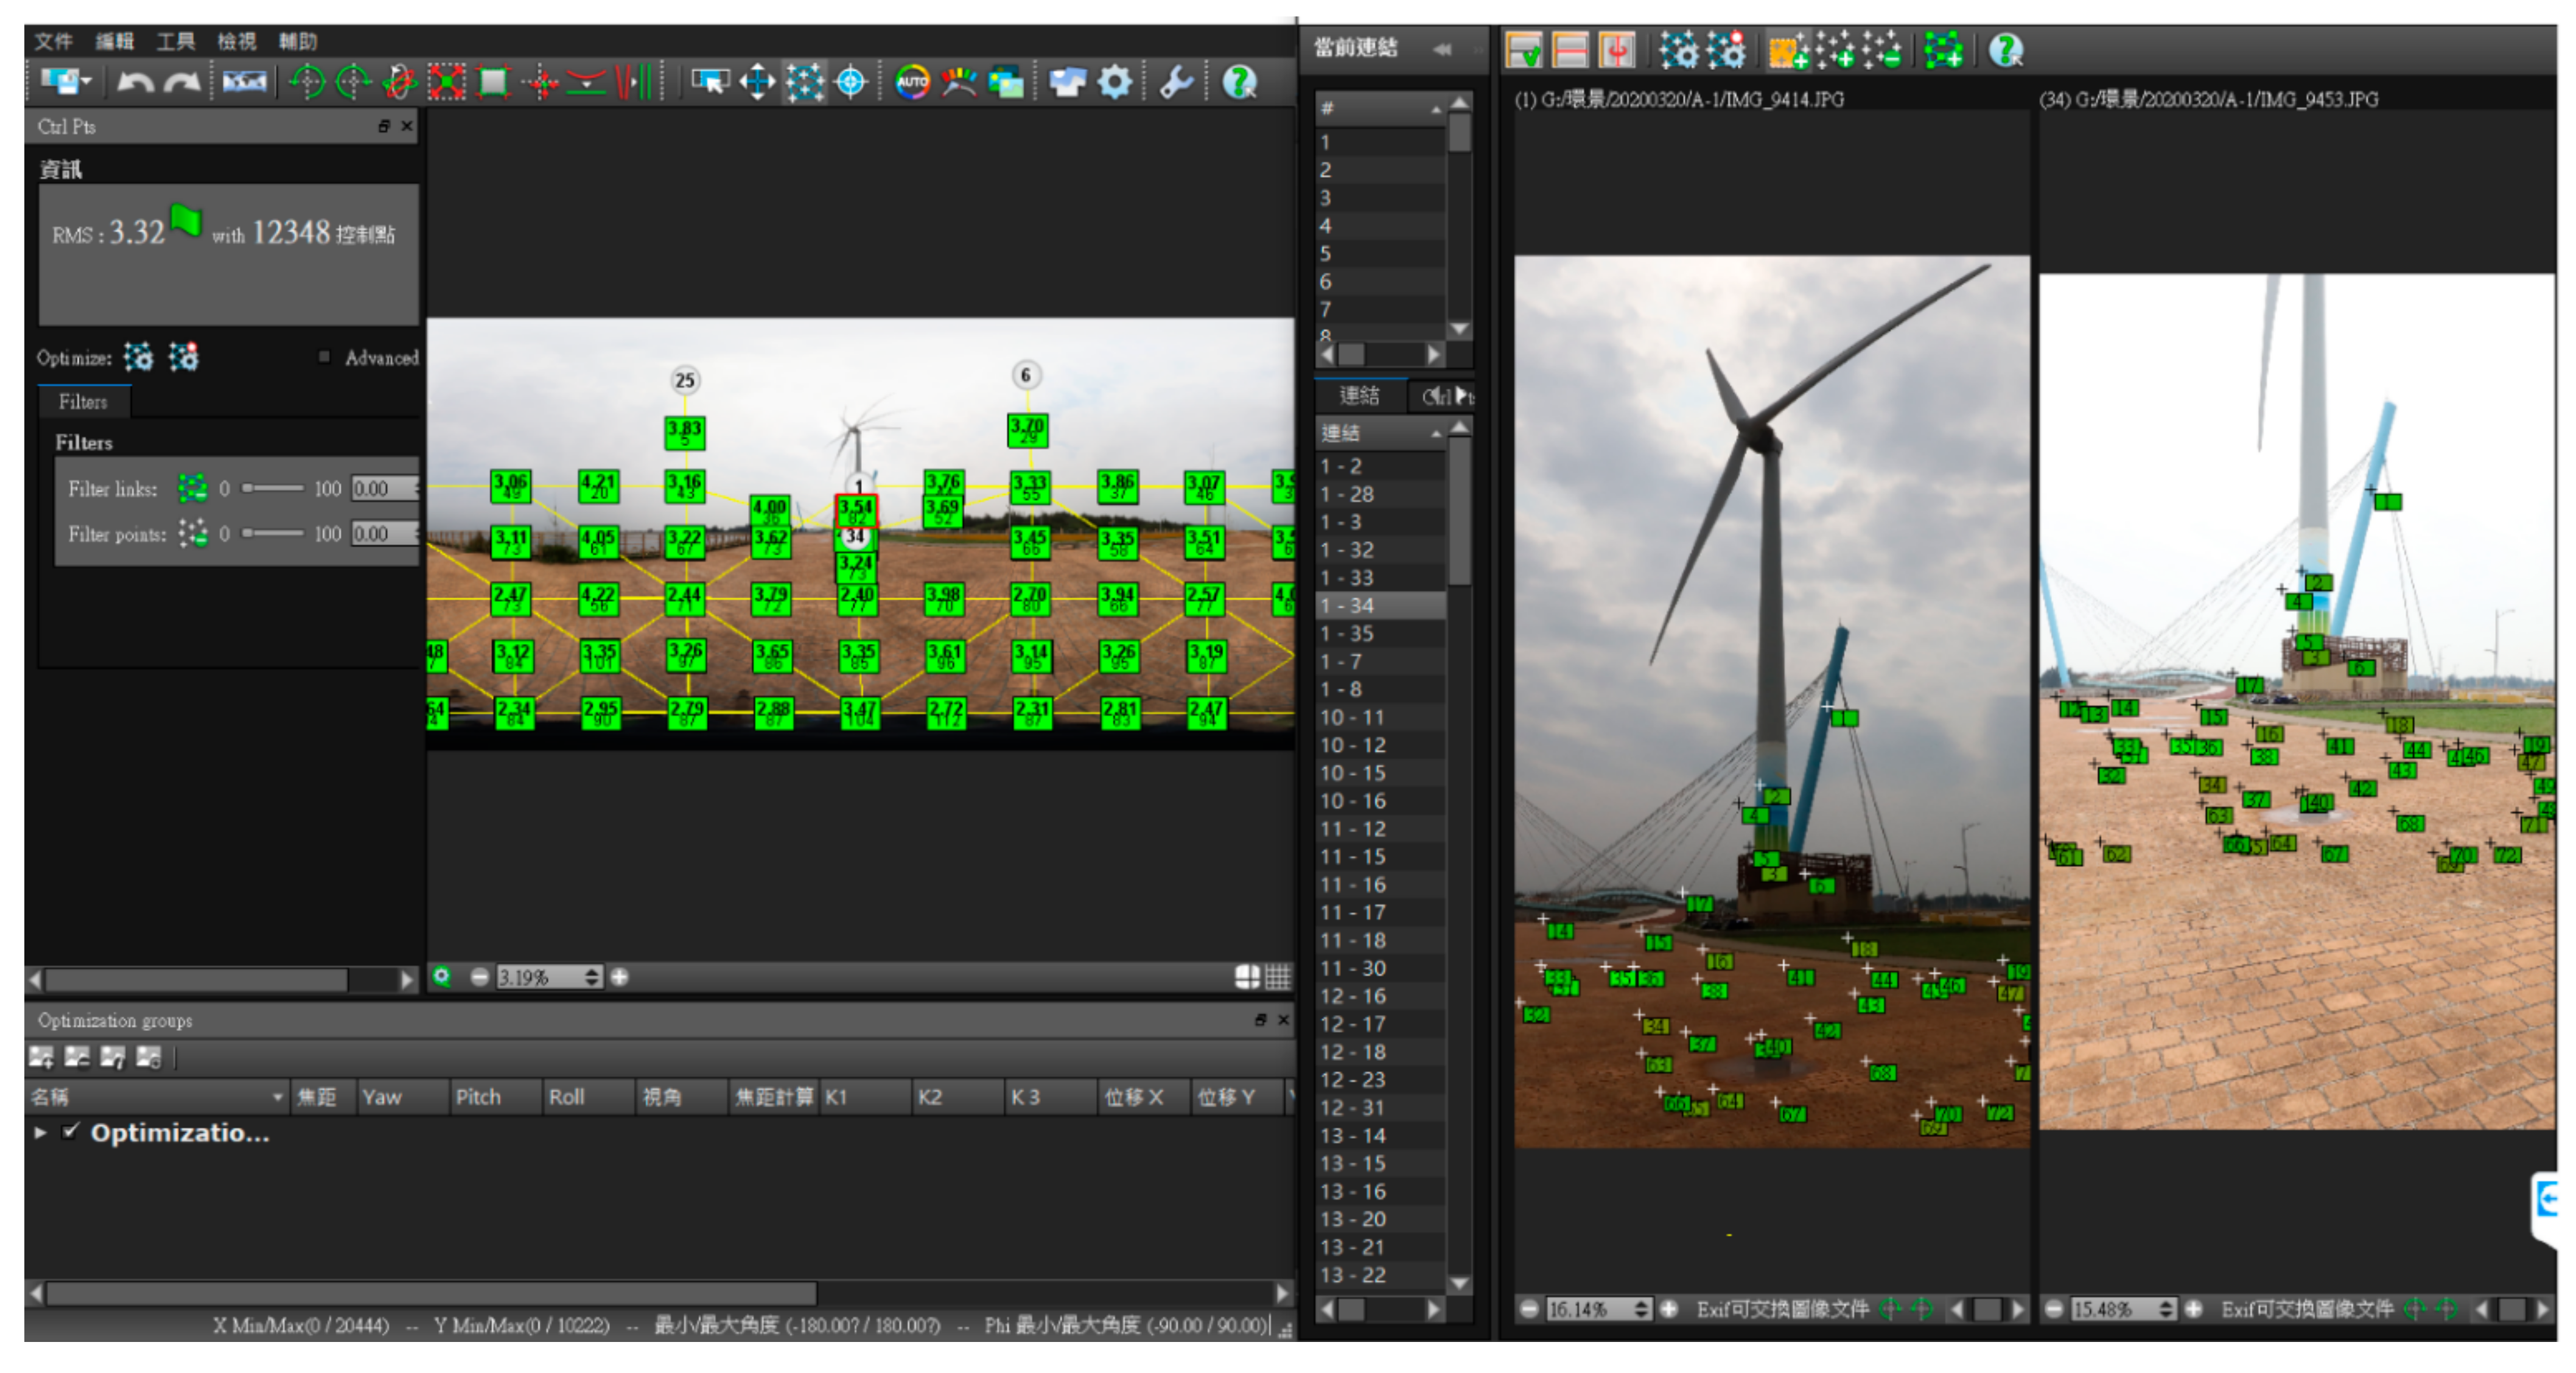
2.2.2. Image Stitching
- Homography
- Image Warping
- Blending
2.2.3. Accuracy Assessment
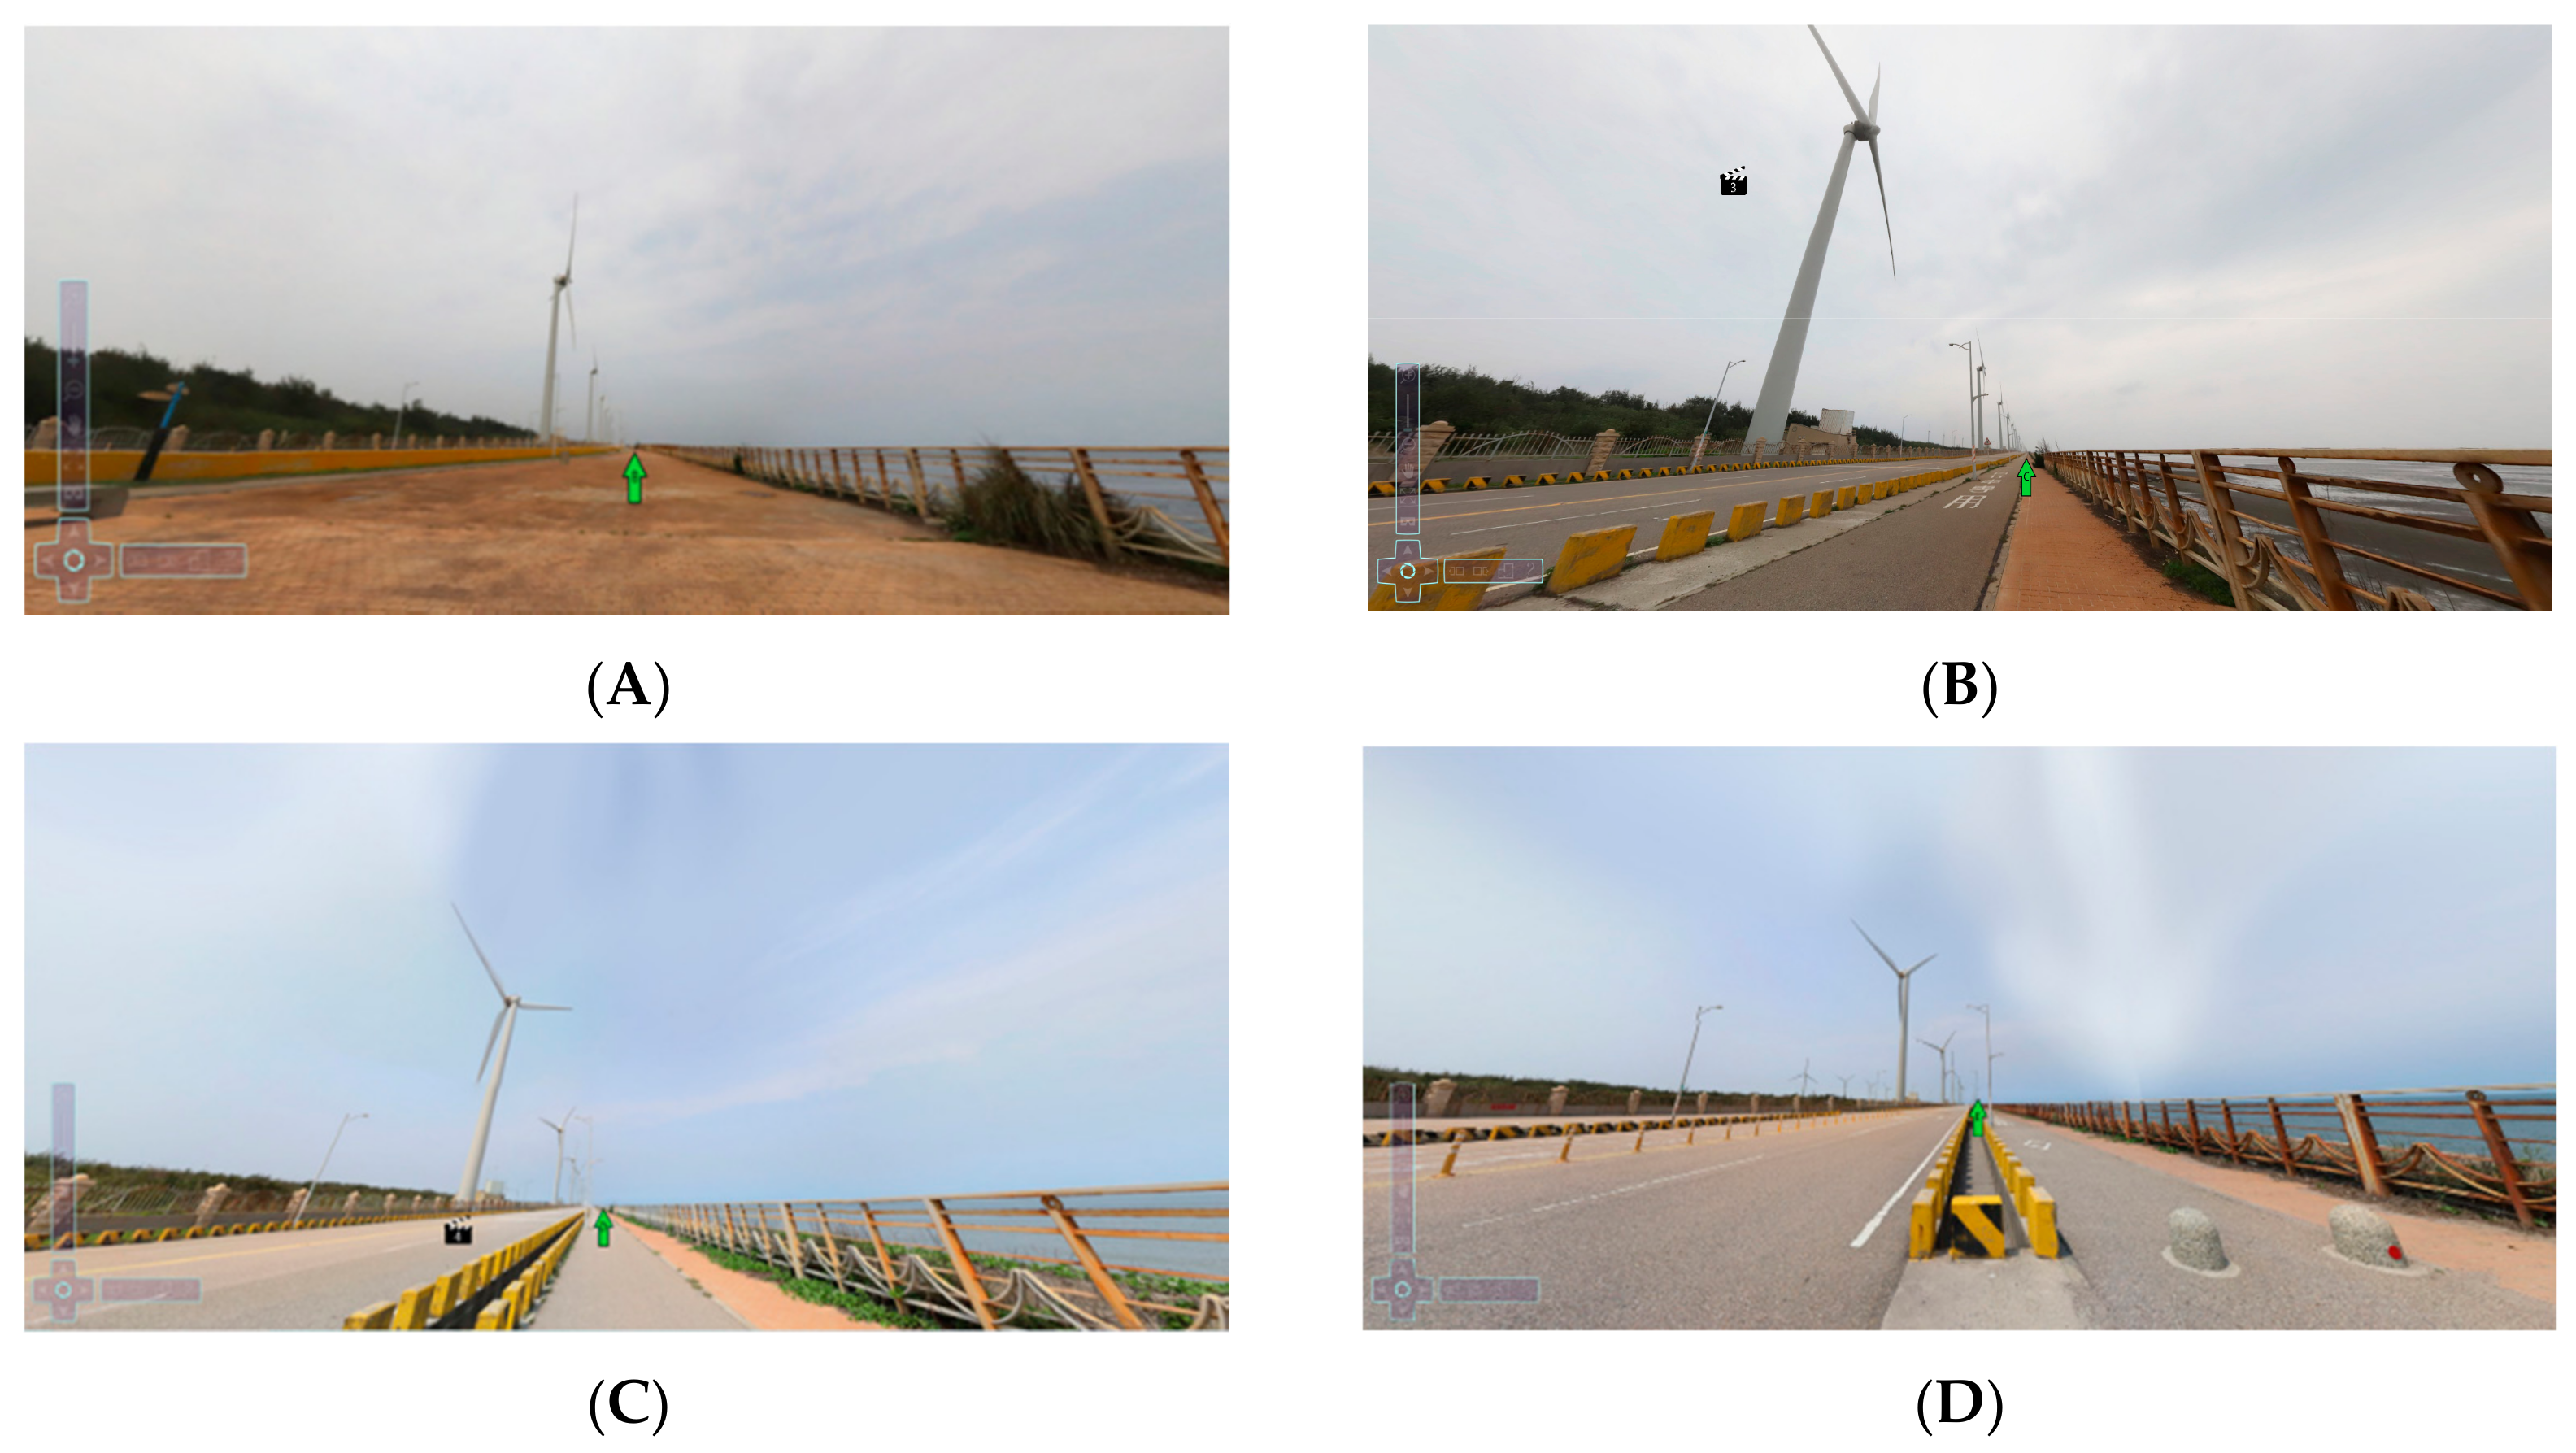
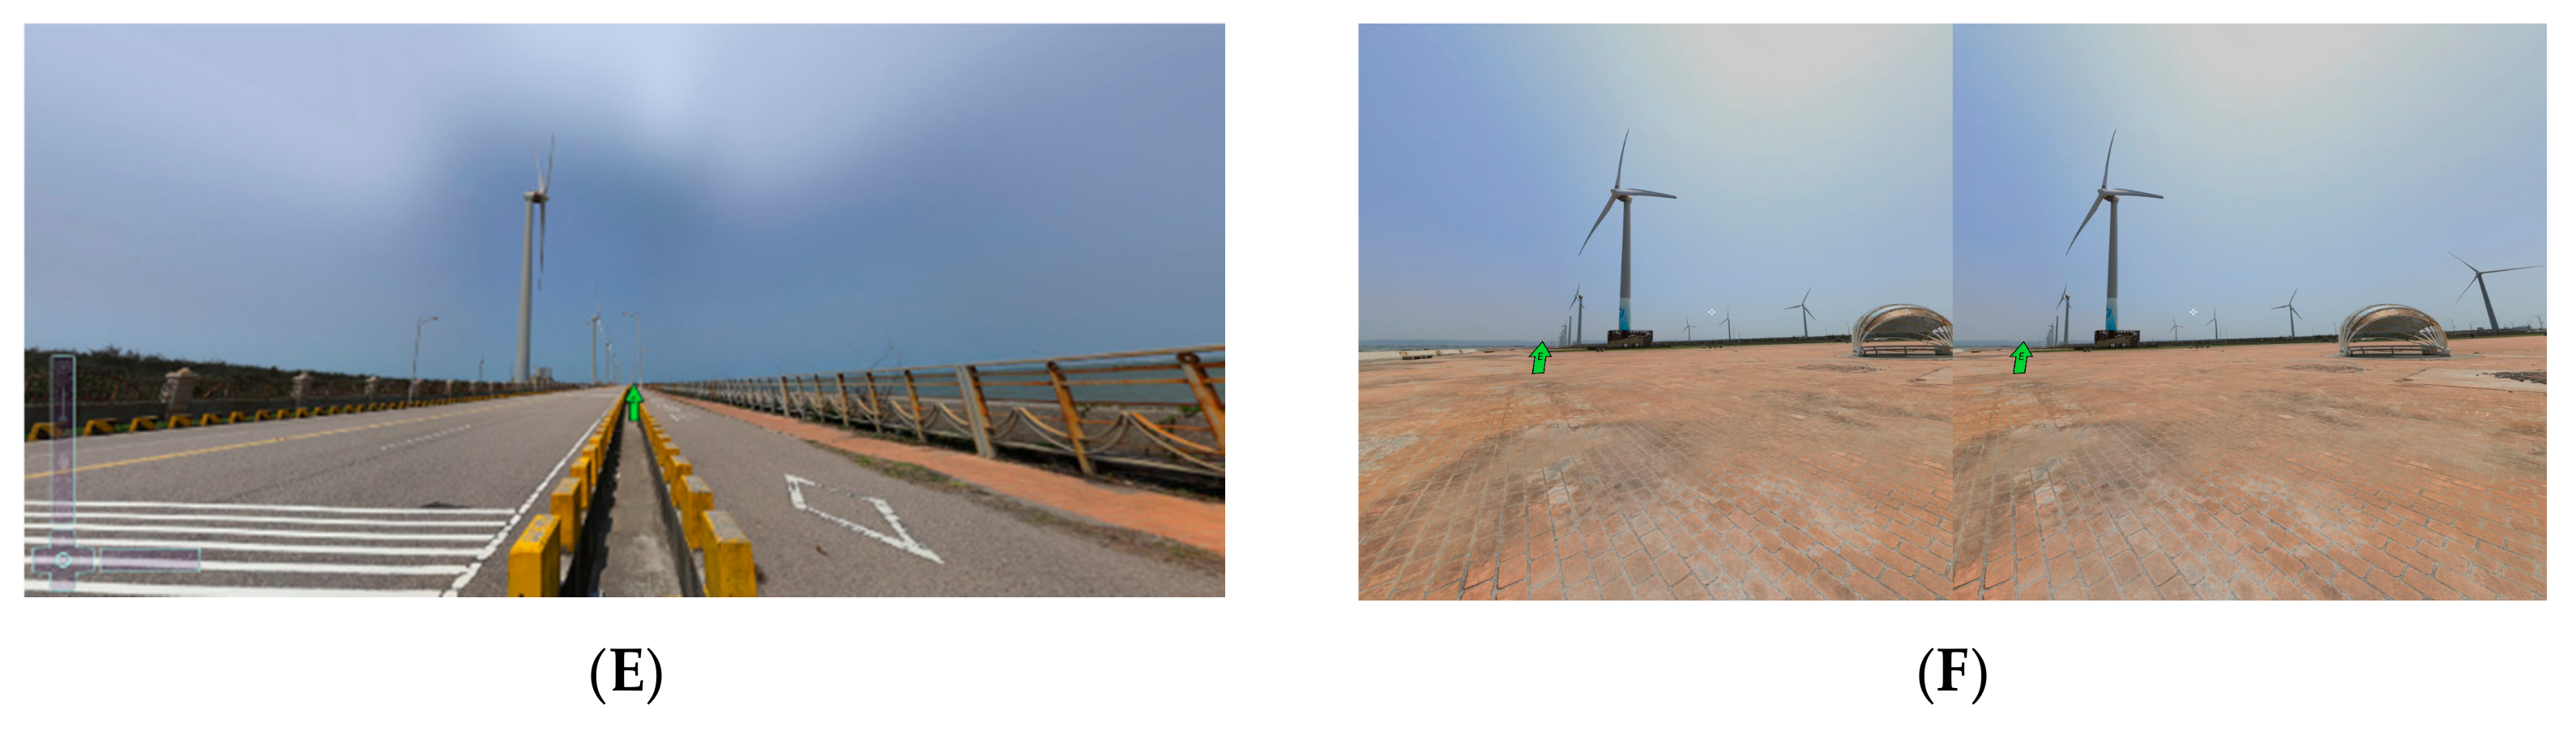
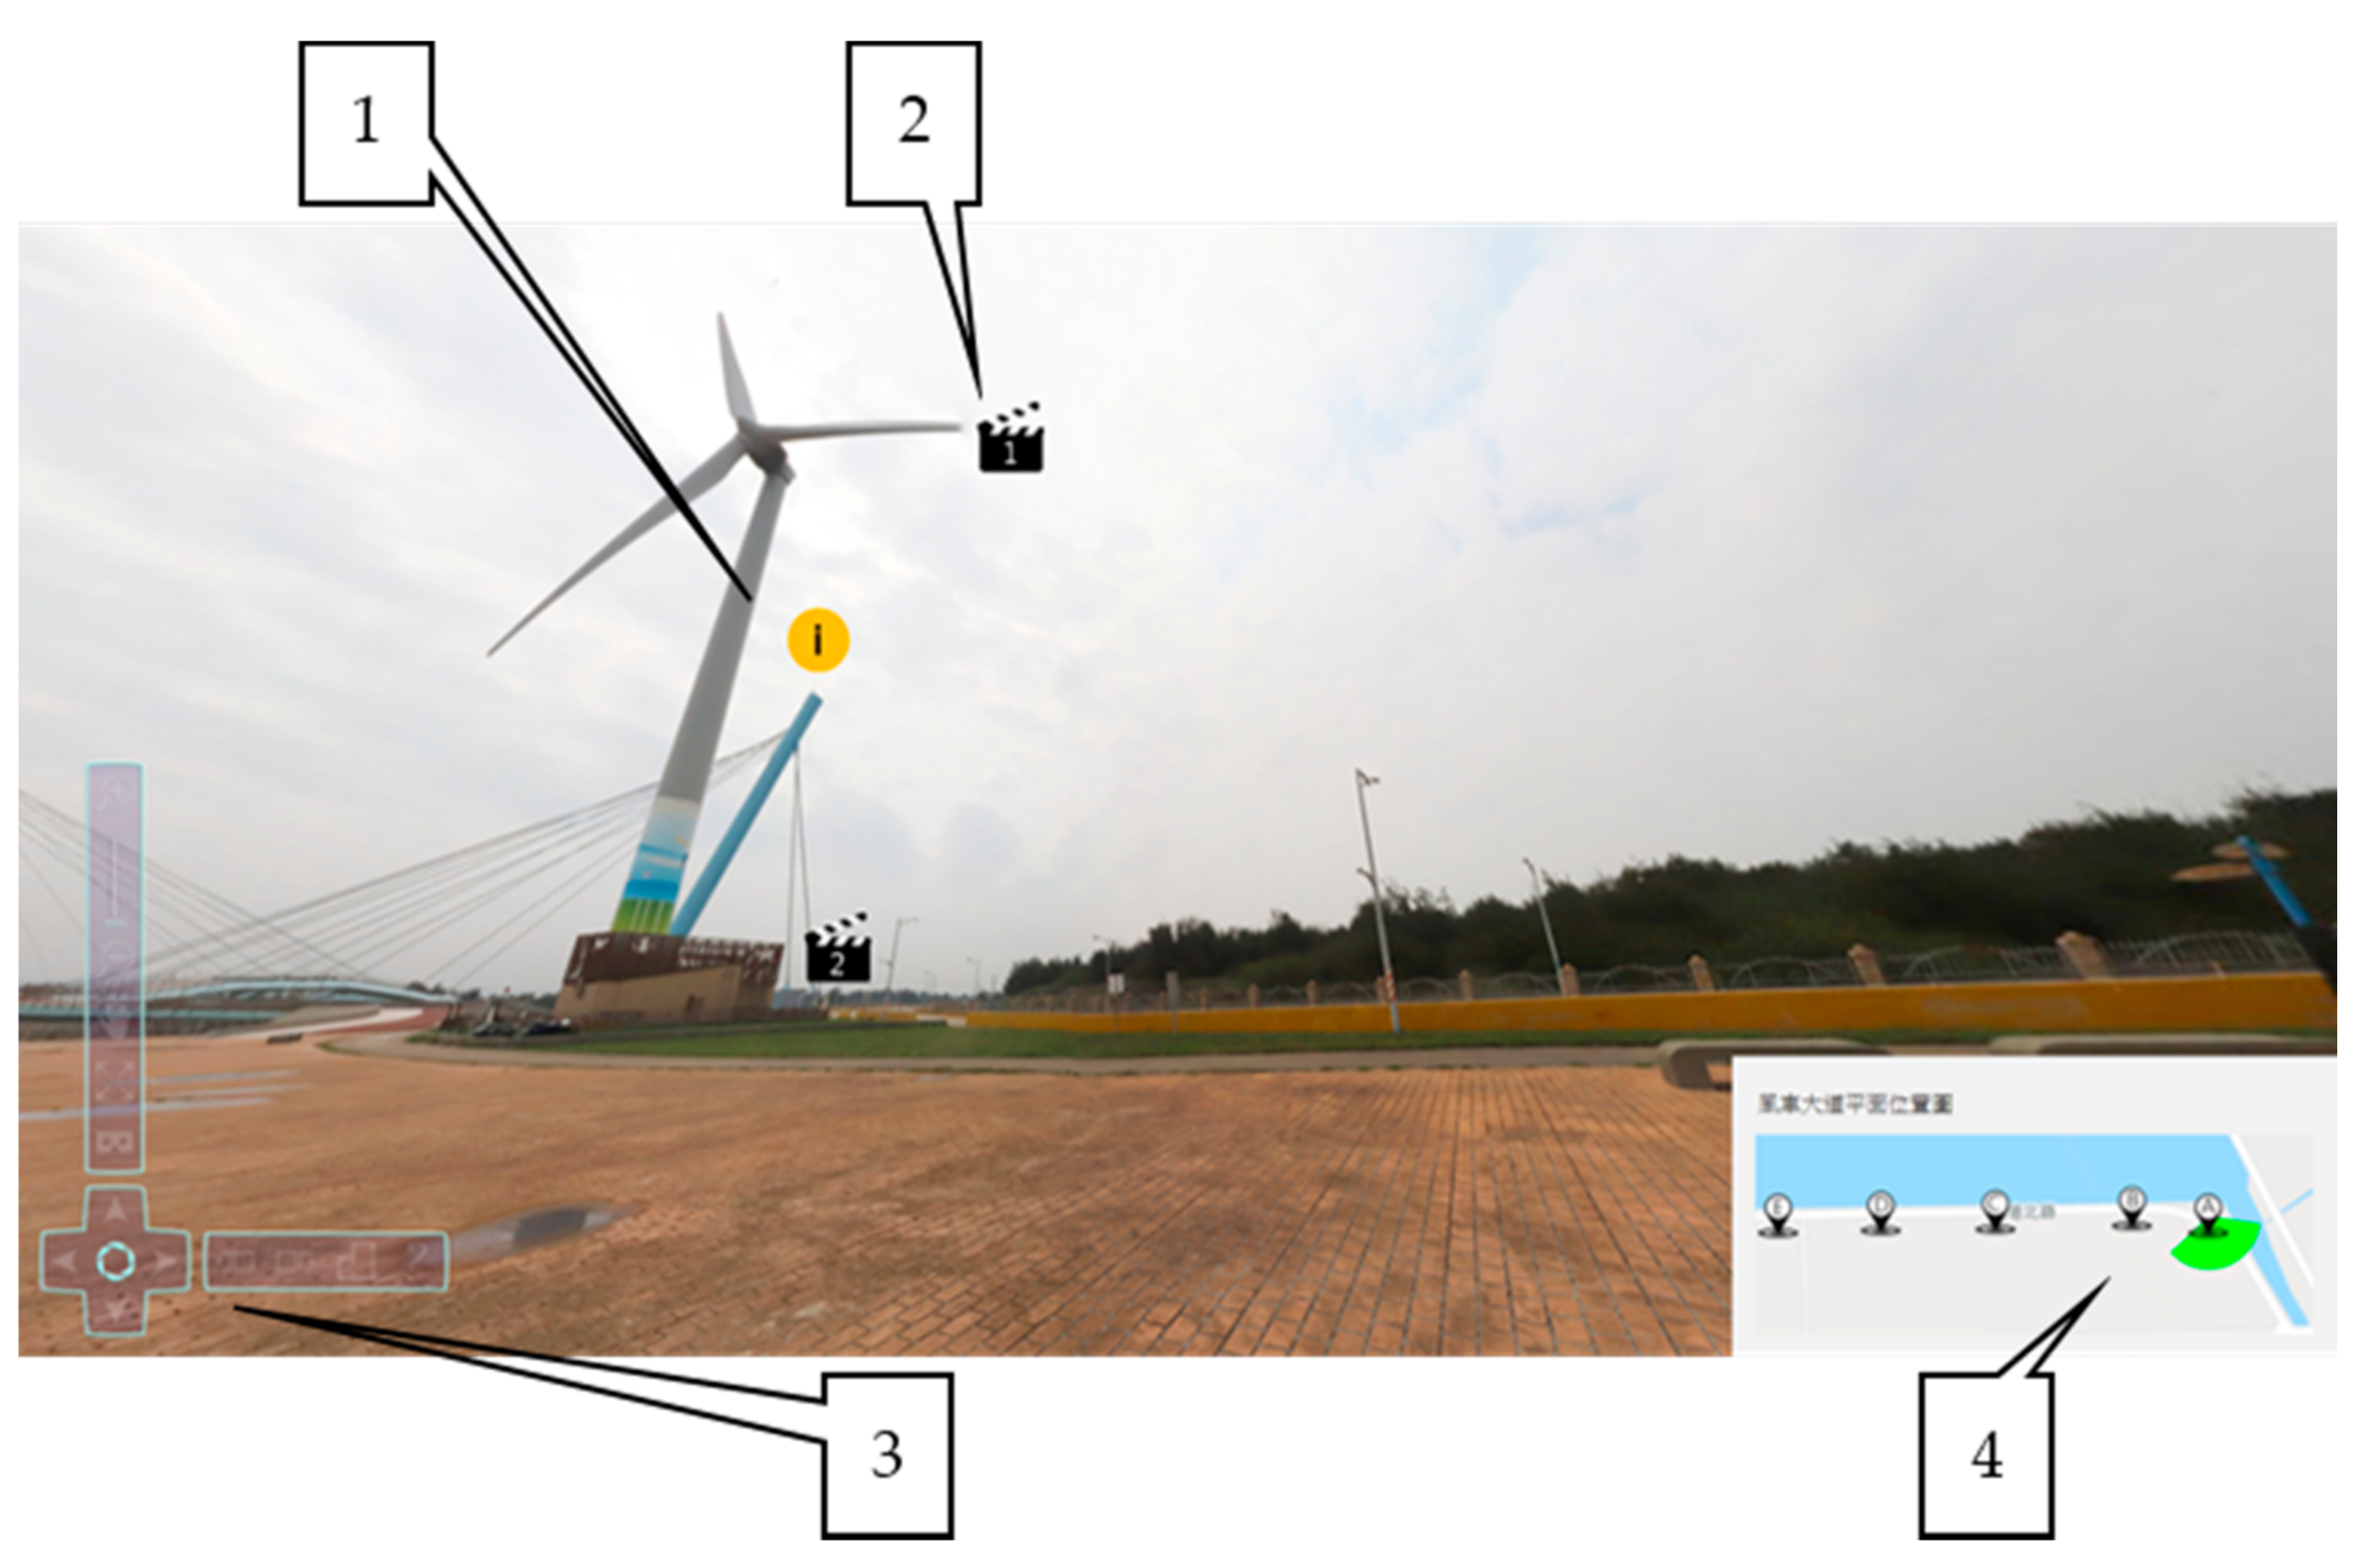
2.2.4. Virtual Tour
3. Results
3.1. Camera Settings
3.2. Test for Eccentric Issue and Rate of Overlap
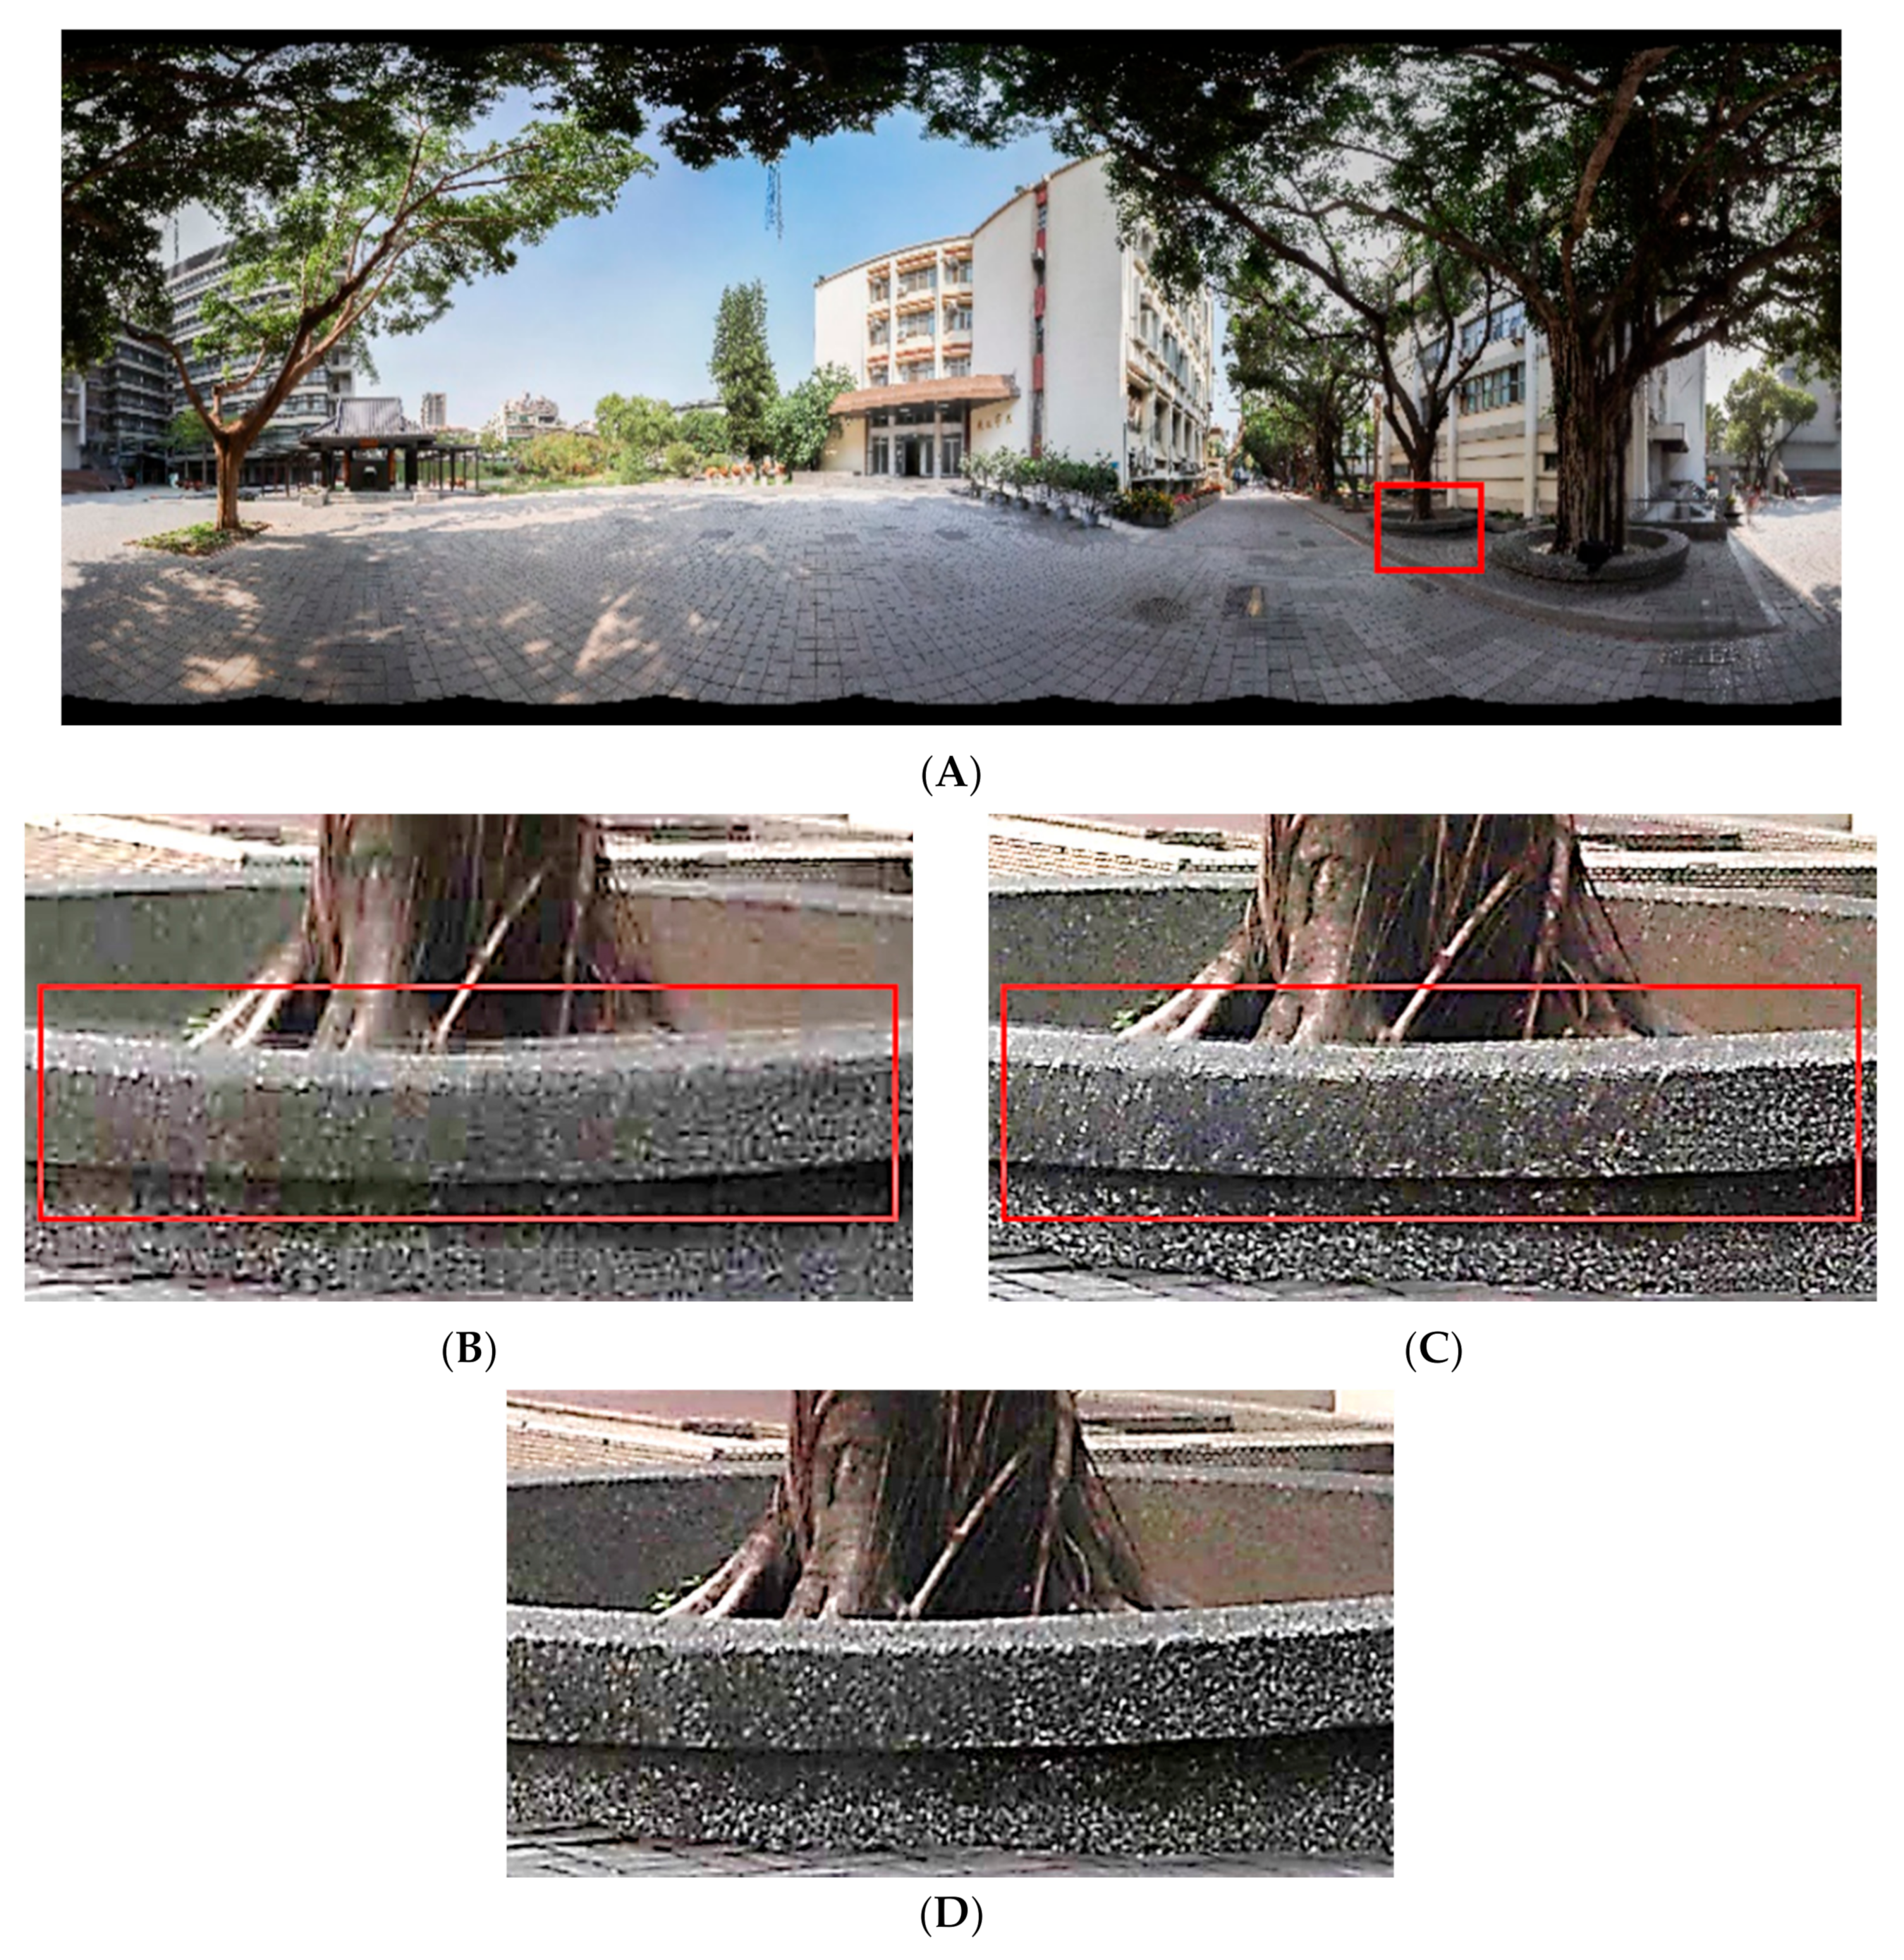
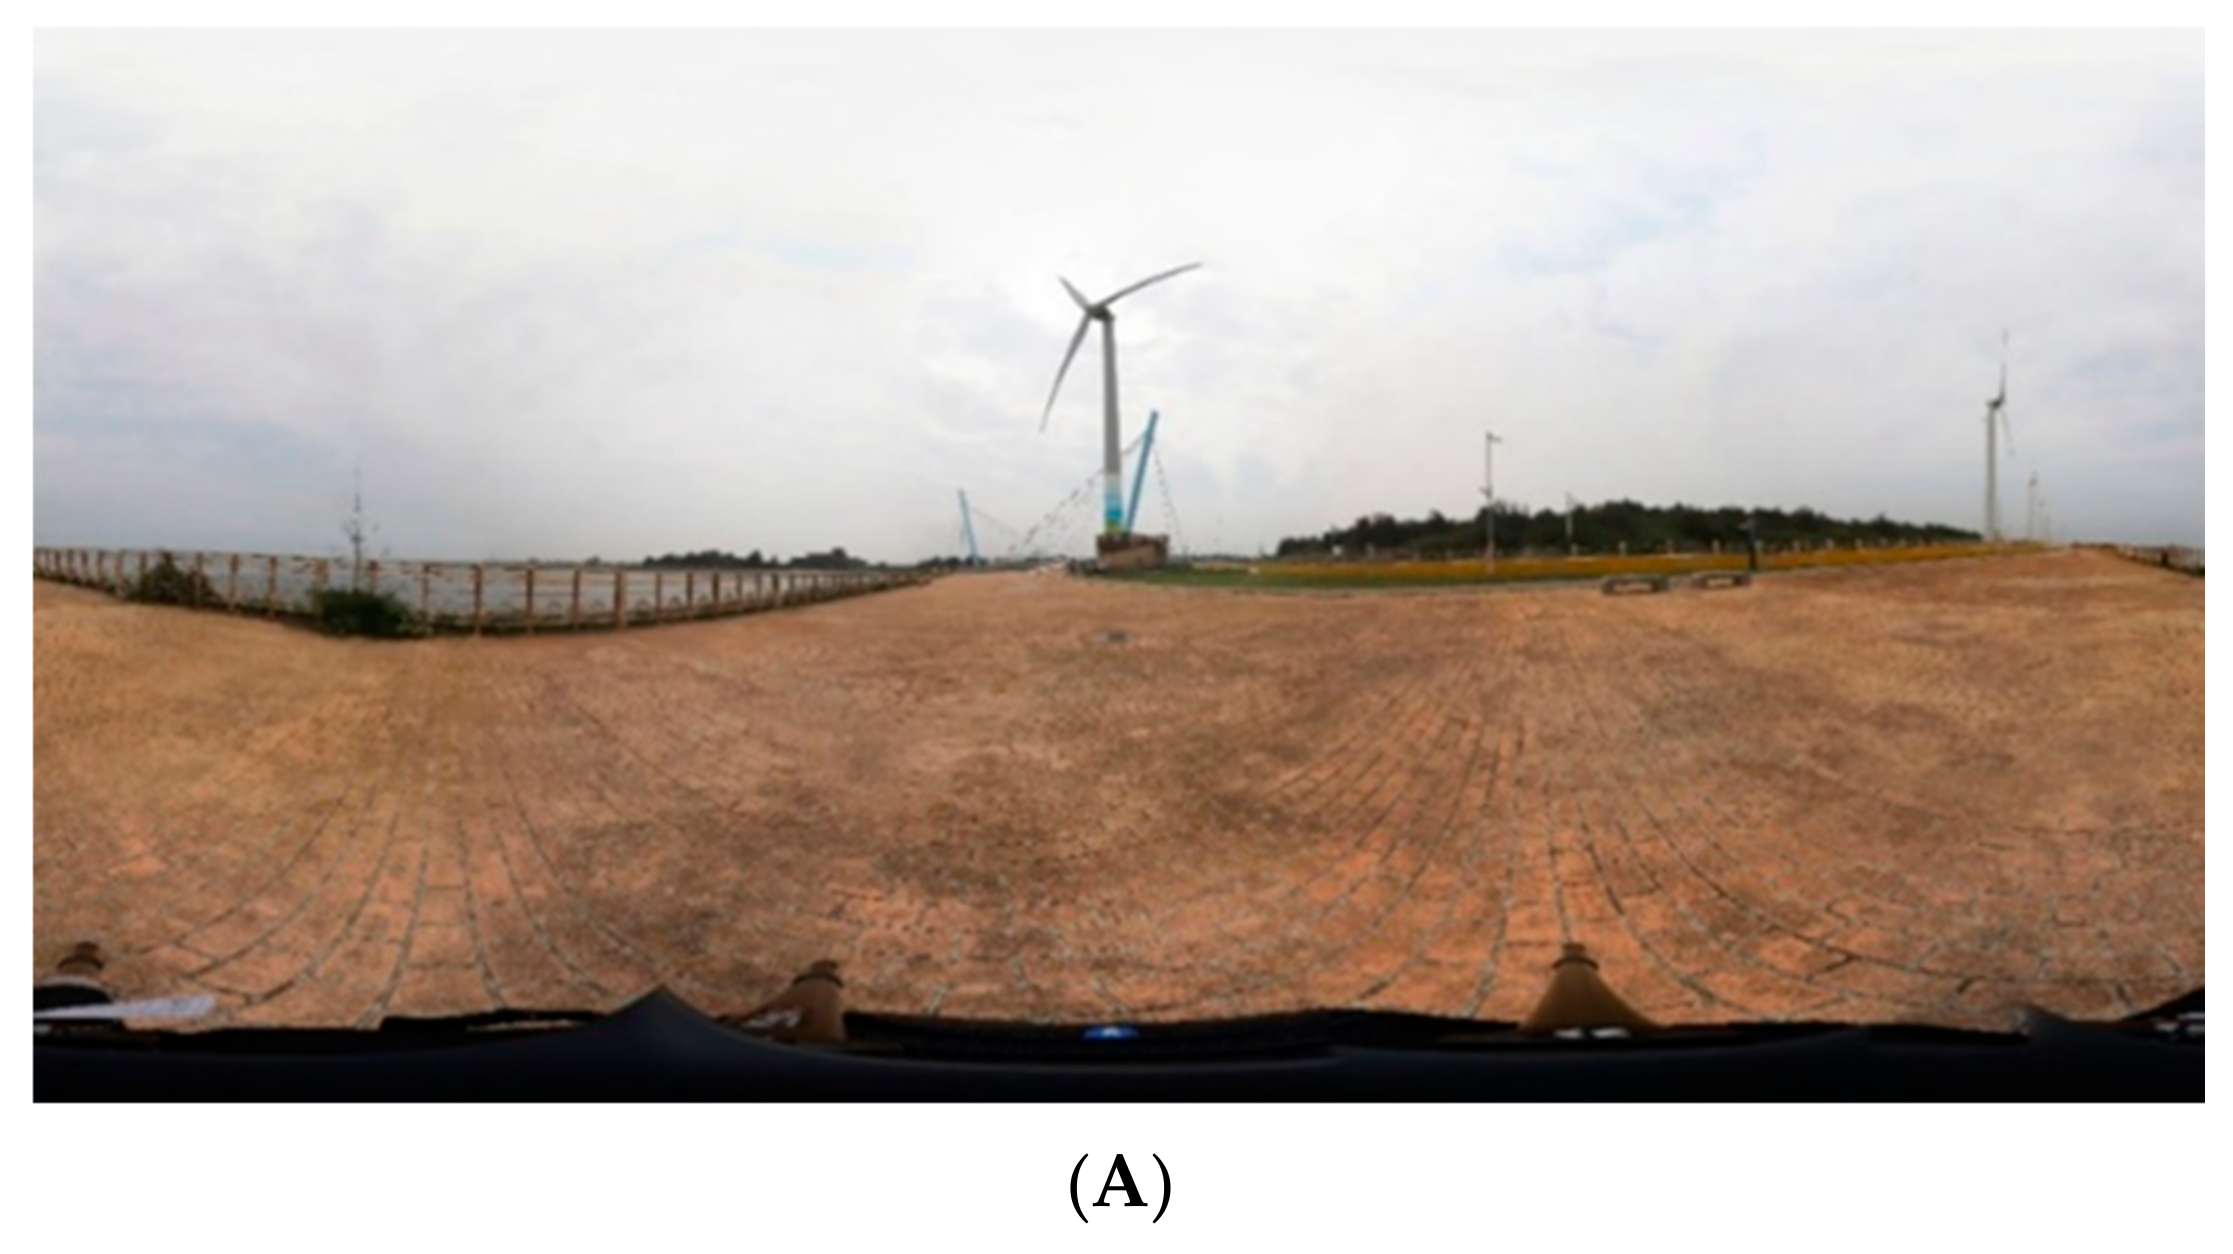
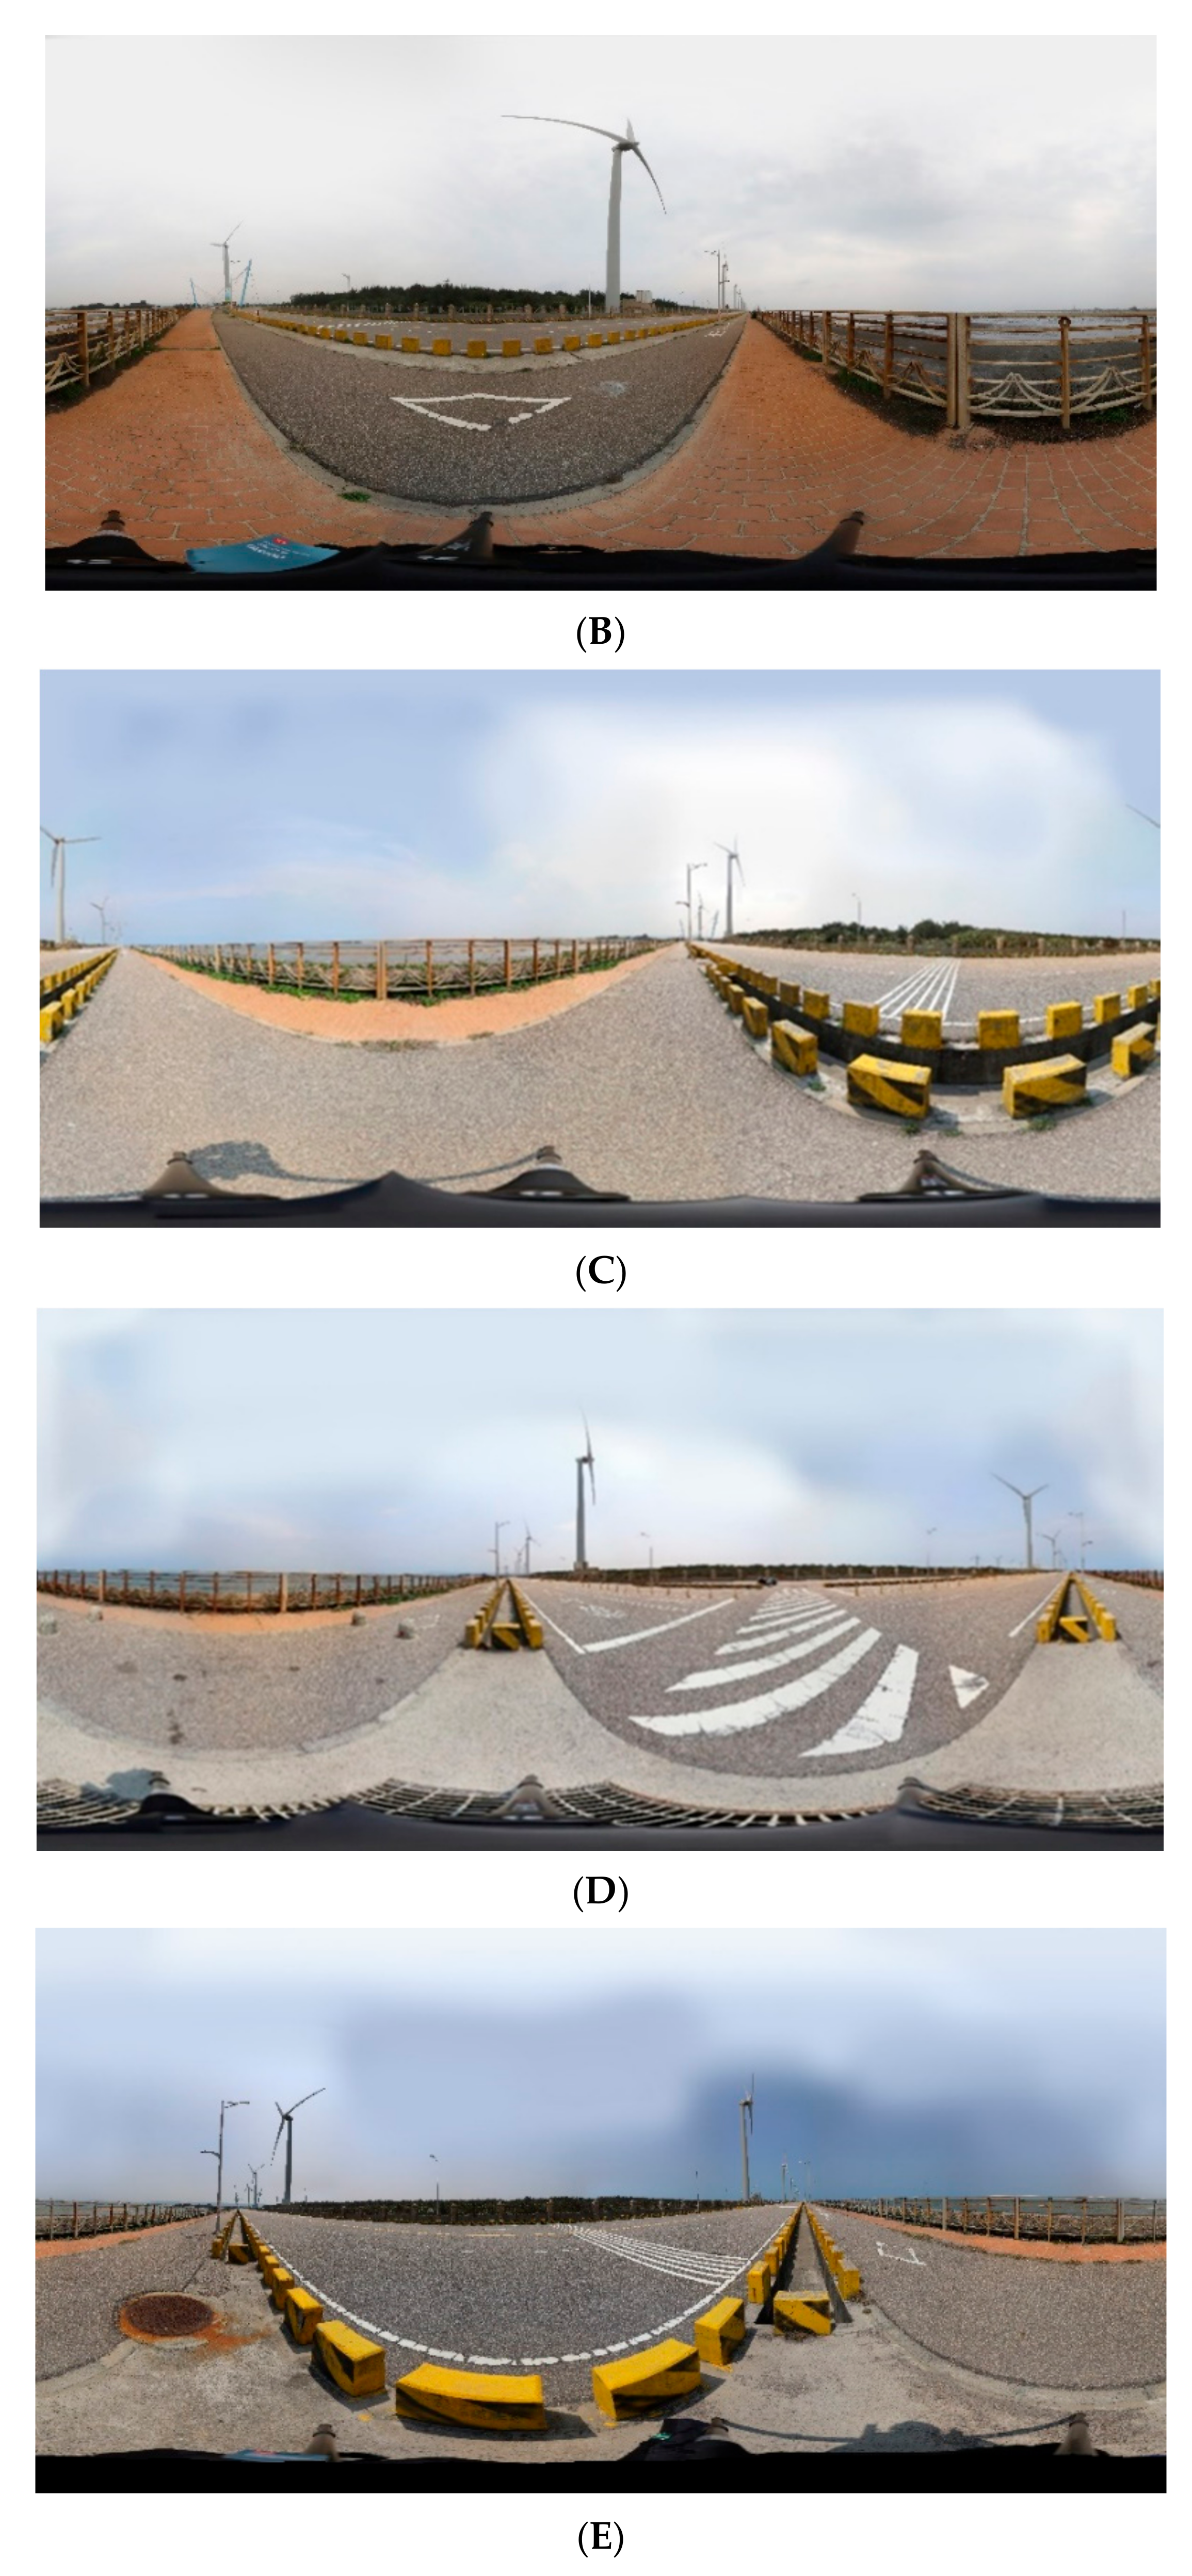
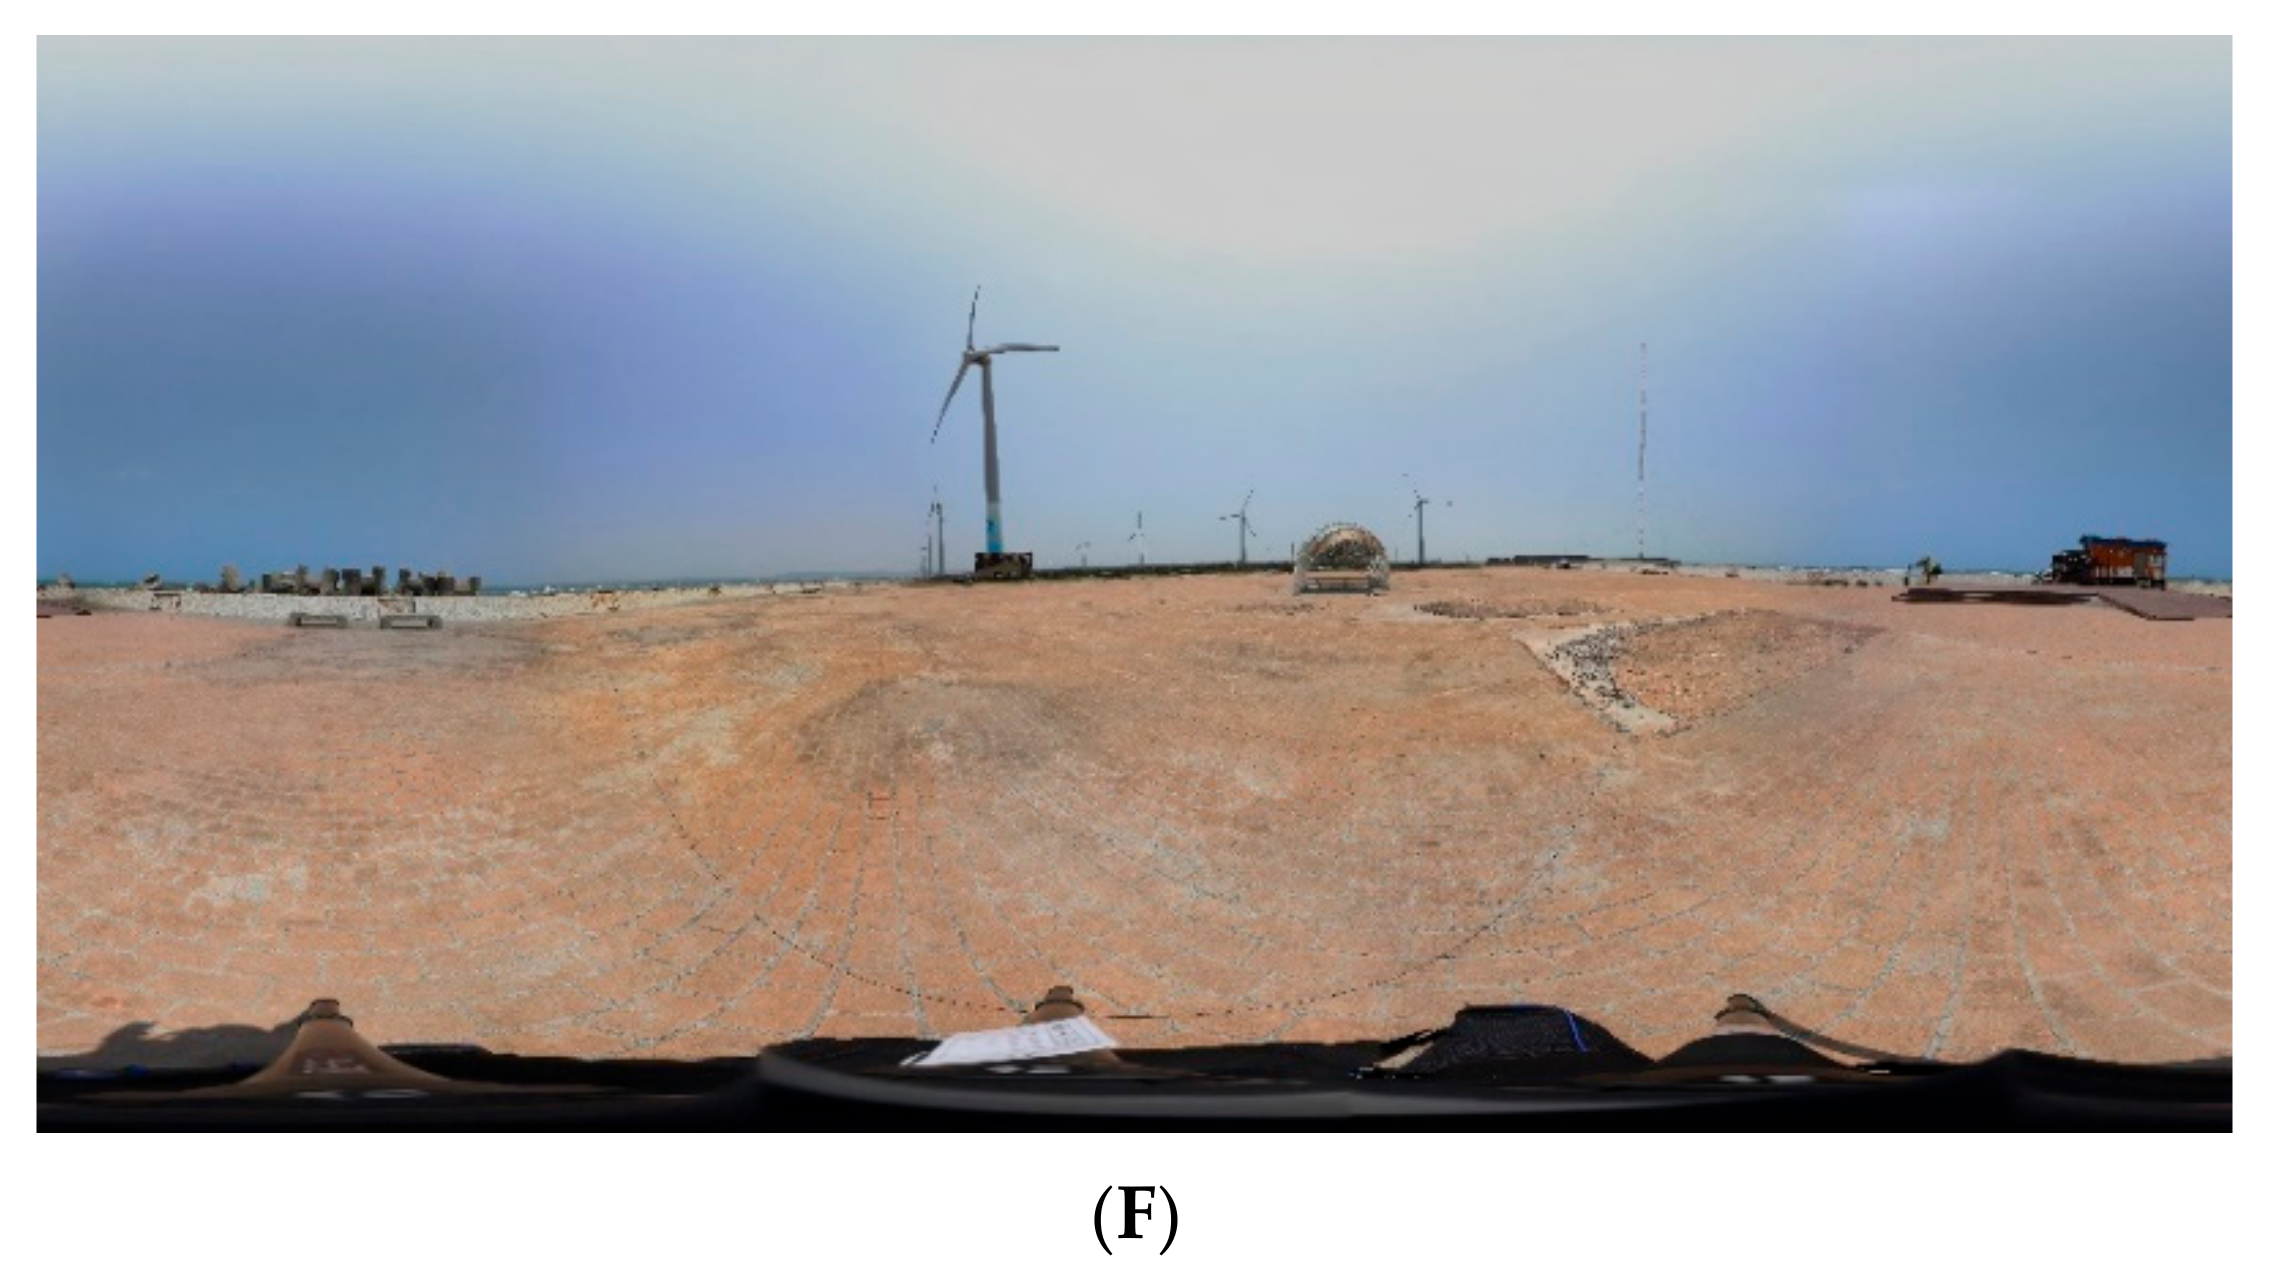
3.3. Real Case of the Onshore Wind Farms
4. Discussion
5. Conclusions
Author Contributions
Funding
Acknowledgments
Conflicts of Interest
References
- Oscar, A.; Eva, M.; Laura, C.; Alberto, P.; Diana, J. High-Fidelity Virtual objective structured clinical examinations with standardized patients in nursing students: An innovative proposal during the COVID-19 pandemic. Healthcare 2021, 9, 355. [Google Scholar]
- Gao, Z.; Lee, J.; McDonough, D.; Albers, C. Virtual reality exercise as a coping strategy for health and wellness promotion in older adults during the COVID-19 pandemic. J. Clin. Med. 2020, 9, 1986. [Google Scholar] [CrossRef] [PubMed]
- Van, N.; Vrana, V.; Duy, N.; Minh, D.; Dzung, P.; Mondal, S.; Das, S. The role of human–machine interactive devices for post-COVID-19 innovative sustainable tourism in Ho Chi Minh City, Vietnam. Sustainability 2020, 12, 9523. [Google Scholar] [CrossRef]
- Graabak, I.; Korpås, M. Variability characteristics of European wind and solar power resources—A review. Energies 2016, 9, 449. [Google Scholar] [CrossRef] [Green Version]
- Thayumanavan, P.; Kaliyaperumal, D.; Subramaniam, U.; Bhaskar, M.; Padmanaban, S.; Leonowicz, Z.; Mitolo, M. Combined harmonic reduction and DC voltage regulation of a single DC source five-level multilevel inverter for wind electric system. Electronics 2020, 9, 979. [Google Scholar] [CrossRef]
- Ganea, D.; Amortila, V.; Mereuta, E.; Rusu, E. A joint evaluation of the wind and wave energy resources close to the Greek Islands. Sustainability 2017, 9, 1025. [Google Scholar] [CrossRef] [Green Version]
- Feng, T.; Yang, Y.; Yang, Y.; Wang, D. Application status and problem investigation of distributed generation in China: The case of natural gas, solar and wind resources. Sustainability 2017, 9, 1022. [Google Scholar] [CrossRef] [Green Version]
- Chang, C. Wind Power Generation Prediction Using Data Mining Technique: The Case of Chang Kung Wind Farm. Master’s Thesis, National Chung Hsing University, Taichung, Taiwan, 2018. [Google Scholar]
- Cheng, K.-S.; Ho, C.-Y.; Teng, J.-H. Wind and see breeze characteristics for the offshore wind farms in the central coastal area of Taiwan. Energies 2022, 15, 992. [Google Scholar] [CrossRef]
- 4C Offshore. Available online: https://www.4coffshore.com/windfarms/windspeeds.aspx (accessed on 8 April 2022).
- Burdea, G. Virtual reality systems and applications. In Proceedings of the Electro/93 International Conference, Short Course, Edison, NJ, USA, 28 April 1993. [Google Scholar]
- Weng, C. A Study on Sense of Space and Presence in Virtual Space. Ph.D. Thesis, National Chiao Tung University, Hsinchu, Taiwan, 2007. [Google Scholar]
- Bricken, M. Virtual reality learning environments: Potentials and challenges. Comput. Graph. 1991, 25, 178–184. [Google Scholar] [CrossRef]
- Michitaka, H. Virtual reality technology and museum exhibit. Int. J. Virtual Real. 2006, 5, 31–36. [Google Scholar]
- Lai, J.; Peng, Y.; Chang, M.; Huang, J. Panoramic mapping with information technologies for supporting engineering education: A preliminary exploration. ISPRS Int. J. Geo-Inf. 2020, 9, 689. [Google Scholar] [CrossRef]
- Soliman, M.; Pesyridis, A.; Dalaymani-Zad, D.; Gronfula, M.; Kourmpetis, M. The application of virtual reality in engineering education. Appl. Sci. 2021, 11, 2879. [Google Scholar] [CrossRef]
- FernandoJ, F.; Rebeca, M.; Manuel, C. Constructionist learning tool for acquiring skills in understanding standardised engineering drawings of mechanical assemblies in mobile devices. Sustainability 2021, 13, 3305. [Google Scholar]
- Lee, H.; Lee, J. The effect of elementary school soccer instruction using virtual reality technologies on students’ attitudes toward physical education and flow in class. Sustainability 2021, 13, 3240. [Google Scholar] [CrossRef]
- Louvre. Available online: https://www.louvre.fr/en/visites-en-ligne (accessed on 29 March 2022).
- Great Wall of China. Available online: https://www.thechinaguide.com/destination/great-wall-of-china (accessed on 29 March 2022).
- Lee, C. Applying Orient-Object Technique to Construct 3D Virtual Tourism—A Case Study in the Yeliou Geo-Park. Master’s Thesis, National Taiwan University, Taipei, Taiwan, 2007. [Google Scholar]
- Harrington, M.; Bledsoe, Z.; Jones, C.; Miller, J.; Pring, T. Designing a virtual arboretum as an immersive, multimodal, interactive, data visualization virtual field trip. Multimodal Technol. Interact. 2021, 5, 18. [Google Scholar] [CrossRef]
- Antonio, M.; Alberto, R.; Gasparini, M.; Hornero, A.; Iraci, B.; Martín-Talaverano, R.; Moreno-Escribano, J.; Muñoz-Cádiz, J.; Murillo-Fragero, J.; Obregón-Romero, R.; et al. A heritage science workflow to preserve and narrate a rural archeological landscape using virtual reality: The Cerro del Castillo of Belmez and its surrounding environment (Cordoba, Spain). Appl. Sci. 2020, 10, 8659. [Google Scholar]
- Mariotto, F.; Bonali, F. Virtual geosites as innovative tools for geoheritage popularization: A case study from eastern Iceland. Geosciences 2021, 11, 149. [Google Scholar] [CrossRef]
- Garinko Ice-Breaker Cruise 360 Experiences. Available online: https://www.youtube.com/watch?v=W3OWKEtVtUY (accessed on 29 March 2022).
- Chao, T.-F. The Study of Virtual Reality Application in Education Learning—An Example on VR Scientific Experiment. Master’s Thesis, National Kaohsiung First University of Science and Technology, Kaohsiung, Taiwan, 2009. [Google Scholar]
- Li, Y.; Song, H.; Guo, R. A study on the causal process of virtual reality tourism and its attributes in terms of their effects on subjective well-being during COVID-19. Int. J. Environ. Res. Public Health 2021, 18, 1019. [Google Scholar] [CrossRef]
- Chiao, H.-M.; Chen, Y.-L.; Huang, W.-H. Examining the usability of an online virtual tour-guiding platform for cultural tourism education. J. Hosp. Leis. Sport Tour. Educ. 2018, 23, 29–38. [Google Scholar] [CrossRef]
- Panos. Available online: https://www.panosensing.com.tw/faq6/ (accessed on 29 March 2022).
- Ernie, H.; Mark, K. Implementing GigaPan technology into an airport’s foreign object debris management program. Transp. Res. Rec. J. Transp. Res. Board 2013, 2336, 55–62. [Google Scholar]
- Zheng, J.; Zhang, Z.; Tao, Q.; Shen, K.; Wang, Y. An accurate multi-row panorama generation using multi-point joint stitching. IEEE Access 2018, 6, 27827–27839. [Google Scholar] [CrossRef]
- Liu, X.C.; Guo, X.T.; Zhao, D.H.; Cao, H.L.; Tang, J.; Wang, C.G.; Shen, C.; Liu, J. Integrated velocity measurement algorithm based on optical flow and scale-invariant feature transform. IEEE Access 2019, 7, 153338–153348. [Google Scholar] [CrossRef]
- Lyu, W.; Zhou, Z.; Chen, L.; Zhou, Y. A survey on image and video stitching. Virtual Real. Intell. Hardwar 2019, 1, 55–83. [Google Scholar] [CrossRef]
- Lee, H.; Lee, S.; Choi, O. Improved method on image stitching based on optical flow algorithm. Int. J. Eng. Bus. Manag. 2020, 12, 1–17. [Google Scholar] [CrossRef]
- Lee, Y.A. Comparative Analysis on the Traditional and Digital Interface of Single-Lens Reflex Cameras—A Case Study of Exposure Control. Master’s Thesis, National Taiwan University of Science and Technology, Taipei, Taiwan, 2009. [Google Scholar]
- Cooper, J.D.; Abbott, J.C. Exposure Control and Lighting (Nikon Handbook); Amphoto: Kansas, MI, USA, 1979. [Google Scholar]
- Lowe, D.G. Object recognition from local scale-invariant features. In Proceedings of the 7th IEEE International Conference on Computer Vision, Kerkyra, Greece, 20–29 September 1999. [Google Scholar]
- Wang, G.; Wu, Q.M.J.; Zhang, W. Kruppa equation based camera calibration from homography induced by remote plane. Pattern Recogn. Lett. 2008, 29, 2137–2144. [Google Scholar] [CrossRef]
- Sakharkar, V.S.; Gupta, S.R. Image stitching techniques—An overview. Int. J. Comput. Sci. Appl. 2013, 6, 324–330. [Google Scholar]
- Blending in AutoPano Video Pro. Available online: https://www.youtube.com/watch?v=knqT-2UJOao (accessed on 29 March 2022).
- What Is Blending? Autopano Video Pro. Available online: https://www.youtube.com/watch?v=H6Tjq0rB9UA (accessed on 29 March 2022).
- Zeng, B.; Huang, Q.; Saddik, A.E.; Li, H.; Jiang, S.; Fan, X. Advances in multimedia information processing. In Proceedings of the 19th Pacific-Rim Conference on Multimedia, Hefei, China, 21–22 September 2018. [Google Scholar]
- Koehl, M.; Brigand, N. Combination of virtual tours, 3D model and digital data in a 3D archaeological knowledge and information system. In Proceedings of the XXII ISPRS Congress, Melbourne, Australia, 25 August–1 September 2012. [Google Scholar]
- Medynska-Gulij, G.; Forrest, D.; Cybulski, P. Modern cartographic forms of expression: The renaissance of multimedia cartography. ISPRS Int. J. Geo-Inf. 2021, 10, 484. [Google Scholar] [CrossRef]
- Huang, T.-Y. Deformation Responses of Piles in Cohesionless Soil under Cyclic Axial Tension Loads. Master’s Thesis, National Cheng Kung University, Tainan, Taiwan, 2014. [Google Scholar]
- Lee, I.-C.; Tsai, F. Applications of panoramic images: From 720° panorama to inerior 3D models of augmented reality. In Proceedings of the Indoor-Outdoor Seamless Modelling, Mapping and Navigation, Tokyo, Japan, 21–22 May 2015. [Google Scholar]
- Tsai, V.J.D.; Chang, C.-T. Three-dimensional positioning from Google street view panoramas. IET Image Process. 2013, 7, 229–239. [Google Scholar] [CrossRef] [Green Version]
- Huang, T.-C.; Tseng, Y.-H. Indoor positioning and navigation based on control spherical panoramic images. J. Photogram. Remote Sens. 2017, 22, 105–115. [Google Scholar]
- Teo, T.-A.; Chang, C.-Y. The generation of 3D point clouds from spherical and cylindrical panorama images. J. Photogram. Remote Sens. 2018, 23, 273–284. [Google Scholar]


| 24 mm | 35 mm | 70 mm | |||
|---|---|---|---|---|---|
| Scale Mark | Object Shift in Clockwise | Scale Mark | Object Shift in Clockwise | Scale Mark | Object Shift in Clockwise |
| 30 | left | 30 | left | 30 | left |
| 55 | left | 55 | left | 55 | left |
| 100 | left | 100 | - | 80 | - |
| 105 | - | 115 | right | 100 | right |
| 110 | right | ||||
| 115 | right | ||||
| 24 mm | 35 mm | ||||
|---|---|---|---|---|---|
| Rate of Overlap | Scale Mark | Avg. RMSE (Unit: Px) | Rate of Overlap | Scale Mark | Avg. RMSE (Unit: Px) |
| 25% | 55 | 2.82 | 25% | 30 | 2.96 |
| 100 | 2.74 | 55 | 2.89 | ||
| 105 | 2.65 | 100 | 2.56 | ||
| 110 | 2.87 | 115 | 2.74 | ||
| 115 | 2.75 | ||||
| 50% | 55 | 2.72 | 50% | 30 | 2.87 |
| 100 | 2.56 | 55 | 2.82 | ||
| 105 | 2.45 | 100 | 2.69 | ||
| 110 | 2.55 | 115 | 2.69 | ||
| 115 | 2.70 | ||||
| 75% | 55 | 2.51 | 75% | 30 | 2.47 |
| 100 | 2.26 | 55 | 2.45 | ||
| 105 | 2.15 | 100 | 2.21 | ||
| 110 | 2.19 | 115 | 2.27 | ||
| 115 | 2.22 | ||||
| Rate of Overlap | Scale Mark | Number of Tie Points | Avg. RMSE (Unit: Px) |
|---|---|---|---|
| 25% | 55 | 161 | 2.82 |
| 105 | 194 | 2.65 | |
| 115 | 166 | 2.75 |
| Station | Sd. | Avg. | Max | Min | Number of Tie Point |
|---|---|---|---|---|---|
| A B C D | 0.50 0.95 0.72 0.56 | 3.36 3.04 2.65 2.65 | 4.59 5.62 5.74 5.11 | 2.10 1.33 1.39 1.65 | 171 238 366 355 |
| E F | 0.64 0.52 | 2.78 3.24 | 5.28 4.58 | 1.50 1.94 | 393 155 |
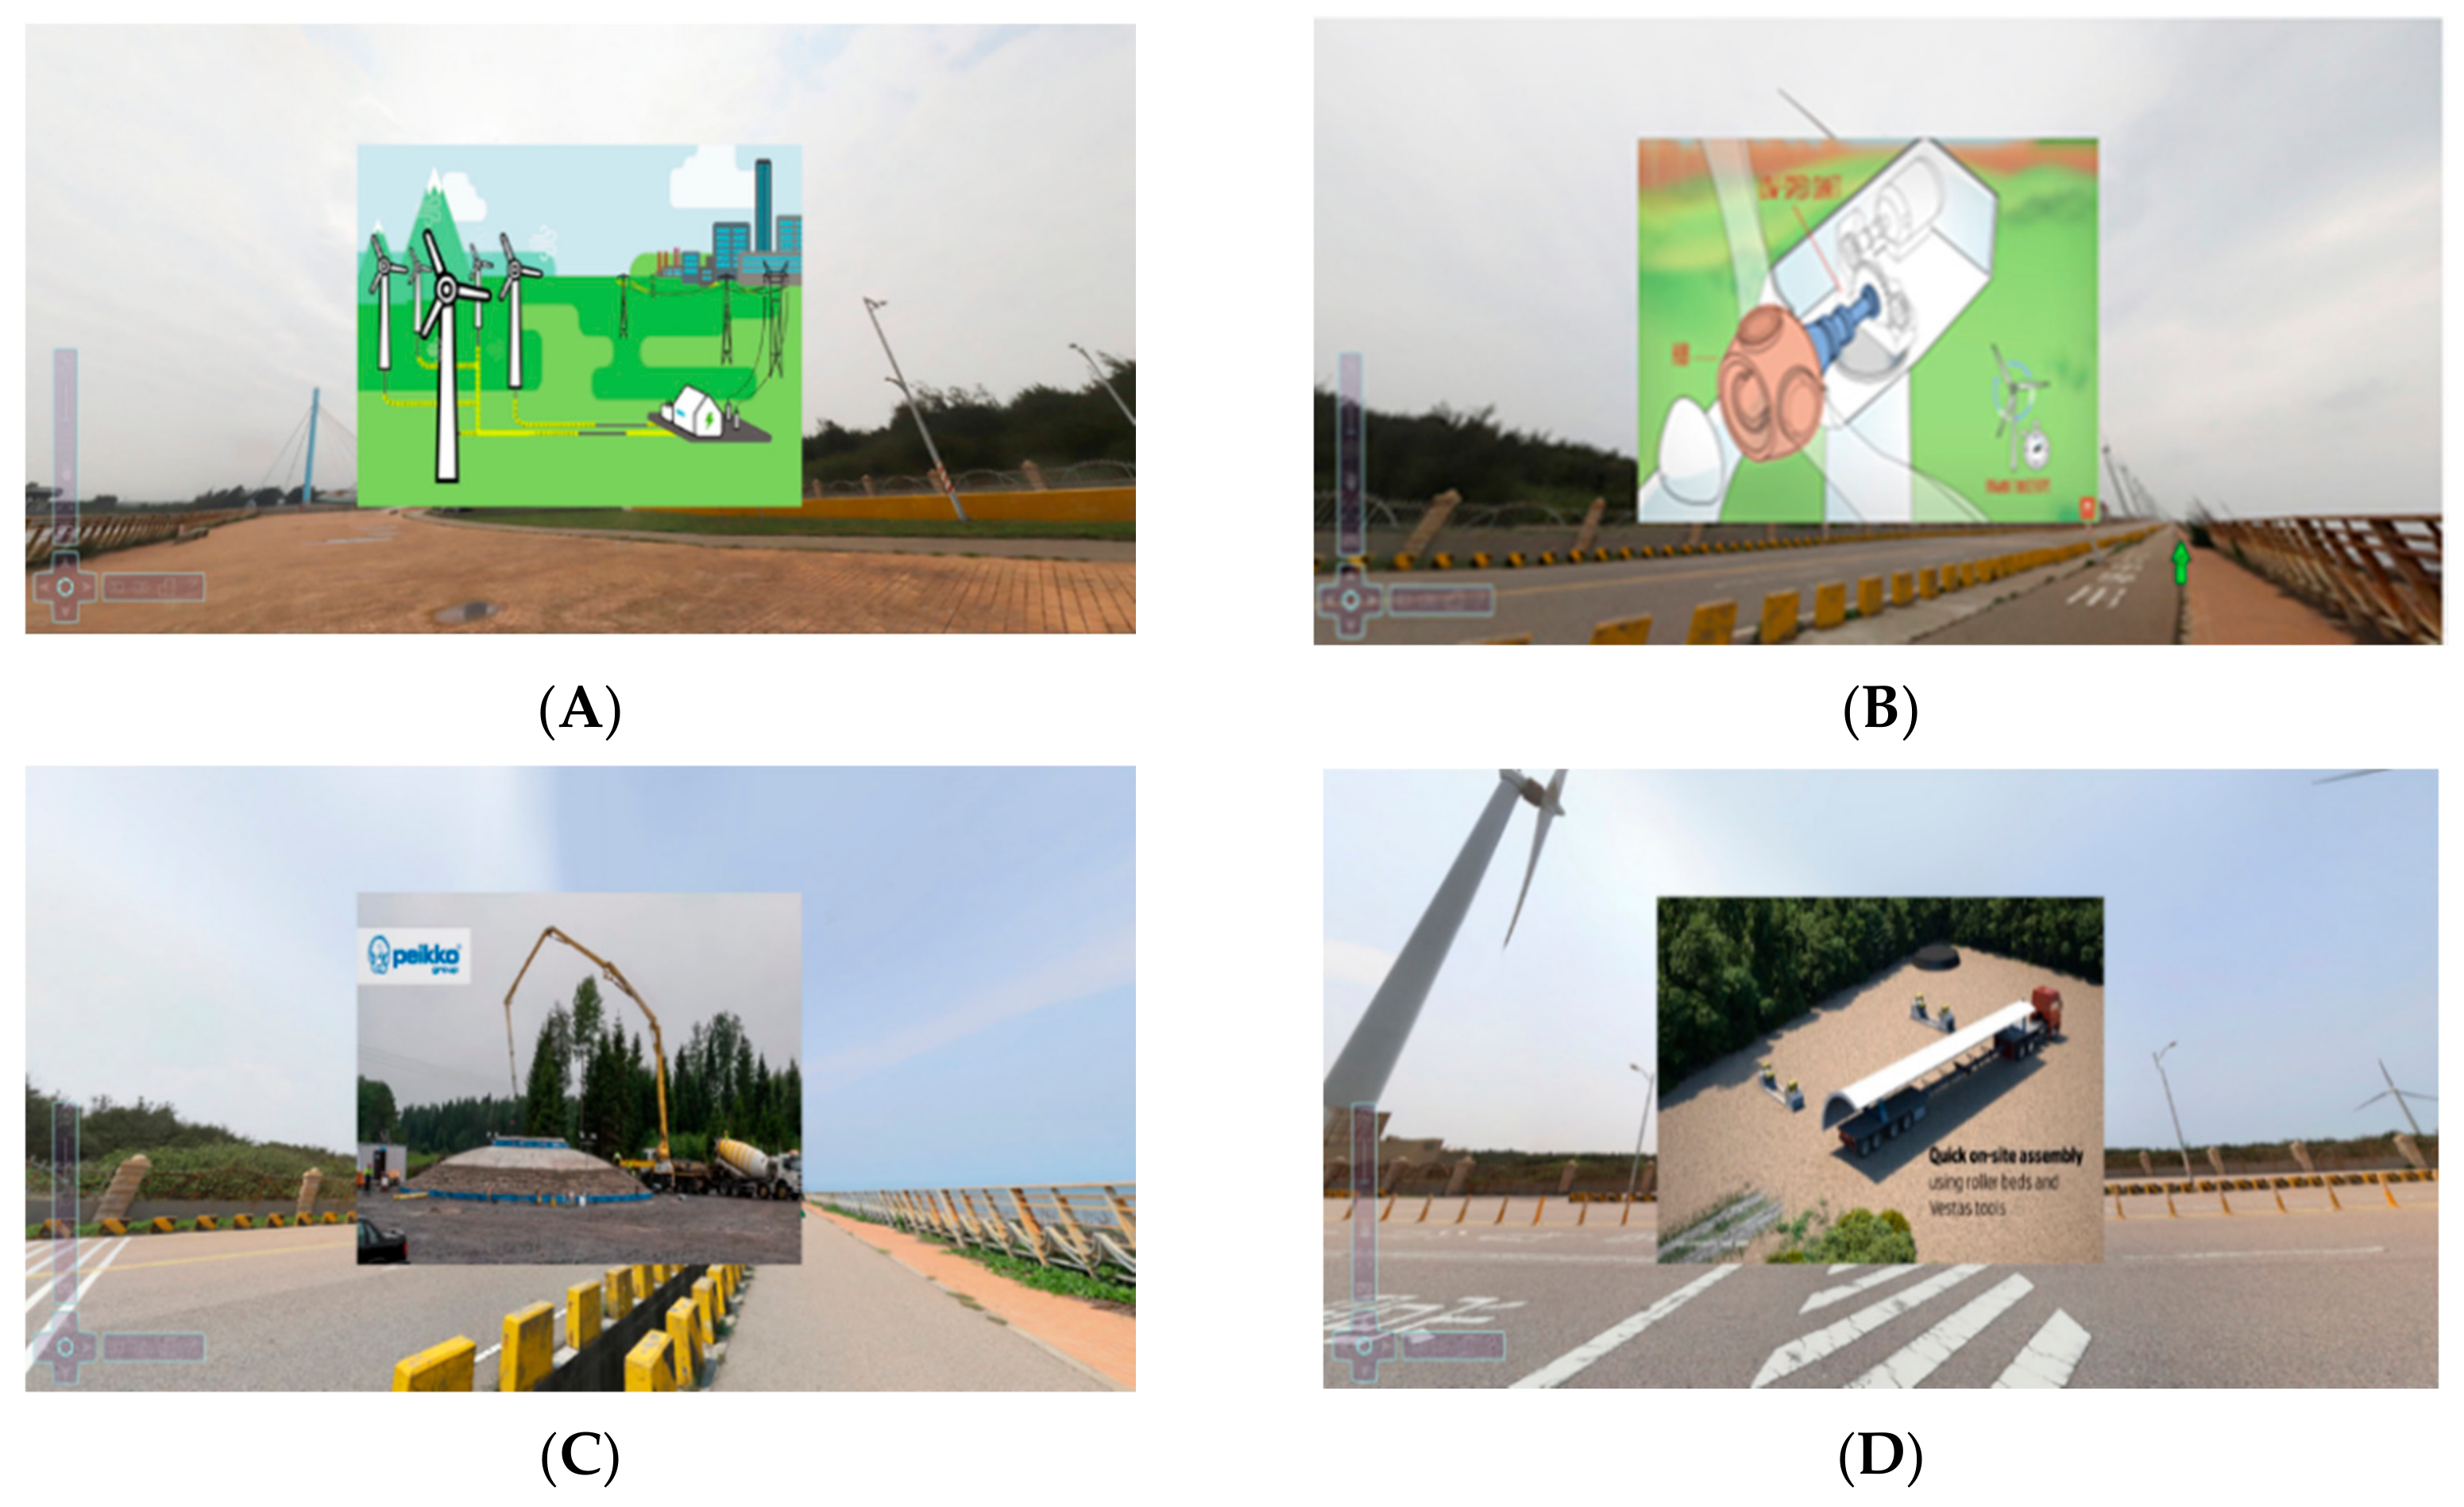
| Station | Illustrated Issues from the Videos |
|---|---|
| A | Operational procedure, substation, and power storage |
| B | Wind power and electricity transportation process |
| C | Construction of gravity-based foundations |
| D | Transportation of wind turbine tower and construction methods |
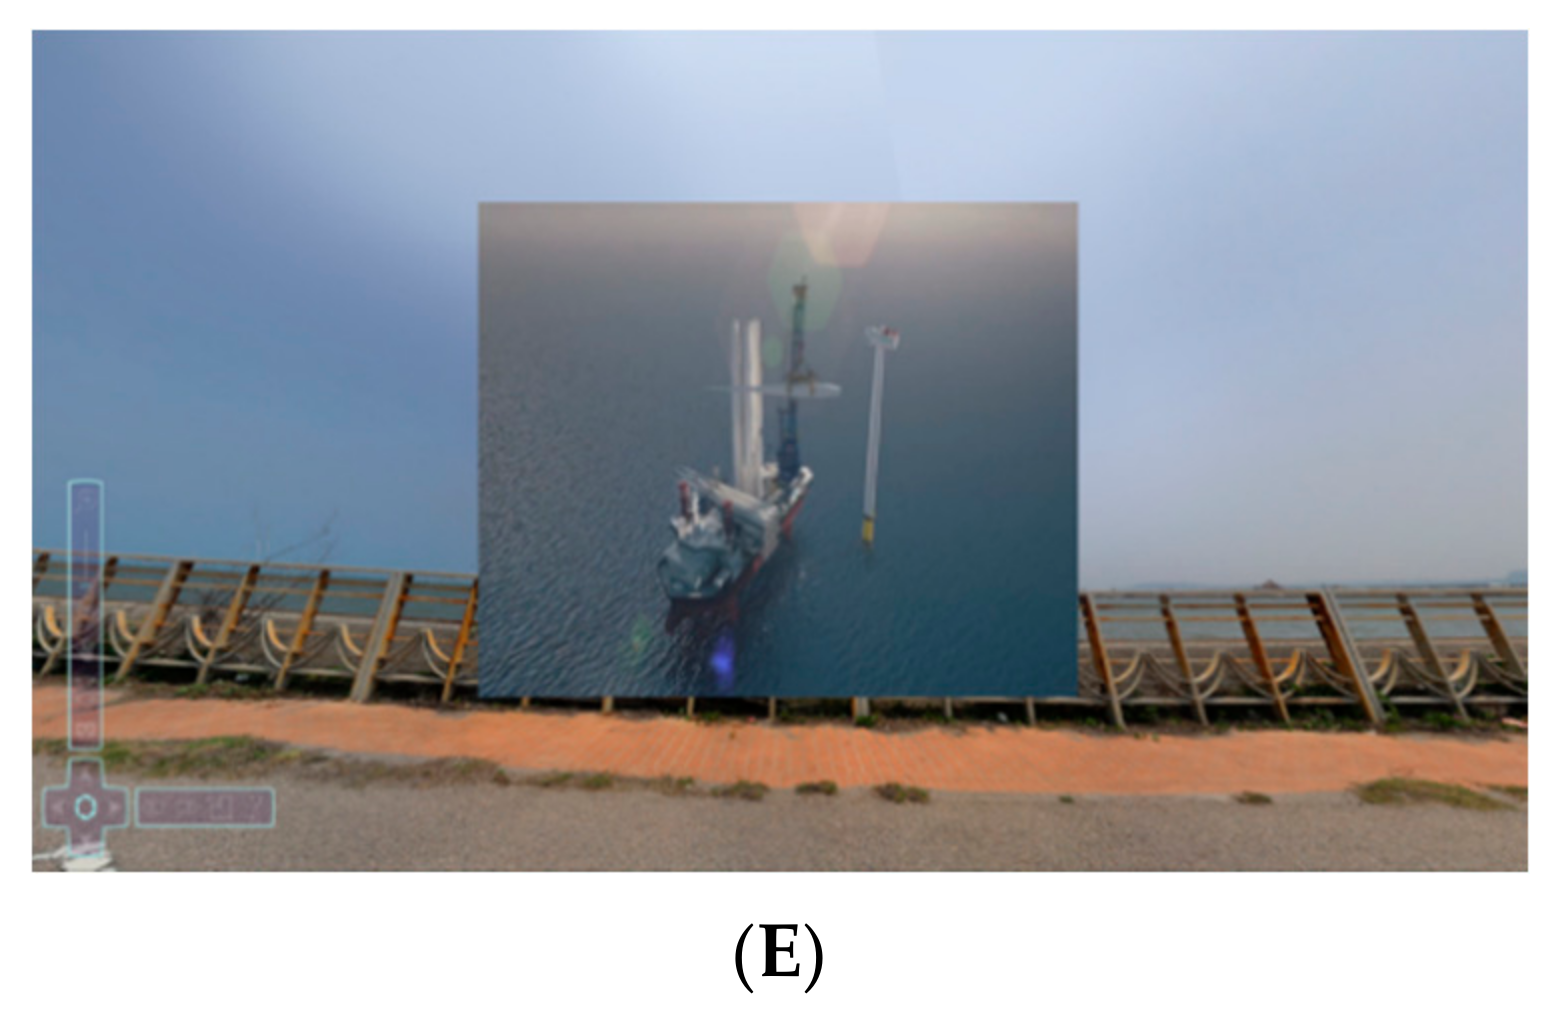
| E | Monopile foundation for offshore wind turbines (extension topic) |
Publisher’s Note: MDPI stays neutral with regard to jurisdictional claims in published maps and institutional affiliations. |
© 2022 by the authors. Licensee MDPI, Basel, Switzerland. This article is an open access article distributed under the terms and conditions of the Creative Commons Attribution (CC BY) license (https://creativecommons.org/licenses/by/4.0/).
Share and Cite
Lai, J.-S.; Tsai, Y.-H.; Chang, M.-J.; Huang, J.-Y.; Chi, C.-M. A Technical and Operational Perspective on Quality Analysis of Stitching Images with Multi-Row Panorama and Multimedia Sources for Visualizing the Tourism Site of Onshore Wind Farm. ISPRS Int. J. Geo-Inf. 2022, 11, 362. https://0-doi-org.brum.beds.ac.uk/10.3390/ijgi11070362
Lai J-S, Tsai Y-H, Chang M-J, Huang J-Y, Chi C-M. A Technical and Operational Perspective on Quality Analysis of Stitching Images with Multi-Row Panorama and Multimedia Sources for Visualizing the Tourism Site of Onshore Wind Farm. ISPRS International Journal of Geo-Information. 2022; 11(7):362. https://0-doi-org.brum.beds.ac.uk/10.3390/ijgi11070362
Chicago/Turabian StyleLai, Jhe-Syuan, Yi-Hung Tsai, Min-Jhen Chang, Jun-Yi Huang, and Chao-Ming Chi. 2022. "A Technical and Operational Perspective on Quality Analysis of Stitching Images with Multi-Row Panorama and Multimedia Sources for Visualizing the Tourism Site of Onshore Wind Farm" ISPRS International Journal of Geo-Information 11, no. 7: 362. https://0-doi-org.brum.beds.ac.uk/10.3390/ijgi11070362