Article

Quantitative Identification of Urban Functions with Fishers’ Exact Test and POI Data Applied in Classifying Urban Districts: A Case Study within the Sixth Ring Road in Beijing

1
College of Resources Environment and Tourism, Capital Normal University, Beijing 100048, China
2
2D Information Collection and Application Key Lab of Education Ministry, Capital Normal University, Beijing 100048, China
3
Beijing State Key Laboratory Incubation Base of Urban Environmental Processes and Digital Simulation, Capital Normal University, Beijing 100048, China
*
Author to whom correspondence should be addressed.
ISPRS Int. J. Geo-Inf. 2019, 8(12), 555; https://0-doi-org.brum.beds.ac.uk/10.3390/ijgi8120555
Submission received: 26 September 2019 / Revised: 8 November 2019 / Accepted: 1 December 2019 / Published: 3 December 2019
(This article belongs to the Special Issue Spatial Data Science)

Abstract

:
Urban areas involve different functions that attract individuals and fit personal needs. Understanding the distribution and combination of these functions in a specific district is significant for urban development in cities. Many researchers have already studied the methods of identifying the dominant functions in a district. However, the degree of collection and the representativeness of a function in a district are controlled not only by its number in the district but also by the number outside this district and a number of other functions. Thus, this study proposed a quantitative method to identify urban functions, using Fisher’s exact test and point of interest (POI) data, applied in determining the urban districts within the Sixth Ring Road in Beijing. To begin with, we defined a functional score based on three statistical features: the p-value, odds-ratio, and the frequency of each POI tag. The p-value and odds-ratio resulted from a statistical significance test, the Fisher’s exact test. Next, we ran a k-modes clustering algorithm to classify all urban districts in accordance with the score of each function and their combination in one district, and then we detected four different groups, namely, Work and Tourism Mixed-developed district, Mixed-developed Residential district, Developing Greenland district, and Mixed Recreation district. Compared with the other identifying methods, our method had good performance in identifying functions, except for transportation. In addition, the Coincidence Degree was used to evaluate the accuracy of classification. In our study, the total accuracy of identifying urban districts was 83.7%. Overall, the proposed identifying method provides an additional method to the various methods used to identify functions. Additionally, analyzing urban spatial structure can be simpler, which has certain theoretical and practical value for urban geospatial planning.

1. Introduction

Urban functions, such as residence, industries, transportation, and business, influence human activities [1]. It is natural that most of these functions do not appear individually as a single function in a particular area. Many previous studies [1,2,3,4,5] showed that these functions are coexistent, and several such relationships are often occurring within every area in cities. Each function has its own characteristics that we can easily discover through various data. Identifying urban functions and their combination precisely can give us a better opportunity to answer some important questions on the relationships between humans and urban environments, for example, in discovering different urban districts with different urban functions. Increasing amounts of data on points of interest (POIs) are becoming available online. Researchers [1,6,7,8,9,10,11] have conducted many studies on urban functions and districts that employ POIs, which are able to lead to a better understanding of individual-level and social-level utilization of urban space. Additionally, POI data can help to understand land use planning, not only at the semantic level, but also at the quantitative level.
Faced with massive POI data, there is no clear and distinct cognition about the actual meaning of an object and its function due to its vague and non-standard category. However, abundant semantic information could reflect the essence of urban functions and human activities. Additionally, we can acquire the relationship between different urban functions and spatial combinations of them through semantics [1]. It has become an interesting branch in the study of data mining, and in recent years has also become a powerful tool for extracting urban districts. These studies [1,12,13,14,15] discovered the semantic information from POIs and then identified different urban districts in accordance with semantics, replacing POI tags. For example, Guo et al. combined semantics with the number of check-ins in different time intervals and discovered urban districts [13], and Wang et al. applied the combination of semantics and origins–destinations flows to identify urban functional regions [14]. Xing et al. used semantics and built attributes to identify four different districts [15]. Another example employed a Bayesian model to connect the spatial objects and zone functions with their semantic information extracted from POIs [12]. However, the error of semantic information of POI data itself, and the increasing uncertainty from the cleaning process of semantic information might cause the results from extracting semantics in POI data to be messy and erroneous. The time cost of subsequent classification must be increased, and the results of classification are not convenient for further verification.
In reality, the tags extracted from the semantic information of POIs and the tags that POI data already have are both proxies for human activities, such as work, recreation, and residence. Therefore, the reclassification of POI categories is also a good solution to improve the accuracy of identification [16]. Quantitative methods are feasible to identify urban functions and districts with high accuracy. It is more simple-calculated and swift than extracting semantics of POIs. There are various methods applied to discover urban functions. One method was introduced by Zhao et al. to evaluate urban functions in a particular district; they applied the entropy weight and mean square deviation method to measure the functional strength of development land [10]. Another more common method is based on the density of POI tags. For instance, Zhao et al. used this method to extract landmarks [17]. Furthermore, there is an improved method based on densities, which considers the influence of the total number of each tag [6,8,9,18]. Gao et al. applied the density and ratio of POI and vehicle trajectory data to classify urban functional regions [19]. Meanwhile, there was an idea to use different indices to assess different functional districts with the number of POI and trajectory data [20]. Kang et al. combined the density and influence of POIs to identify urban functions and districts [7]. Precious few quantitative methods, even the most common one, do not consider the influence of other POI tags and other districts, which might influence how representative one POI tag in a district is.
Every POI is a geographic object representing the unique human cognition and is independent of each other. Additionally, the relationships between a POI and its function and a POI and the district it belongs to, both fit the non-monotonic functional pattern. Based on this premise and this research content, POI attributes can be transformed into binary attributes, that is, whether a POI belongs to a certain function (tag) and whether a POI is in a certain urban district. Some classical mathematical test methods, such as Fisher’s exact test (FET), stipulate that the attributes of test samples should be binary and tested in the form of a contingency table. At the same time, the usage condition of FET is consistent with the inherent characteristics of POIs. There are four parts in the calculation of FET, which can describe the density of one POI tag in a district and the influences of other POI tags and other districts. As a result, Fisher’s exact test can be used to identify urban functions. The most popular application of FET is observing what different variances influence the incidence of disease or the level of healthcare [21,22,23,24,25]. FET is also applied to detect concept drift in big data flows [26]. Another study improved FET to discover the functional dependency of genes in biological systems [27]. In geographical research, Alhazzani et al. identified how different POI tags concentrated in different urban attractors [28].
Overall, there is little research considering the influence of different POI tags and different urban districts on the results of identifying urban functions, which is an important problem because the quantity and distance of different POI tags can influence their spatial distribution and combination. Fortunately, Fisher’s exact test may be a better option for solving this problem. To address this issue, here we introduce an exact functional identification with FET and POI data to discover urban functions. Then, we calculate a functional score for each POI tag in an urban district and classify those districts based on the combination of those scores.
The contributions of this study are as follows:
  • We propose a quantitative method to discover urban functions by a statistical significance test, Fisher’s exact test, which can combine the relative functions and relative districts efficiently.
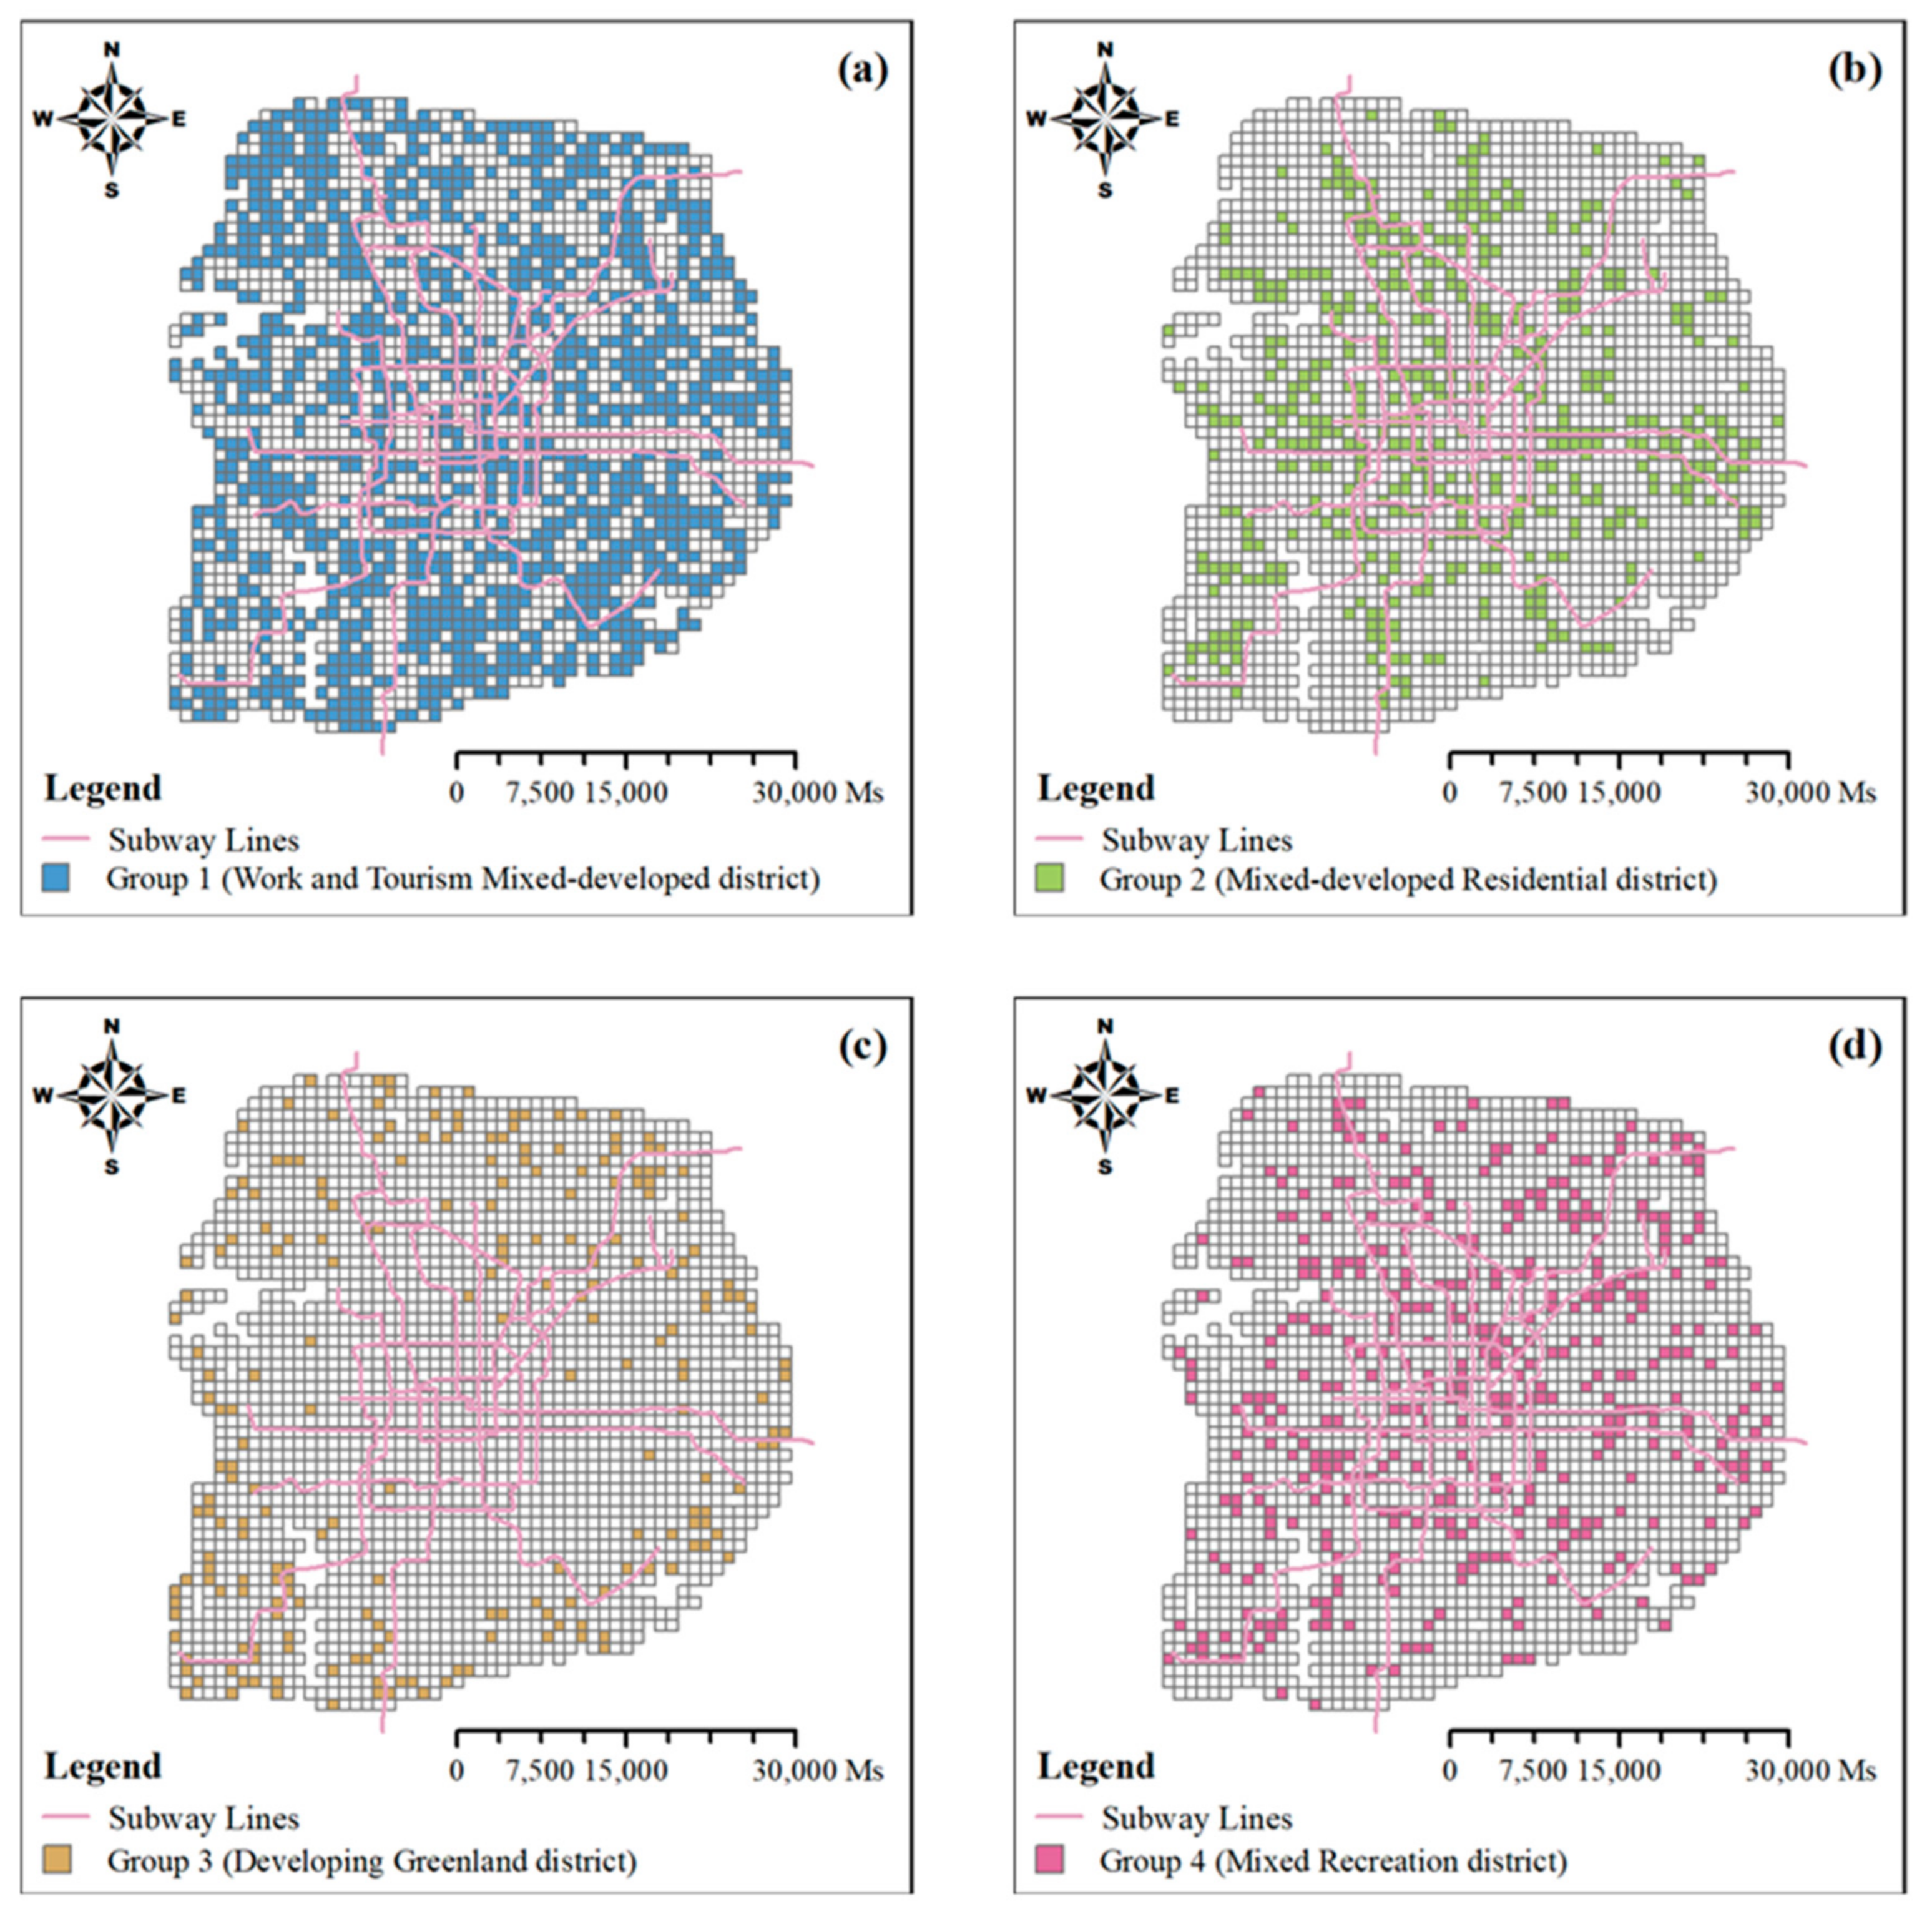
  • We run a k-modes clustering algorithm to classify all urban districts according to the functional scores and their combination in one district and detect four different groups in the study area.
The remainder of this article is structured as follows. Section 2 discusses the datasets used and the selection of the study areas. Section 3 introduces the methods used in our study. In Section 4, we present the results of clusters and compare urban districts and classification accuracy. Next, we discuss the evaluation of identification using the functional score and some broader thinking in Section 5, before concluding and pointing out directions of future work in Section 6.

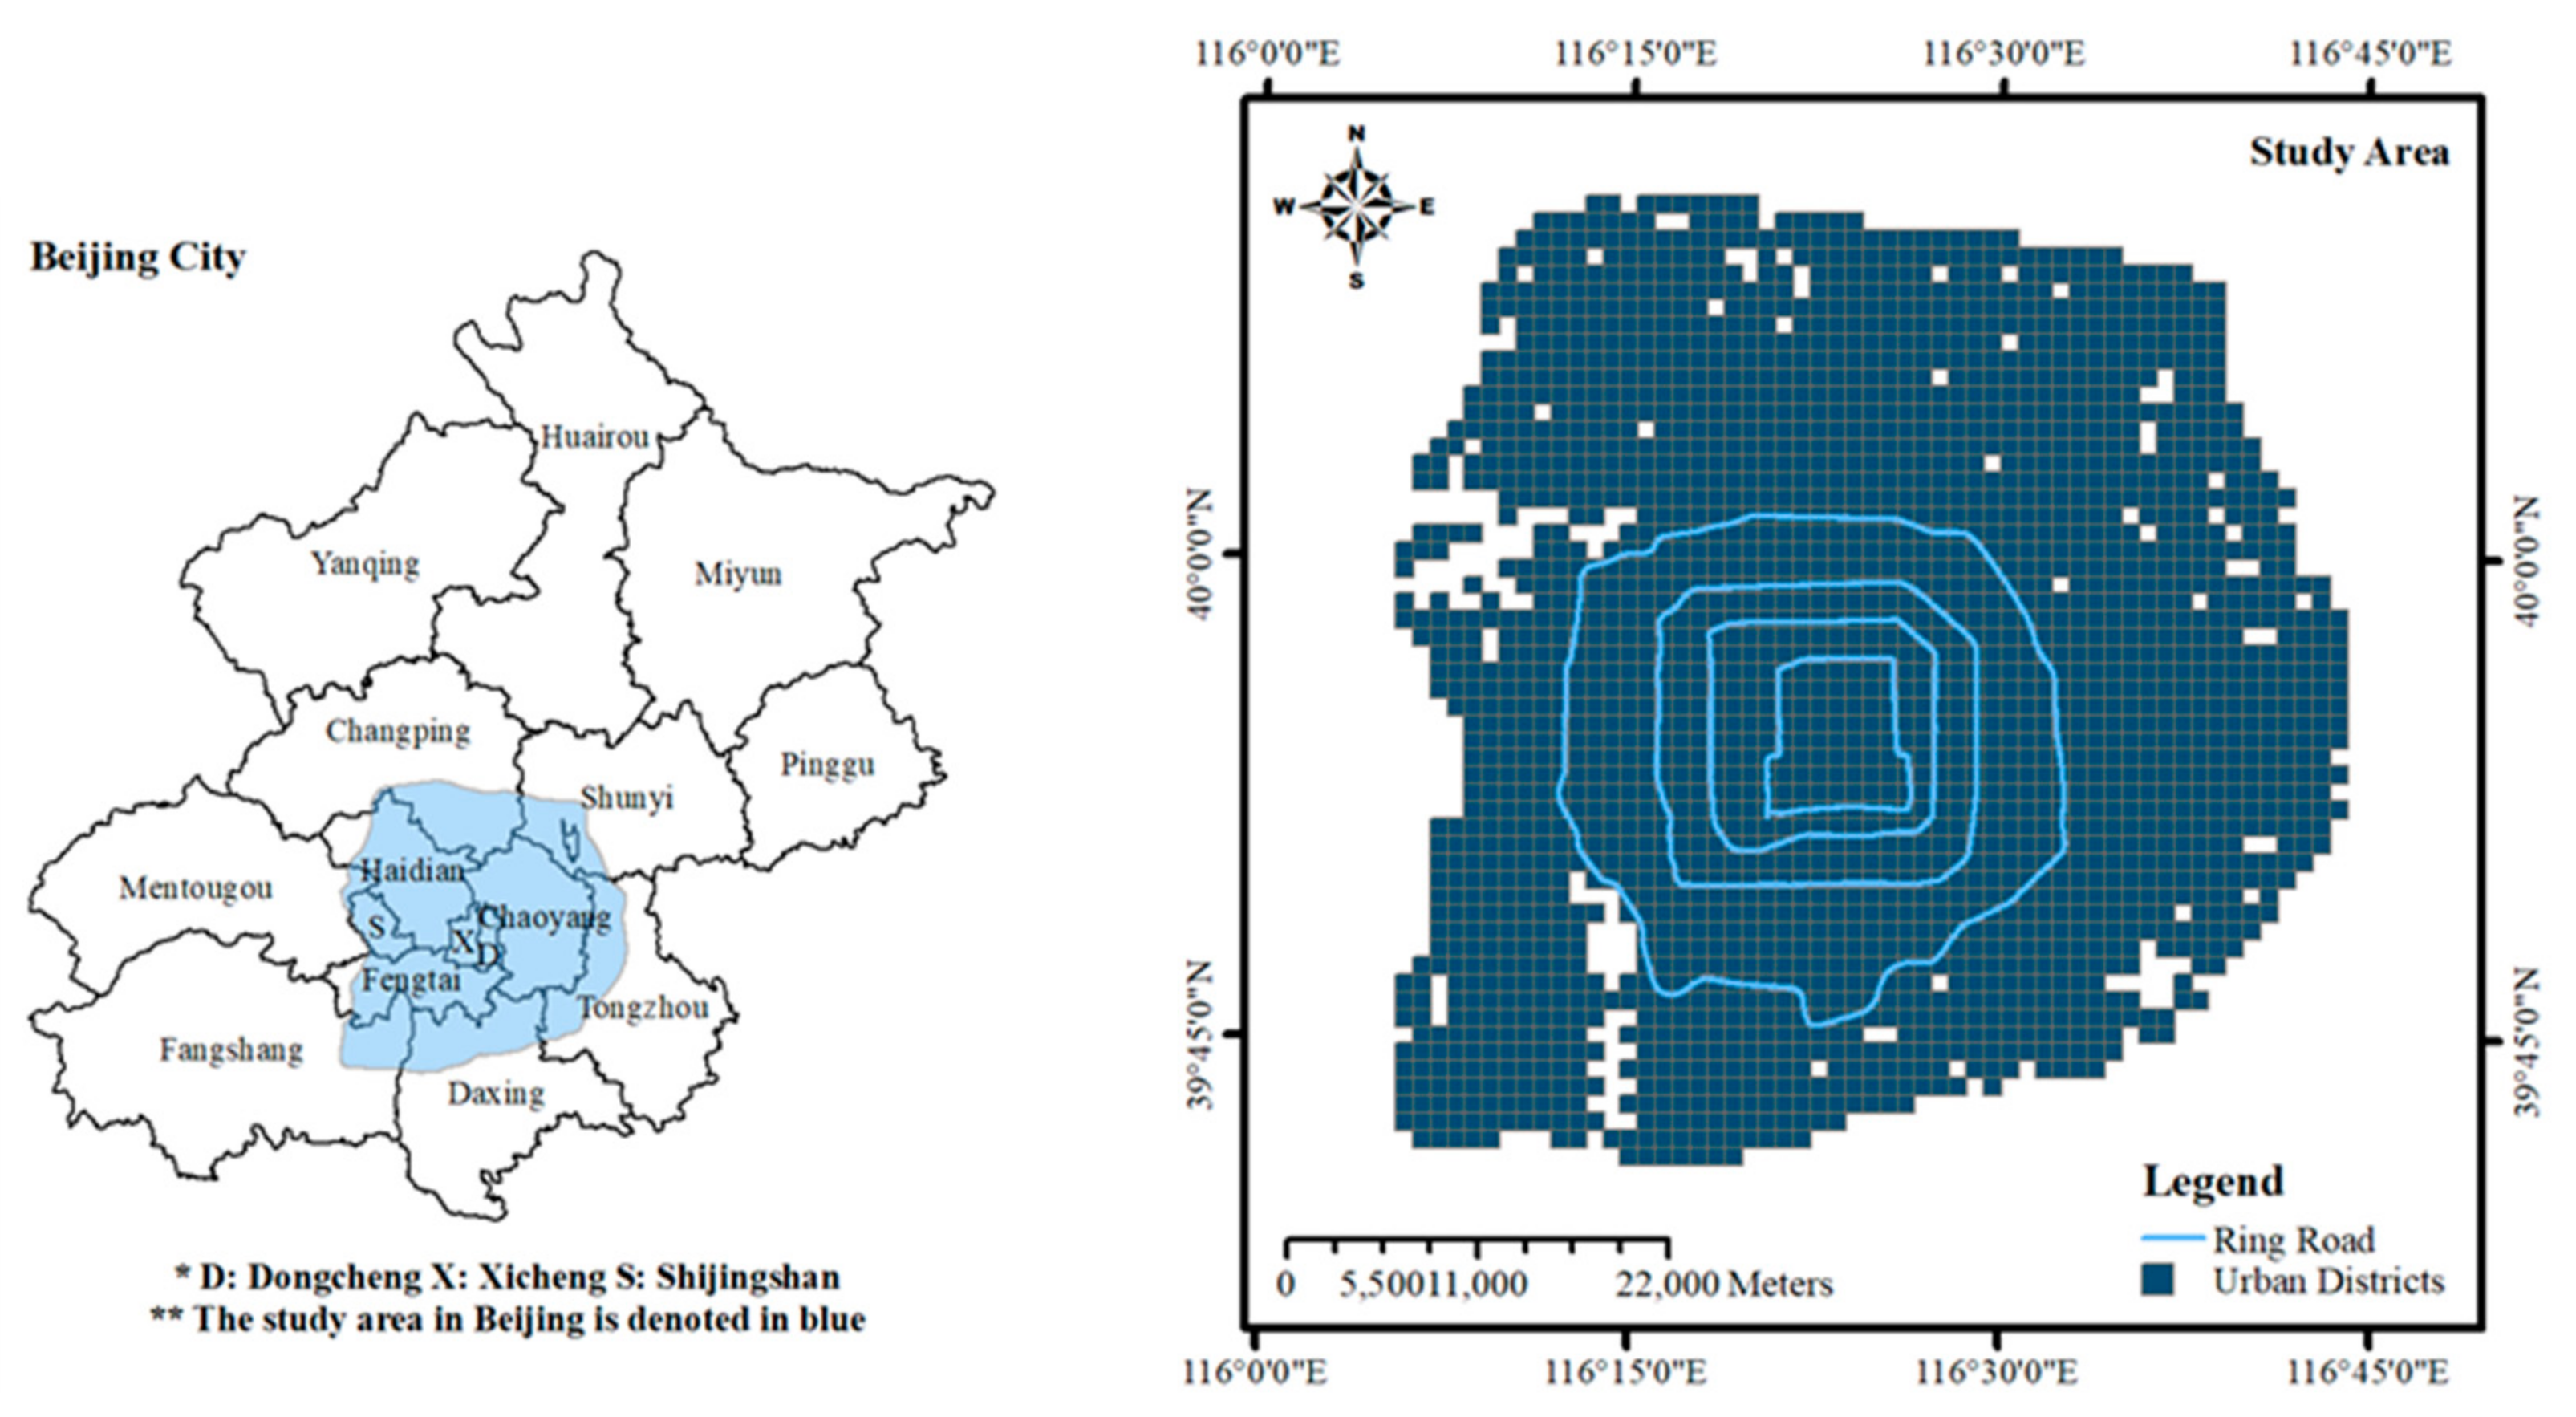
2. Study Area and Datasets

2.1. Study Area

As the center of politics, economy, technology, and transportation in China, Beijing attracts attention from all over the world. Additionally, it is a suitable area with various and complete urban functions, so we selected this city as our study area. Specifically, the area is within the 6th Ring Road in Beijing, including the six main administrative districts, which are also part of the suburbs. This area is the main region for human activity, with a huge population and relatively convenient public transportation and road networks. Traditionally, 500 m, or a walking time of less than 6 min, is used to define the walkability of an area [14]. Considering the scale of human activity and spatial distribution of functions, we considered 1000 m (500 m × 2) as the research diameter and divided the whole study area into regular grids (1000 × 1000 square meters). After removing grids that did not include any POIs, we regarded the remaining 2343 grids as our basic research units (Figure 1).

2.2. Data Prescription and Preprocessing

2.2.1. POI Dataset

Human activity always has different categories, which can be seen as different functional tags in people’s lives, such as workplaces, restaurants, entertainment, schools, and so forth. For the sake of location and geographical representation, point of interest (POI) has recently become a popular expression in this digital age. POI is an abstract point that represents the object in the real world. It can also be understood as a position that is easily found, which people are interested in, and which is a basic geographic entity that is used for navigation, smart transportation, and location-based services. We employed the POI dataset from BaiduMap API, which includes 383,327 POIs in the study area from 2016. Each POI in the dataset has its own attributes, such as name, location, latitude, longitude, category, and so forth.

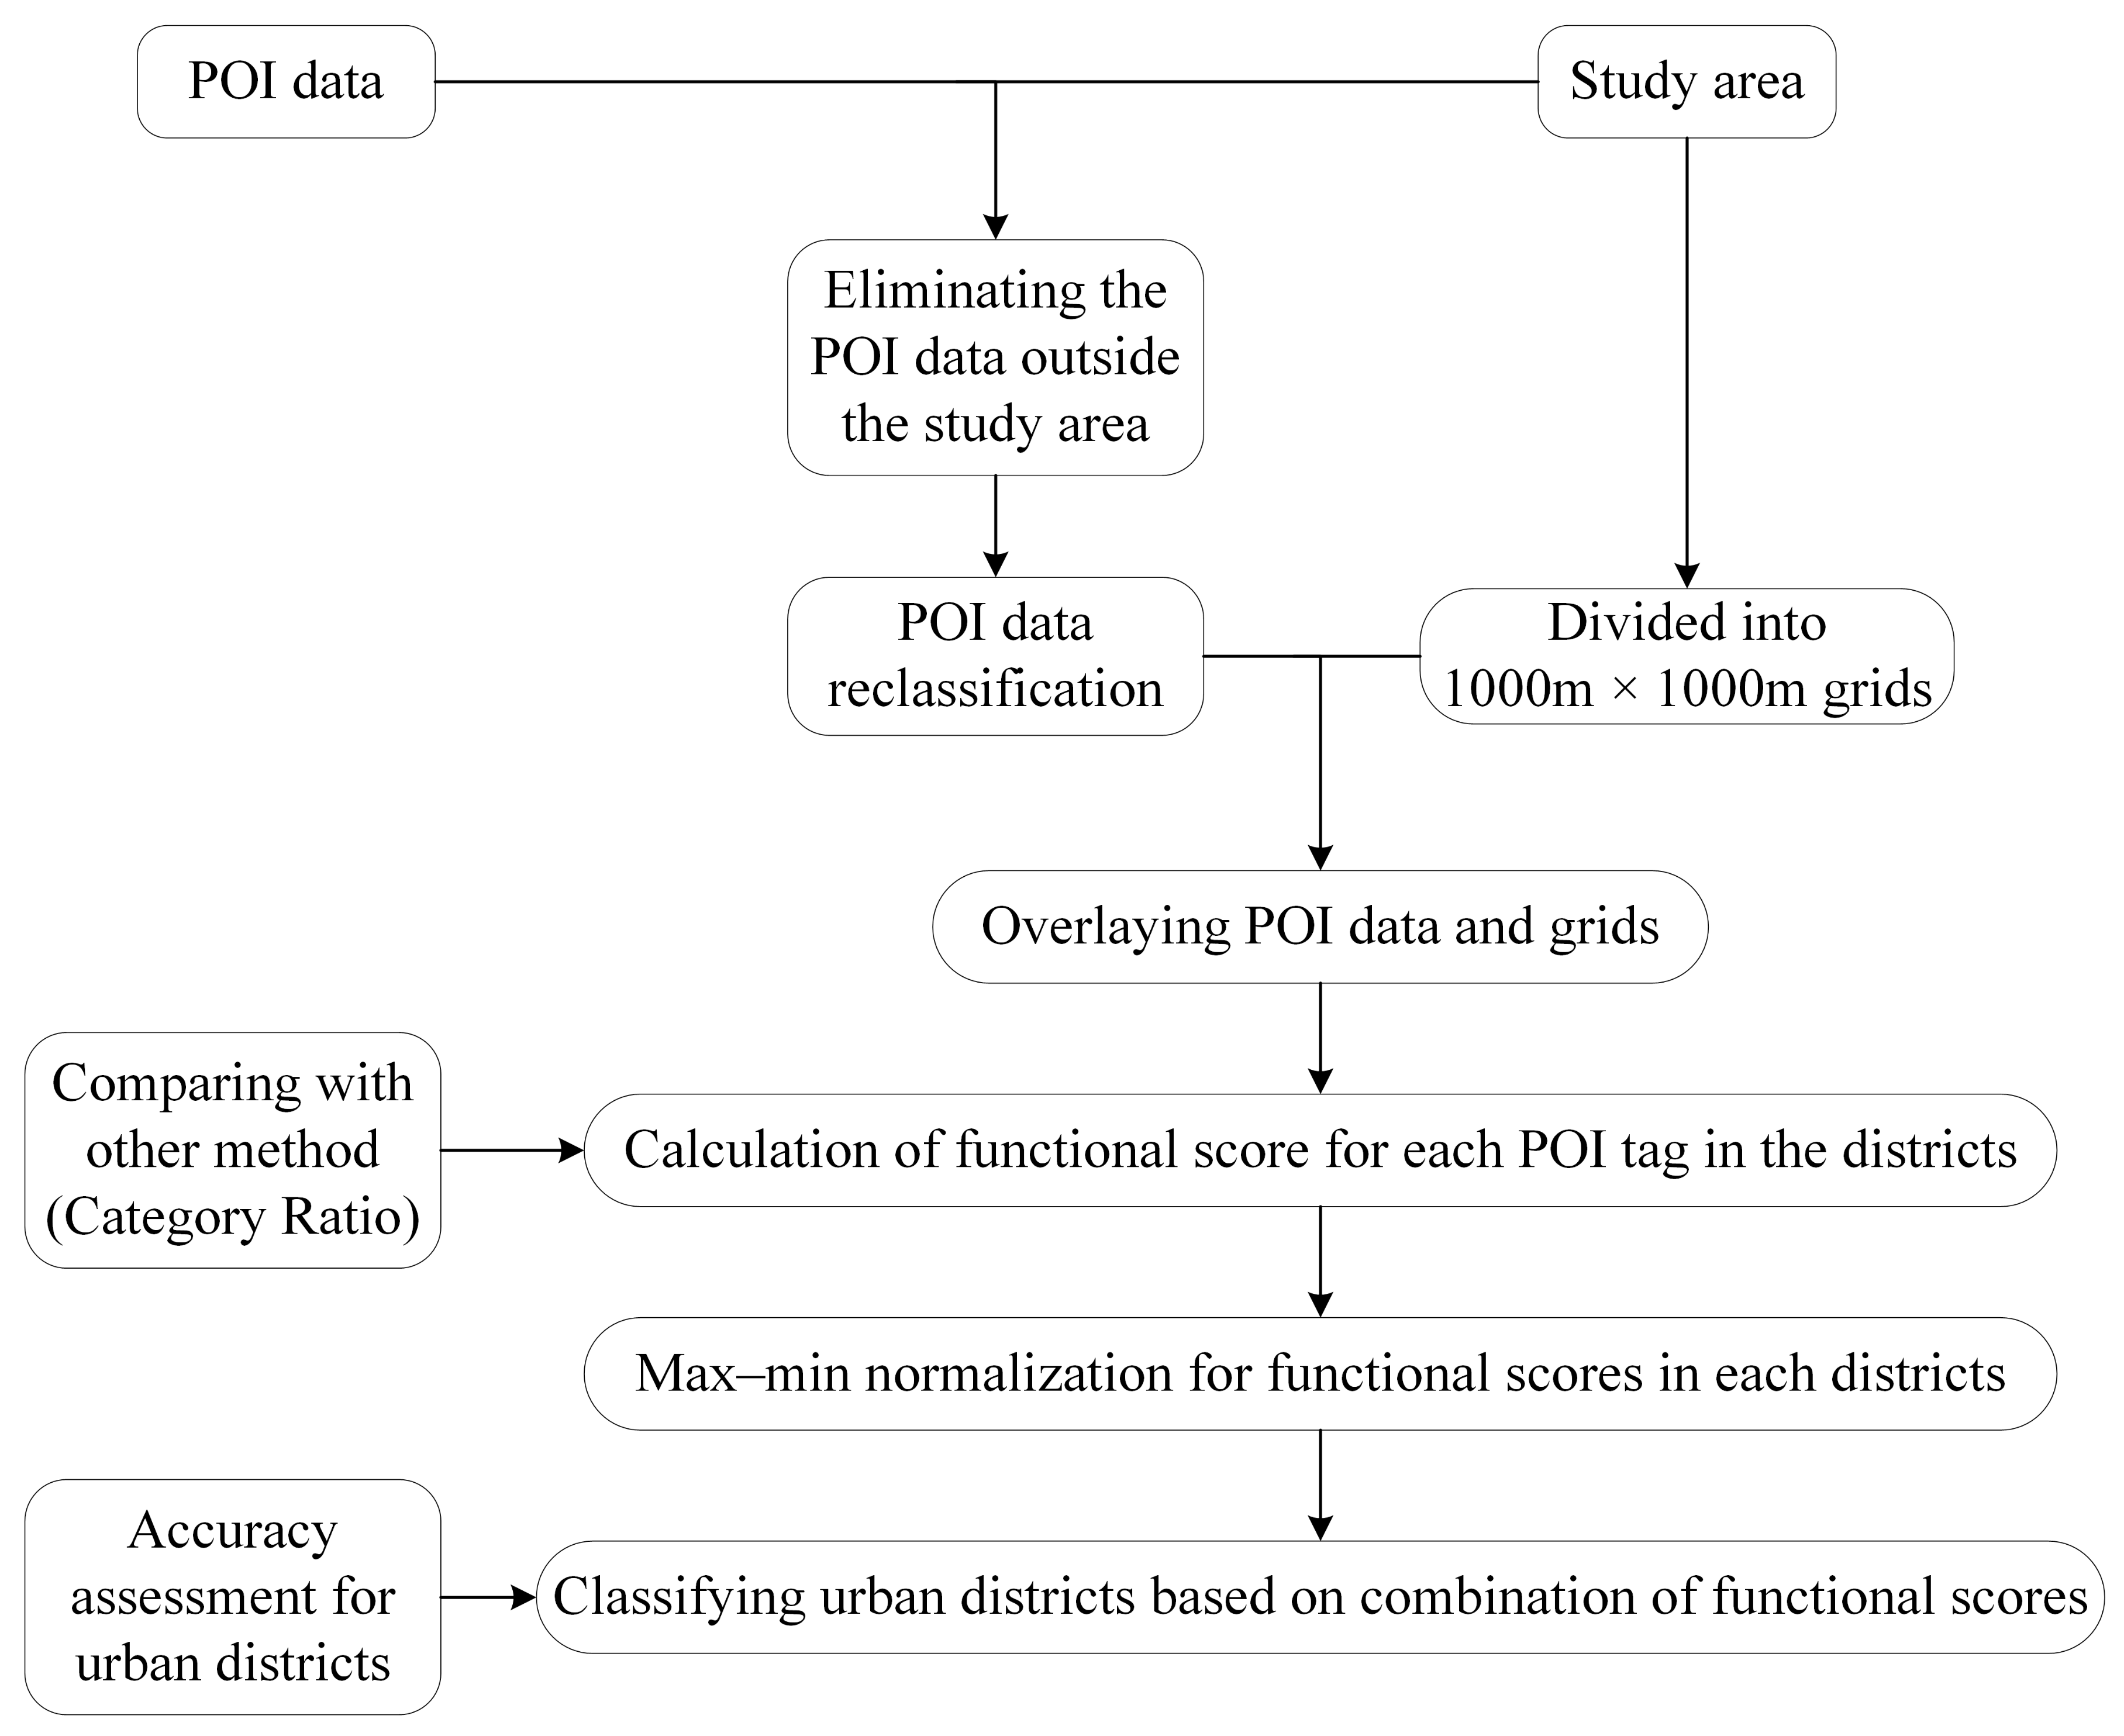
2.2.2. Data Preprocessing

The raw POI classifications included sixteen categories, and each category also included several sub-categories, which were vague and redundant. Considering the specific needs for urban functions, we reclassified those POIs into 10 categories after removing some infrastructure (like toilets and ATMs) that have little influence on people’s daily lives. Each new category clearly expressed urban functions that human activities need. Table 1 shows the previous and the current tags after reclassification.

3. Methods

The flowchart of our work in this paper is illustrated in Figure 2. The purpose of our study is identifying urban functions using Fisher’s exact test and POI data, and then classifying the urban district in accordance with the combination of functions. In this study, four steps were included: data preprocessing (POI data reclassification, dividing the study area into urban districts, overlaying POI data and urban districts), calculation of functional score, normalization for functional score, and classifying urban districts. At the same time, we also compared our proposed method and another method (category ratio) for identifying urban functions.

3.1. Calculation of Functional Score

POI data are considered to represent the urban function that has an exact geographical location. Each POI has its own tag independent of the others. Our aim was a simple and quick calculation using Fisher’s exact test, named functional score, to identify urban functions in a district. At the beginning, there were two prerequisites of Fisher’s exact test that needed to be clear. One was that each POI had to be independent of each other. A spatial autocorrelation test (Global Moran’s I) is involved to prove the independence of each POI. The result of test shows that the Moran’s index is 0.0510 and the z-score is 25.5841, which means that there are few spatial correlations between POIs and the result is significant. Another was that there had to be two attributes for each POI in every calculation, whether a POI belonged to the tag of one calculation involved or not, and whether a POI belonged to the district of one calculation involved or not. Therefore, the p-value (the result of Fisher’s exact test) provided us with a clear view of how one POI tag aggregated in the district. The degree of collection can be seen as the density of the POI, which means the “target” tag in the “target” district is more aggregated compared with that in other districts or other tags in the same district. However, there is a problem that the degree of collection of POI tags in one district might be similar. Only using the p-value cannot mark off the density of two different tags. Fortunately, odds-ratio and the frequency of the POI tag can help to distinguish the degree of collection. As a result, a functional score was introduced in this study, and it was made by three statistical features: p-value, odds-ratio, and the frequency of each POI tag.

3.1.1. p-Value

p-values were derived from Fisher’s exact test. Section 1 mentioned that the relationships between a POI and its function and a POI and the district it belongs to produce an effect on how representative the POI tag in a district is. The association of different POI tags can measure the functional dependency, and furthermore can be used to answer some important questions, for example, the functional combination in urban districts.
Fisher’s exact test (FET) is a statistical significance test for independence, as opposed to association, in 2 × 2 contingency tables (Table 2) proposed by Fisher in 1934; a typical situation where such tables arise is where we have counts of individuals categorized by each of two dichotomous attributes [29].
In a general 2 × 2 contingency table, as seen in Table 2, A means that there are A objects fitting variance one and variance two, and the objects that fit variance two and non-variance one are B. C means the number of objects that fit variance one and non-variance two, and D is the number of objects that do not belong to either variance one or variance two. Then the hypergeometric distribution for the observed cell values has an associated probability. To perform the test, one calculates these probabilities for all possible A values, and the p-value is computed to express the probability of objects that belong to variance one and variance two (observed), which is:
p v a l u e = A + C ! A + B ! B + D ! C + D ! A ! B ! C ! D ! A + B + C + D !
Therefore, the p-value calculated from Fisher’s exact test is suitable for our study to assess urban functions. We employed this test as a measurement rather than its previous role. This is because: 1) It would give a probability of the number of a POI tag in a district, which means the degree of collection of this tag in a spatial region; 2) It works for small as well as large observations and calculates the exact probabilities rather than approximations, such as in the Chi-square test [28]. This low p-value provides very strong evidence of association. In our study, variance one is one POI tag, and variance two is one specific district. Therefore, A in Table 2 is the number of one POI tag in one district, B is the number of other POI tags in the same district, C is the number of the same POI tags in the other districts, and D is the number of other POI tags in the other districts. P t , g represents the p-value of the POI tag t in g district we used in this study, the equation of which is as follows:
P t , g = N t ! N g ! N N t ! N N g ! n t ! N t n t ! N g n t ! N N t N g + n t ! N !   t = 1 , 2 , , 10 ; g = 1 , 2 , , 2343
where n t means the number of POI tags t in g district; N t represents the total number of POI tags t in the whole study area; we used N g to express the total number of POIs in g district; and finally, N is the total number of POIs.

3.1.2. Odds-Ratio

Since it might happen that the two different tags in the same district have similar p-values, we need another index to evaluate which p-value is more reliable. In recent years, odds-ratios have become widely used in medical reports. The odds-ratio is introduced as the ratio of the probability that the event of interest occurs to the probability that it does not [30]. We selected it for evaluation because it provides a confidence degree for the p-value, and the result of the p-value is more reliable when the odd-ratio is higher. Equation (3) shows that the odds-ratio is calculated by A, B, C and D from Table 2, and O t , g (Equation (4)) is seen as the odds-ratio of the POI tag t in g district:
o d d s r a t i o = A × D B × C
O t , g = n t ! N N t N g + n t ! N t n t ! N g n t !   t = 1 , 2 , , 10 ; g = 1 , 2 , , 2343
where n t means the number of POI tags t in g district; N t represents the total number of POI tags t in the whole study area; we used N g to express the total number of POIs in g district; and finally, N is the total number of POIs.

3.1.3. The Frequency of each POI Tag

The third statistical feature is the frequency of each POI tag. It calculates the rate of one tag that happens or is repeated in a district. This part helps our functional score focusing more on the intra-regional distribution of POIs. Due to its rich application in identifying functional districts in cities, we borrowed the idea and defined F t (the frequency of each POI tag) as a weight as one part of the functional score; the equation of F t is as follows:
F t = n t N t   t = 1 , 2 , , 10
where n t means the number of POI tags t in g district; N t represents the total number of POI tags t in the whole study area.
All three features are introduced in detail and we mixed them to obtain our functional score S t , g ; the final equation is a follows:
S t , g = O t , g × F t P t , g   t = 1 , 2 , , 10 ; g = 1 ,   2 , , 2343

3.2. Max–Min Normalization

Generally, a normalization is needed before data classification. The normalization is used to scale data to a specific range; most normalization methods set this range as [0,1]. Normalization can remove the unit limitation of data and transform it into a dimensionless value, which is more suitable for comparison of data with different units or orders of magnitude. After the process of normalization, the accuracy of classification of data is greatly improved, especially for those algorithms based on distance. There are many normalization methods, such as max–min normalization and zero-mean normalization. Max–min normalization is the most common one with wide applications. This method is suitable for such data that do not fit in with Gaussian distribution, and it can smooth high-deviation data. Due to the sharp fluctuation of functional scores of each function in the districts, max–min normalization was selected as a pre-process before classification in our study. It is a linear transformation for the original data, and the new range of data became [0,1]. Equation (7) shows the max–min normalization:
x = x m i n m a x m i n
where x means the result after max–min normalization, x means the original data, m a x means the maximum data in the datasets, and m i n means the minimum data in the datasets.

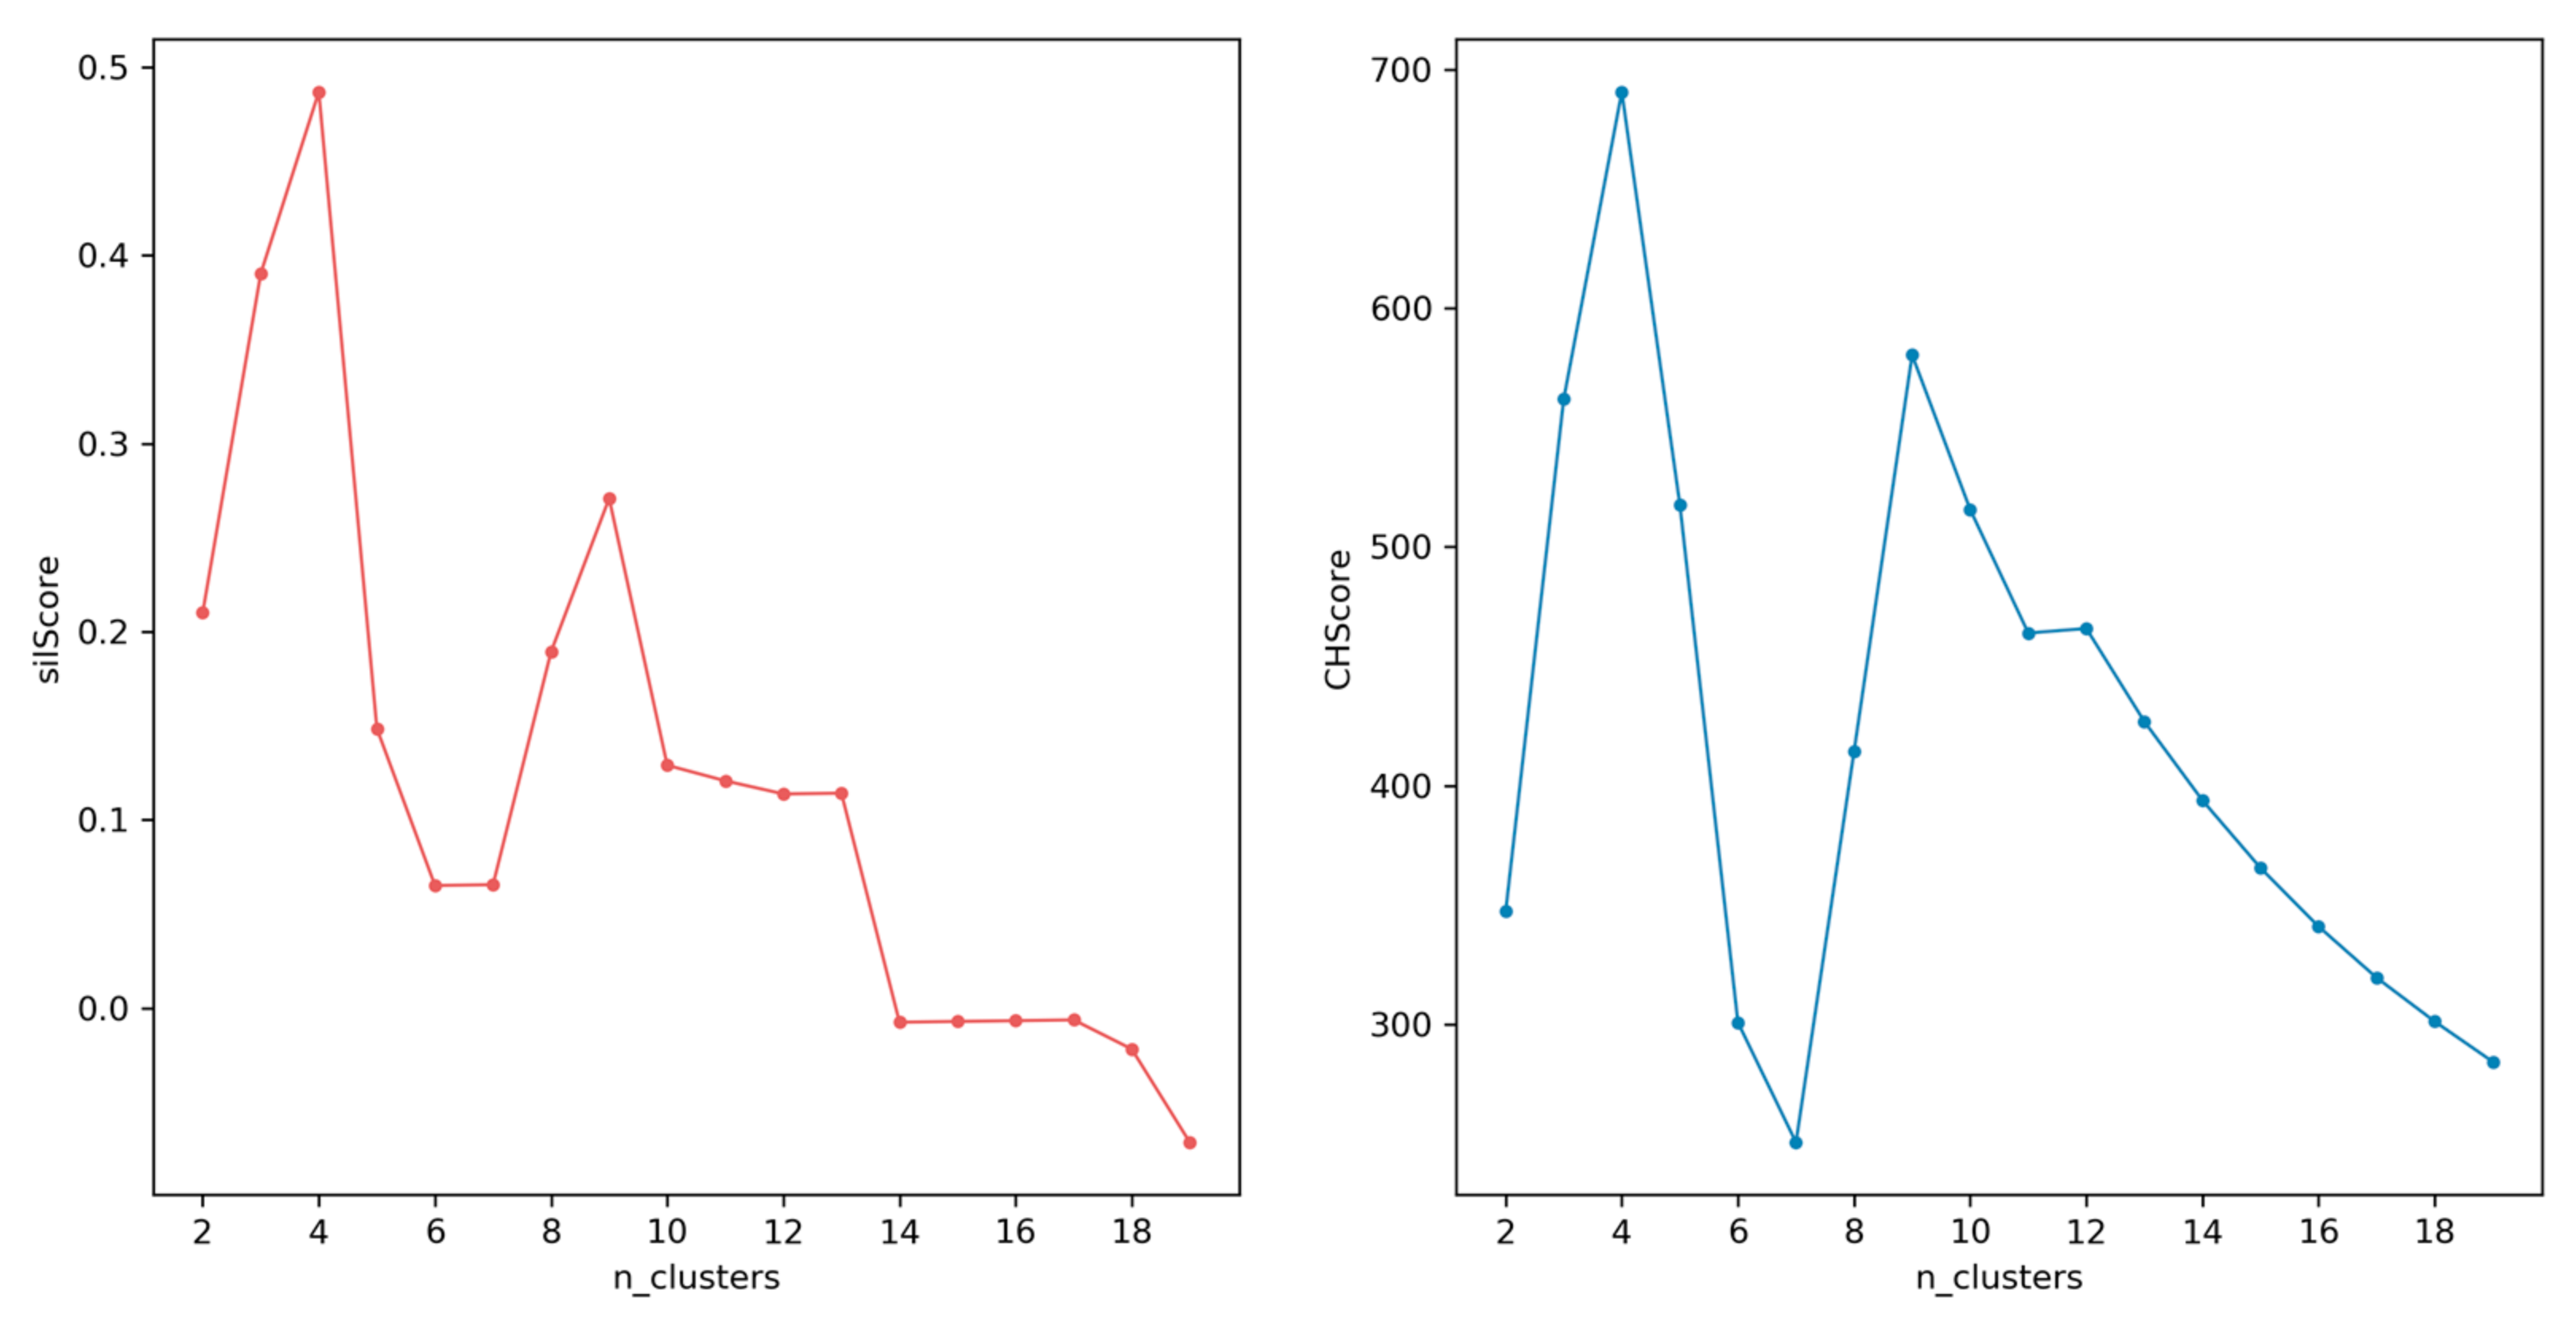
3.3. K-Modes Clustering Algorithm

We already calculated the functional score of each POI tag in a specific district. Considering the distribution of different POI tags in a particular district makes it possible to discover something new by combining these scores in the district. Previous studies showed that the k-means clustering algorithm had good performance in classifying urban districts, which is well known for its efficiency in clustering large data sets [1,7,11,13,31,32]. However, in our study, k-means could not run a proper result with clear boundary between clusters. This was because our functional scores in a district had very different value between the maximum and the minimum, even scores that had passed normalization processing. In addition, the categories of POIs were large, which caused k-means algorithm failed, like large categorical data sets are frequently encountered in such areas as data mining. Huang improved the k-means algorithm and proposed a k-modes algorithm in order to decrease the processing time of large categorical data [33], which is a frequency-based method [34]. The new method uses a simple matching dissimilarity measure for different categories for clusters. As a result, we chose the k-modes clustering algorithm to identify urban districts in our study.

4. Results

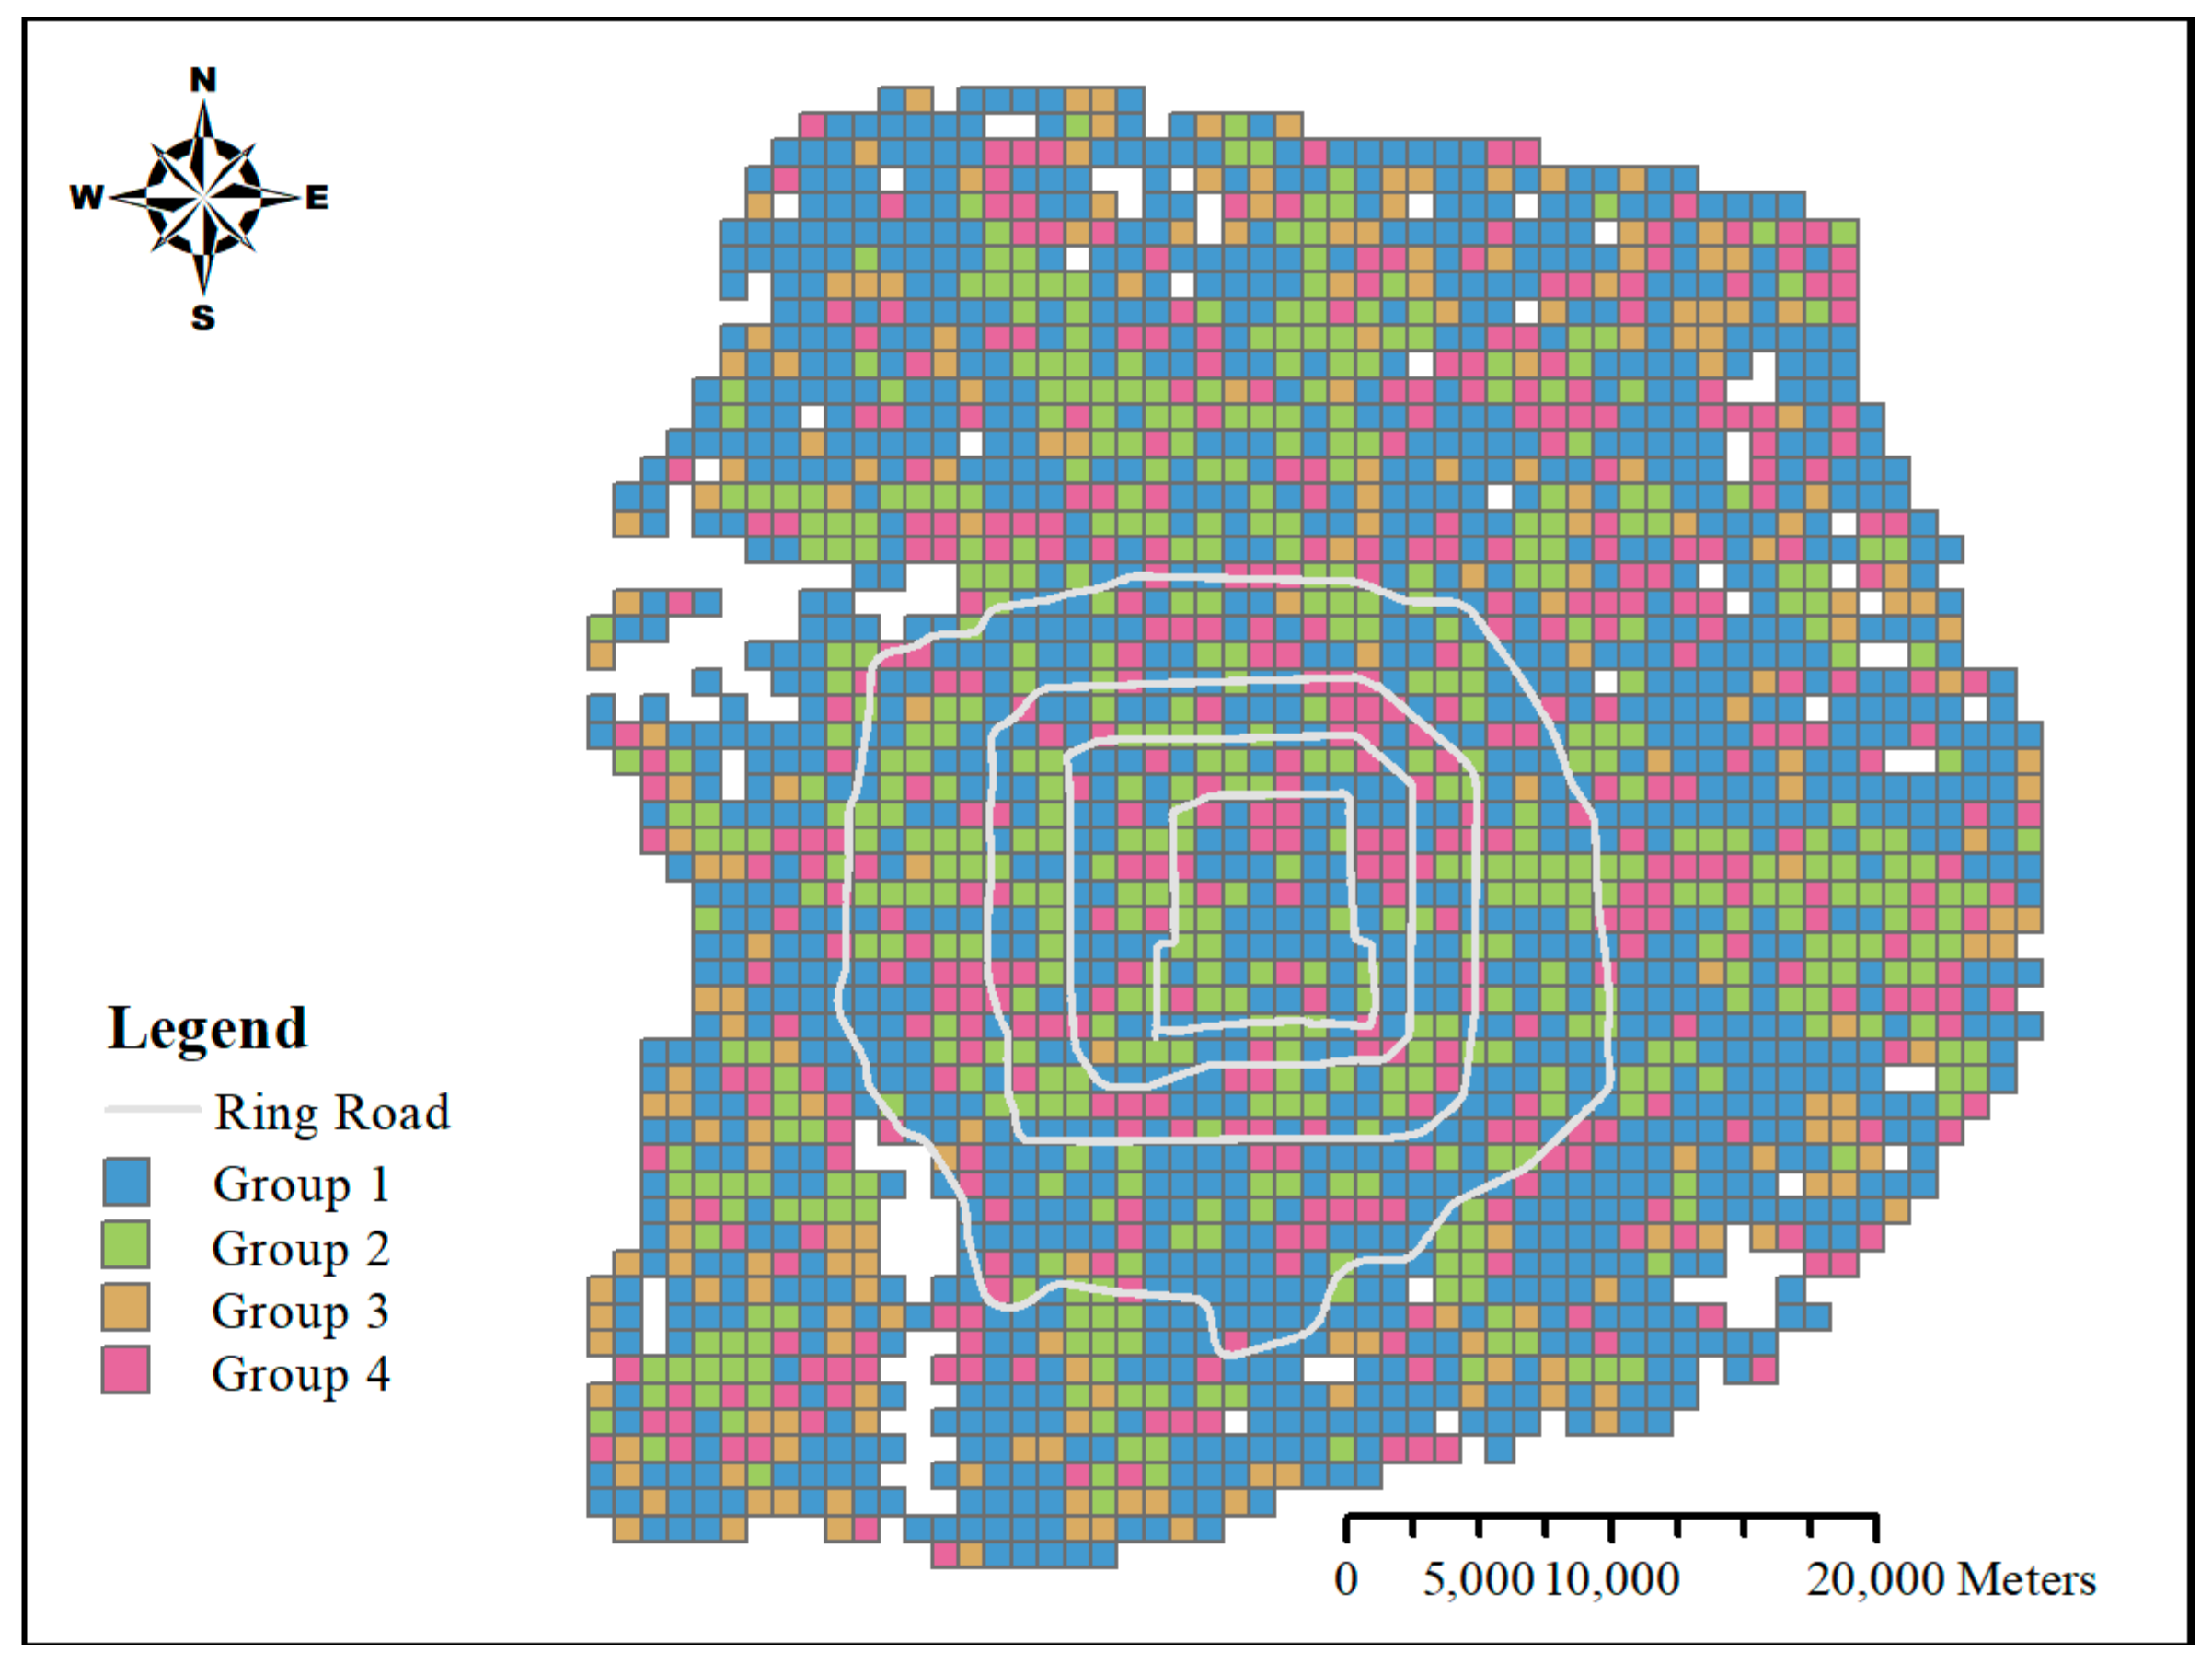
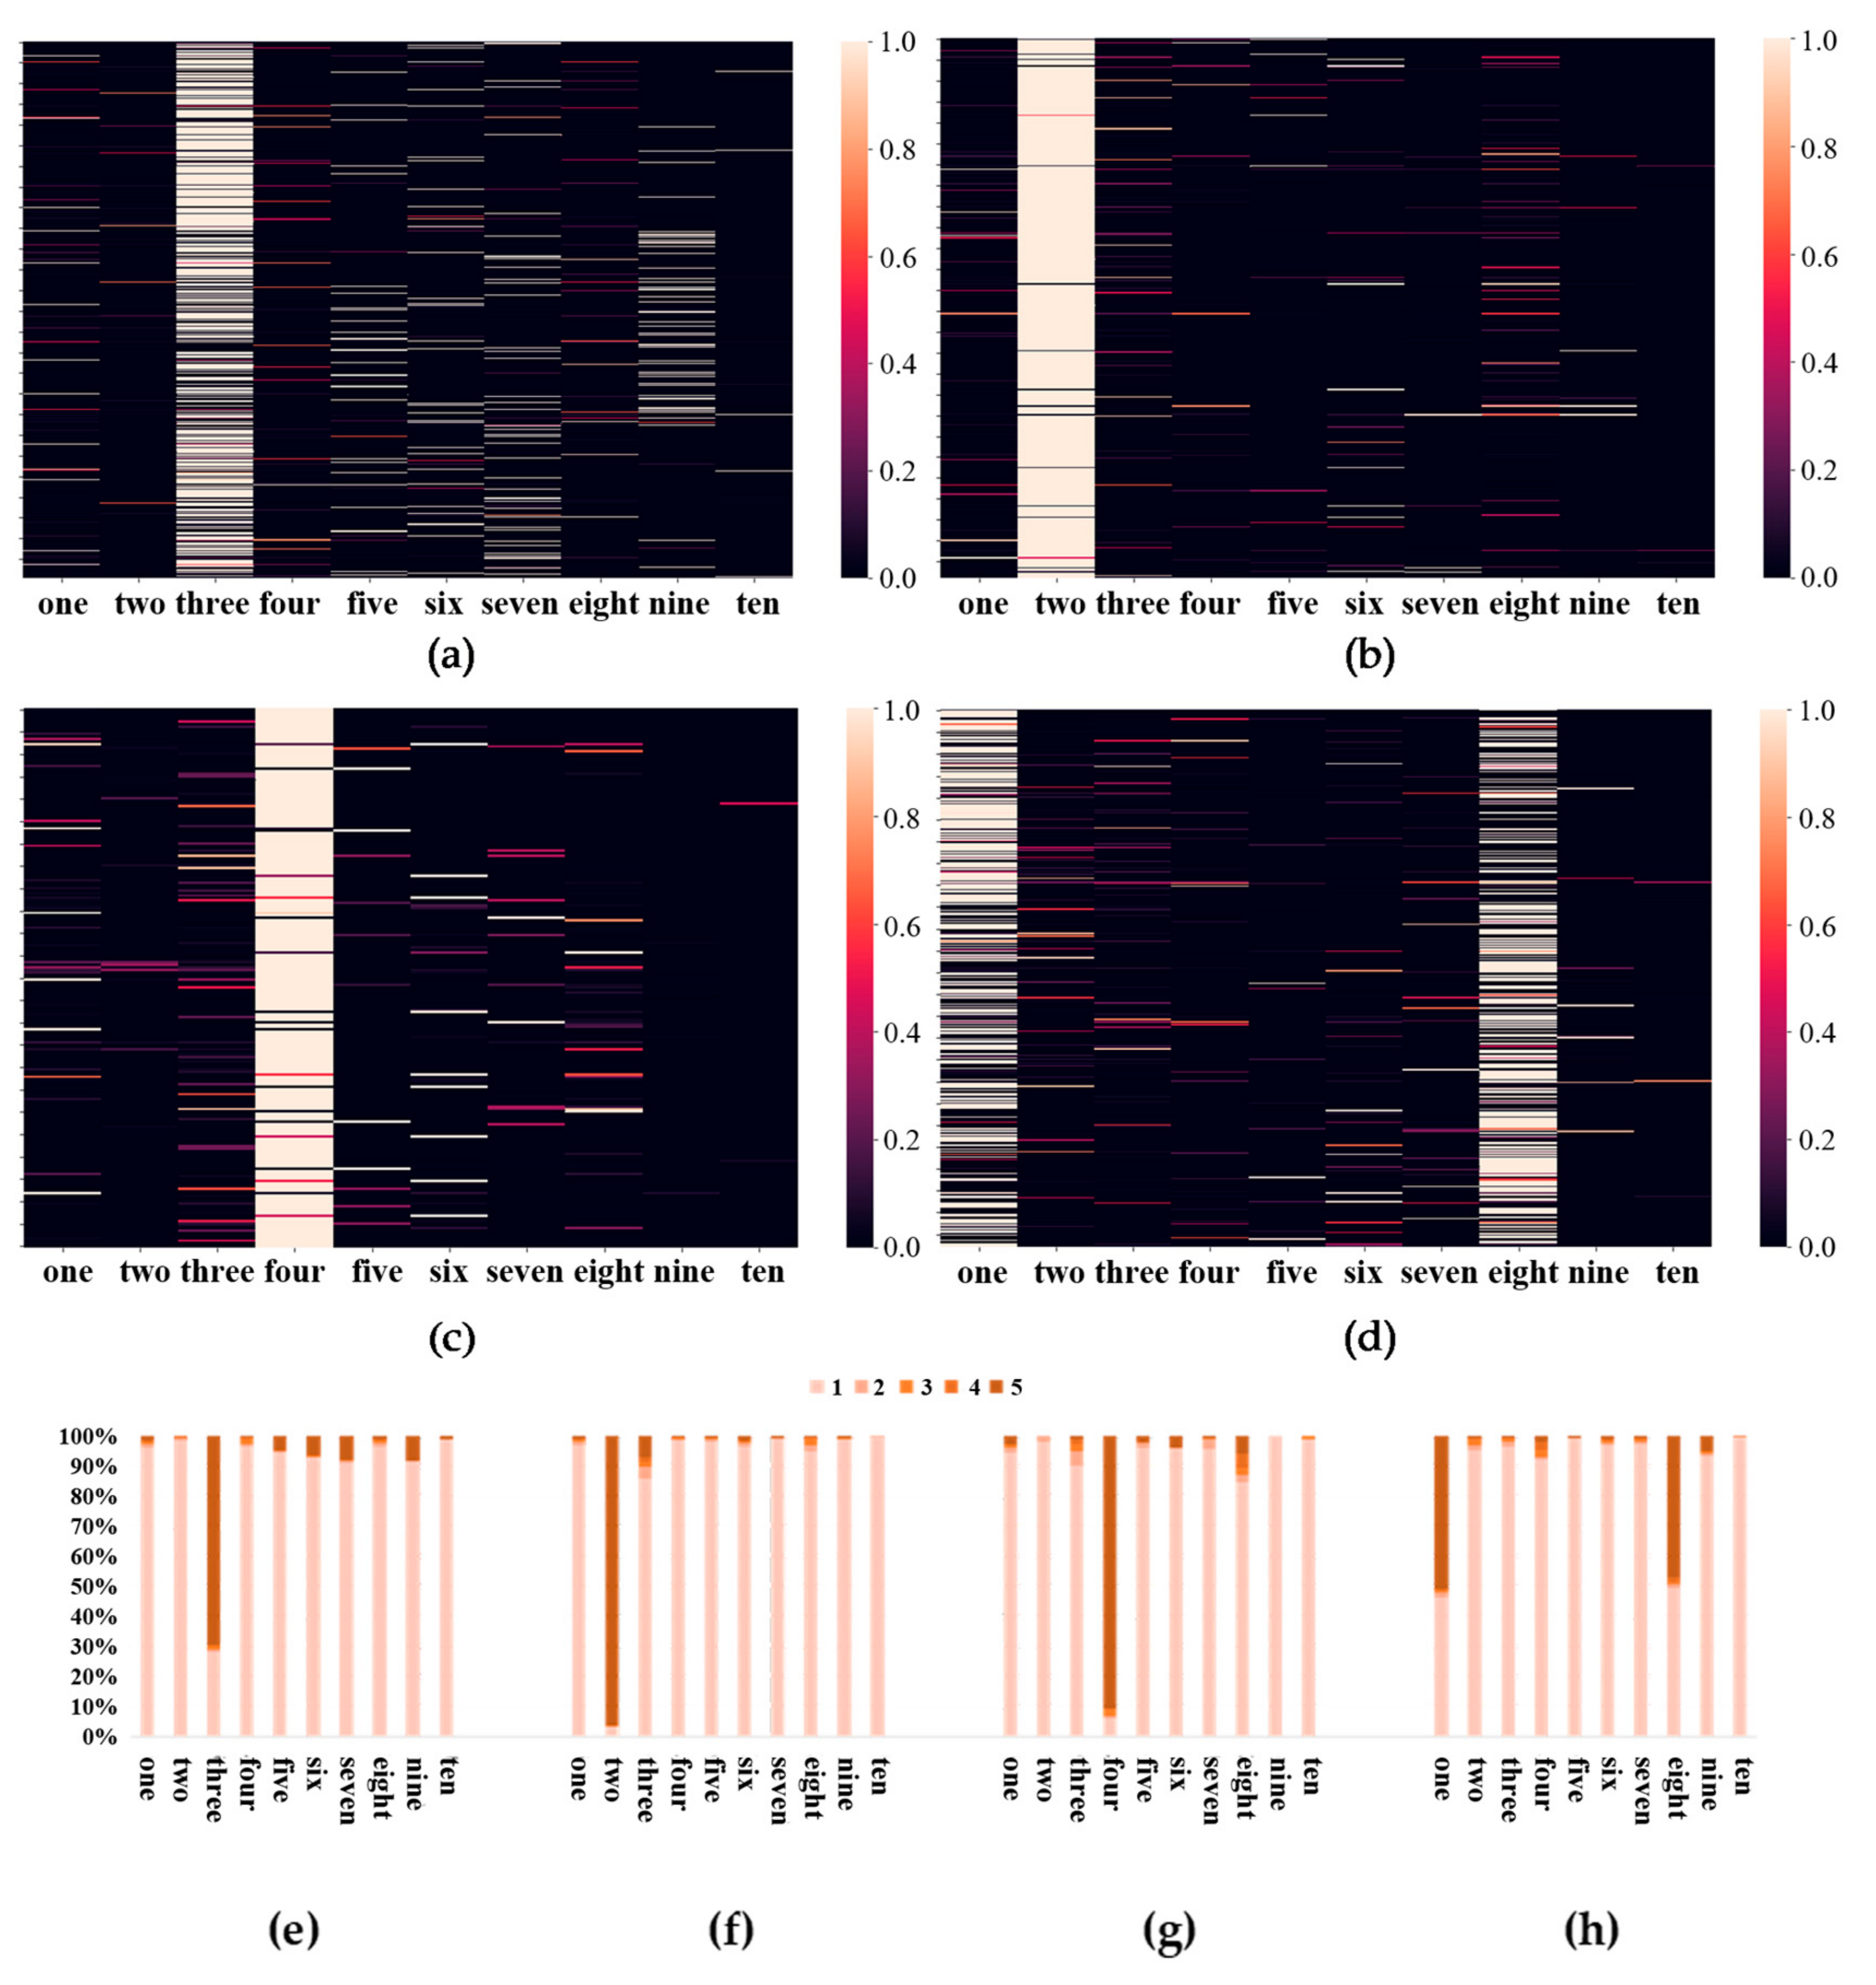
4.1. Classification of Urban Districts

As explained in Section 3, we first ran a Python program to calculate the functional score of each tag in a district. Then, the max–min normalization would be involved before classifying urban districts based on the combination of functional scores. Table 3 illustrates an example of the combination of functional scores in a district.
Since the k-modes clustering method needs a given number as the number of clusters, the most essential step is choosing the number of clusters properly. Evaluating the performance of a clustering algorithm is not as trivial as counting the number of errors or the precision and recall of a supervised classification algorithm. Some measures require knowledge of the ground truth classes, which is rarely available in practice, or requires manual assignment by human annotators (as in the supervised learning setting), which others like the Silhouette Coefficient and Calinski-Harabasz index do not need. Obviously, data we used in this study did not have exact true values. We only evaluated the performance of different k as the total number of clusters for urban districts using two common measures, as we mentioned above. The first one, Silhouette Coefficient, was proposed by Rousseeuw [35]. The Silhouette Coefficient score is bounded between –1 for incorrect clustering and +1 for highly dense clustering, where a higher score relates to a model with better defined clusters. Another index was introduced by Caliński and Harabasz [36], which is faster to compute. Just like the Silhouette Coefficient, higher scores mean that better clusters are obtained. Figure 3 shows the results of the two measures, evaluating how many clusters make the k-modes clustering perform better by setting the range of value k from 2 to 20 [11,31]. Fortunately, both results indicate that the scores peak at the highest value when k = 4. We selected k = 4 as the ideal k value for further analysis and validation, where a different color indicated a different urban district category, as shown in Figure 4.

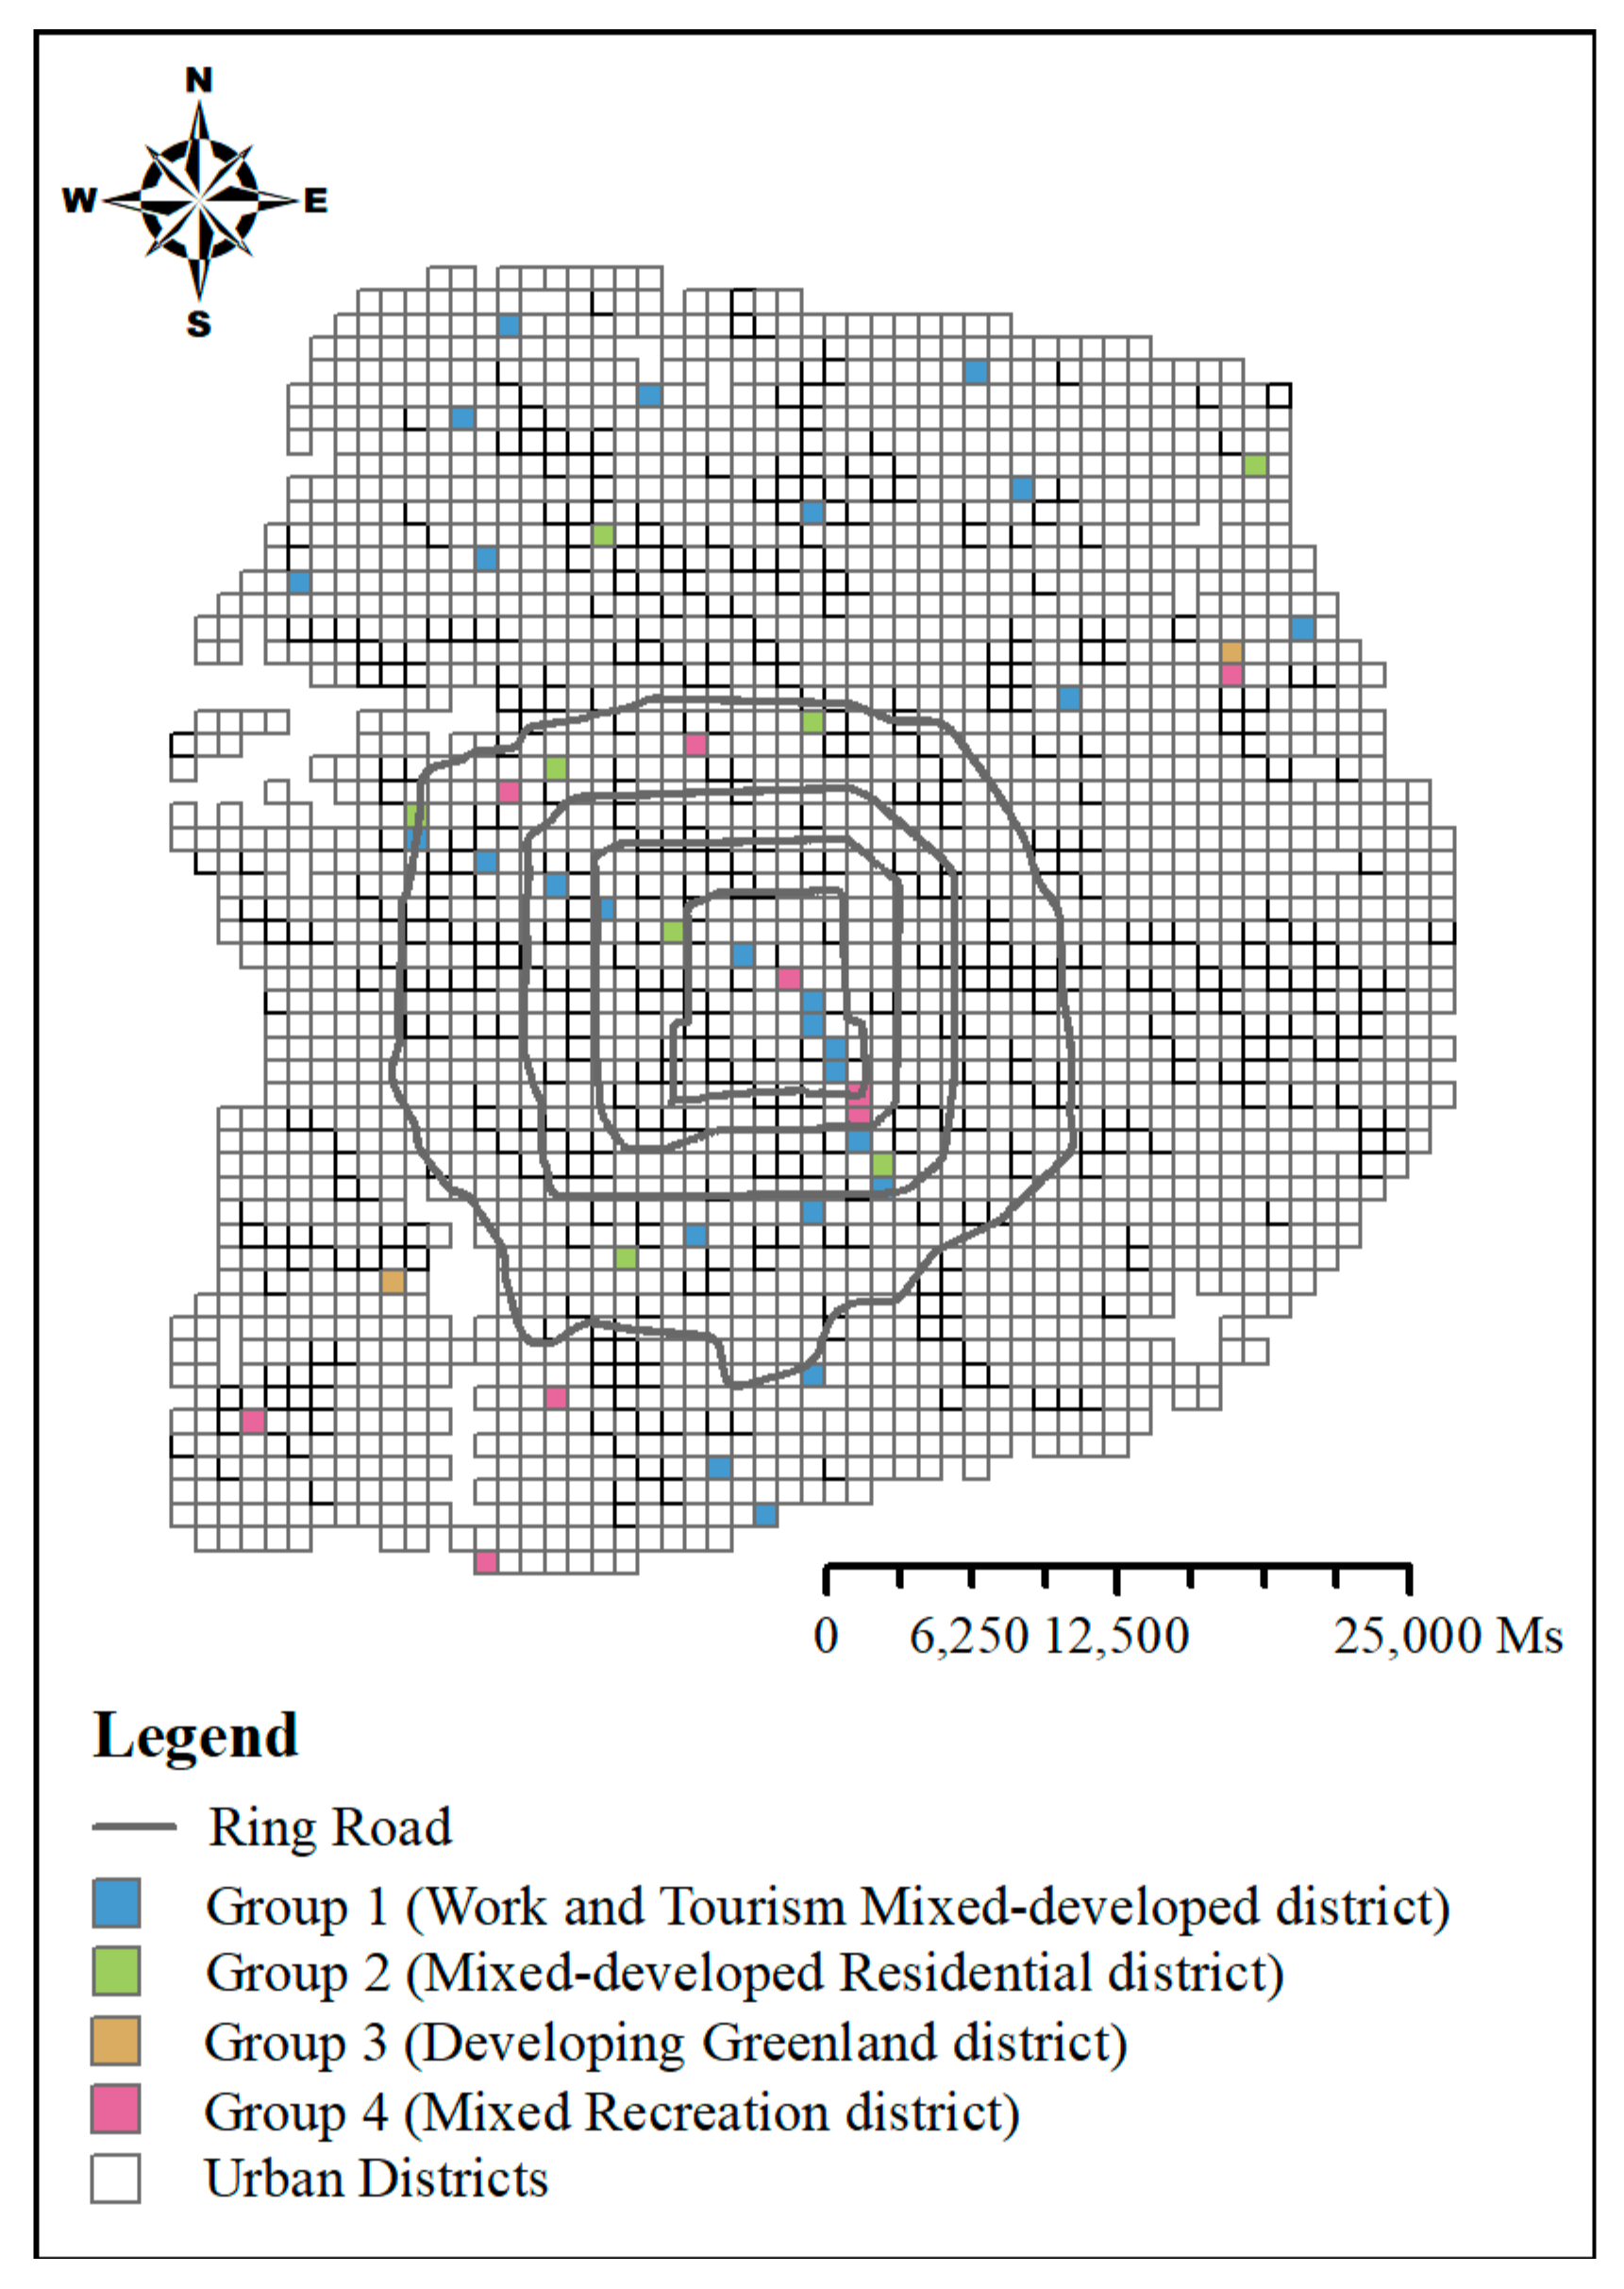
4.2. Identification and Annotation of Urban Districts

As shown in Figure 4, we could see four different groups of districts with different characteristics. Different groups with different functions were located at different area. In this study, we referred to the location of Sixth Ring Road in Beijing and the subway lines within the study area, combining the mixed degree of combination of functions in the districts; four groups were tagged as Work and Tourism Mixed-developed district, Mixed-developed Residential district, Developing Greenland district, and Mixed Recreation district, respectively. Figure 5e–h shows the proportion of functional scores after normalization expressing the characteristics of distribution of them in the different groups of urban districts, where 1–5 mean the ranks of functional scores after normalization, the larger number represents the higher functional scores with the darker color. Each rank has a 0.2 value step.
Specifically, Work and Tourism Mixed-developed district (group one) is a developed area that relies on work as its main urban function; at the same time, some tourism industry was also located in this group, as shown in Figure 5a. For example, the districts that enclose Guomao or Beijing CBD (Central Business District) and the Palace Museum (a very popular attraction) were both classified as Work Developed districts. Its number was also the largest one in the four groups. However, the urban functions of these districts are completed mixed with many other urban functions related to people’s lives, such as hospitals, which are basically spatially distributed throughout the whole study area (Figure 6a).
The second group was the Mixed-developed Residential district, which was with the second largest number. As implied by its name, the main function in this group is residence (Figure 5b). There are some commonalities and differences between group one and group two, except their combination of urban functions. At the beginning, they were full of urban functions that are necessary for people’s lives, while most of the functions appearing in group one were more likely composed of people’s working time, such as public services, higher education, and hospital. If someone often checks in at the districts of group one, they probably have a job in this district. Compared to group one, the functions we discovered in the districts of group two were closer to people’s daily lives, such as kindergartens and parks. Interestingly, the geographical locations of these districts helped us to interpret this difference, because they were distributed around the existing subway lines in Beijing (Figure 6b).
Developing Greenland district is the only district that was not developed in this study, because most of the districts with transportation were in this group. According to its combination graph (Figure 5c) of functions, we could easily understand the development of these districts where transportation plays a vital role there, as well as such features like natural parks and university campuses with large land area, which almost covered the entire district. This district does not have various urban functions related to people’s needs; they can be seen as virgin area with the potential for urbanization. For instance, district No. 1662 covers a part of Olympic Forest Park, which is rich in forest resources with a green coverage of 95.61%; of course, it cannot exist with other urban functions except public transportation. As for the spatial distribution, they were scattered over the area from the Ring 4th Road to the Ring 6th Road (Figure 6c). However, there was one district classified in this group that needed our attention because its location lied inside the Ring 3th Road. It was green land set aside by the government in order to increase city green space and decrease air pollution.
The last group was the Mixed Recreation district. Figure 5d illustrates that this group’s functions mainly included entertainments and public services, which improve cities for leisure and recreation. Other functions such as work and residence were also discovered in this group, while their proportions were much smaller than the main functions. We considered it as a mixed district with functions of leisure and recreation. The two typical example, Houhai and Sanlitun, well-known as entertainment area, both appeared in the district of this group. The geographical distribution was similar to group two, as shown in Figure 6d; however, the number of group four at the suburb between the Ring 4th Road and the Ring 6th Road was smaller than group two.

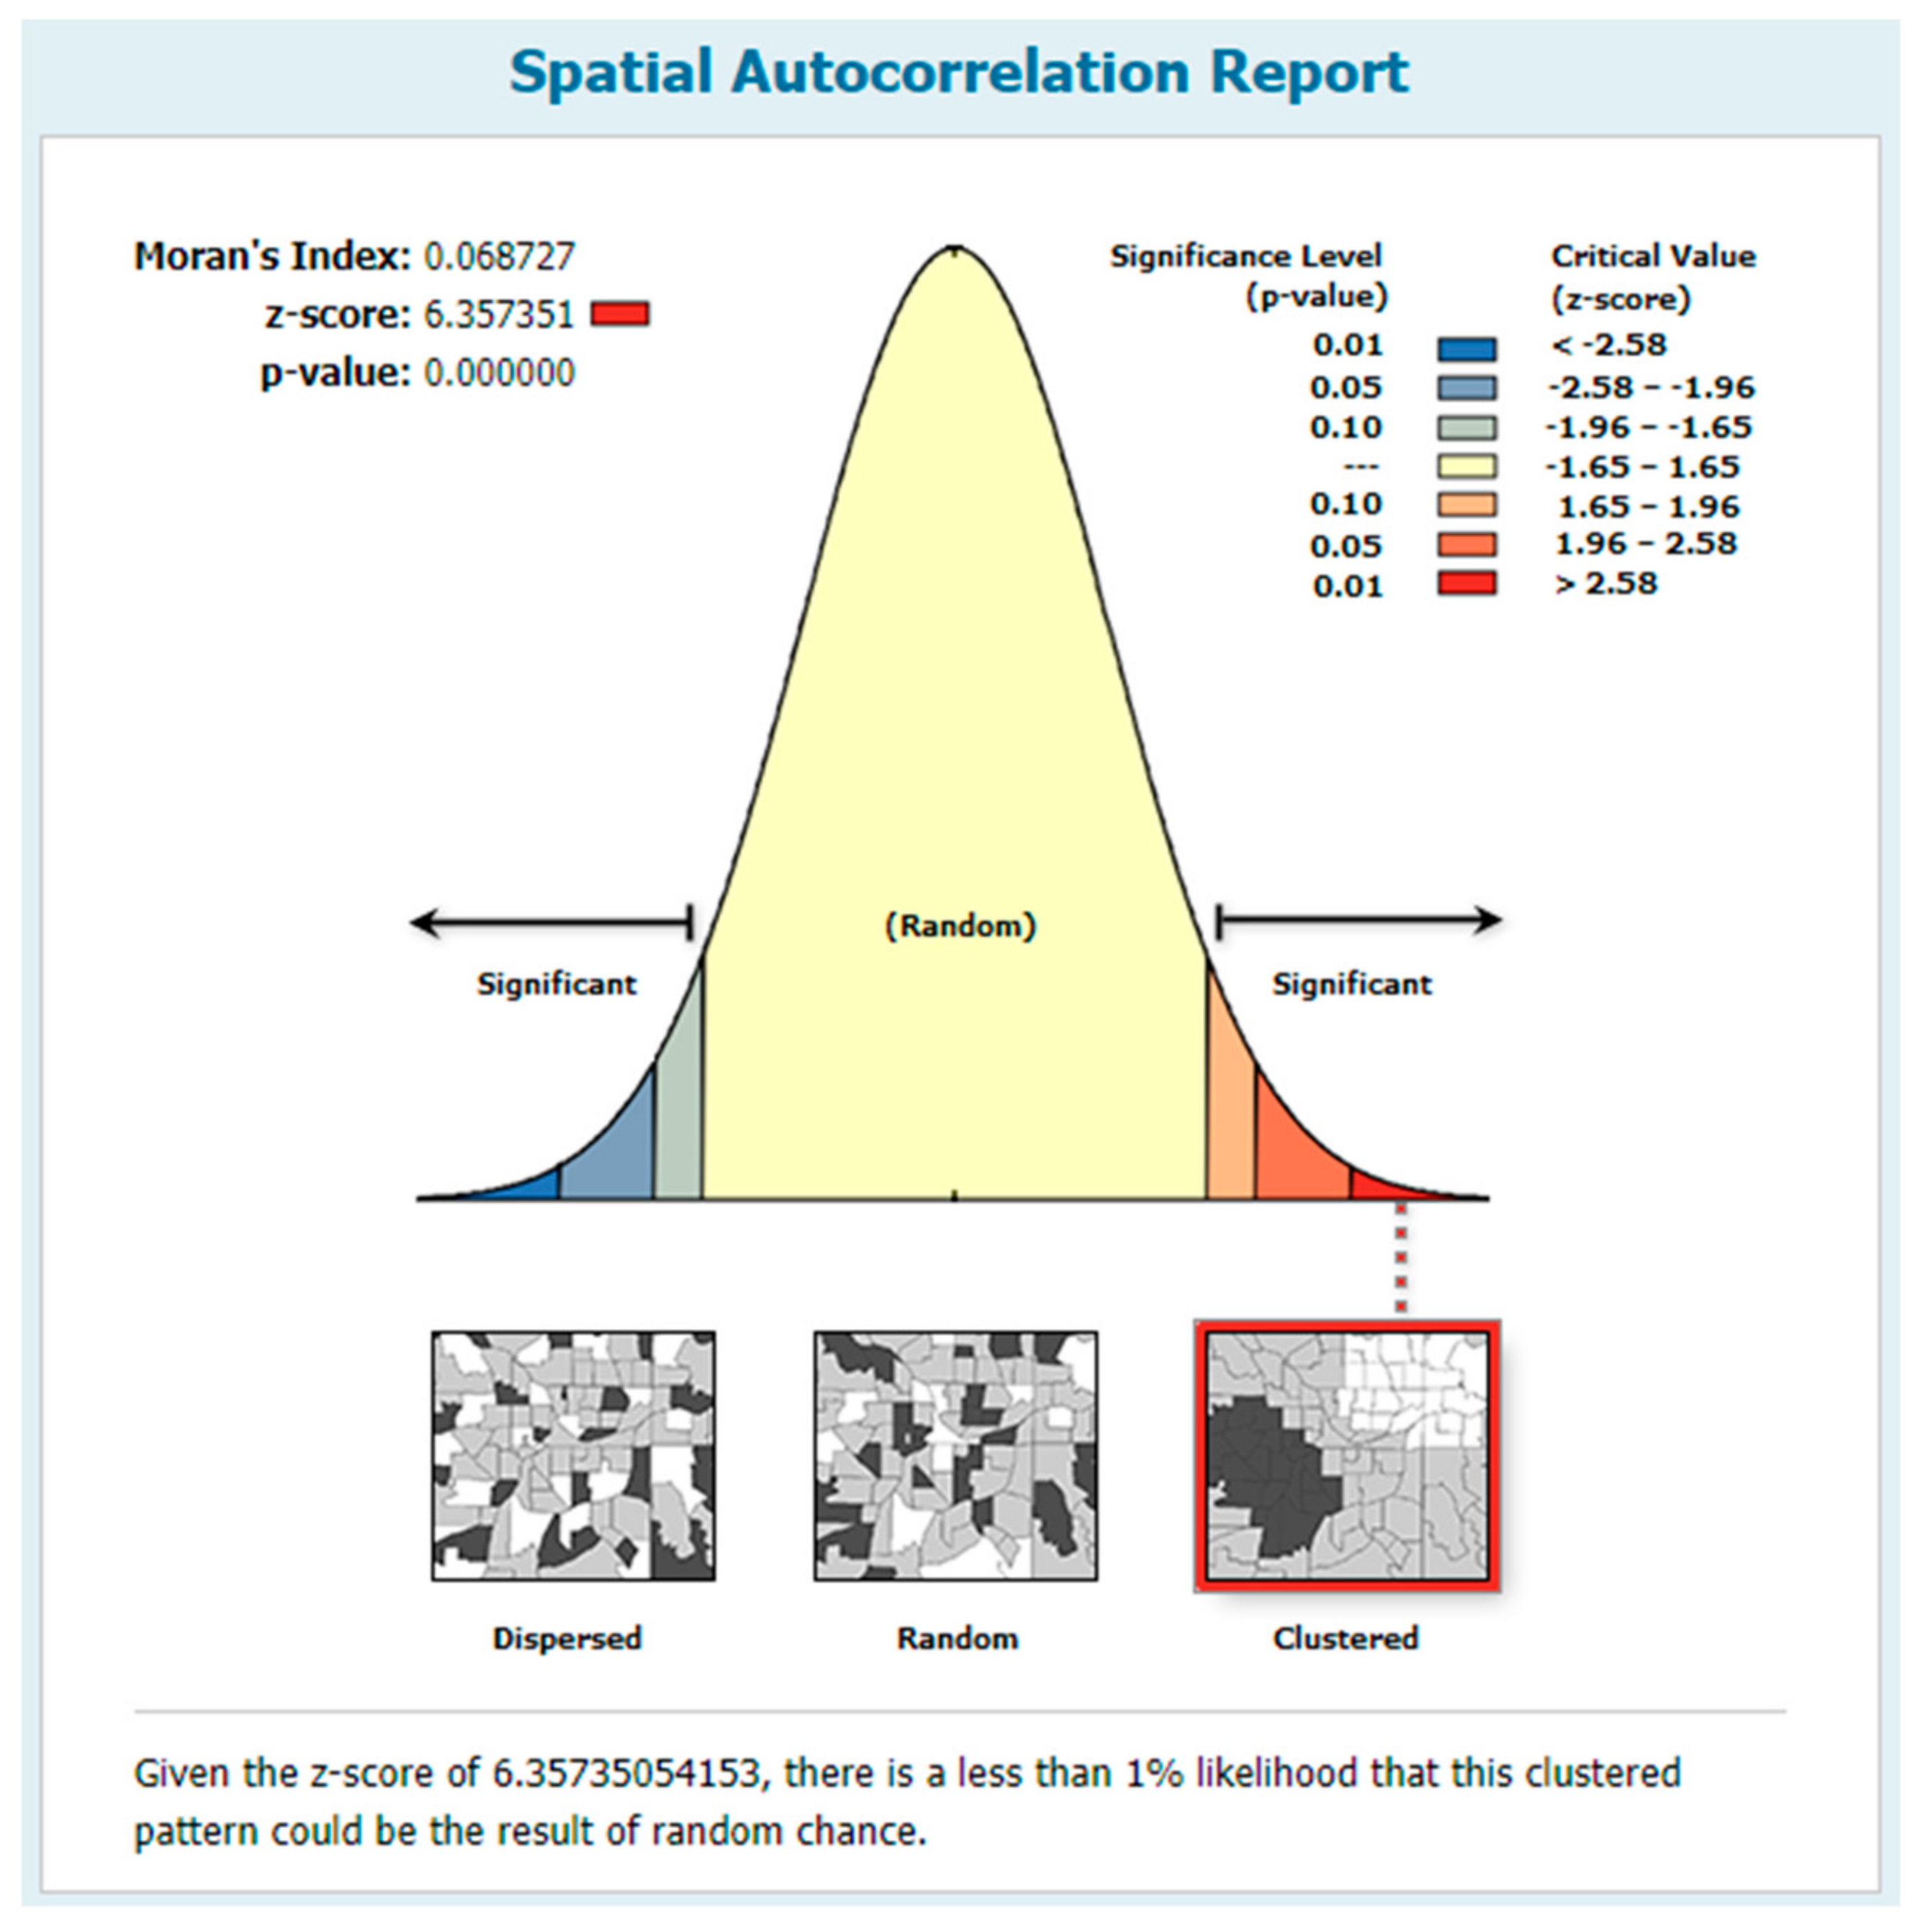
4.3. Accuracy Assessment for Urban Districts

In order to evaluate the accuracy of the results of identification and classification by functional scores, this study compared the four groups of urban districts with BaiduMap. We used an accuracy assessment called Coincidence Degree to evaluate the accuracy of classification [7]. In this assessment, each district was assigned a 0–3 round number. When a district was assigned to 3, it meant that the type of group that it belonged to completely fit with the real land use; 2 meant nearly fitting, 1 meant slightly fitting, and 0 meant barely fitting. C (Equation (8)) represents the Coincidence Degree to calculate the total accuracy,
C = i = 1 n x i i = 1 n X i
where n is the total number of samples, x i represents the actual mark of district i , and X i represents the full mark of district i .
There was a total of 45 districts selected at random for the samples (Figure 7). Table 4 shows the evaluation of all samples. It can be seen that the overall accuracy rate of identification of urban districts in Beijing reached 83.7%, which indicated that the functional score we introduced could effectively discover urban functions and districts.

5. Discussion

5.1. The Availability of Functional Score

Testing our identification method whether it could discover urban functions accurately in urban districts like other quantitative methods is a vital process. We selected a common method (category ratio) comparing with our method, and verified the results by GaodeMap. There is a fact that some districts include more than one function. However, different methods must find different distribution of urban functions in a district. In addition, various urban functions discovered in one district are not suitable for verifying the identification results of two method. We first assumed for the sake of argument that one district is only dominated by one main function, and then chose 7 urban districts which are the single function district (the density of one specific function account for more than 50%) in the study area including 6 urban functions we redefined in Section 2. The details are shown in Table A1.
District No. 1995, for example, is located in a famous residential area around the Huilongguan subway station. Our method identified its function as residence, while the other showed it as recreation. Another example is that our method precisely discovered that higher education is the predominated function in district No. 1555, which includes Peking University; however, the other method failed in identification in this round. Additionally, the same result appeared on the identification of recreation function, district No. 1195, which includes a recreation place named Sanlitun with plenty of nightlife. Our method discovered it as recreation instead of hotel discovered by category ratio. Meanwhile, the two methods both have a good performance on the identification of attractions like district No. 1138. However, our method is a little weaker in identifying transportation functions than category ratio. Although most of transportation places are not discovered by the two methods, the category ratio method is relatively more accurate than our method. For example, district No. 876 includes a main transportation hub; our method illustrated its function as hotel rather than transportation, while category ratio had a good performance. Compared with that, district No. 979, which is marked as hotel, encloses the Beijing South Railway Station. More importantly, the district that includes the Beijing Capital International Airport, No. 2015, is classified as recreation by our method instead of hotel by category ratio.
In total, our method is more precise for identifying those urban functions related with residents’ daily lives in this city, such as residence, work, recreation, and higher/primary education. Meanwhile, the ability to give identification information about hotels and attraction is similar with the category ratio. However, our method cannot offer exact results about discovering transportation. As for public services and hospitals, they often exist with other urban functions due to their built area and numbers. We do not put these two functions in the must-considered list in this study temporally. The results showed that Fisher’s exact test can be used to identify quantitatively urban functions with a good performance.
Furthermore, enormous geo-big data including remote sensing images, smartcard data, social media, and location-based GPS (Global Positioning System) data might provide more information of urban functions. These data can reflect unique characteristics of different urban functions in the urban districts. For example, taxi data can depict the area where is the hotspots of transportation based on time series. Combining functional score and other geo-big data might make the results of identifying urban functions more accurate and rigorous, especially discovering the functions with distinct characteristics such as transportation and hospitals.

5.2. Broader Thinking

One broader question is whether these urban districts have spatial autocorrelation or influence each other by the types of districts. We tested them with Global Moran’s I to discover the dependence of these districts. The results (Figure A1) showed that the Global Moran’s I index was 0.0687 and z-score was 6.3573, which means four groups of urban districts have no correlation spatially and their distribution tends to be random. At the same time, urban functions discovered by the functional score also might be related to spatial aggregation. If one function has a high score in a district, it can be regarded as a function with a high degree of collection in this district. We selected three urban functions, which were residence, recreation, and attractions, as examples. Using hotspot analysis reflects the degree of spatial aggregation of urban districts dominated by these functions according to the function scores of these functions. Getis-Ord Gi* is often used to discover the local spatial autocorrelation and find the hotspot area. The results (Figure A2) show that the hotspot areas of three urban functions discovered by Getis-Ord Gi* were consistent with the actual distribution, respectively. It also proves that it is effective to use functional score to identify urban functions.

6. Conclusions

In this study, we first employed Fisher’s exact test to replace some common methods based on the density of POIs to get a functional score for the purpose of analyzing the quantitative collection of each POI tag to identify urban functions. Next, we ran a k-modes clustering algorithm to discover different groups of urban districts. It is worth noting that the combination of those functions (scores) that belong to the same district was a prerequisite for our identification and classification of urban districts. We discovered that urban functions are mostly mixed in a range of 1000 × 1000 square meters within the Sixth Ring Road of Beijing. There are four groups we found in this study, which are Work and Tourism Mixed-developed district, Mixed-developed Residential district, Developing Greenland district, and Mixed Recreation district. Only the Developing Greenland district is almost scattered at the suburb outside the Fourth Ring Road of Beijing. The distributions of the other urban districts are all throughout the whole area. More importantly, the Mixed-developed Residential district and Mixed Recreation district are closer to the subway lines. This phenomenon explains that these two urban functions (residence and recreation) are dependent on public transportation. Finally, we evaluated the results of classification of urban districts and the feasibility of the functional score. The assessment by coincidence degree, which is a sample scoring method, for the four groups of urban districts shows that the total accuracy of classification is 83.7%. Our method has a good performance in the identification of residence, work, recreation, and education, which are closer with residents’ activities, while it cannot identify transportation hubs precisely. Combining with other geo-big data which can reflect more spatial and temporal characteristics might be a solution for further research.
Additionally, we explored the aggregation of single function in the study area with Getis-Ord Gi* statistics in accordance with the functional score of single function in each urban district, and found that the hotspots of these functions are similar to the existing hotspots of urban development. All these validations prove that it is feasible to use Fisher’s exact test to identify urban functions. Identifying urban functions can be seen as a new application of Fishers’ exact test, which is improved. Additionally, the k-modes clustering algorithm can classify urban districts with a common result.
Although we have successfully proposed an improved quantitative method related to Fisher’s exact test to identify urban functions using POI data, the result of classification for urban districts is relatively rough. For example, the Work and Tourism Mixed-developed district includes two functions representing two statuses of human activities. For registered residents, these two functions can be regarded as work. However, tourists are only appeared into this district for attractions. Therefore, we must consider adding time information into the identification of urban districts in further studies.
Moreover, some studies illustrated that the grid size issue would influence the combination of urban functions and identification of urban districts. In this study, a fixed regular grid was chosen as a research unit. However, different unit size might cause a different degree of collection of POI tags. Increasing or decreasing the unit size can influence the representativeness of POI tags, for example, hospitals are easy to be discovered in a relatively small unit rather than a large unit. The sensitive of the grid size issue is another scope for further research.
In conclusion, this study draws more attention to utilization of land resources, improvement of land use efficiency, and urbanization. It plays a significant role in decisions supporting urban planning practice. Another perspective is that urban functions are an excellent expression of human activities. Specific and accurate urban districts could help us to understand the human activities and different types of humans.

Author Contributions

Conceptualization, Disheng Yi; Data curation, Disheng Yi, Jing Yang, Jingjing Liu and Yusi Liu; Methodology, Disheng Yi; Resources, Disheng Yi; Supervision, Jing Zhang; Visualization, Disheng Yi; Writing—original draft, Disheng Yi; Writing—review & editing, Disheng Yi, Jing Yang, Jingjing Liu, Yusi Liu and Jing Zhang.

Funding

This work was supported by the Open Project Program of the State Key Laboratory of Virtual Reality Technology and Systems, Beihang University (Grant No. 01119220010011)

Acknowledgments

We would like to acknowledge the editors for the editing assistance and the reviewers for their constructive comments on our paper.

Conflicts of Interest

The authors declare no conflict of interest.

Appendix A

Table A1. The list of samples for verifying availability.
GaodeMap/Number of DistrictFunction (Category Ratio)Function (Method this Study Introduced)Main Actual land Features
Ijgi 08 00555 i001TransportationHotelTransportation hub and hotels
No. 876
Ijgi 08 00555 i002HotelHotelRailway station
No. 979
Ijgi 08 00555 i003HotelRecreationAirport terminal and hotels
No. 2015
Ijgi 08 00555 i004AttractionAttractionAttractions
No. 1138
Ijgi 08 00555 i005HotelRecreationRecreations
No. 1195
Ijgi 08 00555 i006AttractionHigher educationUniversity campus
No. 1555
Ijgi 08 00555 i007RecreationResidenceResidence
No. 1995
Figure A1. The result of Global Moran’s I of urban districts.
Ijgi 08 00555 g0a1
Figure A2. The results of Getis-Ord Gi* statistics of three urban functions, including (a) residence, (b) recreation, and (c) attraction. The dark red areas are the identified hotspots with 99% Confidence; the light red areas are the identified hotspots with 95% Confidence; the light pink areas are the identified hotspots with 90% Confidence; and the light yellow areas are not hotspots.
Ijgi 08 00555 g0a2aIjgi 08 00555 g0a2bIjgi 08 00555 g0a2c

References

  1. Gao, S.; Janowicz, K.; Couclelis, H. Extracting urban functional regions from points of interest and human activities on location-based social networks. Trans. GIS 2017, 21, 446–467. [Google Scholar] [CrossRef]
  2. Yao, X.; Chen, L.; Peng, L.; Chi, T. A co-location pattern-mining algorithm with a density-weighted distance thresholding consideration. Inf. Sci. 2017, 396, 144–161. [Google Scholar] [CrossRef]
  3. Kong, X.; Li, M.; Li, J.; Tian, K.; Hu, X.; Xia, F. CoPFun: An urban co-occurrence pattern mining scheme based on regional function discovery. World Wide Web 2019, 22, 1029–1054. [Google Scholar] [CrossRef]
  4. Kashian, A.; Rajabifard, A.; Richter, K.F.; Chen, Y. Automatic analysis of positional plausibility for points of interest in OpenStreetMap using coexistence patterns. Int. J. Geogr. Inf. Sci. 2019, 33, 1420–1443. [Google Scholar] [CrossRef]
  5. Haris, E.; Gan, K.H.; Tan, T.P. Spatial information extraction from travel narratives: Analysing the notion of co-occurrence indicating closeness of tourist places. J. Inf. Sci. 2019. [Google Scholar] [CrossRef]
  6. Chi, J.; Jiao, L.; Dong, T.; Gu, Y.; Ma, Y. Quantitative identification and visualization of urban functional area based on poi data. J. Geomat. 2016, 41, 68–73. [Google Scholar]
  7. Kang, Y.; Wang, Y.; Xia, Z.; Chi, J.; Jiao, M.; Wei, Z.W. Identification and classification of wuhan urban districts based on poi. J. Geomat. 2018, 43, 81–85. [Google Scholar]
  8. Zhu, J.; Tang, C.; Feng, Y. A Study on Quantitative Identification of Urban Functional Areas in Yichun Based on Point of Interest Data. Urb. Arch. 2018, 20, 21–23. [Google Scholar]
  9. Hu, Y.; Han, Y. Identification of Urban Functional Areas Based on POI Data: A Case Study of the Guangzhou Economic and Technological Development Zone. Sustainability 2019, 11, 1385. [Google Scholar] [CrossRef] [Green Version]
  10. Zhao, M.; Liang, J.; Guo, Z. Classifying Development-land Type of the Megacity through the Lens of Multisource Data. Shanghai Urban Plan. Rev. 2018, 5, 72–77. [Google Scholar]
  11. Zhai, W.; Bai, X.; Shi, Y.; Han, Y.; Peng, Z.R.; Gu, C. Beyond Word2vec: An approach for urban functional region extraction and identification by combining Place2vec and POIs. Comput. Environ. Urban Syst. 2019, 74, 1–12. [Google Scholar] [CrossRef]
  12. Zhang, X.; Du, S.; Wang, Q. Hierarchical semantic cognition for urban functional zones with VHR satellite images and POI data. ISPRS J. Photogramm. Remote Sens. 2017, 132, 170–184. [Google Scholar] [CrossRef]
  13. Guo, Z.; Zheng, Z.; Liu, J.; Wang, S.; Zhong, P.; Zhu, M.; He, Y.; Jiang, L.; Zhou, G.; Zhang, H. Urban Functional Regions Using Social Media Check-Ins. In Proceedings of the IGARSS 2018-2018 IEEE International Geoscience and Remote Sensing Symposium, Valencia, Spain, 6 June 2018; pp. 5061–5064. [Google Scholar]
  14. Wang, Y.; Gu, Y.; Dou, M.; Qiao, M. Using spatial semantics and interactions to identify urban functional regions. ISPRS Int. Geo-Inf. 2018, 7, 130. [Google Scholar] [CrossRef] [Green Version]
  15. Xing, H.; Meng, Y. Integrating landscape metrics and socioeconomic features for urban functional region classification. Comput. Environ. Urban Syst. 2018, 72, 134–145. [Google Scholar] [CrossRef]
  16. Jiang, S.; Alves, A.; Rodrigues, F.; Ferreira Jr, J.; Pereira, F.C. Mining point-of-interest data from social networks for urban land use classification and disaggregation. Comput. Environ. Urban Syst. 2015, 53, 36–46. [Google Scholar] [CrossRef] [Green Version]
  17. Zhao, W.; Li, Q.; Li, B. Extracting hierarchical landmarks from urban POI data. J. Remote Sens. 2011, 15, 973–988. [Google Scholar]
  18. Zhang, A.; Xia, C.; Chu, J.; Lin, J.; Li, W.; Wu, J. Portraying urban landscape: A quantitative analysis system applied in fifteen metropolises in China. Sustain. Cities Soc. 2019, 46, 101396. [Google Scholar] [CrossRef]
  19. Gao, Q.; Fu, J.; Yu, Y.; Tang, X. Identification of urban regions’ functions in Chengdu, China, based on vehicle trajectory data. PLoS ONE 2019, 14, e0215656. [Google Scholar] [CrossRef] [Green Version]
  20. Wu, Q.; Zhang, L.; Wu, Z. Identifying City Functional Areas Using Taxi Trajectory Data. J. Geom. Sci. Technol. 2018, 35, 424. [Google Scholar]
  21. Quaife, S.L.; Marlow, L.A.; McEwen, A.; Janes, S.M.; Wardle, J. Attitudes towards lung cancer screening in socioeconomically deprived and heavy smoking communities: Informing screening communication. Health Expect. 2017, 20, 563–573. [Google Scholar] [CrossRef]
  22. Sliwa, K.; Mebazaa, A.; Hilfiker-Kleiner, D.; Petrie, M.C.; Maggioni, A.P.; Laroche, C.; Regitz-Zagrosek, V.; Schaufelberger, M.; Tavazzi, T.; Meer, P.; et al. Clinical characteristics of patients from the worldwide registry on peripartum cardiomyopathy (PPCM) EURObservational Research Programme in conjunction with the Heart Failure Association of the European Society of Cardiology Study Group on PPCM. Eur. J. Heart Fail. 2017, 19, 1131–1141. [Google Scholar] [CrossRef] [PubMed]
  23. Romano, M. Developing a Predictive Mortality Risk Algorithm for Preterm Neonates Requiring Surgical Intervention at Boston Children’s Hospital. Ph.D. Thesis, Boston University, Boston, MA, USA, 2019. [Google Scholar]
  24. Platz, E.; Jhund, P.S.; Claggett, B.L.; Pfeffer, M.A.; Swedberg, K.; Granger, C.B.; Yusuf, S.; Solomon, S.D.; McMurray, J.J. Prevalence and prognostic importance of precipitating factors leading to heart failure hospitalization: Recurrent hospitalizations and mortality. Eur. J. Heart Fail. 2018, 20, 295–303. [Google Scholar] [CrossRef] [PubMed] [Green Version]
  25. Huebener, P.; Sterneck, M.R.; Bangert, K.; Drolz, A.; Lohse, A.W.; Kluge, S.; Fischer, L.; Fuhrmann, V. Stabilisation of acute-on-chronic liver failure patients before liver transplantation predicts post-transplant survival. Aliment. Pharmacol. Ther. 2018, 47, 1502–1510. [Google Scholar] [CrossRef] [PubMed] [Green Version]
  26. De Lima Cabral, D.R.; de Barros, R.S.M. Concept drift detection based on Fisher’s Exact test. Inf. Sci. 2018, 442, 220–234. [Google Scholar] [CrossRef]
  27. Zhong, H.; Song, M. A fast exact functional test for directional association and cancer biology applications. IEEE-ACM Trans. Comput. Biol. Bioinform. 2018, 16, 818–826. [Google Scholar] [CrossRef] [PubMed]
  28. Alhazzani, M.; Alhasoun, F.; Alawwad, Z.; González, M.C. Urban Attractors: Discovering patterns in regions of attraction in cities. arXiv 2016, arXiv:1701.08696. [Google Scholar]
  29. Sprent. Fisher exact test. In International Encyclopedia of Statistical Science, 1st ed.; Lovric, M., Ed.; Springer: Berlin/Heidelberg, Germany, 2011; Volume 2, pp. 524–525. [Google Scholar]
  30. Bland, J.M.; Altman, D.G. The odds ratio. BMJ 2000, 320, 1468. [Google Scholar] [CrossRef] [Green Version]
  31. Zhang, X.; Li, W.; Zhang, F.; Liu, R.; Du, Z. Identifying Urban Functional Zones Using Public Bicycle Rental Records and Point-of-Interest Data. ISPRS Int. Geo-Inf. 2018, 7, 459. [Google Scholar] [CrossRef] [Green Version]
  32. Tang, C.; Liao, H.; Wu, N.; Dong, L.; Zhang, R.; Li, Y.; Gao, X. Mobile Phone Data Based Urban Functional Area Classification Algorithm. Comput. Knowl. Tech. 2018, 14, 285–289. [Google Scholar]
  33. Huang, Z. Extensions to the k-means algorithm for clustering large data sets with categorical values. Data Min. Knowl. Discov. 1998, 2, 283–304. [Google Scholar] [CrossRef]
  34. Huang, Z.; Ng, M.K. A note on k-modes clustering. J. Classif. 2003, 20, 257–261. [Google Scholar] [CrossRef]
  35. Rousseeuw, P.J. Silhouettes: A graphical aid to the interpretation and validation of cluster analysis. J. Comput. Appl. Math. 1987, 20, 53–65. [Google Scholar] [CrossRef] [Green Version]
  36. Caliński, T.; Harabasz, J. A dendrite method for cluster analysis. Commun. Stat. Theory Methods 1974, 3, 1–27. [Google Scholar]
Figure 1. The study area within Sixth Ring Road in Beijing denoted by blue.
Ijgi 08 00555 g001
Figure 2. The flowchart for identifying urban functions and classifying urban districts.
Ijgi 08 00555 g002
Figure 3. Performance of different k clusters in k-modes algorithm. The red line and blue line represent the evaluation of the Silhouette Coefficient and the Calinski-Harabasz index, respectively. The Silhouette Coefficient score reached almost 0.5 when k = 4. Similarly, the Calinski-Harabasz index score also climbed sharply to near 700 as a peak when k = 4.
Ijgi 08 00555 g003
Figure 4. The result of identification and classification of urban districts. Groups 1–4 are different types of urban districts based on the combination of POI data.
Ijgi 08 00555 g004
Figure 5. The combination of functional scores for four groups of urban districts, including (a) Work and Tourism Mixed-developed district; (b) Mixed-developed Residential district; (c) Developing Greenland district; and (d) Mixed Recreation district. Each line represents one district and the color bar beside each graph shows the functional scores after normalization. And the proportion of functional scores after normalization in four group of urban districts, including (e) Work and Tourism Mixed-developed district; (f) Mixed-developed Residential district; (g) Developing Greenland district; and (h) Mixed Recreation district.
Ijgi 08 00555 g005
Figure 6. The spatial distribution of each group of urban districts. (a) Work and Tourism Mixed-developed district; (b) Mixed-developed Residential district; (c) Developing Greenland district; (d) Mixed Recreation district.
Ijgi 08 00555 g006
Figure 7. Samples of accuracy assessment.
Ijgi 08 00555 g007
Table 1. Reclassification results of point of interest (POI) data.
Current TagPrevious Tag (Level One)Previous Sub-Tag (Level Two)
Public serviceBeautyAll
Car serviceAll
Public serviceAll
Financial serviceBank
TransportationGas station
Parking lot
HealthcareNursing home
Chemist store
ResidenceResidenceResidence
WorkCompanyAll
Cultural industryAll
BuildingOffice building
TransportationTransportationStation
Higher educationEducationUniversity
Vocational education
Institute
Library
Primary educationEducationPrimary school
Secondary school
Kindergarten
HotelHotelAll
RecreationFoodAll
Leisure and entertainmentAll
Sports and fittingAll
AttractionPark
Amusement park
AttractionAttractionChurch
Landscape
Museum
Historical site
EducationScience and technology museum
Cultural industryGalley
Exhibition
HealthcareHealthcareGlobal hospital
Special hospital
CDC (Centers for Disease Control and Prevention)
Emergency
Table 2. The 2 × 2 contingency table represents two different attributes used in Fisher’s exact test.
Variance OneNon-Variance One
Variance twoAB
Non-variance twoCD
Table 3. An example of one district. It shows the difference of functional scores before and after running the normalization.
POI Class OnePOI Class TwoPOI Class ThreePOI Class FourPOI Class FivePOI Class SixPOI Class SevenPOI Class EightPOI Class NinePOI Class Ten
Before5.7700.240.14000631.1200
After0.00900.00020000100
Table 4. Assessment of Coincidence Degree for urban districts.
The Number of Districts with a 0 MarkThe Number of Districts with a 1 MarkThe Number of Districts with a 2 MarkThe Number of Districts with a 3 MarkTotal Number of all Districts
3373245

