Spatial Prediction of Landslide Susceptibility Based on GIS and Discriminant Functions

1
College of Geology and Environment, Xi’an University of Science and Technology, Xi’an 710054, China
2
Key Laboratory of Coal Resources Exploration and Comprehensive Utilization, Ministry of Natural Resources, Xi’an 710021, China
*
Author to whom correspondence should be addressed.
ISPRS Int. J. Geo-Inf. 2020, 9(3), 144; https://0-doi-org.brum.beds.ac.uk/10.3390/ijgi9030144
Submission received: 1 January 2020
/
Revised: 10 February 2020
/
Accepted: 27 February 2020
/
Published: 29 February 2020
(This article belongs to the Special Issue Advance Geospatial Artificial Intelligence for Landslide Modeling, Prediction and Management)
Abstract
:The areas where landslides occur frequently pose severe threats to the local population, which necessitates conducting regional landslide susceptibility mapping (LSM). In this study, four models including weight-of-evidence (WoE) and three WoE-based models, which were linear discriminant analysis (LDA), Fisher’s linear discriminant analysis (FLDA), and quadratic discriminant analysis (QDA), were used to obtain the LSM in the Nanchuan region of Chongqing, China. Firstly, a dataset was prepared from sixteen landslide causative factors, including eight topographic factors, three distance-related factors, and five environmental factors. A landslide inventory map including 298 landslide locations was also constructed and randomly divided with a ratio of 70:30 as training and validation data. Subsequently, the WoE method was used to estimate the relationship between landslides and the landslide causative factors, which assign a weight value to each class of causative factors. Finally, four models were applied using the training dataset, and the predictive performance of each model was compared using the validation datasets. The results showed that FLDA had a higher performance than the other three models according to the success rate curve (SRC) and prediction rate curve (PRC), illustrating that it could be considered a promising approach for landslide susceptibility mapping in the study area.
1. Introduction
Slope can be perceived as a critical landform configuration; however, it exposes many natural and man-made disasters such as landslides, collapse events, and debris flows, which result indifferent human and asset loss levels globally, especially in developing countries. Geological environments are increasingly affected by human engineering activities [1,2,3]. Landslide hazard assessments represent a conditional probability based on time and spatial occurrence, and landslide magnitude for a given geo-environmental setting [4]. Gradually, landslide risk assessment has received considerable attention, from analyzing landslide type and magnitude to risk elements, to the final step analyzing landslide spatial occurrence. As a factor included in landslide risk assessment, landslide spatial probability (landslide susceptibility) implies the spatial likelihood of landslide occurrence under indigenous topographic conditions [5]. However, this factor cannot imply the magnitude and temporal probability of slope failure, although it can indicate which area is more likely to have slope failure based on connections to past landslide conditions [6].
To prevent landslides before they cause grave physical and property damage, it is necessary to study the characteristics and causative factors of landslide occurrence at a large scale, to manage landslides with the ultimate goal of providing early warning of landslide hazards. Therefore, a simple expert knowledge method is first used for landslide susceptibility estimation. The combination of landslide inventory and computer science makes digital methods popular, leading to advanced methods and topics for research and application [7]. Nevertheless, landslide susceptibility estimation is not easy to conduct because databases need information covering different areas. Nevertheless, these approaches are useful, with objective and repeatable characteristics [7].
All methods can be grouped into five classes [7]: direct landform mapping, analysis of landslide inventories, process-based conceptual models, heuristic methods, and statistical methods. The first method constructs landslide susceptibility maps using remote sensing (RS) and geographic information system (GIS) techniques. The second method comprises landslide density maps. The third method studies mechanics related to stability analysis [8]. The heuristic approach is a qualitative analysis based on expert knowledge and previous work experience [8,9].
The application of statistical methods based on spatial relation between a series of thematic layers and distribution of past landslides. Statistical approaches are quantitative methods which can use different functional relationship. They can be subdivided into: (1) physically-based methods [10,11]; and (2) traditional statistical methods, such as the frequency ratio [12,13], evidential belief function [14,15], weight of evidence [16,17], discriminant analysis [18,19,20,21], and logistic regression [22,23], (3) advanced data mining technologies, such as artificial neural networks [24,25], support vector machines [26,27,28], adaptive neuro-fuzzy inference systems [29,30], alternating decision trees [31], and functional trees [32,33]. These methods need landslide inventories expressed as landslide density maps to produce functional relationships with causative factors [34]. These methods have also been used in other study fields and exhibit higher spatial accuracy, such as badland susceptibility assessment [35], land subsidence susceptibility mapping [36,37], ground subsidence susceptibility mapping [38,39], flood susceptibility mapping [40,41,42], and groundwater potential mapping [43,44]. Recently, scientists have done a lot of research on hybrid machine learning methods for better assessment and prediction of landslides [45]. Wang et al. proposed a base classifier of MultiBoosting for integrating different machine learning techniques [46]. Althuwaynee et al. applied ensemble decision tree-based chi-squared automatic interaction detector (CHAID) and multivariate logistic regression models to assess landslide spatial occurrence for the first time [47].
This study investigated landslide susceptibility assessment in the Nanchuan area, China, using linear discriminant analysis (LDA), Fisher’s linear discriminant analysis (FLDA), and quadratic discriminant analysis (QDA), as well as weight-of-evidence (WoE) statistical models. These models were selected and applied in this research because of their successful performance in other fields. As can be seen from numerous articles which apply data mining technology, FLDA, LDA, and QDA have been successfully used in many other classification problems, such as groundwater spring potential mapping [48], fault prediction [49], and soil studies [50,51]. WoE model have been used to determine the importance of the independent variables in different research areas [52,53]. In the present study, in order to eliminate the problem of class imbalance in the dataset, the WoE model was used to determine the importance of the classes in each landslide causative factor, and then the weighted classes were used as input to build three discriminant models.
2. Geological and Geomorphological Setting
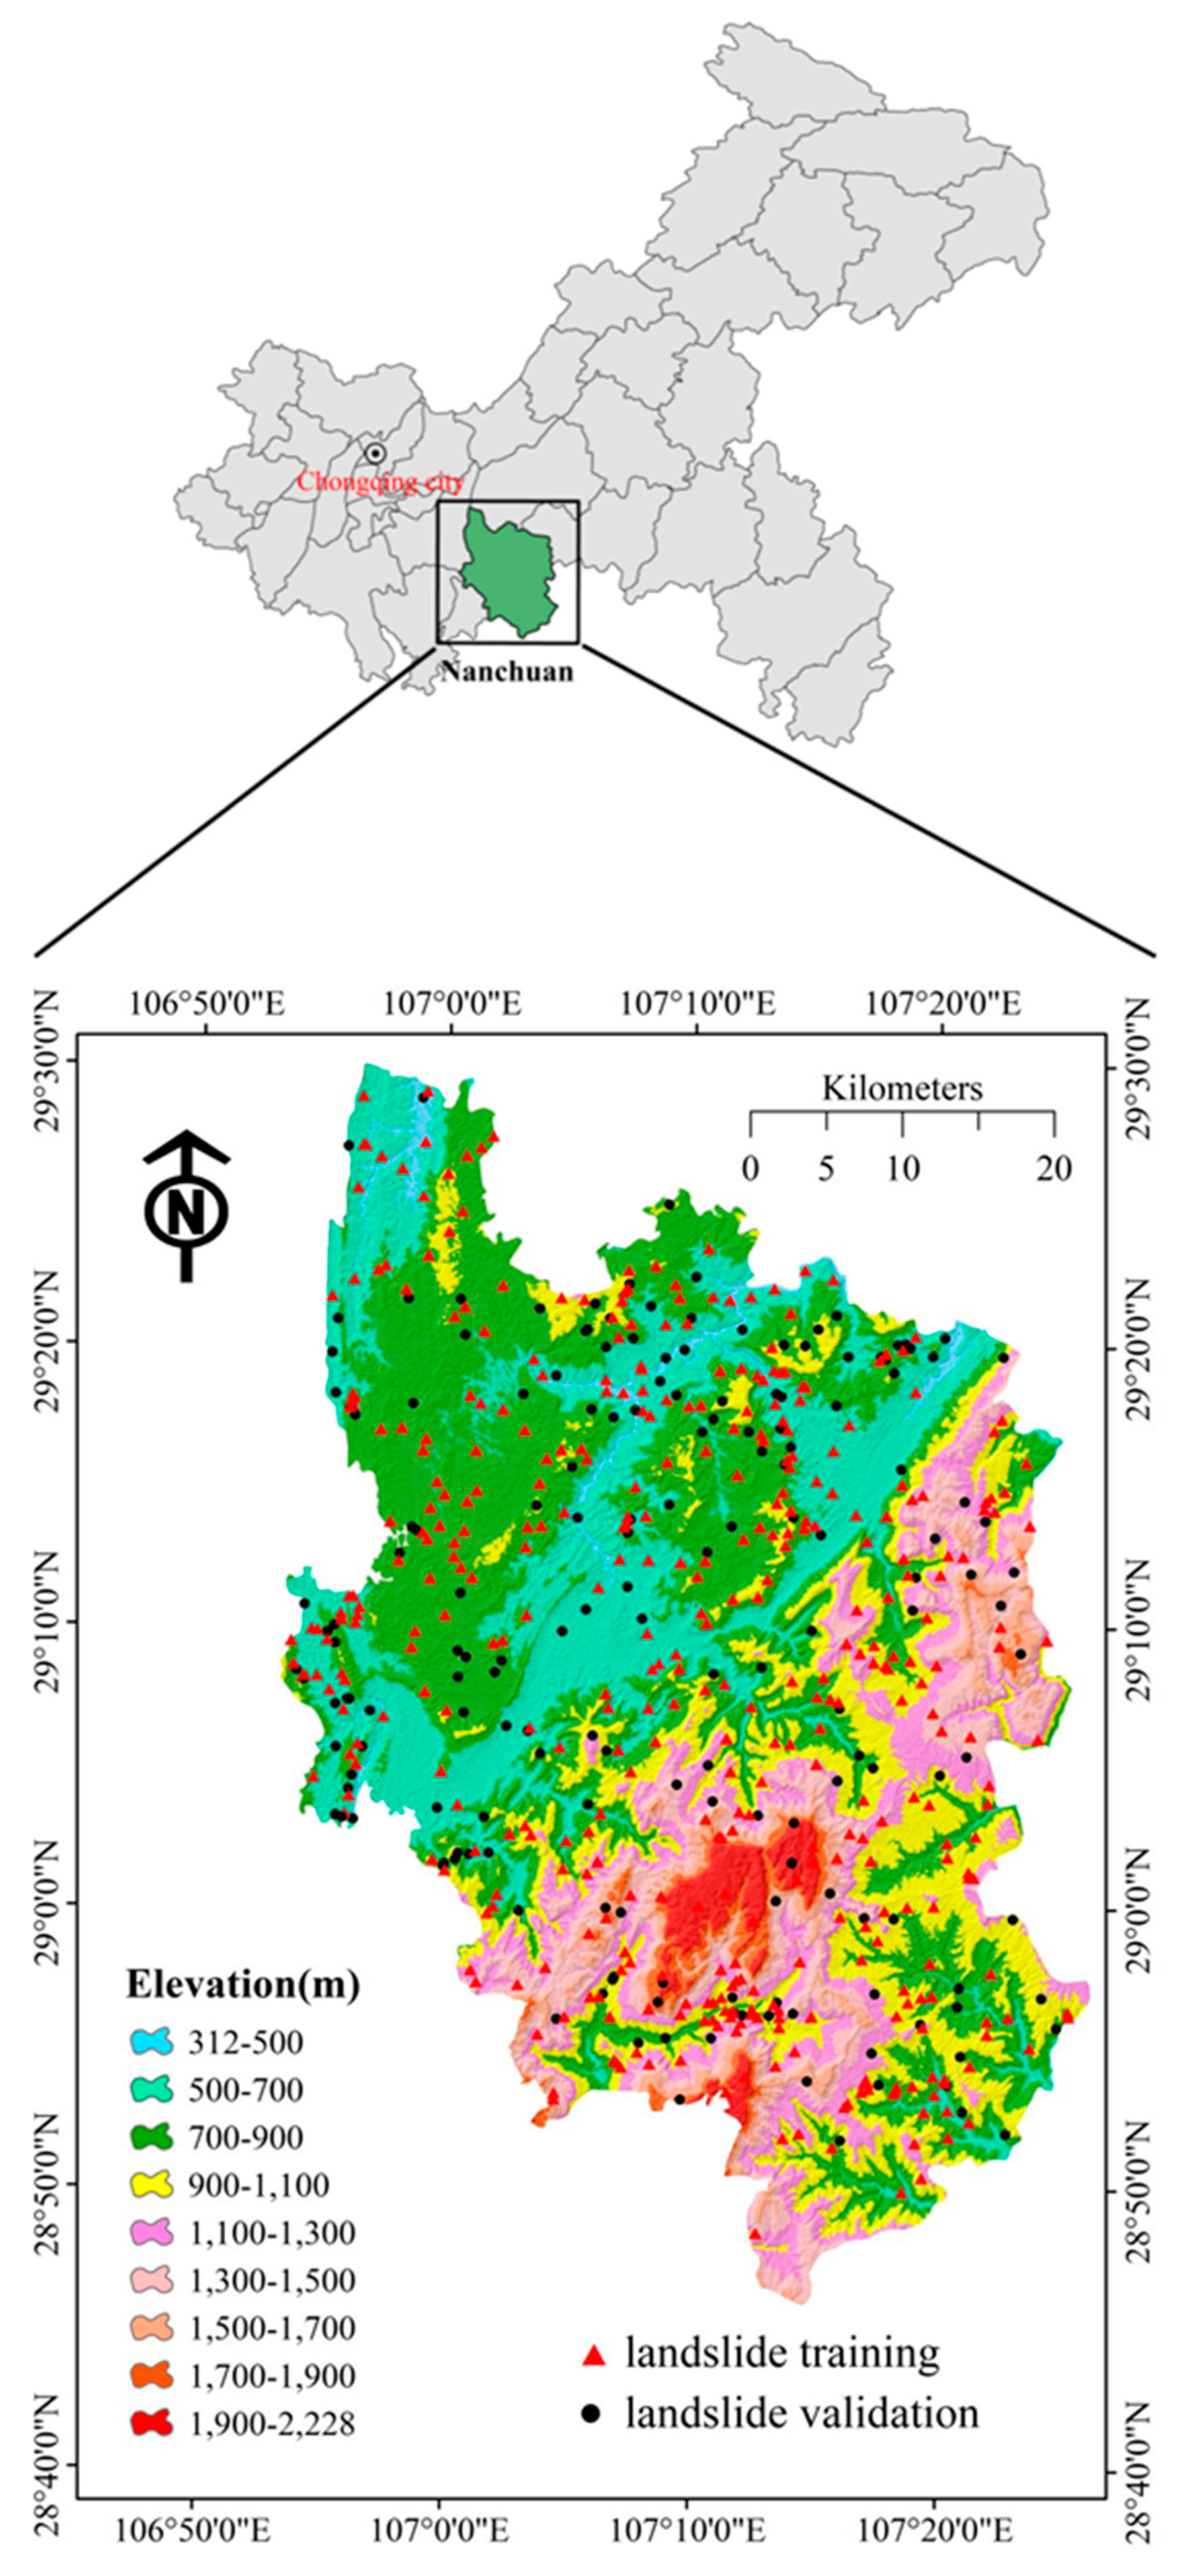
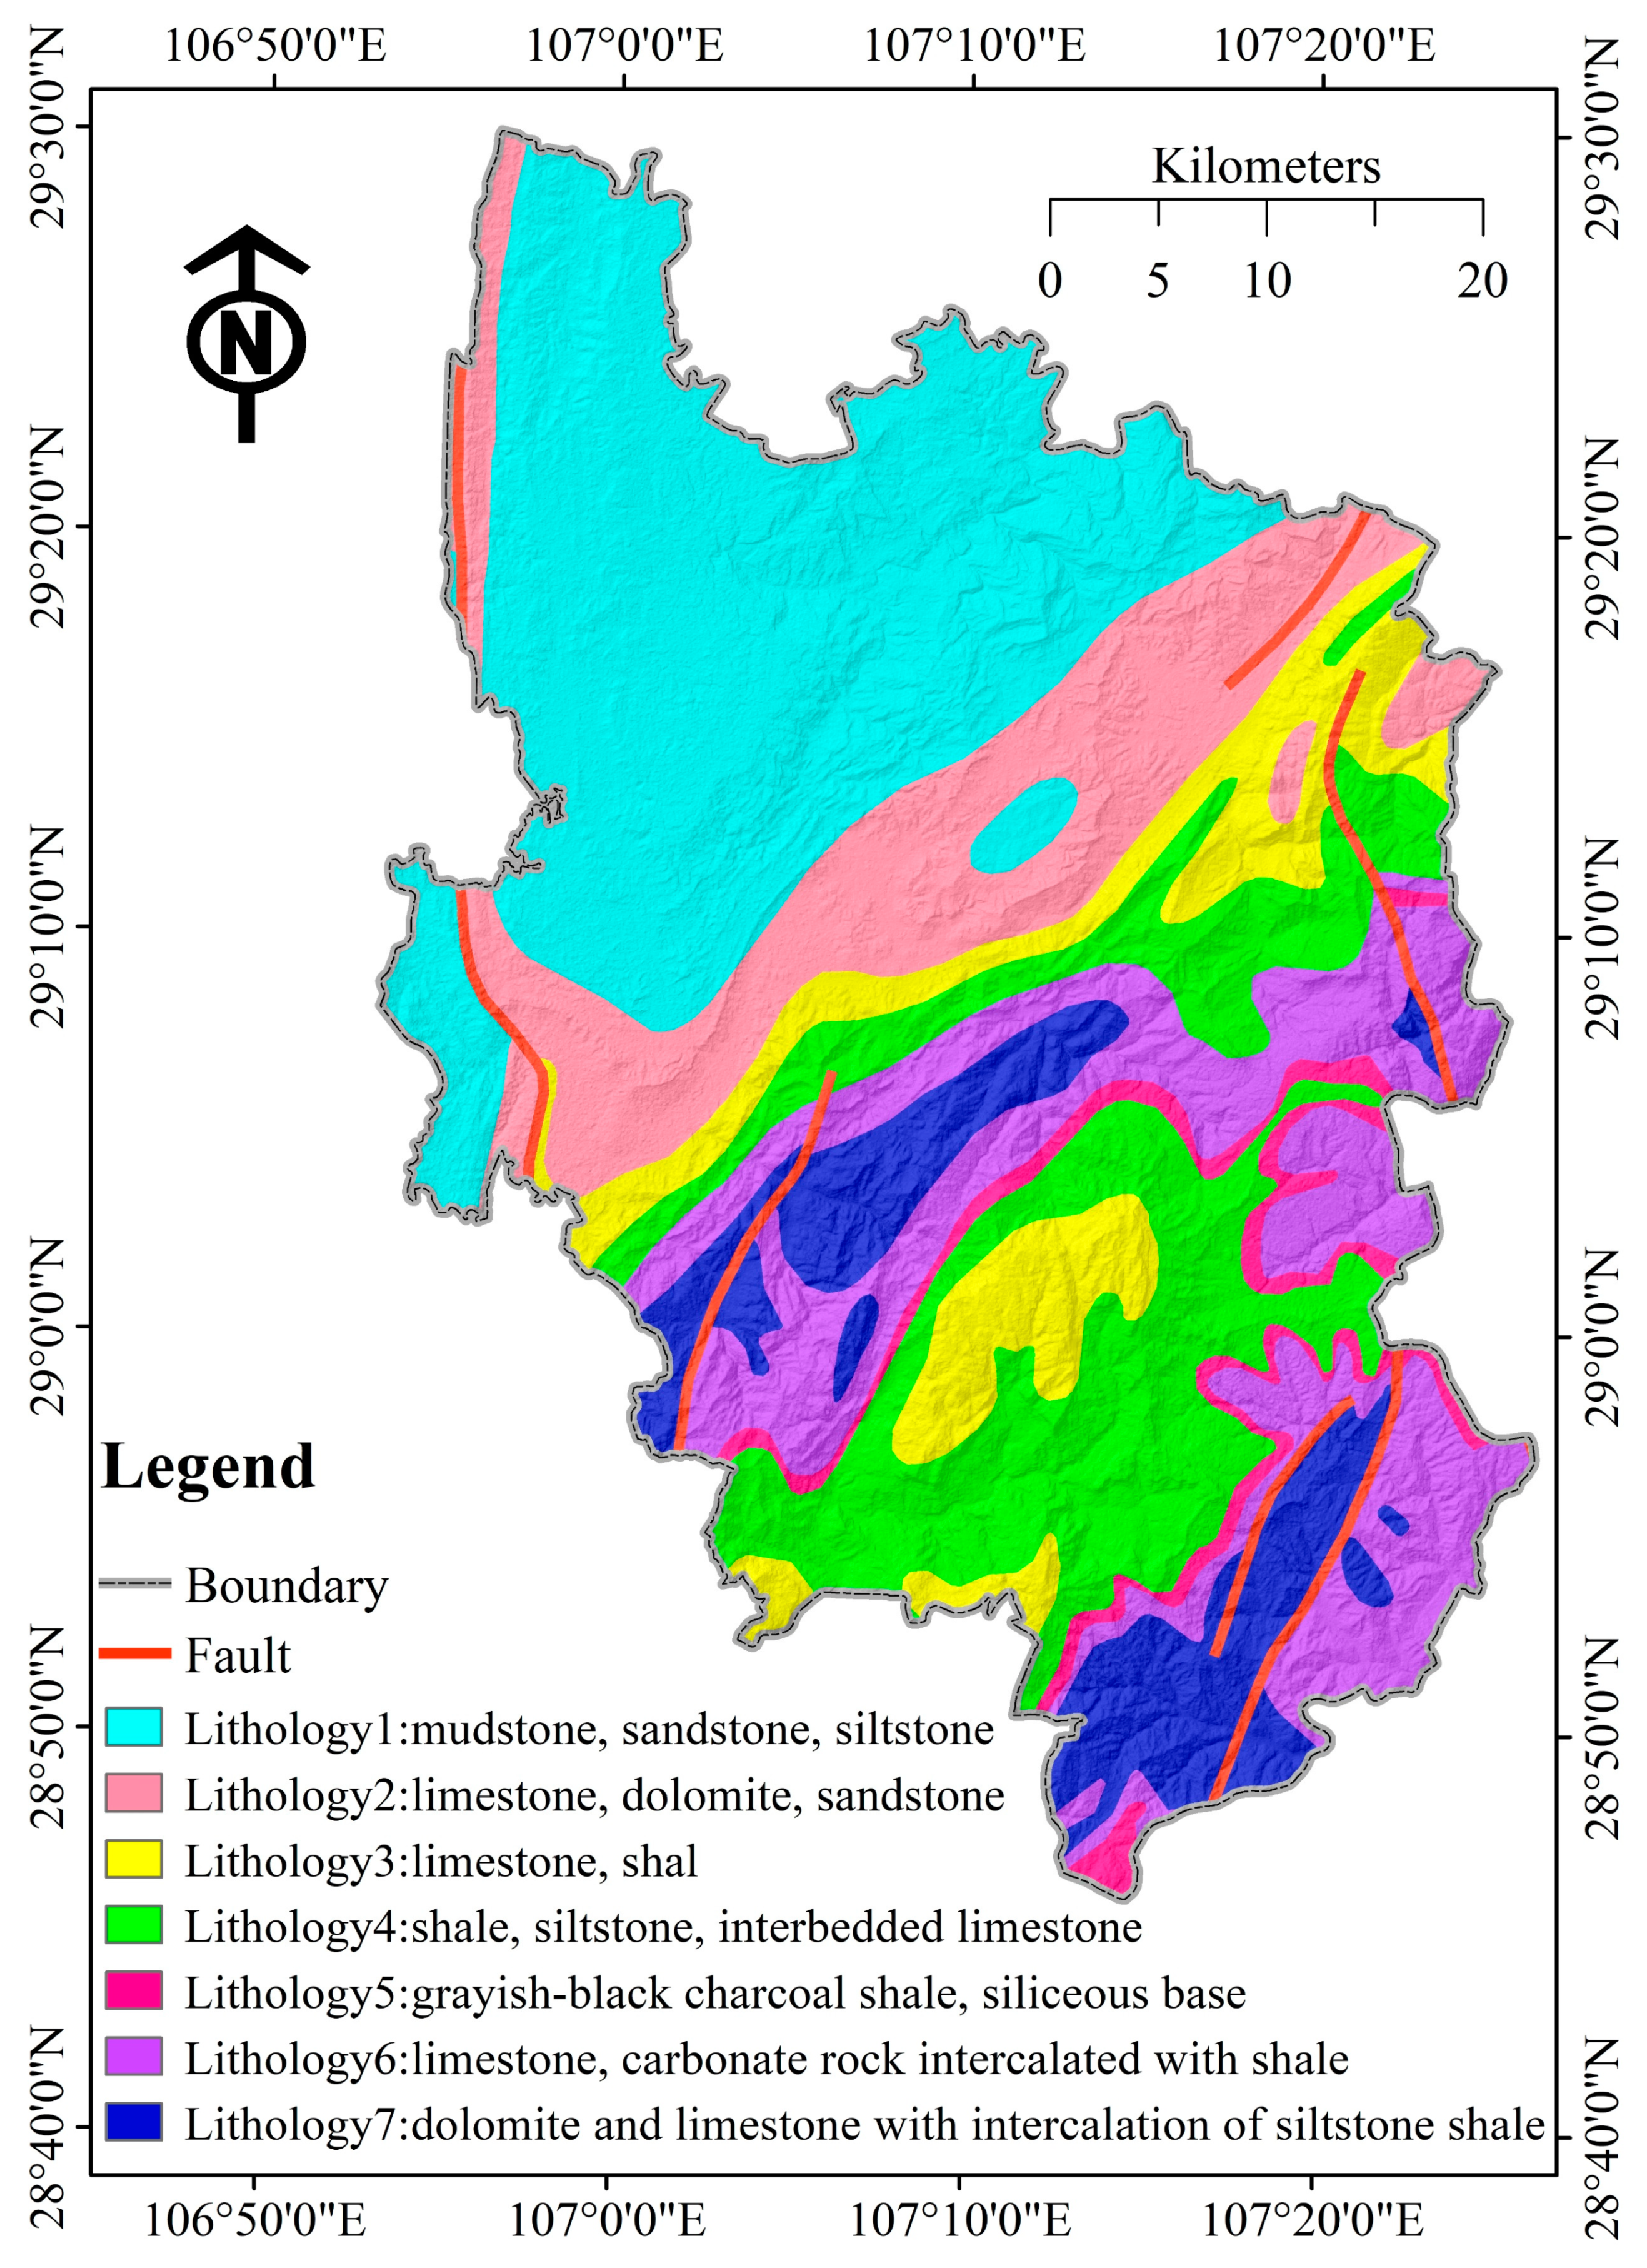
The research was conducted in the Nanchuan district (approximatively 2600 km2), which is located in northern Chongqing City (Figure 1). Geologically, based on the China Geological Survey, the study area outcropped a great variety lithologies (Figure 2, Table 1) (http://www.cgs.gov.cn/). The study area falls in the adjoining zones of the southeast edge of the Sichuan Basin and the northern Yunnan-Guizhou Plateau. The topography and geomorphology of the Nanchuan district have both basin and plateau characteristics. Faults in the study area generally strike in NNE, NE, and NNW directions, of which the main type is compressional fault. The Nanchuan urban district is situated on the border of many middle-low mountains. The Dalou Mountains, in the east of Nanchuan urban area, range from 1000 to 2000 m in altitude. Whereas red-beds landforms, in the west of Nanchuan urban area, are relatively smaller, with altitudes range from 500 to 1000 m. In the study area, slope belts are extensively covered by Quaternary deposits (http://www.cgs.gov.cn/).
3. Materials and Methods
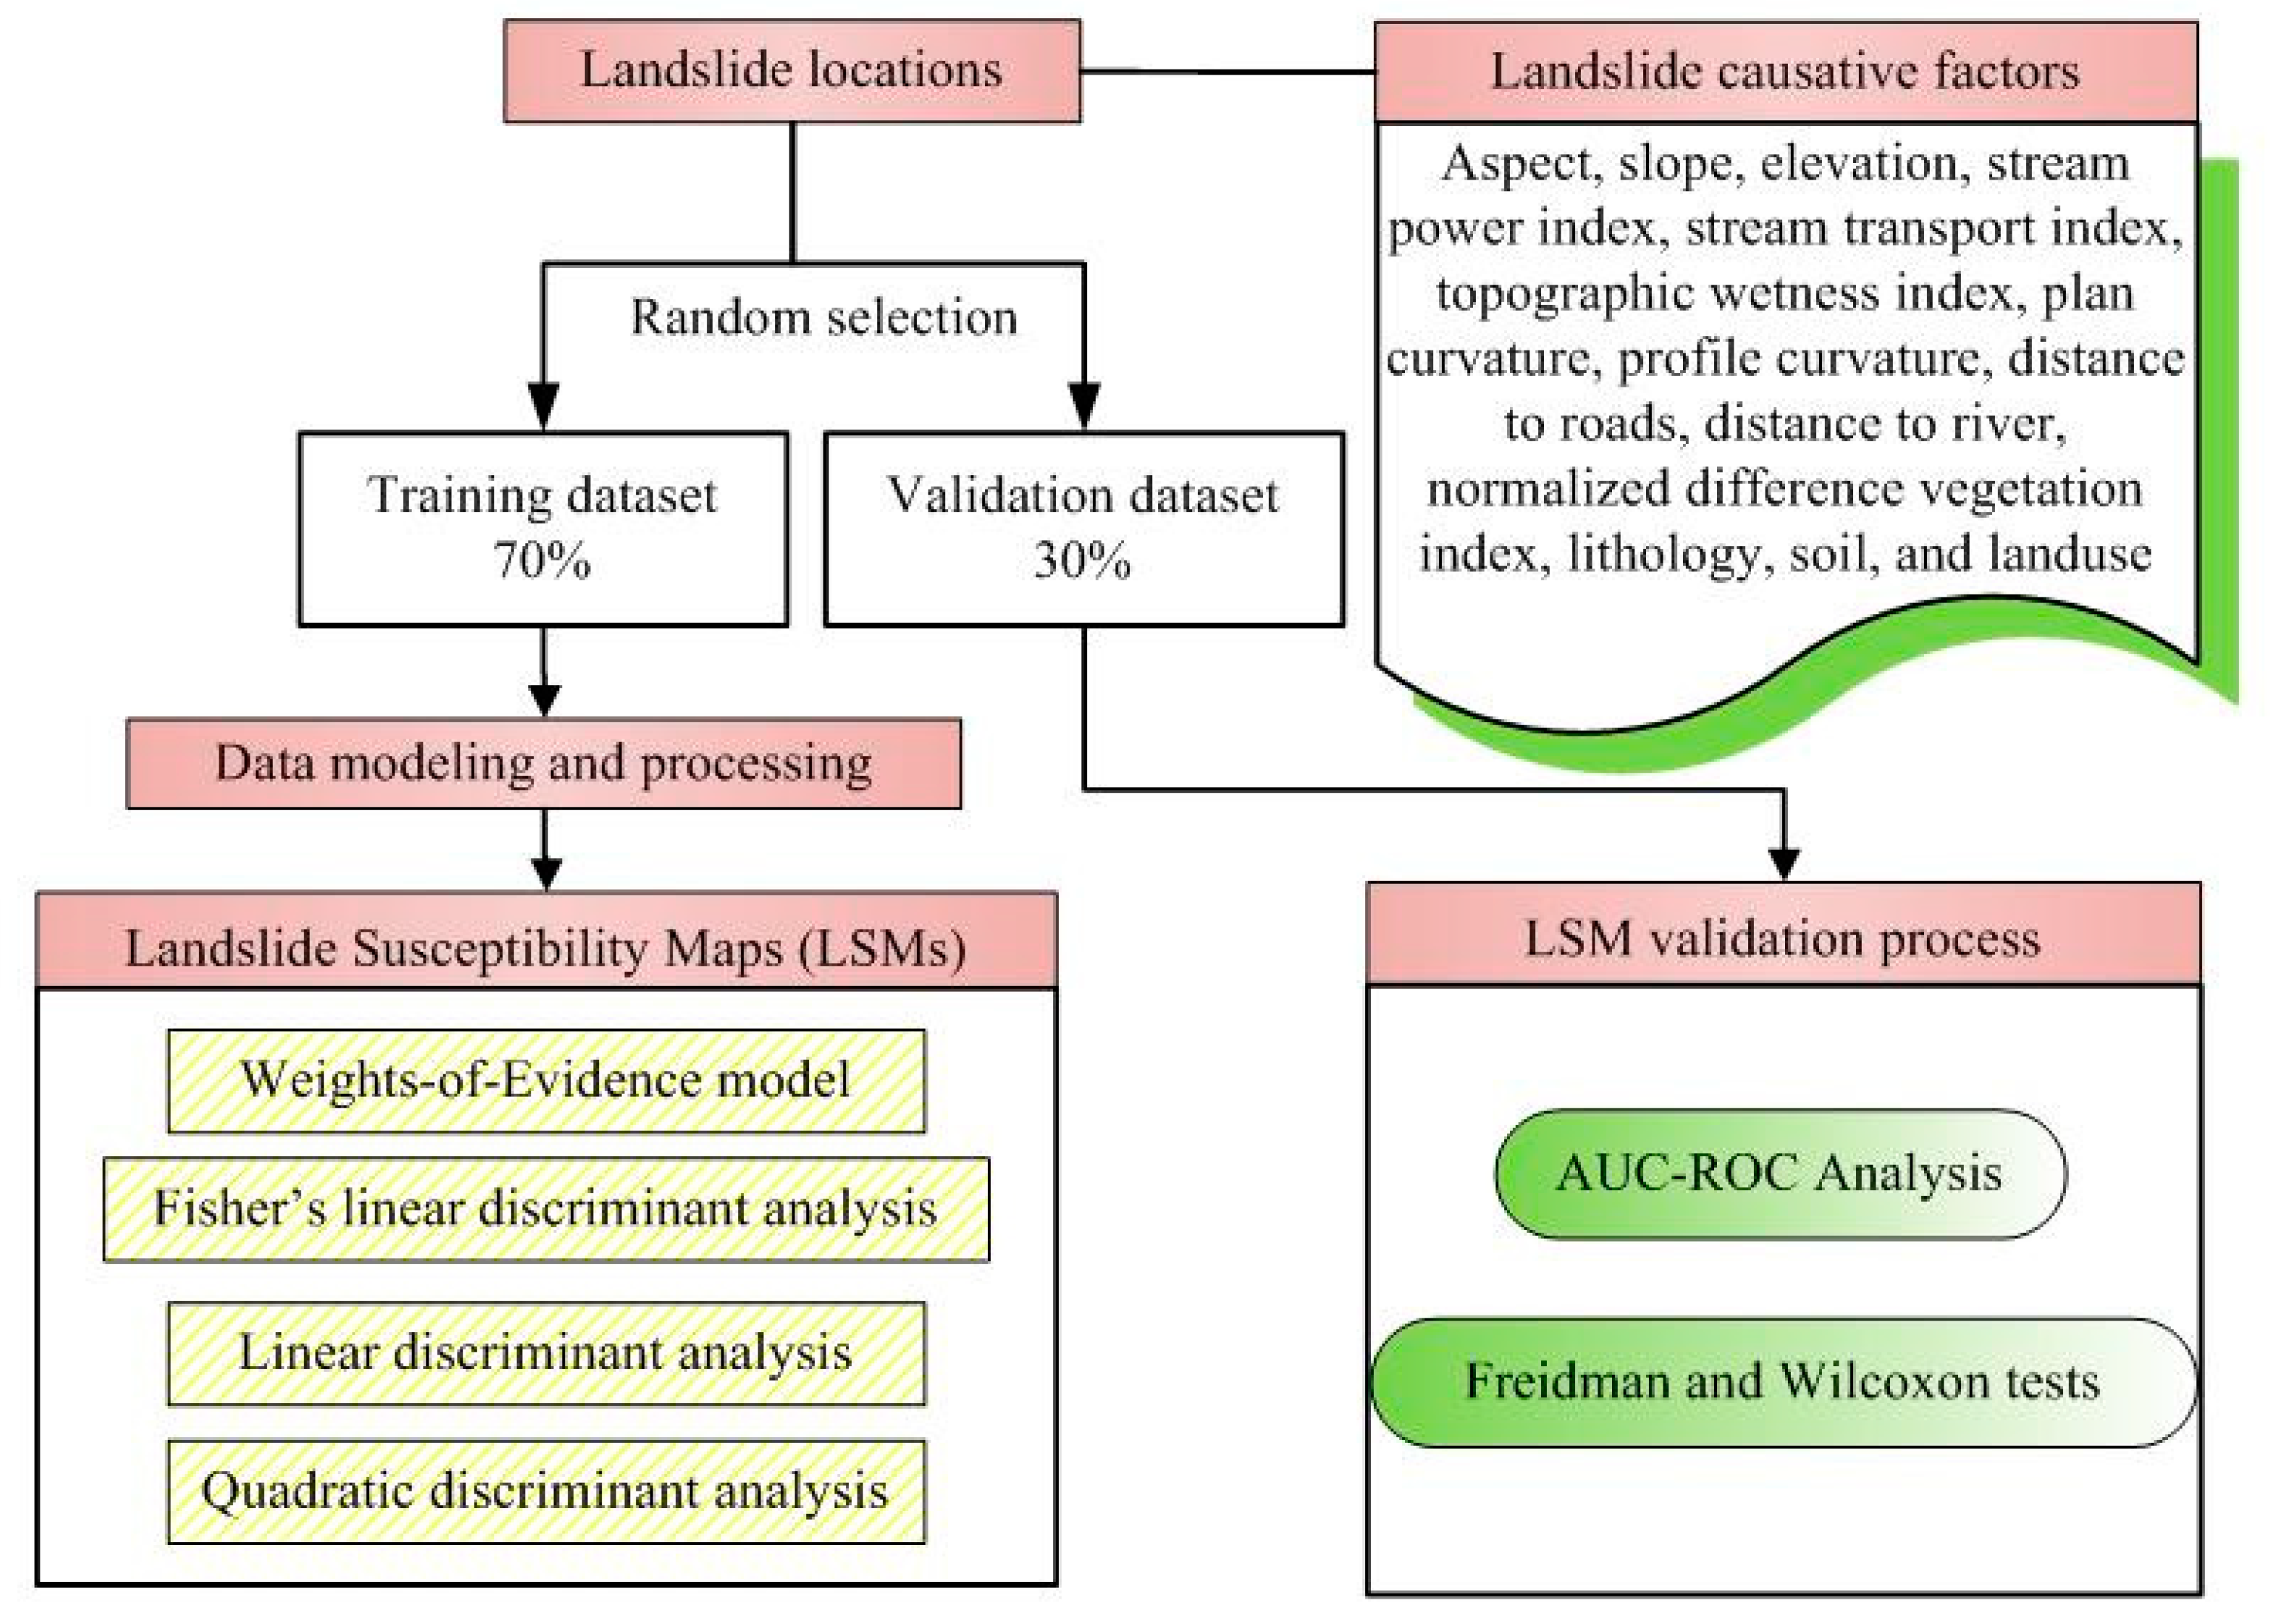
In the present study, landslide susceptibility analysis was conducted using four models. The modeling steps are presented in Figure 3.
3.1. Preparation of Training and Validation Datasets
Landslide inventory is essential to successfully perform landslide susceptibility mapping in a giving area. Firstly, landslide inventory map was extracted from previous landslide records, aerial photographs, and field research. A total of 298 landslides were identified and randomly split into training (70% of landslides; 209) and validation datasets (30% of landslide; 89). An analysis showed that the size of the largest landslide was 840,000 m2 and the smallest was 70 m2.
According to regional geographical and geological conditions, we selected sixteen representative causative factors (Supplementary, Figure S1) to apply the assessment of landslide susceptibility. Depending on the factor attribute, the selected causative factors included three different types: (1) topographic factors, which are aspect, slope, elevation, power index stream power index (SPI), sediment transport index (STI), topographic wetness index (TWI), plan curvature, and profile curvature; (2) distance-related factors, which are distance to roads, distance to rivers and distance to faults; and (3) environmental factors which are normalized difference vegetation index (NDVI), lithology, land use, soil, and rainfall [54,55,56]. The digital elevation model (DEM) is derived from the ASTER GDEM data with the resolution of 30 m × 30 m. Then the aspect, angle, elevation, profile curvature, plan curvature, STI, SPI, and TWI factor maps can be extracted from DEM data.
Slope angle and aspect are two important landslide configuration factors. Slope angle is directly related to landslide formation [20,57]. Slope aspect can indirectly affect landslide occurrence via wind, lineaments, and sunshine effects [20,58,59]. The elevation is a significant factor, which shows geologic and geomorphologic characteristics [60,61].
The power index stream power index (SPI) and sediment transport index (STI) measure the erosive power of water flow and overland flow, respectively [62]. They were calculated on the basis of specific catchment areas (AS) and local slope gradient in degrees (β) [63,64]. Equation (1), gives the net erosion and depositional area in a curved profile, while Equation (2) reflects sediment transport controlled by the slope angle [63,64].
The topographic wetness index (TWI) is another contributing factor affecting topography of runoff-saturated source areas [64]. The TWI is defined by Equation (3).
where α is the area drained per unit contour length at a point, and β is the slope [14,64].
Plan curvature illustrated the curvature degree of a contour line that forms the intersection of the horizontal plane and the ground [65]. Profile curvature expresses the rate of change of a slope angle in the direction of maximum slope [66].
Distances to roads, rivers and faults were compiled from the topographic map (1:50,000), and geological map (1:200,000), respectively. Three distance-related factors were built using a buffer for rivers, faults, and roads. Because faults can induce sharp ground displacement caused by ground stress. Building roads destroys the original terrain due to artificial slope cutting activities. Rivers weaken slope stability by different river density affecting groundwater potential [67].
The value of NDVI represents the degree of vegetation coverage [20]. The NDVI value can be acquired by the NDVI map obtained from Landsat 8 Operational Land Imager (OLI) images. The value can be calculated according to Equation (4).
where IR is the infrared band, and R is the red band.
Lithology is a decisive factor because it is closely related to landslide occurrence. Land use groups identified by using a Landsat Enhanced dataset. Different soil types lead to different susceptibility degrees, because it influences strength and permeability of rocks and soils. As the last causative factor, excessive rainfall can induce landslides.
3.2. Weight of Evidence
The application of weight-of-evidence modeling was demonstrated in this study for large-scale landslide susceptibility mapping. Based on the Bayesian probability model, it was originally used in medicine [68] and then developed for identification of mineral potential using GIS in many countries [68,69,70]. Some authors have employed the weight-of-evidence method to landslide susceptibility mapping [71,72,73,74,75,76,77,78]. This statistical method has many advantages, including its ease of use and speed because it is a quantitative data-driven method [79]. In using the WoE method, each relevant factor’s weight was measured by analysis of the spatial relationship between the landslide location and each class of the causative factors.
The methods can be described as Equations (5) and (6). Additionally, the essential parameters can be calculated through each causative factor (B) based on the presence or absence of the landslide within a certain group of causative factors (N) [80].
P{B|N} is a conditional probability of B occurring given the presence of N. B and B in numerator and denominator signify the presence and absence of a causative factor while N and N signify the presence and absence of a disaster [81]. Positive weight (w+) and negative weight (w−) indicate the presence and absence of a predictable variable and the magnitude indicates the level of positive and negative correlation between a predictable variable and the landslides. The weight contrast, C = w+ − w− was used to measure spatial association. When the contrast value is equal to zero, a certain class of causal variable does not have a clear spatial association. Using Equations (7) and (8), the weight variances (S2) can be calculated as follows [82,83,84]:
Based on S2, the standard deviation of the contrast is given by , and the studentized contrast, C/S(C), gives a measure of confidence [85].
3.3. Fisher’s Linear Discriminant Function
FLDA is referred to as a statistical learning method, which can acquire optimal decision boundaries for a given data set. Discriminant analysis is used for this method to build a model [84]. Because classification must be performed in one-dimension, the FLDA algorithm projects training classes onto a line. This maximizes the distance between the means of two classes and minimizes their variance. For landslide prediction, landslide influence factors use the xi (i = 1, 2…n) representation, and two landslide classes use the Yj (j = 1, 2) expression. Parameter vector n is (Xi, Yj), ascertains the classification of Fisher’s linear discriminant [86]:
where Nb is the definition of a between-class scatter matrix, and Nw is a within-class scatter matrix defined as
where refers to the sample mean of the classes, and T values are training data. Using the limited optimization problem Equation (9), the invariant G(u) can be maximized.
3.4. Quadric Discriminant Analysis
As a soft computing learning algorithm, quadratic discriminant analysis (QDA) can separate the class of a case by the fit of its quadratic surface. The resulting value in each class expresses a normal distribution. In the current study, this univariate statistical method was used in landslide susceptibility mapping to build a model based on groups that contain landslide disaster statistical information [87,88]. QDA is based on finding a category membership comprising a square n × n matrix, where n represents a number of variables. These variables combine linearly following the form , where B is an n × n coefficient matrix, e indicates the linear combination coefficient, and c is constant [89]. Some advantages of QDA over LDA have been reported, such as the fact that covariance of each class need not be identical and different covariance values in classes can be properly handled.
3.5. Linear Discriminant Analysis
In 1936, Fisher pioneered the use of linear discriminant analysis. LDA is a popular machine learning method for high accuracy task classification [90]. In addition, parameter prediction is relatively stable [91]. For LDA objects, there are mutually-exclusive groups for independent input variables [92,93]. LDA first finds the linear combination of some classes of causative factors such as K = αV + m (m is constant). Determined by a linear combination, the estimated (k) values with proper α coefficients can best distinguish a case set [89]. This step is required for data preprocessing to reduce dimensionality in machine-learning models.
4. Results and Analysis
4.1. Correlation Analysis of Influencing Factors
In this study, sixteen different input variables were selected from numerous possible variables for landslide susceptibility mapping and have been applied to construct a model using four different methods. The spatial relationship between each causative factor and landslides were analyzed using the WoE model (Supplementary Table S1). Using this method, W+ and W− are acquired first. The weight contrast (C) can be calculated by subtraction between W+ and W− and the variances in W+ and W− are represented by S2W+ and S2W−. Then, the standard deviation can be calculated by S2W+, and S2W−, which is shown as S(C) (Supplementary Table S1). C/S(C) reflects the final weight, in which positive C/S(C) in each causative factor class indicates a positive correlation with landslide occurrence, while the negative value in each class indicates a negative correlation in this class.
There was no significant difference in weight value based on the comparative analysis of two values C and C/S(C) for the aspect factor. For slope, the C/S(C) value in the 10–20 class had an apparent maximum weight over other classes and nearly half of the landslides occur in this class. Elevation classes (312–700) and (900–1100) were positively correlated with landslide occurrence. For STI, SPI, and TWI, the maximum index interval had a maximum weight representing maximum susceptibility for landslides. The flat curvature had high landslide susceptibility, and the C/S(C) value decreased with the plan curvature increase or decrease. The C/S(C) values for different distance ranges from the roads, river, and faults. The largest WoE value occurred in the 0–200 m distance to roads class with WoE value of 4.5, then the percentage of landslides and WoE values were lower in the next class. For the distance to river and distance to fault classes, the result values did not show significant characteristics. In general, the presence of vegetation may reduce the landslide hazard. However, there are some studies that offer a different point of view [94,95]. From the analysis, lower values of NDVI (<0.26) had positive WoE values, whereas higher NDVI values (>0.26) had almost negative WoE values. The correlation between lithology and WoE values of landslides shows that Ordovician deposits (group-5) mainly include charcoal shale and the siliceous base is the most landslide-prone deposit. The second-most landslide-prone lithologies are (group-2) and (group-4), with relatively weak strength.
4.2. Constructing Landslide Susceptibilitymaps
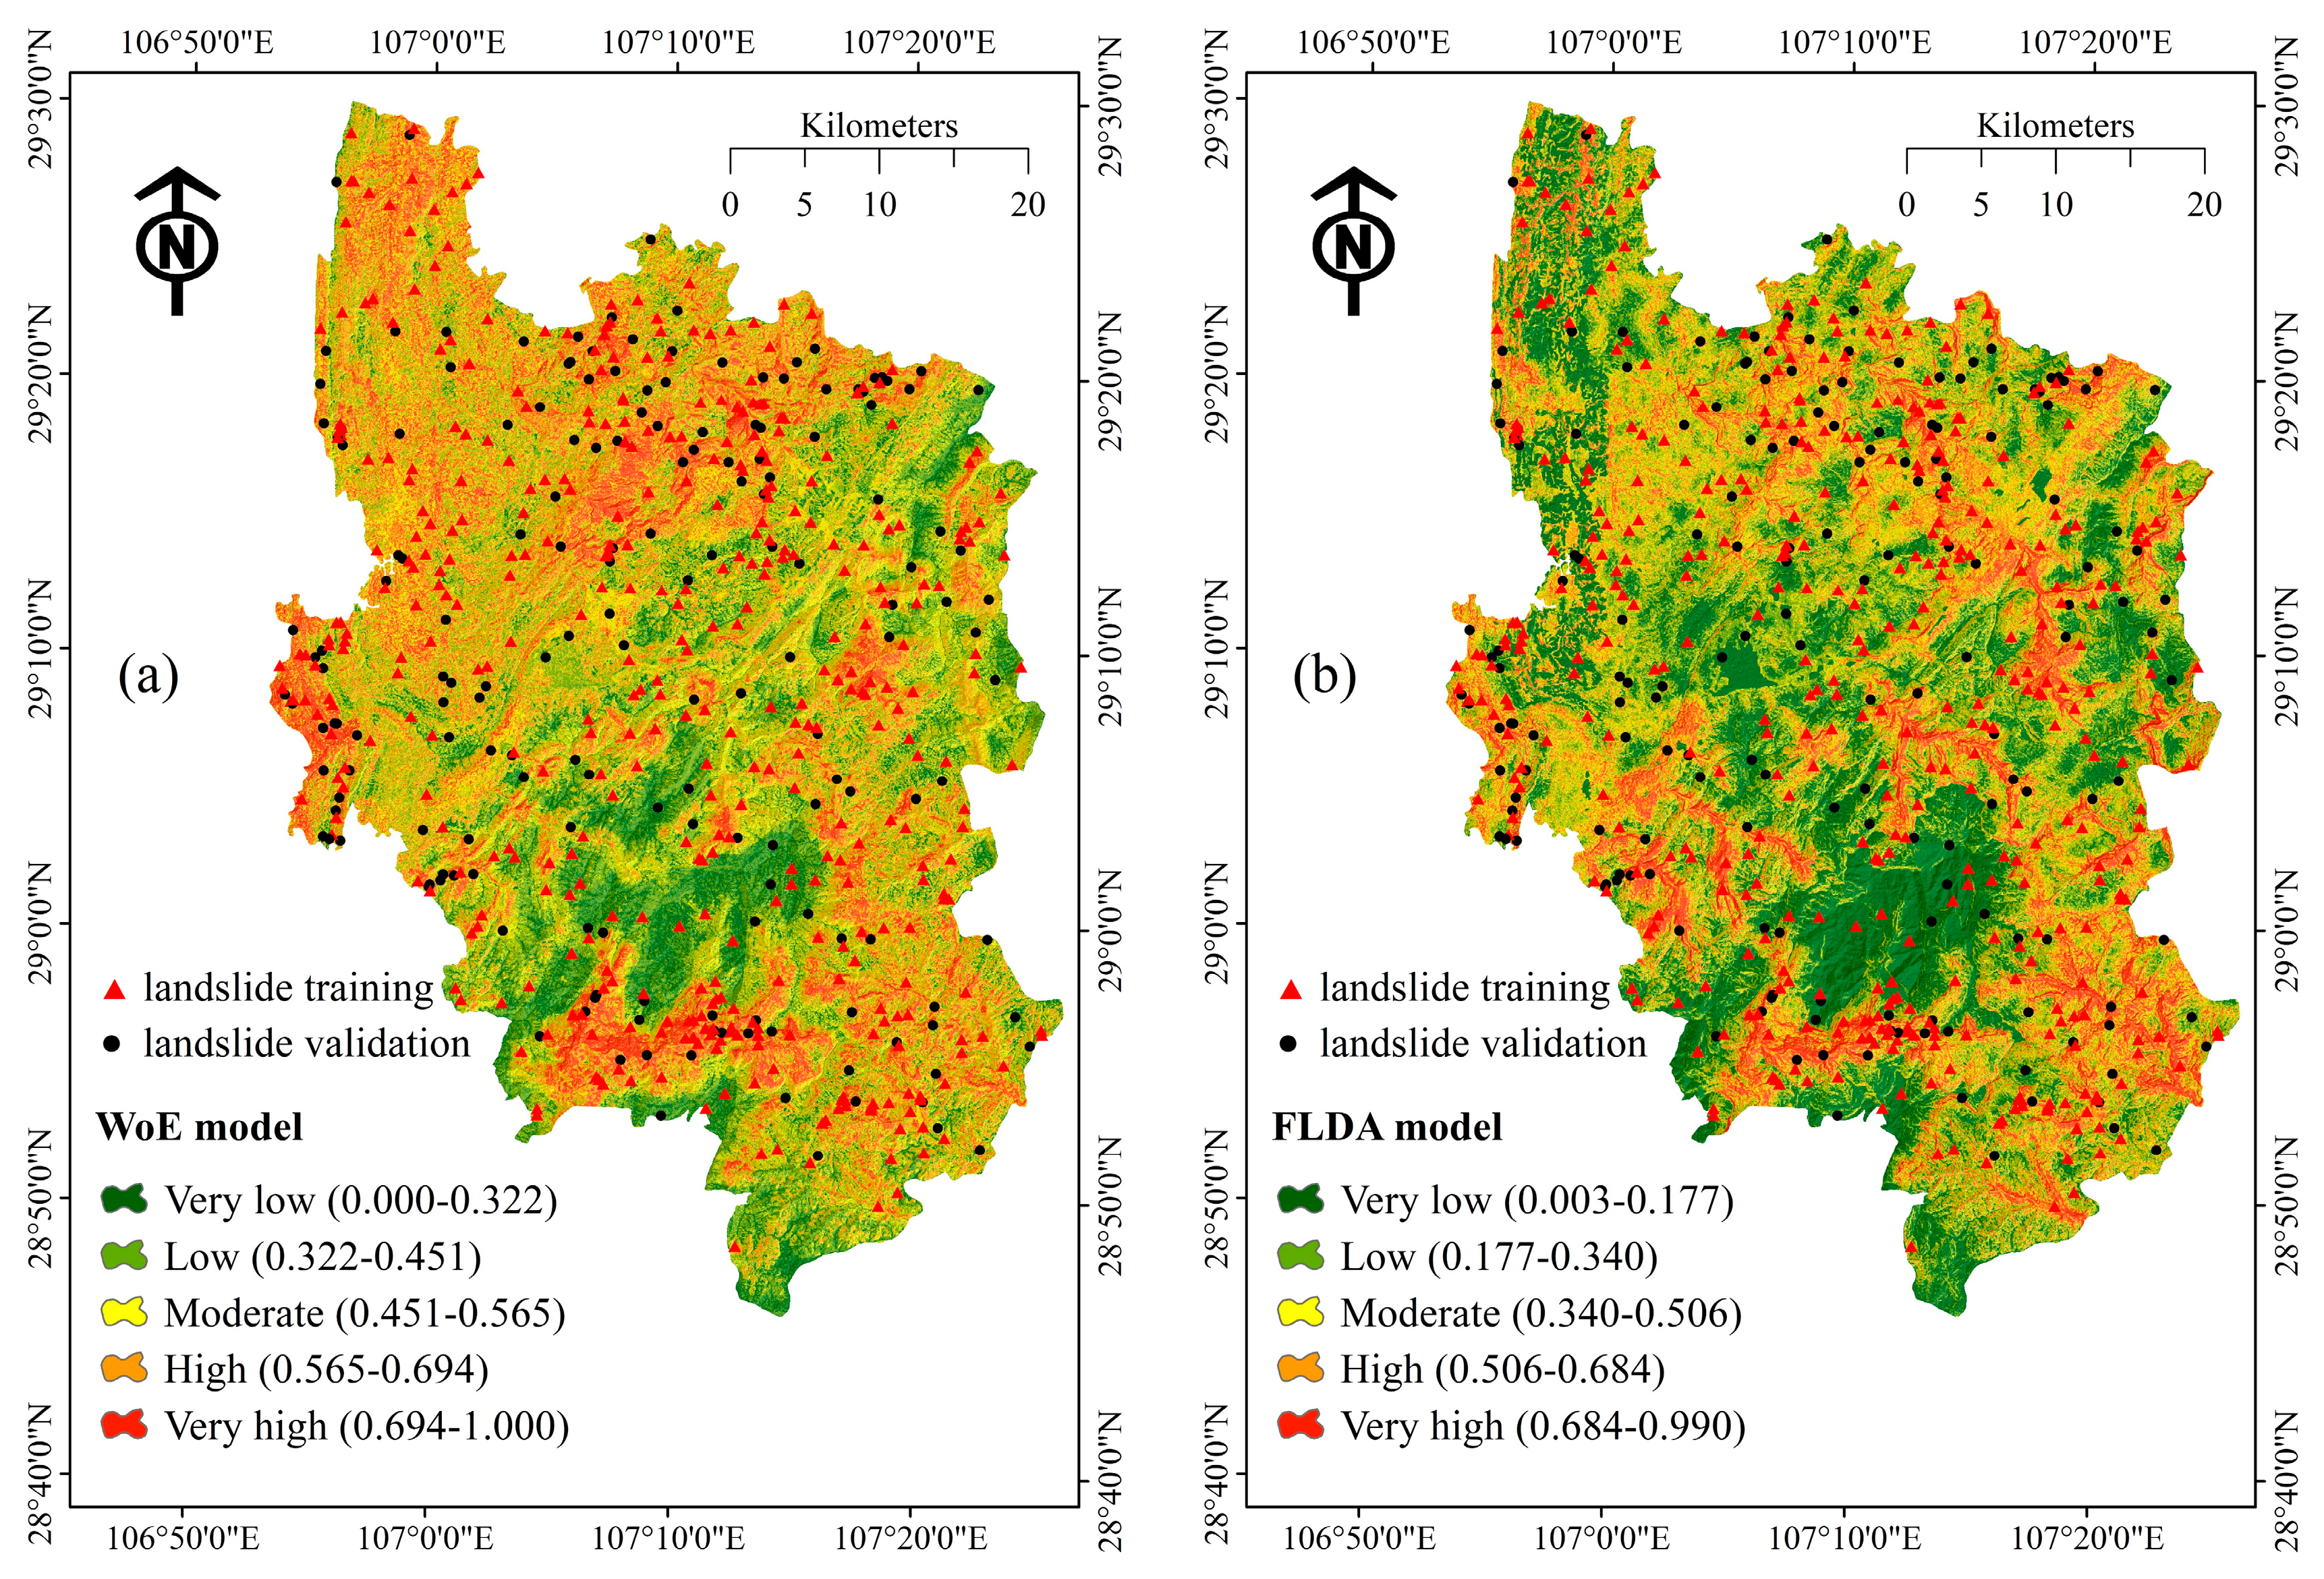
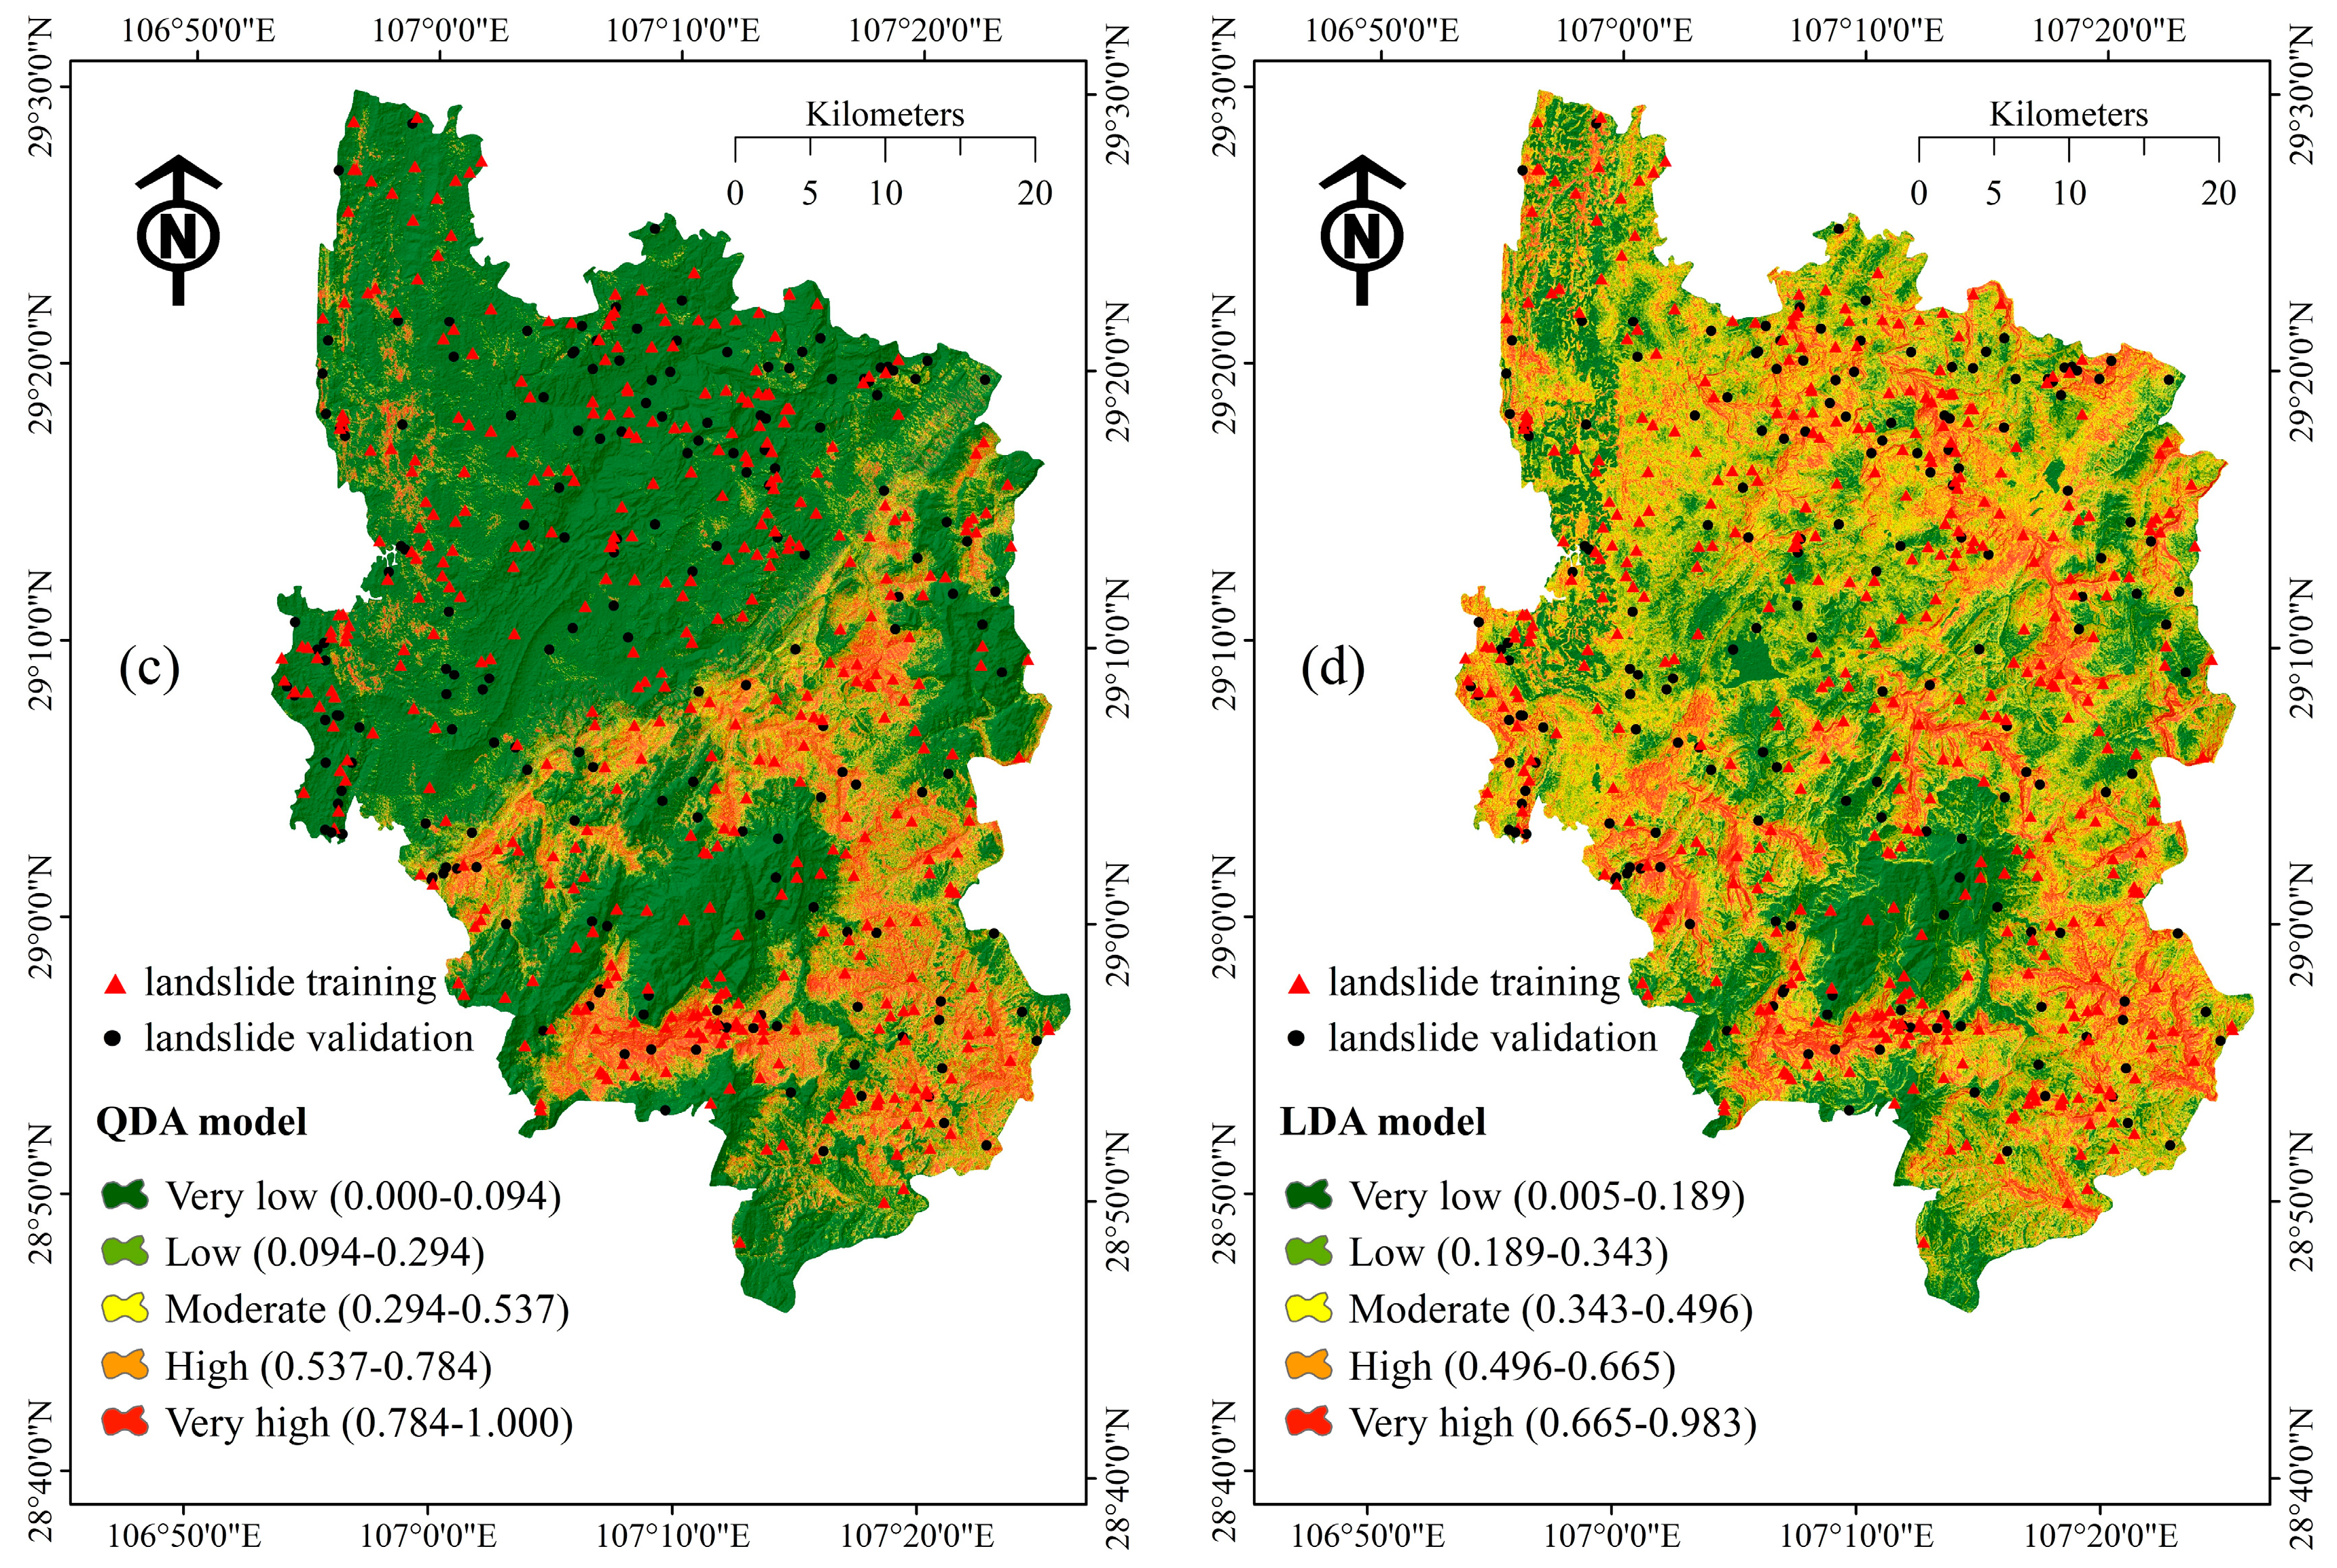
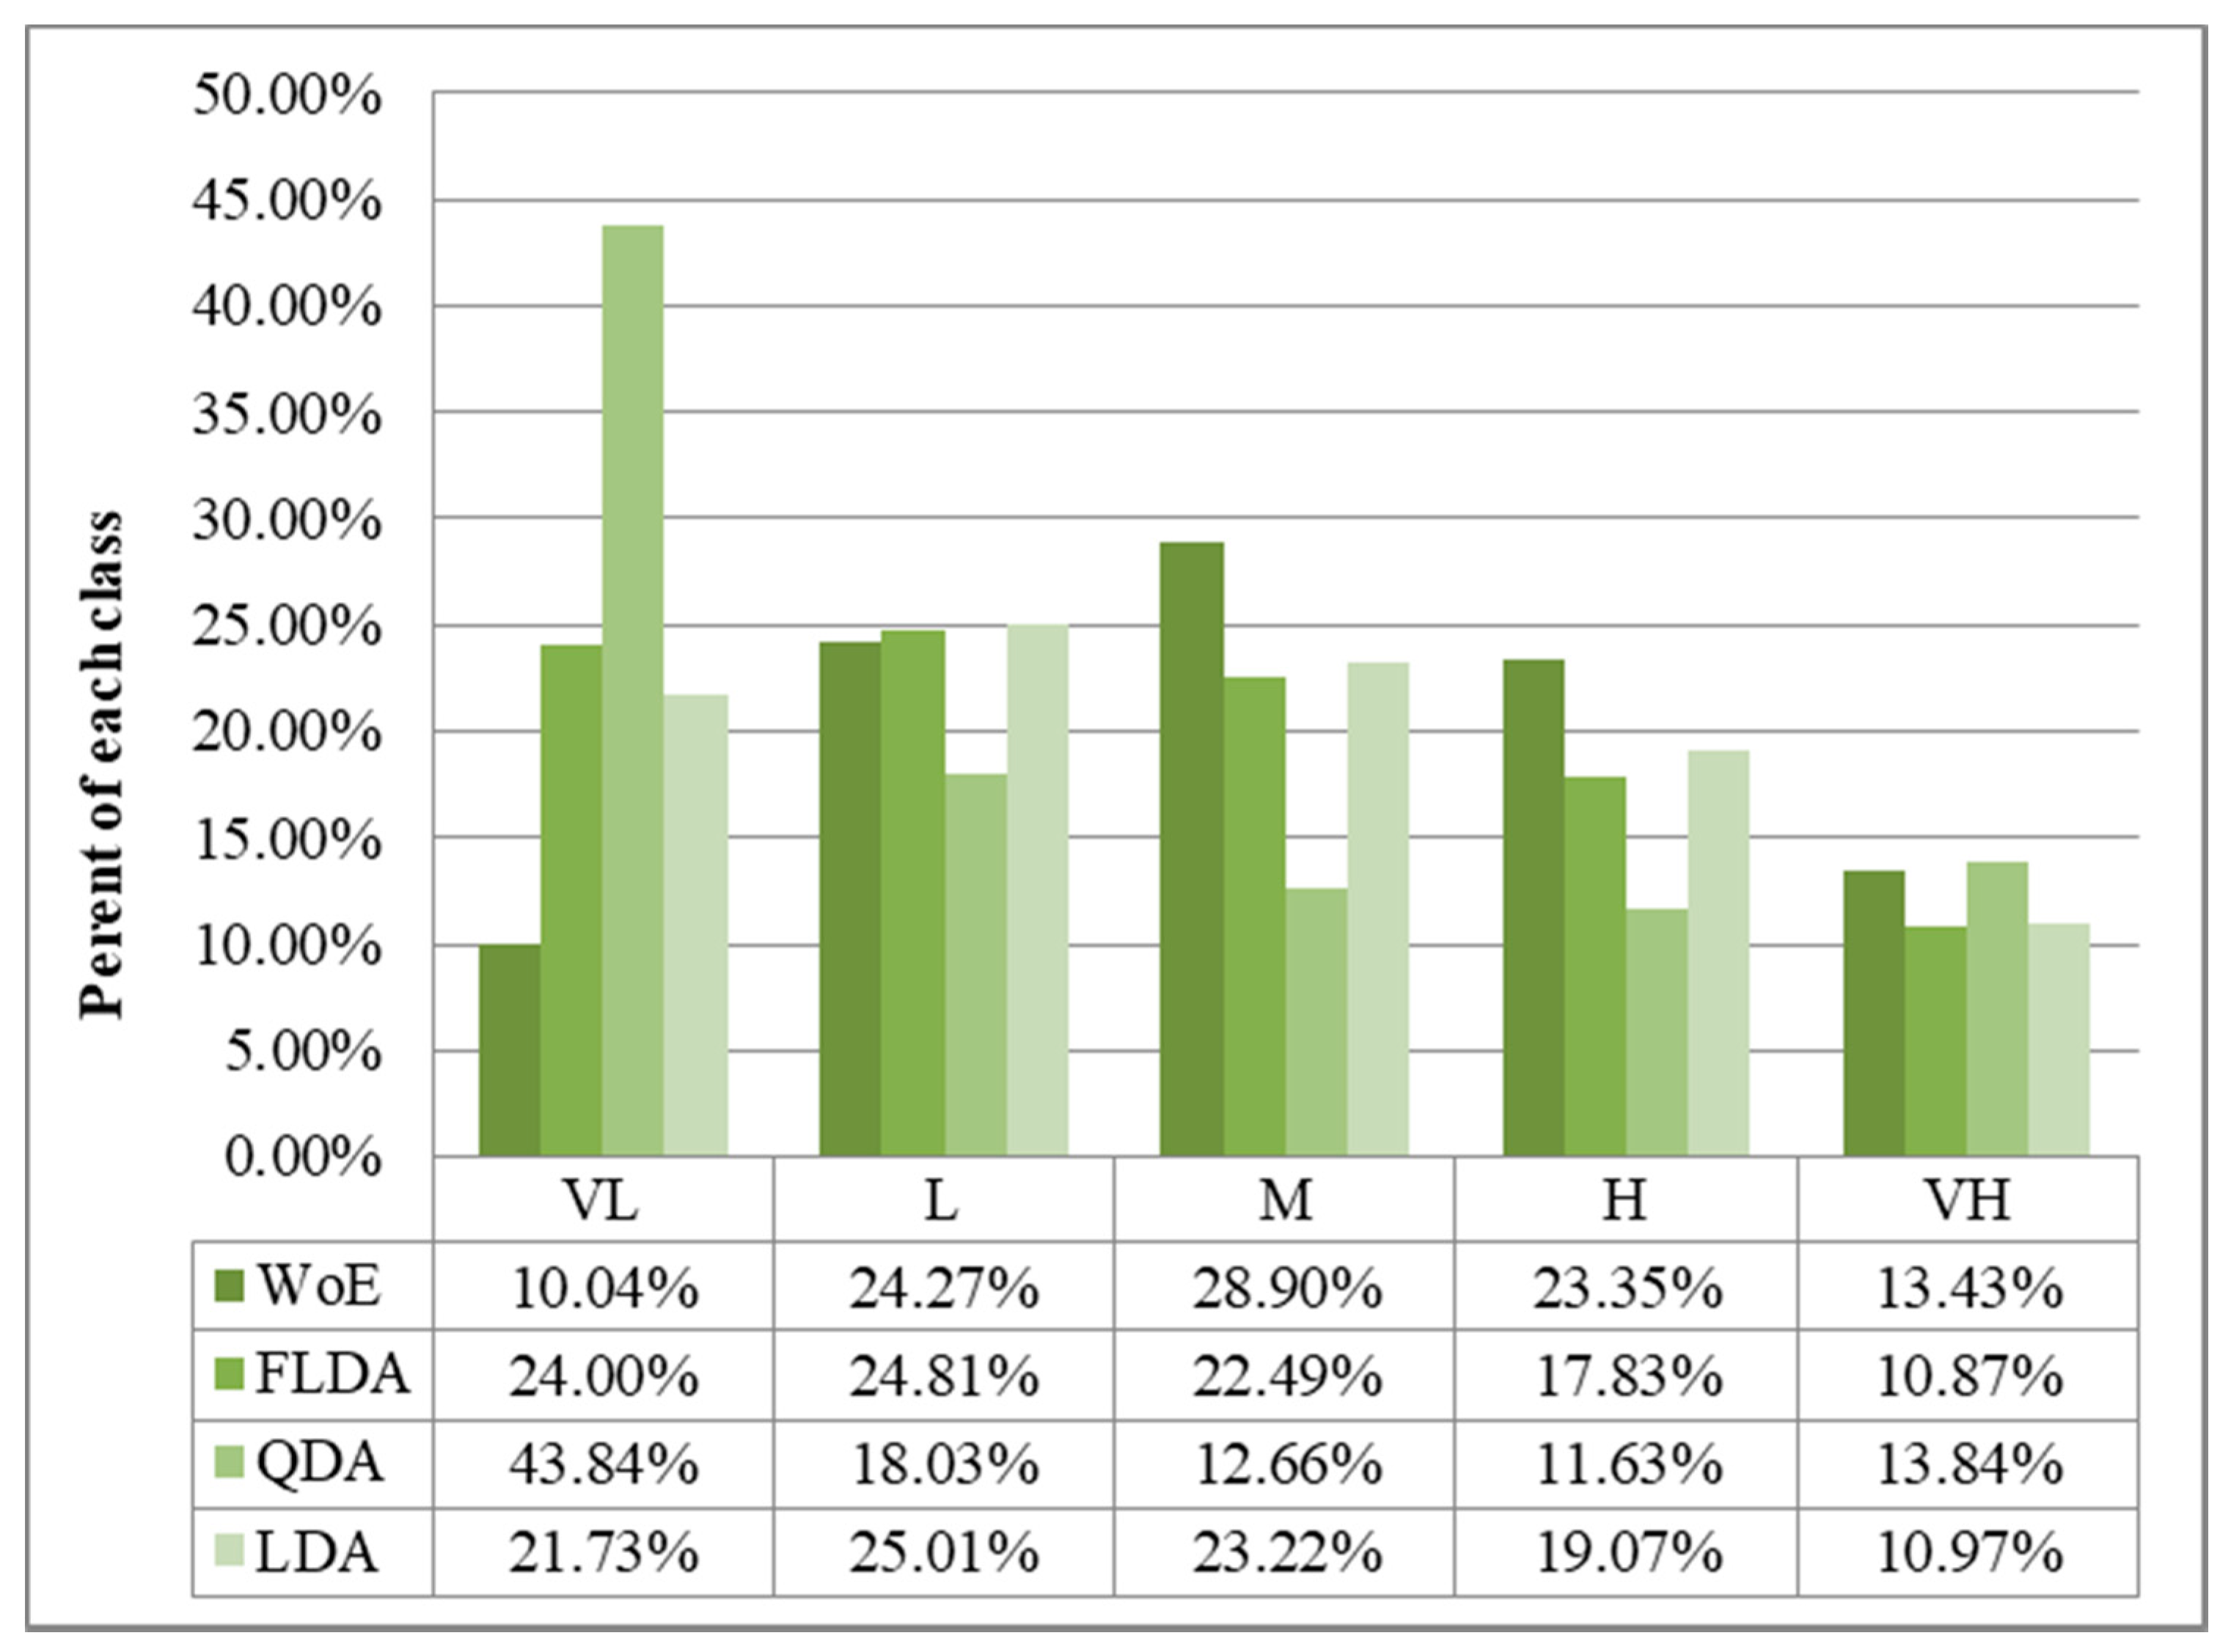
The landslide susceptibility map was produced using layers and training points of the sixteen selected factors, and the map accuracy was firmly controlled by factor selection and combination [96]. The probability values (LSI value) were calculated by extracting the spatial relationship between landslides and each selected factor. Through the application of FLDA, LDA, QDA, and WoE, the LSI values of four landslide susceptibility maps for each pixel were obtained. After normalization, the acquired LSI values were between 0 and 1. After reclassification, the landslide sensitivity map was generated, as shown in Figure 4. Among some classification methods [97], natural breaks were used depending on the histogram of landslide susceptibility indexes. A forward stepwise process reclassified the LSI value into five different class breaks of very high susceptibility (0.70–1), high susceptibility (0.56–0.7), moderate susceptibility (0.45–0.56), low susceptibility (0.32–0.45), and very low susceptibility (0.00–0.32) for the area under investigation. The FLDA, LDA, QDA, and WoE landslide susceptibility maps were constructed following these divisions. The model results are shown below, and the area percentage of each class illustrated in Figure 5. Then, the next step was to explore comparative analysis results of our four models.
4.3. Models Validation and Comparison
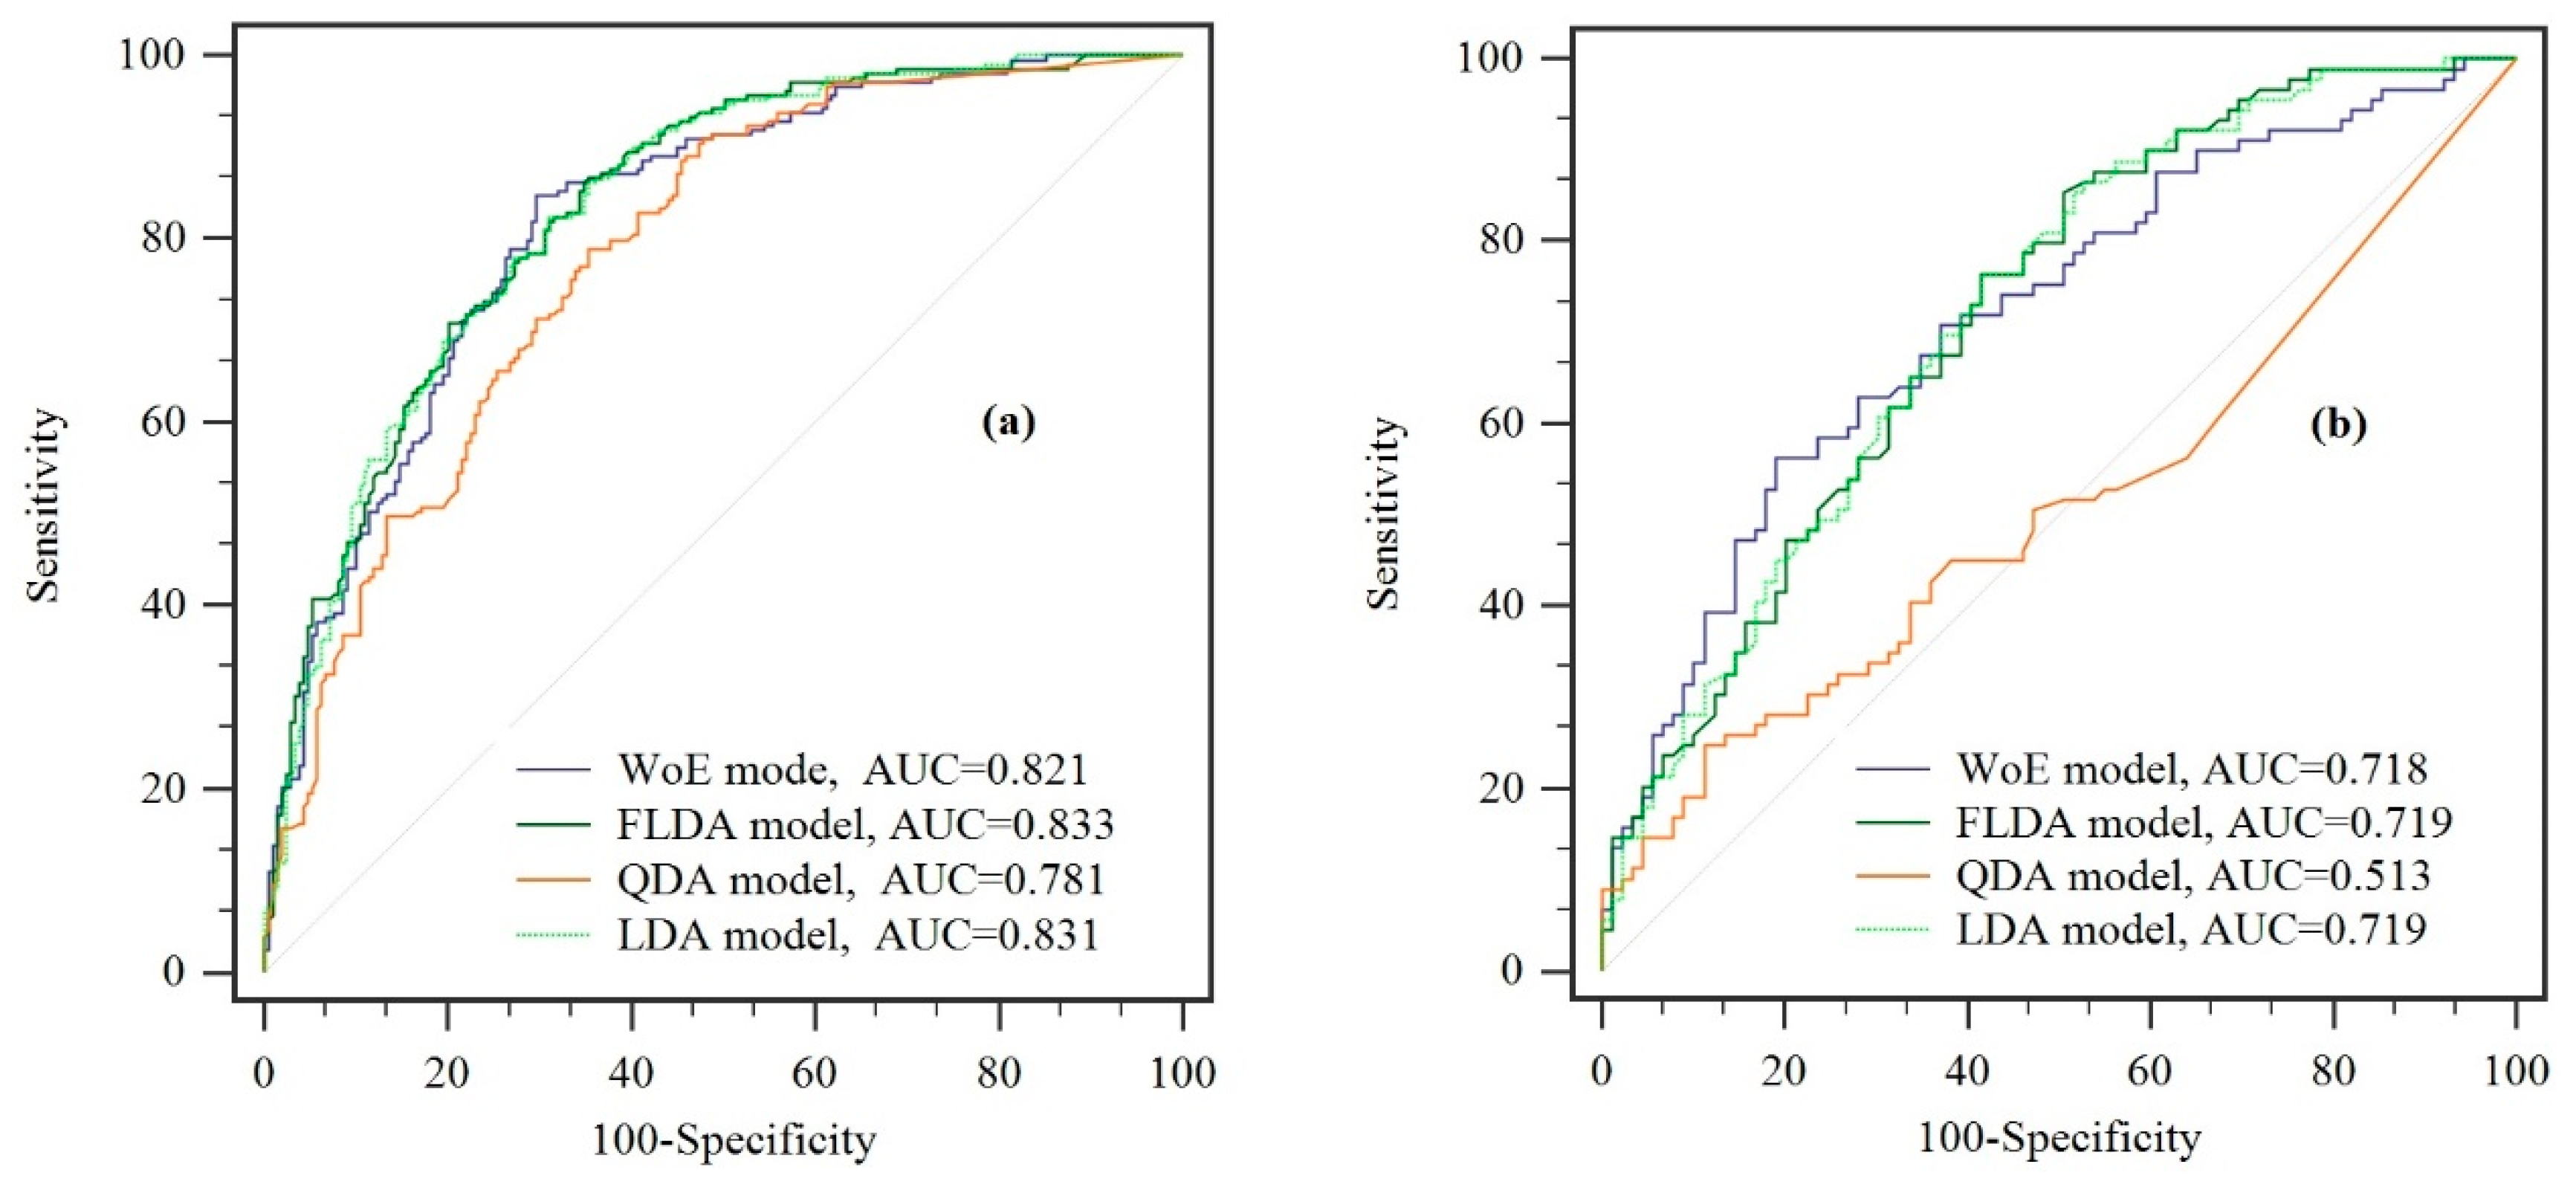
The receiver operating characteristic (ROC) curve, as shown in Figure 6, assessed and validated the models, as it is a common overall performance prediction and accuracy evaluation quantitative index-based technique [98,99,100,101]. Two particular ROC curves, the name of success rate curve (SRC) and prediction rate curve (PRC), have been shown using training and validation datasets, respectively [102,103,104]. The datasets ROC curve used divide the landslide susceptibility index into two groups (landslide and non-landslide) by the size of the value. The x-axis of the curve shows 100-specificity, which expresses the ratio of correctly predicted landslide points, while the y-axis of the curve shows sensitivity, which expresses the ratio of correctly predicted non-landslide points [103,105]. A quantitative index (AUC) represents accuracy and goodness-of-fit for the performance of the four models and represents the area under the ROC curve [40,106,107]. According to the meaning of the AUC value, when the value is 1, the sensitivity and specificity are 100%, which indicates all landslide pixels are correctly classified. Further, the lower AUC value has lower accuracy, AUC > 0.9 indicates an excellent fit, 0.8–0.9 is very good, 0.7–0.8 is good, 0.6–0.7 is moderate, and <0.6 indicates poor accuracy [108].
Performance analysis based on four landslide models results of the SRC (using training dataset) is demonstrated by Figure 6a. Similarly, the PRC result (using validation datasets), which used the evaluated predictive ability, is demonstrated by Figure 6b. The FLDA model was the best for prediction capability and had an AUC value of 0.821. Correspondingly, the FLDA model also has the highest prediction rate for AUC = 0.719. In the training dataset, the other two models, LDA and WoE, had slightly lower AUC values 0.831 and 0.821. Therefore, in the SRC curve, the success rates of LDA and WoE models were relatively high. In the validation dataset, the prediction rate performed well, and the AUC value was close to the maximum (AUC = 0.719 and AUC = 0.718). This was followed by reducing AUC values belonging to the QDA model, in which prediction accuracy is good and predictive ability poor. The AUC values for this model were 0.781 and 0.513 on the SRC curve and the PRC curve, respectively. Hence, from the above analysis results, all four models are considered to exhibit a reasonable SRC, in which the FLDA model shows the highest performance in predicting landslide susceptibility, followed by the LDA and WoE models. On the PRC curve, prediction value was somewhat lower and QDA much lower.
In addition to the AUC quantitative index method, Friedman [109] and Wilcoxon signed-rank [110] statistical tests also can assess model prediction ability. To make the comparison, we first conducted Friedman tests. This test is based on the null hypothesis that at the significance level of α = 0.05 the landslide model group would have no significant difference. Based on this assumption, the p-value was used, and if p < 0.05, the previous assumptions were accepted; otherwise, the null hypothesis was rejected [111]. Table 2 and Table 3 show the result of this test, which display that the mean ranks for the FLDA, LDA, WoE, and QDA models were 2.77, 2.47, 2.44, and 2.32, respectively. The chi-square and p-value are 27.019 and 0.000 in this test. Thus, it implies significant differences among the five models.
Systematic pairwise comparison explored the significant differences among the four models. The analysis was conducted in six groups assembled from any two pairs of landslide models, which is the Wilcoxon signed-rank test. Using the Wilcoxon signed-rank tests at the 5% significance level, the p-value and z-value were used to test whether to accept each group’s hypothesis. The condition for rejecting the null hypothesis assumed that there was no significance between the models if the p-value < 0.05 and the z-value was N (−1.96 and+1.96). According to Table 4 of the Wilcoxon signed-rank test results, only the WoE model and QDA model have no significant difference with z = −0.750 and p = 0.453. The other five susceptibility model groups were statistically different. Furthermore, according to the ROC and statistical tests, FLDA, LDA, and WoE are acceptable for LSM in the study area. The QDA model showed the worst performance among the models.
5. Discussions
Four quantitative statistical models were utilized in landslide susceptibility mapping for the study area. Additionally, the four approaches explored the linear and non-linear spatial relationships among the landslide-prone areas and sixteen causative factors, which are independent of the statistical distribution. QDA and LDA provided a fairly dependent data distribution, and WoE was characterized by operating intuitively and was not dimensionally sensitive [112,113]. QDA and LDA had the same performance indicators, although QDA was like a black box approach, which is an disadvantage for interpretation. However, in the current study, the LDA model could be interpreted straightforwardly [114].
Before modeling, to identify highly susceptible landslide factor classes in any modeling approach, WoE can be used for preprocessing. This method evaluates the weight value of all causative factor classes, which can measure the possibility of a landslide. WoE is similarly used in building landslide models in this research, and it has shown reasonable results.
Within the WoE constructed by W+ and W−, the C/S(C) calculated by the ratio of C to standard deviation S(C) can guide the significance of the spatial connection for each causative factor class. If the C/S(C) value was positive, the factor was favorable for spatial association with landslides; if it was negative, the spatial association was negative. The analysis revealed that a slope with the range of 10–20 had the maximum weight, representing maximum landslide susceptibility. This result was consistent with previous research [85]. It also can be seen that elevation of 900–1100, SPI of >20, STI of >20, TWI of >2.5, rainfall of 333.62–1221.86, road distance of 0–200 m, and lithological group 5 had the highest impacts on landslide occurrence, as evidenced by relatively high values in these classes. In addition to the above factors, some factors (aspect) had poor sensitivity because the values oscillated around zero. This is the same as has been found in other analyses [115].
This study also investigated the performance of three data-mining models of FLDA, LDA, QDA integrated with WoE. The results showed that FLDA and LDA models exhibited excellent performance; where FLDA had the best performance, followed by LDA. They all outperformed the QDA model for spatial prediction accuracy. The areas under the ROC curve using the training dataset for the three models ranged from 82.1% to 83.3%, and they had extremely high AUC values. The analysis of the PRC using the validation dataset indicated that the goodness-of-fit for the three susceptibility models was good, and showed two high prediction powers with AUC values of 0.718 and 0.719, because FLDA and LDA models had the same maximum value. Moreover, the results of the ROC using the training and validation dataset showed that the QDA exhibited the worst performance, especially for the validation dataset analysis (AUC = 0.513). However, a comparison using the Friedman test of the model group revealed that the group models performed differently with statistical significance. It could also be concluded that, although the QDA model did not need identical covariance in each class and the complexity exceeded that of LDA, the prediction accuracy was not enhanced. Instead, the learning performance reduced significantly, and this model could not interpret the parameter.
6. Conclusions
This large-scale landslide susceptibility prediction can be utilized to devise strategies for infrastructural and detailed land use planning. The current study used WoE to depict the relationship between all causative factors and landslide locations. The results suggest that most positive impact classes exist at low slope angles and high SPI, STI, and TWI values. The present study also showed that the FLDA outperformed the other three models. In conclusion, landslide susceptibility maps could assist local and government authorities in establishing appropriate land use plans and landslide mitigation strategies.
Supplementary Materials
The following are available online at https://0-www-mdpi-com.brum.beds.ac.uk/2220-9964/9/3/144/s1, Figure S1: Landslide causative factors: (a) aspect, (b) slope, (c) elevation, (d) SPI, (e) STI, (f) TWI, (g) rainfall, (h) plan curvature, (i) profile curvature, (j) distance to roads, (k) distance to river, (l) distance to faults (m), (m) NDVI, (n) lithology, (o) landuse, (p) soil, Table S1: Correlation between landslide and factors using WoE model.
Author Contributions
Guirong Wang, Xi Chen and Wei Chen contributed equally to the work. Xi Chen and Guirong Wang collected field data and conducted the landslide susceptibility mapping and analysis. Xi Chen and Wei Chen wrote and revised the manuscript. Guirong Wang provided critical comments in planning this paper and edited the manuscript. All the authors discussed the results and edited the manuscript. Great thanks are given to Xingguang Chen and Zhengqian Wu for their kind help. All authors have read and agreed to the published version of the manuscript.
Funding
This study was supported by the National Natural Science Foundation of China (41807192), Natural Science Basic Research Program of Shaanxi (Program No. 2019JLM-7, Program No. 2019JQ-094), China Postdoctoral Science Foundation (Grant No. 2018T111084, 2017M613168), and Project funded by Shaanxi Province Postdoctoral Science Foundation (Grant No. 2017BSHYDZZ07).
Conflicts of Interest
The authors declare no conflict of interest.
References
- Alcantara-Ayala, I. Hazard assessment of rainfall-induced landsliding in mexico. Geomorphology 2004, 61, 19–40. [Google Scholar] [CrossRef]
- Parkash, S. Capacity development for landslides risk reduction in india. In Landslides: Global Risk Preparedness; Springer: Berlin/Heidelberg, Germany, 2013; pp. 369–383. [Google Scholar]
- Guo, C.; Qin, Y.; Ma, D.; Xia, Y.; Chen, Y.; Si, Q.; Lu, L. Ionic composition, geological signature and environmental impacts of coalbed methane produced water in china. Energy Sources Part A Recovery Util. Environ. Eff. 2019, 1–15. [Google Scholar] [CrossRef]
- Guzzetti, F.; Reichenbach, P.; Cardinali, M.; Galli, M.; Ardizzone, F. Probabilistic landslide hazard assessment at the basin scale. Geomorphology 2005, 72, 272–299. [Google Scholar] [CrossRef]
- Brabb, E.E. Innovative Approaches to Landslide Hazard and Risk Mapping; International Landslide Symposium Proceedings: Toronto, ON, Canada, 1985; pp. 17–22. [Google Scholar]
- Guzzetti, F.; Carrara, A.; Cardinali, M.; Reichenbach, P. Landslide hazard evaluation: A review of current techniques and their application in a multi-scale study, central italy. Geomorphology 1999, 31, 181–216. [Google Scholar] [CrossRef]
- Glade, T.; Crozier, M.J. A review of scale dependency in landslide hazard and risk analysis. Landslide Hazard Risk 2005, 75, 138. [Google Scholar]
- Malet, J.-P.; Maquaire, O.; Thiery, Y.; Puissant, A.; van Beek, L.P.; van Asch, T.W.; Remaître, A. Landslide risk zoning-what can be expected from model simulations? A tentative application in the south french alps. Guidel. Mapp. Areas Risk Landslides Eur. 2007, 23, 31. [Google Scholar]
- Chen, W.; Pourghasemi, H.R.; Naghibi, S.A. Prioritization of landslide conditioning factors and its spatial modeling in shangnan county, china using gis-based data mining algorithms. Bull. Eng. Geol. Environ. 2018, 77, 611–629. [Google Scholar] [CrossRef]
- Wang, H.J.; Xiao, T.; Li, X.Y.; Zhang, L.L.; Zhang, L.M. A novel physically-based model for updating landslide susceptibility. Eng. Geol. 2019, 251, 71–80. [Google Scholar] [CrossRef]
- Salvatici, T.; Tofani, V.; Rossi, G.; D’Ambrosio, M.; Tacconi Stefanelli, C.; Masi, E.B.; Rosi, A.; Pazzi, V.; Vannocci, P.; Petrolo, M.; et al. Application of a physically based model to forecast shallow landslides at a regional scale. Nat. Hazards Earth Syst. Sci. 2018, 18, 1919–1935. [Google Scholar] [CrossRef] [Green Version]
- Sahana, M.; Patel, P.P. A comparison of frequency ratio and fuzzy logic models for flood susceptibility assessment of the lower kosi river basin in india. Environ. Earth Sci. 2019, 78, 289. [Google Scholar] [CrossRef]
- Nicu, I.C. Application of analytic hierarchy process, frequency ratio, and statistical index to landslide susceptibility: An approach to endangered cultural heritage. Environ. Earth Sci. 2018, 77, 79. [Google Scholar] [CrossRef]
- Li, Y.; Chen, W. Landslide susceptibility evaluation using hybrid integration of evidential belief function and machine learning techniques. Water 2020, 12, 113. [Google Scholar] [CrossRef] [Green Version]
- Pradhan, A.M.S.; Kim, Y.-T. Spatial data analysis and application of evidential belief functions to shallow landslide susceptibility mapping at mt. Umyeon, seoul, korea. Bull. Eng. Geol. Environ. 2017, 76, 1263–1279. [Google Scholar] [CrossRef]
- Polykretis, C.; Chalkias, C. Comparison and evaluation of landslide susceptibility maps obtained from weight of evidence, logistic regression, and artificial neural network models. Nat. Hazards 2018, 93, 249–274. [Google Scholar] [CrossRef]
- Xie, Z.; Chen, G.; Meng, X.; Zhang, Y.; Qiao, L.; Tan, L. A comparative study of landslide susceptibility mapping using weight of evidence, logistic regression and support vector machine and evaluated by sbas-insar monitoring: Zhouqu to wudu segment in bailong river basin, china. Environ. Earth Sci. 2017, 76, 313. [Google Scholar] [CrossRef]
- Pham, B.T.; Prakash, I. Evaluation and comparison of logitboost ensemble, fisher’s linear discriminant analysis, logistic regression and support vector machines methods for landslide susceptibility mapping. Geocarto Int. 2017, 34, 316–333. [Google Scholar] [CrossRef]
- Alkhasawneh, M.S.; Tay, L.T.; Ngah, U.K.; Al-Batah, M.S.; Isa, N.A.M. Intelligent landslide system based on discriminant analysis and cascade-forward back-propagation network. Arab. J. Eng. 2014, 39, 5575–5584. [Google Scholar] [CrossRef]
- He, S.; Pan, P.; Dai, L.; Wang, H.; Liu, J. Application of kernel-based fisher discriminant analysis to map landslide susceptibility in the qinggan river delta, three gorges, china. Geomorphology 2012, 171, 30–41. [Google Scholar] [CrossRef]
- Dong, J.-J.; Tung, Y.-H.; Chen, C.-C.; Liao, J.-J.; Pan, Y.-W. Discriminant analysis of the geomorphic characteristics and stability of landslide dams. Geomorphology 2009, 110, 162–171. [Google Scholar] [CrossRef]
- Park, S.; Hamm, S.Y.; Jeon, H.T.; Kim, J. Evaluation of logistic regression and multivariate adaptive regression spline models for groundwater potential mapping using r and gis. Sustainability 2017, 9, 1157. [Google Scholar] [CrossRef] [Green Version]
- Tsangaratos, P.; Ilia, I. Comparison of a logistic regression and naïve bayes classifier in landslide susceptibility assessments: The influence of models complexity and training dataset size. Catena 2016, 145, 164–179. [Google Scholar] [CrossRef]
- Tien Bui, D.; Tuan, T.A.; Klempe, H.; Pradhan, B.; Revhaug, I. Spatial prediction models for shallow landslide hazards: A comparative assessment of the efficacy of support vector machines, artificial neural networks, kernel logistic regression, and logistic model tree. Landslides 2016, 13, 361–378. [Google Scholar] [CrossRef]
- Conforti, M.; Pascale, S.; Robustelli, G.; Sdao, F. Evaluation of prediction capability of the artificial neural networks for mapping landslide susceptibility in the turbolo river catchment (northern calabria, italy). Catena 2014, 113, 236–250. [Google Scholar] [CrossRef]
- Pham, B.T.; Tien Bui, D.; Prakash, I.; Dholakia, M.B. Evaluation of predictive ability of support vector machines and naive bayes trees methods for spatial prediction of landslides in uttarakhand state (india) using gis. J. Geomat. 2016, 10, 71–79. [Google Scholar]
- Hong, H.; Pradhan, B.; Jebur, M.N.; Tien Bui, D.; Xu, C.; Akgun, A. Spatial prediction of landslide hazard at the luxi area (china) using support vector machines. Environ. Earth Sci. 2016, 75, 1–14. [Google Scholar] [CrossRef]
- Dou, J.; Paudel, U.; Oguchi, T.; Uchiyama, S.; Hayakavva, Y.S. Shallow and deep-seated landslide differentiation using support vector machines: A case study of the chuetsu area, japan. Terr. Atmos. Ocean. Sci. 2015, 26, 227. [Google Scholar] [CrossRef] [Green Version]
- Nasiri Aghdam, I.; Pradhan, B.; Panahi, M. Landslide susceptibility assessment using a novel hybrid model of statistical bivariate methods (fr and woe) and adaptive neuro-fuzzy inference system (anfis) at southern zagros mountains in Iran. Environ. Earth Sci. 2017, 76, 237. [Google Scholar] [CrossRef]
- Chen, W.; Hong, H.; Panahi, M.; Shahabi, H.; Wang, Y.; Shirzadi, A.; Pirasteh, S.; Alesheikh, A.A.; Khosravi, K.; Panahi, S.; et al. prediction of landslide susceptibility using gis-based data mining techniques of anfis with whale optimization algorithm (woa) and grey wolf optimizer (gwo). Appl. Sci. 2019, 9, 3755. [Google Scholar] [CrossRef] [Green Version]
- Pham, B.T.; Tien Bui, D.; Prakash, I. Landslide susceptibility assessment using bagging ensemble based alternating decision trees, logistic regression and j48 decision trees methods: A comparative study. Geotech. Geol. Eng. 2017, 35, 2597–2611. [Google Scholar] [CrossRef]
- Pham, B.T.; Tien Bui, D.; Pourghasemi, H.R.; Indra, P.; Dholakia, M. Landslide susceptibility assesssment in the uttarakhand area (india) using gis: A comparison study of prediction capability of naïve bayes, multilayer perceptron neural networks, and functional trees methods. Theor. Appl. Climatol. 2017, 128, 255–273. [Google Scholar] [CrossRef]
- Tien Bui, D.; Ho, T.-C.; Pradhan, B.; Pham, B.-T.; Nhu, V.-H.; Revhaug, I. Gis-based modeling of rainfall-induced landslides using data mining-based functional trees classifier with adaboost, bagging, and multiboost ensemble frameworks. Environ. Earth Sci. 2016, 75, 1–22. [Google Scholar] [CrossRef]
- Rossi, M.; Guzzetti, F.; Reichenbach, P.; Mondini, A.C.; Peruccacci, S. Optimal landslide susceptibility zonation based on multiple forecasts. Geomorphology 2010, 114, 129–142. [Google Scholar] [CrossRef]
- Bianchini, S.; Del Soldato, M.; Solari, L.; Nolesini, T.; Pratesi, F.; Moretti, S. Badland susceptibility assessment in volterra municipality (tuscany, italy) by means of gis and statistical analysis. Environ. Earth Sci. 2016, 75, 889. [Google Scholar] [CrossRef]
- Pradhan, B.; Abokharima, M.H.; Jebur, M.N.; Tehrany, M.S. Land subsidence susceptibility mapping at kinta valley (malaysia) using the evidential belief function model in gis. Nat. Hazards 2014, 73, 1019–1042. [Google Scholar] [CrossRef]
- Tien Bui, D.; Shahabi, H.; Shirzadi, A.; Chapi, K.; Pradhan, B.; Chen, W.; Khosravi, K.; Panahi, M.; Bin Ahmad, B.; Saro, L. Land subsidence susceptibility mapping in south korea using machine learning algorithms. Sensors 2018, 18, 2464. [Google Scholar] [CrossRef] [PubMed] [Green Version]
- Bianchini, S.; Solari, L.; Del Soldato, M.; Raspini, F.; Montalti, R.; Ciampalini, A.; Casagli, N.J. Ground subsidence susceptibility (gss) mapping in grosseto plain (tuscany, italy) based on satellite insar data using frequency ratio and fuzzy logic. Remote Sens. 2019, 11, 2015. [Google Scholar] [CrossRef] [Green Version]
- Lee, S.; Park, I. Application of decision tree model for the ground subsidence hazard mapping near abandoned underground coal mines. J. Environ. Manag. 2013, 127, 166–176. [Google Scholar] [CrossRef]
- Chen, W.; Li, Y.; Xue, W.; Shahabi, H.; Li, S.; Hong, H.; Wang, X.; Bian, H.; Zhang, S.; Pradhan, B.; et al. Modeling flood susceptibility using data-driven approaches of naïve bayes tree, alternating decision tree, and random forest methods. Sci. Total Environ. 2020, 701, 134979. [Google Scholar] [CrossRef]
- Costache, R.; Pham, Q.B.; Sharifi, E.; Linh, N.T.T.; Abba, S.I.; Vojtek, M.; Vojteková, J.; Nhi, P.T.T.; Khoi, D.N. Flash-flood susceptibility assessment using multi-criteria decision making and machine learning supported by remote sensing and gis techniques. Remote Sens. 2020, 12, 106. [Google Scholar] [CrossRef] [Green Version]
- Zhao, G.; Pang, B.; Xu, Z.; Peng, D.; Xu, L. Assessment of urban flood susceptibility using semi-supervised machine learning model. Sci. Total Environ. 2019, 659, 940–949. [Google Scholar] [CrossRef]
- Chen, W.; Zhao, X.; Tsangaratos, P.; Shahabi, H.; Ilia, I.; Xue, W.; Wang, X.; Ahmad, B.B. Evaluating the usage of tree-based ensemble methods in groundwater spring potential mapping. J. Hydrol. 2020, 583, 124602. [Google Scholar] [CrossRef]
- Rahmati, O.; Naghibi, S.A.; Shahabi, H.; Bui, D.T.; Pradhan, B.; Azareh, A.; Rafiei-Sardooi, E.; Samani, A.N.; Melesse, A.M. Groundwater spring potential modelling: Comprising the capability and robustness of three different modeling approaches. J. Hydrol. 2018, 565, 248–261. [Google Scholar] [CrossRef]
- Zhao, X.; Chen, W. Gis-based evaluation of landslide susceptibility models using certainty factors and functional trees-based ensemble techniques. Appl. Sci. 2020, 10, 16. [Google Scholar] [CrossRef] [Green Version]
- Wang, G.; Lei, X.; Chen, W.; Shahabi, H.; Shirzadi, A. Hybrid computational intelligence methods for landslide susceptibility mapping. Symmetry 2020, 12, 325. [Google Scholar] [CrossRef] [Green Version]
- Althuwaynee, O.F.; Pradhan, B.; Park, H.-J.; Lee, J.H. A novel ensemble decision tree-based chi-squared automatic interaction detection (chaid) and multivariate logistic regression models in landslide susceptibility mapping. Landslides 2014, 11, 1063–1078. [Google Scholar] [CrossRef]
- Naghibi, S.A.; Dashtpagerdi, M.M. Evaluation of four supervised learning methods for groundwater spring potential mapping in khalkhal region (Iran) using gis-based features. Hydrogeol. J. 2017, 25, 169–189. [Google Scholar] [CrossRef]
- Kalsoom, A.; Maqsood, M.; Ghazanfar, M.A.; Aadil, F.; Rho, S. A dimensionality reduction-based efficient software fault prediction using fisher linear discriminant analysis (flda). J. Supercomput 2018, 74, 4568–4602. [Google Scholar] [CrossRef]
- Wang, X.; Li, X.; Ma, R.; Li, Y.; Wang, W.; Huang, H.; Xu, C.; An, Y. Quadratic discriminant analysis model for assessing the risk of cadmium pollution for paddy fields in a county in china. Environ. Pollut. 2018, 236, 366–372. [Google Scholar] [CrossRef] [PubMed]
- Yao, G.; Ding, G.; Zang, Y.; Wang, J.; Gao, Y.; Zhou, R.; Wang, J.; Xue, B.; Gao, J. Soil quality evaluation of windy desert region after coal mining subsidence based on discriminant and factor analysis. Trans. Chin. Soc. Agric. Eng. 2012, 28, 200–207. [Google Scholar]
- Dahal, R.K.; Hasegawa, S.; Nonomura, A.; Yamanaka, M.; Masuda, T.; Nishino, K. Gis-based weights-of-evidence modelling of rainfall-induced landslides in small catchments for landslide susceptibility mapping. Environ. Geol. 2008, 54, 311–324. [Google Scholar] [CrossRef]
- Falah, F.; Zeinivand, H. Gis-based groundwater potential mapping in khorramabad in lorestan, Iran, using frequency ratio (fr) and weights of evidence (woe) models. Water Resour. 2019, 46, 679–692. [Google Scholar] [CrossRef]
- Akgun, A.; Sezer, E.A.; Nefeslioglu, H.A.; Gokceoglu, C.; Pradhan, B. An easy-to-use matlab program (mamland) for the assessment of landslide susceptibility using a mamdani fuzzy algorithm. Comput. Geosci. 2012, 38, 23–34. [Google Scholar] [CrossRef]
- Melchiorre, C.; Abella, E.C.; van Westen, C.J.; Matteucci, M. Evaluation of prediction capability, robustness, and sensitivity in non-linear landslide susceptibility models, guantánamo, cuba. Comput. Geosci. 2011, 37, 410–425. [Google Scholar] [CrossRef]
- Chen, W.; Shahabi, H.; Shirzadi, A.; Hong, H.; Akgun, A.; Tian, Y.; Liu, J.; Zhu, A.X.; Li, S. Novel hybrid artificial intelligence approach of bivariate statistical-methods-based kernel logistic regression classifier for landslide susceptibility modeling. Bull. Eng. Geol. Environ. 2019, 78, 4397–4419. [Google Scholar] [CrossRef]
- Dai, F.; Lee, C. Terrain-based mapping of landslide susceptibility using a geographical information system: A case study. Can. Geotech. J. 2001, 38, 911–923. [Google Scholar] [CrossRef]
- Yalcin, A.; Bulut, F. Landslide susceptibility mapping using gis and digital photogrammetric techniques: A case study from ardesen (ne-turkey). Nat. Hazards 2007, 41, 201–226. [Google Scholar] [CrossRef]
- Pourghasemi, H.R.; Pradhan, B.; Gokceoglu, C. Application of fuzzy logic and analytical hierarchy process (ahp) to landslide susceptibility mapping at haraz watershed, Iran. Nat. Hazards 2012, 63, 965–996. [Google Scholar] [CrossRef]
- Gritzner, M.L.; Marcus, W.A.; Aspinall, R.; Custer, S.G. Assessing landslide potential using gis, soil wetness modeling and topographic attributes, payette river, idaho. Geomorphology 2001, 37, 149–165. [Google Scholar] [CrossRef]
- Dai, F.; Lee, C. Landslide characteristics and slope instability modeling using gis, lantau island, hong kong. Geomorphology 2002, 42, 213–228. [Google Scholar] [CrossRef]
- Jaafari, A.; Najafi, A.; Pourghasemi, H.; Rezaeian, J.; Sattarian, A. Gis-based frequency ratio and index of entropy models for landslide susceptibility assessment in the caspian forest, northern Iran. Int. J. Environ. Sci. Technol. 2014, 11, 909–926. [Google Scholar] [CrossRef] [Green Version]
- Moore, I.D.; Burch, G.J. Physical basis of the length-slope factor in the universal soil loss equation 1. Soil Sci. Soc. Am. J. 1986, 50, 1294–1298. [Google Scholar] [CrossRef]
- Moore, I.D.; Grayson, R.B.; Ladson, A.R. Digital terrain modelling: A review of hydrological, geomorphological, and biological applications. Hydrol. Process. 1991, 5, 3–30. [Google Scholar] [CrossRef]
- Pourghasemi, H.; Moradi, H.; Aghda, S.F.; Gokceoglu, C.; Pradhan, B. Gis-based landslide susceptibility mapping with probabilistic likelihood ratio and spatial multi-criteria evaluation models (north of Tehran, Iran). Arab. J. Geosci. 2014, 7, 1857–1878. [Google Scholar] [CrossRef] [Green Version]
- Catani, F.; Lagomarsino, D.; Segoni, S.; Tofani, V. Landslide susceptibility estimation by random forests technique: Sensitivity and scaling issues. Nat. Hazards Earth Syst. Sci. 2013, 13, 2815–2831. [Google Scholar] [CrossRef] [Green Version]
- Naghibi, S.A.; Pourghasemi, H.R.; Dixon, B. Gis-based groundwater potential mapping using boosted regression tree, classification and regression tree, and random forest machine learning models in Iran. Environ. Monit. Assess. 2016, 188, 44. [Google Scholar] [CrossRef]
- Spiegelhalter, D.J.; Knill-Jones, R.P. Statistical and knowledge-based approaches to clinical decision-support systems, with an application in gastroenterology. J. R. Stat. Soc. Ser. A 1984, 147, 35–58. [Google Scholar] [CrossRef]
- Bonham-Carter, G.; Agterberg, F.; Wright, D. Integration of geological datasets for gold exploration in nova scotia. Photogramm. Eng. Remote Sens. 1988, 54, 1585–1592. [Google Scholar]
- Bonham-Carter, G. Weights of evidence modelling: A new approach to mapping mineral potential.: In statistical applications in the earth sciences. Geol. Surv. Can. Pap. 1990, 89, 171–183. [Google Scholar]
- Agterberg, F.; Bonham-Carter, G.; Cheng, Q.-M.; Wright, D. Weights of evidence modeling and weighted logistic regression for mineral potential mapping. Comput. Geol. 1993, 25, 13–32. [Google Scholar]
- Van Westen, C.J.; Rengers, N.; Terlien, M.; Soeters, R. Prediction of the occurrence of slope instability phenomenal through gis-based hazard zonation. Geol. Rundsch. 1997, 86, 404–414. [Google Scholar] [CrossRef]
- Lee, S.; Choi, J.; Min, K. Landslide susceptibility analysis and verification using the bayesian probability model. Environ. Geol. 2002, 43, 120–131. [Google Scholar] [CrossRef]
- Van Westen, C.; Rengers, N.; Soeters, R. Use of geomorphological information in indirect landslide susceptibility assessment. Nat. Hazards 2003, 30, 399–419. [Google Scholar] [CrossRef]
- Lee, S.; Choi, J. Landslide susceptibility mapping using gis and the weight-of-evidence model. Int. J. Geogr. Inf. Sci. 2004, 18, 789–814. [Google Scholar] [CrossRef]
- Thiery, Y.; Sterlacchini, S.; Malet, J.-P.; Puissant, A.; Remaître, A.; Maquaire, O. In strategy to reduce subjectivity in landslide susceptibility zonation by gis in complex mountainous environments. In Proceedings of the 7th AGILE Conference on GIScience, Castellon, Spain, 3–16 June 2004; pp. 623–634. [Google Scholar]
- Thiery, Y.; Malet, J.-P.; Sterlacchini, S.; Puissant, A.; Maquaire, O. Landslide susceptibility assessment by bivariate methods at large scales: Application to a complex mountainous environment. Geomorphology 2007, 92, 38–59. [Google Scholar] [CrossRef] [Green Version]
- Mathew, J.; Jha, V.; Rawat, G. Weights of evidence modelling for landslide hazard zonation mapping in part of bhagirathi valley, uttarakhand. Curr. Sci. 2007, 628–638. [Google Scholar]
- Pradhan, B. Flood susceptible mapping and risk area delineation using logistic regression, gis and remote sensing. J. Spat. Hydrol. 2010, 9, 1–18. [Google Scholar]
- Ozdemir, A. Landslide susceptibility mapping of vicinity of yaka landslide (gelendost, turkey) using conditional probability approach in gis. Environ. Geol. 2009, 57, 1675–1686. [Google Scholar] [CrossRef]
- Xu, C.; Xu, X.; Dai, F.; Xiao, J.; Tan, X.; Yuan, R. Landslide hazard mapping using gis and weight of evidence model in qingshui river watershed of 2008 wenchuan earthquake struck region. J. Earth Sci. 2012, 23, 97–120. [Google Scholar] [CrossRef]
- Bonham-Carter, G.F. Weights of evidence modeling: A new approach to mapping mineral potential. Stat. Appl. Earth Sci. 1989, 89-9, 171–183. [Google Scholar]
- Cui, K.; Lu, D.; Li, W. Comparison of landslide susceptibility mapping based on statistical index, certainty factors, weights of evidence and evidential belief function models. Geocarto Int. 2017, 32, 935–955. [Google Scholar] [CrossRef]
- Gayen, A.; Saha, S. Application of weights-of-evidence (woe) and evidential belief function (ebf) models for the delineation of soil erosion vulnerable zones: A study on pathro river basin, jharkhand, india. Modeling Earth Syst. Environ. 2017, 3, 1123–1139. [Google Scholar] [CrossRef]
- Neuhäuser, B.; Terhorst, B. Landslide susceptibility assessment using “weights-of-evidence” applied to a study area at the jurassic escarpment (sw-germany). Geomorphology 2007, 86, 12–24. [Google Scholar] [CrossRef]
- Mohammadimanesh, F.; Salehi, B.; Mahdianpari, M.; Homayouni, S. Unsupervised wishart classfication of wetlands in newfoundland, canada using polsar data based on fisher linear discriminant analysis. Int. Arch. Photogramm. Remote Sens. Spat. Inf. Sci. 2016, 41, 305. [Google Scholar] [CrossRef]
- McLachlan, G.J. Discriminant Analysis and Statistical Pattern Recognition; John Wiley & Sons: Hoboken, NJ, USA, 2004; Volume 544. [Google Scholar]
- Seber, G.A. Multivariate Observations; John Wiley & Sons: Hoboken, NJ, USA, 2009; Volume 252. [Google Scholar]
- Eker, A.M.; Dikmen, M.; Cambazoğlu, S.; Düzgün, Ş.H.; Akgün, H. Evaluation and comparison of landslide susceptibility mapping methods: A case study for the ulus district, bartın, northern turkey. Int. J. Geogr. Inf. Sci. 2015, 29, 132–158. [Google Scholar] [CrossRef]
- Hand, D.J. Classifier technology and the illusion of progress. Stat. Sci. 2006, 21, 1–14. [Google Scholar] [CrossRef] [Green Version]
- Hong, H.; Naghibi, S.A.; Dashtpagerdi, M.M.; Pourghasemi, H.R.; Chen, W. A comparative assessment between linear and quadratic discriminant analyses (lda-qda) with frequency ratio and weights-of-evidence models for forest fire susceptibility mapping in china. Arab. J. Geosci. 2017, 10, 167. [Google Scholar] [CrossRef]
- Anderson, T. An Introduction to Multivariate Statistical Analysis (Wiley Series in Probability and Statistics); Wiley: New York, NY, USA, 2003. [Google Scholar]
- Baecher, G.B.; Christian, J.T. Reliability and Statistics in Geotechnical Engineering; John Wiley & Sons: Hoboken, NJ, USA, 2005. [Google Scholar]
- Collison, A.; Anderson, M. Using a combined slope hydrology/stability model to identify suitable conditions for landslide prevention by vegetation in the humid tropics. Earth Surf. Process. Landf. 1996, 21, 737–747. [Google Scholar] [CrossRef]
- Dai, F.; Lee, C.; Li, J.; Xu, Z. Assessment of landslide susceptibility on the natural terrain of lantau island, hong kong. Environ. Geol. 2001, 40, 381–391. [Google Scholar]
- Pradhan, B.; Lee, S.; Mansor, S.; Buchroithner, M.; Jamaluddin, N.; Khujaimah, Z. Utilization of optical remote sensing data and geographic information system tools for regional landslide hazard analysis by using binomial logistic regression model. J. Appl. Remote Sens. 2008, 2, 023542. [Google Scholar]
- Ayalew, L.; Yamagishi, H. The application of gis-based logistic regression for landslide susceptibility mapping in the kakuda-yahiko mountains, central Japan. Geomorphology 2005, 65, 15–31. [Google Scholar] [CrossRef]
- Chen, W.; Panahi, M.; Khosravi, K.; Pourghasemi, H.R.; Rezaie, F.; Parvinnezhad, D. Spatial prediction of groundwater potentiality using anfis ensembled with teaching-learning-based and biogeography-based optimization. J. Hydrol. 2019, 572, 435–448. [Google Scholar] [CrossRef]
- Kadavi, P.R.; Lee, C.-W.; Lee, S. Landslide-susceptibility mapping in gangwon-do, south korea, using logistic regression and decision tree models. Environ. Earth Sci. 2019, 78, 116. [Google Scholar] [CrossRef]
- Janizadeh, S.; Avand, M.; Jaafari, A.; Phong, T.V.; Bayat, M.; Ahmadisharaf, E.; Prakash, I.; Pham, B.T.; Lee, S. Prediction success of machine learning methods for flash flood susceptibility mapping in the tafresh watershed, Iran. Sustainability 2019, 11, 5426. [Google Scholar] [CrossRef] [Green Version]
- Chen, W.; Pradhan, B.; Li, S.; Shahabi, H.; Rizeei, H.M.; Hou, E.; Wang, S. Novel hybrid integration approach of bagging-based fisher’s linear discriminant function for groundwater potential analysis. Nat. Resour. Res. 2019, 28, 1239–1258. [Google Scholar] [CrossRef] [Green Version]
- Nguyen, Q.-K.; Tien Bui, D.; Hoang, N.-D.; Trinh, P.; Nguyen, V.-H.; Yilmaz, I. A novel hybrid approach based on instance based learning classifier and rotation forest ensemble for spatial prediction of rainfall-induced shallow landslides using gis. Sustainability 2017, 9, 813. [Google Scholar] [CrossRef] [Green Version]
- Shirzadi, A.; Bui, D.T.; Pham, B.T.; Solaimani, K.; Chapi, K.; Kavian, A.; Shahabi, H.; Revhaug, I. Shallow landslide susceptibility assessment using a novel hybrid intelligence approach. Environ. Earth Sci. 2017, 76, 60. [Google Scholar] [CrossRef]
- Chen, W.; Li, Y.; Tsangaratos, P.; Shahabi, H.; Ilia, I.; Xue, W.; Bian, H. Groundwater spring potential mapping using artificial intelligence approach based on kernel logistic regression, random forest, and alternating decision tree models. Appl. Sci. 2020, 10, 425. [Google Scholar] [CrossRef] [Green Version]
- Jaafari, A.; Zenner, E.K.; Pham, B.T. Wildfire spatial pattern analysis in the zagros mountains, Iran: A comparative study of decision tree based classifiers. Ecol. Inform. 2018, 43, 200–211. [Google Scholar] [CrossRef]
- Pham, B.T.; Bui, D.T.; Prakash, I.; Dholakia, M. Rotation forest fuzzy rule-based classifier ensemble for spatial prediction of landslides using gis. Nat. Hazards 2016, 83, 97–127. [Google Scholar] [CrossRef]
- Chen, W.; Tsangaratos, P.; Ilia, I.; Duan, Z.; Chen, X. Groundwater spring potential mapping using population-based evolutionary algorithms and data mining methods. Sci. Total Environ. 2019, 684, 31–49. [Google Scholar] [CrossRef]
- Tien Bui, D.; Tuan, T.A.; Hoang, N.-D.; Thanh, N.Q.; Nguyen, D.B.; Van Liem, N.; Pradhan, B. Spatial prediction of rainfall-induced landslides for the lao cai area (vietnam) using a hybrid intelligent approach of least squares support vector machines inference model and artificial bee colony optimization. Landslides 2017, 14, 447–458. [Google Scholar] [CrossRef]
- Friedman, M. The use of ranks to avoid the assumption of normality implicit in the analysis of variance. J. Am. Stat. Assoc. 1937, 32, 675–701. [Google Scholar] [CrossRef]
- Wilcoxon, F. Individual Comparisons by Ranking Methods. Biom Bull 1945, 1, 80. [Google Scholar] [CrossRef]
- Tien Bui, D.; Pradhan, B.; Revhaug, I.; Nguyen, D.B.; Pham, H.V.; Bui, Q.N. A novel hybrid evidential belief function-based fuzzy logic model in spatial prediction of rainfall-induced shallow landslides in the lang son city area (Vietnam). Geomat. Nat. Hazards Risk 2015, 6, 243–271. [Google Scholar]
- Bellman, R.E. Adaptive Control Processes: A guided Tour; Princeton University Press: Princeton, NJ, USA, 2015; Volume 2045. [Google Scholar]
- Porwal, A.; Gonzalez-Alvarez, I.; Markwitz, V.; McCuaig, T.; Mamuse, A. Weights-of-evidence and logistic regression modeling of magmatic nickel sulfide prospectivity in the yilgarn craton, western australia. Ore Geol. Rev. 2010, 38, 184–196. [Google Scholar] [CrossRef]
- Immitzer, M.; Atzberger, C.; Koukal, T. Tree species classification with random forest using very high spatial resolution 8-band worldview-2 satellite data. Remote Sens. 2012, 4, 2661–2693. [Google Scholar] [CrossRef] [Green Version]
- Zare, M.; Pourghasemi, H.R.; Vafakhah, M.; Pradhan, B. Landslide susceptibility mapping at vaz watershed (Iran) using an artificial neural network model: A comparison between multilayer perceptron (mlp) and radial basic function (rbf) algorithms. Arab. J. Geosci. 2013, 6, 2873–2888. [Google Scholar] [CrossRef]
Figure 1.
Geographical position of study area.

Figure 2.
Geological map of the study area.

Figure 3.
Modeling process flowchart.

Figure 4.
Landslide susceptibility maps: (a) weight-of-evidence (WoE) model, (b) Fisher’s linear discriminant analysis (FLDA) model, (c) quadratic discriminant analysis (QDA) model, (d) linear discriminant analysis (LDA) model.
Figure 4.
Landslide susceptibility maps: (a) weight-of-evidence (WoE) model, (b) Fisher’s linear discriminant analysis (FLDA) model, (c) quadratic discriminant analysis (QDA) model, (d) linear discriminant analysis (LDA) model.


Figure 5.
Sketch map for percentage of each classes using four models.

Figure 6.
Receiver operating characteristic (ROC) curves of the models: (a) training test, (b) validation dataset.
Figure 6.
Receiver operating characteristic (ROC) curves of the models: (a) training test, (b) validation dataset.


Table 1.
Formations.
| No. | Code | Formation | Lithology | Geological Age |
|---|---|---|---|---|
| 1 | J3 | Suining | Mudstone interbedded with sandstone, siltstone | Late Triassic |
| J2 | Shaximiao | Sandstone intercalated with mudstone | Middle Jurassic | |
| J1 | Ziliujing | Mudstone, sandstone, siltstone, limestone | Early Jurassic | |
| 2 | T3 | Xujiahe | Arkose, siltstone, mudstone, coal | Late Triassic |
| T2 | Leikoupo | Dolomite interbedded with limestone, salts | Middle Triassic | |
| T1 | Dazhi | Limestone, dolomite, Karst breccia | Early Triassic | |
| 3 | P2 | Wujiaping | Limestone, chert siliceous nodule beds | Middle Permian |
| P1 | Liangshan | Sandstone, shale, clayrock interbedded with coal | Early Permian | |
| 4 | S2 | Luoreping | Clastic rocks interbedded with limestone | Middle Silurian |
| S1 | Xintan | Shale, siltstone interbedded with limestone | Early Silurian | |
| 5 | O3 | Longmaxi | Clastic rocks interbedded with limestone | Late Ordovician |
| 6 | O1 | Baotazu | Limestone, marl interbedded with biolithic limestone | Early Ordovician |
| 7 | ∈2 | Gaotai | Dolomite interbedded with limestone | Middle Cambrian |
| ∈<1 | Loushanguan | Dolomite, limestone interbedded with sandstone, shale | Early Cambrian |
Table 2.
Average ranking of the landslide susceptibility models for the study area.
| Models | Mean Rank |
|---|---|
| FLDA model | 2.77 |
| LDA model | 2.47 |
| WoE model | 2.44 |
| QDA model | 2.32 |
Table 3.
Result of Friedman test for the landslide susceptibility models with α = 0.05.
| Chi-Square | 27.019 |
| p | 0.000 |
Table 4.
Comparison for the landslide susceptibility models using Wilcoxon signed-rank test (two-tailed).
Table 4.
Comparison for the landslide susceptibility models using Wilcoxon signed-rank test (two-tailed).
| Pairwise Comparison | z Statistic | p | Significance |
|---|---|---|---|
| WoE model ~ FLDA model | −3.426 | 0.001 | Yes |
| WoE model ~ QDA model | −0.750 | 0.453 | No |
| WoE model ~ LDA model | −3.723 | 0.000 | Yes |
| FLDA model ~ QDA model | 3.402 | 0.0007 | Yes |
| FLDA model ~ LDA model | −2.000 | 0.045 | Yes |
| QDA model ~ LDA model | −5.117 | 0.000 | Yes |
© 2020 by the authors. Licensee MDPI, Basel, Switzerland. This article is an open access article distributed under the terms and conditions of the Creative Commons Attribution (CC BY) license (http://creativecommons.org/licenses/by/4.0/).
Share and Cite
MDPI and ACS Style
Wang, G.; Chen, X.; Chen, W. Spatial Prediction of Landslide Susceptibility Based on GIS and Discriminant Functions. ISPRS Int. J. Geo-Inf. 2020, 9, 144. https://0-doi-org.brum.beds.ac.uk/10.3390/ijgi9030144
AMA Style
Wang G, Chen X, Chen W. Spatial Prediction of Landslide Susceptibility Based on GIS and Discriminant Functions. ISPRS International Journal of Geo-Information. 2020; 9(3):144. https://0-doi-org.brum.beds.ac.uk/10.3390/ijgi9030144
Chicago/Turabian StyleWang, Guirong, Xi Chen, and Wei Chen. 2020. "Spatial Prediction of Landslide Susceptibility Based on GIS and Discriminant Functions" ISPRS International Journal of Geo-Information 9, no. 3: 144. https://0-doi-org.brum.beds.ac.uk/10.3390/ijgi9030144
Note that from the first issue of 2016, this journal uses article numbers instead of page numbers. See further details here.