Article

Appraising the Genetic Architecture of Kernel Traits in Hexaploid Wheat Using GWAS

1
College of Plant Science and Technology & Biomass and Bioenergy Research Center, Huazhong Agricultural University, Wuhan 430070, China
2
State Key Laboratory for Conservation and Utilization of Subtropical Agro-Bioresources, College of Agriculture, Guangxi University, 100 Daxue Rd., Nanning 530004, China
*
Authors to whom correspondence should be addressed.
Int. J. Mol. Sci. 2020, 21(16), 5649; https://0-doi-org.brum.beds.ac.uk/10.3390/ijms21165649
Submission received: 13 July 2020 / Revised: 2 August 2020 / Accepted: 5 August 2020 / Published: 6 August 2020
(This article belongs to the Section Molecular Biology)

Abstract

:
Kernel morphology is one of the major yield traits of wheat, the genetic architecture of which is always important in crop breeding. In this study, we performed a genome-wide association study (GWAS) to appraise the genetic architecture of the kernel traits of 319 wheat accessions using 22,905 single nucleotide polymorphism (SNP) markers from a wheat 90K SNP array. As a result, 111 and 104 significant SNPs for Kernel traits were detected using four multi-locus GWAS models (mrMLM, FASTmrMLM, FASTmrEMMA, and pLARmEB) and three single-locus models (FarmCPU, MLM, and MLMM), respectively. Among the 111 SNPs detected by the multi-locus models, 24 SNPs were simultaneously detected across multiple models, including seven for kernel length, six for kernel width, six for kernels per spike, and five for thousand kernel weight. Interestingly, the five most stable SNPs (RAC875_29540_391, Kukri_07961_503, tplb0034e07_1581, BS00074341_51, and BobWhite_049_3064) were simultaneously detected by at least three multi-locus models. Integrating these newly developed multi-locus GWAS models to unravel the genetic architecture of kernel traits, the mrMLM approach detected the maximum number of SNPs. Furthermore, a total of 41 putative candidate genes were predicted to likely be involved in the genetic architecture underlining kernel traits. These findings can facilitate a better understanding of the complex genetic mechanisms of kernel traits and may lead to the genetic improvement of grain yield in wheat.

1. Introduction

Bread wheat (Triticum aestivum L.) is a staple food crop worldwide, providing 20% of the caloric intake of humans [1,2]. Food production needs to be increase by an estimated 50% in order to keep pace with the increasing demands projected for 2050. This requires continuing genetic gains in yield improvement by approximately 1.1% per annum [3]. Enhancing the yield by evaluating grain traits is a common target for genetic improvement in wheat breeding. Grain yield is governed by multiple genes, which are greatly influenced by environmental factors [4]. The total grain yield depends on multiple yield components, such as grain number per spike, thousand kernel weight, kernel length, and kernel width, where each component is quantitatively inherited [5].
Grain morphology has been studied for decades, but determining loci associated with seed dimensions remains an important task in crop yield improvement studies [6]. This has led to the search for fundamental genes associated with grain weight and size, with several genes controlling grain morphology having been identified recently [7]. Among these genes, TaGW2 has been associated with grain morphology, which is an orthologous gene of rice OsGW2 [8]. Several quantitative trait loci (QTLs) in the promoter region of TaGW2-6A associated with kernel weight and kernel dimension parameters have been identified [8,9,10]. Heidari et al. [11] and Zhang et al. [12] identified several QTLs associated with kernel number per spike (KPS). Using a set of wheat cultivars, Guo et al. [13,14] screened 13 KPS-associated QTLs. Although there have been several studies related to QTL mapping and genome-wide association studies (GWASs) for yield-related traits [15,16,17,18,19], only a few outcomes have been applied for wheat improvement in breeding programs [20]. High-throughput single nucleotide polymorphism (SNP) assays have been used in breeding and genotyping studies, which enable the process of association mapping to be more accurate and robust [20,21]. SNP assays developed from animal and plant transcriptomes [22] are generally more advanced, stable, capable of automatic detection, efficient, and cost-effective [23,24]. In wheat, several high-density SNP arrays (i.e., 9K [24], 90K [22], 820K [25], and 660K [26], among others) have been adopted. Among these, the 90K and 660K arrays are now widely applied, as compared to simple sequence repeat (SSR) markers, for the genetic improvement of wheat traits related to yield, quality, stress tolerance, and disease resistance [27,28,29,30]. Recently, the 90K array based on the Illumina platform can be found in bi-parental QTL mapping [31,32,33,34] and GWAS for yield-contributing traits in wheat [35,36,37]. Conventional QTL mapping can only reflect the genetic content between parents and focuses on specific traits [20]. Recent advances in genomic technologies have shown GWAS to be a promising alternative approach to QTL mapping. Recently, several genomic regions associated with yield-related traits have been identified through genome-wide association studies (GWASs) in wheat [20,38,39,40].
GWAS relies on linkage disequilibrium (LD), which dissects the genetic basis of complex traits. Unlike QTL mapping, GWAS can explore wider genetic variations with higher resolution, in order to phenotype several traits with one cycle of genotyping [20]. It is an effective method for detecting multi-allelic variation, thus helping in the pyramiding of favorable alleles for a target trait [41]. Commonly used GWAS approaches utilizing mixed linear models have become the most standard criteria, employing population structure or kinship analysis among genotypes [42]. However, due to the strengthened screening criteria of Bonferroni correction, many important small-effect loci cannot be detected, especially with a large number of SNPs [43]. In order to obtain the associations at a fine mapping resolution, subsequent mixed-model applications have integrated multiple methods with a higher detection power. Multi-locus models fit large-effect loci as covariates, allowing for the identification of more loci with smaller effects [44]. Recently, several multi-locus models, including mrMLM [45], FASTmrEMMA [46], pLARmEB [47], and FASTmrMLM [48] have been developed, with high powers of detection and less strong criteria.
Therefore, the present study was designed to conduct GWAS in a set of 319 wheat accessions in central China and the Yangzi River region, using the high-throughput wheat 90K iSelect SNP array [22]. The objectives of this study included: (1) the detection of significant loci associated with kernel traits, (2) comparing and integrating the effects of loci on kernel traits, and (3) identifying the candidate genes which control the corresponding kernel traits. Finally, the detection of several significant SNPs by integrating three single-locus and four recently developed multi-locus GWAS models can facilitate marker-assisted breeding for higher yields in wheat.

2. Results

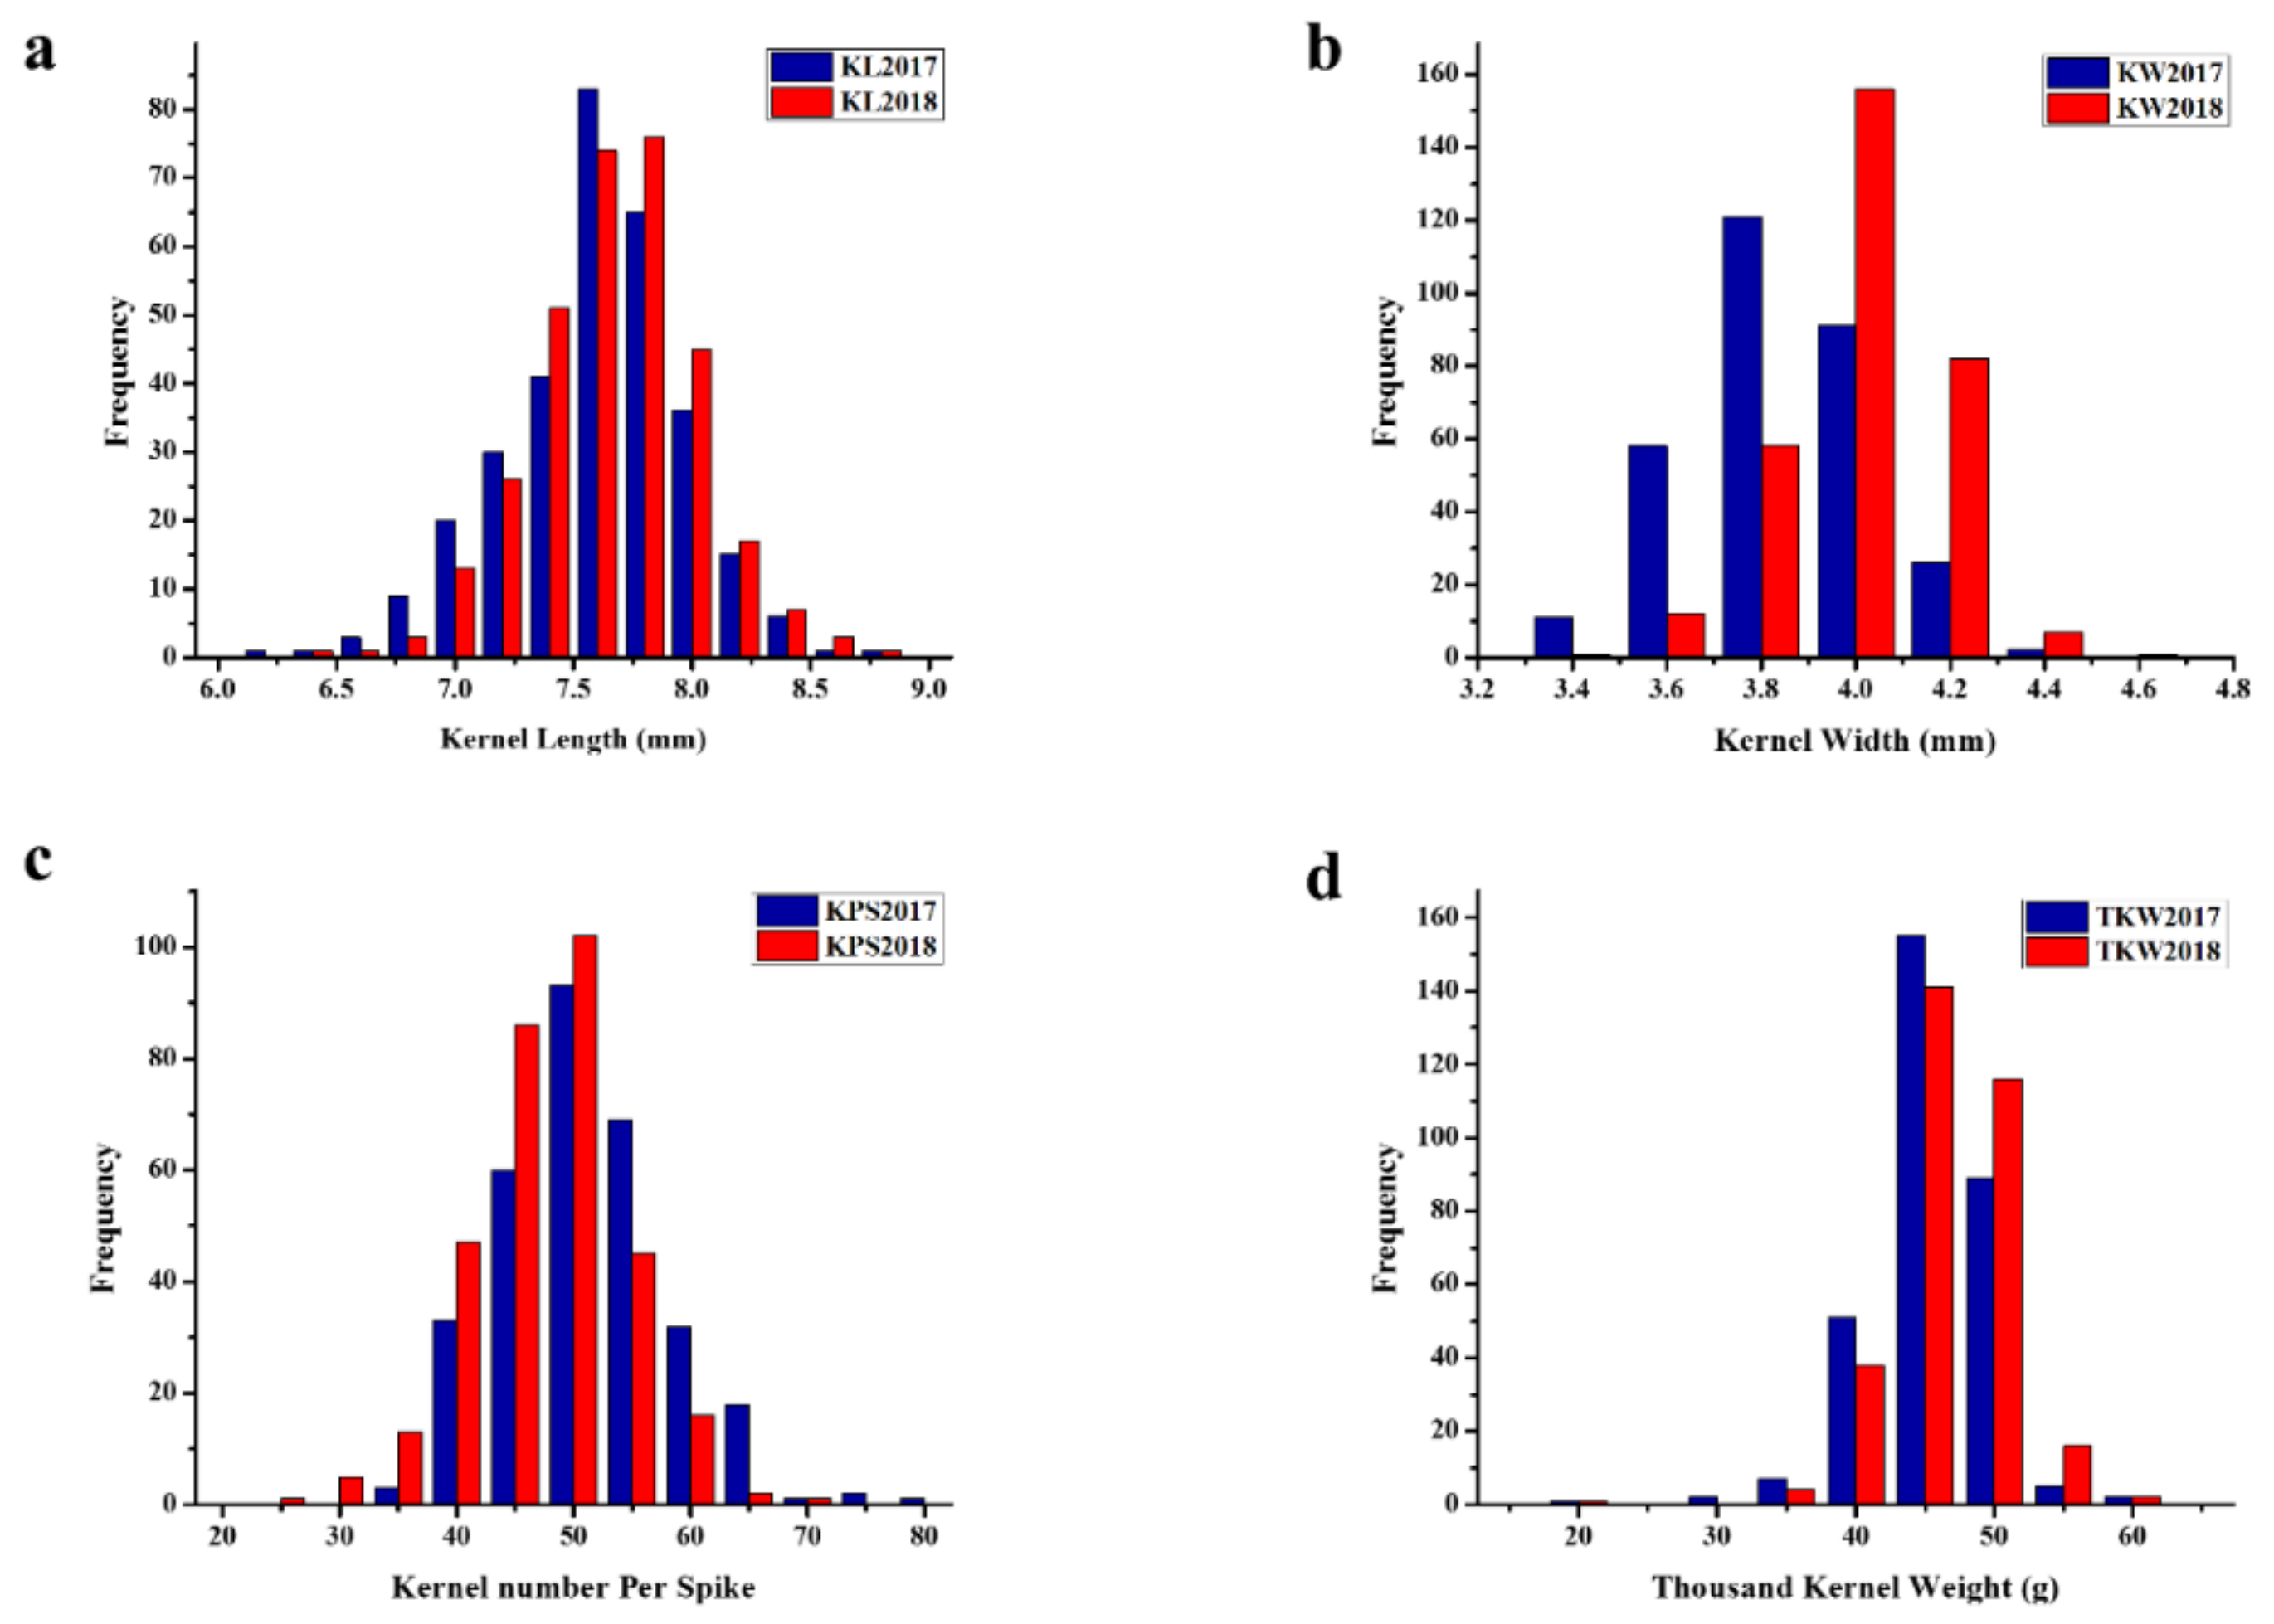
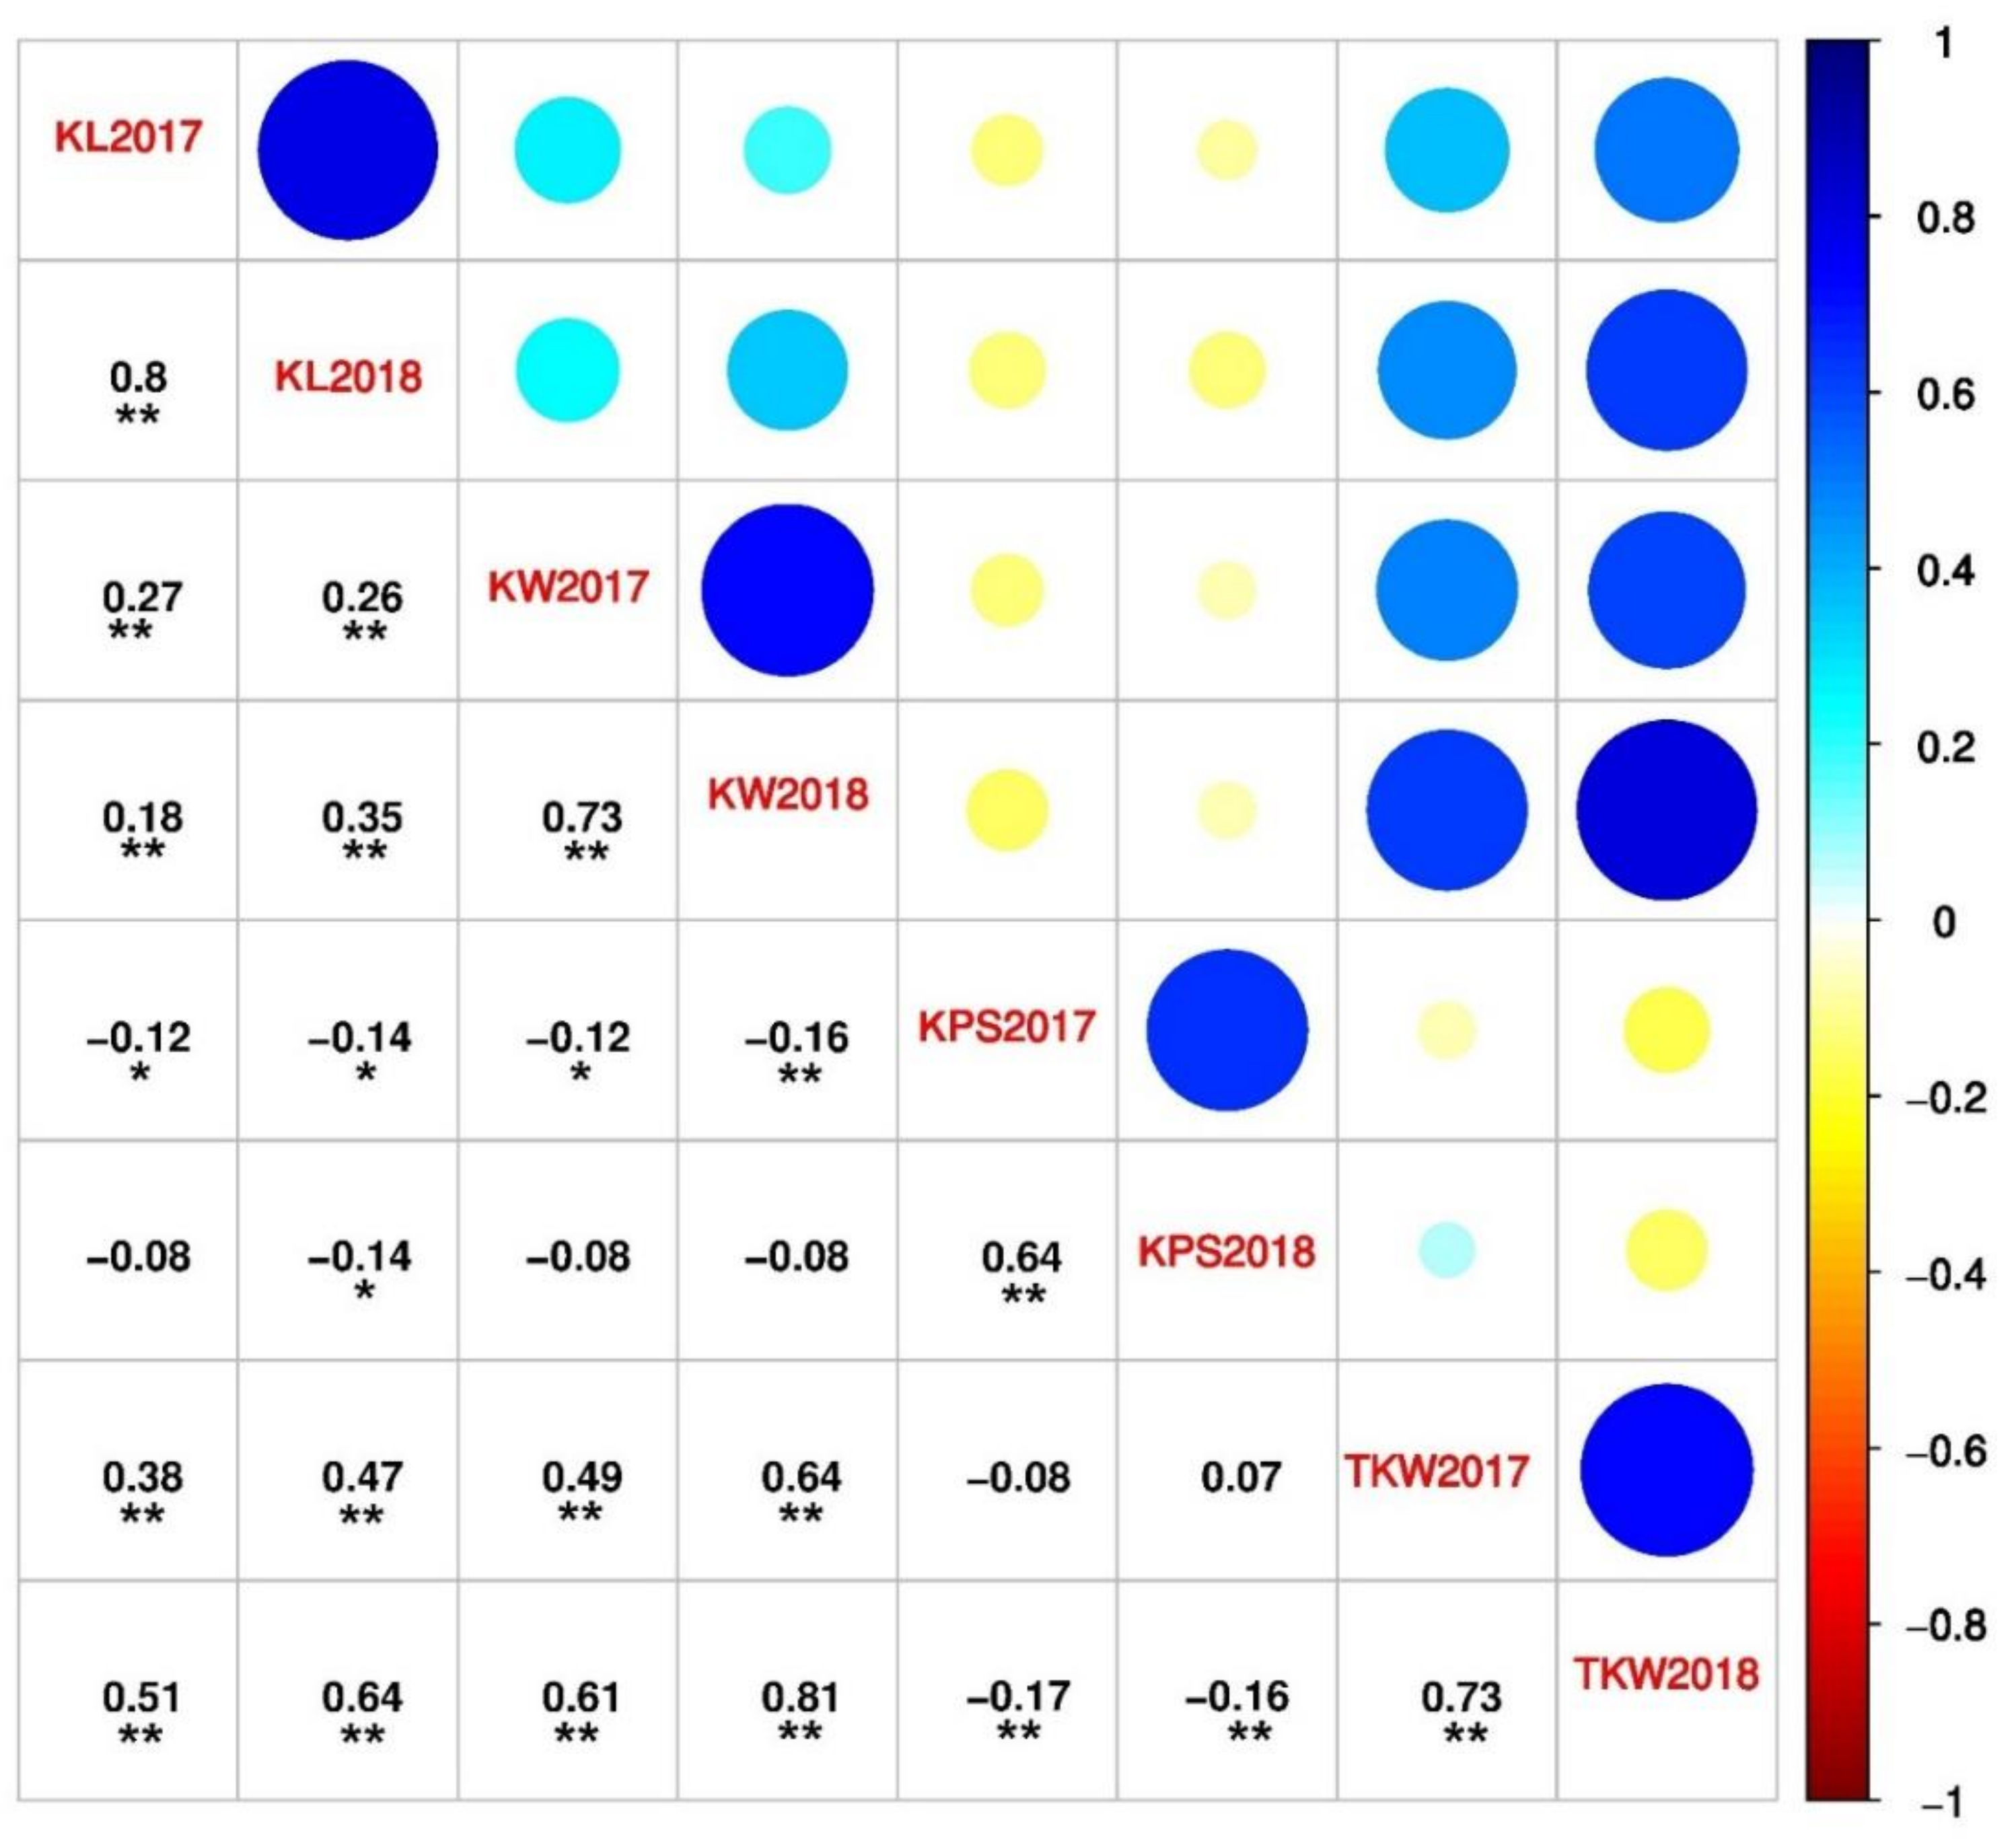
2.1. Phenotypic Evaluation, Correlation, and Heritability of Kernel Traits

Phenotypic variations of kernel traits among the 319 wheat accessions were evaluated at the experimental field in Wuhan during the winter seasons of 2017 and 2018. Phenotypic evaluation revealed significant variations for all traits (i.e., kernel length, kernel width, kernels per spike, and thousand kernel weight) in the two years (Table S1). Kernel length ranged from 6.36 mm to 8.62 mm with a mean of 7.53 mm, where the data revealed a normal distribution pattern with a standard deviation of 0.34 and coefficient of variation (CV) of 4.53%. Kernel width ranged from 2.89 mm to 4.37 mm with a CV of 4.58%. For kernels per spike, the number of kernels in each spike ranged from 28.08 to 68.93. Thousand kernel weight ranged from 17.98 g to 56.99 g. The frequency distributions of all traits revealed a normal distribution in each year, as presented in Figure 1, indicating the quantitative nature of these traits.
The correlation analysis showed significant positive correlations between the two years for kernel length (r = 0.80), kernel width (r = 0.73), kernels per spike (r = 0.63), and thousand kernel weight (r = 0.73), indicating the consistency of these traits across the years. Furthermore, the correlation coefficients showed a significant positive association (p < 0.01) of thousand kernel weight with both kernel width (r = 0.49–0.81) and length (r = 0.38–0.64), indicating that the kernel weight was influenced by kernel size. By contrast, kernel length and width showed significant negative correlations with the kernels per spike (Figure 2). The ANOVA results revealed significant differences (p < 0.01) among the genotypes for all traits (Table S2). High broad-sense heritability was observed for all traits, with a range from 0.80 to 0.89, indicating that these traits were largely influenced by genetic factors.

2.2. Population Structure and LD Analysis

Population structure analysis is mandatory in a diverse population, as the presence of a large number of genotypes in a study can result in a higher quantity of false associations between the phenotypes and unlinked markers. Hence, a detailed examination of the population structure is necessary for conducting a valid association analysis. The number of sub-populations were determined by the changing value of the log probability of data between the successive K-values. ΔK was estimated by the STRUCTURE analysis, in order to highlight the increase in the K value, following the procedure of Evanno [49]. From the kinship analysis, a break in the slope was observed at K = 2, followed by a flattening of the curve (Figure S1a); hence, it was revealed that the most likely number of sub-populations was two (K = 2; Figure S1b). Furthermore, these results were confirmed by principle component analysis (PCA), based on the standardized covariance of genetic distances of SNP markers (Figure S1c). Linkage disequilibrium (LD) among markers was performed using TASSEL v.5.0. software, indicating the mapping resolution and power. The LD among SNPs was estimated for the whole genome (Figure S2a). Only markers with a known position and with an MAF greater than 5% were used. The LD half-width i.e., the point at which LD decays to 50% of the peak, was 9.8 cM. With an increase in genetic distance, the r2 value of the A, B, and D sub-genomes decreased gradually (Figure S2b). The LD analysis for sub-genomes revealed the highest marker density on B (58%) followed by A (34.6%) and then D (7.4%) sub-genomes. Chromosome 2B has the highest marker density, while 4D has the lowest. There was a high LD for most of the pairwise comparisons between the SNP loci. The presence of population structure was one reason inferred for the high LD. The two main factors that greatly affected the significant LD between the independent loci were removing similar entries and considering the presence of population structure. Overall, the LD decays not very rapidly which reveals the significance of the markers used in the study.

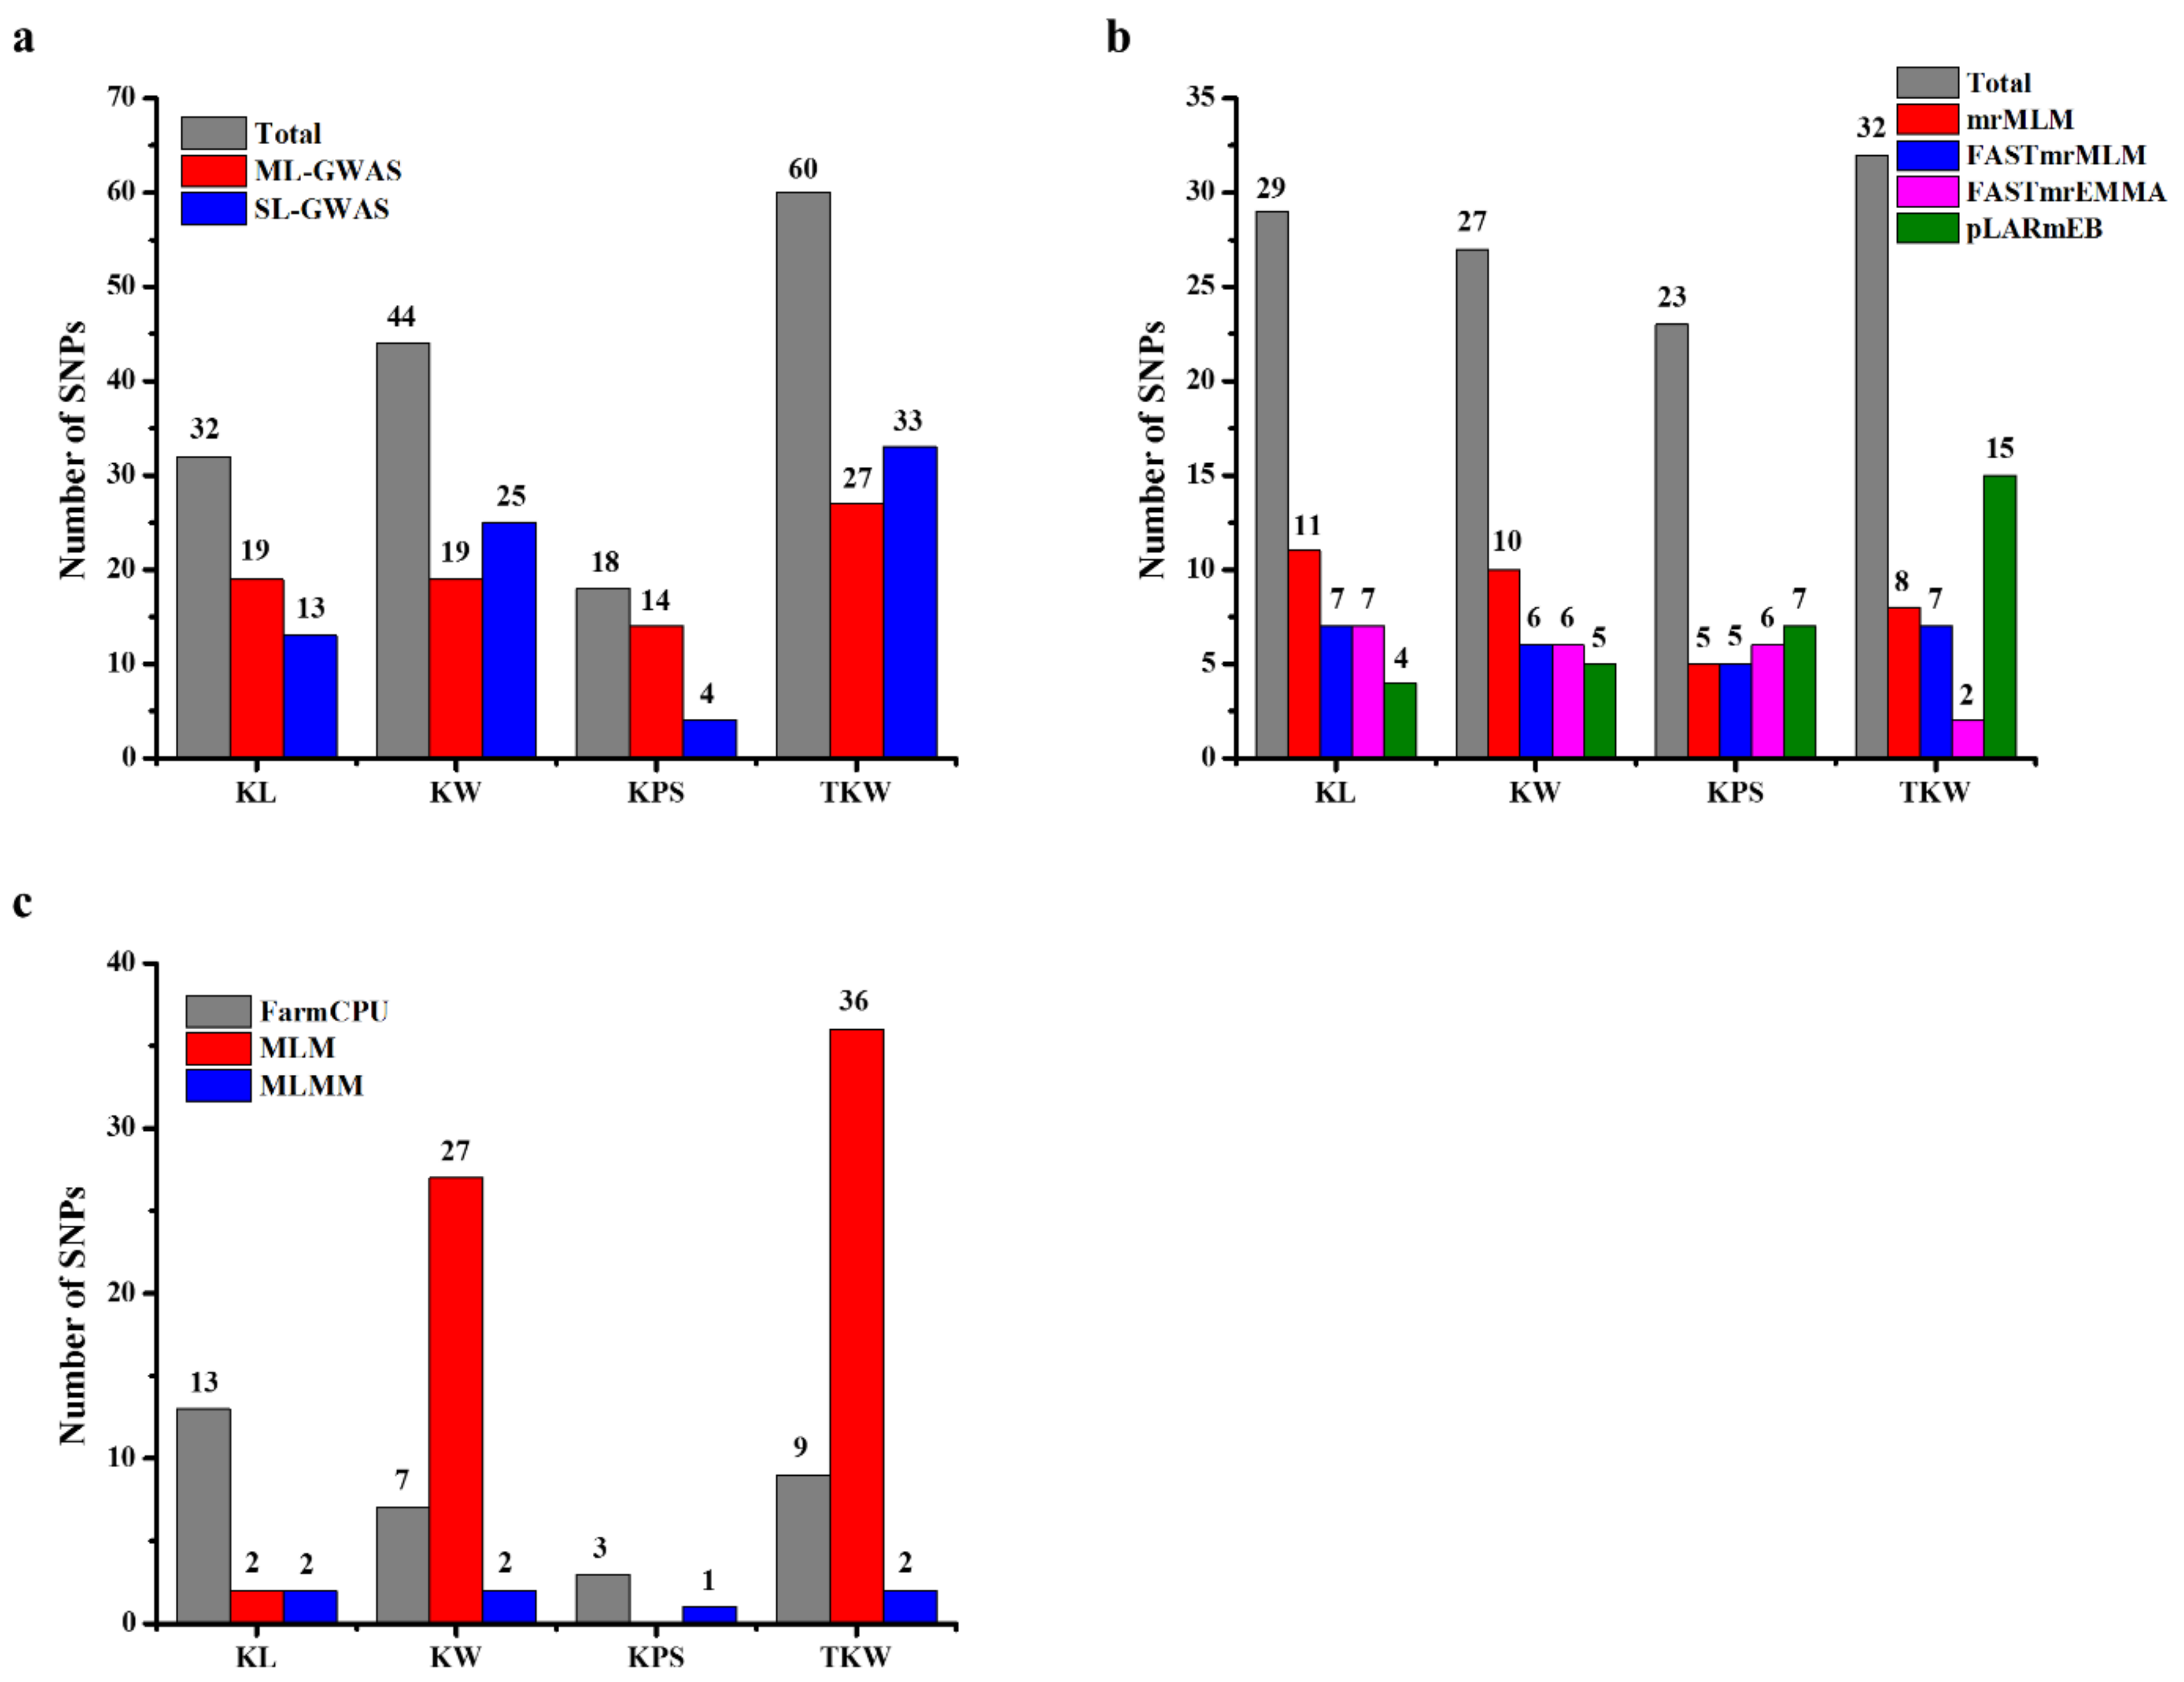
2.3. GWAS for Kernel Traits

We conducted the GWAS to unravel the complex genetic architecture of kernel traits, including kernel length, kernel width, kernels per spike, and thousand kernel weight, across two environments. Four multi-locus GWAS (ML-GWAS)—mrMLM, FASTmrMLM, FASTmrEMMA, and pLARmEB—and three single-locus GWAS (SL-GWAS) methods—FarmCPU, MLM, and MLMM—were used to detect significant loci associated with these traits. In ML-GWAS, loci with critical logarithm of odds (LOD) values equal to 3 or greater than 3 were considered significant. For SL-GWAS, the selection criteria were set to p = 1/n (n corresponding to the total number of SNPs). To obtain more reliable results, the SNPs which were simultaneously detected by at least two methods or in two years were regarded as consensus SNPs. By not considering the repeated SNPs by different models, we obtained a total of 79 and 75 loci for the kernel traits detected on all 21 chromosomes using the ML-GWAS and SL-GWAS methods, respectively (Figure 3a).

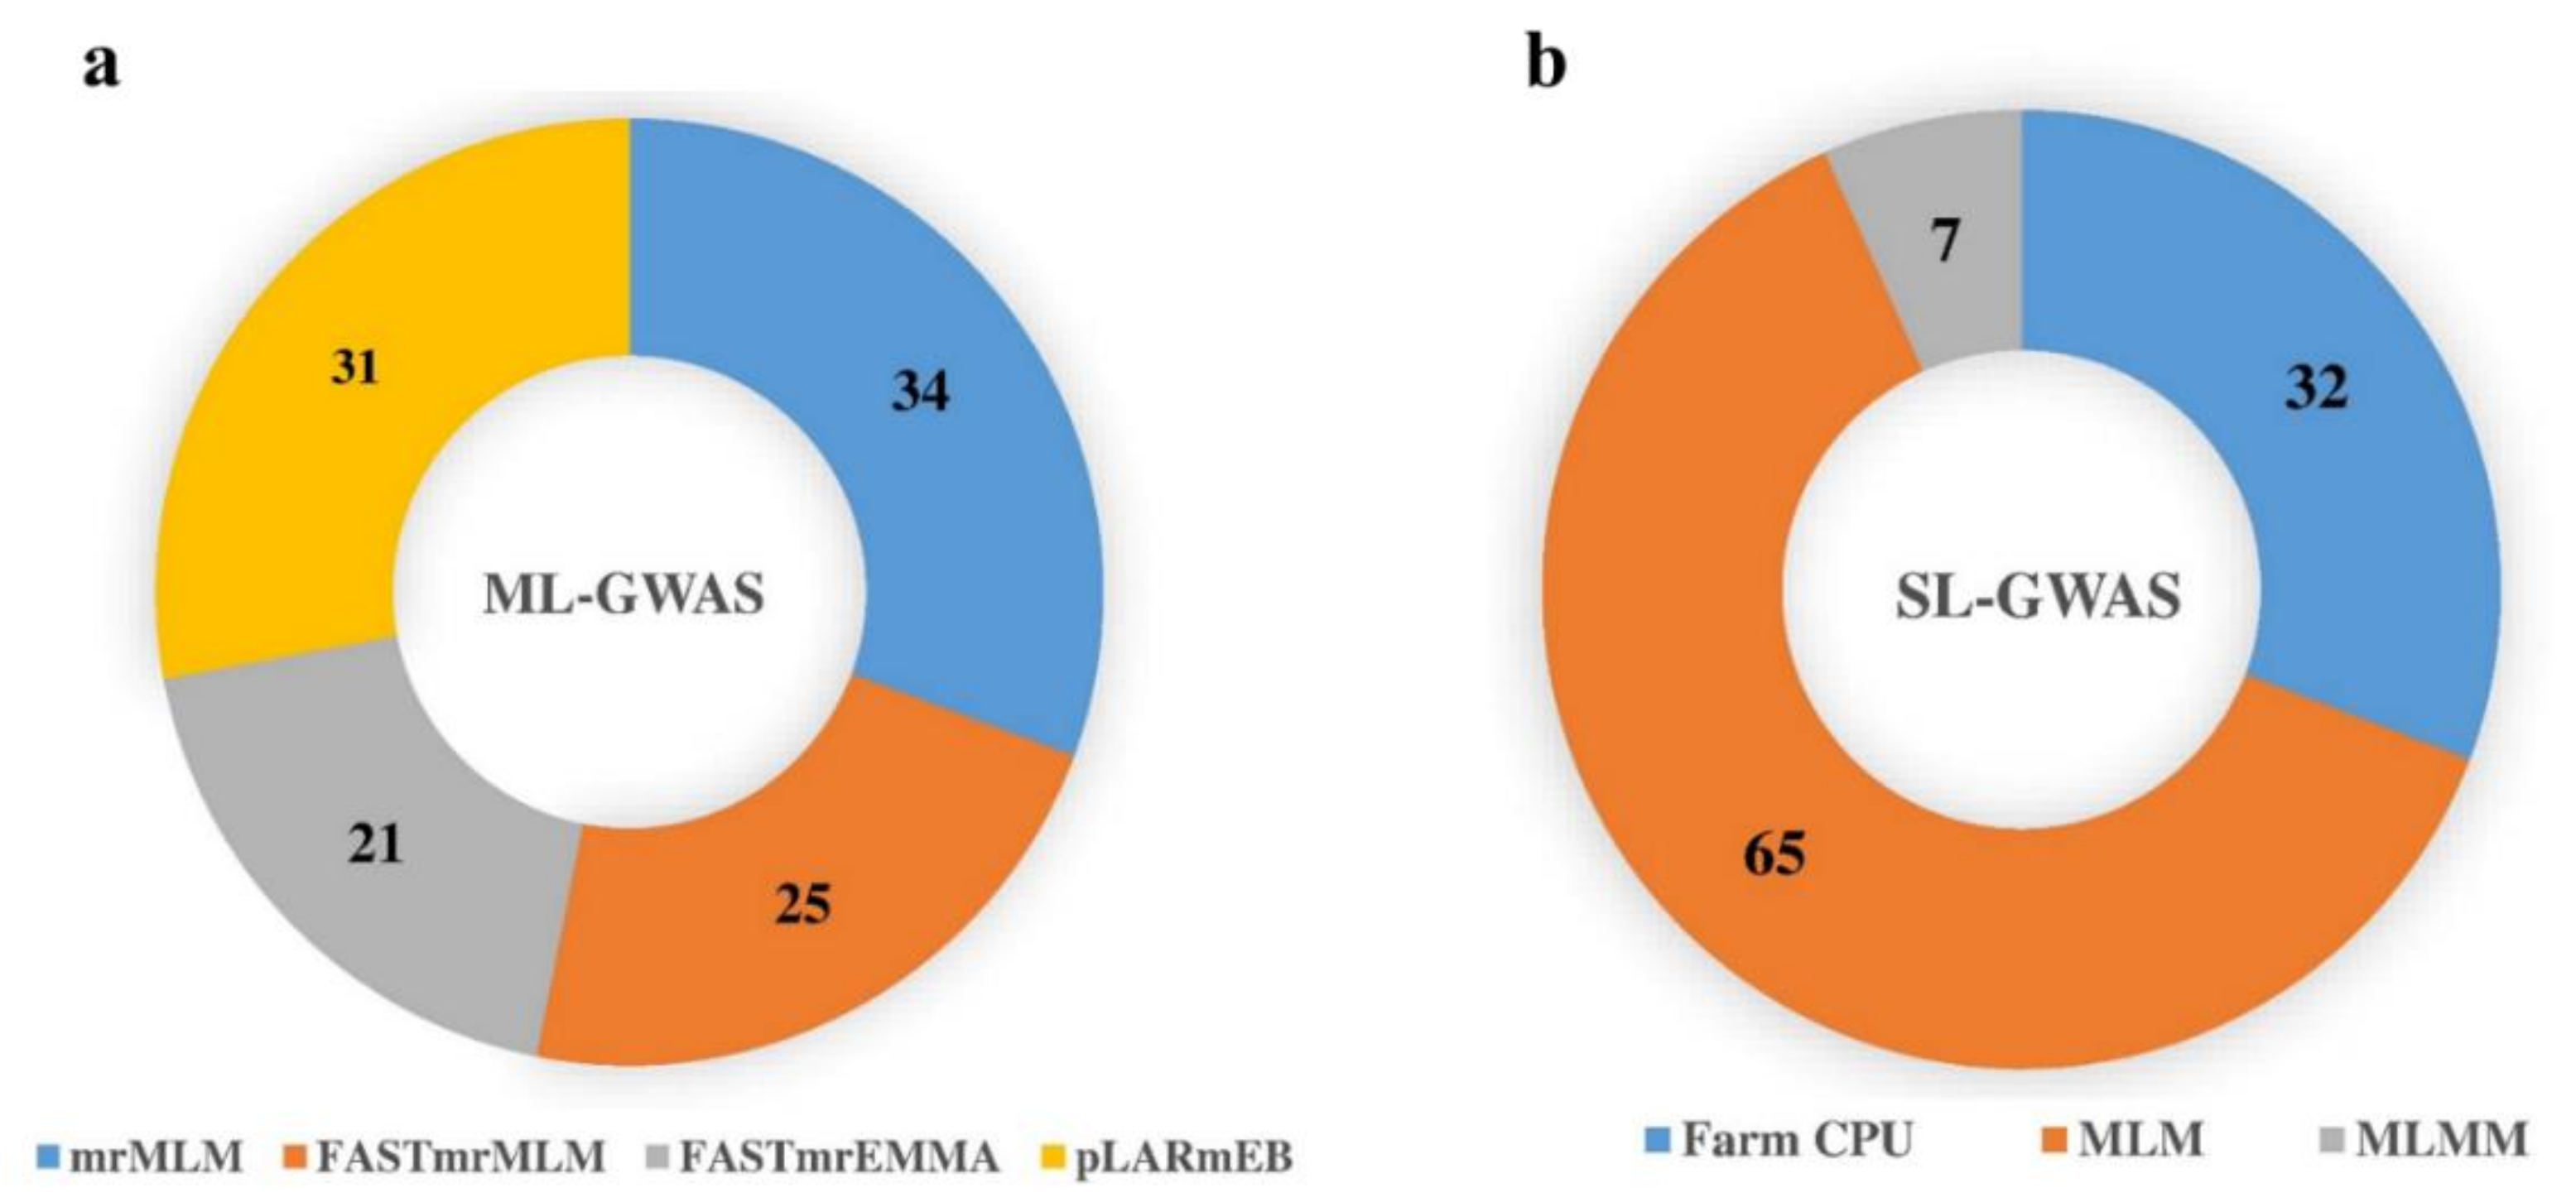
2.4. Loci Detected by Multi-Locus GWAS Methods

Four multi-locus GWAS methods in the mrMLM software were used in this study. A total of 34, 25, 21, and 31 significant SNPs were detected by mrMLM, FASTmrMLM, FASTmrEMMA, and pLARmEB, respectively, for KL (29), KW (27), KPS (23), and TKW (32) across two environments (Figure 3b). Among these SNPs, 11, 10, five, and eight were detected by mrMLM for KL, KW, KPS, and TKW, respectively. By using FASTmrMLM, a total of seven, six, five, and seven were detected associated with the aforementioned objective traits, respectively. Furthermore, seven, six, six, and two significant loci were identified by FASTmeEMMA for these traits, respectively. Finally, by applying the pLARmEB ML-GWAS approach, a total of four, five, seven, and 15 significant SNPs were associated with KL, KW, KPS, and TKW, respectively (Figure 3b).
For further validation, we compared the results across the different ML-GWAS models and both years. As a result, we found 24 significant SNPs co-detected by at least two ML-GWAS methods, whereas three SNPs were consistently repeated in both years. Interestingly, most of these SNPs were located on chromosome 7A and 7B, while chromosome 1B harbored only one SNP. Among the 24 stably expressed SNPs across different ML-GWAS models, five SNPs (RAC875_29540_391, Kukri_07961_503, tplb0034e07_1581, BS00074341_51, and BobWhite_049_3064) were simultaneously detected by at least three ML-GWAS methods. Furthermore, to observe the association of these consistent SNPs, seven loci were associated with KL with phenotypic variance (PVE) explained by the SNPs ranging from 2.58% to 10.51%. The remaining consistent SNPs associated with the rest of kernel traits are shown in Table 1. By integrating the four ML-GWAS methods (mrMLM, FASTmrMLM, FASTmrEMMA, and pLARmEB) to appraise the genetic architecture of the kernel traits, the mrMLM models detected the most SNPs (34), most of which contributed to KL (11 SNPs), while FASTmrEMMA detected the least SNPs (21; Figure 4a). Among the significant SNPs common to both years, two SNPs (Ku_008899_90, Kukri_07961_503) were detected for KL, with an LOD ranging from 3.64 to 7.50, while one SNP (BS00021738_51) was detected across both years for KW, with an LOD score from 4.98 to 7.30 (Table 1). Manhattan plots showing the distribution of significant SNPs for KL, KW, KPS, and TKW, as well as the Q–Q plots illustrating the observed vs. expected associations, are given in Figure 5.

2.5. Loci Detected by Single-Locus GWAS Methods

Single-locus GWAS (SL-GWAS) models, including FarmCPU, MLM, and MLMM, were implemented using the Genomic association and prediction integrated tool (GAPIT) package in R, in order to further evaluate the above kernel traits. A total of 75 significant SNPs was detected by integrating the three SL-GWAS methods in two environments (Figure 3c; Table S3). Among these SNPs, chromosome 4A harbored the maximum number of SNPs (27), followed by chromosome 3B (12 SNPs) and chromosome 7A (five SNPs). By comparing the results of the three SL-GWAS methods, FarmCPU detected 32, MLM identified 65, and MLMM detected seven significant loci associated with kernel traits across the two environments. After observing the association of these SNPs with different kernel traits, we found a total of 17 SNPs associated with KL, 36 SNPs with KW, four SNPs with KPS, and 47 SNPs with TKW (Figure 3c). We further analyzed the SNPs commonly detected by all three SL-GWAS methods and highlighted seven SNPs which were simultaneously detected by more than one SL-GWAS method. Among these SNPs, Kukri_07961_503 was simultaneously detected by all three SL-GWAS methods (Table S4). Conclusively, the MLM approach detected the maximum number of SNPs (65)—mostly contributing to TKW—while MLMM detected the least SNPs (seven; Figure 4b). To obtain more reliable results, we integrated the results of both ML-GWAS and SL-GWAS methods and detected a total of 13 SNPs common to both ML-GWAS and SL-GWAS methods (Table 2). Among these SNPs, most were detected on chromosomes 4A and 7A, thus revealing the importance of these chromosomes in the wheat genome. After observing the associations of these SNPs, we found that most of these SNPs were associated with TKW, followed by KL. Based on these findings, it can be concluded that these SNPs are more reliable and stable, which may be useful for further breeding purposes. Manhattan and Q–Q plots of the above three single-locus GWAS models for plant architectural traits are given in Supplementary Figure S4.

2.6. SNPs Associated with More than One Trait

SNPs controlling more than one trait are prominent in marker-assisted selection. In the present study, we screened some candidate SNPs through the ML-GWAS methods and detected a total of five pleiotropic SNPs (Excalibur_01167_1207, RAC875_00174_268, D_contig07330_330, IACX938, and Tdurum_contig15734_221) associated with different kernel traits (Table S5). Among these, three SNPs (Excalibur_01167_1207, RAC875_00174_268, and D_contig07330_330), located on chromosomes 5A, 5B, and 7D, respectively, were associated with KW and TKW. However, one SNP (IACX938), which was located on chromosome 4B, controlled KL and KW. Finally, one SNP (Tdurum_contig15734_221), located on chromosome 7B, was associated with KL, KW, and TKW at the same time. As discussed above, most of the SNPs had common associations with KW and TKW, which was also confirmed by the correlation analysis (Figure 2). Based on these findings, it can be concluded that these pleotropic SNPs have multifaceted roles in controlling the genetic architecture of kernel traits.

2.7. Mining of Candidate Genes

Candidate genes were detected around the peak SNPs, based on the annotated wheat reference genome. A total of 41 putative candidate genes were associated with kernel traits (Table S6). Among these, six genes located on chromosomes 4A and 3B were associated with kernel width, while the other 35 genes (which were mostly located on chromosomes 3B, 4A, 5B, and 7A) had putative roles in controlling the thousand kernel weight. Most of the candidate genes were located on chromosome 4A followed by chromosome 7A. Based on these results, the genes were categorized regarding several important functions associated with plant growth and development (including Ras family protein, Regulatory protein NPR1, Myosin 6, and so on), as shown in Figure 6 and Table S6.

3. Discussion

3.1. Phenotypic Observations of Kernel Traits

Wheat (Triticum aestivum L.) is one of the major staple food crops, which has an important role in achieving food security [50]. Therefore, improving kernel yield and related traits are consistently important tasks for genetic gain in this crop. Kernel size and shape are key quantitative characteristics which influence crop yield and end-use quality in wheat. Kernel dimensions in wheat have been studied for decades, but the genes underlying kernel morphology are poorly understood [6]. Kernel traits—particularly kernel length, kernel width, kernels per spike, and thousand kernel weight—are key components of kernel yield and quality, due to their significant roles in cultivar yield, milling quality, and market price [51]. The present study was undertaken to use four multi-locus GWAS (ML-GWAS) methods—mrMLM, FASTmrMLM, FASTmrEMMA, and pLARmEB—and three single-locus GWAS (SL-GWAS) methods—FarmCPU, MLM, and MLMM—to detect the significant loci associated with kernel traits in a collection of 319 wheat accessions with a broad genetic base.
Manual measurements of kernel traits have limited data quantity and quality. Therefore, data analysis using digital image technology can improve the process of measurement while providing robust and quick results [52]. Several studies have been done to unravel kernel morphology in wheat by using digital image technologies [6,52,53,54,55,56,57]. The phenotypic traits showed significant variations for kernel traits with high heritability. The significant positive correlation of kernel width and length with kernel weight revealed that the kernels with increased width and length can greatly contribute to kernel weight. However, in the current study, kernel width had a more positive impact on kernel weight than kernel length. Earlier studies have reported moderate to strong correlations between kernel weight and size [56]. Simmonds et al. [58] reported that kernel length and width in tetraploid and hexaploid wheat can greatly influence the thousand kernel weight, as longer and broader kernels have more starch accumulation and hence, a higher weight. Similarly, the presence of a positive and significant correlation between the kernel length and kernel width suggests that choosing heavier kernels may result in an indirect selection for larger seeds. Previously, Breseghello and Sorrells [54] and Ramya et al. [59] reported positive associations among kernel weight, kernel length, and kernel width.

3.2. GWAS Using High-Throughput Genotyping

The advent of next-generation sequencing technologies has enabled the detection of many SNPs, demonstrating high-density genotyping compared to conventional marker analysis [22]. SNP chips are highly adapted, due to their stability, power of detection, efficiency, and low cost [22,29]. At present, molecular studies in wheat using SNP chips are still at a preliminary level. For instance, [60] evaluated 102 Argentinean hexaploid wheat varieties using a 35K SNP array to detect ninety-seven genomic regions associated with yield-contributing traits, and further screened fifteen markers controlling the fruiting efficiency at harvest (FEh), which is an important trait to increase wheat yield. Talini et al. [61] characterized a collection of 299 Triticum Urartu accessions and developed 441,327 single nucleotide polymorphisms to detect the significant loci associated with several agronomic and quality traits. Furthermore, they revealed that T. Urartu may provide an important allele pool for wheat improvement and detected 25 significant quantitative trait nucleotides (QTNs) associated with the different traits under study. Wheat strip rust is one of the most serious treats to wheat yield. Therefore, genetic resistance against this disease is the most effective strategy to control the disease. Cheng et al. [62] conducted GWAS in 120 China winter wheat accessions using SNP markers of a 90K array and detected 16 significant loci controlling wheat strip rust. Gahlaut, Jaiswal, Singh, Balyan, and Gupta [38] conducted multi-locus GWAS in a collection of 320 spring wheat accessions using 9626 SNPs and detected 46 drought-tolerant loci associated with different traits. Chen et al. [63] conducted a metabolite-based GWAS study using 14,646 SNP markers and detected 1098 genomic regions and 42 candidate genes having prominent effects.

3.3. Comparison of Present GWAS Results with Previous Studies

Recently, several studies based on 90K SNP arrays can be found which have used GWAS for kernel yield [20,64,65], for resistance against different diseases in wheat [62,66,67], and for bi-parental QTL mapping [32,68,69,70,71]. Comparatively, GWAS-based linkage disequilibrium (LD) is a much more powerful tool to detect genetic loci in larger gene pools, with much higher resolution than traditional QTL mapping [72]. GWAS can be used to phenotype several complex traits in studies with larger population sizes [20]. The validity of GWAS results depends on the number of markers used in the study. In the present study, we used 22,905 SNPs from a wheat 90K array to detect several genomic loci for kernel traits. A total of 24 common SNPs was detected by the different ML-GWAS methods. However, we only found three SNPs which were consistently repeated in both years. We note that Zhang et al. [73] detected only one common QTN in three environments in a total of 129 QTNs identified for seed protein content in soybean. Su et al. [74] detected a total of 70 significant SNPs for fiber-related traits in upland cotton, of which only three SNPs were found across two environments. We believe that the inconsistency between the two years is mostly due to the Kernel yield and its contributing traits possessing a complex quantitative nature, representing the culmination of a diverse array of various vegetative and reproductive processes [75]. In addition, we detected moderate interaction effects between the accessions (genotypes) and the years. Furthermore, the correlation between the two years does not definitely indicate an association in the genetics. Due to the inconsistency of these SNPs across environments, we focused on common SNPs across different GWAS models, as the major purpose of this study was to highlight the most accurate SNPs. Therefore, we considered the results of all four ML-GWAS methods and selected the SNPs identified by multiple methods as credible SNPs to consider in further experiments. Most of these SNPs were located on chromosome 7A and 7B. Jamil et al. [76] conducted GWAS for seven agronomic traits and revealed the importance of chromosome 7A, due to the presence of association signals with several agronomic traits. According to Wang et al. [77], most of the MTAs for plant height- and yield-contributing traits were located on chromosome 7B, suggesting the importance of this chromosome. Furthermore, several previous reports have indicated the prominence of chromosome 7B by revealing many yield-related genes and QTLs on chromosome 7B, including Hkps/sn-7B loci for increased grains and spikelet number per spike [78], the TaSus1-7B genomic region for TKW [79], and the TaCYP78A3 candidate gene for grain size [80]. According to our results, common SNPs detected by different ML-GWAS models associated with KW were located on chromosomes 2A, 4A, 6A, 7B, and 7D, where chromosome 2A was more promising for KW, harboring most of the stable SNPs. Similarly, the SNPs linked to KW on 2A have been reported earlier in genome-wide association studies for grain yield in hexaploid wheat [20] and in QTL mapping for seed dimensions in bread wheat [6].
By further reviewing the results of commonly identified SNPs in the ML-GWAS methods, a stable SNP (Tdurum_contig15734_221) was consistently repeated by three ML-GWAS methods, which we referred to as a pleiotropic SNP, having association signals with multiple traits identified for kernel length and width, on chromosome 7B. The same SNP has been identified in a bi-parental QTL mapping for plant height- and yield-contributing traits in hexaploid wheat [81]. Another pleiotropic SNP (D_contig07330_330) associated with kernel width and thousand kernel weight was identified in our study, which was located on chromosome 7D. A similar SNP has been reported earlier, in a genome-wide association study for domestication and the improvement of candidate loci using a 90K wheat SNP array [82]. Another stable SNP (tplb0034e07_1581) associated with kernel width was detected in our study, which was consistently repeated by three ML-GWAS methods. Previously, Yang et al. [83] reported the same SNP by evaluating disease resistance genes in wheat and Arabidopsis.
Kernel number per spike is another important trait for kernel yield in wheat. For KPS, most of the stable SNPs were located on chromosome 7A, as revealed by the ML-GWAS results. Earlier studies conducted on GWAS for yield-contributing traits reported significant loci linked to KPS on chromosome 7A [20,77]. A stable SNP (Tdurum_contig54559_211) associated with KPS was simultaneously detected by two ML-GWAS methods (mrMLM and pLARmEB). Zanke et al. [84] reported the same SNP in a genome-wide study for thousand kernel weight in hexaploid wheat. TKW is a complex quantitative trait, which had SNPs located on different chromosomes, including 4A, 7A, and 7D. Most of the SNPs for TKW were located on 7A. Similarly, SNPs for TKW located on chromosome 7A have been previously reported in several studies [76,77,85]. In our study, we retrieved high-confidence candidate genes surrounding (±200 kb) the peak SNPs, based on the annotated wheat reference genome IWGSC RefSeq v1.0 [86]. A total of 41 putative genes were detected and categorized into major functional groups (Figure 6). These functional groups included the “Ras family protein”, controlling TKW and KW. Ras family proteins are involved in the virulence and the cell death of harmful fungi [87,88]. Regulatory protein NPR1 is another functional protein associated with KW and TKW. NPR1 plays a prominent role in developing systematic acquired resistance (SAR) [89]. According to Diethelm et al. [90], NPR1-like genes are involved in Fusarium head blight (FHB) resistance in wheat. Another functional protein included putative Cytochrome P450, which is involved in plant defense, including resistance to FHB disease in wheat [91,92]. Furthermore, Globulin 1 was associated with TKW, which is a major class of storage proteins involved in seed development [93]. Other functional proteins were predicted for KW and TKW, including putative transmembrane protein 56, Lipid transfer protein, Myosin-6, and so on, as shown in Supplementary Table S6.

4. Materials and Methods

4.1. Plant Materials

The plant material was comprised of 319 wheat accessions obtained from the Hubei Academy of Agricultural Sciences in Hubei Province, China, which represent a wheat gene pool adapted to the central China and the Yangzi River region. Most of the accessions comprised of released varieties and landraces (266), some of which were genetic stocks (41) and improved genotypes (12). These accessions were evaluated in randomized complete blocks with three replicates at the experimental farm of Huazhong Agricultural University (HZAU), Wuhan, China, for two consecutive winter seasons (2017–2018 and 2018–2019). Twenty individual plants from each accession were selected and grown in two rows, with distances of 15 cm between the plants and 20 cm between the rows. Field management essentially followed normal local wheat cropping practices. The plants were harvested individually at maturity for phenotype evaluation.

4.2. Phenotyping

Four traits, including kernel length (KL), kernel width (KW), kernels per spike (KPS), and thousand kernel weight (TKW), were evaluated at the experimental farm of HZAU, Wuhan, China, during the winter seasons of 2017 and 2018. The measurements of these kernel traits were performed by selecting the main spikes of five random individual plants in the middle of the row for each accession. Kernels per spike were estimated by hand-threshing the mature spike. Thousand kernel weight (TKW) of each plant was recorded by weighing all the seeds from a sample, dividing it by the total seed number measured, and multiplying the result by 1000 [6]. In the experiment, we counted the number of seeds from each sample, with more than 200 seeds. Phenotypic analysis was done by high-throughput image processing, as follows: the kernels were placed on a glass plate and images were produced by a scanner (GT-X820, Epson, Suwa, Japan) at a resolution of 240 or 360 dpi. The images were processed using the software package SmartGrain ver. 1.2, developed for the high-throughput phenotyping of rice grains [94], and which can also be used for wheat grain measurement [95]. Measurements were done with the default threshold for the accuracy of grain detection, such that extreme values for grain size could be excluded.

4.3. Genotyping

The 319 wheat accessions were genotyped using the Illumina 90K wheat chip [22] in the genotyping Laboratory of North Dakota State University in Fargo. Quality pre-processing of the genotyping data was performed using the PLINK software (https://zzz.bwh.harvard.edu/plink/) [96] for the sample call rate, SNP call rate, minor allele frequency (MAF), and Hardy–Weinberg equilibrium (HWE).

4.4. Statistical Analysis

Statistical analyses, including ANOVA, heritability, correlation, and descriptive statistics, were conducted using the R statistical package [97]. The broad-sense heritability for the traits was estimated by the formula H2 = VG/(VG + VE) where VG and VE represent the estimates of genetic and environmental variance, respectively [75].

4.5. Population Structure and Kinship Analysis

Population structure analysis was carried out by the STRUCTURE 2.3.4 software [98], using Bayesian cluster analysis, and the obtained results were visualized with the STRUCTURE HARVESTER software [99], in order to obtain an appropriate K value. The putative number of sub-populations (k = 1 to 7) was assessed using 100,000 burn-in iterations followed by 500,000 recorded Markov chain iterations. In order to reveal the sampling variance (robustness) of the inferred population structure, 10 independent runs were carried out for each K value. K was estimated, according to the method of Evanno et al. [49], using an ad hoc statistic, ∆K, based on the rate of change in the log probability of data between successive values. Principle component analysis (PCA) was calculated by R software to evaluate the population structure and for comparison with the results of STRUCTURE [29]. Linkage disequilibrium (LD) among the markers was also performed using the observed vs. expected allele frequencies of the markers in the TASSEL v.5.0 software [64].

4.6. Genome-Wide Association Studies

To appraise the genetic architecture of kernel-related traits, we used mrMLM software for four multi-locus GWAS (ML-GWAS), including FASTmrMLM, FASTmrEMMA, mrMLM, and pLARmEB, as well as three single-locus GWAS (SL-GWAS) models, including FarmCPU, MLM, and MLMM, as implemented by the Genomic Association and Prediction Integrated Tool (GAPIT) in R [100]. Previously, GLM and MLM were the most generally applied among SL-GWAS methods. However, these methods have some limitations; for example, GLM can encounter high false-positive rates (FPRs), while MLM uses Bonferroni corrections to reduce FPRs [101] and so this method is so stringent that it may ignore several significant SNPs [45]. To overcome these issues, multi-locus GWAS approaches are the best alternatives. The strict selection criterion in the SL-GWAS analysis was substituted by a flexible selection criterion in multi-locus GWAS analysis, which lessened the possibility of missing out significant loci [45,46]. The four ML-GWAS methods were performed with default parameters, while the screening criteria for significance were set with the logarithm of odds (LOD) scores of 3 or greater than 3 [43,45,46,47,102]. However, for the SL-GWAS models, the threshold for the p-value was calculated based on the number of markers (p = 1/n, n = total SNPs used), according to the method of [103]. Significant markers were visualized with a Manhattan plot using the Haploview 4.2 software [104]. Important p-value distributions (expected vs. observed p-values on a -log10 scale) are shown with a quantile–quantile plot.

4.7. Candidate Gene Analysis

The R Package Pathway Association Study Tool (PAST) version 1.0.1 [105] was used to detect high-confidence genes surrounding (±200 kb) the peak SNPs. Gene sites were aligned and downloaded from the ViroBLAST database (https://urgi.versailles.inra.fr/blast/docs/aboutviroblast.html). To obtain the putative related candidate genes of SNP-flanking regions, a BLASTx search was conducted for significant marker-trait associations (MTAs) against the recently released genome sequence i.e. international wheat genome sequencing consortium (IWGSC) RefSeq v1.0 [86].

5. Conclusions

The present study utilized four multi-locus GWAS (ML-GWAS) and three single-locus GWAS (SL-GWAS) models, resulting in the detection of the consensus SNPs and genes responsible for the determination of kernel traits. Comparatively, 111 and 104 significant SNPs were found to be significant using the ML-GWAS and SL-GWAS methods, respectively. By integrating these GWAS models, the mrMLM and MLM approaches outperformed in SNP detection compared to the other ML-GWAS and SL-GWAS models, respectively. Overall, the ML-GWAS results revealed five stable SNPs (RAC875_29540_391, Kukri_07961_503, tplb0034e07_1581, BS00074341_51, and BobWhite_049_3064), which were simultaneously detected by at least three of the ML-GWAS methods. Furthermore, 41 putative candidate genes were assessed as controlling kernel width and thousand kernel weight, thus providing new insights into the genetic architecture of these kernel traits.

Supplementary Materials

The following are available online at https://0-www-mdpi-com.brum.beds.ac.uk/1422-0067/21/16/5649/s1, Figure S1: Structure analysis of 319 wheat accessions based on unlinked SNPs. Figure S2: Linkage disequilibrium (LD) analysis among markers. Figure S3: Manhattan and Q–Q plots of multi-locus GWAS models for kernel length, kernel width, kernels per spike, and thousand kernel weight in two years. Figure S4: Manhattan and Q–Q plots of three single-locus GWAS models for kernel traits in two years. Table S1: Phenotypic variation of kernel length, kernel width, kernel per spike, and thousand kernel weight in two years (2017–2018). Table S2: Analysis of variance (ANOVA) and heritability for kernel length, kernel width, kernel per spike, and thousand kernel weight. Table S3: Significant SNPs detected by three single-locus GWAS methods in two years for kernel length, kernel width, kernels per spike, and thousand kernel weight. Table S4: Common SNPs co-detected by multiple- and single-locus GWAS methods for kernel length, kernel width, and thousand kernel weight. Table S5: List of pleiotropic SNPs associated with more than one trait. Table S6: List of putative candidate genes around the peak SNPs associated with kernel width (KW) and thousand kernel weight (TKW).

Author Contributions

Conceptualization, A.M.; data curation, A.M. and W.H.; writing—original draft preparation, A.M.; methodology, Z.L.; formal analysis, J.L.; writing—review and editing, L.W.; resources, G.X.; validation, J.W.; supervision, L.W. All authors have read and agreed to the published version of the manuscript.

Funding

This work was supported in part by grants from the National Natural Science Foundation of China (31771775 and 31171524), Program of Introducing Talents of Discipline to Guangxi University (A3310051010 and EE101701).

Conflicts of Interest

The authors declare no conflict of interest.

Abbreviations

GWASGenome-wide association study
MLMulti-locus
SLSingle-locus
SNPSingle nucleotide polymorphism
QTLQuantitative trait loci
KLKernel length
KWKernel width
KPSKernel per spike
TKWThousand kernel weight
MAFMinor allele frequency
HWEHardy–Weinberg equilibrium
ANOVAAnalysis of variance
LDLinkage disequilibrium
GAPITGenomic association and prediction integrated tool
MTAMarker-trait associations
CVCoefficient of variation

References

  1. Muhammad, A.; Hao, H.; Xue, Y.; Alam, A.; Bai, S.; Hu, W.; Sajid, M.; Hu, Z.; Samad, R.A.; Li, Z.; et al. Survey of wheat straw stem characteristics for enhanced resistance to lodging. Cellulose 2020, 27, 2469–2484. [Google Scholar] [CrossRef]
  2. Zhang, D.; Zhou, Y.; Zhao, X.; Lv, L.; Zhang, C.; Li, J.; Sun, G.; Li, S.; Song, C. Development and utilization of introgression lines using synthetic octaploid wheat (aegilops tauschii× hexaploid wheat) as Donor. Front. Plant Sci. 2018, 9, 1113. [Google Scholar] [CrossRef] [PubMed]
  3. Bruinsma, J. The resources outlook: By how much do land, water and crop yields need to increase by 2050? In Looking Ahead in World Food and Agriculture: Perspectives to 2050; FAO: Rome, Italy, 2011; pp. 233–278. [Google Scholar]
  4. Quarrie, S.; Pekic Quarrie, S.; Radosevic, R.; Rancic, D.; Kaminska, A.; Barnes, J.; Leverington, M.; Ceoloni, C.; Dodig, D. Dissecting a wheat QTL for yield present in a range of environments: From the QTL to candidate genes. J. Exp. Bot. 2006, 57, 2627–2637. [Google Scholar] [CrossRef] [PubMed] [Green Version]
  5. Zhang, L.Y.; Liu, D.C.; Guo, X.L.; Yang, W.L.; Sun, J.Z.; Wang, D.W.; Zhang, A. Genomic distribution of quantitative trait loci for yield and yield-related traits in common wheat. J. Integr. Plant Biol. 2010, 52, 996–1007. [Google Scholar] [CrossRef] [PubMed]
  6. Williams, K.; Sorrells, M.E. Three-dimensional seed size and shape QTL in hexaploid wheat (Triticum aestivum L.) populations. Crop Sci. 2014, 54, 98–110. [Google Scholar] [CrossRef]
  7. Valluru, R.; Reynolds, M.P.; Salse, J. Genetic and molecular bases of yield-associated traits: A translational biology approach between rice and wheat. Theor. Appl. Genet. 2014, 127, 1463–1489. [Google Scholar] [CrossRef]
  8. Su, Z.; Hao, C.; Wang, L.; Dong, Y.; Zhang, X. Identification and development of a functional marker of TaGW2 associated with grain weight in bread wheat (Triticum aestivum L.). Theor. Appl. Genet. 2011, 122, 211–223. [Google Scholar] [CrossRef]
  9. Zhang, X.; Chen, J.; Shi, C.; Chen, J.; Zheng, F.; Tian, J. Function of TaGW2-6A and its effect on grain weight in wheat (Triticum aestivum L.). Euphytica 2013, 192, 347–357. [Google Scholar] [CrossRef]
  10. Jaiswal, V.; Gahlaut, V.; Mathur, S.; Agarwal, P.; Khandelwal, M.K.; Khurana, J.P.; Tyagi, A.K.; Balyan, H.S.; Gupta, P.K. Identification of novel SNP in promoter sequence of TaGW2-6A associated with grain weight and other agronomic traits in wheat (Triticum aestivum L.). PLoS ONE 2015, 10, e0129400. [Google Scholar] [CrossRef] [Green Version]
  11. Heidari, B.; Sayed-Tabatabaei, B.E.; Saeidi, G.; Kearsey, M.; Suenaga, K. Mapping QTL for grain yield, yield components, and spike features in a doubled haploid population of bread wheat. Genome 2011, 54, 517–527. [Google Scholar] [CrossRef]
  12. Zhang, H.; Chen, J.; Li, R.; Deng, Z.; Zhang, K.; Liu, B.; Tian, J. Conditional QTL mapping of three yield components in common wheat (Triticum aestivum L.). Crop J. 2016, 4, 220–228. [Google Scholar] [CrossRef] [Green Version]
  13. Guo, J.; Hao, C.; Zhang, Y.; Zhang, B.; Cheng, X.; Qin, L.; Li, T.; Shi, W.; Chang, X.; Jing, R. Association and validation of yield-favored alleles in chinese cultivars of common wheat (Triticum aestivum L.). PLoS ONE 2015, 10, e0130029. [Google Scholar]
  14. Guo, J.; Zhang, Y.; Shi, W.; Zhang, B.; Zhang, J.; Xu, Y.; Cheng, X.; Cheng, K.; Zhang, X.; Hao, C. Association analysis of grain-setting rates in apical and basal spikelets in bread wheat (Triticum aestivum L.). Front. Plant Sci. 2015, 6, 1029. [Google Scholar] [CrossRef]
  15. Cuthbert, J.L.; Somers, D.J.; Brûlé-Babel, A.L.; Brown, P.D.; Crow, G.H. Molecular mapping of quantitative trait loci for yield and yield components in spring wheat (Triticum aestivum L.). Theor. Appl. Genet. 2008, 117, 595–608. [Google Scholar] [CrossRef] [PubMed]
  16. Cui, F.; Li, J.; Ding, A.; Zhao, C.; Wang, L.; Wang, X.; Li, S.; Bao, Y.; Li, X.; Feng, D. Conditional QTL mapping for plant height with respect to the length of the spike and internode in two mapping populations of wheat. Theor. Appl. Genet. 2011, 122, 1517–1536. [Google Scholar] [CrossRef] [PubMed]
  17. Cui, F.; Zhao, C.; Ding, A.; Li, J.; Wang, L.; Li, X.; Bao, Y.; Li, J.; Wang, H. Construction of an integrative linkage map and QTL mapping of grain yield-related traits using three related wheat RIL populations. Theor. Appl. Genet. 2014, 127, 659–675. [Google Scholar] [CrossRef]
  18. Edae, E.A.; Byrne, P.F.; Haley, S.D.; Lopes, M.S.; Reynolds, M.P. Genome-wide association mapping of yield and yield components of spring wheat under contrasting moisture regimes. Theor. Appl. Genet. 2014, 127, 791–807. [Google Scholar] [CrossRef]
  19. Azadi, A.; Mardi, M.; Hervan, E.M.; Mohammadi, S.A.; Moradi, F.; Tabatabaee, M.T.; Pirseyedi, S.M.; Ebrahimi, M.; Fayaz, F.; Kazemi, M. QTL mapping of yield and yield components under normal and salt-stress conditions in bread wheat (Triticum aestivum L.). Plant Mol. Biol. Rep. 2015, 33, 102–120. [Google Scholar] [CrossRef]
  20. Li, F.; Wen, W.; Liu, J.; Zhang, Y.; Cao, S.; He, Z.; Rasheed, A.; Jin, H.; Zhang, C.; Yan, J. Genetic architecture of grain yield in bread wheat based on genome-wide association studies. BMC Plant Biol. 2019, 19, 168. [Google Scholar] [CrossRef]
  21. Tsai, H.-Y.; Janss, L.L.; Andersen, J.R.; Orabi, J.; Jensen, J.D.; Jahoor, A.; Jensen, J. Genomic prediction and GWAS of yield, quality and disease-related traits in spring barley and winter wheat. Sci. Rep. 2020, 10, 1–15. [Google Scholar] [CrossRef]
  22. Wang, S.; Wong, D.; Forrest, K.; Allen, A.; Chao, S.; Huang, B.E.; Maccaferri, M.; Salvi, S.; Milner, S.G.; Cattivelli, L. Characterization of polyploid wheat genomic diversity using a high-density 90,000 single nucleotide polymorphism array. Plant Biotechnol. J. 2014, 12, 787–796. [Google Scholar] [CrossRef] [PubMed] [Green Version]
  23. Allen, A.M.; Barker, G.L.; Berry, S.T.; Coghill, J.A.; Gwilliam, R.; Kirby, S.; Robinson, P.; Brenchley, R.C.; D’Amore, R.; McKenzie, N. Transcript-specific, single-nucleotide polymorphism discovery and linkage analysis in hexaploid bread wheat (Triticum aestivum L.). Plant Biotechnol. J. 2011, 9, 1086–1099. [Google Scholar] [CrossRef] [Green Version]
  24. Cavanagh, C.R.; Chao, S.; Wang, S.; Huang, B.E.; Stephen, S.; Kiani, S.; Forrest, K.; Saintenac, C.; Brown-Guedira, G.L.; Akhunova, A. Genome-wide comparative diversity uncovers multiple targets of selection for improvement in hexaploid wheat landraces and cultivars. Proc. Natl. Acad. Sci. USA 2013, 110, 8057–8062. [Google Scholar] [CrossRef] [Green Version]
  25. Winfield, M.O.; Allen, A.M.; Burridge, A.J.; Barker, G.L.; Benbow, H.R.; Wilkinson, P.A.; Coghill, J.; Waterfall, C.; Davassi, A.; Scopes, G. High-density SNP genotyping array for hexaploid wheat and its secondary and tertiary gene pool. Plant Biotechnol. J. 2016, 14, 1195–1206. [Google Scholar] [CrossRef] [PubMed]
  26. Cui, F.; Zhang, N.; Fan, X.-l.; Zhang, W.; Zhao, C.-h.; Yang, L.-j.; Pan, R.-q.; Chen, M.; Han, J.; Zhao, X.-q. Utilization of a Wheat660K SNP array-derived high-density genetic map for high-resolution mapping of a major QTL for kernel number. Sci. Rep. 2017, 7, 1–12. [Google Scholar]
  27. Jin, H.; Wen, W.; Liu, J.; Zhai, S.; Zhang, Y.; Yan, J.; Liu, Z.; Xia, X.; He, Z. Genome-wide QTL mapping for wheat processing quality parameters in a Gaocheng 8901/Zhoumai 16 recombinant inbred line population. Front. Plant Sci. 2016, 7, 1032. [Google Scholar] [CrossRef] [Green Version]
  28. Liu, J.; He, Z.; Rasheed, A.; Wen, W.; Yan, J.; Zhang, P.; Wan, Y.; Zhang, Y.; Xie, C.; Xia, X. Genome-wide association mapping of black point reaction in common wheat (Triticum aestivum L.). BMC Plant Biol. 2017, 17, 220. [Google Scholar] [CrossRef] [Green Version]
  29. Sun, C.; Zhang, F.; Yan, X.; Zhang, X.; Dong, Z.; Cui, D.; Chen, F. Genome-wide association study for 13 agronomic traits reveals distribution of superior alleles in bread wheat from the Yellow and Huai Valley of China. Plant Biotechnol. J. 2017, 15, 953–969. [Google Scholar] [CrossRef] [Green Version]
  30. Valluru, R.; Reynolds, M.P.; Davies, W.J.; Sukumaran, S. Phenotypic and genome-wide association analysis of spike ethylene in diverse wheat genotypes under heat stress. New Phytol. 2017, 214, 271–283. [Google Scholar] [CrossRef] [Green Version]
  31. Mu, J.; Wu, J.; Liu, S.; Dai, M.; Sun, D.; Huang, S.; Wang, Q.; Zeng, Q.; Yu, S.; Chen, L. Genome-Wide Linkage Mapping Reveals Stripe Rust Resistance in Common Wheat (Triticum aestivum) Xinong1376. Plant Dis. 2019, 103, 2742–2750. [Google Scholar] [CrossRef]
  32. Kthiri, D.; Loladze, A.; N’Diaye, A.; Nilsen, K.T.; Walkowiak, S.; Dreisigacker, S.; Ammar, K.; Pozniak, C.J. Mapping of genetic loci conferring resistance to leaf rust from three globally resistant durum wheat sources. Front. Plant Sci. 2019, 10, 1247. [Google Scholar] [CrossRef]
  33. Zhao, M.; Leng, Y.; Chao, S.; Xu, S.S.; Zhong, S. Molecular mapping of QTL for Fusarium head blight resistance introgressed into durum wheat. Theor. Appl. Genet. 2018, 131, 1939–1951. [Google Scholar] [CrossRef] [PubMed]
  34. Assanga, S.O.; Fuentealba, M.; Zhang, G.; Tan, C.; Dhakal, S.; Rudd, J.C.; Ibrahim, A.M.; Xue, Q.; Haley, S.; Chen, J. Mapping of quantitative trait loci for grain yield and its components in a US popular winter wheat TAM 111 using 90K SNPs. PLoS ONE 2017, 12, e0189669. [Google Scholar] [CrossRef]
  35. Garcia, M.; Eckermann, P.; Haefele, S.; Satija, S.; Sznajder, B.; Timmins, A.; Baumann, U.; Wolters, P.; Mather, D.E.; Fleury, D. Genome-wide association mapping of grain yield in a diverse collection of spring wheat (Triticum aestivum L.) evaluated in southern Australia. PLoS ONE 2019, 14, e0211730. [Google Scholar] [CrossRef] [PubMed] [Green Version]
  36. Zhu, Y.; Wang, S.; Wei, W.; Xie, H.; Liu, K.; Zhang, C.; Wu, Z.; Jiang, H.; Cao, J.; Zhao, L. Genome-wide association study of pre-harvest sprouting tolerance using a 90K SNP array in common wheat (Triticum aestivum L.). Theor. Appl. Genet. 2019, 132, 2947–2963. [Google Scholar] [CrossRef]
  37. Mangini, G.; Gadaleta, A.; Colasuonno, P.; Marcotuli, I.; Signorile, A.M.; Simeone, R.; De Vita, P.; Mastrangelo, A.M.; Laidò, G.; Pecchioni, N. Genetic dissection of the relationships between grain yield components by genome-wide association mapping in a collection of tetraploid wheats. PLoS ONE 2018, 13, e0190162. [Google Scholar] [CrossRef]
  38. Gahlaut, V.; Jaiswal, V.; Singh, S.; Balyan, H.; Gupta, P. Multi-Locus Genome Wide Association Mapping for Yield and its contributing traits in Hexaploid Wheat under Different Water Regimes. Sci. Rep. 2019, 9, 1–15. [Google Scholar]
  39. Pradhan, S.; Babar, M.A.; Robbins, K.; Bai, G.; Mason, R.E.; Khan, J.; Shahi, D.; Avci, M.; Guo, J.; Hossain, M.M. Understanding the Genetic Basis of Spike Fertility to Improve Grain Number, Harvest Index, and Grain Yield in Wheat Under High Temperature Stress Environments. Front. Plant Sci. 2019, 10, 1481. [Google Scholar] [CrossRef] [PubMed] [Green Version]
  40. Ye, X.; Li, J.; Cheng, Y.; Yao, F.; Long, L.; Wang, Y.; Wu, Y.; Li, J.; Wang, J.; Jiang, Q. Genome-wide association study reveals new loci for yield-related traits in Sichuan wheat germplasm under stripe rust stress. BMC Genom. 2019, 20, 640. [Google Scholar] [CrossRef] [Green Version]
  41. Shi, W.; Hao, C.; Zhang, Y.; Cheng, J.; Zhang, Z.; Liu, J.; Yi, X.; Cheng, X.; Sun, D.; Xu, Y. A combined association mapping and linkage analysis of kernel number per spike in common wheat (Triticum aestivum L.). Front. Plant Sci. 2017, 8, 1412. [Google Scholar] [CrossRef] [Green Version]
  42. Yu, J.; Pressoir, G.; Briggs, W.H.; Bi, I.V.; Yamasaki, M.; Doebley, J.F.; McMullen, M.D.; Gaut, B.S.; Nielsen, D.M.; Holland, J.B. A unified mixed-model method for association mapping that accounts for multiple levels of relatedness. Nat. Genet. 2006, 38, 203–208. [Google Scholar] [CrossRef] [PubMed]
  43. Tamba, C.L.; Ni, Y.-L.; Zhang, Y.-M. Iterative sure independence screening EM-Bayesian LASSO algorithm for multi-locus genome-wide association studies. PLoS Comput. Biol. 2017, 13, e1005357. [Google Scholar] [CrossRef]
  44. Segura, V.; Vilhjálmsson, B.J.; Platt, A.; Korte, A.; Seren, Ü.; Long, Q.; Nordborg, M. An efficient multi-locus mixed-model approach for genome-wide association studies in structured populations. Nat. Genet. 2012, 44, 825. [Google Scholar] [CrossRef] [PubMed] [Green Version]
  45. Wang, S.-B.; Feng, J.-Y.; Ren, W.-L.; Huang, B.; Zhou, L.; Wen, Y.-J.; Zhang, J.; Dunwell, J.M.; Xu, S.; Zhang, Y.-M. Improving power and accuracy of genome-wide association studies via a multi-locus mixed linear model methodology. Sci. Rep. 2016, 6, 19444. [Google Scholar] [CrossRef] [Green Version]
  46. Wen, Y.-J.; Zhang, H.; Ni, Y.-L.; Huang, B.; Zhang, J.; Feng, J.-Y.; Wang, S.-B.; Dunwell, J.M.; Zhang, Y.-M.; Wu, R. Methodological implementation of mixed linear models in multi-locus genome-wide association studies. Brief. Bioinform. 2018, 19, 700–712. [Google Scholar] [CrossRef] [PubMed] [Green Version]
  47. Zhang, J.; Feng, J.; Ni, Y.; Wen, Y.; Niu, Y.; Tamba, C.; Yue, C.; Song, Q.; Zhang, Y. pLARmEB: Integration of least angle regression with empirical Bayes for multilocus genome-wide association studies. Heredity 2017, 118, 517–524. [Google Scholar] [CrossRef] [PubMed] [Green Version]
  48. Zhang, Y.-M.; Tamba, C.L. A fast mrMLM algorithm for multi-locus genome-wide association studies. bioRxiv 2018, 341784. [Google Scholar] [CrossRef]
  49. Evanno, G.; Regnaut, S.; Goudet, J. Detecting the number of clusters of individuals using the software STRUCTURE: A simulation study. Mol. Ecol. 2005, 14, 2611–2620. [Google Scholar] [CrossRef] [Green Version]
  50. Kumar, A.; Mantovani, E.E.; Simsek, S.; Jain, S.; Elias, E.M.; Mergoum, M. Genome wide genetic dissection of wheat quality and yield related traits and their relationship with grain shape and size traits in an elite× non-adapted bread wheat cross. PLoS ONE 2019, 14, e0221826. [Google Scholar] [CrossRef] [PubMed]
  51. Abdipour, M.; Ebrahimi, M.; Izadi-Darbandi, A.; Mastrangelo, A.M.; Najafian, G.; Arshad, Y.; Mirniyam, G. Association between grain size and shape and quality traits, and path analysis of thousand grain weight in Iranian bread wheat landraces from different geographic regions. Not. Bot. Horti. Agrobot. Cluj Napoca 2016, 44, 228–236. [Google Scholar] [CrossRef] [Green Version]
  52. Williams, K.; Munkvold, J.; Sorrells, M. Comparison of digital image analysis using elliptic Fourier descriptors and major dimensions to phenotype seed shape in hexaploid wheat (Triticum aestivum L.). Euphytica 2013, 190, 99–116. [Google Scholar] [CrossRef]
  53. Gegas, V.C.; Nazari, A.; Griffiths, S.; Simmonds, J.; Fish, L.; Orford, S.; Sayers, L.; Doonan, J.H.; Snape, J.W. A genetic framework for grain size and shape variation in wheat. Plant Cell 2010, 22, 1046–1056. [Google Scholar] [CrossRef] [PubMed] [Green Version]
  54. Breseghello, F.; Sorrells, M.E. QTL analysis of kernel size and shape in two hexaploid wheat mapping populations. Field Crops Res. 2007, 101, 172–179. [Google Scholar] [CrossRef]
  55. Xiao, Y.; He, S.; Yan, J.; Zhang, Y.; Zhang, Y.; Wu, Y.; Xia, X.; Tian, J.; Ji, W.; He, Z. Molecular mapping of quantitative trait loci for kernel morphology traits in a non-1BL. 1RS× 1BL. 1RS wheat cross. Crop Pasture Sci. 2011, 62, 625–638. [Google Scholar] [CrossRef] [Green Version]
  56. Rasheed, A.; Xia, X.; Ogbonnaya, F.; Mahmood, T.; Zhang, Z.; Mujeeb-Kazi, A.; He, Z. Genome-wide association for grain morphology in synthetic hexaploid wheats using digital imaging analysis. BMC Plant Biol. 2014, 14, 128. [Google Scholar] [CrossRef] [Green Version]
  57. Zhang, G.; Wang, Y.; Guo, Y.; Zhao, Y.; Kong, F.; Li, S. Characterization and mapping of QTLs on chromosome 2D for grain size and yield traits using a mutant line induced by EMS in wheat. Crop J. 2015, 3, 135–144. [Google Scholar] [CrossRef] [Green Version]
  58. Simmonds, J.; Scott, P.; Brinton, J.; Mestre, T.C.; Bush, M.; Del Blanco, A.; Dubcovsky, J.; Uauy, C. A splice acceptor site mutation in TaGW2-A1 increases thousand grain weight in tetraploid and hexaploid wheat through wider and longer grains. Theor. Appl. Genet. 2016, 129, 1099–1112. [Google Scholar] [CrossRef] [Green Version]
  59. Ramya, P.; Chaubal, A.; Kulkarni, K.; Gupta, L.; Kadoo, N.; Dhaliwal, H.; Chhuneja, P.; Lagu, M.; Gupt, V. QTL mapping of 1000-kernel weight, kernel length, and kernel width in bread wheat (Triticum aestivum L.). Appl. Genet. 2010, 51, 421–429. [Google Scholar] [CrossRef]
  60. Basile, S.M.L.; Ramírez, I.A.; Crescente, J.M.; Conde, M.B.; Demichelis, M.; Abbate, P.; Rogers, W.J.; Pontaroli, A.C.; Helguera, M.; Vanzetti, L.S. Haplotype block analysis of an Argentinean hexaploid wheat collection and GWAS for yield components and adaptation. BMC Plant Biol. 2019, 19, 553. [Google Scholar]
  61. Talini, R.F.; Brandolini, A.; Miculan, M.; Brunazzi, A.; Vaccino, P.; Pè, M.E.; Dell’Acqua, M. Genome wide association study of agronomic and quality traits in a world collection of the wild wheat relative Triticum urartu. Plant J. 2020, 102, 555–568. [Google Scholar] [CrossRef]
  62. Cheng, B.; Gao, X.; Cao, N.; Ding, Y.; Gao, Y.; Chen, T.; Xin, Z.; Zhang, L. Genome-wide association analysis of stripe rust resistance loci in wheat accessions from southwestern China. J. Appl. Genet. 2020, 1–14. [Google Scholar] [CrossRef] [PubMed] [Green Version]
  63. Chen, J.; Hu, X.; Shi, T.; Yin, H.; Sun, D.; Yuanfeng, H.; Xia, X.; Luo, J.; Fernie, A.R.; He, Z. Metabolite-based genome-wide association study enables dissection of the flavonoid decoration pathway of wheat kernels. Plant Biotechnol. J. 2020, 10, 1111. [Google Scholar] [CrossRef]
  64. Ain, Q.-u.; Rasheed, A.; Anwar, A.; Mahmood, T.; Imtiaz, M.; He, Z.; Xia, X.; Quraishi, U.M. Genome-wide association for grain yield under rainfed conditions in historical wheat cultivars from Pakistan. Front. Plant Sci. 2015, 6, 743. [Google Scholar] [CrossRef] [PubMed] [Green Version]
  65. Guo, Z.; Chen, D.; Alqudah, A.M.; Röder, M.S.; Ganal, M.W.; Schnurbusch, T. Genome-wide association analyses of 54 traits identified multiple loci for the determination of floret fertility in wheat. New Phytol. 2017, 214, 257–270. [Google Scholar] [CrossRef] [PubMed]
  66. Kang, Y.; Barry, K.; Cao, F.; Zhou, M. Genome-wide association mapping for adult resistance to powdery mildew in common wheat. Mol. Biol. Rep. 2019, 1, 16. [Google Scholar] [CrossRef]
  67. Muqaddasi, Q.H.; Zhao, Y.; Rodemann, B.; Plieske, J.; Ganal, M.W.; Röder, M.S. Genome-wide association mapping and prediction of adult stage Septoria tritici blotch infection in European winter wheat via high-density marker arrays. Plant Genome 2019, 12. [Google Scholar] [CrossRef] [PubMed] [Green Version]
  68. Yuan, F.-P.; Zeng, Q.-D.; Wu, J.-H.; Wang, Q.-L.; Yang, Z.-J.; Liang, B.-P.; Kang, Z.-S.; Chen, X.-H.; Han, D.-J. QTL mapping and validation of adult plant resistance to stripe rust in Chinese wheat landrace Humai 15. Front. Plant Sci. 2018, 9, 968. [Google Scholar] [CrossRef]
  69. Zhao, M.; Wang, G.; Leng, Y.; Wanjugi, H.; Xi, P.; Grosz, M.D.; Mergoum, M.; Zhong, S. Molecular mapping of Fusarium head blight resistance in the spring wheat line ND2710. Phytopathology 2018, 108, 972–979. [Google Scholar] [CrossRef] [Green Version]
  70. Liu, S.; Assanga, S.O.; Dhakal, S.; Gu, X.; Tan, C.-T.; Yang, Y.; Rudd, J.; Hays, D.; Ibrahim, A.; Xue, Q. Validation of chromosomal locations of 90K array single nucleotide polymorphisms in US wheat. Crop Sci. 2016, 56, 364–373. [Google Scholar] [CrossRef] [Green Version]
  71. Avni, R.; Nave, M.; Eilam, T.; Sela, H.; Alekperov, C.; Peleg, Z.; Dvorak, J.; Korol, A.; Distelfeld, A. Ultra-dense genetic map of durum wheat× wild emmer wheat developed using the 90K iSelect SNP genotyping assay. Mol. Breed. 2014, 34, 1549–1562. [Google Scholar] [CrossRef]
  72. Sheoran, S.; Jaiswal, S.; Kumar, D.; Raghav, N.; Sharma, R.; Pawar, S.; Paul, S.; Iquebal, M.A.; RAI, A.; Kumar, D. Uncovering genomic regions associated with 36 agro-morphological traits in Indian spring wheat using GWAS. Front. Plant Sci. 2019, 10, 527. [Google Scholar] [CrossRef] [PubMed]
  73. Zhang, K.; Liu, S.; Li, W.; Liu, S.; Li, X.; Fang, Y.; Zhang, J.; Wang, Y.; Xu, S.; Zhang, J. Identification of QTNs controlling seed protein content in soybean using multi-locus genome-wide association studies. Front. Plant Sci. 2018, 9, 1690. [Google Scholar] [CrossRef] [PubMed]
  74. Su, J.; Ma, Q.; Li, M.; Hao, F.; Wang, C. Multi-locus genome-wide association studies of fiber-quality related traits in Chinese early-maturity upland cotton. Front. Plant Sci. 2018, 9, 1169. [Google Scholar] [CrossRef] [Green Version]
  75. Arora, S.; Singh, N.; Kaur, S.; Bains, N.S.; Uauy, C.; Poland, J.; Chhuneja, P. Genome-wide association study of grain architecture in wild wheat Aegilops tauschii. Front. Plant Sci. 2017, 8, 886. [Google Scholar] [CrossRef] [PubMed] [Green Version]
  76. Jamil, M.; Ali, A.; Gul, A.; Ghafoor, A.; Napar, A.A.; Ibrahim, A.M.; Naveed, N.H.; Yasin, N.A.; Mujeeb-Kazi, A. Genome-wide association studies of seven agronomic traits under two sowing conditions in bread wheat. BMC Plant Biol. 2019, 19, 149. [Google Scholar] [CrossRef] [PubMed] [Green Version]
  77. Wang, S.-X.; Zhu, Y.-L.; Zhang, D.-X.; Shao, H.; Liu, P.; Hu, J.-B.; Zhang, H.; Zhang, H.-P.; Chang, C.; Lu, J. Genome-wide association study for grain yield and related traits in elite wheat varieties and advanced lines using SNP markers. PLoS ONE 2017, 12, e0188662. [Google Scholar] [CrossRef] [PubMed] [Green Version]
  78. Liu, J.; Xu, Z.; Fan, X.; Zhou, Q.; Cao, J.; Wang, F.; Ji, G.; Yang, L.; Feng, B.; Wang, T. A genome-wide association study of wheat spike related traits in China. Front. Plant Sci. 2018, 9, 1584. [Google Scholar] [CrossRef]
  79. Hou, J.; Jiang, Q.; Hao, C.; Wang, Y.; Zhang, H.; Zhang, X. Global selection on sucrose synthase haplotypes during a century of wheat breeding. Plant Physiol. 2014, 164, 1918–1929. [Google Scholar] [CrossRef] [Green Version]
  80. Ma, M.; Wang, Q.; Li, Z.; Cheng, H.; Li, Z.; Liu, X.; Song, W.; Appels, R.; Zhao, H. Expression of Ta CYP 78A3, a gene encoding cytochrome P450 CYP 78A3 protein in wheat (Triticum aestivum L.), affects seed size. Plant J. 2015, 83, 312–325. [Google Scholar] [CrossRef]
  81. Gao, F.; Wen, W.; Liu, J.; Rasheed, A.; Yin, G.; Xia, X.; Wu, X.; He, Z. Genome-wide linkage mapping of QTL for yield components, plant height and yield-related physiological traits in the Chinese wheat cross Zhou 8425B/Chinese Spring. Front. Plant Sci. 2015, 6, 1099. [Google Scholar] [CrossRef] [Green Version]
  82. Gao, L.; Zhao, G.; Huang, D.; Jia, J. Candidate loci involved in domestication and improvement detected by a published 90K wheat SNP array. Sci. Rep. 2017, 7, 1–13. [Google Scholar]
  83. Yang, R.-C.; Peng, F.Y.; Hu, Z. Inferring defense-related gene families in Arabidopsis and wheat. BMC Genom. 2017, 18, 980. [Google Scholar] [CrossRef] [Green Version]
  84. Zanke, C.D.; Ling, J.; Plieske, J.; Kollers, S.; Ebmeyer, E.; Korzun, V.; Argillier, O.; Stiewe, G.; Hinze, M.; Neumann, F. Analysis of main effect QTL for thousand grain weight in European winter wheat (Triticum aestivum L.) by genome-wide association mapping. Front. Plant Sci. 2015, 6, 644. [Google Scholar] [CrossRef] [PubMed] [Green Version]
  85. Yan, X.; Zhao, L.; Ren, Y.; Dong, Z.; Cui, D.; Chen, F. Genome-wide association study revealed that the TaGW8 gene was associated with kernel size in Chinese bread wheat. Sci. Rep. 2019, 9, 1–10. [Google Scholar]
  86. Consortium, I.W.G.S. Shifting the limits in wheat research and breeding using a fully annotated reference genome. Science 2018, 361, eaar7191. [Google Scholar]
  87. Bluhm, B.; Zhao, X.; Flaherty, J.; Xu, J.-R.; Dunkle, L. RAS2 regulates growth and pathogenesis in Fusarium graminearum. Mol. Plant Microbe Interact. 2007, 20, 627–636. [Google Scholar] [CrossRef] [Green Version]
  88. Ramsdale, M. Programmed cell death in pathogenic fungi. BBA-Mol. Cell Res. 2008, 1783, 1369–1380. [Google Scholar] [CrossRef] [Green Version]
  89. Backer, R.; Naidoo, S.; van den Berg, N. The nonexpressor of pathogenesis-related genes 1 (NPR1) and related Family: Mechanistic insights in plant disease resistance. Front. Plant Sci. 2019, 10, 102. [Google Scholar] [CrossRef] [PubMed] [Green Version]
  90. Diethelm, M.; Schmolke, M.; Groth, J.; Friedt, W.; Schweizer, G.; Hartl, L. Association of allelic variation in two NPR1-like genes with Fusarium head blight resistance in wheat. Mol. Breed. 2014, 34, 31–43. [Google Scholar] [CrossRef]
  91. Walter, S.; Brennan, J.M.; Arunachalam, C.; Ansari, K.I.; Hu, X.; Khan, M.R.; Trognitz, F.; Trognitz, B.; Leonard, G.; Egan, D. Components of the gene network associated with genotype-dependent response of wheat to the Fusarium mycotoxin deoxynivalenol. Func. Integr. Genom. 2008, 8, 421–427. [Google Scholar] [CrossRef] [PubMed]
  92. Walter, S.; Doohan, F. Transcript profiling of the phytotoxic response of wheat to the Fusarium mycotoxin deoxynivalenol. Mycotoxin Res. 2011, 27, 221–230. [Google Scholar] [CrossRef] [PubMed]
  93. Kumar, P.; Kesari, P.; Dhindwal, S.; Choudhary, A.K.; Katiki, M.; Verma, A.; Ambatipudi, K.; Tomar, S.; Sharma, A.K.; Mishra, G. A novel function for globulin in sequestering plant hormone: Crystal structure of Wrightia tinctoria 11S globulin in complex with auxin. Sci. Rep. 2017, 7, 1–11. [Google Scholar] [CrossRef] [PubMed] [Green Version]
  94. Tanabata, T.; Shibaya, T.; Hori, K.; Ebana, K.; Yano, M. SmartGrain: High-throughput phenotyping software for measuring seed shape through image analysis. Plant Physiol. 2012, 160, 1871–1880. [Google Scholar] [CrossRef] [Green Version]
  95. Okamoto, Y.; Nguyen, A.T.; Yoshioka, M.; Iehisa, J.C.; Takumi, S. Identification of quantitative trait loci controlling grain size and shape in the D genome of synthetic hexaploid wheat lines. Breed. Sci. 2013, 63, 423–429. [Google Scholar] [CrossRef] [Green Version]
  96. Purcell, S.; Neale, B.; Todd-Brown, K.; Thomas, L.; Ferreira, M.A.; Bender, D.; Maller, J.; Sklar, P.; De Bakker, P.I.; Daly, M.J. PLINK: A tool set for whole-genome association and population-based linkage analyses. Am. J. Hum. Genet. 2007, 81, 559–575. [Google Scholar] [CrossRef] [PubMed] [Green Version]
  97. R Core Team. R: A Language and Environment for Statistical Computing; R Foundation for Statistical Computing: Vienna, Austria, 2019. [Google Scholar]
  98. Pritchard, J.K.; Stephens, M.; Donnelly, P. Inference of population structure using multilocus genotype data. Genetics 2000, 155, 945–959. [Google Scholar]
  99. Earl, D.A. STRUCTURE HARVESTER: A website and program for visualizing STRUCTURE output and implementing the Evanno method. Conserv. Genet. Resour. 2012, 4, 359–361. [Google Scholar] [CrossRef]
  100. Lipka, A.E.; Tian, F.; Wang, Q.; Peiffer, J.; Li, M.; Bradbury, P.J.; Gore, M.A.; Buckler, E.S.; Zhang, Z. GAPIT: Genome association and prediction integrated tool. Bioinformatics 2012, 28, 2397–2399. [Google Scholar] [CrossRef] [Green Version]
  101. Ma, L.; Liu, M.; Yan, Y.; Qing, C.; Zhang, X.; Zhang, Y.; Long, Y.; Wang, L.; Pan, L.; Zou, C. Genetic dissection of maize embryonic callus regenerative capacity using multi-locus genome-wide association studies. Front. Plant Sci. 2018, 9, 561. [Google Scholar] [CrossRef] [Green Version]
  102. Ren, W.-L.; Wen, Y.-J.; Dunwell, J.M.; Zhang, Y.-M. pKWmEB: Integration of Kruskal–Wallis test with empirical Bayes under polygenic background control for multi-locus genome-wide association study. Heredity 2018, 120, 208–218. [Google Scholar] [CrossRef]
  103. Li, H.; Peng, Z.; Yang, X.; Wang, W.; Fu, J.; Wang, J.; Han, Y.; Chai, Y.; Guo, T.; Yang, N. Genome-wide association study dissects the genetic architecture of oil biosynthesis in maize kernels. Nat. Genet. 2013, 45, 43. [Google Scholar] [CrossRef]
  104. Barrett, J.C.; Fry, B.; Maller, J.; Daly, M.J. Haploview: Analysis and visualization of LD and haplotype maps. Bioinformatics 2004, 21, 263–265. [Google Scholar] [CrossRef] [Green Version]
  105. Thrash, A.; Tang, J.D.; DeOrnellis, M.; Peterson, D.G.; Warburton, M.L. PAST: The pathway association studies tool to infer biological meaning from GWAS datasets. Plants 2020, 9, 58. [Google Scholar] [CrossRef] [Green Version]
Figure 1. Frequency distribution of the kernel traits: (a) the kernel length, (b) kernel width, (c) kernels per spike, and (d) the thousand kernel weight in 2017 and 2018.
Ijms 21 05649 g001
Figure 2. Correlation between the kernel traits, including KL (kernel length), KW (kernel width), KPS (kernels per spike), and TKW (thousand kernel weight) for 2017 and 2018. Significant correlations are shown with asterisk (*). * and **, significant at p < 0.05 and p < 0.01, respectively.
Ijms 21 05649 g002
Figure 3. Significant single nucleotide polymorphisms (SNPs) detected by different multi-locus genome-wide association study (ML-GWAS) and single-locus GWAS (SL-GWAS) methods for the Kernel traits of the Kernel length, Kernel width, Kernels per spike, and thousand kernel weight: (a) Number of detected SNPs through ML-GWAS and SL-GWAS methods; (b) number of significant SNPs detected by ML-GWAS methods including mrMLM, FASTmrMLM, FASTmrEMMA, and pLARmEB; and (c) significant SNPs detected by SL-GWAS methods including FarmCPU, MLM, and MLMM.
Ijms 21 05649 g003
Figure 4. Significant SNPs detected by ML-GWAS vs. SL-GWAS methods: (a) the total number of significant SNPs detected by four ML-GWAs methods (mrMLM, FASTmrMLM, FASTmrEMMA, and pLARmEB); and (b) the total number of significant SNPs detected by three SL-GWAS methods (FarmCPU, MLM, and MLMM).
Ijms 21 05649 g004
Figure 5. Manhattan and quantile–quantile (Q–Q) plots for the kernel traits across two environments (2017–2018): (a) Manhattan and Q–Q plots for kernel length; (b) Manhattan and Q–Q plots for kernel width; (c) Manhattan and Q–Q plots for kernels per spike; and (d) Manhattan and Q–Q plots for thousand kernel weight. Note: Number of detected SNPs by four multi-locus GWAS methods. For brevity, we present here the Manhattan and Q–Q plots of mrMLM model. The rest of the Manhattan and Q–Q plots are given in Supplementary Figure S3.
Ijms 21 05649 g005aIjms 21 05649 g005b
Figure 6. Functional classification of putative candidate genes controlling the kernel width and the thousand kernel weight. The number of SNPs (for either single or multiple traits) located within the genes that have the same gene annotations is shown. KW, kernel width; TKW, thousand kernel weight.
Ijms 21 05649 g006
Table 1. Common SNPs identified by different multi-locus models for kernel traits (kernel length kernel width, kernels per spike, and thousand kernel weight).
TraitMethods (1–4)SNPsChrPosition (bp)LOD > 3r2 (%)Repeated in Years
KL1,2,3RAC875_29540_3911A2644.44–6.423.41–4.842018
2,3BS00089524_511B6373.07–5.994.64–6.572018
1,2,4Kukri_07961_5036D3,491,8856.14–7.503.63–7.652017, 2018
1,2Kukri_c8827_2177A3,732,5753.56–3.742.70–4.402017
1,4Tdurum_contig102328_1297B4,030,9373.94–6.585.36–10.512017
1,3Kukri_c64387_2187B4,049,3593.22–4.072.58–4.842018
1,2Tdurum_contig15734_2217B4,127,6233.60–4.592.64–4.332018
1Ku_008899_903D1,664,6043.64–3.865.22–5.402017, 2018
KW1,2RAC875_0643_15482A105,0903.10–3.311.10–3.992017
2,3,4tplb0034e07_15812A79,5883.86–4.291.28–1.942018
1,2Kukri_c48194_6414A1,892,0653.35–6.324.59–6.972017
1,4Ra_02239_5046A2,962,5483.95–4.591.88–4.772018
2,3Tdurum_contig15734_2217B4,127,6233.40–4.332.92–3.652017
2,3D_contig07330_3307D4,292,7473.01–6.282.50–6.002017
1BS00021738_514A1,804,5014.98–7.3014.34–16.132017, 2018
KPS2,3,4BS00074341_511A1094.18–6.182.90–3.962018
1,4Tdurum_contig54559_2114B2,056,7913.27–4.032.16–4.472017
2,4Kukri_08268_795A2,172,1003.26–3.512.39–3.872018
2,3GENE_3726_786B3,355,2333.28–3.682.32–2.402018
1,2,3,4BobWhite_049_30647A3,802,4573.26–9.022.83–8.152018
2,4wsnp_Ku_rep_004159_907044697A3,806,9415.07–5.363.41–4.072018
TKW2,4wsnp_Ex_c33778_422102834A1,954,1255.99–7.901.21–6.842017
1,4RAC875_rep_c83934_917A3,886,3333.76–10.772.27–5.152017
2,4wsnp_Ku_0552_30602977A3,779,7273.83–4.822.24–3.502018
1,2Kukri_rep_c97425_1647A3,791,9383.19–3.341.86–3.342018
2,4D_contig07330_3307D4,292,7473.43–3.540.49–3.102017
Methods (1–4): the corresponding multi-locus GWAS methods (mrMLM, FASTmrMLM, FASTmrEMMA, and pLARmEB, respectively). r2 (%) represents the proportion of the total phenotypic variation explained by each SNP. KL (kernel length); KW (kernel width); KPS (kernels per spike); TKW (thousand kernel weight).
Table 2. Common SNPs simultaneously co-detected by multi-locus and single-locus GWAS methods for the kernel length, kernel width, kernels per spike, and the thousand kernel weight.
TraitMethodsSNPChrPosition (bp)Repeated in Years
KLpLARmEB, MLMMKukri_07961_5036D3,491,8852017, 2018
KLmrMLM, FarmCPUKukri_c8827_2177A3,732,5752017
KLpLARmEB, FarmCPUTdurum_contig102328_1297B4,030,9372017
KWmrMLM, MLMMBS00021738_514A1,804,5012017, 2018
KWFASTmrMLM, FarmCPUTdurum_contig15734_2217B4,127,6232017
KPSmrMLM, MLMMwsnp_Ra_rep_007017_906676184A1,774,5262017
KPSmrMLM, FarmCPUBobWhite_049_30647A3,802,4572018
TKWFASTmrEMMA, FarmCPUBobWhite_09733_3011B8682017
TKWmrMLM, MLMMBS00110286_513D1,727,4872017
TKWmrMLM, MLMMEx_07338_4014A1,800,8472017, 2018
TKWmrMLM, MLMKukri_rep_c97425_1647A3,791,9382018
TKWpLARmEB, MLMRAC875_rep_c83934_917A3,886,3332017
TKWFASTmrEMMA, MLMwsnp_Ex_c4068_73518064A1,803,1312017, 2018
KL (kernel length); KW (kernel width); KPS (kernels per spike); TKW (thousand kernel weight).

