Genome-Wide Identification of CsATGs in Tea Plant and the Involvement of CsATG8e in Nitrogen Utilization

 , and
, and 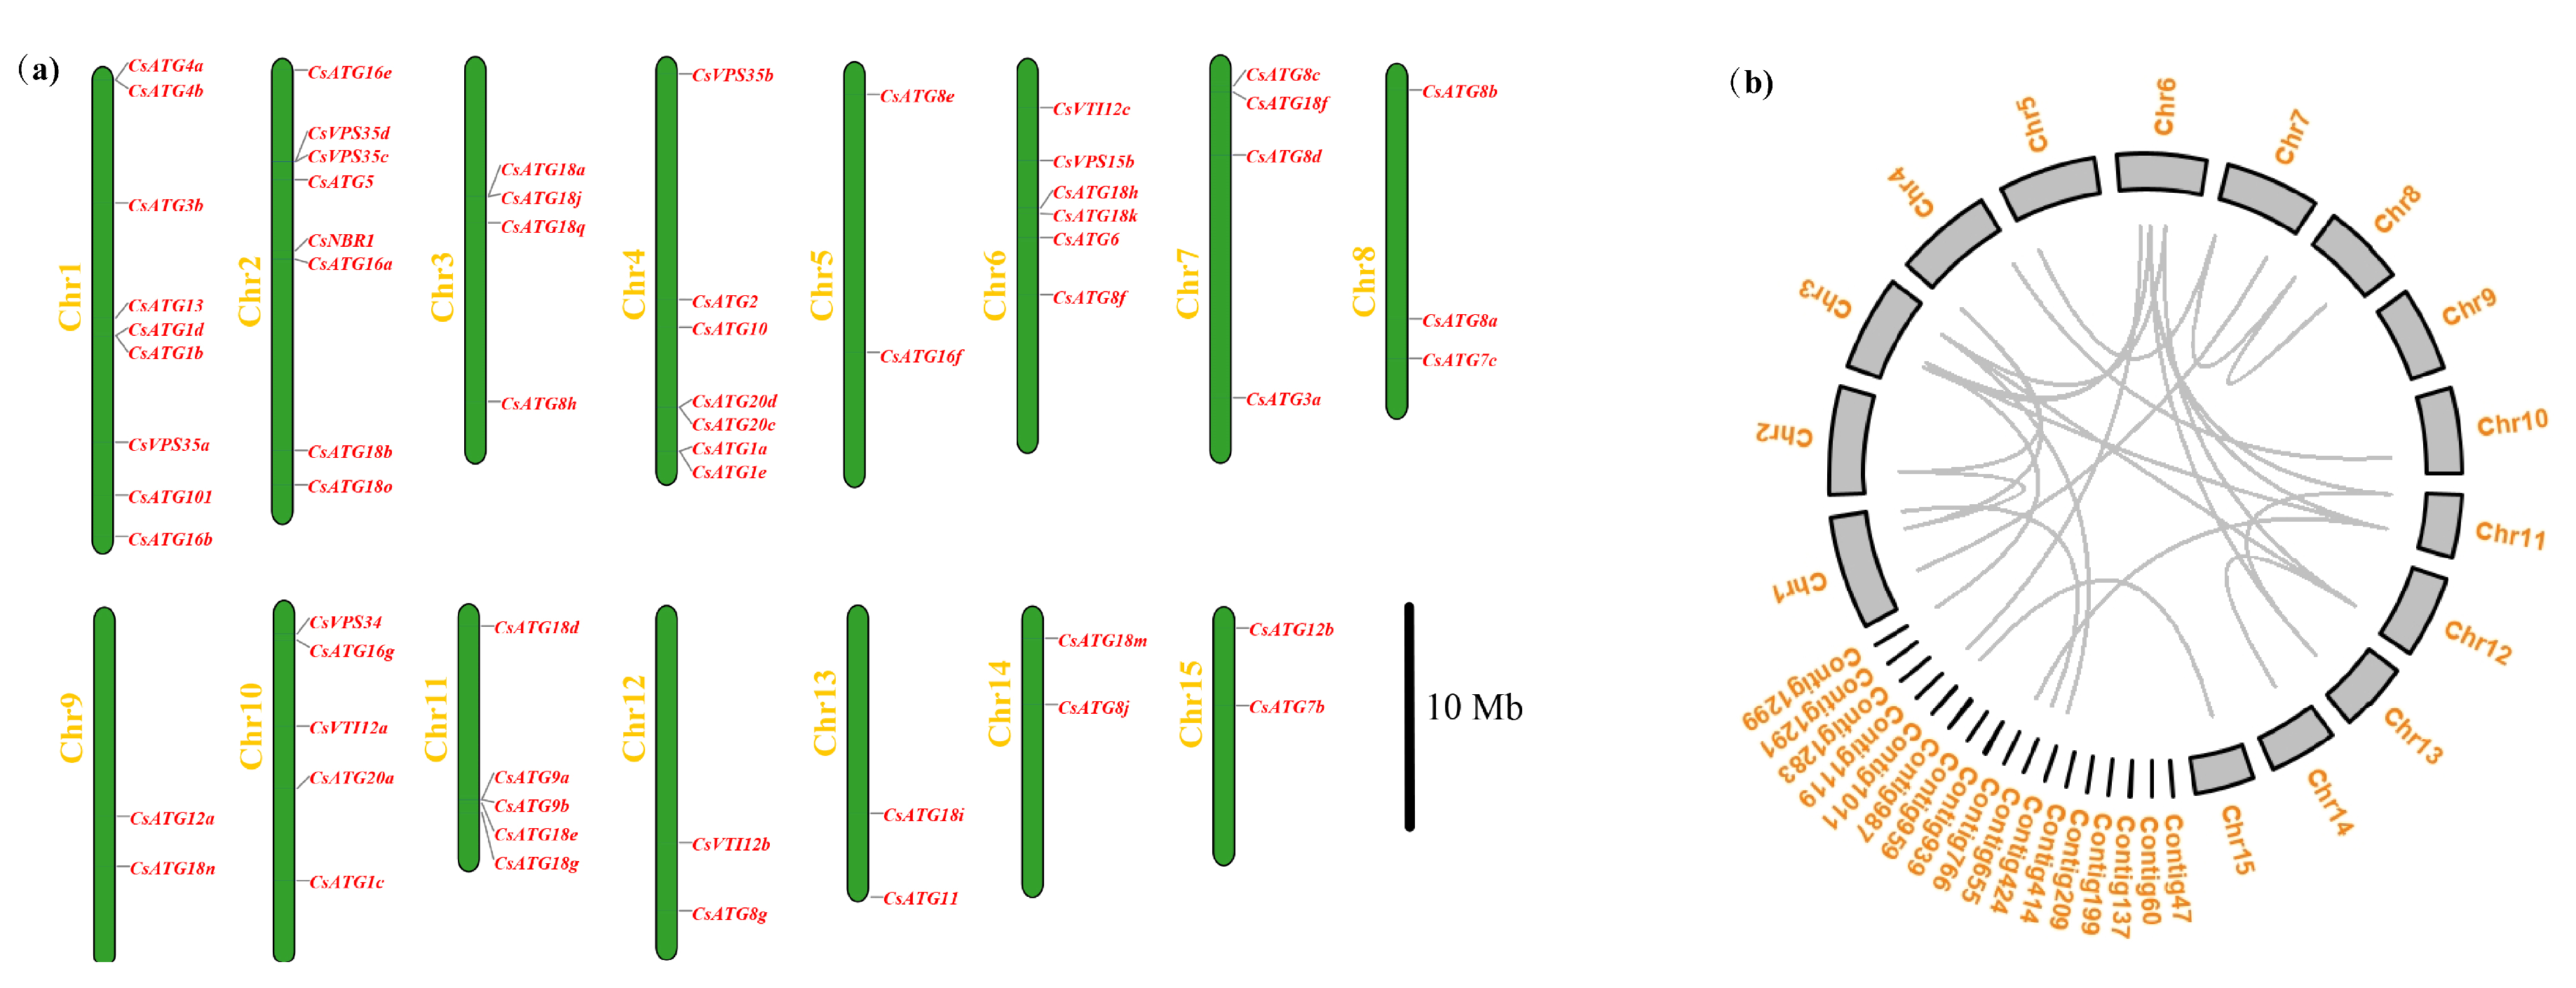
Abstract
:1. Introduction
2. Results
2.1. Genome-Wide Identification of CsATGs in Tea Plant
2.2. Bioinformatic Characterization of the 80 CsATGs
2.2.1. Chromosomal Distribution of CsATGs
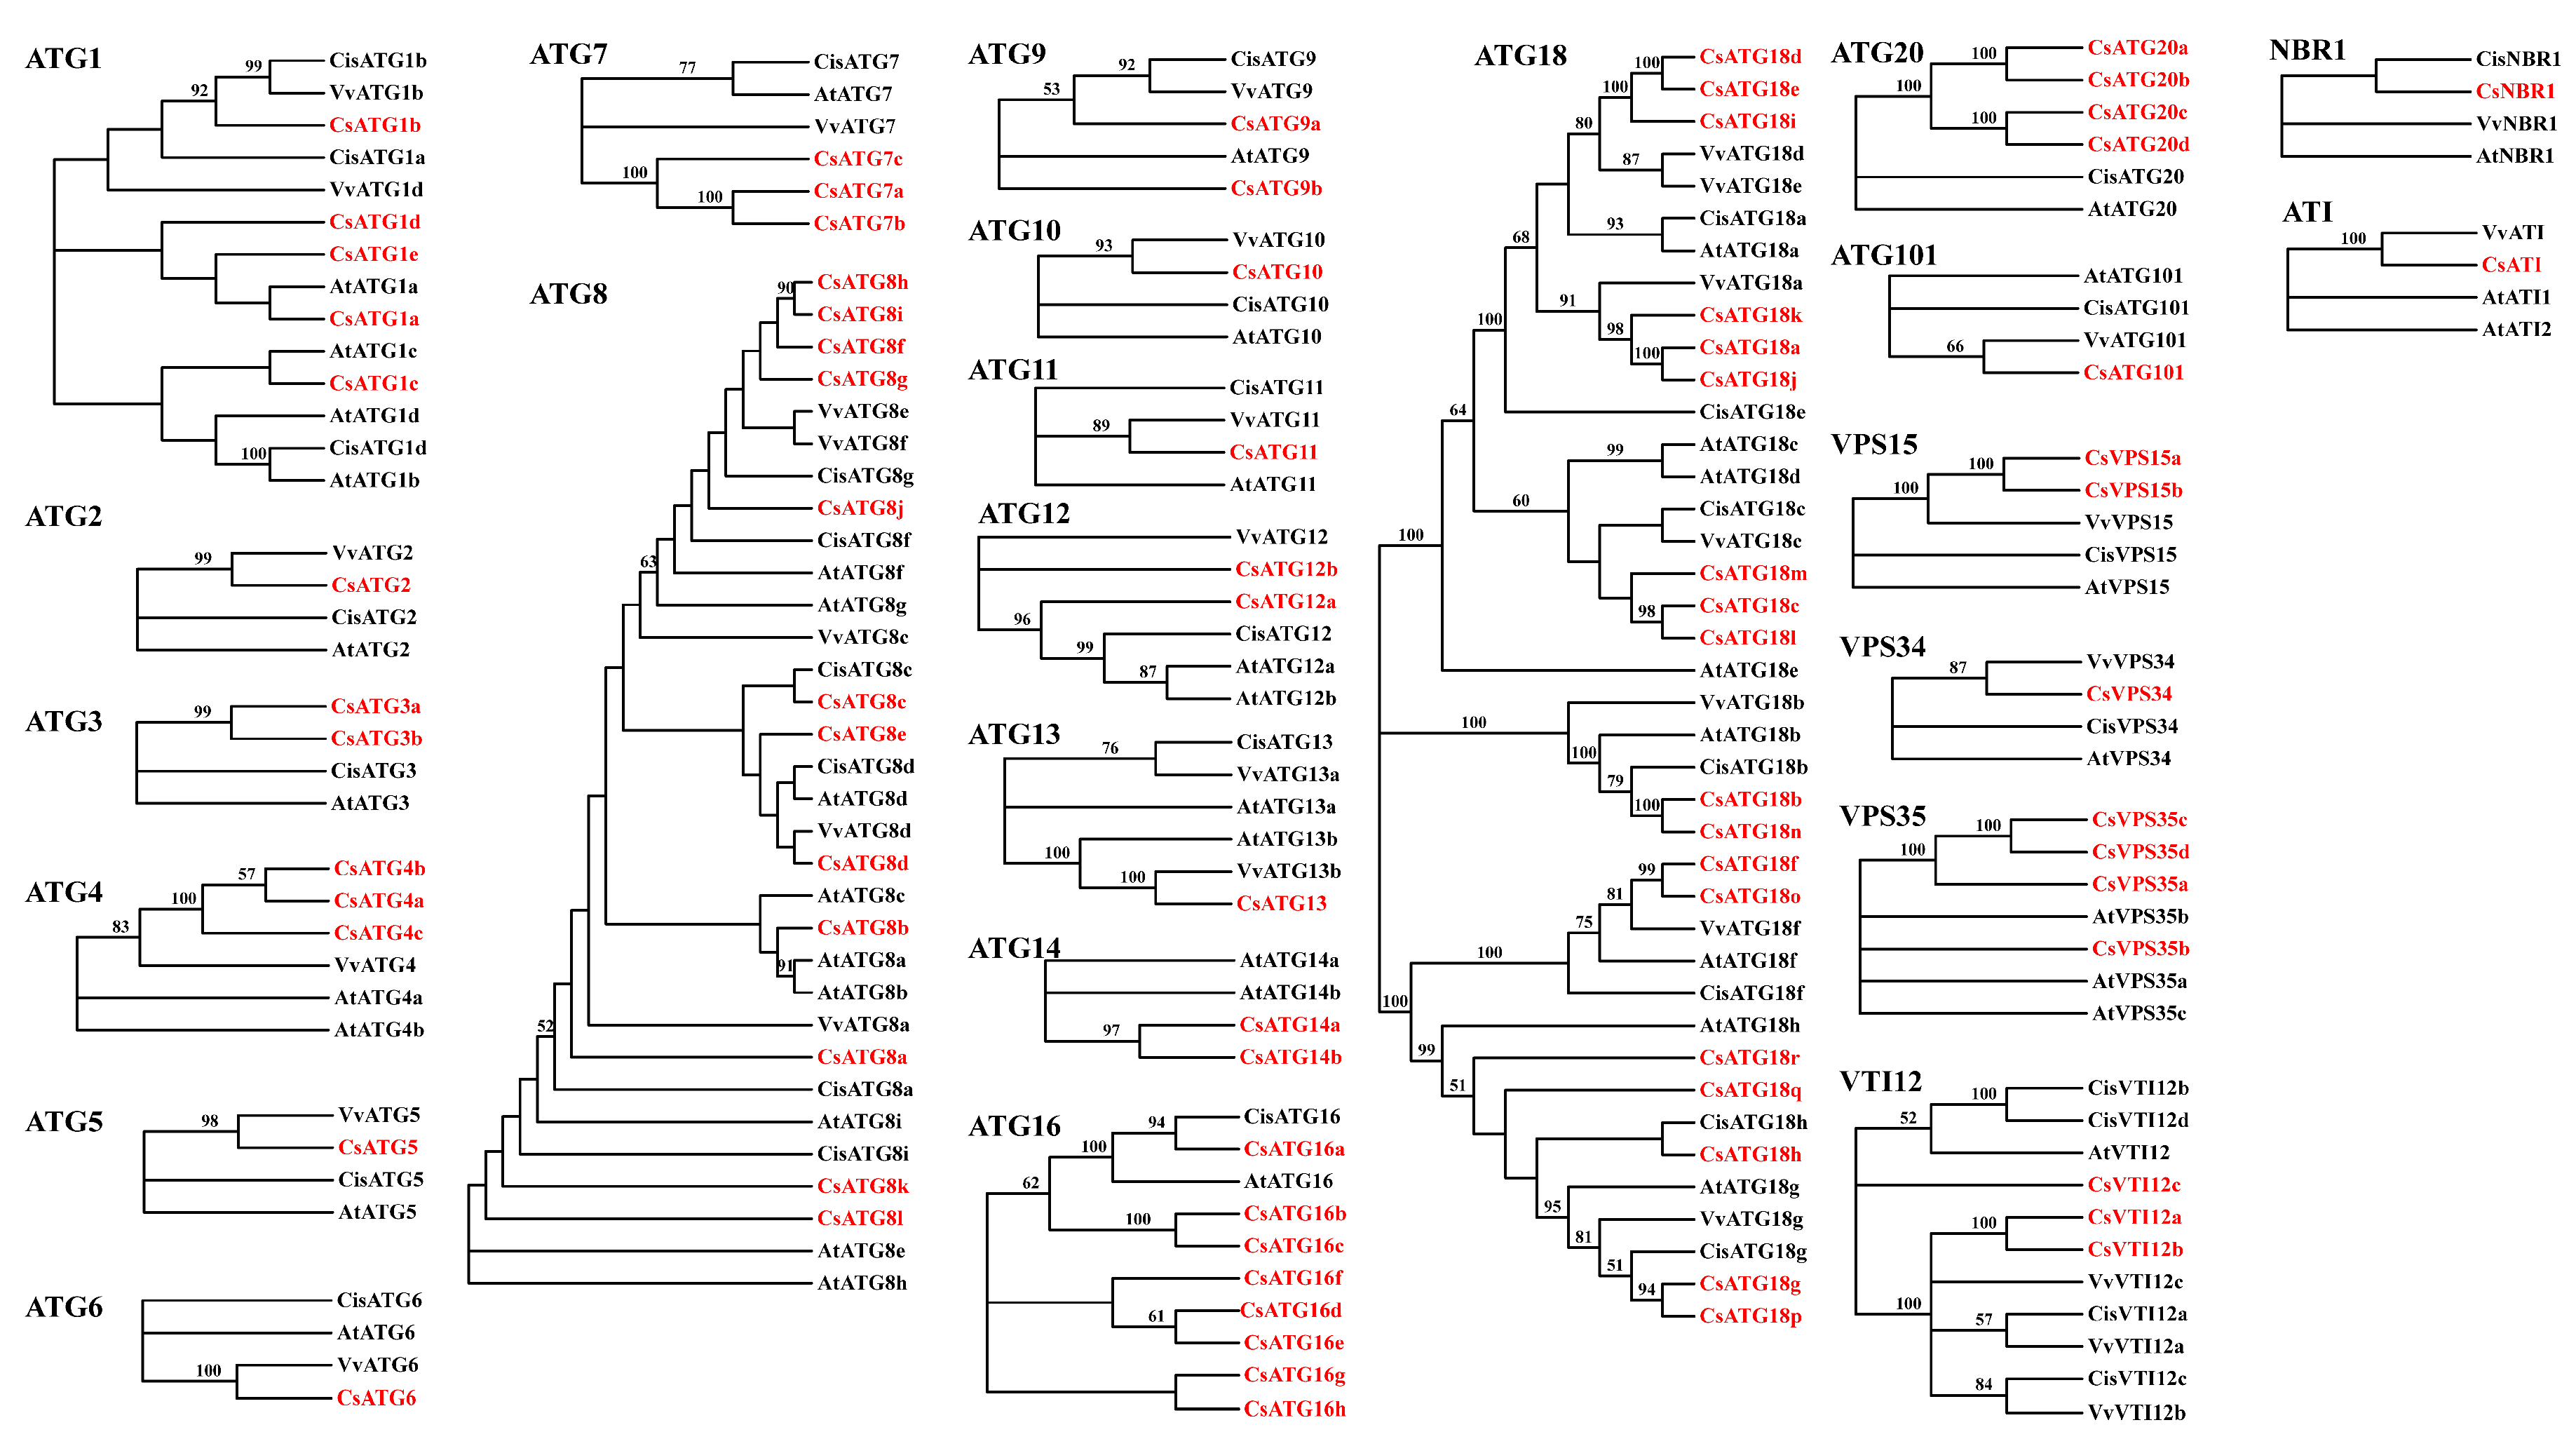
2.2.2. Phylogenetic Analysis
2.2.3. Gene Structures and Conserved Domains
2.3. Expression Profiles of CsATGs in Camellia sinensis
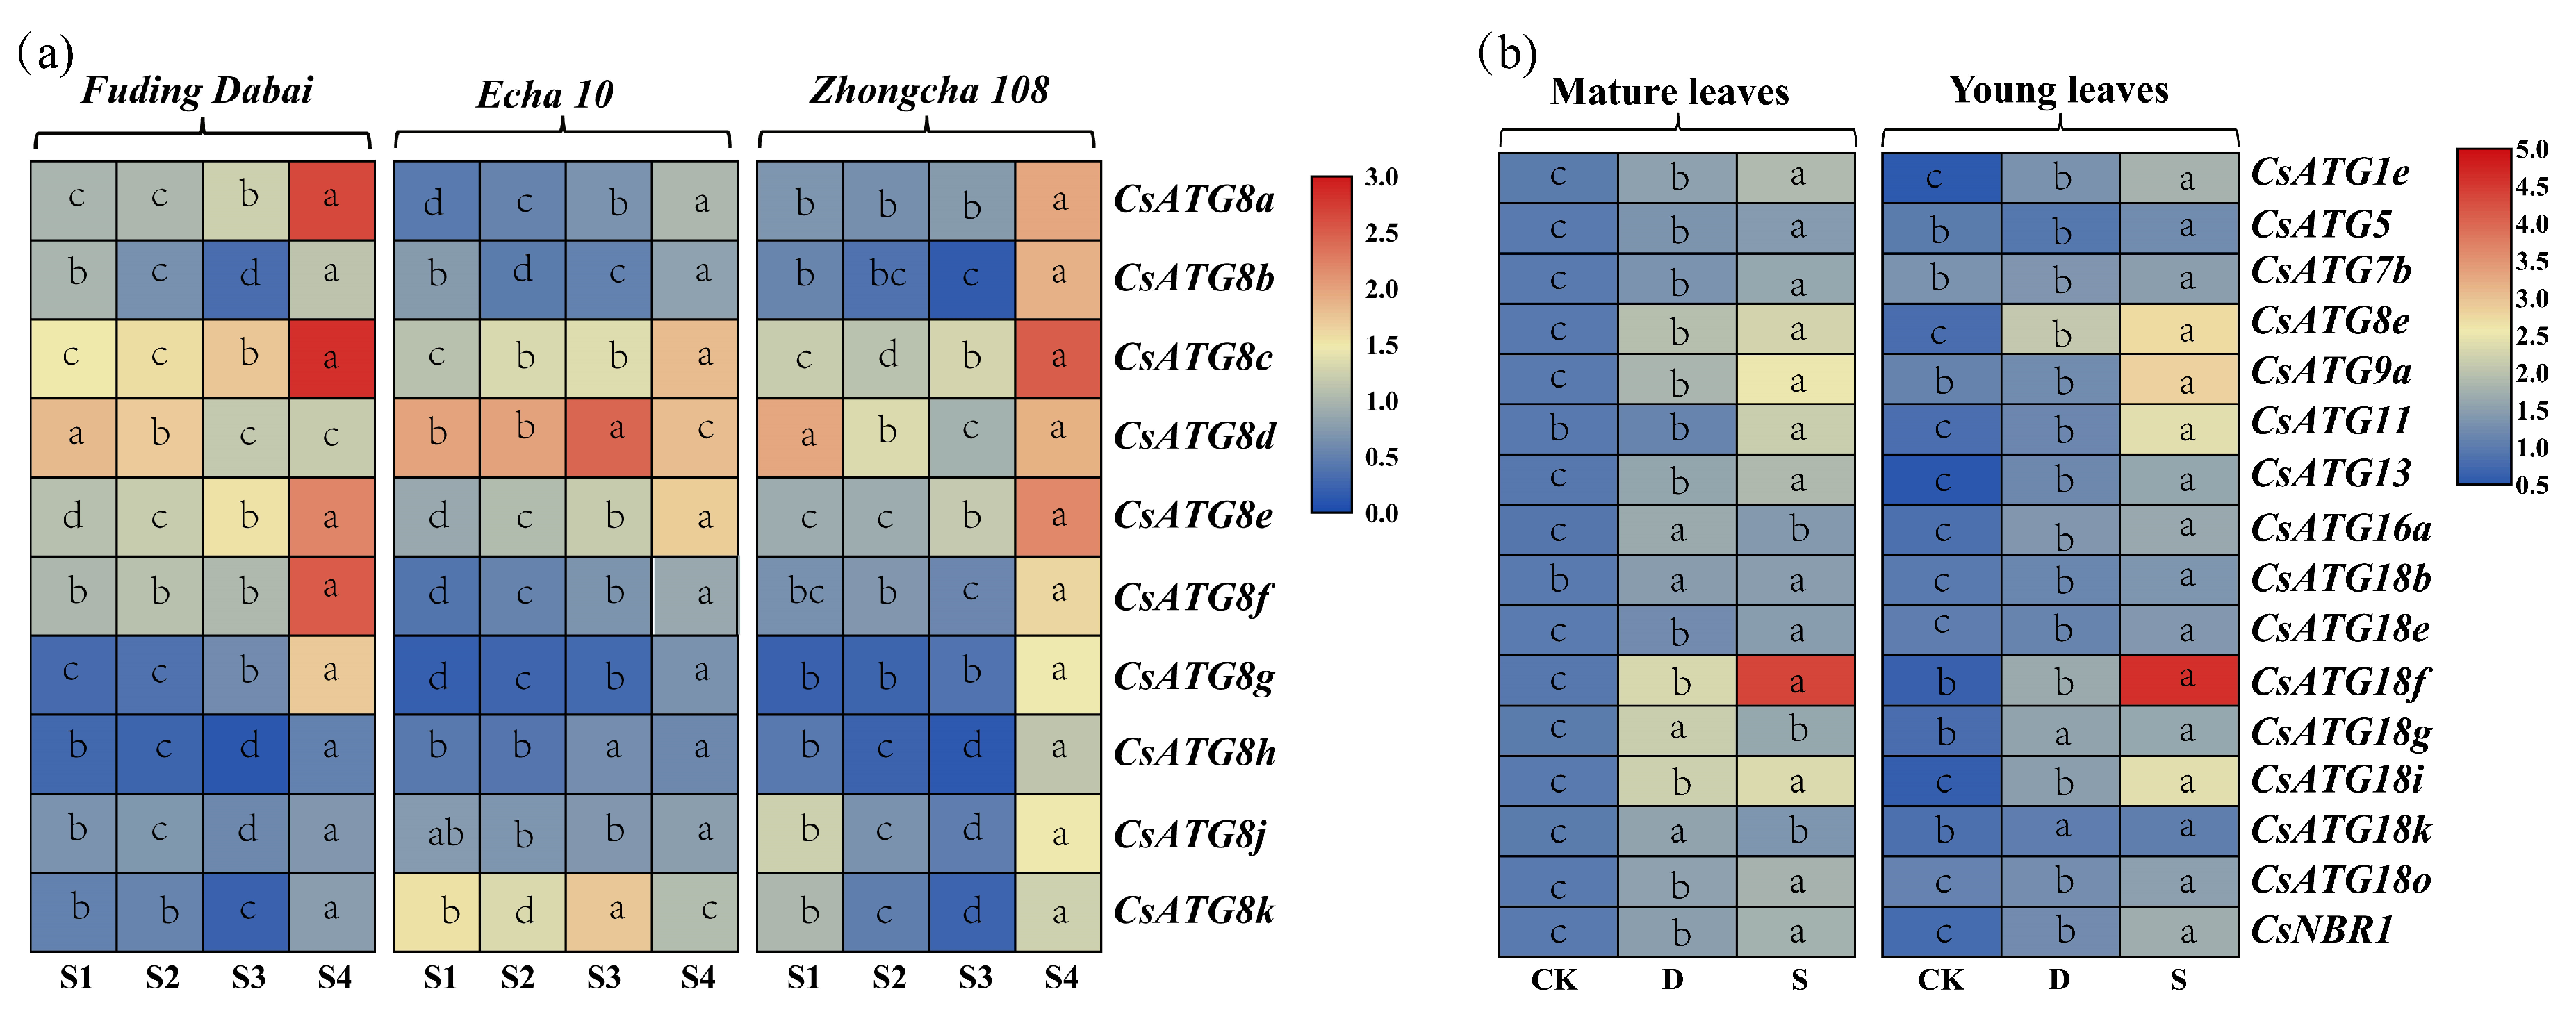
2.3.1. Expression Patterns for CsATG8s in Tea Cultivars
2.3.2. Expression Patterns for CsATGs in Response to N
2.4. Cloning and Functional Characterization of CsATG8e
2.4.1. Cloning of CsATG8e and Comparison with ATG8s in Camellia sinensis and Arabidopsis
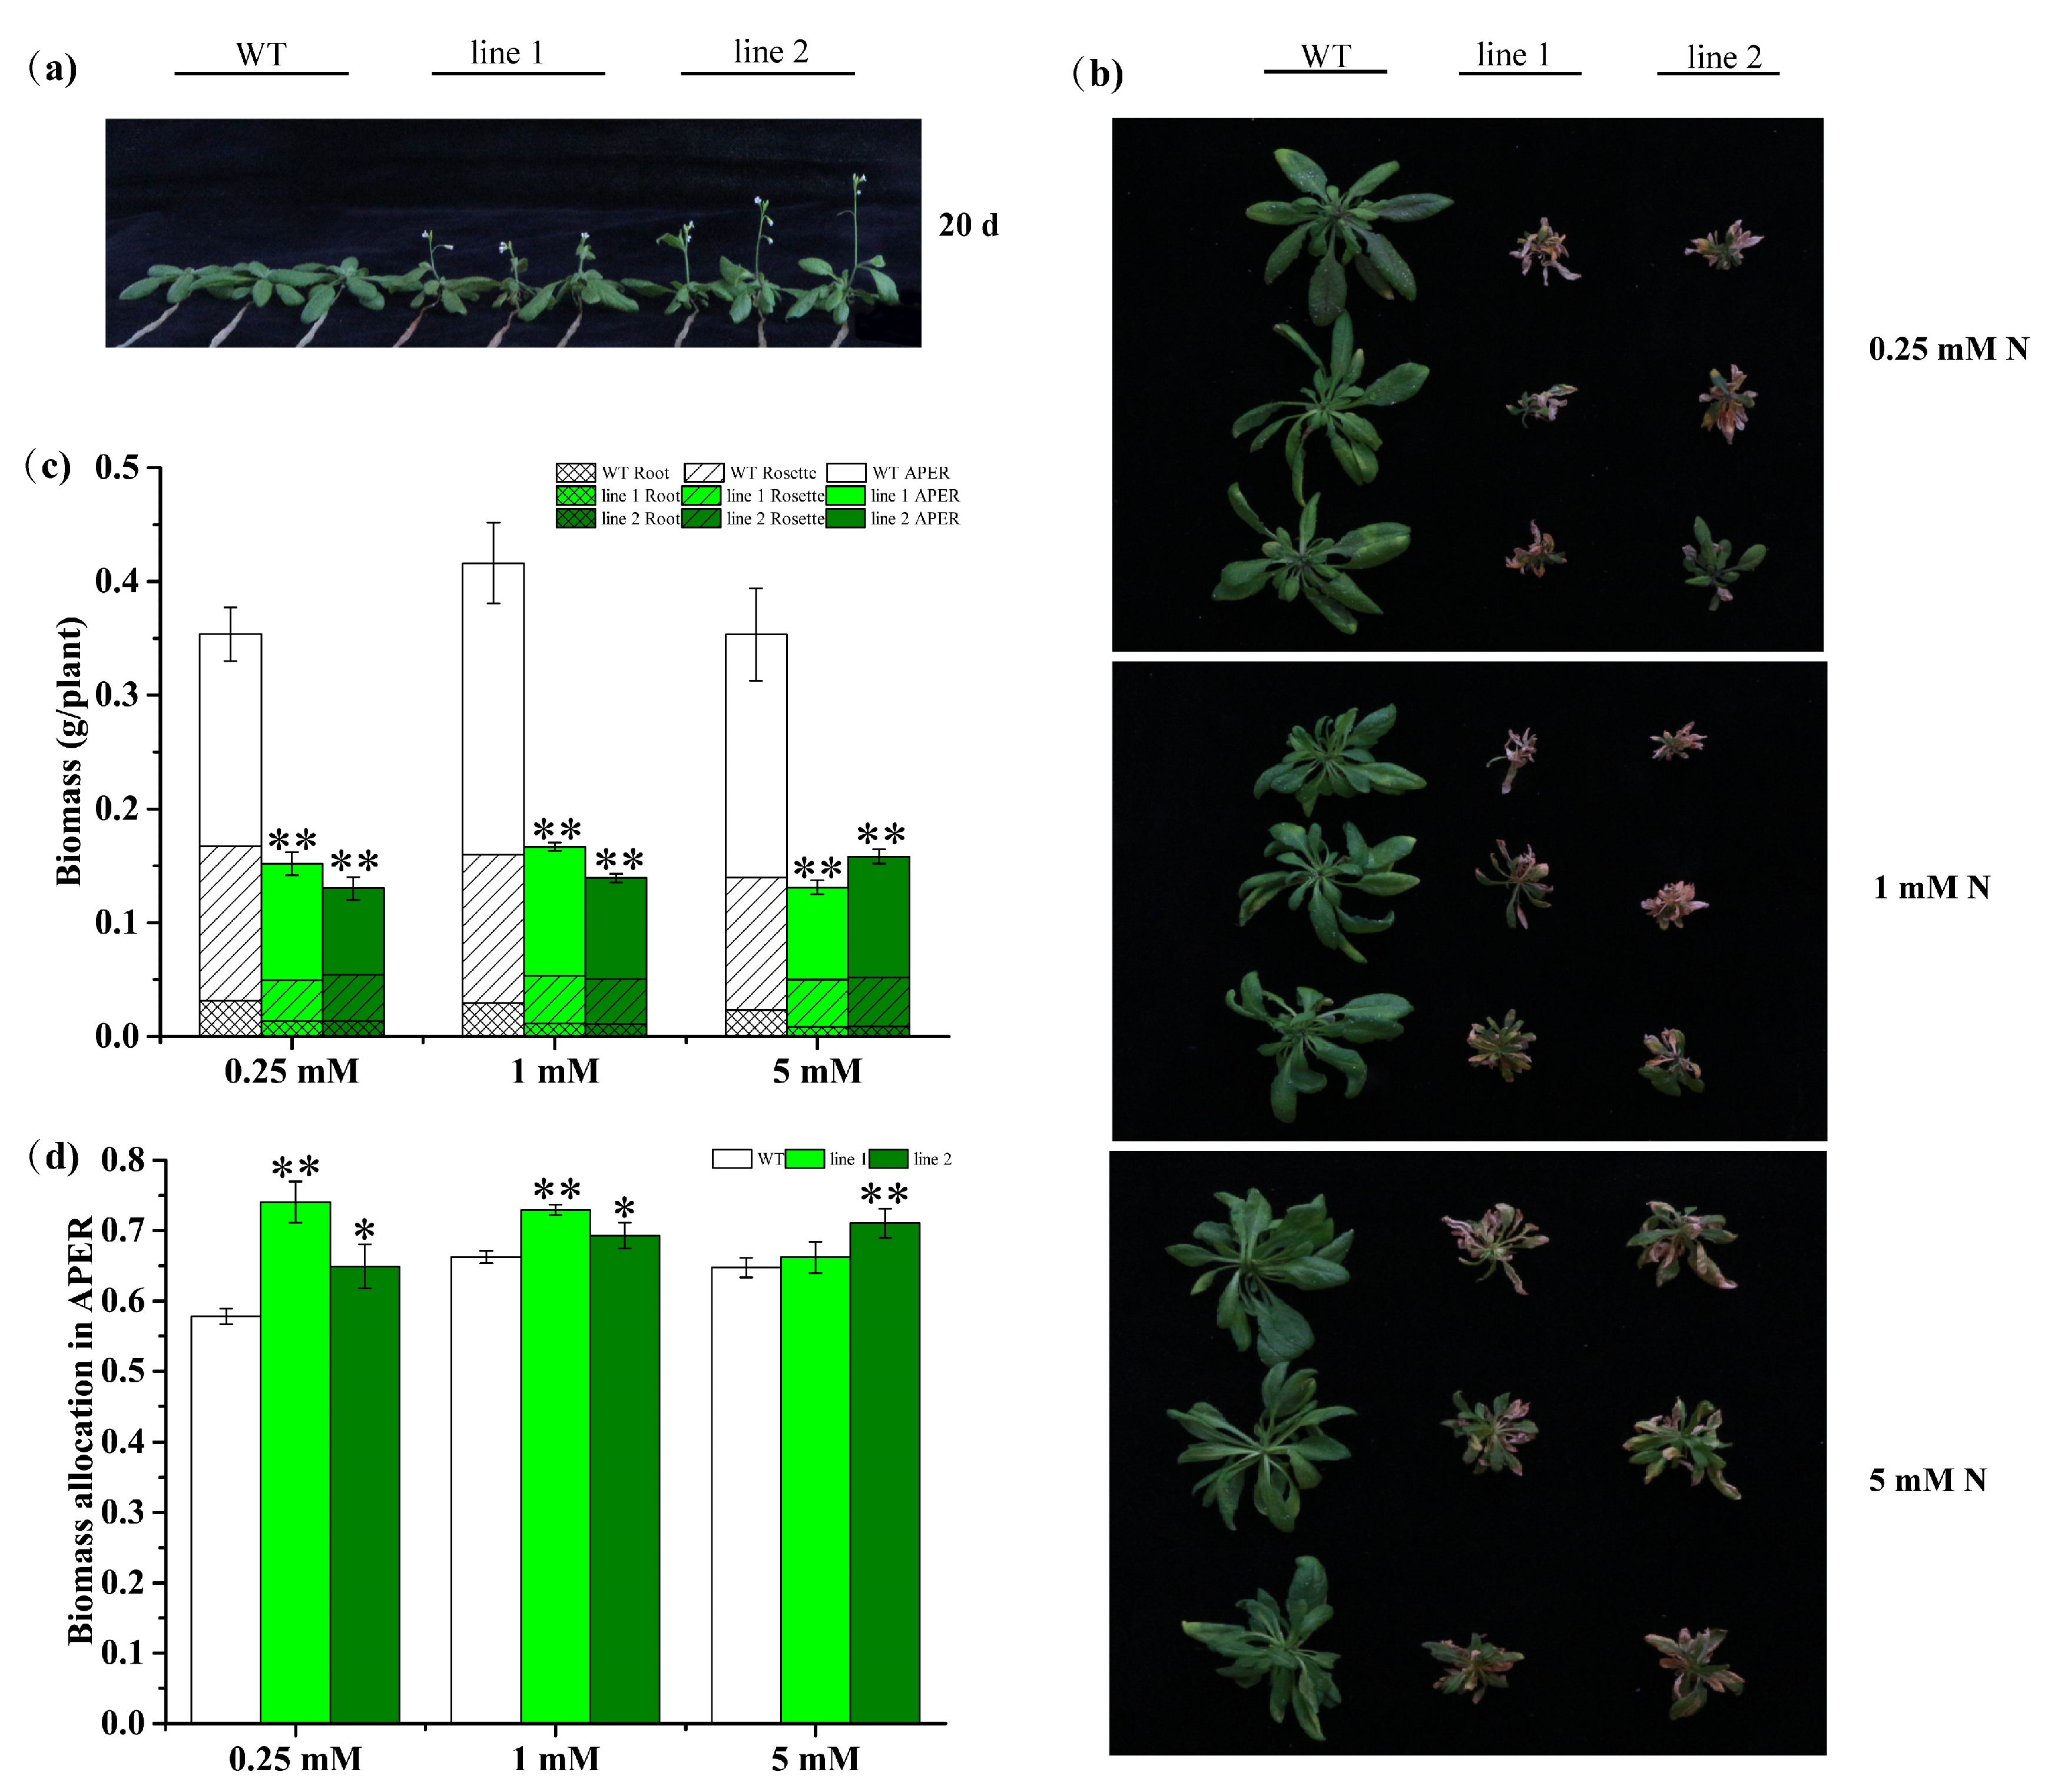
2.4.2. Transgenic Plants Promote Development but Decrease Biomass
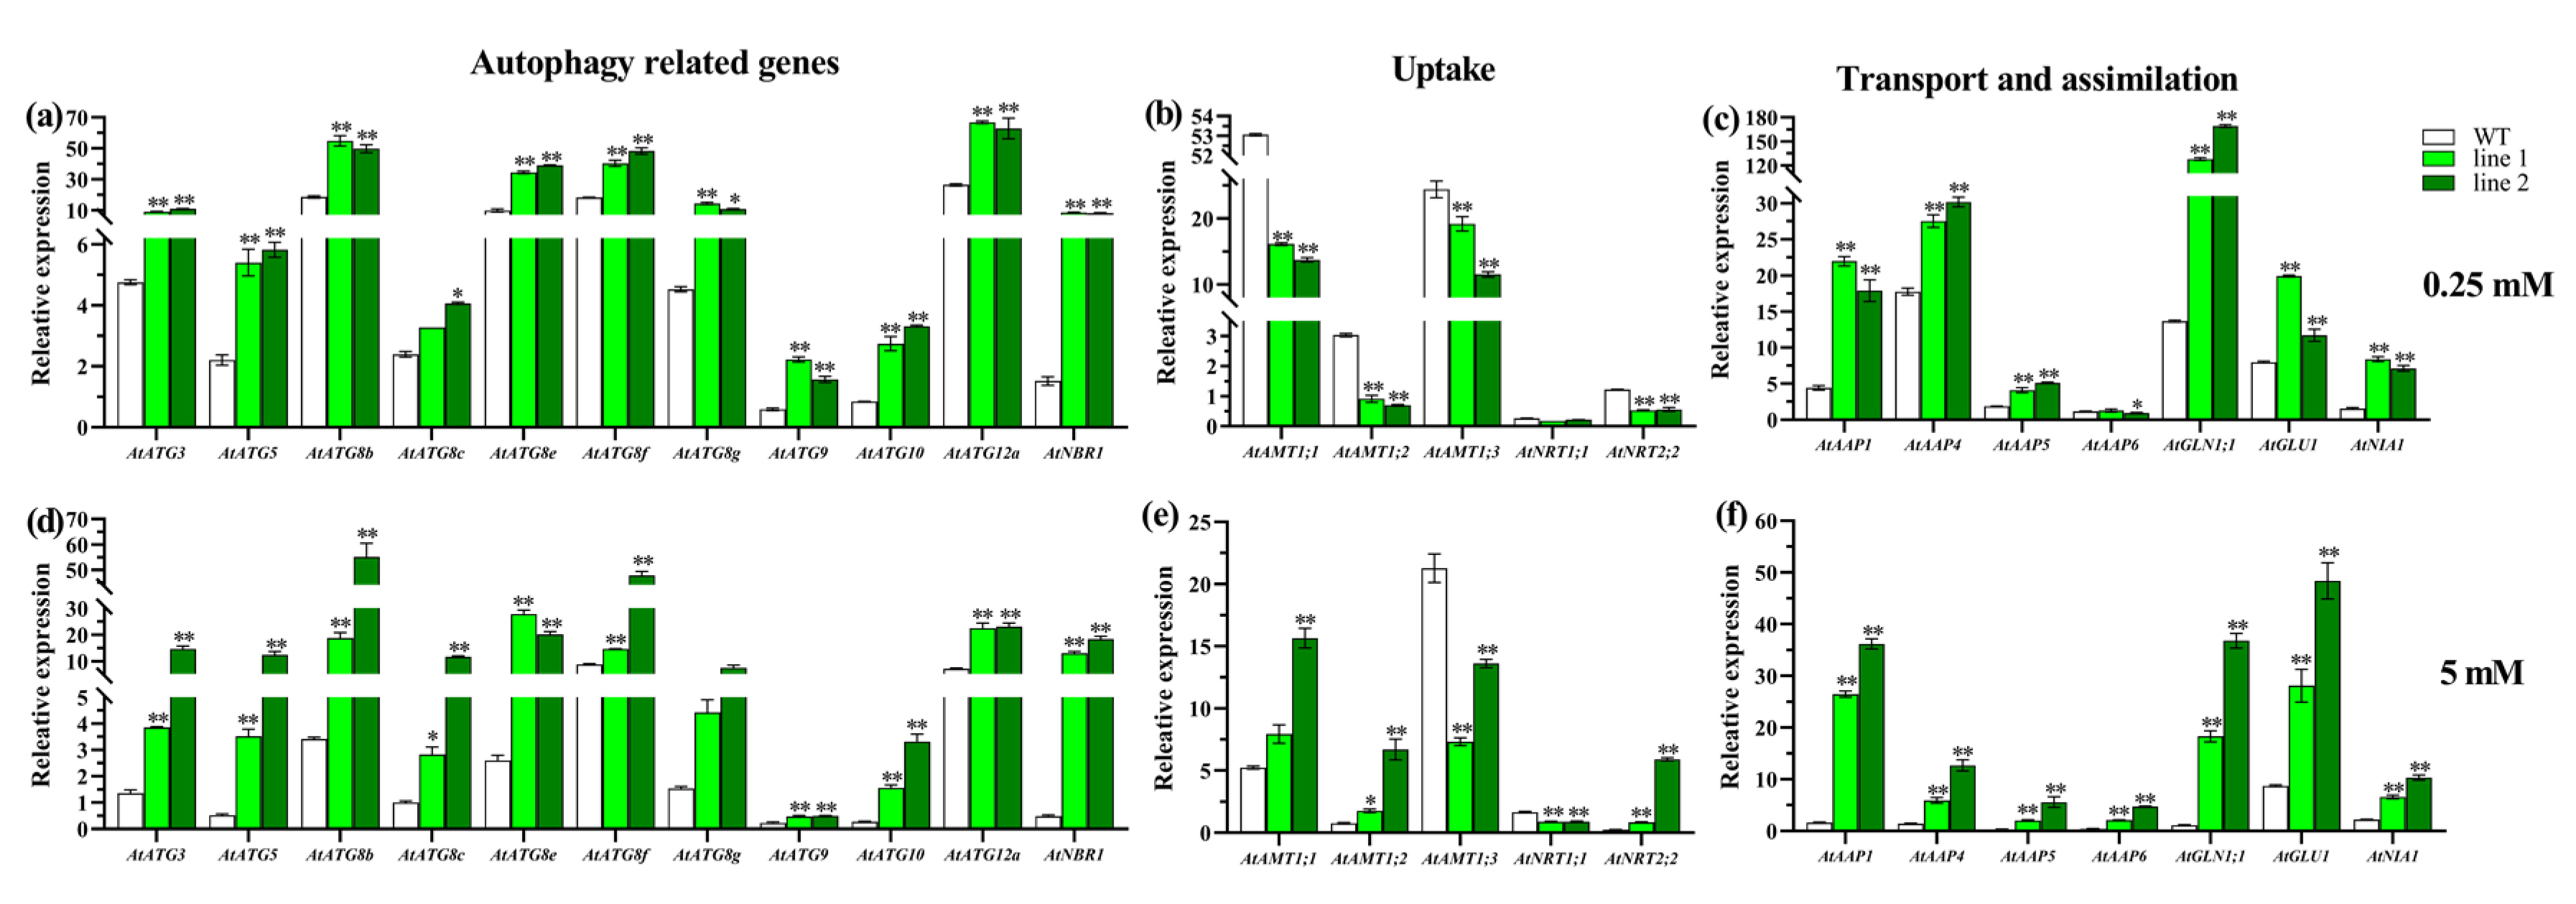
2.4.3. Transgenic Plants Enhance N Use Capacity under Both Sufficient and Deficient N Conditions
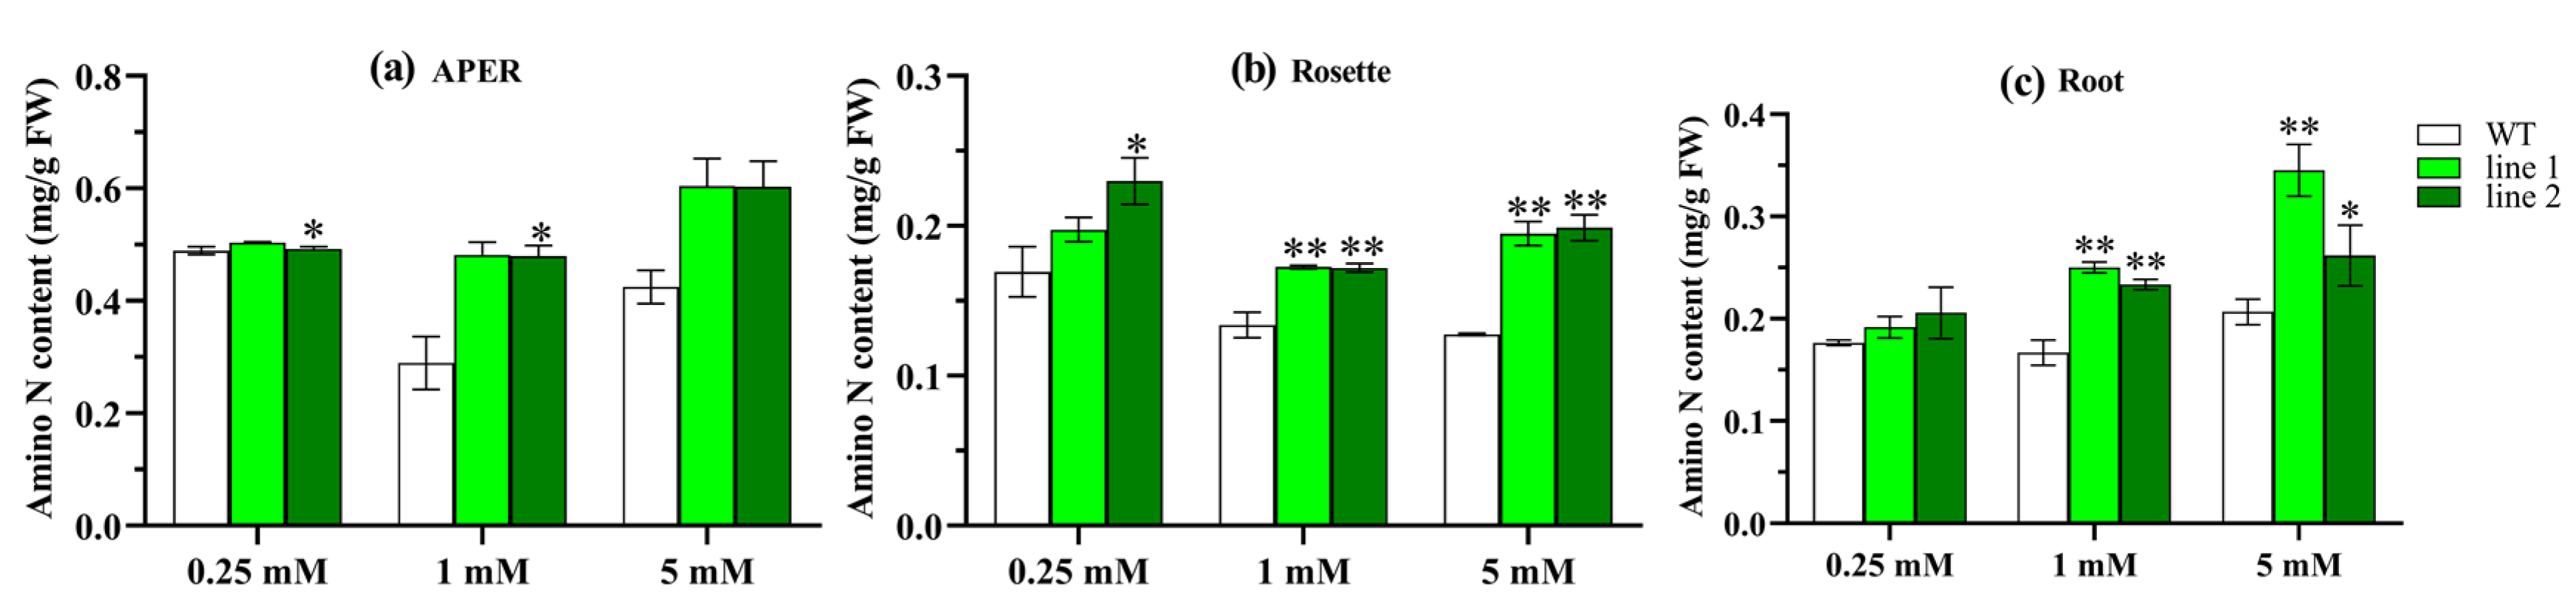
2.4.4. Transgenic Plants Increase Amino N
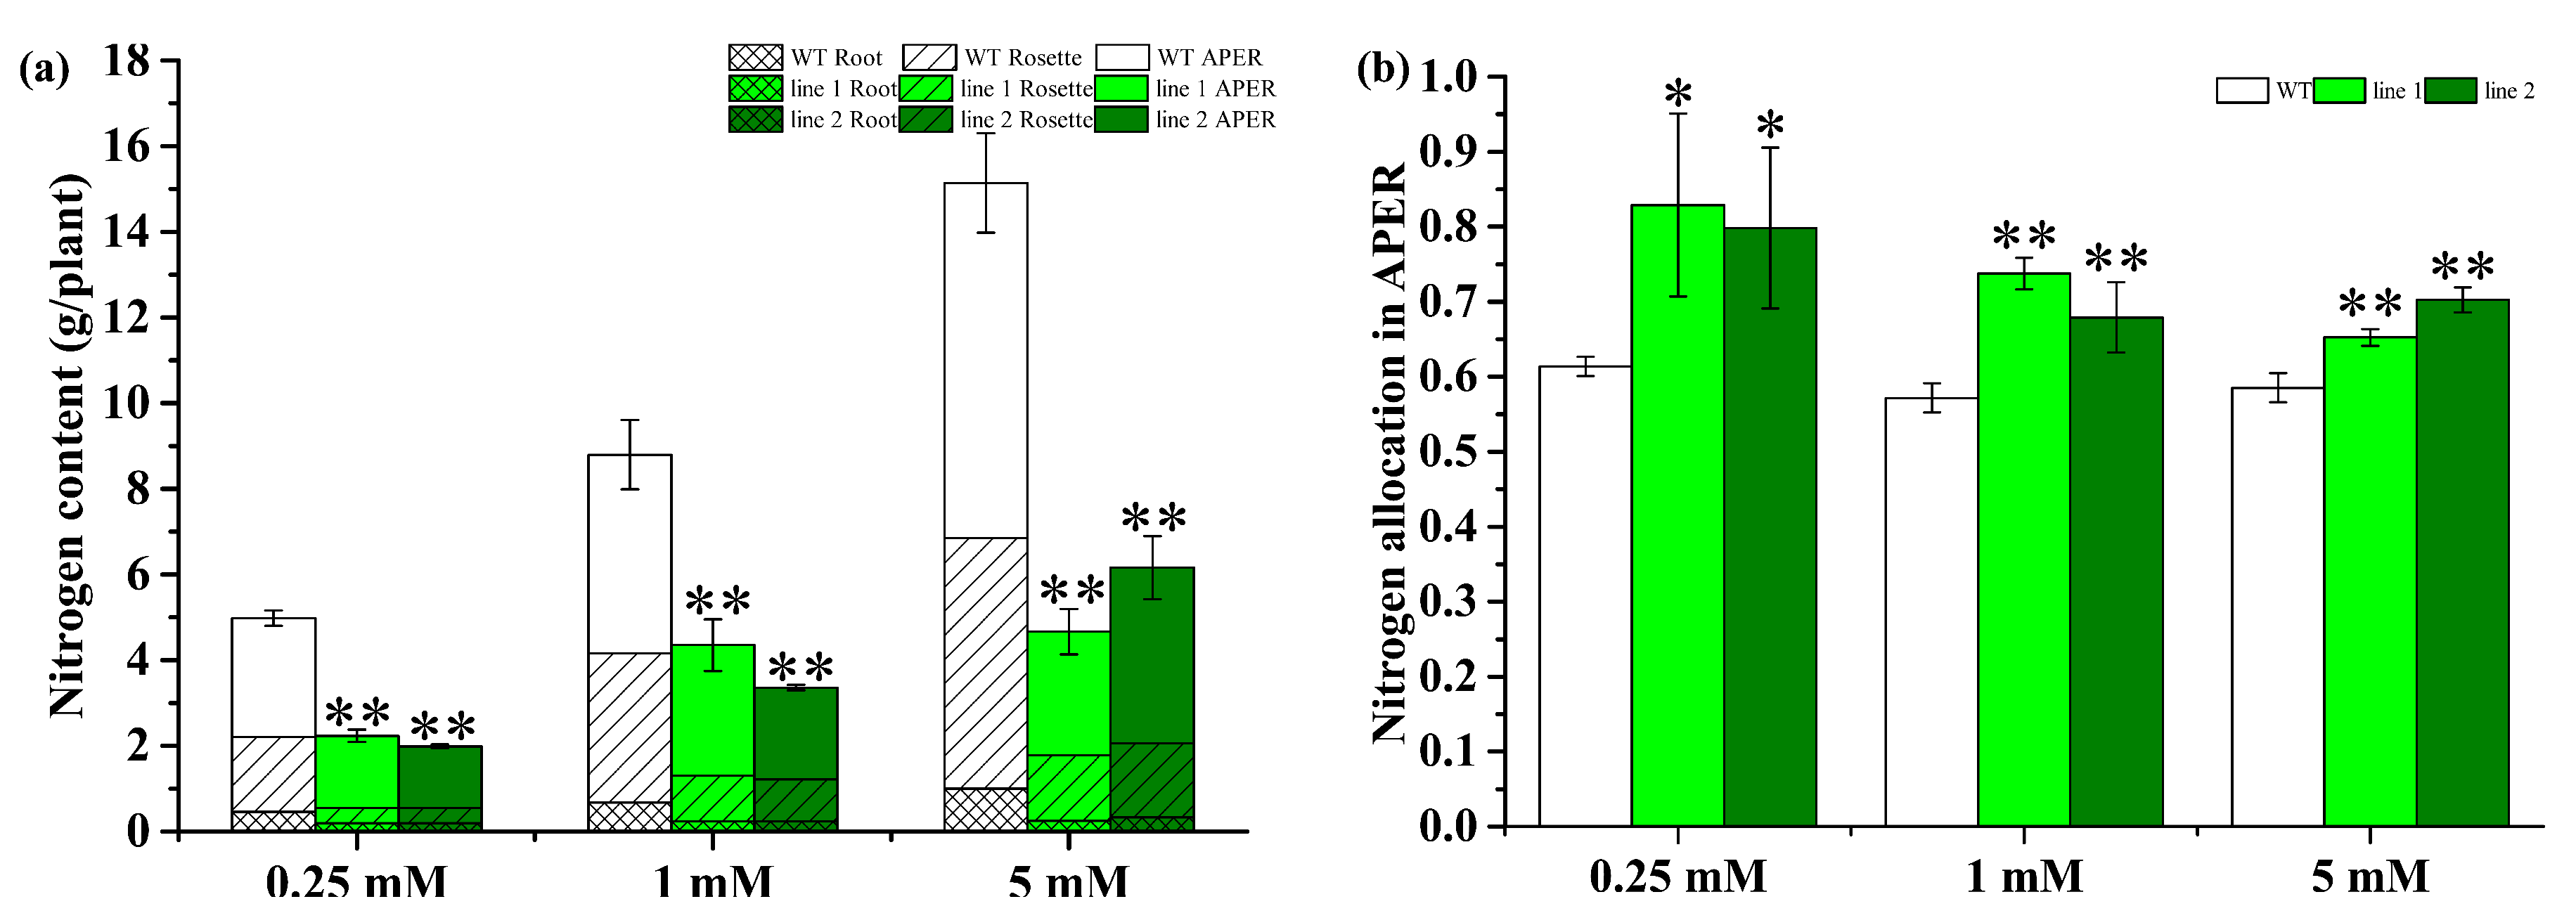
2.4.5. Transgenic Plants Improve N Allocation in APER
2.4.6. The Decrease in the Content of P and K in Transgenic Plants Is Mainly Attributed to Biomass Rather than the Concentration of P and K
3. Discussion
4. Materials and Methods
4.1. Identification of CsATG Genes
4.2. Phylogenetic Tree Construction and Analysis of Conserved Motif and Gene Structure of CsATGs
4.3. Plant Materials and Nitrogen Treatments
4.4. RNA Extraction and Gene Expression Analysis
4.5. Cloning of CsATG8e and Generation of Transgenic Arabidopsis thaliana Plants
4.6. Determination of N, P and K Concentration and Amino N in Arabidopsis
4.7. Statistical Analysis
Supplementary Materials
Author Contributions
Funding
Conflicts of Interest
Abbreviations
| APER | aerial part excluding rosette |
| ATG | autophagy-related gene |
| AAP | amino acid permease gene |
| AMT | ammonium transporter |
| NRT | nitrate transporter |
| NIA | nitrate reductase encoding gene |
| GLU | Gln 2-oxoglutarate aminotransferase encoding gene |
| GLN | Gln synthetase encoding gene |
| OE | overexpression |
| WT | wild type |
| ORF | open reading frame |
| UTR | untranslated region |
| ATG_C | Autophagy-related protein C terminal domain |
| Chorein_N | N-terminal region of Chorein |
| Autophagy_N | Autophagocytosis-associated protein N-terminus |
| Autophagy_C | Autophagocytosis-associated protein C-terminus |
| Autophagy_act_C | Autophagocytosis-associated protein, active-site domain |
| Peptidase_C54 | Peptidase family C54 |
| E1_like_apg7 | E1-like protein-activating enzyme Gsa7p/Apg7p |
| Ubl_ATG8 | ubiquitin-like (Ubl) domain and sub-family of the autophagy-related 8 family |
| Ubl_ATG12 | ubiquitin-like domain found in autophagy-related protein 12 |
| WD40 | WD40 repeat |
| BCAS3 | Breast carcinoma amplified sequence 3 |
| PX_SNX1_2_like | Phosphoinositide binding Phox Homology domain of Sorting Nexins 1 and 2 |
| BAR_SNK | Bin/Amphiphysin/Rvs (BAR) domain of Sorting Nexins |
| C2_PI3K_class_III | C2 domain present in class III phosphatidylinositol 3-kinases |
| PI3Ka_III | Phosphoinositide 3-kinase class III |
| PI3Kc_III | Catalytic domain of Class III Phosphoinositide 3-kinase |
| Vps35 | Vacuolar protein sorting-associated protein 35 |
| NBR1_like | neighbor of Brca1 Gene 1 and related proteins |
| UBA_NBR1 | UBA domain of next to BRCA1 gene 1 protein (NBR1) and similar proteins |
| ZZ superfamily | Zinc finger, ZZ type |
| V-SNARE | Vesicle transport v-SNARE protein N-terminus |
| SNARE_Vti1 | SNARE motif of Vti1 |
| PKc-like | Protein Kinases, catalytic domain |
| STKc_ATG1_ULK_like | Catalytic domain of the Serine/Threonine kinases, Autophagy-related protein 1 and Unc-51-like kinases |
| STKc_Vps15 | Catalytic domain of the Serine/Threonine kinase, Vacuolar protein sorting-associated protein 15 |
References
- Mukhopadhyay, M.; Mondal, T.K.; Chand, P.K. Biotechnological advances in tea (Camellia sinensis [L.] O. Kuntze): A review. Plant Cell Rep. 2016, 35, 255–287. [Google Scholar] [CrossRef] [PubMed]
- Chen, L.; Apostolides, Z.; Chen, Z.M. Global Tea Breeding, Achievements, Challenges and Perspectives; Springer-Zhejiang University Press: Hangzhou, China, 2012. [Google Scholar]
- Bouwman, A.F.; Boumans, L.J.M.; Batjes, N. Emissions of N2O and NO from fertilized fields: Summary of available measurement data. Glob. Biogeochem. Cycles 2002, 16, 1058. [Google Scholar] [CrossRef]
- Gruber, N.; Galloway, J.N. An Earth-system perspective of the global nitrogen cycle. Nature 2008, 451, 293–296. [Google Scholar] [CrossRef]
- Maegan, A.G.; Rakesh, M.; Stephanie, L.; Subhash, C.M. Effects of different foliar nitrogen fertilizers on cellular nitrogen metabolism and biomass of two shrub willow cultivars. NRC Res. Press 2019, 49, 1548–1559. [Google Scholar]
- Alessandro, M.; Pasquale, S.; Antonio, D.; Daniela, S.; Giuseppe, C.; Youssef, R.; Boris, B. Foliar application of an amino acid-enriched urea fertilizer on ‘Greco’ grapevines at full veraison increases berry yeast-assimilable nitrogen content. Plants 2020, 9, 619. [Google Scholar]
- Fan, K.; Zhang, Q.; Liu, M.Y.; Ma, L.; Shi, Y.; Ruan, J. Metabolomic and transcriptional analyses reveal the mechanism of C, N allocation from source leaf to flower in tea plant (Camellia sinensis L.). J. Plant Physiol. 2019, 232, 200–208. [Google Scholar] [CrossRef] [PubMed]
- Masclaux-Daubresse, C.; Chen, Q.; Havé, M. Regulation of nutrient recycling via autophagy. Curr. Opin. Plant Biol. 2017, 39, 8–17. [Google Scholar] [CrossRef]
- Liu, Y.; Bassham, D.C. Autophagy: Pathways for self-eating in plant cells. Annu. Rev. Plant Biol. 2012, 63, 215–237. [Google Scholar] [CrossRef] [Green Version]
- Hanaoka, H.; Noda, T.; Shirano, Y.; Kato, T.; Hayashi, H.; Shibata, D.; Tabata, S.; Ohsumi, Y. Leaf senescence and starvation-induced chlorosis are accelerated by the disruption of an arabidopsis autophagy gene. Plant Physiol. 2002, 129, 1181–1193. [Google Scholar] [CrossRef] [Green Version]
- Li, F.; Chung, T.; Pennington, J.G.; Federico, M.L.; Kaeppler, H.F.; Kaeppler, S.; Otegui, M.S.; Vierstra, R.D. Autophagic recycling plays a central role in maize nitrogen remobilization. Plant Cell 2015, 27, 1389–1408. [Google Scholar] [CrossRef] [Green Version]
- Masclaux-Daubresse, C.; Reisdorf-Cren, M.; Orsel, M. Leaf nitrogen remobilization for plant development and grain filling. Plant Biol. 2008, 10, 23–36. [Google Scholar] [CrossRef] [PubMed]
- Diaz, C.; Lemaître, T.; Christ, A.; Azzopardi, M.; Kato, Y.; Sato, F.; Morot-Gaudry, J.F.; Le Dily, F.; Masclaux-Daubresse, C. Nitrogen recycling and remobilization are differentially controlled by leaf senescence and development stage in arabidopsis under low nitrogen nutrition. Plant Physiol. 2008, 147, 1437–1449. [Google Scholar] [CrossRef] [PubMed] [Green Version]
- Wada, S.; Hayashida, Y.; Izumi, M.; Kurusu, T.; Hanamata, S.; Kanno, K.; Kojima, S.; Yamaya, T.; Kuchitsu, K.; Makino, A.; et al. Autophagy supports biomass production and nitrogen use efficiency at the vegetative stage in rice. Plant Physiol. 2015, 168, 60–73. [Google Scholar] [CrossRef] [Green Version]
- Guiboileau, A.; Yoshimoto, K.; Soulay, F.; Bataillé, M.P.; Avice, J.C.; Masclaux-Daubresse, C. Autophagy machinery controls nitrogen remobilization at the whole-plant level under both limiting and ample nitrate conditions in Arabidopsis. New Phytol. 2012, 194, 732–740. [Google Scholar] [CrossRef] [PubMed]
- Tsukada, M.; Ohsumi, Y. Isolation and characterization of autophagy-defective mutants of Saccharomyces cerevisiae. FEBS Lett. 1993, 333, 169–174. [Google Scholar] [CrossRef] [Green Version]
- Avila-Ospina, L.; Moison, M.; Yoshimoto, K.; Masclaux-Daubresse, C. Autophagy, plant senescence, and nutrient recycling. J. Exp. Bot. 2014, 65, 3799–3811. [Google Scholar] [CrossRef] [Green Version]
- Han, S.; Yu, B.; Wang, Y.; Liu, Y. Role of plant autophagy in stress response. Protein Cell 2011, 2, 784–791. [Google Scholar] [CrossRef] [Green Version]
- Li, F.; Chung, T.; Vierstra, R.D. AUTOPHAGY-RELATED11 Plays a Critical Role in General Autophagy- and Senescence-Induced Mitophagy in Arabidopsis. Plant Cell 2014, 26, 788–807. [Google Scholar] [CrossRef] [Green Version]
- Shangguan, L.; Fang, X.; Chen, L.; Cui, L.; Fang, J. Genome-wide analysis of autophagy-related genes (ARGs) in grapevine and plant tolerance to copper stress. Planta 2018, 247, 1449–1463. [Google Scholar] [CrossRef]
- Xia, E.H.; Zhang, H.B.; Sheng, J.; Li, K.; Zhang, Q.J.; Kim, C.; Zhang, Y.; Liu, Y.; Zhu, T.; Li, W.; et al. The tea tree genome provides insights into tea flavor and independent evolution of caffeine biosynthesis. Mol. Plant 2017, 10, 866–877. [Google Scholar] [CrossRef] [PubMed] [Green Version]
- Zhang, W.; Zhang, Y.; Qiu, H.; Guo, Y.; Wan, H.; Zhang, X.; Scossa, F.; Alseekh, S.; Zhang, Q.; Wang, P.; et al. Genome assembly of wild tea tree DASZ reveals pedigree and selection history of tea varieties. Nat. Commun. 2020, 11, 3719. [Google Scholar] [CrossRef]
- Xia, E.H.; Li, F.; Tong, W.; Li, P.; Wu, Q.; Zhao, H.; Ge, R.H.; Li, R.; Li, Y.; Zhang, Z.; et al. Tea Plant Information Archive: A comprehensive genomics and bioinformatics platform for tea plant. Plant Biotechnol. J. 2019, 17, 1938–1953. [Google Scholar] [CrossRef] [PubMed]
- Li, F.; Vierstra, R.D. Autophagy: A multifaceted intracellular system for bulk and selective recycling. Trends Plant Sci. 2012, 17, 526–537. [Google Scholar] [CrossRef] [PubMed]
- Kwon, S.I.; Park, O.K. Autophagy in plants. J. Plant Biol. 2008, 51, 313–320. [Google Scholar] [CrossRef]
- Wang, P.; Sun, X.; Jia, X.; Wang, N.; Gong, X.; Ma, F. Characterization of an autophagy-related gene MdATG8i from apple. Front. Plant Sci. 2016, 7, 720. [Google Scholar] [CrossRef] [PubMed] [Green Version]
- Zhen, X.; Li, X.; Yu, J.; Xu, F. OsATG8c-mediated increased autophagy regulates the yield and nitrogen use efficiency in rice. Int. J. Mol. Sci. 2019, 20, 4956. [Google Scholar] [CrossRef] [PubMed] [Green Version]
- Chen, Q.; Soulay, F.; Saudemont, B.; Elmayan, T.; Marmagne, A.; Masclaux-Daubresse, C.; Masclaux-Daubresse, C. Overexpression of ATG8 in arabidopsis stimulates autophagic activity and increases nitrogen remobilization efficiency and grain filling. Plant Cell Physiol. 2019, 60, 343–352. [Google Scholar] [CrossRef]
- Lornac, A.; Havé, M.; Chardon, F.; Soulay, F.; Clément, G.; Avice, J.-C.; Masclaux-Daubresse, C. Autophagy controls sulphur metabolism in the rosette leaves of arabidopsis and facilitates S remobilization to the seeds. Cells 2020, 9, 332. [Google Scholar] [CrossRef]
- Pottier, M.; Dumont, J.; Masclaux-Daubresse, C.; Thomine, S. Autophagy is essential for optimal translocation of iron to seeds in Arabidopsis. J. Exp. Bot. 2019, 70, 859–869. [Google Scholar] [CrossRef] [Green Version]
- Pottier, M.; Masclaux-Daubresse, C.; Yoshimoto, K.; Thomine, S. Autophagy as a possible mechanism for micronutrient remobilization from leaves to seeds. Front. Plant Sci. 2014, 5, 11. [Google Scholar] [CrossRef] [Green Version]
- Wu, W.; Liu, Y.; Wang, Y.; Li, H.; Liu, J.; Tan, J.; He, J.; Bai, J.; Ma, H. Evolution analysis of the Aux/IAA gene family in plants shows dual origins and variable nuclear localization signals. Int. J. Mol. Sci. 2017, 18, 2107. [Google Scholar] [CrossRef] [Green Version]
- Bu, F.; Yang, M.; Guo, X.; Huang, W.; Chen, L. Multiple functions of ATG8 family proteins in plant autophagy. Front. Cell Dev. Biol. 2020, 8, 466. [Google Scholar] [CrossRef] [PubMed]
- Kim, S.H.; Kwon, C.; Lee, J.H.; Chung, T. Genes for plant autophagy: Functions and interactions. Mol. Cells 2012, 34, 413–423. [Google Scholar] [CrossRef] [Green Version]
- Xia, K.; Liu, T.; Ouyang, J.; Wang, R.; Fan, T.; Zhang, M. Genome-wide identification, classification, and expression analysis of autophagy-associated gene homologues in rice (Oryza sativa L.). DNA Res. 2011, 18, 363–377. [Google Scholar] [CrossRef] [PubMed] [Green Version]
- Zhou, X.M.; Zhao, P.; Wang, W.; Zou, J.; Cheng, T.H.; Peng, X.B.; Sun, M.X. A comprehensive, genome-wide analysis of autophagy-related genes identified in tobacco suggests a central role of autophagy in plant response to various environmental cues. DNA Res. 2015, 22, 245–257. [Google Scholar] [CrossRef] [Green Version]
- Fu, X.Z.; Zhou, X.; Xu, Y.Y.; Hui, Q.L.; Chang-Pin, C.; Li-Li, L.; Liang-Zhi, P. Comprehensive analysis of autophagy-related genes in sweet orange (Citrus sinensis) highlights their roles in response to abiotic stresses. Int. J. Mol. Sci. 2020, 21, 2699. [Google Scholar] [CrossRef] [Green Version]
- Thompson, A.R.; Vierstra, R.D. Autophagic recycling: Lessons from yeast help define the process in plants. Curr. Opin. Plan. Biol. 2005, 8, 165–173. [Google Scholar] [CrossRef]
- Wei, Y.; Liu, W.; Hu, W.; Liu, G.; Wu, C.; Liu, W.; Zeng, H.; He, C.; Shi, H. Genome-wide analysis of autophagy-related genes in banana highlights MaATG8s in cell death and autophagy in immune response to Fusarium wilt. Plant Cell Rep. 2017, 36, 1237–1250. [Google Scholar] [CrossRef]
- Zhai, Y.; Guo, M.; Wang, H.; Lu, J.; Liu, J.; Zhang, C.; Gong, Z.; Lu, M. Autophagy, a conserved mechanism for protein degradation, responds to heat, and other abiotic stresses in Capsicum annuum L. Front. Plant Sci. 2016, 7, 131. [Google Scholar] [CrossRef] [Green Version]
- Li, W.; Chen, M.; Wang, E.; Hu, L.; Hawkesford, M.J.; Zhong, L.; Chen, Z.; Xu, Z.; Li, L.; Zhou, Y.; et al. Genome-wide analysis of autophagy-associated genes in foxtail millet (Setaria italica L.) and characterization of the function of SiATG8a in conferring tolerance to nitrogen starvation in rice. BMC Genom. 2016, 17, 797. [Google Scholar] [CrossRef] [Green Version]
- Zhen, X.; Xu, F.; Zhang, W.; Li, N.; Li, X. Overexpression of rice gene OsATG8b confers tolerance to nitrogen starvation and increases yield and nitrogen use efficiency (NUE) in Arabidopsis. PLoS ONE 2019, 14, e0223011. [Google Scholar] [CrossRef] [PubMed] [Green Version]
- Wang, P.; Mugume, Y.; Bassham, D.C. New advances in autophagy in plants: Regulation, selectivity and function. Semin. Cell Dev. Biol. 2018, 80, 113–122. [Google Scholar] [CrossRef] [PubMed]
- Himelblau, E.; Amasino, R.M. Nutrients mobilized from leaves of Arabidopsis thaliana during leaf senescence. J. Plant Physiol. 2001, 158, 1317–1323. [Google Scholar] [CrossRef]
- An, Z.Y.; Tassa, A.; Thomas, C.; Zhong, R.; Xiao, G.H.; Fotedar, R.; Tu, B.P.; Klionsky, D.J.; Levine, B. Autophagy is required for G1/G0 quiescence in response to nitrogen starvation in Saccharomyces cerevisiae. Autophagy 2014, 10, 1702–1711. [Google Scholar]
- Onodera, J.; Ohsumi, Y. Autophagy is required for maintenance of amino acid levels and protein synthesis under nitrogen starvation. J. Biol. Chem. 2005, 280, 31582–31586. [Google Scholar] [CrossRef] [Green Version]
- Di Berardino, J.; Marmagne, A.; Berger, A.; Yoshimoto, K.; Cueff, G.; Chardon, F.; Masclaux-Daubresse, C.; Reisdorf-Cren, M. Autophagy controls resource allocation and protein storage accumulation in Arabidopsis seeds. J. Exp. Bot. 2018, 69, 1403–1414. [Google Scholar] [CrossRef] [Green Version]
- Guiboileau, A.; Avila-Ospina, L.; Yoshimoto, K.; Soulay, F.; Azzopardi, M.; Marmagne, A.; Lothier, J.; Masclaux-Daubresse, C. Physiological and metabolic consequences of autophagy deficiency for the management of nitrogen and protein resources in Arabidopsis leaves depending on nitrate availability. New Phytol. 2013, 199, 683–694. [Google Scholar] [CrossRef]
- Fan, T.; Yang, W.; Zeng, X.; Xu, X.; Xu, Y.; Fan, X.; Luo, M.; Tian, C.; Xia, K.; Zhang, M. A rice autophagy gene OsATG8b is involved in nitrogen remobilization and control of grain quality. Front. Plant Sci. 2020, 11, 588. [Google Scholar] [CrossRef]
- Yu, J.; Zhen, X.; Li, X.; Li, N.; Xu, F. Increased autophagy of rice can increase yield and nitrogen use efficiency (NUE). Front. Plant Sci. 2019, 10, 584. [Google Scholar] [CrossRef] [Green Version]
- Islam, M.; Ishibashi, Y.; Nakagawa, A.C.; Tomita, Y.; Iwaya-Inoue, M.; Arima, S.; Zheng, S.-H. Nitrogen redistribution and its relationship with the expression of GmATG8c during seed filling in soybean. J. Plant Physiol. 2016, 192, 71–74. [Google Scholar] [CrossRef]
- Tegeder, M.; Masclaux-Daubresse, C. Source and sink mechanisms of nitrogen transport and use. New Phytol. 2018, 217, 35–53. [Google Scholar] [CrossRef] [PubMed] [Green Version]
- Tegeder, M. Transporters for amino acids in plant cells: Some functions and many unknowns. Curr. Opin. Plant Biol. 2012, 15, 315–321. [Google Scholar] [CrossRef]
- Santiago, J.P.; Tegeder, M. Connecting source with sink: The role of arabidopsis AAP8 in phloem loading of amino Acids. Plant Physiol. 2016, 171, 508–521. [Google Scholar] [CrossRef] [PubMed] [Green Version]
- Xia, T.; Xiao, D.; Liu, N.; Chai, W.; Gong, Q.; Wang, N.N. Heterologous expression of ATG8c from soybean confers tolerance to nitrogen deficiency and increases yield in arabidopsis. PLoS ONE 2012, 7, e37217. [Google Scholar] [CrossRef] [PubMed]
- Chen, C.J.; Chen, H.; He, Y.H.; Xia, R. TBtools, a Toolkit for biologists integrating various biological data handling tools with a user-friendly interface. bioRxiv 2018. [Google Scholar] [CrossRef]
- Wan, Q.; Xu, R.; Li, X. Proton release by tea plant (Camellia sinensis L.) roots as affected by nutrient solution concentration and pH. Plant Soil Environ. 2012, 58, 429–434. [Google Scholar] [CrossRef]
- Livak, K.J.; Schmittgen, T.D. Analysis of relative gene expression data using real-time quantitative PCR and the 2−ΔΔCT method. Methods 2001, 25, 402–408. [Google Scholar] [CrossRef]
- Zhang, C.; Zhang, W.; Ren, G.; Li, D.; Cahoon, R.E.; Chen, M.; Zhou, Y.; Yu, B.; Cahoon, E.B. Chlorophyll synthase under epigenetic surveillance is critical for vitamin E synthesis, and altered expression affects tocopherol levels in arabidopsis. Plant Physiol. 2015, 168, 1503–1511. [Google Scholar] [CrossRef]
- Clough, S.J.; Bent, A.F. Floral dip: A simplified method for Agrobacterium-mediated transformation of Arabidopsis thaliana. Plant J. 1998, 16, 735–743. [Google Scholar] [CrossRef] [Green Version]
- Rosen, H. A modified ninhydrin colorimetric analysis for amino acids. Arch. Biochem. Biophys. 1957, 67, 10–15. [Google Scholar] [CrossRef]


© 2020 by the authors. Licensee MDPI, Basel, Switzerland. This article is an open access article distributed under the terms and conditions of the Creative Commons Attribution (CC BY) license (http://creativecommons.org/licenses/by/4.0/).
Share and Cite
Huang, W.; Ma, D.-N.; Liu, H.-L.; Luo, J.; Wang, P.; Wang, M.-L.; Guo, F.; Wang, Y.; Zhao, H.; Ni, D.-J. Genome-Wide Identification of CsATGs in Tea Plant and the Involvement of CsATG8e in Nitrogen Utilization. Int. J. Mol. Sci. 2020, 21, 7043. https://0-doi-org.brum.beds.ac.uk/10.3390/ijms21197043
Huang W, Ma D-N, Liu H-L, Luo J, Wang P, Wang M-L, Guo F, Wang Y, Zhao H, Ni D-J. Genome-Wide Identification of CsATGs in Tea Plant and the Involvement of CsATG8e in Nitrogen Utilization. International Journal of Molecular Sciences. 2020; 21(19):7043. https://0-doi-org.brum.beds.ac.uk/10.3390/ijms21197043
Chicago/Turabian StyleHuang, Wei, Dan-Ni Ma, Hong-Ling Liu, Jie Luo, Pu Wang, Ming-Le Wang, Fei Guo, Yu Wang, Hua Zhao, and De-Jiang Ni. 2020. "Genome-Wide Identification of CsATGs in Tea Plant and the Involvement of CsATG8e in Nitrogen Utilization" International Journal of Molecular Sciences 21, no. 19: 7043. https://0-doi-org.brum.beds.ac.uk/10.3390/ijms21197043