
Effects of Extracellular Vesicles from Blood-Derived Products on Osteoarthritic Chondrocytes within an Inflammation Model

 , ,
, ,
Abstract
:1. Introduction
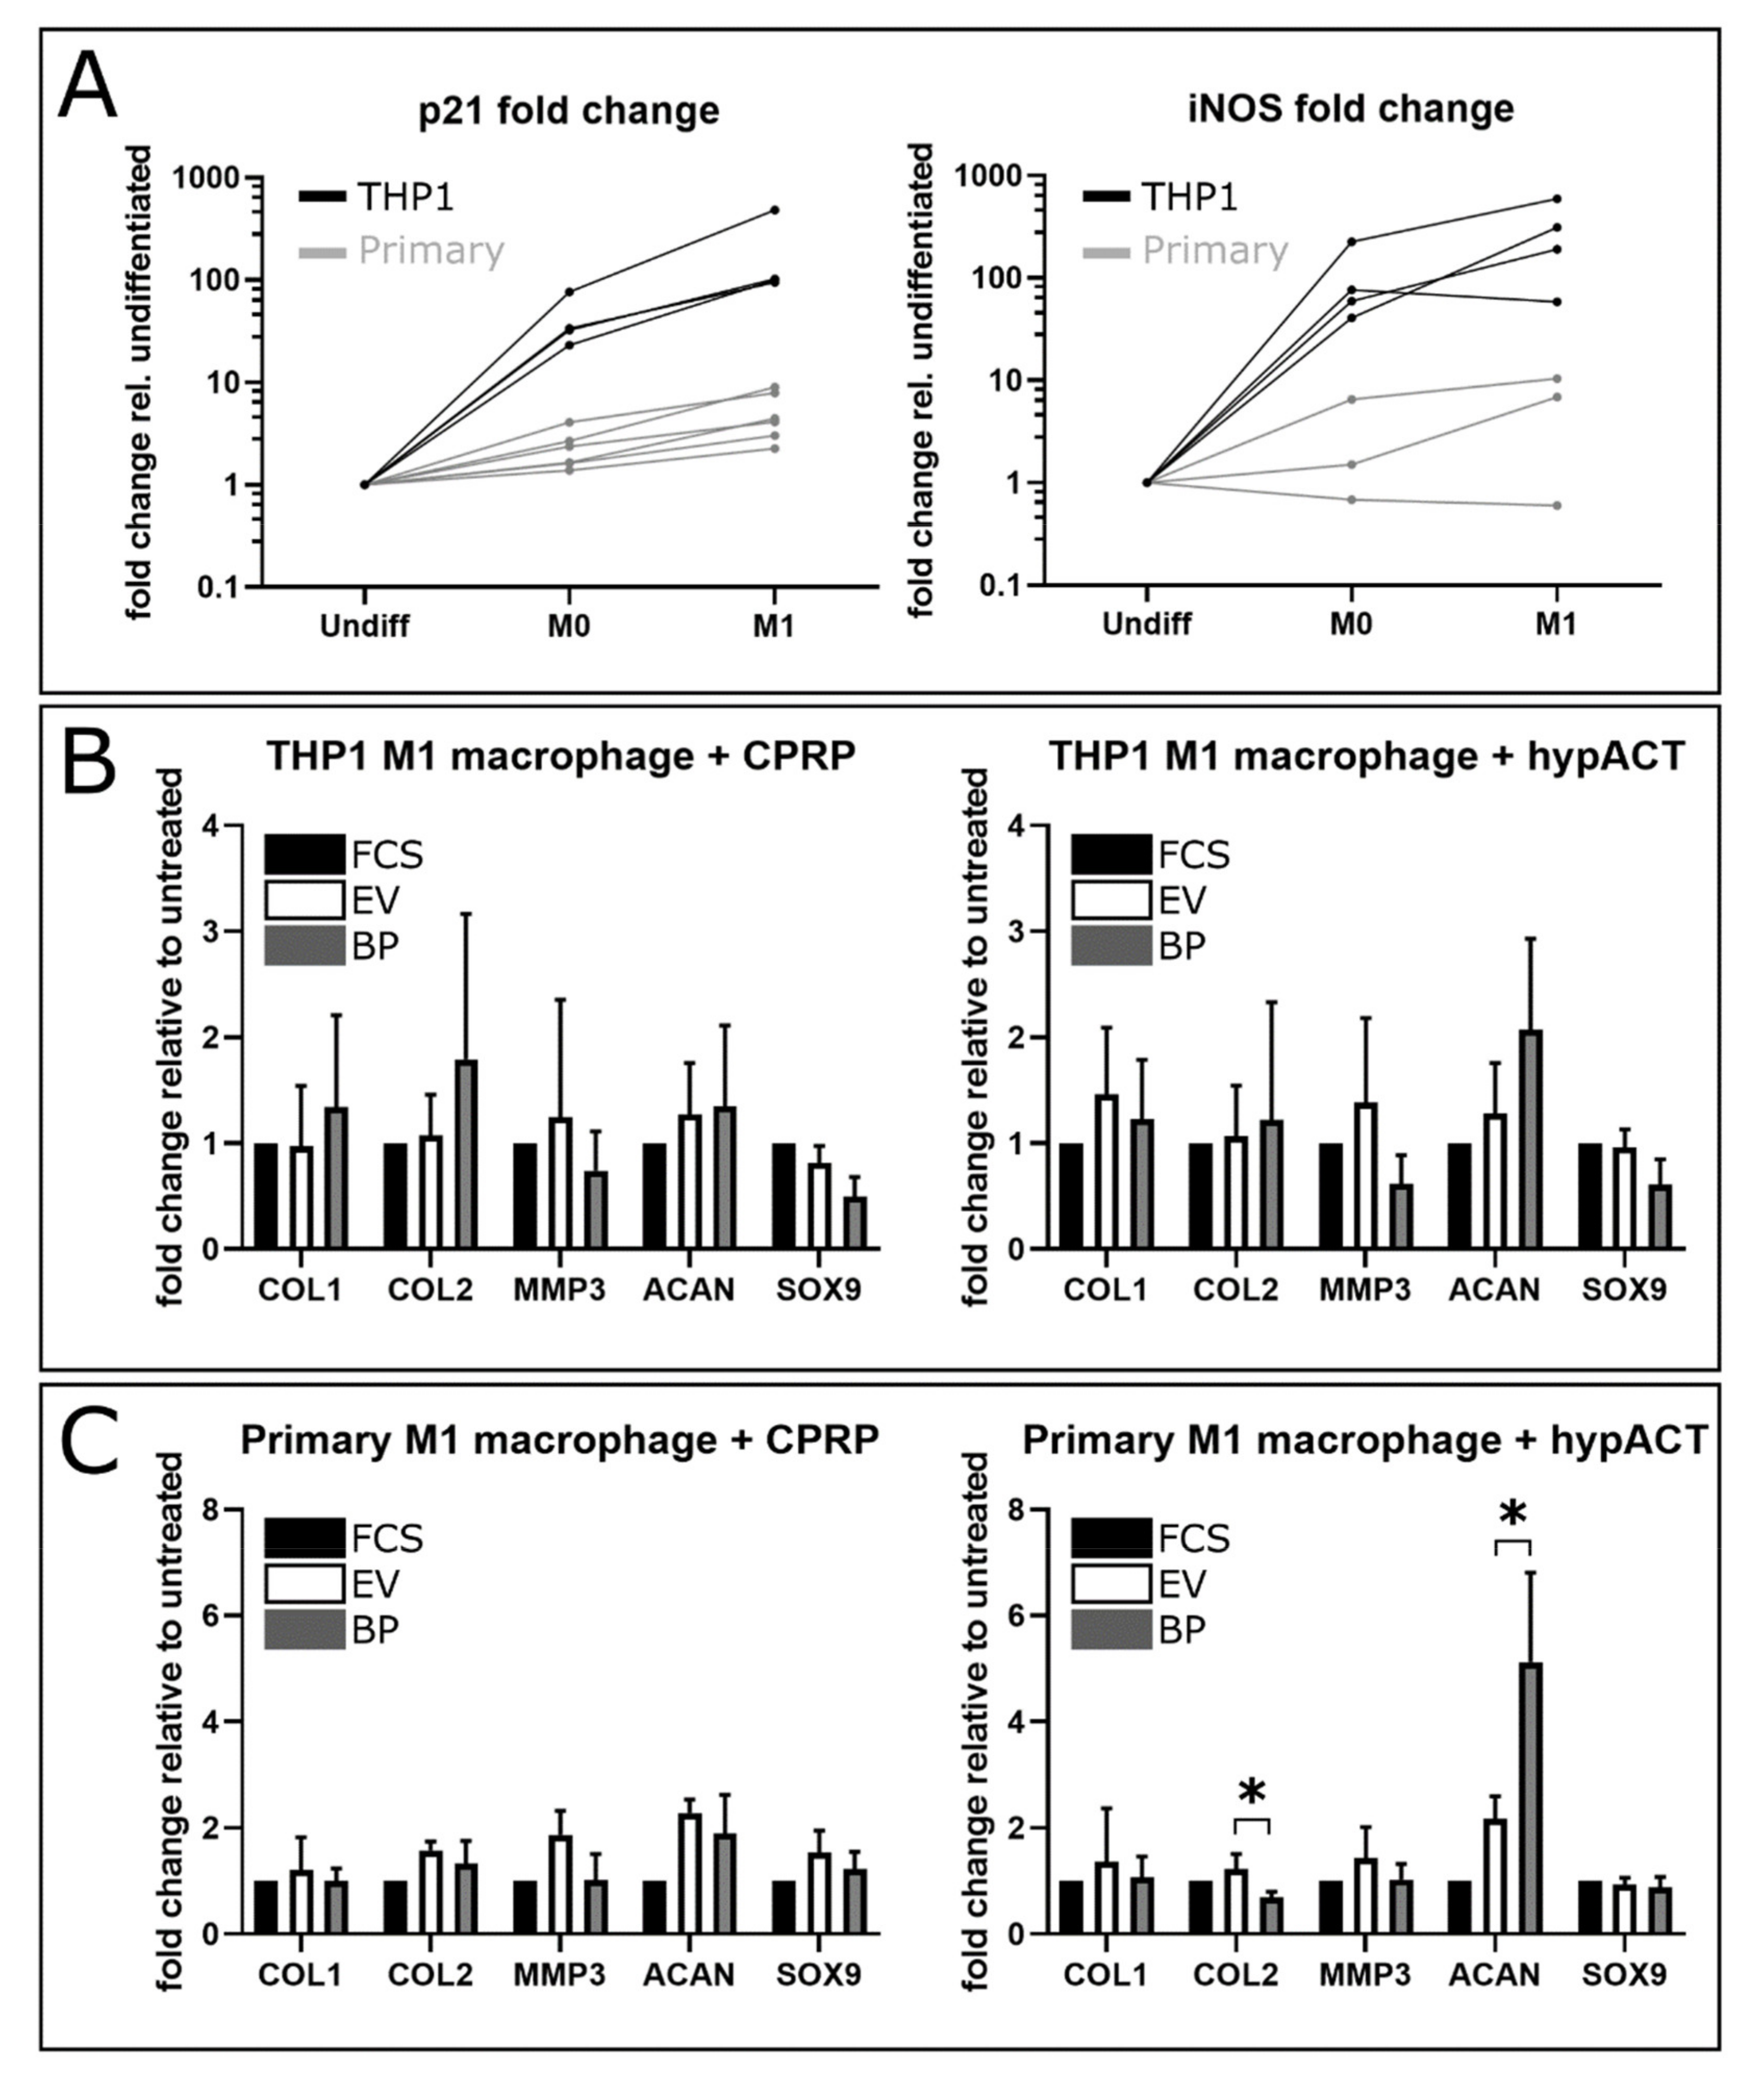
2. Results
2.1. Gene Expression Changes in Response to Blood Product or EV Supplementation
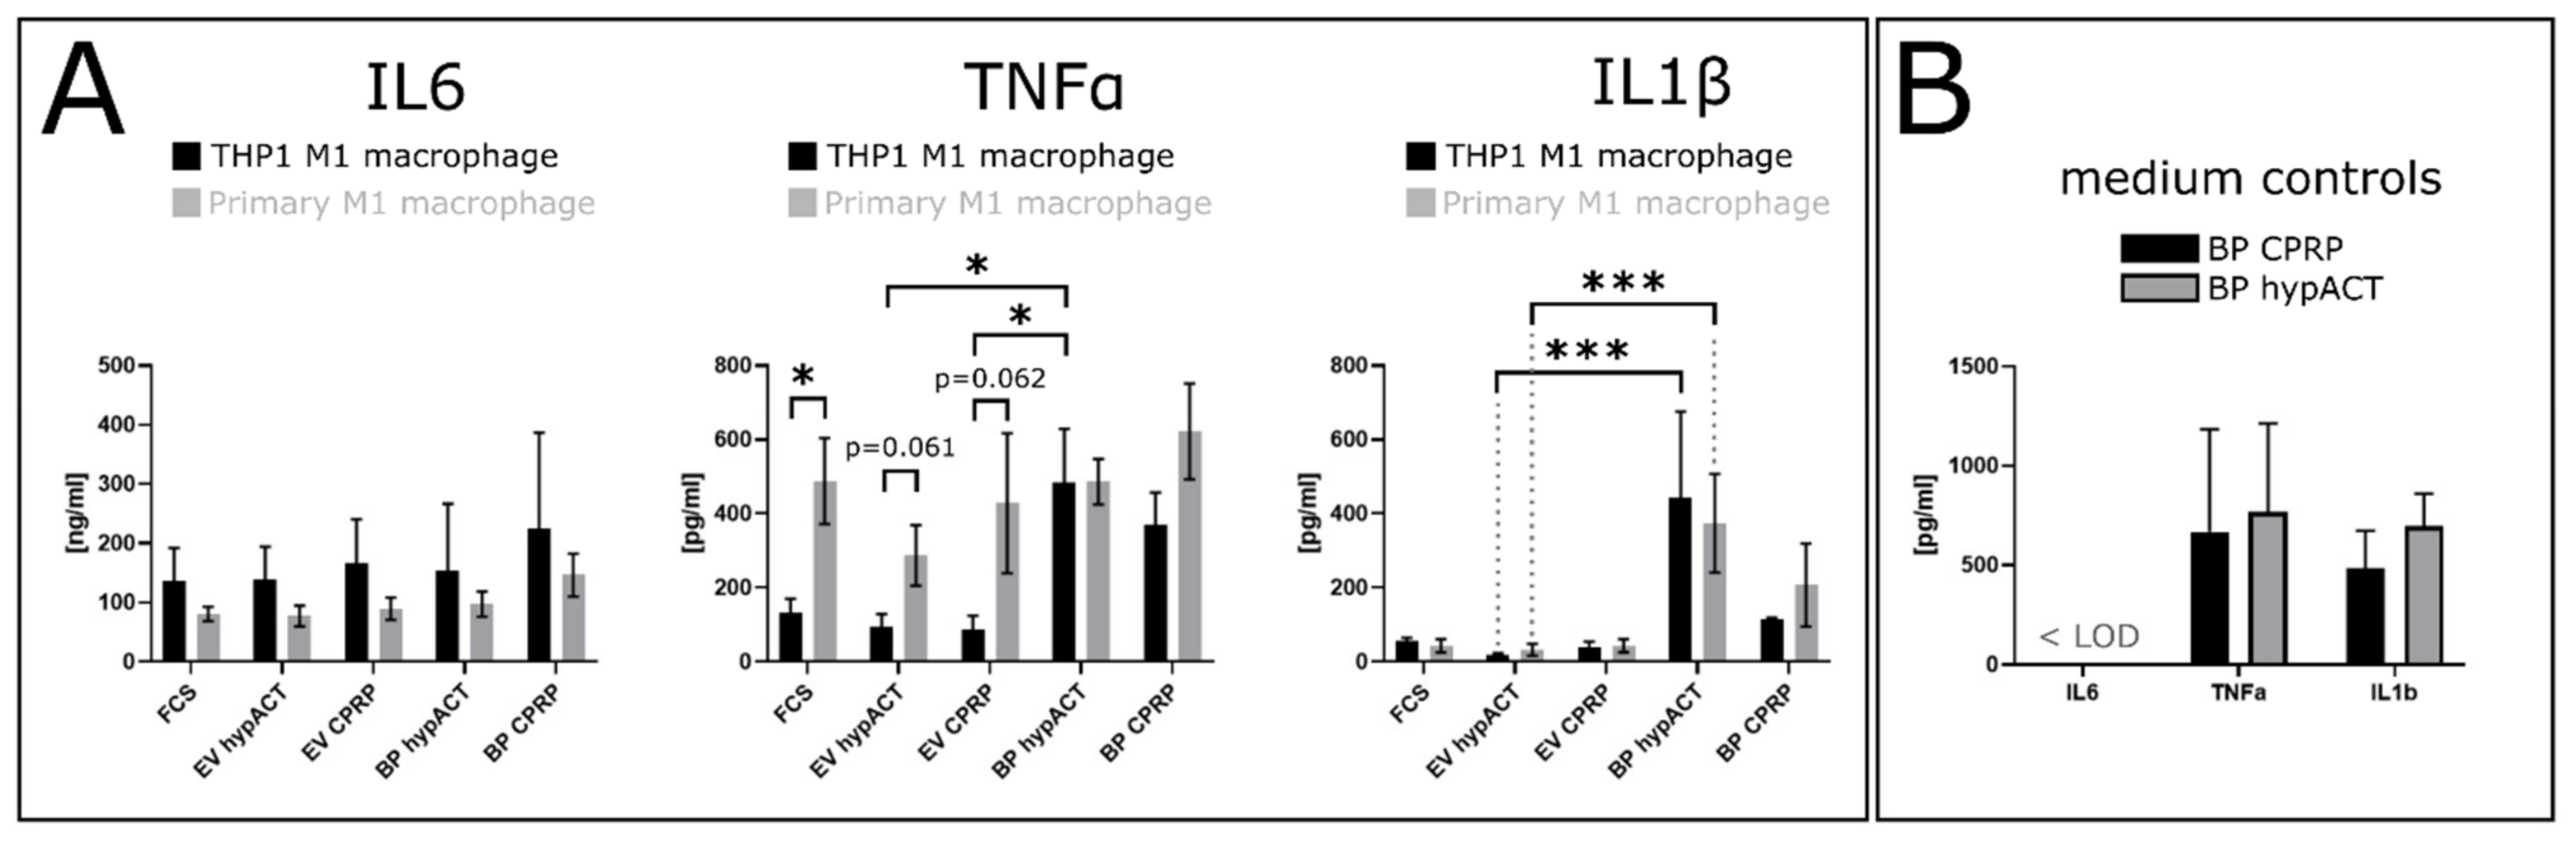
2.2. EV Supplementation Modulates Cytokine Levels
3. Discussion
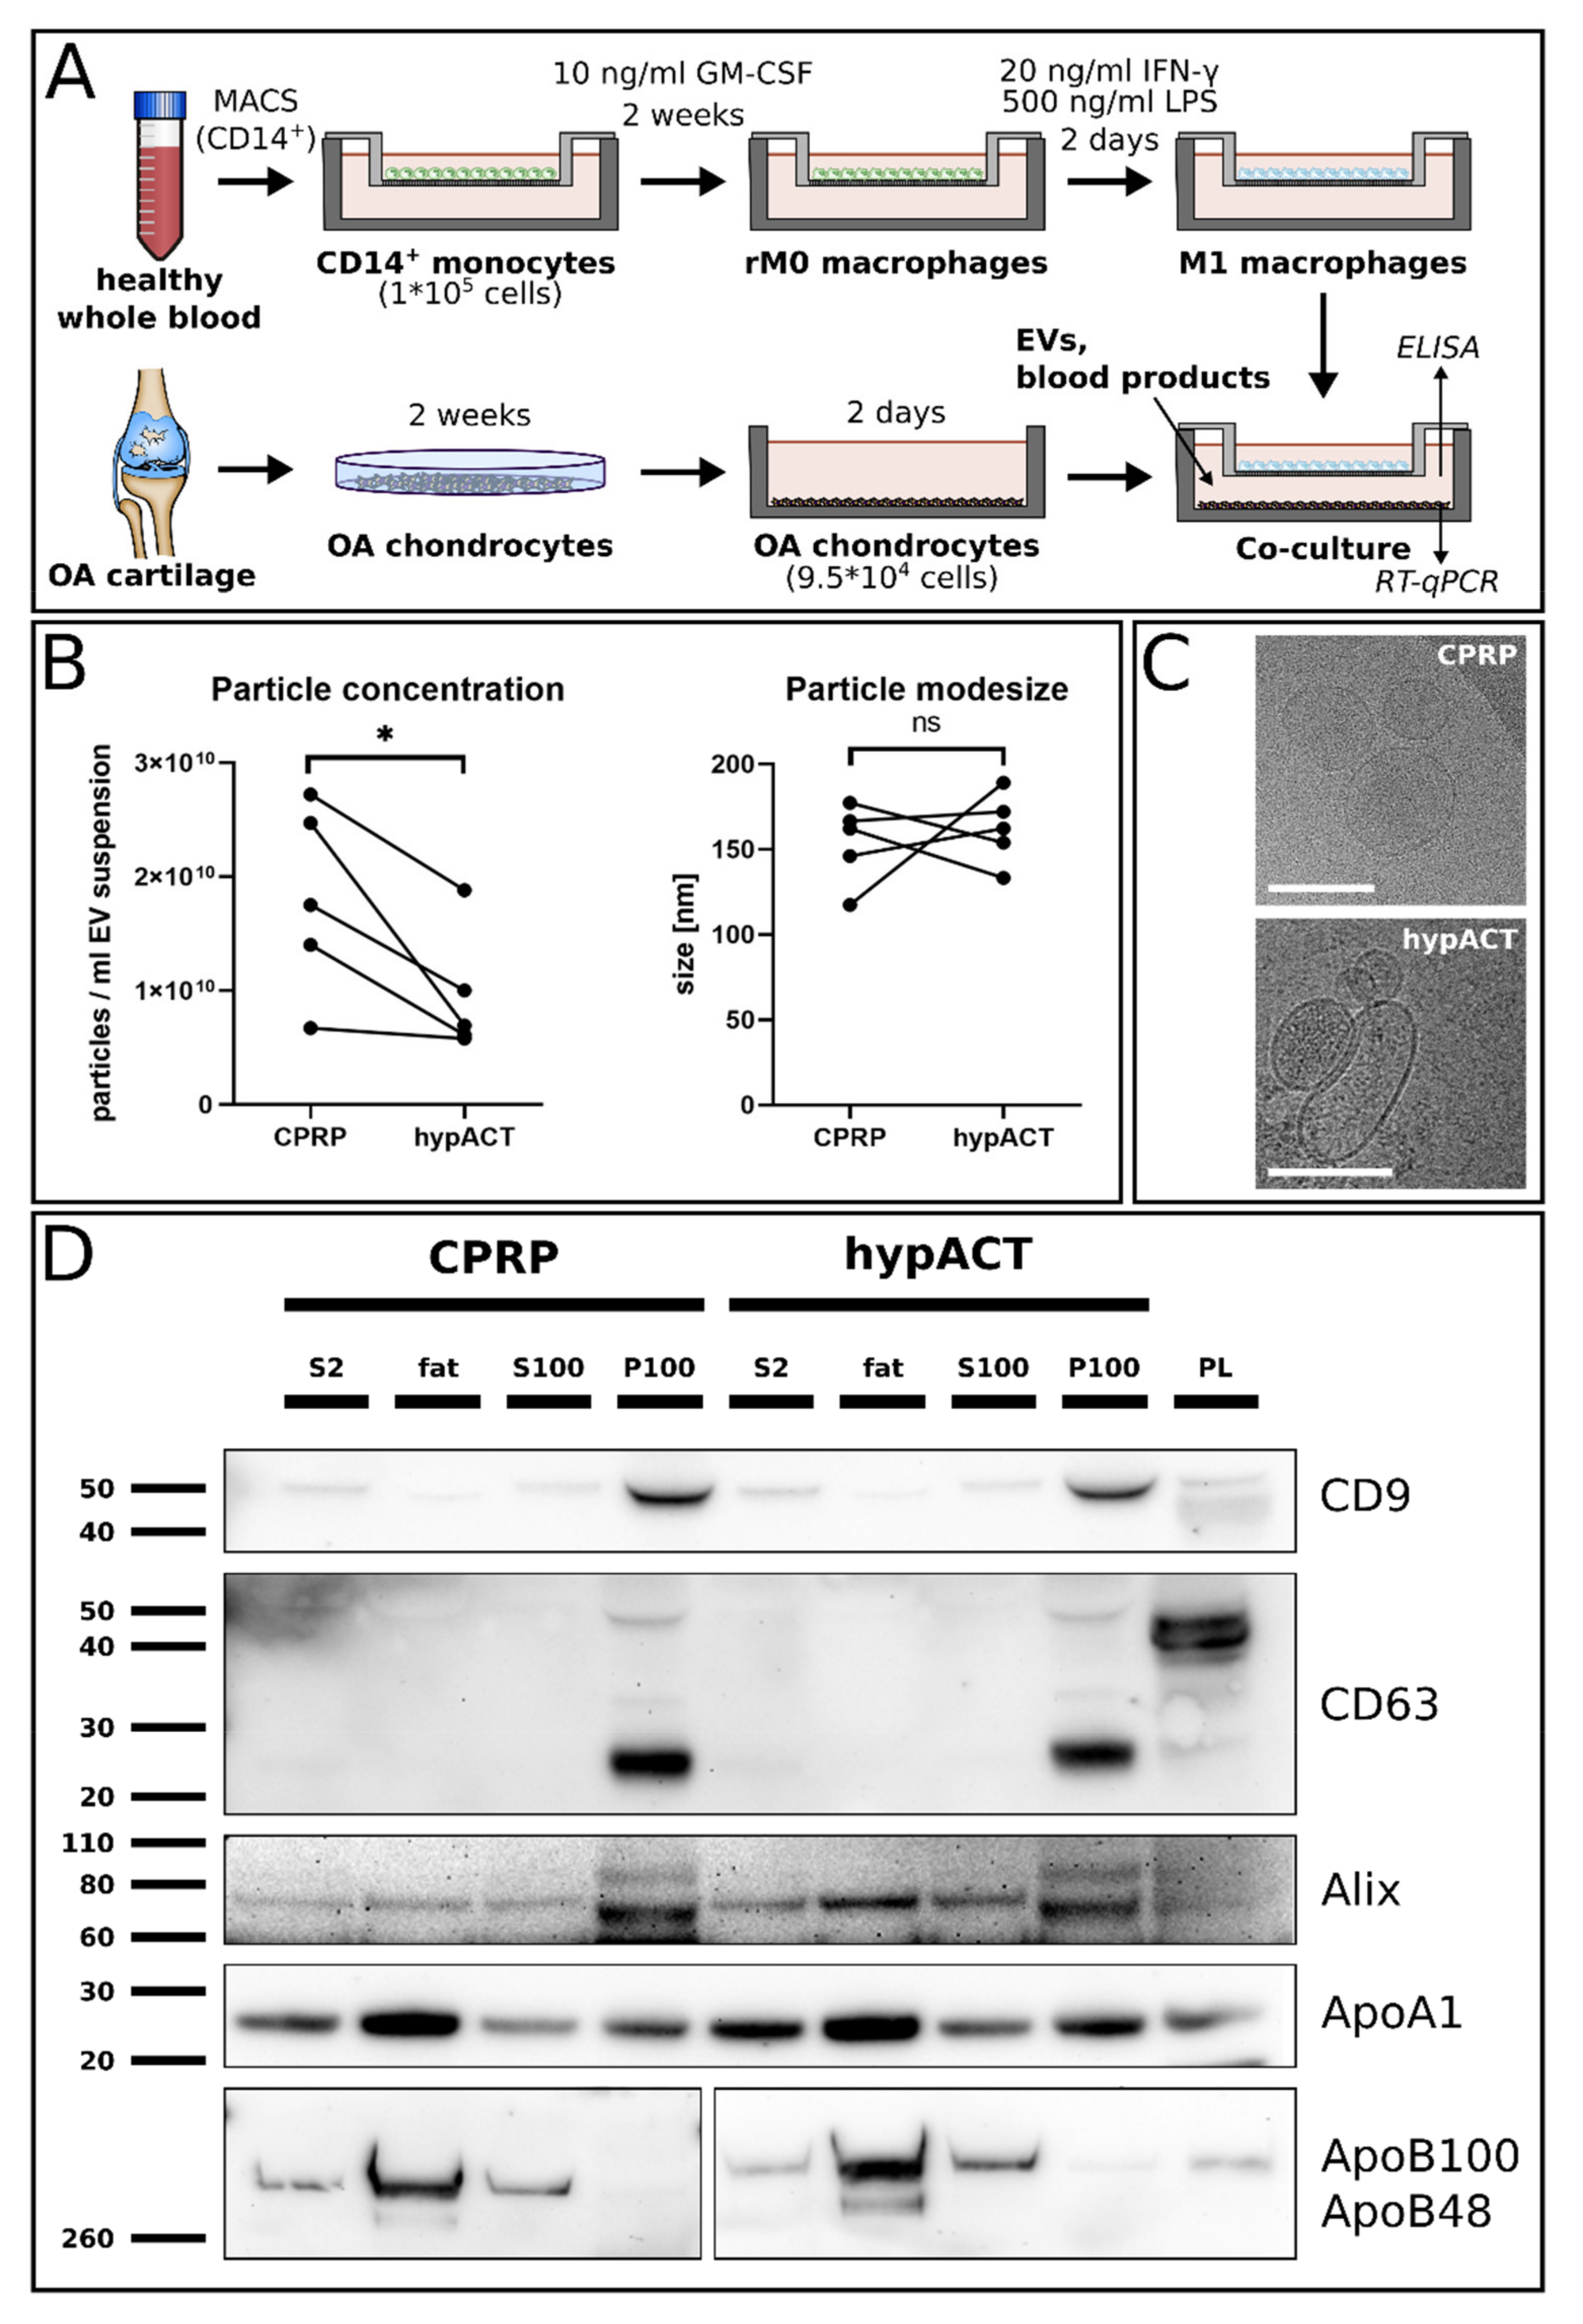
4. Materials and Methods
4.1. Preparation of PRP and hypACT
4.2. Enrichment of Extracellular Vesicles
4.3. Nanoparticle Tracking Analysis (NTA)
4.4. Cryo-Electron Microscopy
4.5. Western Blot Analysis
4.6. Isolation of Patient-Derived Osteoarthritic (OA) Chondrocytes
4.7. Isolation of CD14+ Primary Monocytes
4.8. Differentiation of CD14+ Primary Monocytes into M1 Macrophages
4.9. Co-Cultivation of Osteoarthritic Chondrocytes and M1 Macrophages
4.10. RNA Extraction and Reverse Transcription Quantitative PCR (RT-qPCR)
4.11. Enzyme-Linked Immunosorbent Assay (ELISA)
4.12. Statistical Analysis
5. Conclusions
Supplementary Materials
Author Contributions
Funding
Institutional Review Board Statement
Informed Consent Statement
Data Availability Statement
Acknowledgments
Conflicts of Interest
References
- Pourakbari, R.; Khodadadi, M.; Aghebati-Maleki, A.; Yousefi, M. The potential of exosomes in the therapy of the cartilage and bone complications; emphasis on osteoarthritis. Life Sci. 2019, 236, 116861. [Google Scholar] [CrossRef]
- Chaganti, R.K.; Lane, N.E. Risk factors for incident osteoarthritis of the hip and knee. Curr. Rev. Musculoskelet. Med. 2011, 4, 99–104. [Google Scholar] [CrossRef] [PubMed] [Green Version]
- Prieto-Alhambra, D.; Judge, A.; Javaid, M.; Cooper, C.; Diez-Perez, A.; Arden, N.K. Incidence and risk factors for clinically diagnosed knee, hip and hand osteoarthritis: Influences of age, gender and osteoarthritis affecting other joints. Ann. Rheum. Dis. 2014, 73, 1659–1664. [Google Scholar] [CrossRef] [Green Version]
- Gao, T.; Guo, W.; Chen, M.; Huang, J.; Yuan, Z.; Zhang, Y.; Wang, M.; Li, P.; Peng, J.; Wang, A.; et al. Extracellular Vesicles and Autophagy in Osteoarthritis. BioMed. Res. Int. 2016, 2016, 2428915. [Google Scholar] [CrossRef]
- Nakata, K.; Ono, K.; Miyazaki, J.; Olsen, B.R.; Muragaki, Y.; Adachi, E.; Yamamura, K.; Kimura, T. Osteoarthritis associated with mild chondrodysplasia in transgenic mice expressing alpha 1(IX) collagen chains with a central deletion. Proc. Natl. Acad. Sci. USA 1993, 90, 2870–2874. [Google Scholar] [CrossRef] [Green Version]
- Sandell, L.J.; Aigner, T. Articular cartilage and changes in arthritis. An introduction: Cell biology of osteoarthritis. Arthritis Res. 2001, 3, 107–113. [Google Scholar]
- Belluzzi, E.; Macchi, V.; Fontanella, C.G.; Carniel, E.L.; Olivotto, E.; Filardo, G.; Sarasin, G.; Porzionato, A.; Granzotto, M.; Pozzuoli, A.; et al. Infrapatellar Fat Pad Gene Expression and Protein Production in Patients with and without Osteoarthritis. Int. J. Mol. Sci. 2020, 21, 6016. [Google Scholar] [CrossRef]
- Tsujii, A.; Nakamura, N.; Horibe, S. Age-related changes in the knee meniscus. Knee 2017, 24, 1262–1270. [Google Scholar] [CrossRef] [PubMed]
- Kardos, D.; Marschall, B.; Simon, M.; Hornyák, I.; Hinsenkamp, A.; Kuten, O.; Gyevnár, Z.; Erdélyi, G.; Bárdos, T.; Paukovits, T.M.; et al. Investigation of Cytokine Changes in Osteoarthritic Knee Joint Tissues in Response to Hyperacute Serum Treatment. Cells 2019, 8, 824. [Google Scholar] [CrossRef] [PubMed] [Green Version]
- Bondeson, J.; Wainwright, S.D.; Lauder, S.; Amos, N.; Hughes, C.E.; Caterso, B.; Van den Berg, W.B. The role of synovial macrophages and macrophage-produced mediators in driving inflammatory and destructive responses in osteoarthritis. Arthritis Rheum. 2010, 62, 647–657. [Google Scholar] [CrossRef] [Green Version]
- Aigner, T.; McKeen, L.; Zien, A.; Fan, Z.; Gebhard, P.M.; Zimmer, R. Gene expression profiling of serum- and interleukin-1 beta-stimulated primary human adult articular chondrocytes—A molecular analysis based on chondrocytes isolated from one donor. Cytokine 2005, 31, 227–240. [Google Scholar] [CrossRef]
- Guerne, P.A.; Carson, D.A.; Lotz, M. IL-6 production by human articular chondrocytes. Modulation of its synthesis by cytokines, growth factors, and hormones in vitro. J. Immunol. 1990, 144, 499–505. [Google Scholar]
- Lotz, M.; Terkeltaub, R.; Villiger, P.M. Cartilage and joint inflammation. Regulation of IL-8 expression by human articular chondrocytes. J. Immunol. 1992, 148, 466–473. [Google Scholar]
- Verma, P.; Dalal, K. ADAMTS-4 and ADAMTS-5: Key enzymes in osteoarthritis. J. Cell Biochem. 2011, 112, 3507–3514. [Google Scholar] [CrossRef] [PubMed]
- Lefebvre, V.; Peeters-Joris, C.; Vaes, G. Modulation by interleukin 1 and tumor necrosis factor alpha of production of collagenase, tissue inhibitor of metalloproteinases and collagen types in differentiated and dedifferentiated articular chondrocytes. Biochim. Biophys. Acta Moll. Cell Res. 1990, 1052, 366–378. [Google Scholar] [CrossRef]
- Xue, J.; Wang, J.; Liu, Q.; Luo, A. Tumor necrosis factor-alpha induces ADAMTS-4 expression in human osteoarthritis chondrocytes. Mol. Med. Rep. 2013, 8, 1755–1760. [Google Scholar] [CrossRef]
- Kolasinski, S.L.; Neogi, T.; Hochberg, M.C.; Oatis, C.; Guyatt, G.; Block, J.; Callahan, L.; Copenhaver, C.; Dodge, C.; Felson, D.; et al. 2019 American College of Rheumatology/Arthritis Foundation Guideline for the Management of Osteoarthritis of the Hand, Hip, and Knee. Arthritis Care Res. 2020, 72, 149–162. [Google Scholar] [CrossRef]
- Diekman, B.O.; Guilak, F. Stem cell-based therapies for osteoarthritis: Challenges and opportunities. Curr. Opin. Rheumatol. 2013, 25, 119–126. [Google Scholar] [CrossRef] [PubMed]
- Steinhaus, M.E.; Christ, A.B.; Cross, M.B. Total Knee Arthroplasty for Knee Osteoarthritis: Support for a Foregone Conclusion? HSS J.® 2017, 13, 207–210. [Google Scholar] [CrossRef]
- Kellgren, J.H.; Lawrence, J.S. Radiological Assessment of Osteo-Arthrosis. Ann. Rheum. Dis. 1957, 16, 494–502. [Google Scholar] [CrossRef] [Green Version]
- Primorac, D.; Molnar, V.; Matišić, V.; Hudetz, D.; Jeleč, Ž; Rod., E.; Čukelj, F.; Vidović, D.; Vrdoljak, T.; Dobričik, B.; et al. Comprehensive Review of Knee Osteoarthritis Pharmacological Treatment and the Latest Professional Societies’ Guidelines. Pharmaceuticals 2021, 14, 205. [Google Scholar] [CrossRef]
- Archbold, P.; Paillot, J.L.; Neyret, P.; Butcher, C. Surgical Indications in the Treatment of Osteoarthritis. In Surgery of the Knee; Neyret, P., Butcher, C., Demey, G., Eds.; Springer International Publishing: Cham, Switzerland, 2020; pp. 139–145. [Google Scholar]
- Fotouhi, A.; Maleki, A.; Dolati, S.; Aghebati-Maleki, A. Platelet rich plasma, stromal vascular fraction and autologous conditioned serum in treatment of knee osteoarthritis. Biomed. Pharmacother. 2018, 104, 652–660. [Google Scholar] [CrossRef]
- Le, A.D.K.; Enweze, L.; DeBaun, M.R.; Dragoo, J.L. Current Clinical Recommendations for Use of Platelet-Rich Plasma. Curr. Rev. Musculoskelet. Med. 2018, 11, 624–634. [Google Scholar] [CrossRef]
- Amable, P.R.; Bizon Vieira Carias, R.; Vinicius Telles Teixeira, M.; da Cruz Pacheco, Í.; Farrias Corrêa do Amaral, R.J.; Granjeiro, J.M.; Borojevic, R. Platelet-rich plasma preparation for regenerative medicine: Optimization and quantification of cytokines and growth factors. Stem Cell Res. Ther. 2013, 4, 67. [Google Scholar] [CrossRef] [Green Version]
- Prakash, S.; Thakur, A. Platelet concentrates: Past, present and future. J. Maxillofac. Oral Surg. 2011, 10, 45–49. [Google Scholar] [CrossRef] [Green Version]
- Masuki, H.; Okudera, T.; Watanabe, T.; Suzuki, M.; Nishiyama, K.; Okudera, H.; Nakata, K.; Uematsu, K.; Su, C.-Y.; Kawase, T. Growth factor and pro-inflammatory cytokine contents in platelet-rich plasma (PRP), plasma rich in growth factors (PRGF), advanced platelet-rich fibrin (A-PRF), and concentrated growth factors (CGF). Int. J. Implant. Dent. 2016, 2, 19. [Google Scholar] [CrossRef] [PubMed] [Green Version]
- El-Sharkawy, H.; Kantarci, A.; Deady, J.; Hasturk, H.; Liu, H.; Alshahat, M.; Van Dyke, T.E. Platelet-rich plasma: Growth factors and pro-and anti-inflammatory properties. J. Periodontol. 2007, 78, 661–669. [Google Scholar] [CrossRef] [PubMed] [Green Version]
- Boswell, S.G.; Cole, B.J.; Sundman, E.A.; Karas, V.; Fortier, L.A. Platelet-rich plasma: A milieu of bioactive factors. J. Arthrosc. Relat. Surg. 2012, 28, 429–439. [Google Scholar] [CrossRef] [PubMed]
- Akeda, K.; An, H.; Okuma, M.; Attawia, M.; Miyamoto, K.; Thonar, E.-M.; Lenz, M.; Sah, R.; Masuda, K. Platelet-rich plasma stimulates porcine articular chondrocyte proliferation and matrix biosynthesis. Osteoarthr. Cartil. 2006, 14, 1272–1280. [Google Scholar] [CrossRef] [Green Version]
- Pereira, R.C.; Scaranari, M.; Benelli, R.; Strada, P.; Reis, R.L.; Cancedda, R.; Gentili, C. Dual effect of platelet lysate on human articular cartilage: A maintenance of chondrogenic potential and a transient proinflammatory activity followed by an inflammation resolution. Tissue Eng. Part A 2013, 19, 1476–1488. [Google Scholar] [CrossRef]
- Sundman, E.A.; Cole, B.J.; Fortier, L.A. Growth factor and catabolic cytokine concentrations are influenced by the cellular composition of platelet-rich plasma. Am. J. Sports Med. 2011, 39, 2135–2140. [Google Scholar] [CrossRef] [PubMed]
- Wu, C.-C.; Chen, W.-H.; Zao, B.; Lai, P.-L.; Lin, T.-C.; Lo, H.-Y.; Shieh, Y.-H.; Wu, C.-H.; Deng, W.-P. Regenerative potentials of platelet-rich plasma enhanced by collagen in retrieving pro-inflammatory cytokine-inhibited chondrogenesis. Biomaterials 2011, 32, 5847–5854. [Google Scholar] [CrossRef] [PubMed]
- Filardo, G.; Previtali, D.; Napoli, F.; Candrian, C.; Zaffagnini, S.; Grassi, A. PRP Injections for the Treatment of Knee Osteoarthritis: A Meta-Analysis of Randomized Controlled Trials. Cartilage 2020, 194760352093117. [Google Scholar] [CrossRef] [PubMed]
- Gato-Calvo, L.; Magalhães, J.; Ruiz-Romero, C.; Blanco, F.J.; Burguera, E.F. Platelet-rich plasma in osteoarthritis treatment: Review of current evidence. Ther. Adv. Chronic Dis. 2019, 10, 2040622319825567. [Google Scholar] [CrossRef] [PubMed] [Green Version]
- Oudelaar, B.W.; Peerbooms, J.C.; Huis in ‘t Veld, R.; Vochteloo, A.J.H. Concentrations of Blood Components in Commercial Platelet-Rich Plasma Separation Systems: A Review of the Literature. Am. J. Sports Med. 2019, 47, 479–487. [Google Scholar] [CrossRef]
- Kardos, D.; Simon, M.; Vácz, G.; Hinsenkamp, A.; Holczer, T.; Cseh, D.; Sárközi, A.; Szenthe, K.; Bánáti, F.; Szathmary, S.; et al. The Composition of Hyperacute Serum and Platelet-Rich Plasma Is Markedly Different despite the Similar Production Method. Int. J. Mol. Sci. 2019, 20, 721. [Google Scholar] [CrossRef] [PubMed] [Green Version]
- Golebiewska, E.M.; Poole, A.W. Platelet secretion: From haemostasis to wound healing and beyond. Blood Rev. 2015, 29, 153–162. [Google Scholar] [CrossRef] [Green Version]
- Colombo, M.; Raposo, G.; Théry, C. Biogenesis, Secretion, and Intercellular Interactions of Exosomes and Other Extracellular Vesicles. Annu. Rev. Cell Dev. Biol. 2014, 30, 255–289. [Google Scholar] [CrossRef]
- Yáñez-Mó, M.; Siljander, P.R.-M.; Andreu, Z.; Zavec, A.B.; Borràs, F.E.; Buzas, E.I.; Buzas, K.; Casal, E.; Cappello, F.; Carvalho, J.; et al. Biological properties of extracellular vesicles and their physiological functions. J. Extracell. Vesicles 2015, 4, 27066. [Google Scholar] [CrossRef] [Green Version]
- Hock, A.; Miyake, H.; Li, B.; Lee, C.; Ermini, L.; Koike, Y.; Chen, Y.; Määttänen, P.; Zani, A.; Pierro, A. Breast milk-derived exosomes promote intestinal epithelial cell growth. J. Pediatr. Surg. 2017, 52, 755–759. [Google Scholar] [CrossRef]
- Katsiougiannis, S.; Chia, D.; Kim, Y.; Singh, R.P.; Wong, D.T.W. Saliva exosomes from pancreatic tumor-bearing mice modulate NK cell phenotype and antitumor cytotoxicity. FASEB J. 2017, 31, 998–1010. [Google Scholar] [CrossRef] [PubMed] [Green Version]
- Lamichhane, T.N.; Sokic, S.; Schardt, J.S.; Raiker, R.S.; Lin, J.W.; Jay, S.M. Emerging roles for extracellular vesicles in tissue engineering and regenerative medicine. Tissue Eng. Part B Rev. 2015, 21, 45–54. [Google Scholar] [CrossRef] [PubMed] [Green Version]
- Sampey, G.C.; Saifuddin, M.; Schwab, A.; Barclay, R.; Punya, S.; Chung, M.-C.; Hakami, R.M.; Zadeh, M.A.; Lepene, B.; Klase, Z.A.; et al. Exosomes from HIV-1-infected Cells Stimulate Production of Pro-inflammatory Cytokines through Trans-activating Response (TAR) RNA. J. Biol. Chem. 2016, 291, 1251–1266. [Google Scholar] [CrossRef] [Green Version]
- Moreno-Gonzalo, O.; Delgado, I.F.; Sanchez-Madrid, F. Post-translational add-ons mark the path in exosomal protein sorting. Cell. Mol. Life Sci. 2017, 75, 1–19. [Google Scholar] [CrossRef] [PubMed] [Green Version]
- Théry, C.; Witwer, K.W.; Aikawa, E.; Alcaraz, M.J.; Anderson, J.D.; Andriantsitohaina, R.; Antoniou, A.; Arab, T.; Archer, F.; Atkin-Smith, G.K.; et al. Minimal information for studies of extracellular vesicles 2018 (MISEV2018): A position statement of the International Society for Extracellular Vesicles and update of the MISEV2014 guidelines. J. Extracell. Vesicles 2018, 7, 1535750. [Google Scholar] [CrossRef] [PubMed] [Green Version]
- Xue, Q.; Yan, Y.; Zhang, R.; Xiong, H. Regulation of iNOS on Immune Cells and Its Role in Diseases. Int. J. Mol. Sci. 2018, 19, 3805. [Google Scholar] [CrossRef] [Green Version]
- Rackov, G.; Hernández-Jiménez, E.; Shokri, R.; Carmona-Rodríguez, L.; Mañes, S.; Álvarez-Mon, M.; López-Collazo, E.; Martȷnez, A.C.; Balomenos, D. p21 mediates macrophage reprogramming through regulation of p50-p50 NF-κB and IFN-β. J. Clin. Investig. 2016, 126, 3089–3103. [Google Scholar] [CrossRef]
- Samavedi, S.; Diaz-Rodriguez, P.; Erndt-Marino, J.D.; Hahn, M.S. A Three-Dimensional Chondrocyte-Macrophage Coculture System to Probe Inflammation in Experimental Osteoarthritis. Tissue Eng. Part A 2017, 23, 101–114. [Google Scholar] [CrossRef] [Green Version]
- Otahal, A.; Kramer, K.; Kuten-Pella, O.; Weiss, R.; Stotter, C.; Lacza, Z.; Weber, V.; Nehrer, S.; De Luna, A. Characterization and Chondroprotective Effects of Extracellular Vesicles From Plasma-and Serum-Based Autologous Blood-Derived Products for Osteoarthritis Therapy. Front. Bioeng. Biotechnol. 2020, 8, 584050. [Google Scholar] [CrossRef]
- Lv, M.; Zhou, Y.; Polson, S.W.; Wan, L.Q.; Wang, M.; Han, L.; Wang, L.; Lu, X.L. Identification of Chondrocyte Genes and Signaling Pathways in Response to Acute Joint Inflammation. Sci. Rep. 2019, 9, 93. [Google Scholar] [CrossRef]
- Fan, Z.; Söder, S.; Oehler, S.; Fundel, K.; Aigner, T. Activation of interleukin-1 signaling cascades in normal and osteoarthritic articular cartilage. Am. J. Pathol. 2007, 171, 938–946. [Google Scholar] [CrossRef] [Green Version]
- Vincenti, M.P.; Brinckerhoff, C.E. Early response genes induced in chondrocytes stimulated with the inflammatory cytokine interleukin-1beta. Arthritis Res. 2001, 3, 381. [Google Scholar] [CrossRef] [PubMed]
- Li, Y.-H.; Tavallaee, G.; Tokar, T.; Nakamura, A.; Sundararajan, K.; Weston, A.; Sharma, A.; Mahomed, N.; Gandhi, R.; Jurisica, I.; et al. Identification of synovial fluid microRNA signature in knee osteoarthritis: Differentiating early-and late-stage knee osteoarthritis. Osteoarthr. Cartil. 2016, 24, 1577–1586. [Google Scholar] [CrossRef] [PubMed] [Green Version]
- Song, J.; Kang, Y.; Chun, C.-H.; Jin, E.-J. Selective loading of exosomal HULC and miR-372 is responsible for chondrocyte death during OA pathogenesis. Anim. Cells Syst. 2017, 21, 397–403. [Google Scholar] [CrossRef]
- Wang, Y.; Zhao, M.; Liu, S.; Guo, J.; Lu, Y.; Cheng, J.; Liu, J. Macrophage-derived extracellular vesicles: Diverse mediators of pathology and therapeutics in multiple diseases. Cell Death Dis. 2020, 11, 924. [Google Scholar] [CrossRef]
- Théry, C.; Amigorena, S.; Raposo, G.; Clayton, A. Isolation and characterization of exosomes from cell culture supernatants and biological fluids. Curr. Protoc. Cell. Biol. 2006, 30, 3–22. [Google Scholar] [CrossRef]
- Sillat, T.; Barreto, G.; Clarijs, P.; Soininen, A.; Ainola, M.; Pajarinen, J.; Korhonen, M.; Konttinen, Y.T.; Sakalyte, R.; Hukkanen, M.; et al. Toll-like receptors in human chondrocytes and osteoarthritic cartilage. Acta Orthop. 2013, 84, 585–592. [Google Scholar] [CrossRef]
- Wang, Y.; Zhao, X.; Liu-Bryan, R. Role of TLR2 and TLR4 in regulation of articular chondrocyte homeostasis. Osteoarthr. Cartil. 2020, 28, 669–674. [Google Scholar] [CrossRef]
- Bobacz, K.; Sunk, I.G.; Hofstaetter, J.G.; Amoyo, L.; Toma, C.D.; Akira, S.; Weichhart, T.; Saemann, M.; Smolen, J.S. Toll-like receptors and chondrocytes: The lipopolysaccharide-induced decrease in cartilage matrix synthesis is dependent on the presence of toll-like receptor 4 and antagonized by bone morphogenetic protein 7. Arthritis Rheum. 2007, 56, 1880–1893. [Google Scholar] [CrossRef]
- Takov, K.; Yellon, D.M.; Davidson, S.M. Comparison of small extracellular vesicles isolated from plasma by ultracentrifugation or size-exclusion chromatography: Yield, purity and functional potential. J. Extracell. Vesicles 2019, 8, 1560809. [Google Scholar] [CrossRef]
- Karimi, N.; Cvjetkovic, A.; Jang, S.C.; Crescitelli, R.; Feizi, M.A.H.; Nieuwland, R.; Lötvall, J.; Lässer, C. Detailed analysis of the plasma extracellular vesicle proteome after separation from lipoproteins. Cell. Mol. Life Sci. 2018, 75, 2873–2886. [Google Scholar] [CrossRef] [PubMed] [Green Version]
- Palviainen, M.; Saraswat, M.; Varga, Z.; Kitka, D.; Neuvonen, M.; Puhka, M.; Joenväärä, S.; Renkonen, R.; Nieuwland, R.; Takatalo, M.; et al. Extracellular vesicles from human plasma and serum are carriers of extravesicular cargo-Implications for biomarker discovery. PLoS ONE 2020, 15, e0236439. [Google Scholar] [CrossRef] [PubMed]
- Pearson, M.J.; Herndler-Brandstetter, D.; Tariq, M.A.; Nicholson, T.A.; Philp, A.; Smith, H.L.; Davis, E.T.; Jones, S.; Lord, J.M. IL-6 secretion in osteoarthritis patients is mediated by chondrocyte-synovial fibroblast cross-talk and is enhanced by obesity. Sci. Rep. 2017, 7, 3451. [Google Scholar] [CrossRef] [PubMed] [Green Version]
- Dong, Y.; Drissi, H.; Chen, M.; Chen, D.; Zuscik, M.J.; Schwarz, E.M.; O’Keefe, R.J. Wnt-mediated regulation of chondrocyte maturation: Modulation by TGF-beta. J. Cell. Biochem. 2005, 95, 1057–1068. [Google Scholar] [CrossRef] [Green Version]
- Green, J.D.; Tollemar, V.; Dougherty, M.; Yan, Z.; Yin, L.; Ye, J.; Collier, Z.; Mohammed, M.K.; Haydon, R.C.; Luu, H.H.; et al. Multifaceted signaling regulators of chondrogenesis: Implications in cartilage regeneration and tissue engineering. Genes Dis. 2015, 2, 307–327. [Google Scholar] [CrossRef] [Green Version]
- Kuten, O.; Simon, M.; Hornyák, I.; De Luna-Preitschopf, A.; Nehrer, S.; Lacza, Z. The Effects of Hyperacute Serum on Adipogenesis and Cell Proliferation of Mesenchymal Stromal Cells. Tissue Eng. Part A 2018, 24, 1011–1021. [Google Scholar] [CrossRef]
- EV-TRACK Consortium; Van Deun, J.; Mestdagh, P.; Agostinis, P.; Akay, Ö.; Anand, S.; Anckaert, J.; Martinez, Z.A.; Baetens, T.; Beghein, E.; et al. EV-TRACK: Transparent reporting and centralizing knowledge in extracellular vesicle research. Nat. Methods 2017, 14, 228–232. [Google Scholar]
- Gardiner, C.; Ferreira, Y.J.; Dragovic, R.A.; Redman, C.W.; Sargent, I.L. Extracellular vesicle sizing and enumeration by nanoparticle tracking analysis. J. Extracell. Vesicles 2013, 2, 19671. [Google Scholar] [CrossRef]
- Mehdiani, A.; Maier, A.; Pinto, A.; Barth, M.; Akhyari, P.; Lichtenberg, A. An innovative method for exosome quantification and size measurement. J. Vis. Exp. 2015, 2015, e50974. [Google Scholar] [CrossRef] [Green Version]
- Otahal, A.; Kuten-Pella, O.; Kramer, K.; Neubauer, M.; Lacza, Z.; Nehrer, S.; De Luna, A. Functional repertoire of EV-associated miRNA profiles after lipoprotein depletion via ultracentrifugation and size exclusion chromatography from autologous blood products. Sci. Rep. 2021, 11, 5823. [Google Scholar] [CrossRef]
- De Luna-Preitschopf, A.; Zwickl, H.; Nehrer, S.; Hengstschläger, M.; Mikula, M. Rapamycin Maintains the Chondrocytic Phenotype and Interferes with Inflammatory Cytokine Induced Processes. Int. J. Mol. Sci. 2017, 18, 1494. [Google Scholar] [CrossRef] [PubMed] [Green Version]
- Bauer, C.; Niculescu-Morzsa, E.; Jeyakumar, V.; Kern, D.; Späth, S.S.; Nehrer, S. Chondroprotective effect of high-molecular-weight hyaluronic acid on osteoarthritic chondrocytes in a co-cultivation inflammation model with M1 macrophages. J. Inflamm. 2016, 13, 31. [Google Scholar] [CrossRef] [PubMed] [Green Version]
- Benjamini, Y.; Krieger, A.M.; Yekutieli, D. Adaptive linear step-up procedures that control the false discovery rate. Biometrika 2006, 93, 491–507. [Google Scholar] [CrossRef]


| Gene | F-Primer | R-Primer |
|---|---|---|
| SOX9 | tacccgcacttgcacaac | tctcgctctcgttcagaagtc |
| COL2 | gtgtcagggccaggatgt | tcccagtgtcacagacacagat |
| ACAN | cctccccttcacgtgtaaaa | gctccgcttctgtagtctgc |
| MMP3 | caaaacatatttctttgtagaggacaa | ttcagctatttgcttgggaaa |
| COL1 | gggattccctggacctaaag | ggaacacctcgctctccag |
| GAPDH | ctctgctcctcctgttcgac | acgaccaaatccgttgactc |
Publisher’s Note: MDPI stays neutral with regard to jurisdictional claims in published maps and institutional affiliations. |
© 2021 by the authors. Licensee MDPI, Basel, Switzerland. This article is an open access article distributed under the terms and conditions of the Creative Commons Attribution (CC BY) license (https://creativecommons.org/licenses/by/4.0/).
Share and Cite
Otahal, A.; Kramer, K.; Kuten-Pella, O.; Moser, L.B.; Neubauer, M.; Lacza, Z.; Nehrer, S.; De Luna, A. Effects of Extracellular Vesicles from Blood-Derived Products on Osteoarthritic Chondrocytes within an Inflammation Model. Int. J. Mol. Sci. 2021, 22, 7224. https://0-doi-org.brum.beds.ac.uk/10.3390/ijms22137224
Otahal A, Kramer K, Kuten-Pella O, Moser LB, Neubauer M, Lacza Z, Nehrer S, De Luna A. Effects of Extracellular Vesicles from Blood-Derived Products on Osteoarthritic Chondrocytes within an Inflammation Model. International Journal of Molecular Sciences. 2021; 22(13):7224. https://0-doi-org.brum.beds.ac.uk/10.3390/ijms22137224
Chicago/Turabian StyleOtahal, Alexander, Karina Kramer, Olga Kuten-Pella, Lukas B. Moser, Markus Neubauer, Zsombor Lacza, Stefan Nehrer, and Andrea De Luna. 2021. "Effects of Extracellular Vesicles from Blood-Derived Products on Osteoarthritic Chondrocytes within an Inflammation Model" International Journal of Molecular Sciences 22, no. 13: 7224. https://0-doi-org.brum.beds.ac.uk/10.3390/ijms22137224