Author Contributions
Conceptualisation, E.A.-P., M.G. and A.K.; methodology, E.A.-P. and W.B.; software, W.B.; formal analysis, E.A.-P. and W.B.; investigation, E.A.-P., D.B., J.F., M.M., U.K., P.C., M.W., K.M., S.P., L.S., D.L.; data curation, W.B.; writing—original draft preparation, E.A.-P.; writing—review and editing, E.A.-P.; visualisation, E.A.-P. and W.B.; supervision, M.G. and A.K.; project administration, E.A.-P.; funding acquisition, E.A.-P., M.G. and A.K. All authors have read and agreed to the published version of the manuscript.
Figure 1.
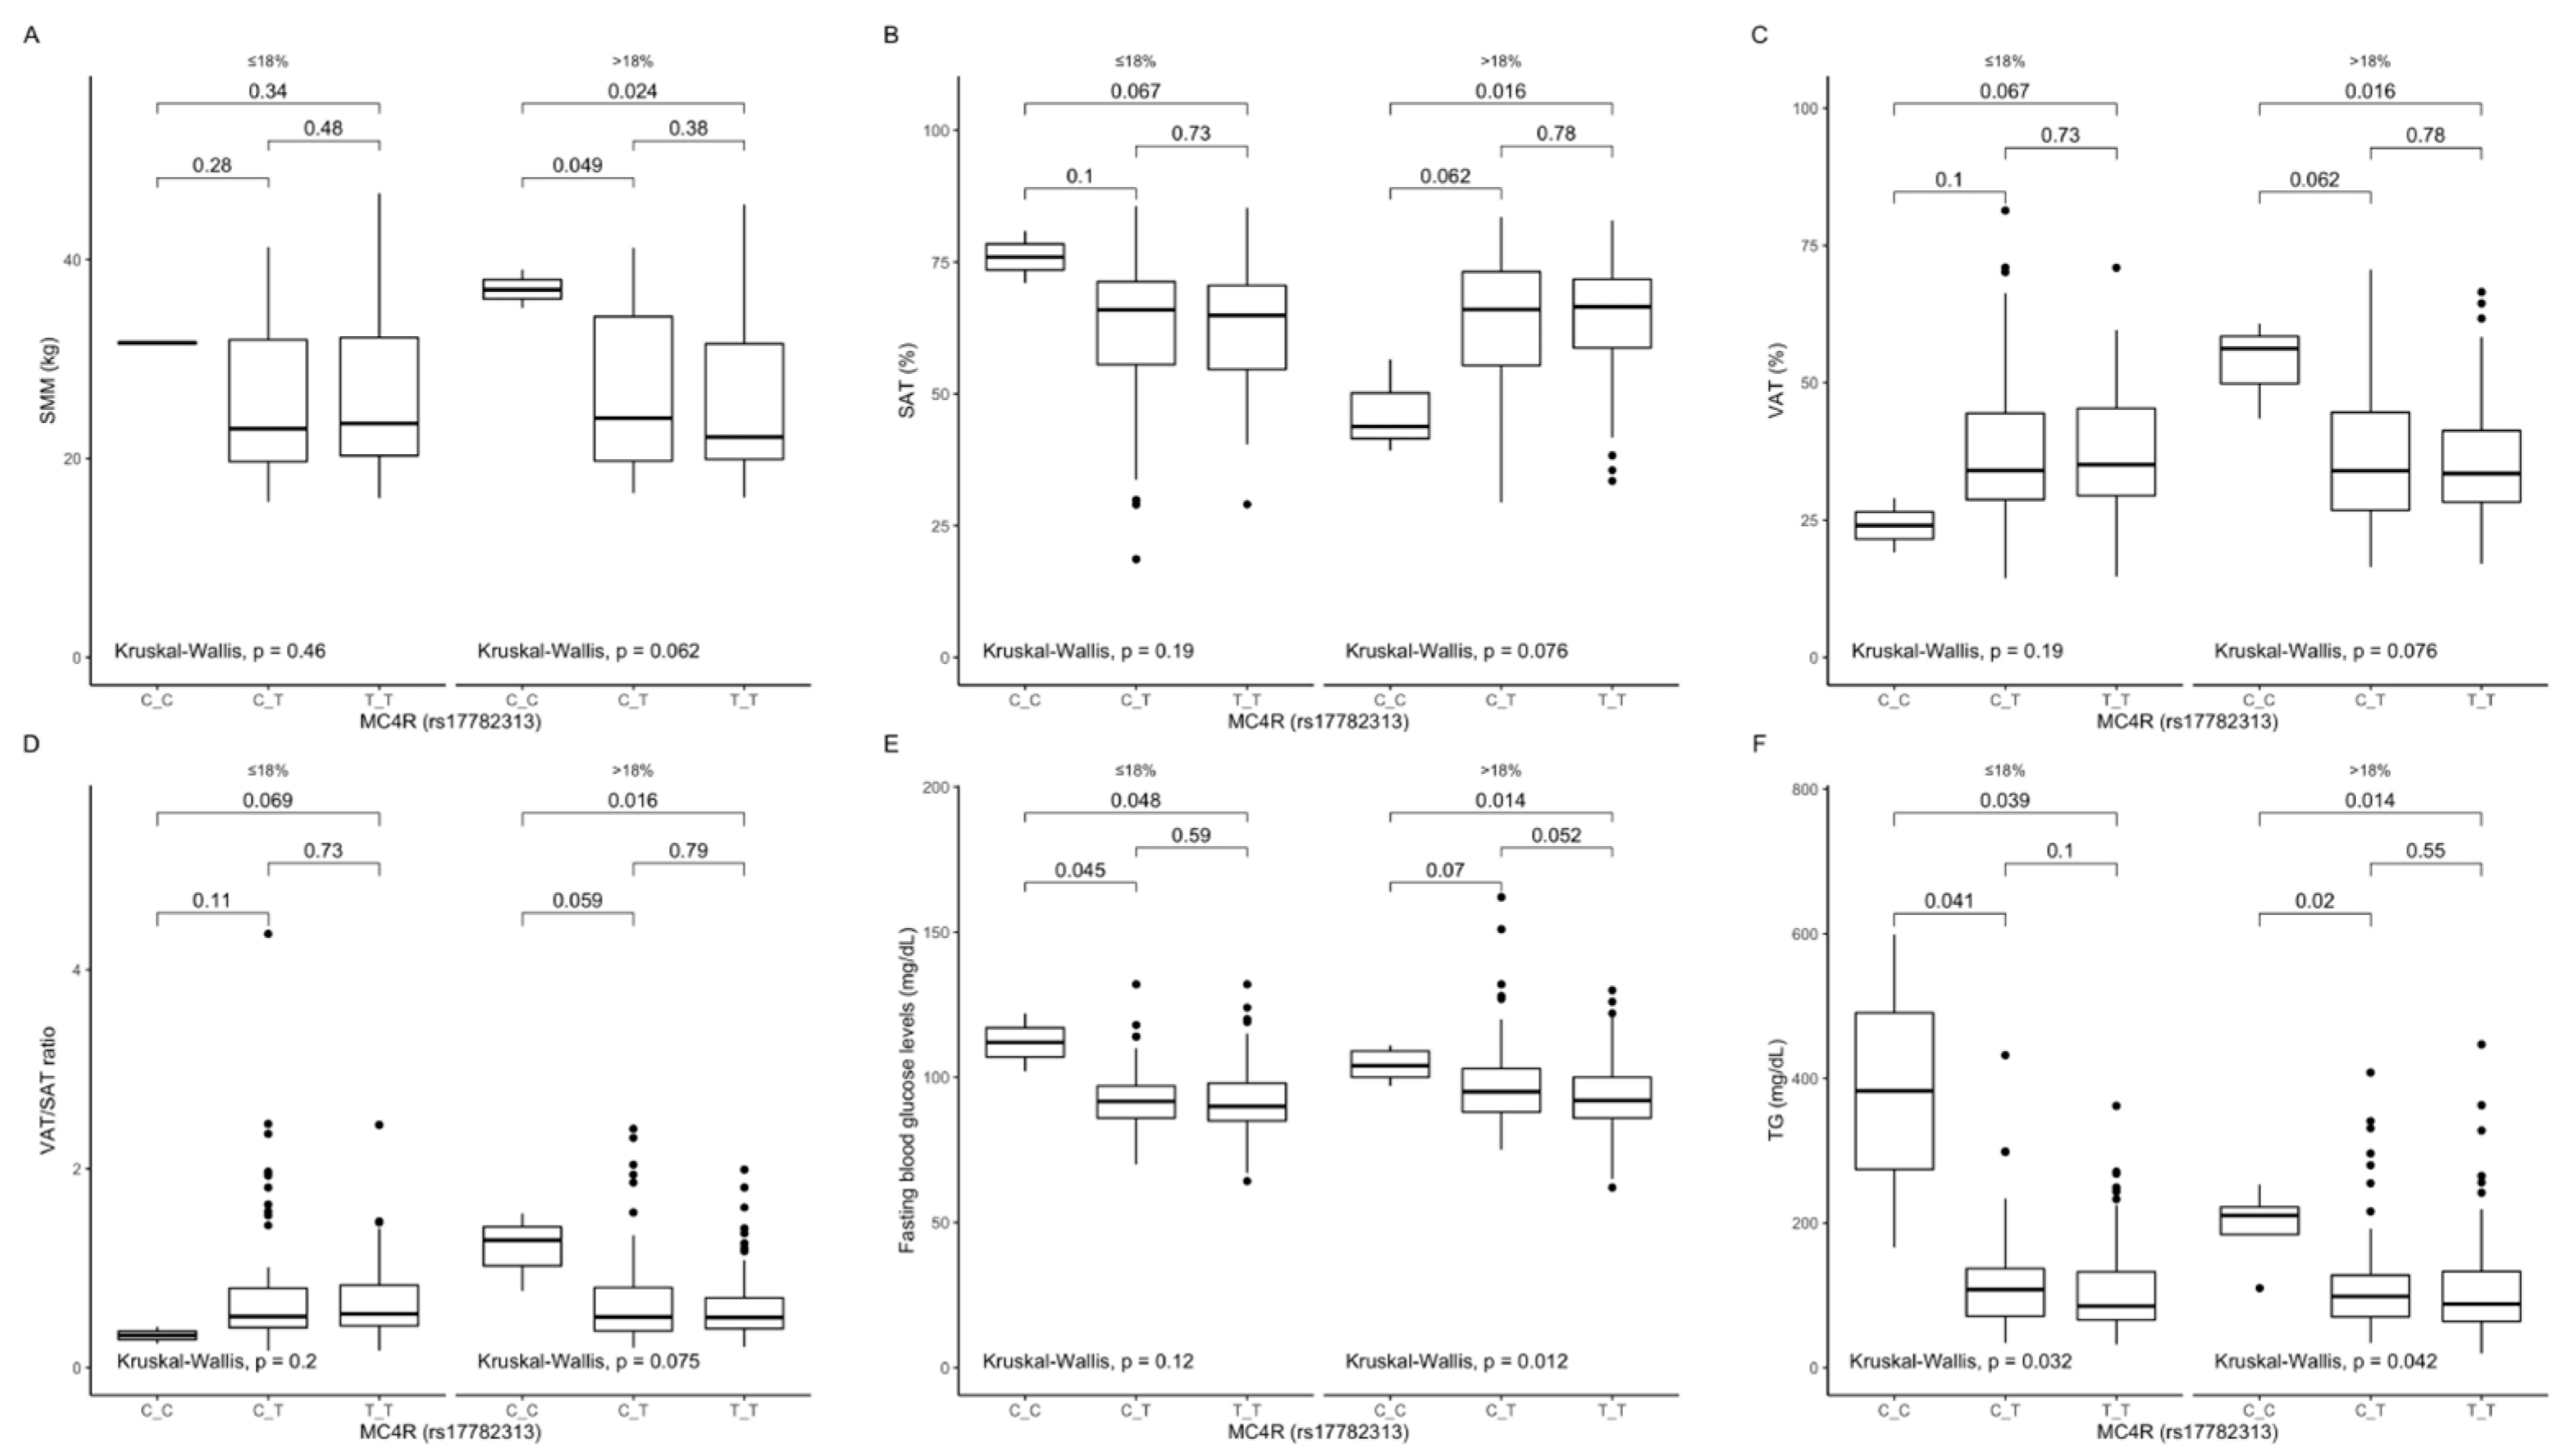
Association of MC4R rs17782313 genotypes with (A) SMM (kg), (B) SAT (%), (C) VAT (%), (D) VAT/SAT ratio; (E) fasting blood glucose levels (mg/dL); (F) TG concentrations (mg/dL), by dietary protein strata: ≤18% and >18% of total daily energy intake. SMM, skeletal muscle mass; SAT, subcutaneous adipose tissue; TG, triglycerides; VAT, visceral adipose tissue.
Figure 1.
Association of MC4R rs17782313 genotypes with (A) SMM (kg), (B) SAT (%), (C) VAT (%), (D) VAT/SAT ratio; (E) fasting blood glucose levels (mg/dL); (F) TG concentrations (mg/dL), by dietary protein strata: ≤18% and >18% of total daily energy intake. SMM, skeletal muscle mass; SAT, subcutaneous adipose tissue; TG, triglycerides; VAT, visceral adipose tissue.
Figure 2.
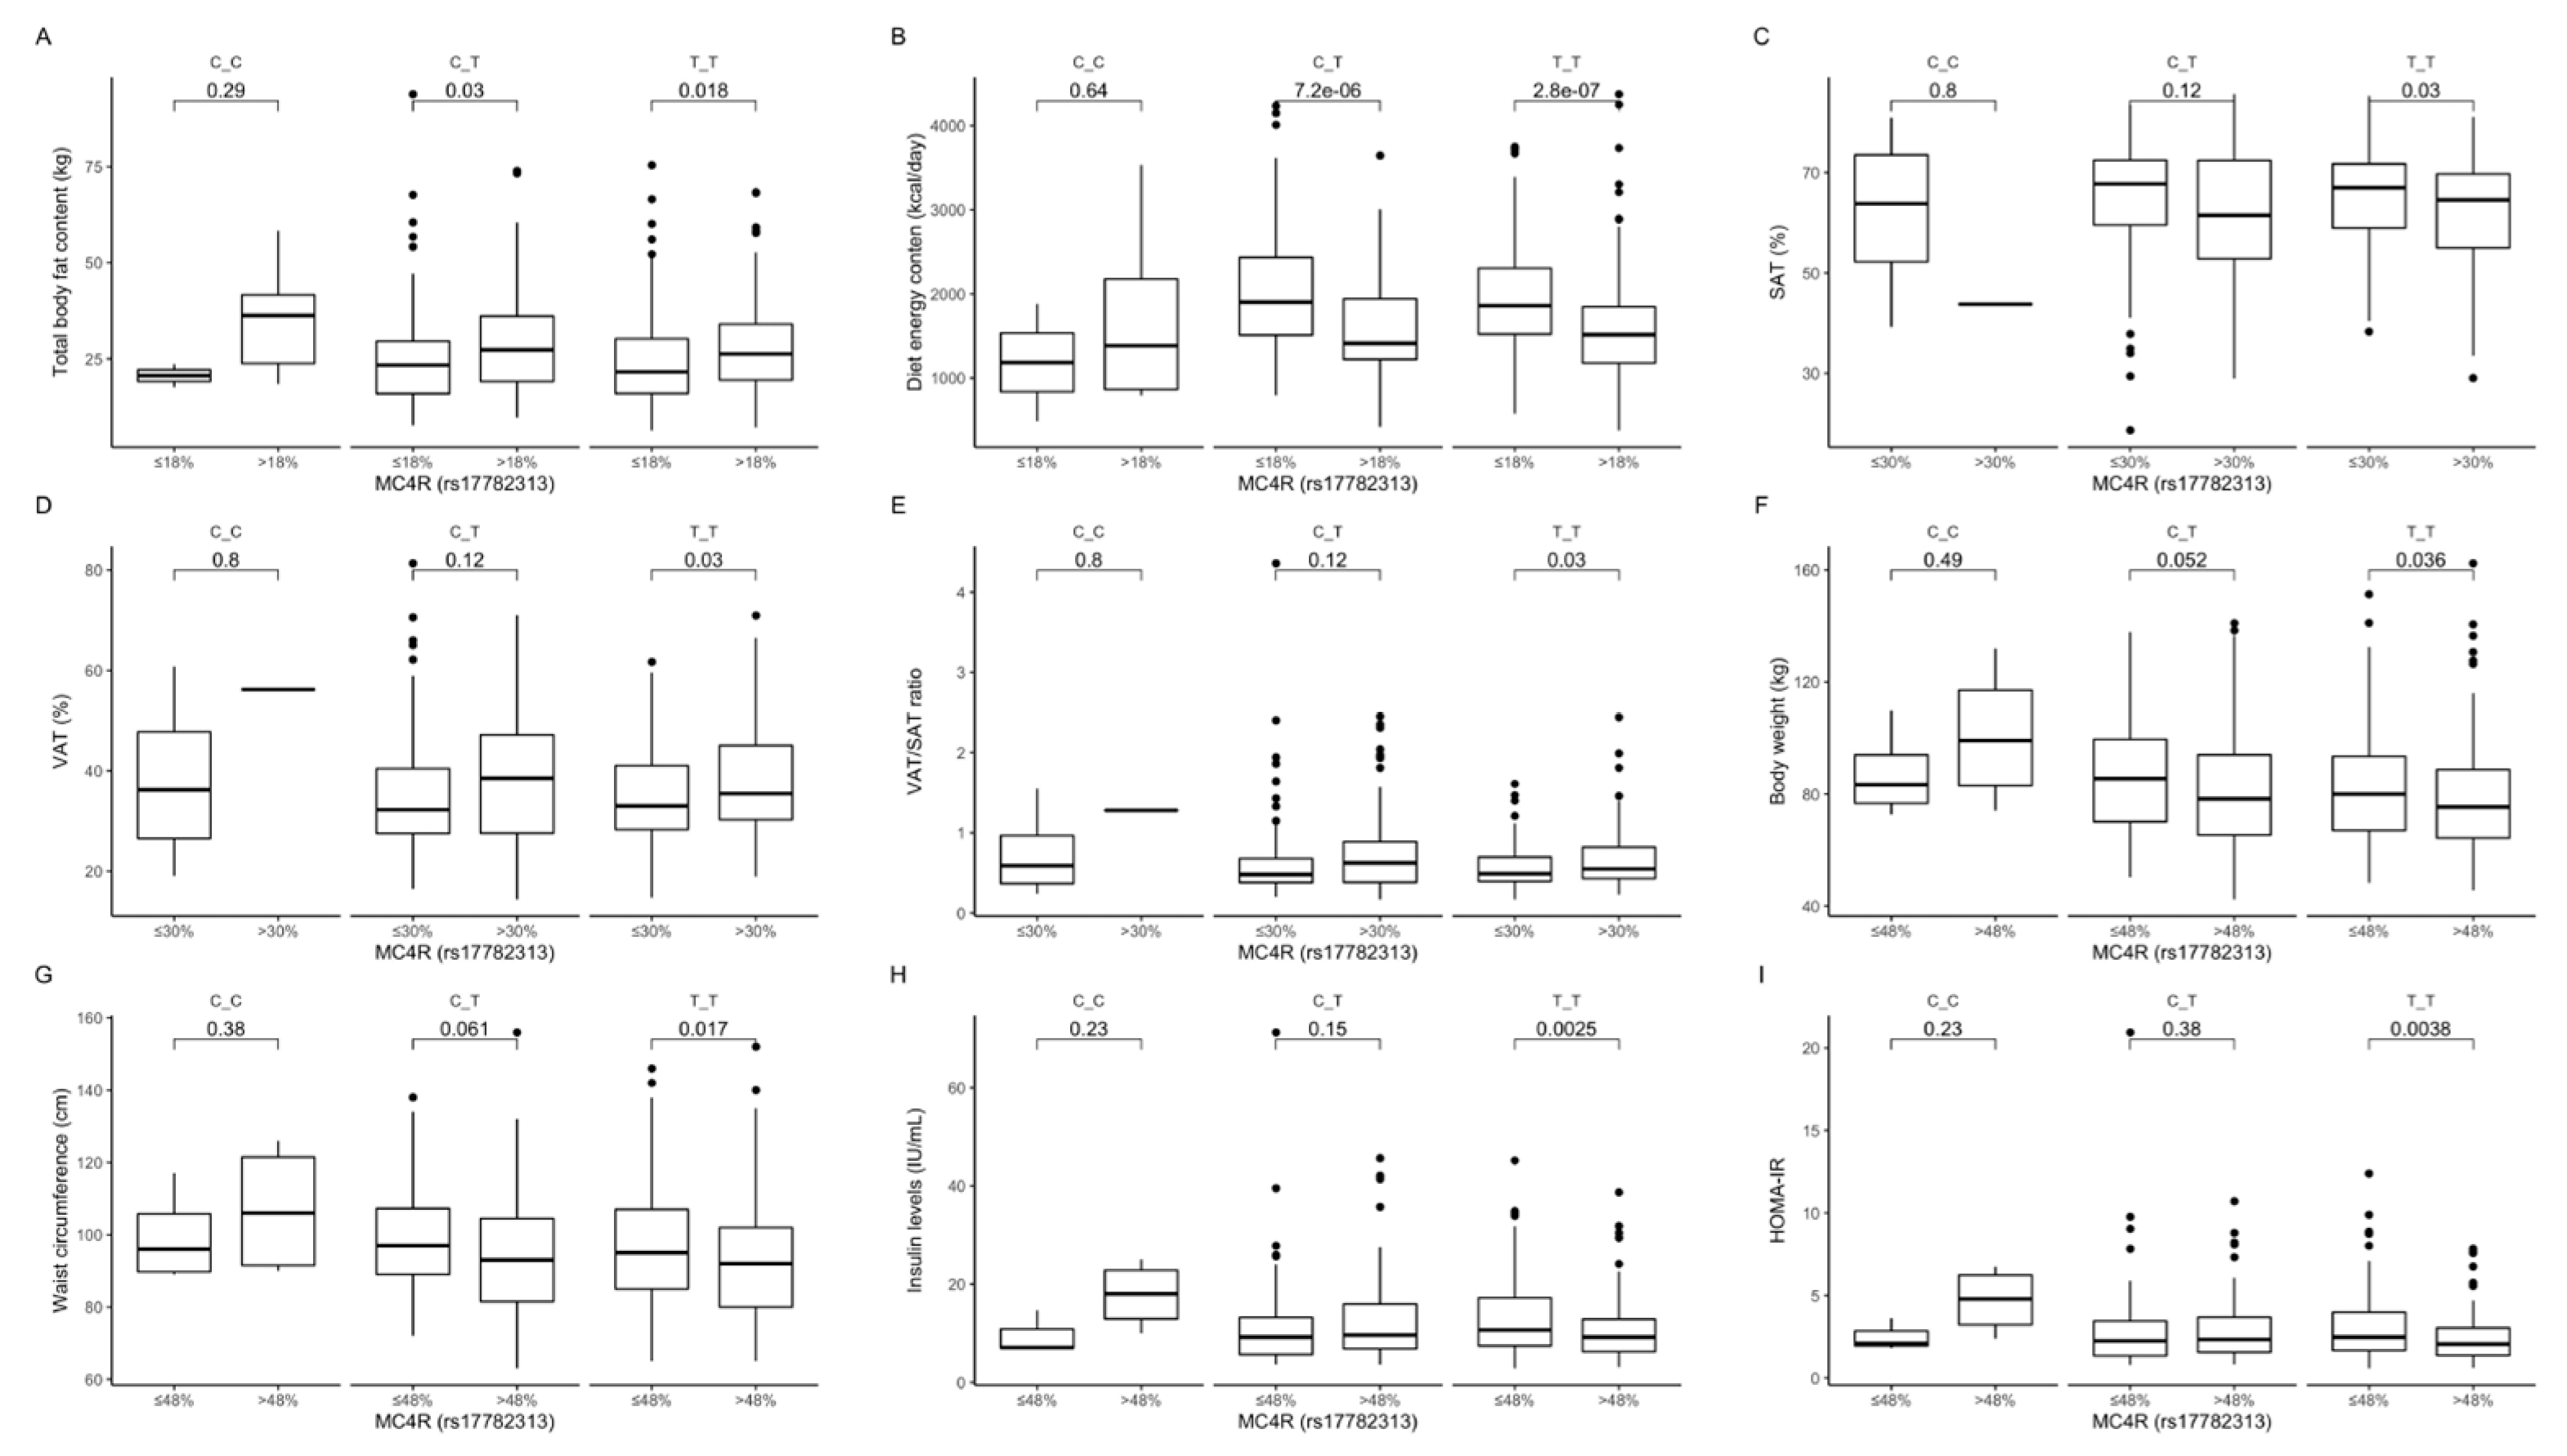
Association of dietary protein intake ≤18% and > 18% of total daily energy intake with (A) total body fat content (kg) and (B) diet energy content (kcal/day), in MC4R rs17782313 genotype carriers. Association of dietary fat intake ≤ 30% and >30% of total daily energy intake with (C) SAT (%), (D) VAT (%), and (E) VAT/SAT ratio, in MC4R rs17782313 genotype carriers. Association of dietary carbohydrates intake ≤48% and >48% of total daily energy intake with (F) body weight (kg), (G) waist circumference (cm), (H) fasting insulin levels (IU/mL), and (I) HOMA-IR, in MC4R rs17782313 genotype carriers. HOMA-IR, Homeostatic Models Assessment of Insulin Resistance; SAT, subcutaneous adipose tissue; VAT, visceral adipose tissue.
Figure 2.
Association of dietary protein intake ≤18% and > 18% of total daily energy intake with (A) total body fat content (kg) and (B) diet energy content (kcal/day), in MC4R rs17782313 genotype carriers. Association of dietary fat intake ≤ 30% and >30% of total daily energy intake with (C) SAT (%), (D) VAT (%), and (E) VAT/SAT ratio, in MC4R rs17782313 genotype carriers. Association of dietary carbohydrates intake ≤48% and >48% of total daily energy intake with (F) body weight (kg), (G) waist circumference (cm), (H) fasting insulin levels (IU/mL), and (I) HOMA-IR, in MC4R rs17782313 genotype carriers. HOMA-IR, Homeostatic Models Assessment of Insulin Resistance; SAT, subcutaneous adipose tissue; VAT, visceral adipose tissue.
Figure 3.
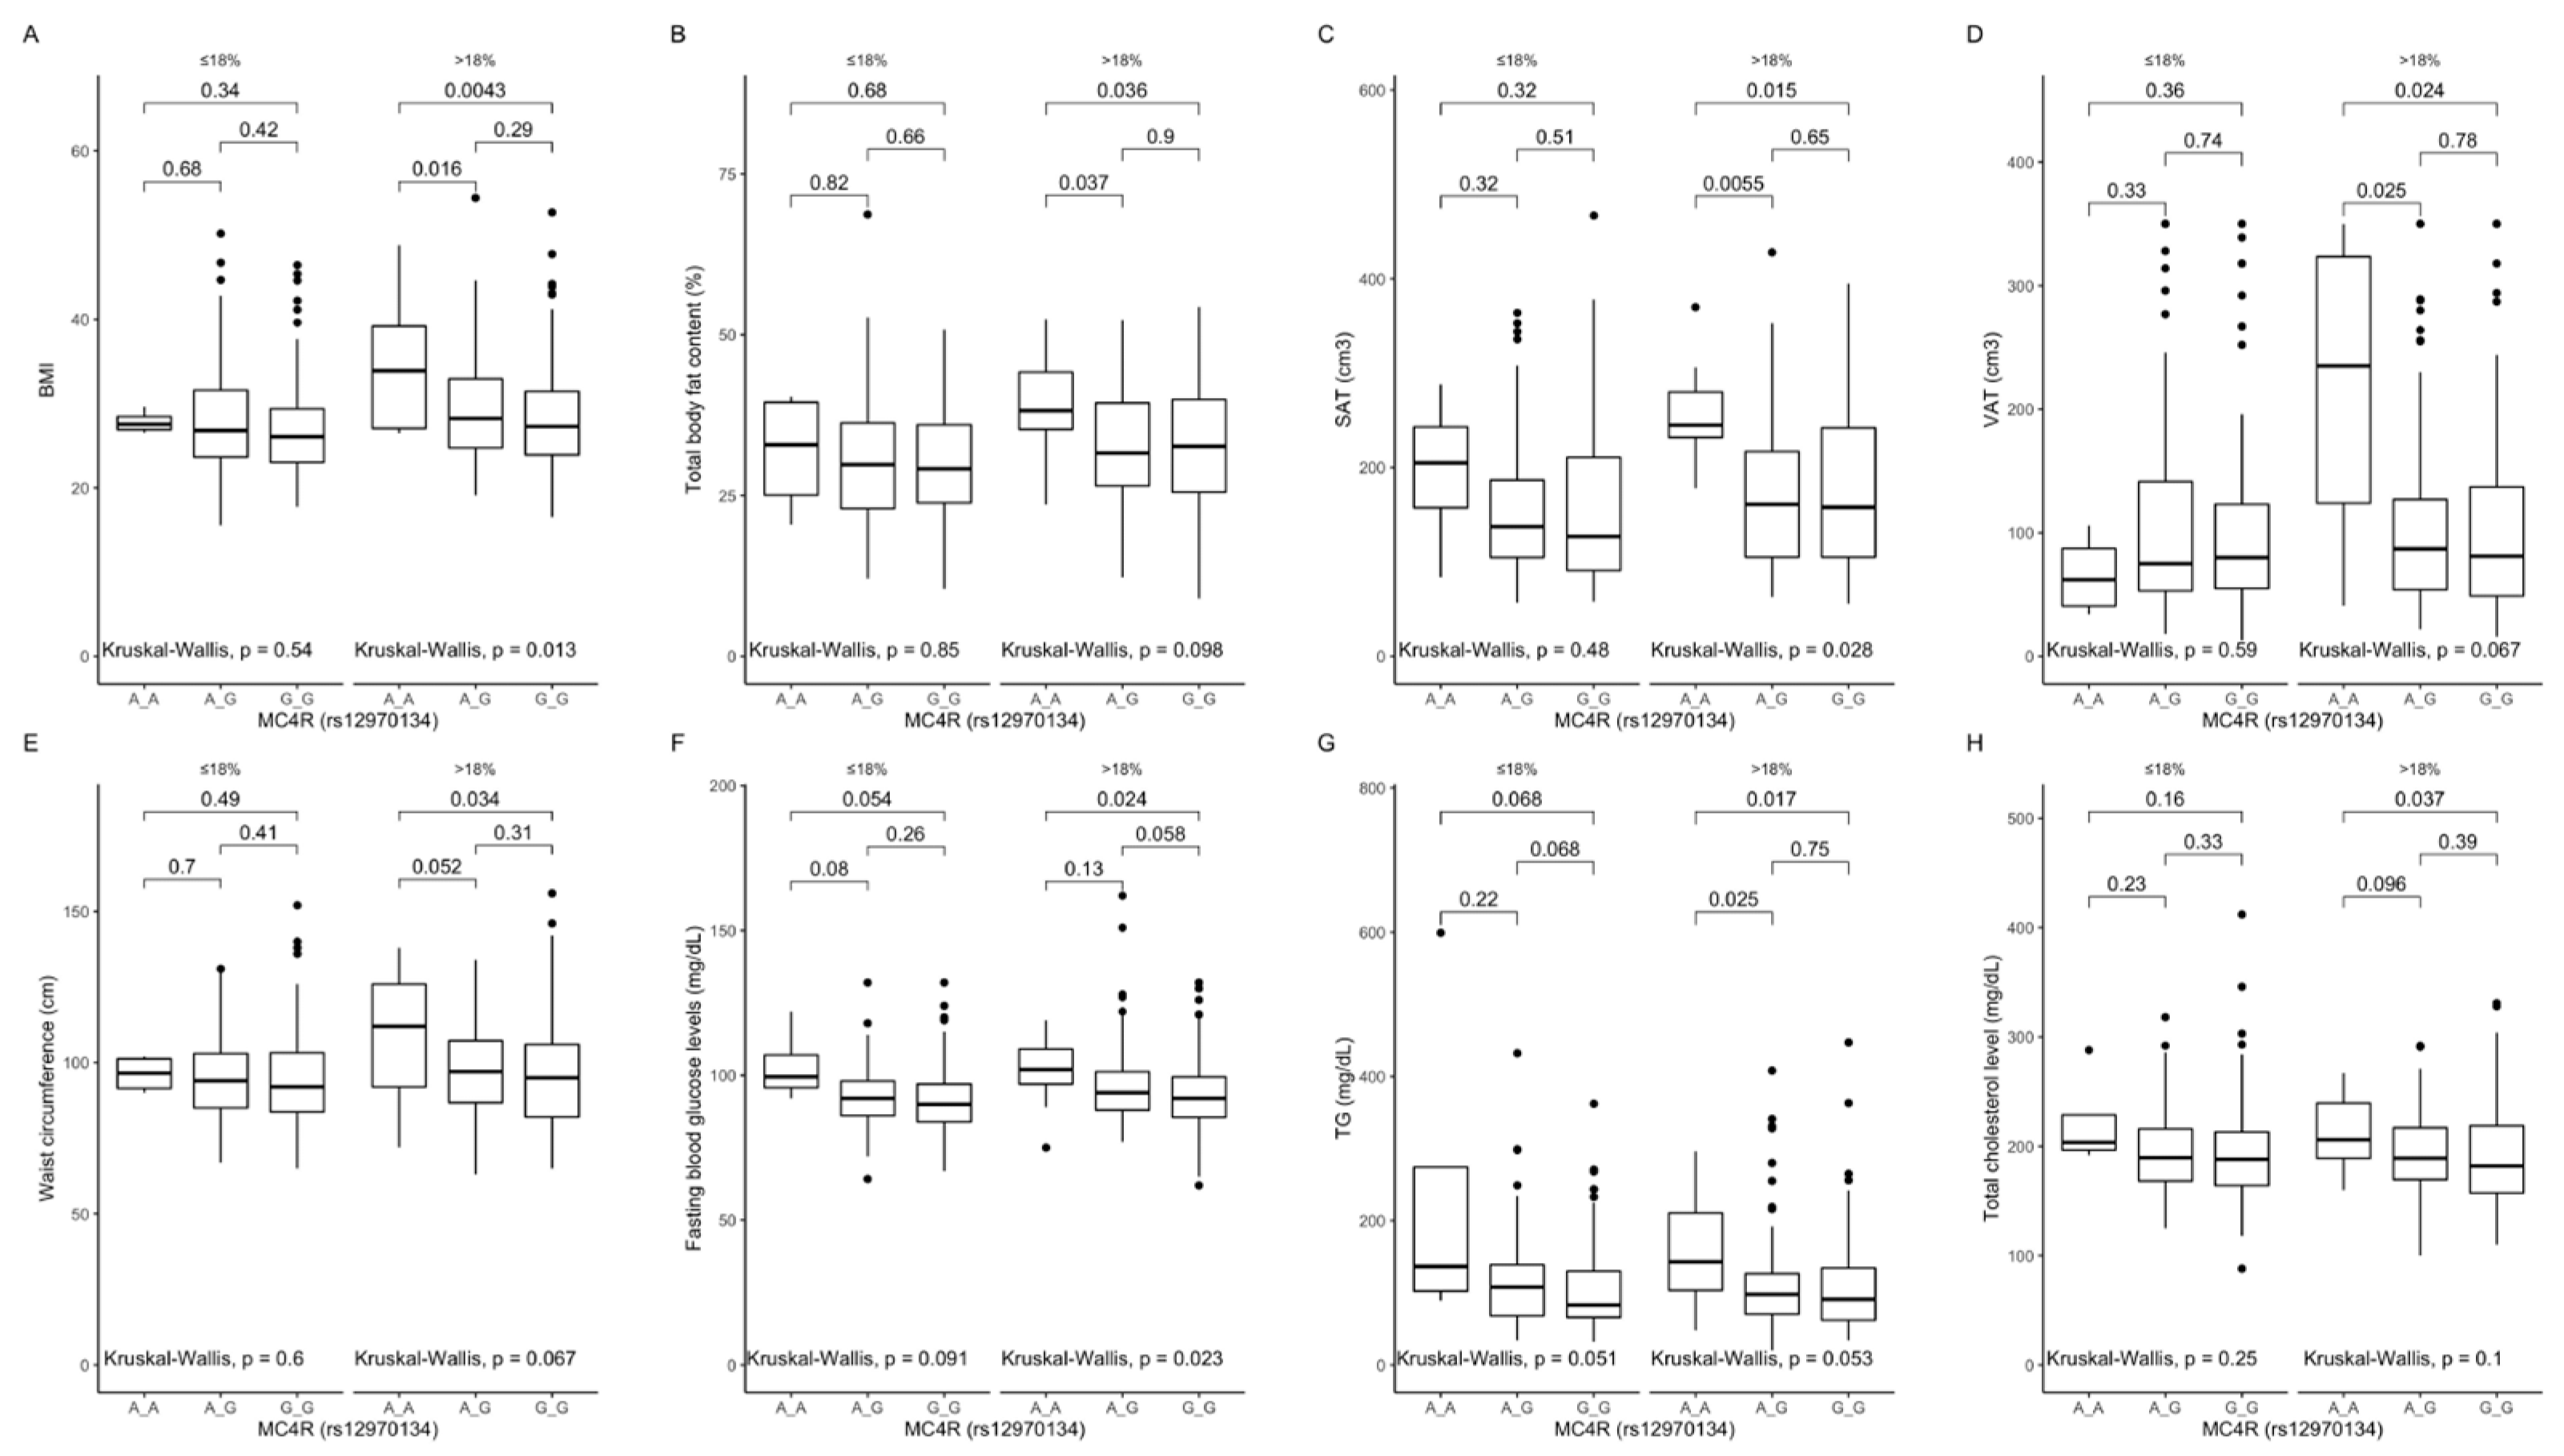
Association of MC4R rs12970134 genotypes with (A) BMI (kg/m2), (B) total body fat content (%), (C) SAT (cm3), (D) VAT (cm3), (E) waist circumference (cm), (F) fasting blood glucose levels (mg/dL), (G) TG concentrations (mg/dL), and (H) total cholesterol concentrations (mg/dL), by dietary protein strata: ≤18% and >18% of total daily energy intake. BMI, Body Mass Index; SAT, subcutaneous adipose tissue; TG, triglycerides; VAT, visceral adipose tissue.
Figure 3.
Association of MC4R rs12970134 genotypes with (A) BMI (kg/m2), (B) total body fat content (%), (C) SAT (cm3), (D) VAT (cm3), (E) waist circumference (cm), (F) fasting blood glucose levels (mg/dL), (G) TG concentrations (mg/dL), and (H) total cholesterol concentrations (mg/dL), by dietary protein strata: ≤18% and >18% of total daily energy intake. BMI, Body Mass Index; SAT, subcutaneous adipose tissue; TG, triglycerides; VAT, visceral adipose tissue.
Figure 4.
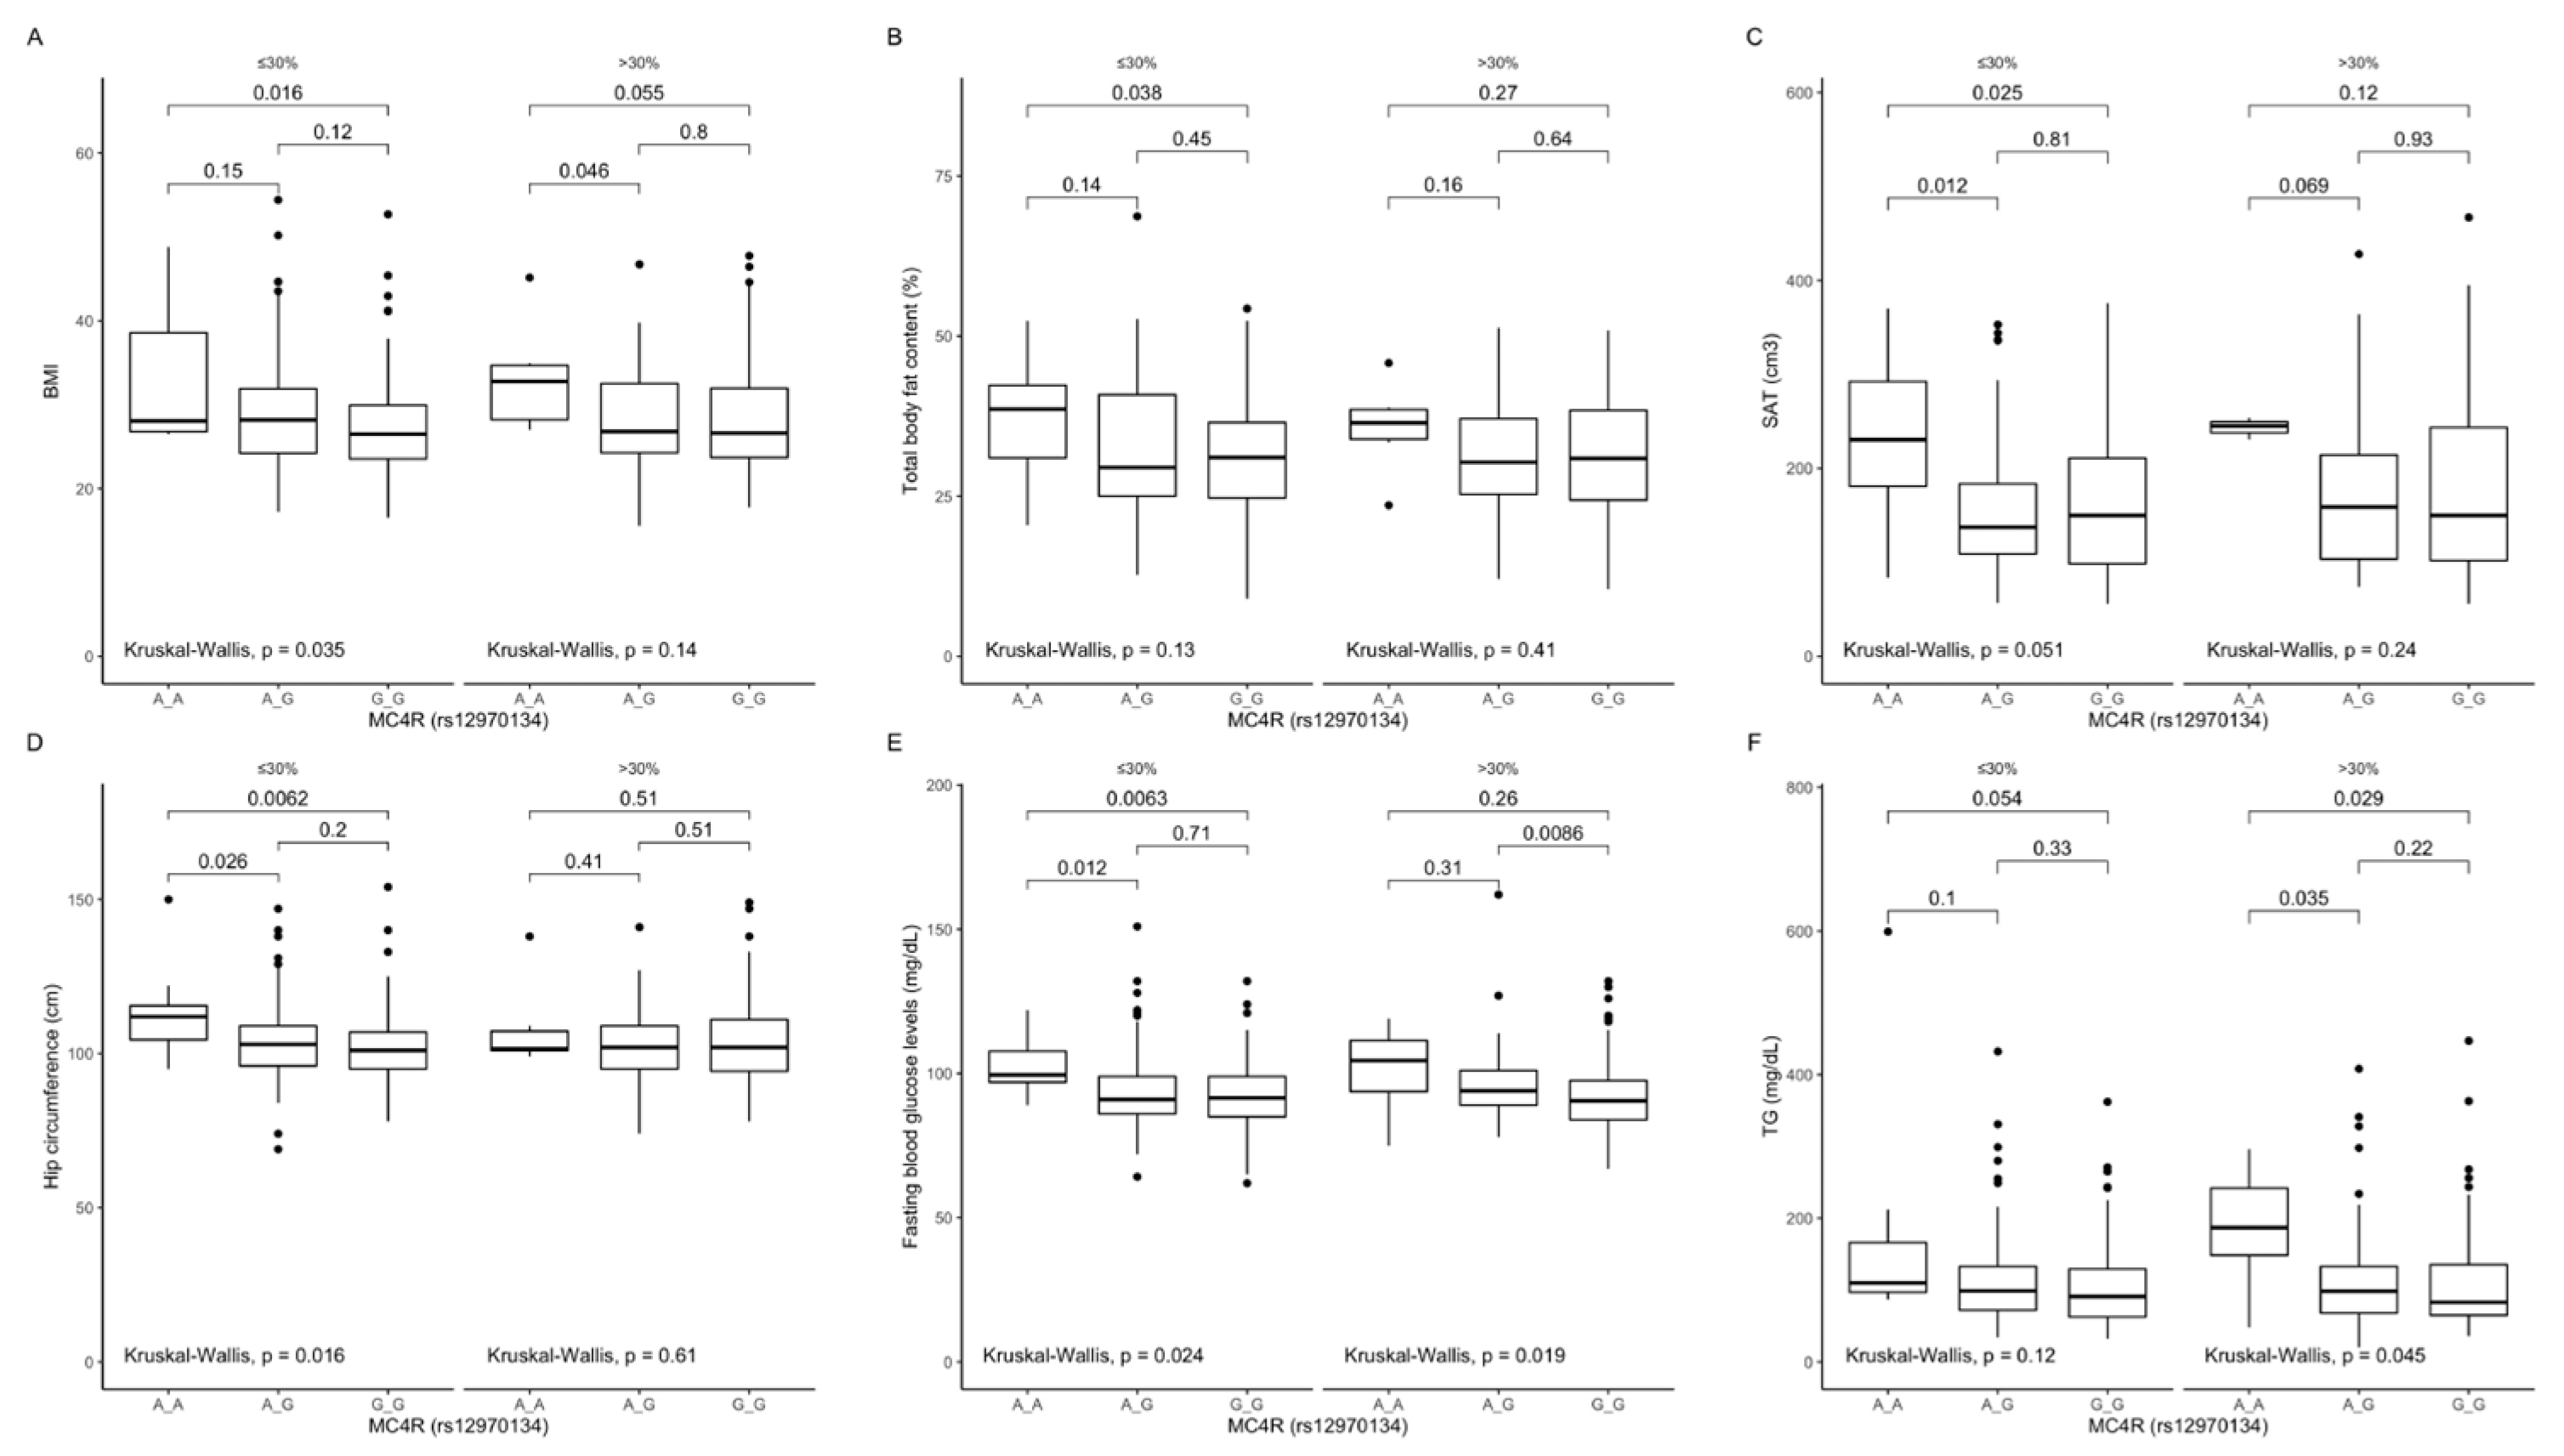
Association of MC4R rs12970134 genotypes with (A) BMI (kg/m2); (B) total body fat content (%); (C) SAT (cm3), (D) hip circumference (cm), (E) fasting blood glucose concentrations (mg/dL), and (F) TG concentrations (mg/dL), by dietary fat intake strata: ≤30% and >30% of total daily energy intake. BMI, Body Mass Index; SAT, subcutaneous adipose tissue; TG, triglycerides.
Figure 4.
Association of MC4R rs12970134 genotypes with (A) BMI (kg/m2); (B) total body fat content (%); (C) SAT (cm3), (D) hip circumference (cm), (E) fasting blood glucose concentrations (mg/dL), and (F) TG concentrations (mg/dL), by dietary fat intake strata: ≤30% and >30% of total daily energy intake. BMI, Body Mass Index; SAT, subcutaneous adipose tissue; TG, triglycerides.
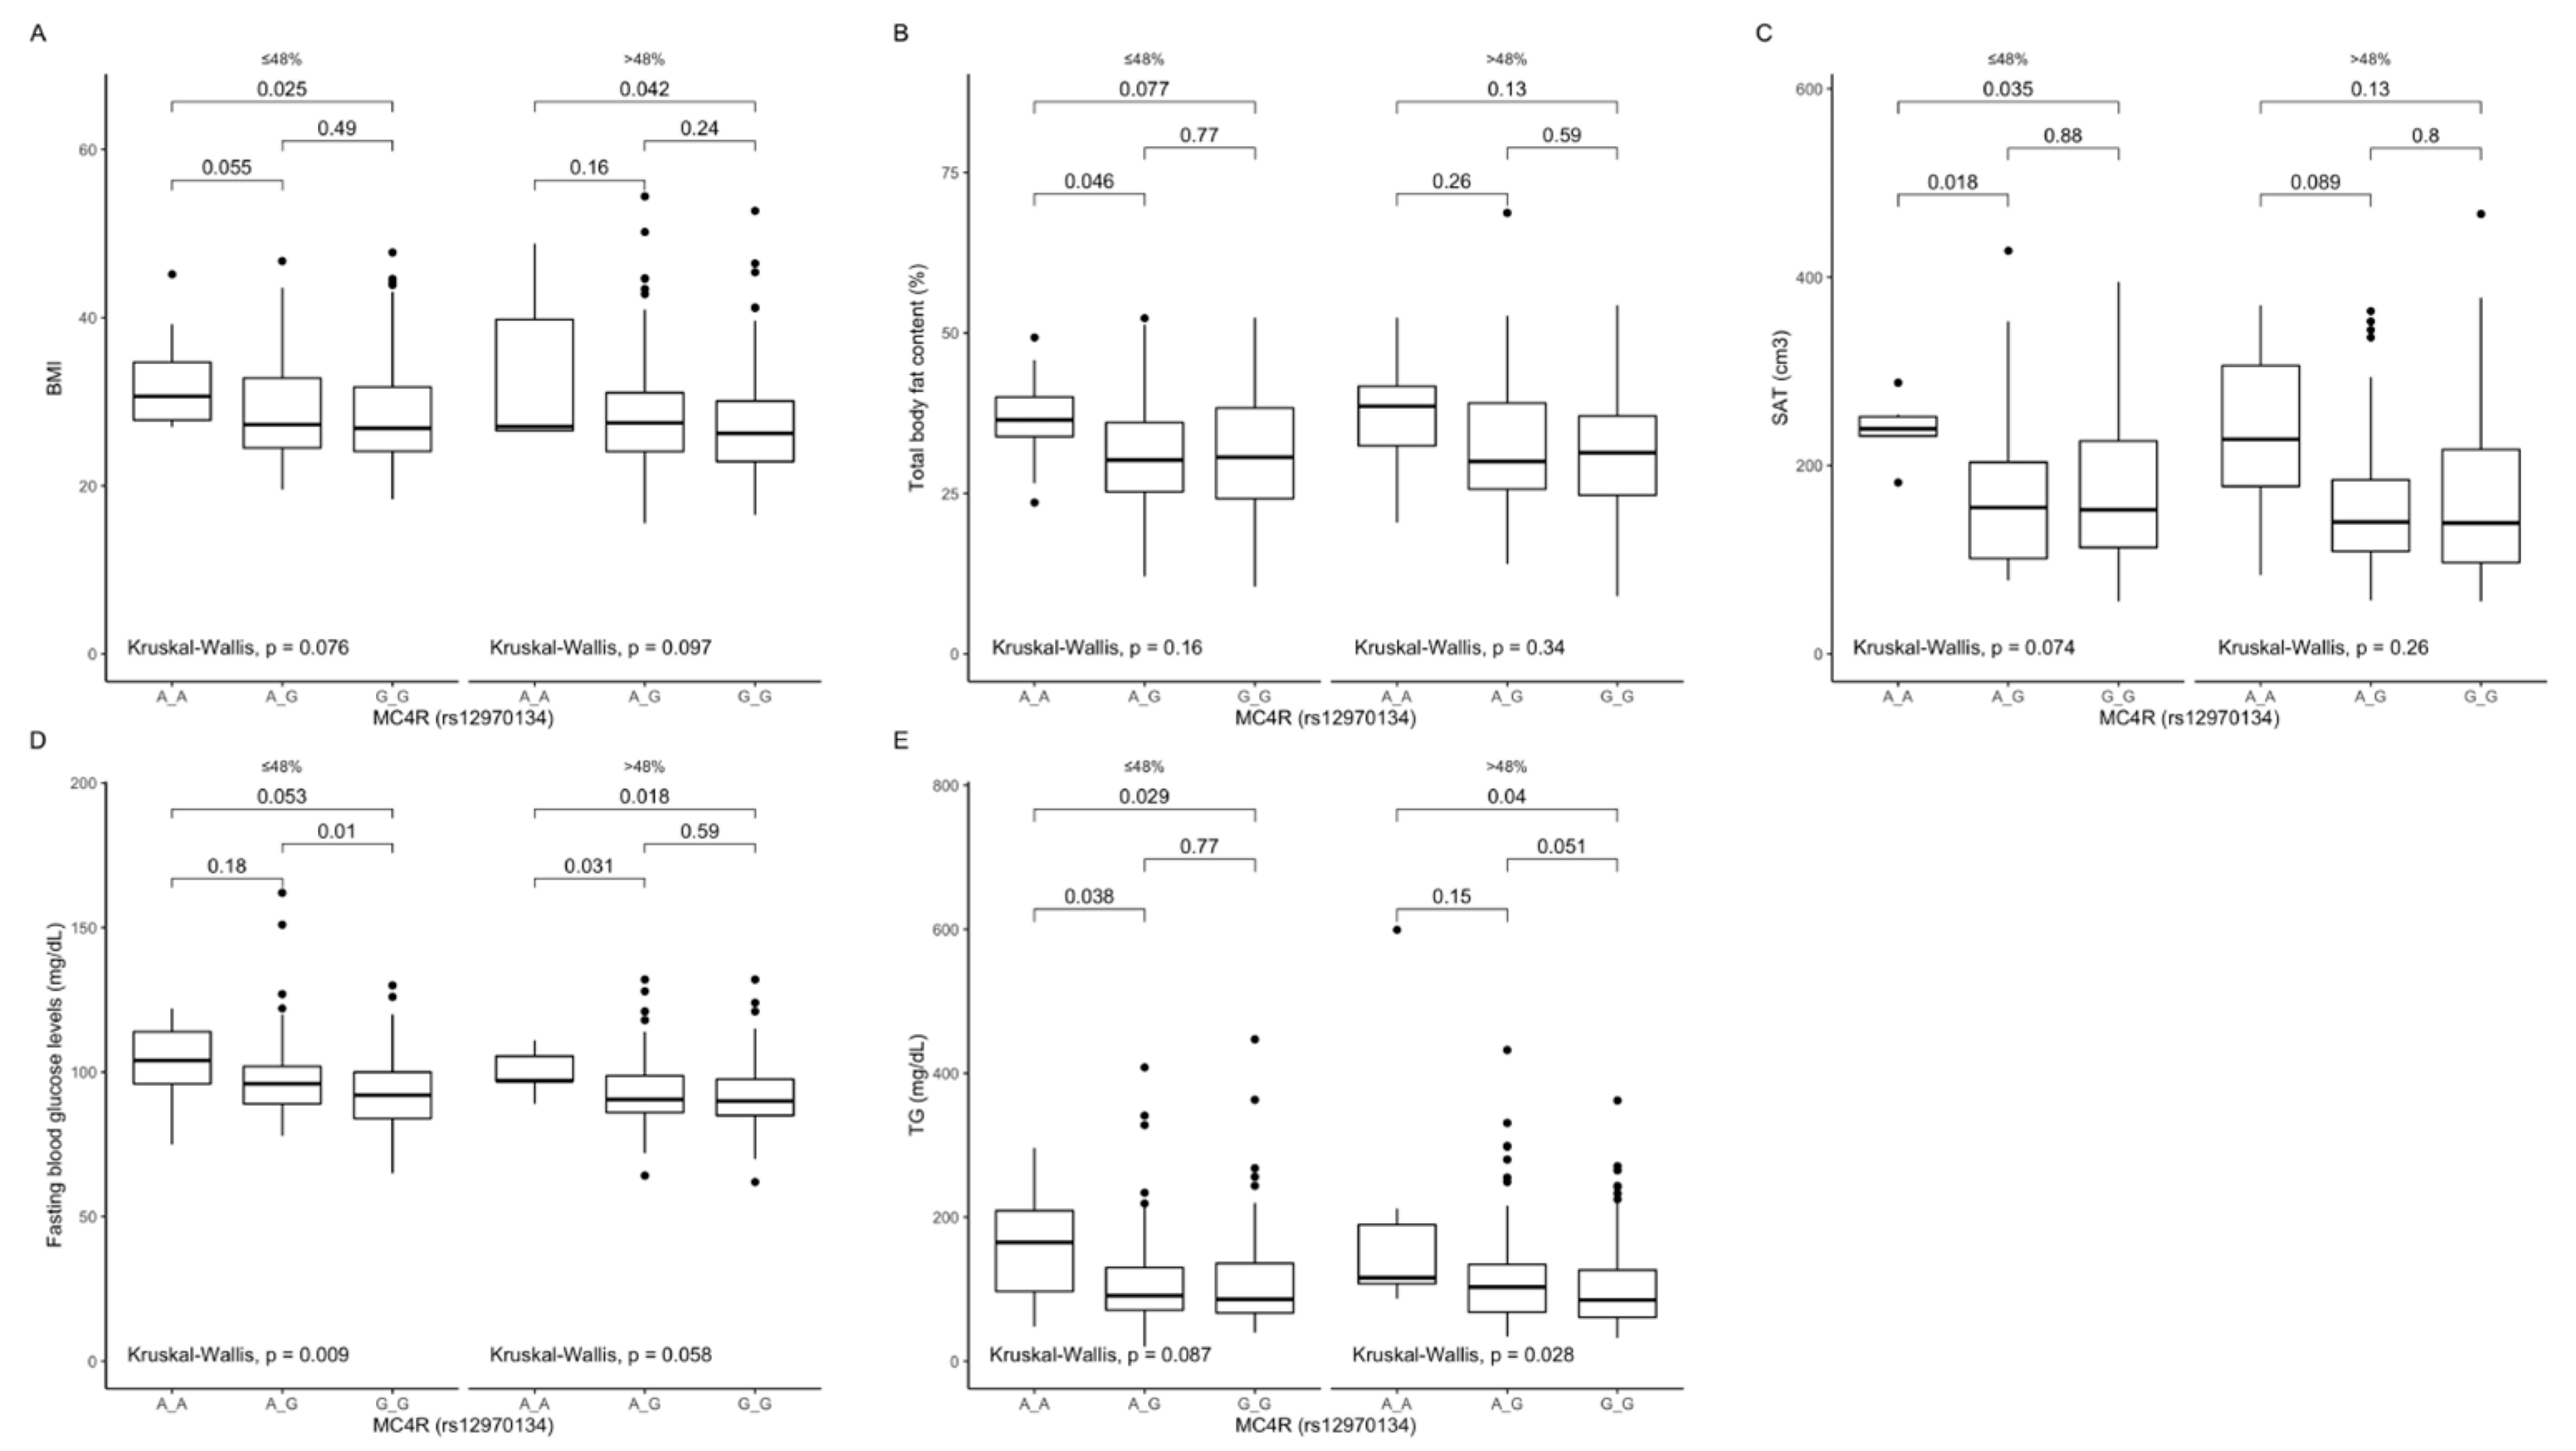
Figure 5.
Association of MC4R rs12970134 genotypes with (A) BMI (kg/m2), (B) total body fat content (%), (C) SAT (cm3), (D) fasting blood glucose concentrations (mg/dL), and (E) TG concentrations (mg/dL), by dietary carbohydrates intake strata: ≤48% and >48% of total daily energy intake. BMI, Body Mass Index; SAT, subcutaneous adipose tissue; TG, tri-glycerides.
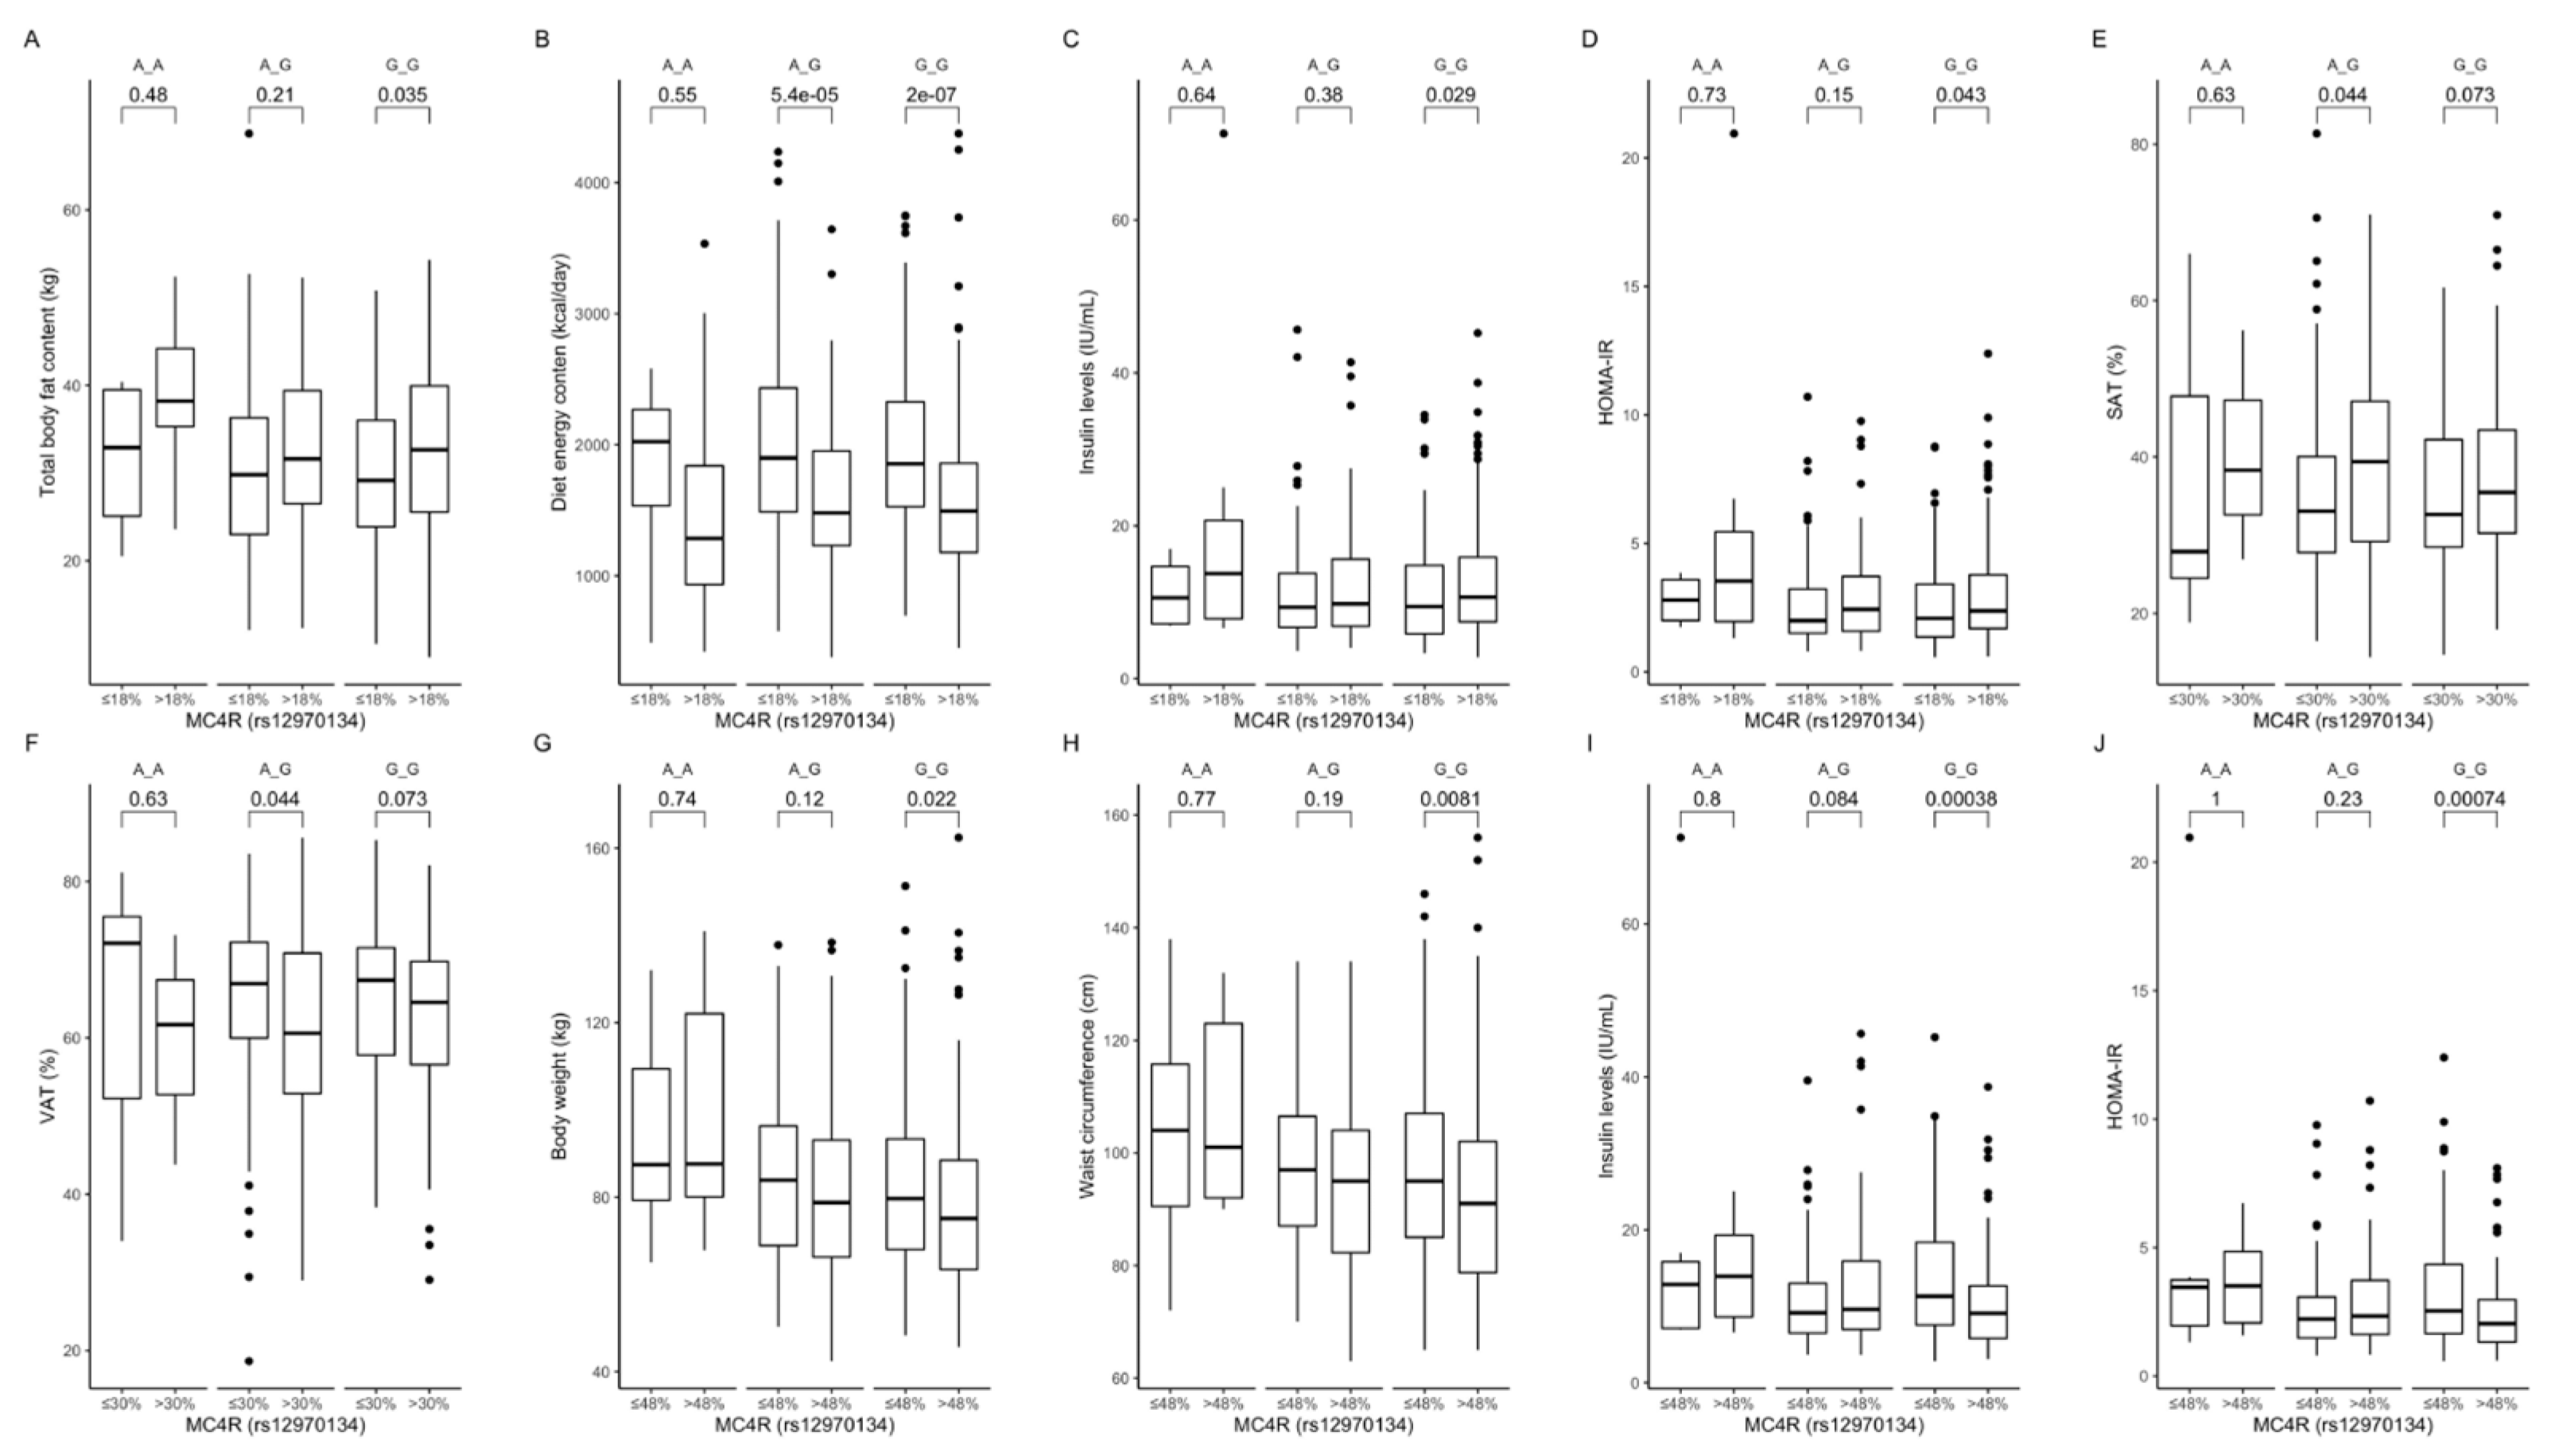
Figure 6.
Association of dietary protein intake ≤ 18% and >18% of total daily energy intake with (A) total body fat content (kg), (B) diet energy content (kcal/day), (C) insulin levels (IU/mL), and (D) HOMA-IR in MC4R rs12970134 genotype carriers. Association of dietary fat intake ≤ 30% and >30% of total daily energy intake with (E) SAT (%) and (F) VAT (%), in MC4R rs12970134 genotype carriers. Association of dietary carbohydrates intake ≤ 48% and >48% of total daily energy intake with (G) body weight (kg), (H) waist circumference (cm), (I) fasting insulin levels (IU/mL), and (J) HOMA-IR, in MC4R rs12970134 genotype carriers. HOMA-IR, Homeostatic Models Assessment of Insulin Resistance; SAT, subcutaneous adipose tissue; VAT, visceral adipose tissue.
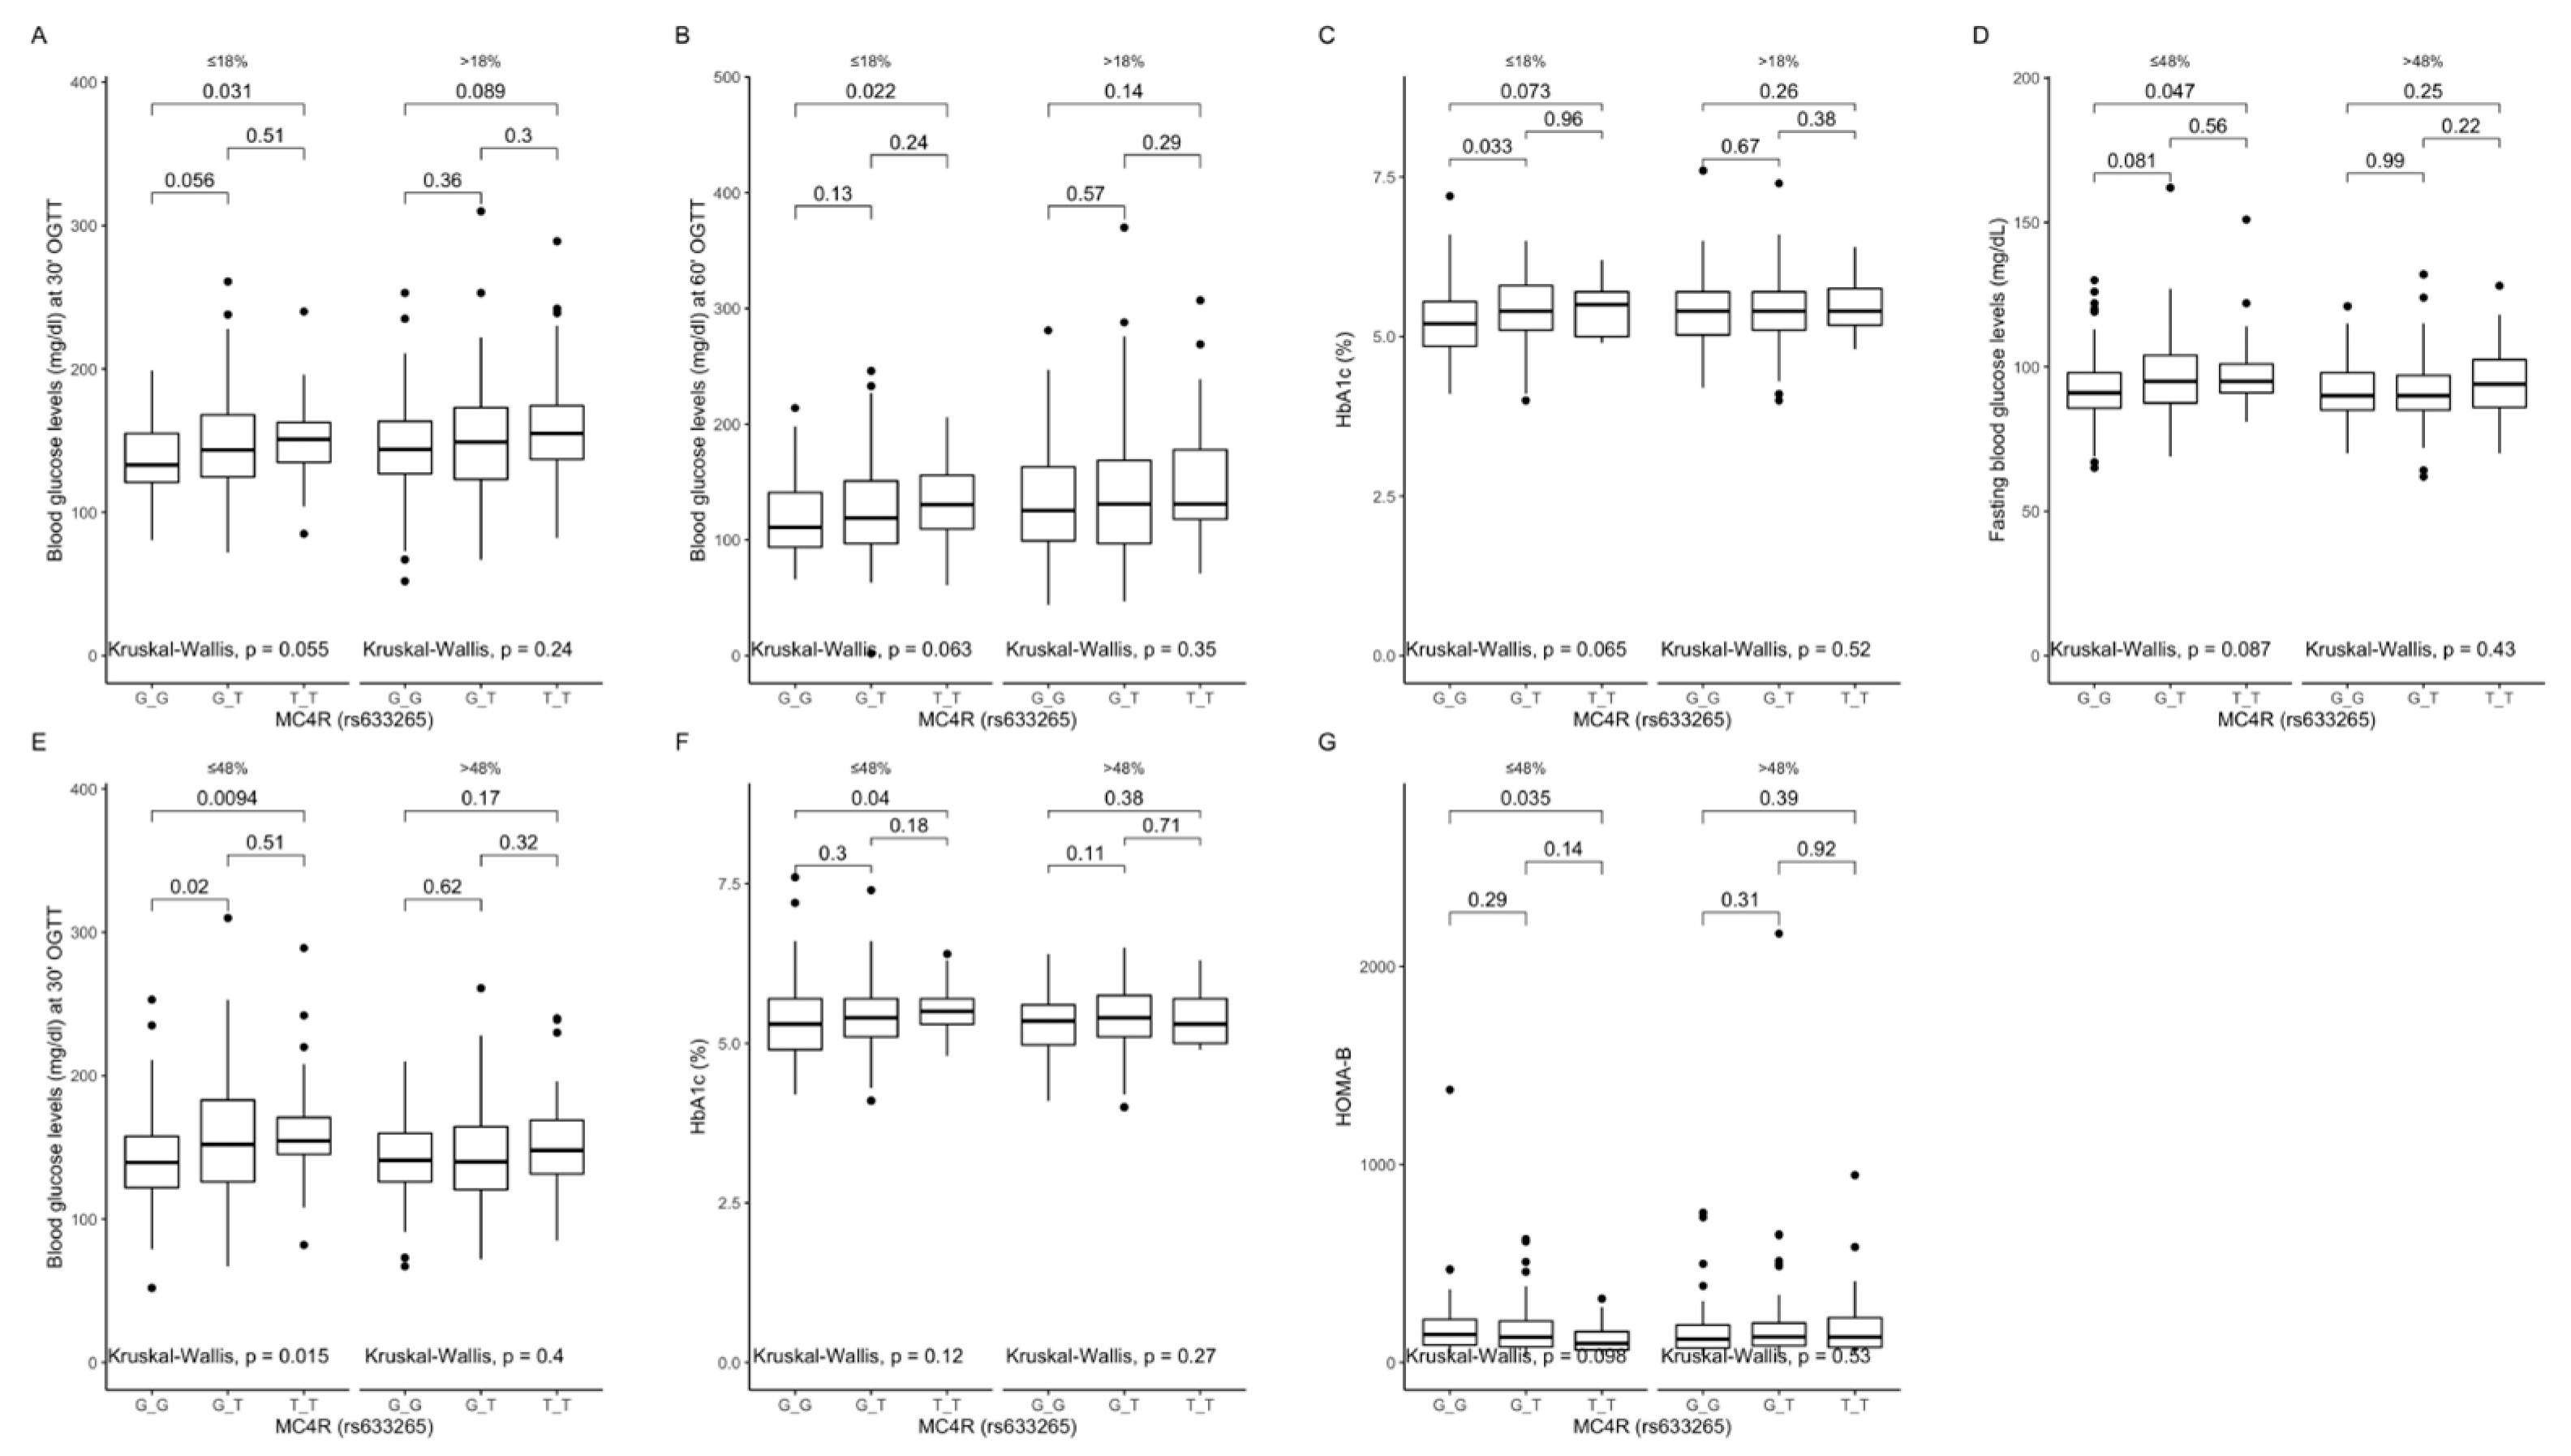
Figure 7.
Association of MC4R rs633265 genotypes with (A) blood glucose levels (mg/dL) at 30 min of OGTT, (B) blood glucose levels (mg/dL) at 60 min of OGTT, and (C) HbA1c levels (%), by dietary protein intake strata: ≤18% and >18% of total daily energy intake. Association of MC4R rs633265 genotypes with (D) fasting blood glucose levels (mg/dL), (E) blood glucose levels (mg/dL) at 30 min of OGTT, (F) HbA1c levels (%), and (G) HOMA-B (%), by dietary carbohydrates intake strata: ≤48% and >48% of total daily energy intake. HOMA-B, Homeostatic Models Assessment of β-cell function; OGTT, Oral Glucose Tolerance Test.
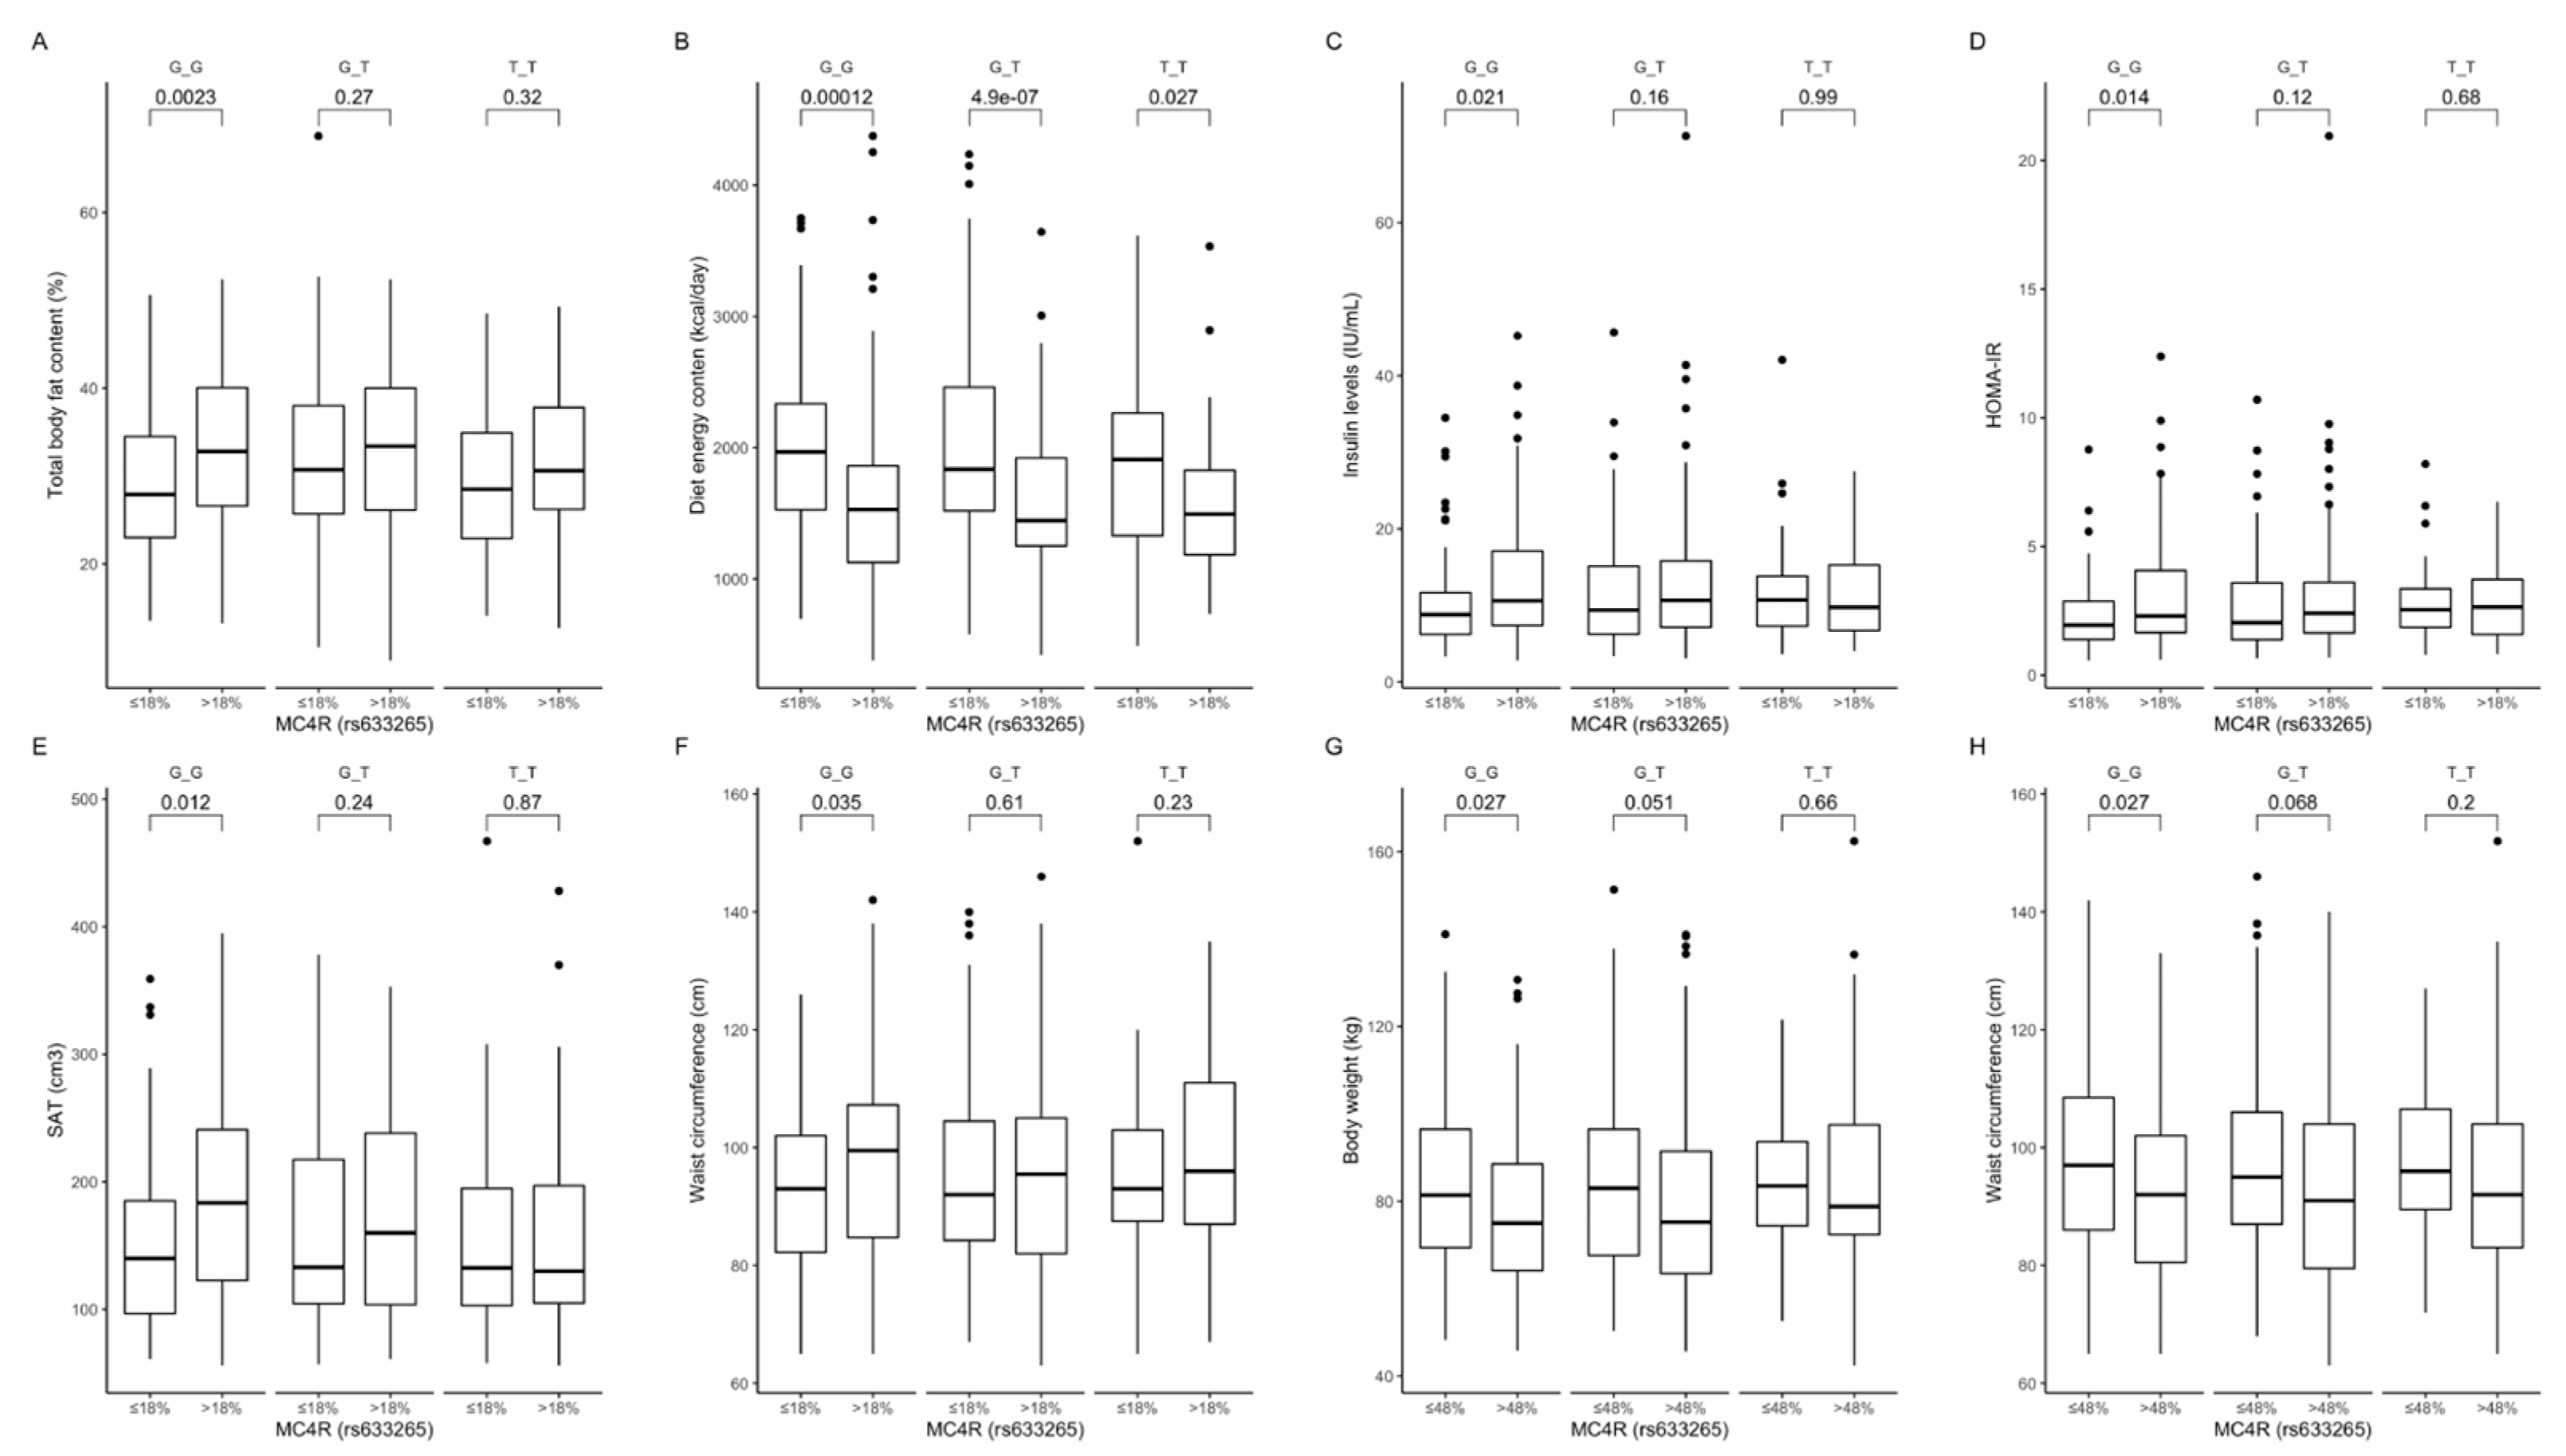
Figure 8.
Association of dietary protein intake ≤ 18% and >18% of total daily energy intake with (A) total body fat content (%), (B) diet energy content (kcal/day), (C) fasting insulin levels (IU/mL), (D) HOMA-IR, (E) SAT (cm3), and (F) waist circumference (cm), in MC4R rs633265 genotype carriers. Association of dietary carbohydrate intake ≤ 48% and >48% of total daily energy intake with (G) body weight (kg) and (H) waist circumference (cm), in MC4R rs633265 genotype carriers. HOMA-IR, Homeostatic Models Assessment of Insulin Resistance; SAT, subcutaneous adipose tissue.
Figure 9.
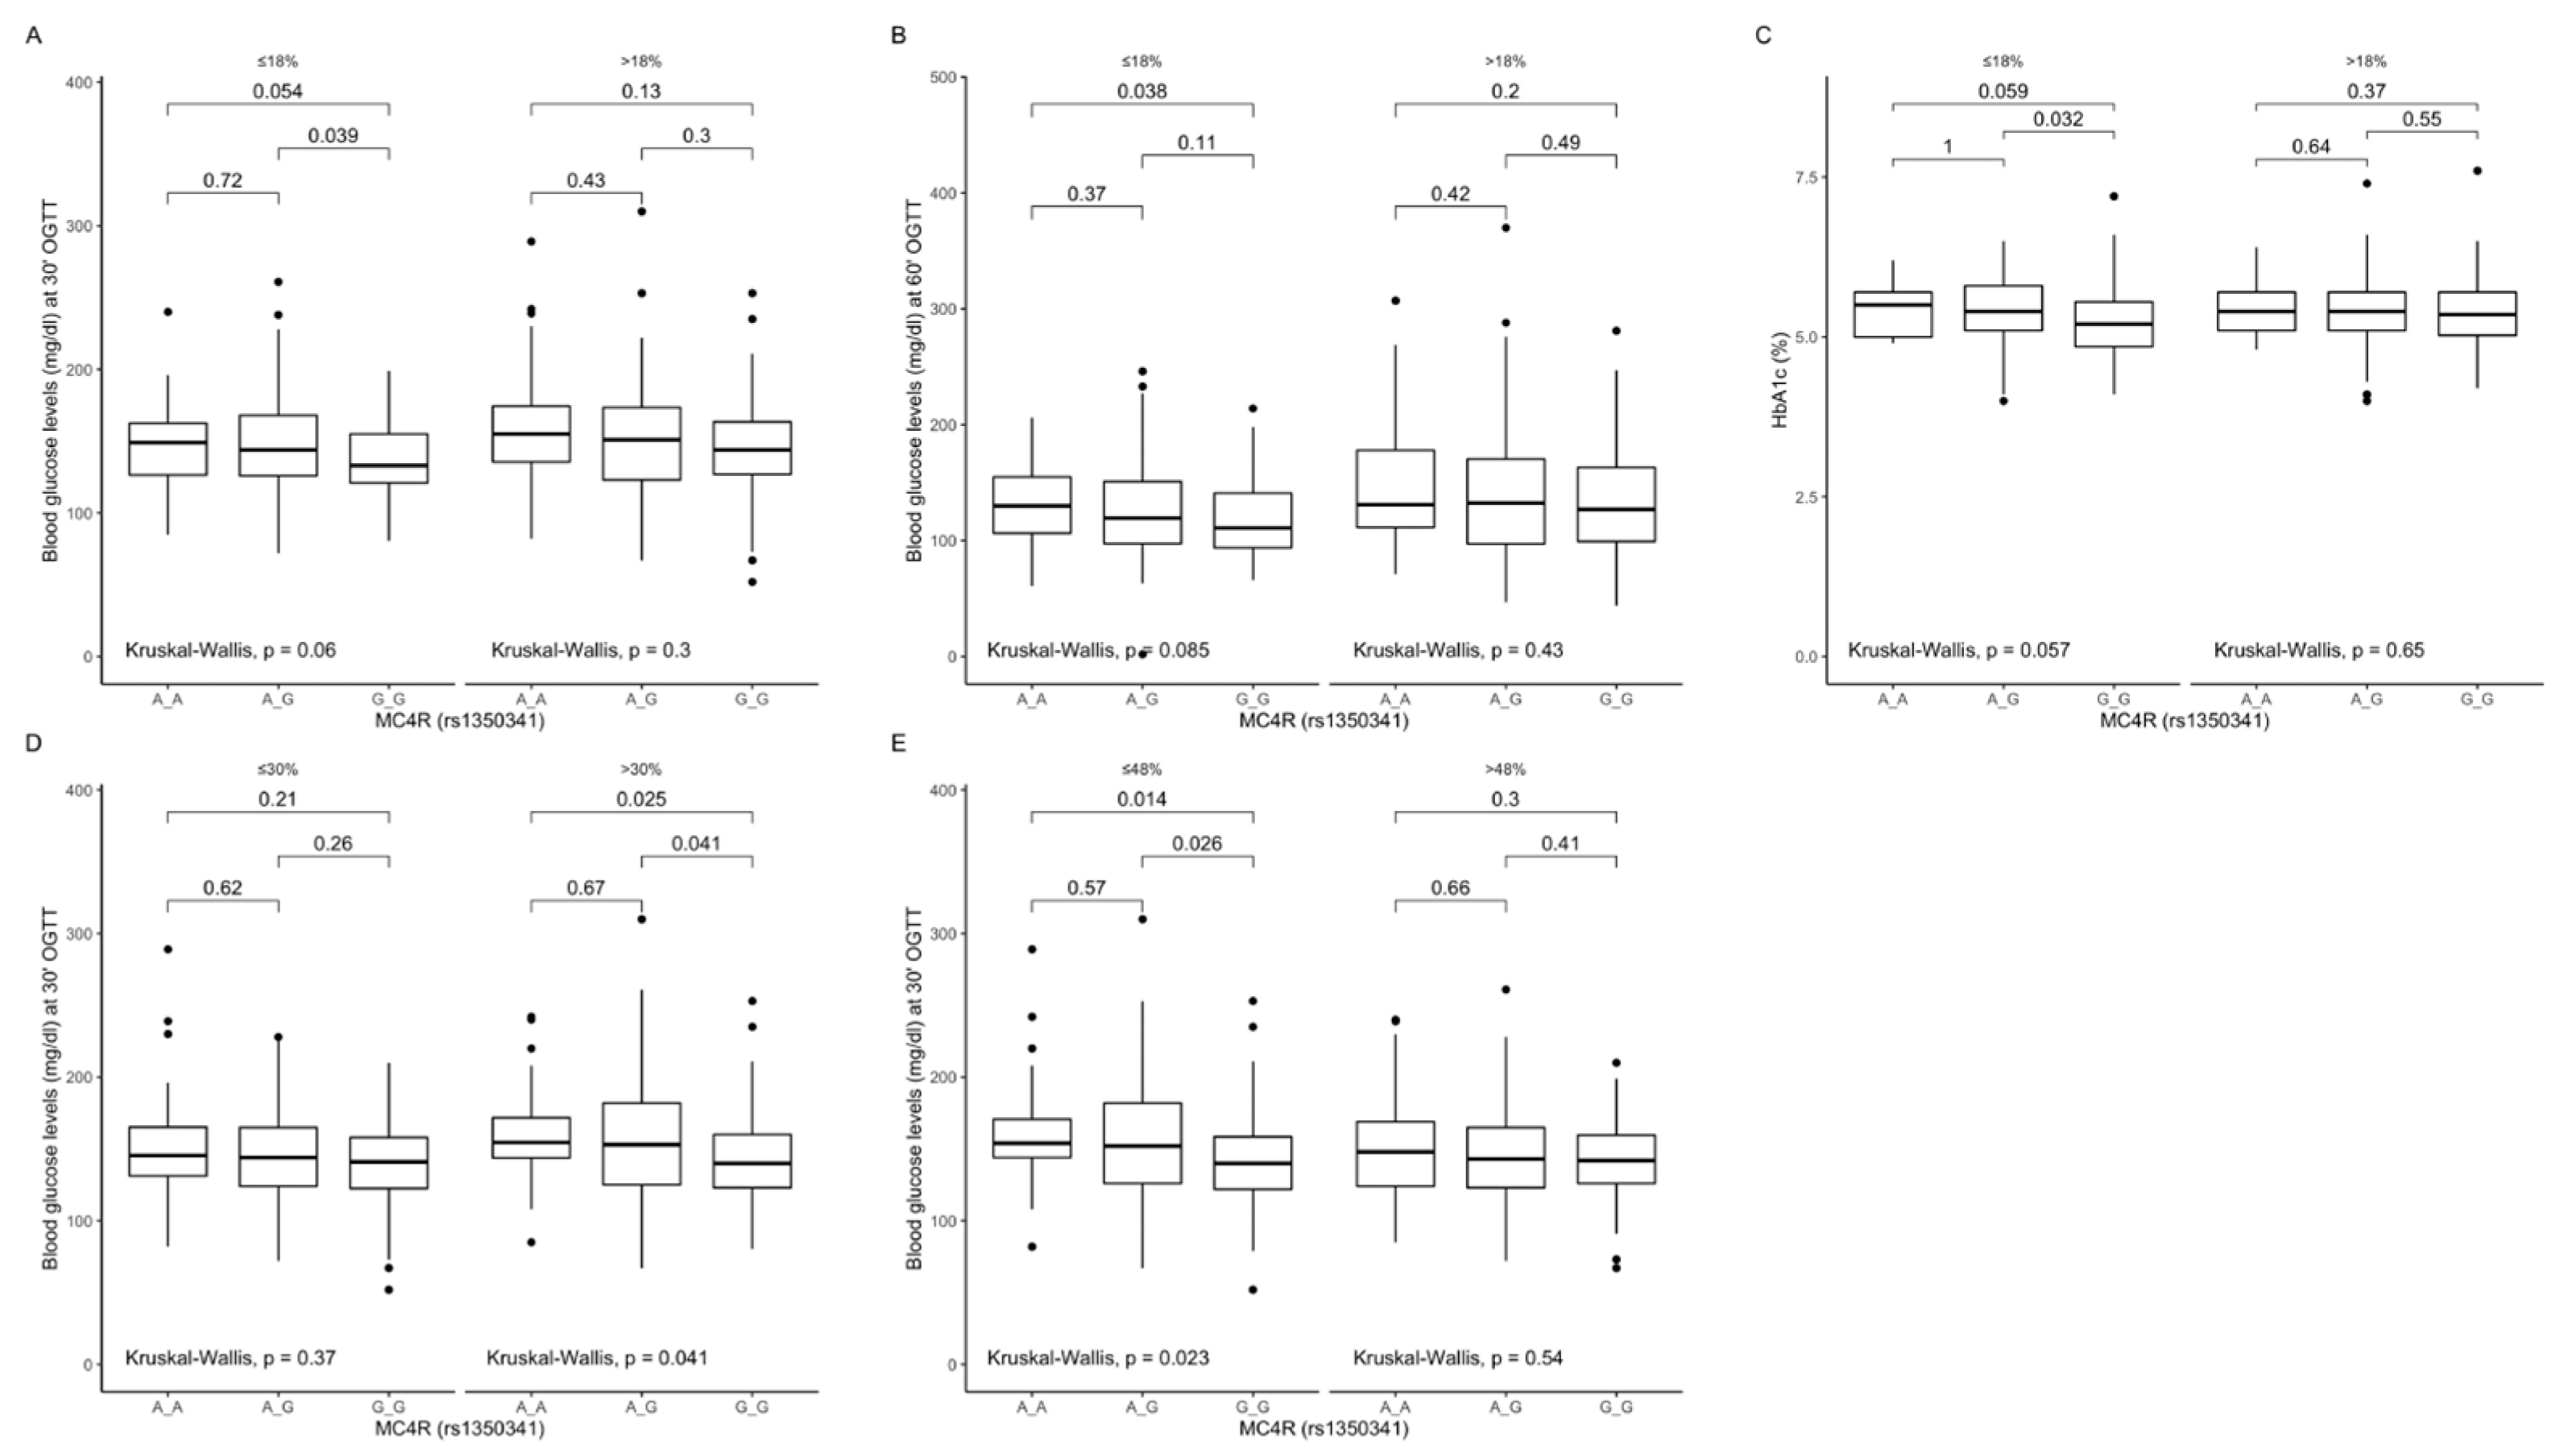
Association of MC4R rs1350341 genotypes with (A) blood glucose levels (mg/dL) at 30 min of OGTT, (B) blood glucose levels (mg/dL) at 60 min of OGTT and (C) HbA1c levels (%), by dietary protein intake strata: ≤18% and >18% of total daily energy intake. Association of MC4R rs1350341 genotypes with (D) blood glucose levels (mg/dL) at 30 min of OGTT, by dietary fat intake strata: ≤30% and >30% of total daily energy intake. Association of MC4R rs1350341 genotypes with (E) blood glucose levels (mg/dL) at 30 min of OGTT, by dietary carbohydrates intake strata: ≤48% and >48% of total daily energy intake. OGTT, Oral Glucose Tolerance Test.
Figure 9.
Association of MC4R rs1350341 genotypes with (A) blood glucose levels (mg/dL) at 30 min of OGTT, (B) blood glucose levels (mg/dL) at 60 min of OGTT and (C) HbA1c levels (%), by dietary protein intake strata: ≤18% and >18% of total daily energy intake. Association of MC4R rs1350341 genotypes with (D) blood glucose levels (mg/dL) at 30 min of OGTT, by dietary fat intake strata: ≤30% and >30% of total daily energy intake. Association of MC4R rs1350341 genotypes with (E) blood glucose levels (mg/dL) at 30 min of OGTT, by dietary carbohydrates intake strata: ≤48% and >48% of total daily energy intake. OGTT, Oral Glucose Tolerance Test.
Figure 10.
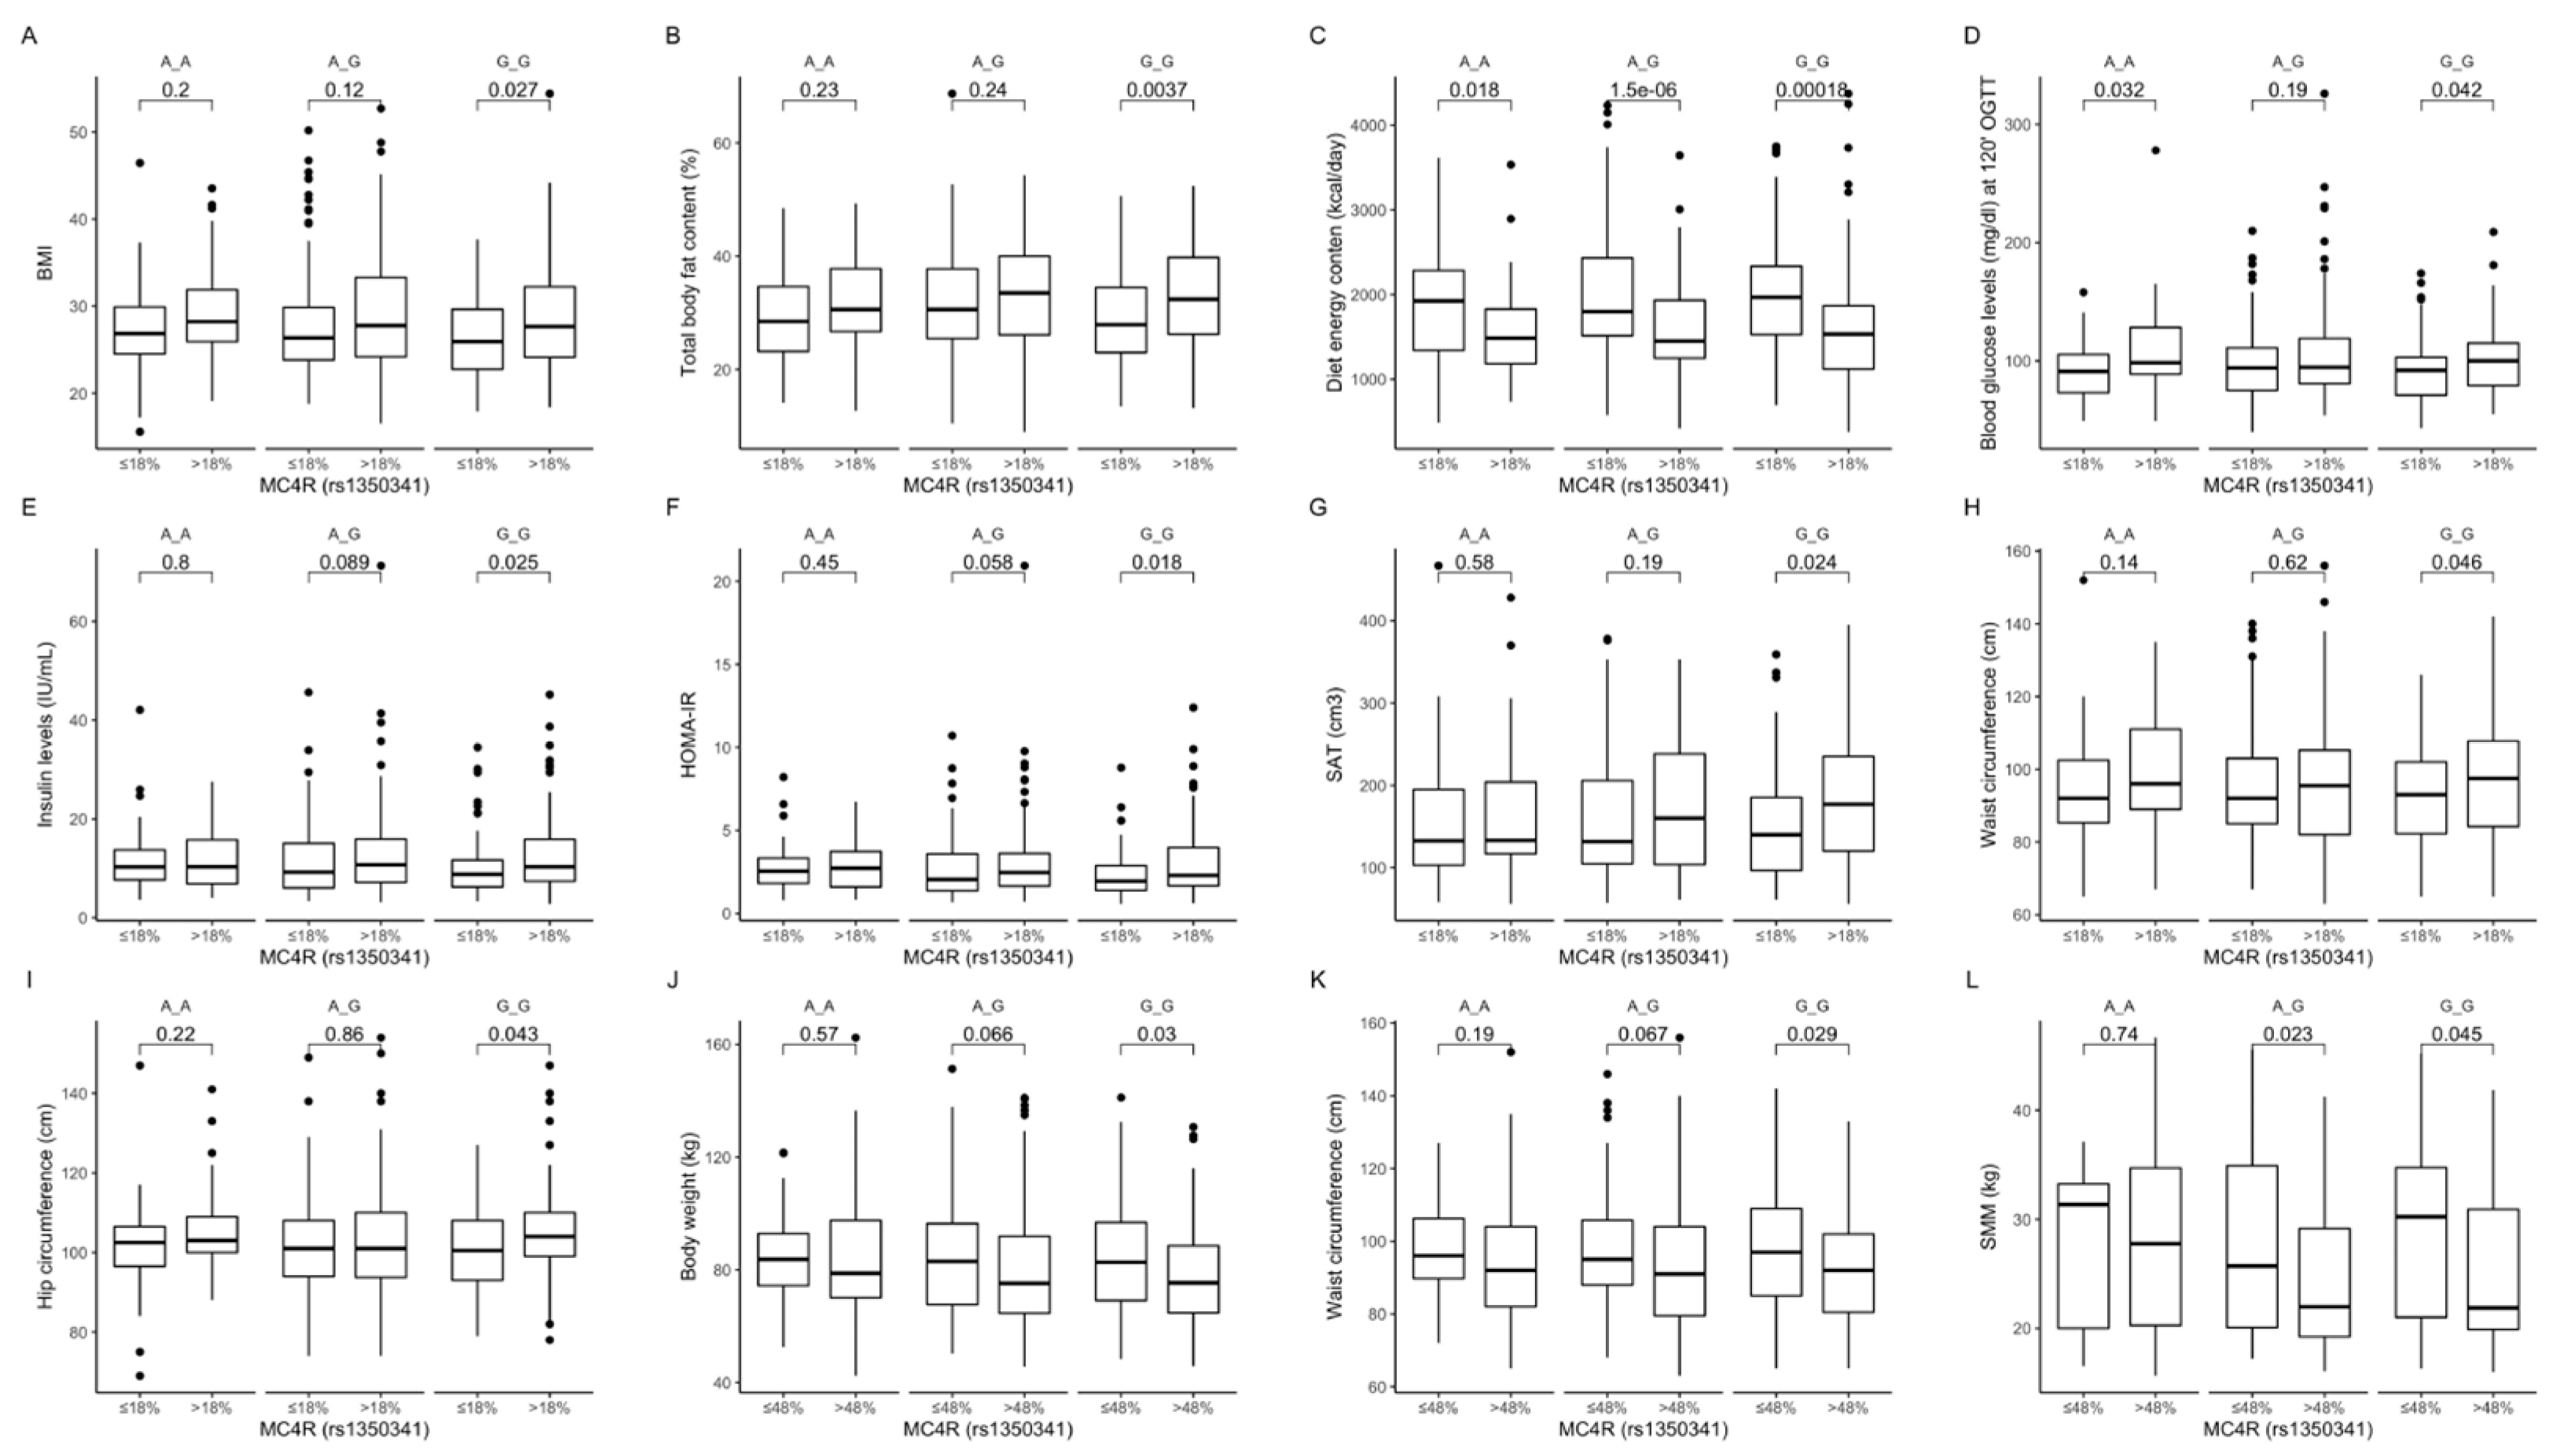
Association of dietary protein intake ≤ 18% and >18% of total daily energy intake with (A) BMI (kg/m2); (B) total body fat content (%); (C) diet energy content (kcal/day); (D) blood glucose levels (mg/dL) at 120 min of OGTT; (E) fasting insulin levels (IU/mL); (F) HOMA-IR; (G) SAT (cm3), (H) waist circumference (cm); and (I) hip circumference (cm), in MC4R rs1350341 genotype carriers. Association of dietary carbohydrates intake ≤ 48% and >48% of total daily energy intake with (J) body weight (kg); (K) waist circumference (cm); and (L) SMM (kg) in MC4R rs1350341 genotype carriers. BMI, Body Mass Index; HOMA-IR, Homeostatic Models Assessment of Insulin Resistance; OGTT, Oral Glucose Tolerance Test; SAT, subcutaneous adipose tissue; SMM, skeletal muscle mass.
Figure 10.
Association of dietary protein intake ≤ 18% and >18% of total daily energy intake with (A) BMI (kg/m2); (B) total body fat content (%); (C) diet energy content (kcal/day); (D) blood glucose levels (mg/dL) at 120 min of OGTT; (E) fasting insulin levels (IU/mL); (F) HOMA-IR; (G) SAT (cm3), (H) waist circumference (cm); and (I) hip circumference (cm), in MC4R rs1350341 genotype carriers. Association of dietary carbohydrates intake ≤ 48% and >48% of total daily energy intake with (J) body weight (kg); (K) waist circumference (cm); and (L) SMM (kg) in MC4R rs1350341 genotype carriers. BMI, Body Mass Index; HOMA-IR, Homeostatic Models Assessment of Insulin Resistance; OGTT, Oral Glucose Tolerance Test; SAT, subcutaneous adipose tissue; SMM, skeletal muscle mass.
Table 1.
Characteristics of studied population. Data presented as mean and standard deviation (SD), unless otherwise stated. BMI, body mass index, WHR, waist–hip ratio.
Table 1.
Characteristics of studied population. Data presented as mean and standard deviation (SD), unless otherwise stated. BMI, body mass index, WHR, waist–hip ratio.
| Parameter | |
|---|
| N (women/men, %) | 819 (52.5/47.5) |
| Age (years) | 42.1 (14.5) |
| BMI (kg/m2) | 28.5 (6.6) |
| % of subjects with BMI < 25.0 kg/ m2 (%) | 33.9 |
| % of subjects with BMI 25.0–29.9 kg/ m2 (%) | 34.5 |
| % of subjects with BMI ≥ 30.0 kg/ m2 (%) | 31.6 |
| Fat mass (kg) | 27.1 (13.8) |
| Fat mass (%) | 31.4 (9.6) |
| WHR | 0.928 (0.088) |
| Visceral fat (cm3) | 108.4 (80.6) |
| Visceral fat (%) | 37.1 (12.1) |
| Subcutaneous fat (cm3) | 167.9 (81.7) |
| Subcutaneous fat (%) | 62.8 (12.3) |
| Visceral/subcutaneous fat ratio | 0.669 (0.443) |
| Frequency of prediabetes or diabetes | |
| Yes | 411 (50.2%) |
| No | 408 (49.8%) |
| Fasting blood glucose level (mg/dL) | 98.8 (23.9) |
| Daily energy intake (kcal) | 1792.5 (697.4) |
| % of daily energy from protein | 18.9 (4.8) |
| % of daily energy from fat | 31.2 (7.5) |
| % of daily energy from carbohydrates | 47.6 (8.6) |
| Daily physical activity level, n (%) | |
| Low | 60 (7.3%) |
| Moderate | 173 (21.1%) |
| High | 586 (71.6%) |
Table 2.
Characteristics of participants stratified by rs17782313 genotypes. Data presented as mean and standard deviation (SD). OGTT, oral glucose tolerance test; WHR, waist–hip ratio.
Table 2.
Characteristics of participants stratified by rs17782313 genotypes. Data presented as mean and standard deviation (SD). OGTT, oral glucose tolerance test; WHR, waist–hip ratio.
| rs17782313 | C/C | C/T | T/T | p-Value |
|---|
| N (women/men) | 30 (10/20) | 275 (137/138) | 504 (277/227) | |
| Genotype frequency | 3.71% | 33.99% | 62.30% | >0.05 |
| BMI (kg/m2) | 29.8 (6.4) | 29.0 (6.9) | 28.1 (6.5) | 0.049 |
| BMI < 25.0 (kg/m2) | 7 (23.3%) | 83 (30.5%) | 182 (36.4%) | |
| BMI 25.0–29.9 (kg/m2) | 9 (30.0%) | 98 (36.0%) | 170 (34.0%) | 0.186 |
| BMI ≥ 30.0 (kg/m2) | 14 (46.7%) | 91 (33.5%) | 148 (29.6%) | |
| Fat mass (kg) | 29.2 (12.6) | 27.8 (14.6) | 26.6 (13.4) | 0.322 |
| Fat mass (%) | 32.0 (7.7) | 31.5 (10.0) | 31.3 (9.5) | 0.924 |
| WHR | 0.944 (0.100) | 0.935 (0.087) | 0.923 (0.088) | 0.133 |
| Visceral fat (cm3) | 151.9 (114.3) | 115.9 (89.7) | 101.7 (71.8) | 0.264 |
| Visceral fat (%) | 42.5 (14.0) | 38.1 (13.9) | 36.2 (10.7) | 0.107 |
| Subcutaneous fat (cm3) | 179.8 (82.2) | 167.7 (79.7) | 167.0 (82.8) | 0.693 |
| Subcutaneous fat (%) | 57.5 (14.0) | 61.9 (13.9) | 63.6 (11.2) | 0.110 |
| Visceral/subcutaneous fat ratio | 0.847 (0.478) | 0.736 (0.575) | 0.623 (0.345) | 0.105 |
| Frequency of prediabetes or diabetes | | | | |
| Yes | 19 (61.3%) | 148 (53.6%) | 241 (47.4%) | 0.118 |
| No | 12 (38.7%) | 128 (46.4%) | 267 (52.6%) |
| Fasting blood glucose level (mg/dL) | 104.5 (31.8) | 98.2 (24.0) | 94.7 (17.2) | 0.037 |
| Blood glucose level at 30′ of OGTT (mg/dL) | 151.1 (32.0) | 148.8 (37.3) | 145.2 (35.8) | 0.217 |
| Daily energy intake (kcal) | 1575.1 (1017.8) | 1825.0 (697.5) | 1774.6 (689.4) | 0.514 |
| % of daily energy from protein | 19.8 (2.4) | 18.7 (4.3) | 19.1 (5.1) | 0.329 |
| % of daily energy from fat | 27.9 (9.0) | 31.1 (6.7) | 31.3 (7.9) | 0.563 |
| % of daily energy from carbohydrates | 50.2 (9.3) | 47.6 (8.2) | 47.4 (8.9) | 0.644 |
| Daily physical activity level | | | | |
| Low | 2 (6.5%) | 22 (8.0%) | 35 (6.9%) | |
| Moderate | 10 (32.3%) | 53 (19.2%) | 109 (21.5%) | 0.528 |
| High | 19 (61.3%) | 201 (72.8%) | 364 (71.7%) | |
Table 3.
Characteristics of participants stratified by rs12970134 genotypes. Data presented as mean and standard deviation (SD). OGTT, oral glucose tolerance test; WHR, waist–hip ratio.
Table 3.
Characteristics of participants stratified by rs12970134 genotypes. Data presented as mean and standard deviation (SD). OGTT, oral glucose tolerance test; WHR, waist–hip ratio.
| rs12970134 | A/A | A/G | G/G | p-Value |
|---|
| N (women/men) | 44 (18/26) | 308 (157/151) | 459 (251/208) | |
| Genotype frequency | 5.43% | 37.98% | 56.59% | >0.05 |
| BMI (kg/m2) | 30.6 (6.8) | 28.8 (6.8) | 28.1 (6.5) | 0.010 |
| BMI < 25.0 (kg/m2) | 8 (18.2%) | 98 (32.1%) | 166 (36.5%) | |
| BMI 25.0–29.9 (kg/m2) | 15 (34.1%) | 105 (34.4%) | 157 (34.5%) | 0.050 |
| BMI ≥ 30.0 (kg/m2) | 21 (47.7%) | 102 (33.4%) | 132 (29.0%) | |
| Fat mass (kg) | 31.3 (13.9) | 27.5 (14.1) | 26.4 (13.6) | 0.035 |
| Fat mass (%) | 33.7 (8.2) | 31.6 (9.8) | 31.1 (9.7) | 0.209 |
| WHR | 0.949 (0.099) | 0.936 (0.089) | 0.921 (0.086) | 0.021 |
| Visceral fat (cm3) | 145.6 (111.7) | 111.6 (82.6) | 102.9 (75.0) | 0.235 |
| Visceral fat (%) | 39.4 (15.3) | 37.8 (13.1) | 36.4 (10.9) | 0.685 |
| Subcutaneous fat (cm3) | 196.4 (74.5) | 165.5 (77.2) | 167.0 (85.2) | 0.075 |
| Subcutaneous fat (%) | 60.6 (15.3) | 62.2 (13.1) | 63.5 (11.4) | 0.693 |
| Visceral/subcutaneous fat ratio | 0.777 (0.527) | 0.712 (0.533) | 0.630 (0.355) | 0.672 |
| Frequency of prediabetes or diabetes | | | | |
| Yes | 26 (57.8%) | 162 (52.3%) | 221 (47.8%) | 0.285 |
| No | 19 (42.2%) | 148 (47.7%) | 241 (52.2%) |
| Fasting blood glucose level (mg/dl) | 104.1 (33.1) | 97.8 (22.2) | 94.5 (17.4) | 0.038 |
| Blood glucose level at 30′ of OGTT (mg/dl) | 148.8 (33.4) | 149.3 (36.3) | 144.6 (36.4) | 0.119 |
| Daily energy intake (kcal) | 1599.3 (887.3) | 1831.3 (700.8) | 1780.0 (683.7) | 0.316 |
| % of daily energy from protein | 20.5 (4.1) | 18.6 (4.1) | 19.0 (5.2) | 0.130 |
| % of daily energy from fat | 29.1 (7.4) | 31.1 (7.1) | 31.3 (7.7) | 0.490 |
| % of daily energy from carbohydrates | 47.9 (8.3) | 47.9 (8.4) | 47.4 (8.8) | 0.691 |
| Daily physical activity level | | | | |
| Low | 4 (8.9%) | 21 (6.8%) | 35 (7.6%) | |
| Moderate | 13 (28.9%) | 61 (19.7%) | 99 (21.4%) | 0.623 |
| High | 28 (62.2%) | 228 (73.5%) | 328 (71.0%) | |
Table 4.
Characteristics of participants stratified by rs633265 genotypes. Data presented as mean and standard deviation (SD). OGTT, oral glucose tolerance test; WHR, waist–hip ratio.
Table 4.
Characteristics of participants stratified by rs633265 genotypes. Data presented as mean and standard deviation (SD). OGTT, oral glucose tolerance test; WHR, waist–hip ratio.
| rs633265 | G/G | G/T | T/T | p-Value |
|---|
| N (women/men) | 278 (151/127) | 399 (213/186) | 130 (59/71) | |
| Genotype frequency | 34.45% | 49.44% | 16.11% | >0.05 |
| BMI (kg/m2) | 27.9 (6.3) | 28.6 (6.8) | 28.9 (6.4) | 0.134 |
| BMI < 25.0 (kg/m2) | 100 (36.2%) | 140 (35.4%) | 32 (24.8%) | |
| BMI 25.0–29.9 (kg/m2) | 93 (33.7%) | 132 (33.4%) | 51 (39.5%) | 0.219 |
| BMI ≥ 30.0 (kg/m2) | 83 (30.1%) | 123 (31.1%) | 46 (35.7%) | |
| Fat mass (kg) | 26.1 (12.4) | 27.5 (14.8) | 27.6 (13.1) | 0.535 |
| Fat mass (%) | 31.1 (9.1) | 31.7 (10.3) | 31.1 (8.6) | 0.786 |
| WHR | 0.924 (0.087) | 0.928 (0.089) | 0.936 (0.088) | 0.474 |
| Visceral fat (cm3) | 101.9 (68.5) | 107.0 (82.0) | 123.8 (95.4) | 0.379 |
| Visceral fat (%) | 36.5 (10.9) | 36.7 (12.2) | 39.4 (13.9) | 0.163 |
| Subcutaneous fat (cm3) | 167.6 (81.4) | 166.7 (80.9) | 170.5 (84.3) | 0.935 |
| Subcutaneous fat (%) | 63.5 (10.9) | 63.1 (12.8) | 60.7 (13.8) | 0.169 |
| Visceral/subcutaneous fat ratio | 0.635 (0.368) | 0.665 (0.484) | 0.749 (0.471) | 0.164 |
| Frequency of prediabetes or diabetes | | | | |
| Yes | 132 (46.8%) | 203 (50.8%) | 73 (55.7%) | 0.244 |
| No | 150 (53.2%) | 197 (49.2%) | 58 (44.3%) |
| Fasting blood glucose level (mg/dL) | 98.1 (21.2) | 96.8 (22.6) | 94.5 (16.7) | 0.144 |
| Blood glucose level at 30′ of OGTT (mg/dL) | 152.6 (38.7) | 147.8 (36.1) | 142.0 (34.7) | 0.023 |
| Daily energy intake (kcal) | 1818.8 (740.8) | 1796.5 (675.8) | 1733.0 (668.6) | 0.715 |
| % of daily energy from protein | 19.1 (5.3) | 18.7 (4.5) | 19.2 (4.5) | 0.502 |
| % of daily energy from fat | 32.1 (8.1) | 30.5 (7.1) | 31.4 (7.2) | 0.120 |
| % of daily energy from carbohydrates | 47.0 (9.3) | 47.9 (8.4) | 47.2 (8.0) | 0.535 |
| Daily physical activity level | | | | |
| Low | 15 (5.3%) | 36 (9.0%) | 9 (6.9%) | |
| Moderate | 66 (23.4%) | 79 (19.8%) | 26 (19.8%) | 0.401 |
| High | 201 (71.3%) | 285 (71.2%) | 96 (73.3%) | |
Table 5.
Characteristics of participants stratified by rs1350341 genotypes. Data presented as mean and standard deviation (SD). OGTT, oral glucose tolerance test; WHR, waist–hip ratio.
Table 5.
Characteristics of participants stratified by rs1350341 genotypes. Data presented as mean and standard deviation (SD). OGTT, oral glucose tolerance test; WHR, waist–hip ratio.
| rs1350341 | A/A | A/G | G/G | p-Value |
|---|
| N (women/men) | 127 (59/68) | 390 (207/183) | 274 (149/125) | |
| Genotype frequency | 16.06% | 49.30% | 34.64% | >0.05 |
| BMI (kg/m2) | 29.0 (6.5) | 28.7 (7.0) | 27.9 (6.3) | 0.128 |
| BMI <25.0 (kg/ m2) | 31 (24.6%) | 136 (35.2%) | 100 (36.8%) | |
| BMI 25.0–29.9 (kg/ m2) | 51 (40.5%) | 131 (33.9%) | 91 (33.5%) | 0.196 |
| BMI ≥30.0 (kg/ m2) | 44 (34.9%) | 119 (30.8%) | 81 (29.8%) | |
| Fat mass (kg) | 27.7 (13.2) | 27.4 (15.0) | 26.1 (12.5) | 0.484 |
| Fat mass (%) | 31.2 (8.6) | 31.5 (10.3) | 31.1 (9.1) | 0.890 |
| WHR | 0.934 (0.089) | 0.927 (0.088) | 0.923 (0.087) | 0.507 |
| Visceral fat (cm3) | 124.9 (96.8) | 106.1 (81.4) | 101.7 (69.1) | 0.386 |
| Visceral fat (%) | 39.1 (14.0) | 36.7 (12.3) | 36.6 (11.0) | 0.294 |
| Subcutaneous fat (cm3) | 173.3 (84.9) | 165.3 (80.2) | 165.8 (80.2) | 0.734 |
| Subcutaneous fat (%) | 61.0 (13.9) | 63.1 (12.9) | 63.4 (11.0) | 0.304 |
| Visceral/subcutaneous fat ratio | 0.741 (0.476) | 0.669 (0.490) | 0.638 (0.371) | 0.296 |
| Frequency of prediabetes or diabetes | | | | |
| Yes | 69 (53.9%) | 195 (50.0%) | 129 (46.7%) | 0.385 |
| No | 59 (46.1%) | 195 (50.0%) | 147 (53.3%) |
| Fasting blood glucose level (mg/dl) | 97.4 (20.7) | 95.9 (17.9) | 94.3 (16.2) | 0.198 |
| Blood glucose level at 30′ of OGTT (mg/dl) | 152.4 (38.7) | 148.3 (36.0) | 142.0 (34.8) | 0.021 |
| Daily energy intake (kcal) | 1741.1 (670.7) | 1789.2 (674.1) | 1823.0 (744.7) | 0.742 |
| % of daily energy from protein | 19.2 (4.6) | 18.7 (4.3) | 19.1 (5.4) | 0.604 |
| % of daily energy from fat | 31.4 (7.1) | 30.5 (7.2) | 32.1 (8.1) | 0.097 |
| % of daily energy from carbohydrates | 47.2 (8.1) | 48.0 (8.4) | 47.0 (9.3) | 0.476 |
| Daily physical activity level | | | | |
| Low | 8 (6.2%) | 34 (8.7%) | 15 (5.4%) | |
| Moderate | 27 (21.1%) | 76 (19.5%) | 62 (22.5%) | 0.524 |
| High | 93 (72.7%) | 280 (71.8%) | 199 (72.1%) | |


 ,
, 


