Article

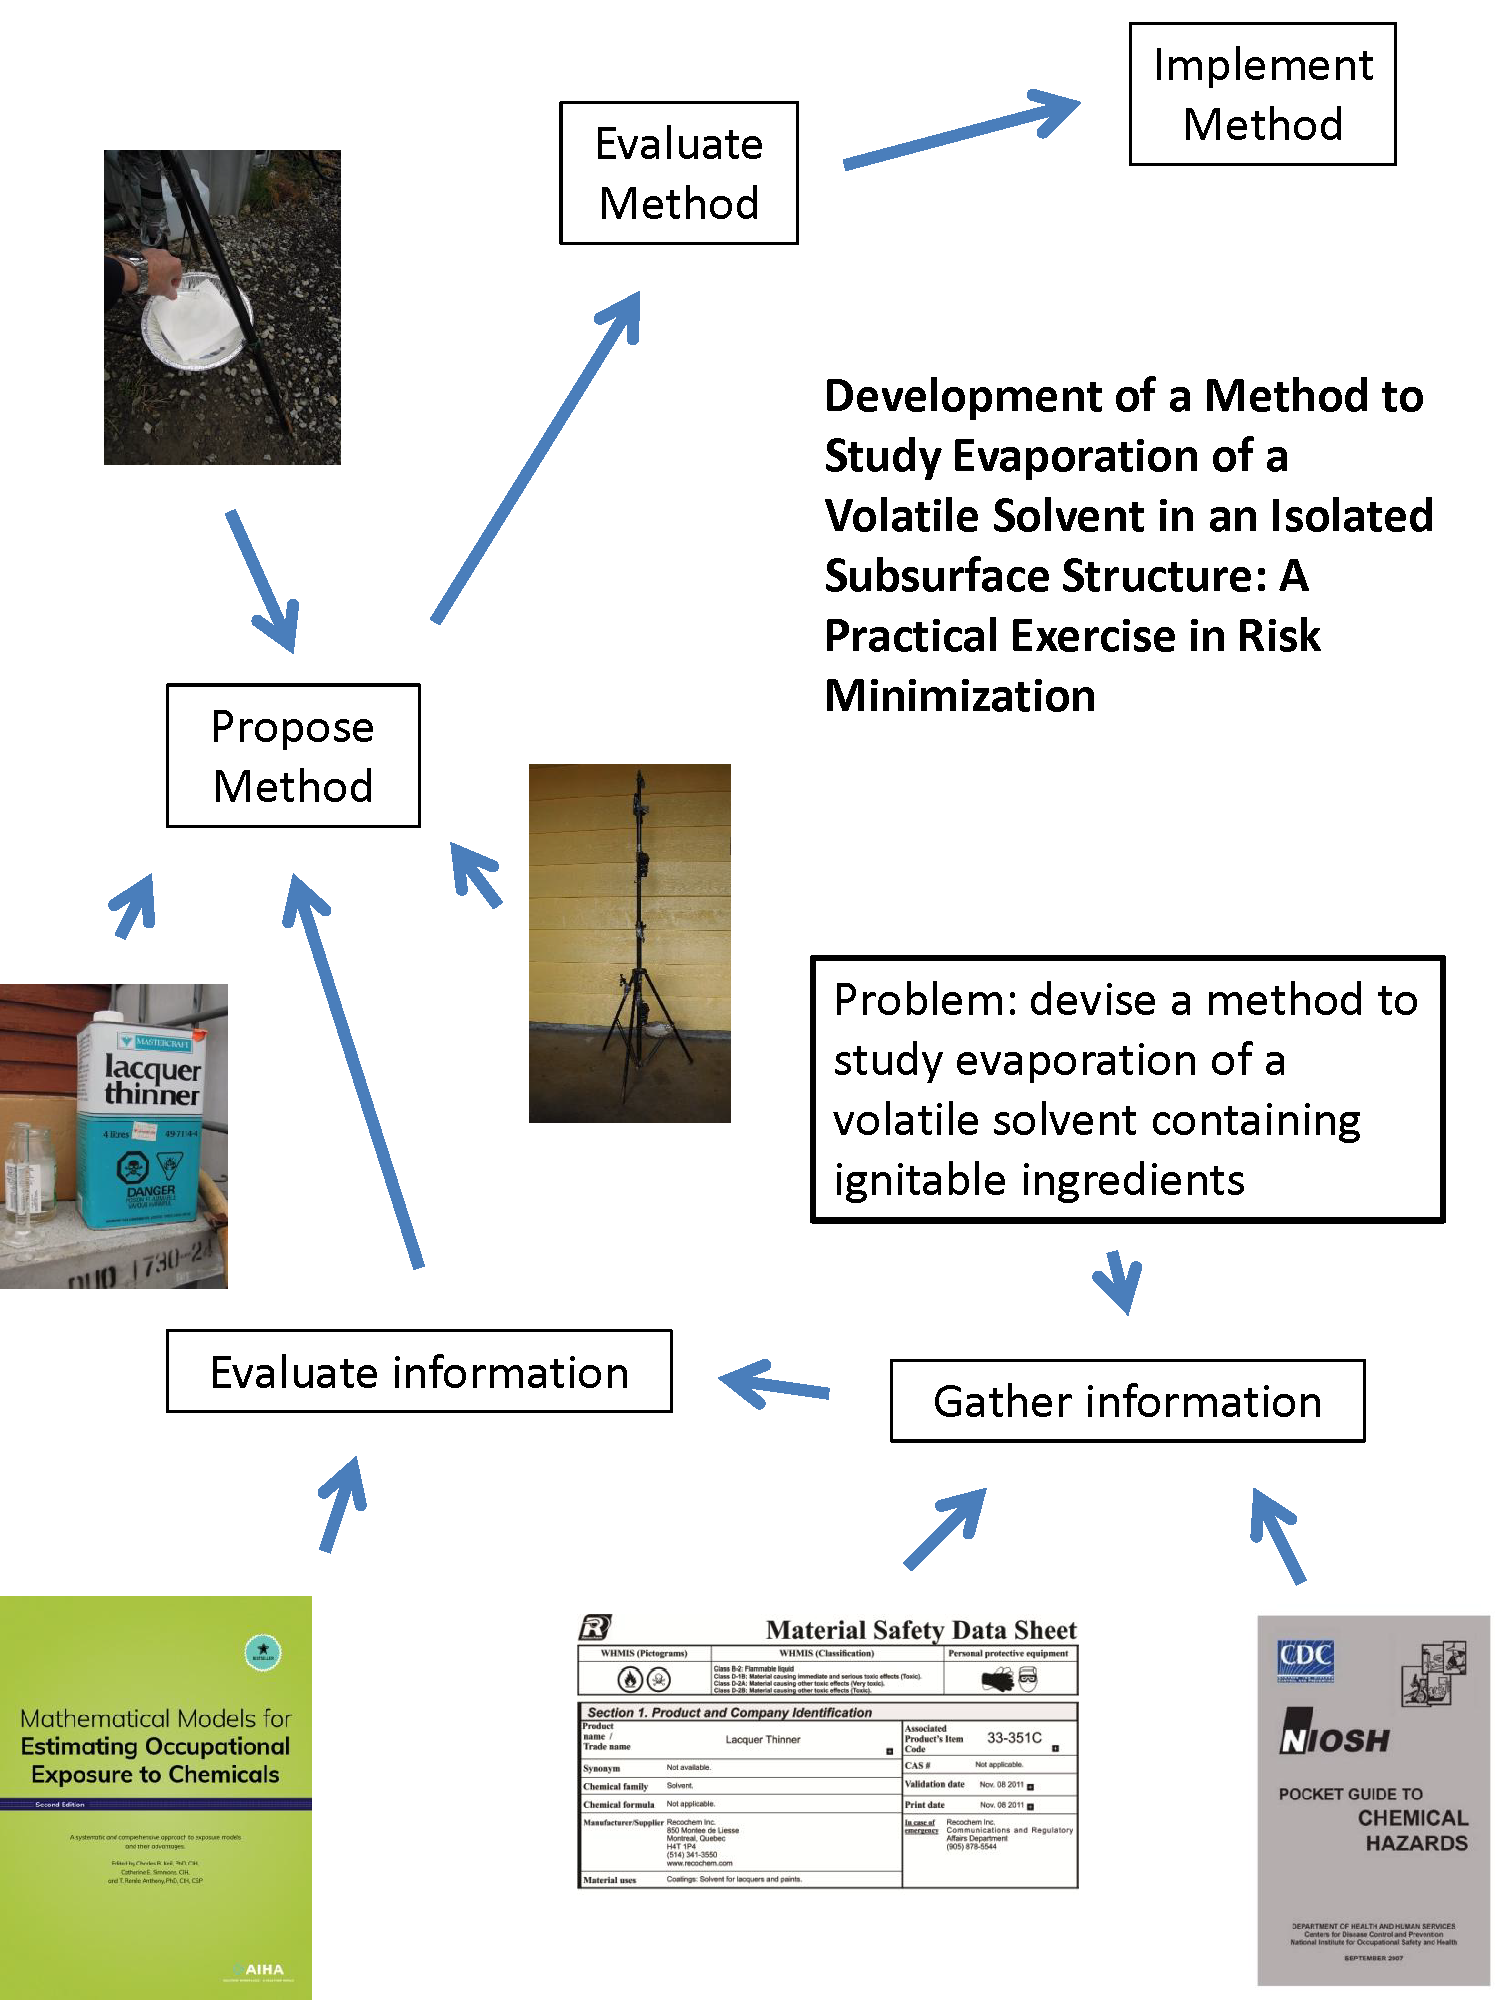
Development of a Method to Study Evaporation of a Volatile Solvent in an Isolated Subsurface Structure: A Practical Exercise in Risk Minimization

1
NorthWest Occupational Health & Safety, North Vancouver, BC V7K 1P3, Canada
2
Programa de Engenharia Ambiental, Universidade Federal do Rio de Janeiro, Rio de Janeiro 21941-972, Brazil
3
Escola Politécnica, Universidade Federal do Rio de Janeiro, Rio de Janeiro 21941-972, Brazil
*
Author to whom correspondence should be addressed.
Submission received: 20 July 2020 / Revised: 1 August 2020 / Accepted: 6 August 2020 / Published: 8 August 2020

Abstract

:
This article describes development and confirmatory testing of a method to study the evaporation of a volatile solvent containing ignitable ingredients in an isolated subsurface structure, a type of confined space. Accidental spillage and surreptitious disposal of chemical products in streets create a risk of fire and explosions in these structures. Development of the method included consideration about instrument safety; personal exposure; volume of the structure (2.5 m3); evaporation rate; temperature of the airspace; and number of opening(s) in the manhole cover. Confirmatory testing utilized 10 mL of lacquer thinner (60% to 80% toluene, 10% to 20% methylethyl ketone (MEK), 5% to 10% methanol and 1% to 9% acetone) on a wetted paper towel positioned near the bottom of the structure. This methodology produced a maximum of 2150 ppm of ‘isobutylene units’ on a PID (PhotoIonization sensor) positioned about 15 cm above the sample. This concentration corresponds to about 1140 ppm of toluene (less than 10% of the Lower Flammable Limit of 12,700 ppm). This method offers a stable, safe platform for study of the process. Evaporation of solvent and exchange between the external atmosphere and the airspace regulate the concentration of vapor, which can typically persist for 24 to 48 h.

Graphical Abstract

1. Introduction

Subsurface infrastructure is all around us under foot. All that normally indicate the presence of these structures are the manhole and access covers located at grade. Some of these structures are connected together in open systems while others are completely independent from each other. Open systems include inter-building utility tunnels and vaults, structures in the wastewater collection system (storm water and sanitary), the underground electrical system, and possibly vaults and manholes in the telecommunication system. Open systems distinguish themselves through interconnection by pipe or duct between vaults and manholes that allow unhindered movement of the atmosphere in the airspace of the system. That is, contamination introduced in one location can spread throughout the system. Systems that contain isolated subsurface structures include the potable water systems, fuel gas distribution, district hot water and steam heating, and older underground electrical systems.
Fires and explosions in the subsurface infrastructure are not new. To illustrate, on 22 April 1992, a series of explosions occurred in the metropolitan area of Mexico’s second largest city, Guadalajara [1]. These explosions resulted from the ignition of gasoline vapor that accumulated in the main sewer subsequent to a leak in an underground pipeline transporting gasoline. Underground electrical vaults in older parts of Rio de Janeiro and Sao Paulo, Brazil experienced explosions dating back to 1911 [2]. Rio de Janeiro has an estimated 4800 subsurface transformer vaults. Studies performed by investigators at the (US) Bureau of Mines in the 1920s and early 1930s in collaboration with utilities in Boston demonstrated the potential for the accumulation of ignitable materials and potential for continuation of the problem to the present era [3,4]. The latter studies detected gasoline vapor and fuel gases from the surface soil and ignitable gases of soil origin including methane and hydrogen. Modern studies indicate a similar pattern [5]. Approximately 75% of the explosions in the underground electrical system involve chemical products. A study of episodes in New York and the surrounding area estimated the rate to be (1 failure)/(375 structures)/(year) [6].
This work describes development and demonstration of a method to study evaporation of a volatile solvent containing ignitable ingredients in an isolated subsurface structure in the subsurface infrastructure. Entry of volatile liquid chemical substances accidentally spilled in the vicinity or deliberately poured into openings in the manhole cover or access hatch can facilitate development of a contaminated and possibly ignitable atmosphere in the airspace. This contamination will undergo dispersion within the airspace and exchange with the exterior atmosphere over the passage of time because ventilation induced by natural forces is occurring [7,8,9,10,11].
Usually there is no indication about the composition and quantity of the spilled material, and the concentration and consequence of the atmosphere that develops in the airspace of the isolated structure during these events. Little, if any, information is available concerning the dynamics of development and dispersion of contaminated atmospheres resulting from the evaporation of liquids in subsurface infrastructures. Usually this information emerges at most qualitatively in summaries of accidents occurring during construction and in-service [1,5,12,13,14,15,16,17,18,19,20]. Hence, there is a demonstrable incentive to develop methodology to facilitate the study of evaporation under these circumstances.
Many, if not all, of the structures described in the previous discussion meet generally accepted criteria for classification as confined spaces [12]. Confined spaces are typically structures in which people do not or cannot routinely work and are not designed or intended for entry and work. However, because of the need to perform activity in these structures, they become workspaces.
Preparation for entry into isolated subsurface chambers poses considerable risk because associated activity creates the first contact with the undiluted atmosphere contained in the airspace [21]. Workers preparing for entry into previously closed structures must establish ambient conditions in the airspace. This activity can necessitate partial or full removal of the manhole cover or access hatch in order to insert the probe of the atmospheric testing instrument or, in some cases, the entire instrument in order to assess the condition of the atmosphere, and the duct of the portable ventilation system.
The published technical literature contains little information about preparation for entry into previously enclosed and isolated structures. What information does exist has arisen primarily from anecdotal sources. Investigators at the Bureau of Mines published the first articles concerning ventilation induced by natural forces in isolated subsurface structures through openings in manhole covers using gas mixtures maintained under equilibrium conditions [7,8,9,10]. More recently, Wiegand and Dunne [21] examined the ventilation of a subsurface structure induced by natural airflow through an open or partially open manhole. These authors showed rapid decrease in concentration of contaminant inside the structure. This decrease indicated the expulsion of the atmosphere in the airspace to the external atmosphere outside the manhole opening.
McManus [11] studied ventilation induced by natural forces of a mixture of exhaust gases from a small engine through opening(s) in the manhole cover of an isolated subsurface concrete vault. This study showed that the ventilation of such spaces through one or more openings in the manhole cover is a continuous, naturally occurring process. The air entering the structure moves continually throughout the airspace to produce rapid and thorough mixing. Ventilation rate depends on the number of openings in the manhole cover. For a single opening, the ventilation rate was as high as 8.8 L/min and 10 to 12.5 L/min for 2 openings.

1.1. Considerations in Method Development

The first part of this work was to discuss and consider parameters involved in predicting the composition of the atmosphere following the evaporation of volatile solvents readily available in the marketplace. The published technical literature contains nothing concerning evaporation of volatile solvents into the airspace of isolated subsurface structures as could occur following a spill on the ground or surreptitious disposal and entry through opening(s) in the manhole cover. Methodology for a study of evaporation must consider several possibly conflicting requirements. The overriding requirement is prevention from overexposure of the worker(s) and/or fire and/or explosion involving ingredients of the test solvent. Consideration of safety in experimental methodology has become an important topic following a number of high-profile accidents. The absence of information on this topic in the published technical literature is an important stimulus for this type of discussion.
Overexposure is unlikely given the brevity of handling and small quantity of the test solvent during a controlled experiment. Hence, the quantity used in conjunction with rate of evaporation must not exceed fire and explosion parameters in the airspace. A conflicting requirement is to select a product containing ingredient(s) detectable by the sensor in the measuring instrument at low levels. Similarly, the presence of vapor from the product must not interfere with naturally occurring processes. Consideration also must extend to the environment in the airspace because temperature and air velocity influence the rate of evaporation [22].
Commercial volatile solvents often are mixtures of ingredients that collectively create desired properties of solvency and evaporation. Lacquer thinner is a volatile chemical product readily available in hardware stores. Lacquer thinner also is a candidate for surreptitious disposal in subsurface structures located in the community. The Material Safety Data Sheet (MSDS) [23] (now Safety Data Sheet) indicates that this version of lacquer thinner contained 60 to 80% (by weight) of toluene; 10 to 20%, methylethyl ketone (MEK); 5 to 10%, methanol, and 1 to 9%, acetone. The mid-point of the percent composition of these ingredients was used as the basis for further discussion except for acetone. Equation (1) (Raoult’s Law) predicts the pressure of individual vapors in equilibrium with liquid components in mixtures [22,24]:
P A = γ X A P A 0
where
PA = pressure of the vapor of component A in the airspace above the liquid, mmHg.
γ = the activity coefficient. The activity coefficient addresses non-ideal behavior shown by individual molecules of a component in their interaction with molecules of other components, unitless.
XA = the mole fraction of component A in the liquid mixture. Mole fraction is calculated from the weight percent of component A in the liquid mixture, unitless.
P A 0 = vapor pressure of pure component A at the temperature of the liquid, mmHg.
Readily available software calculates values of saturated vapor pressure for components and γ for mixtures under different conditions [22,24,25,26]. Table 1 provides information for the formulation mentioned above. Properties were expressed relative to 13 °C, the lowest temperature expected during this study (outdoor conditions) and 25 °C, the highest [11].
The lowest temperature has importance for detectability by the sensor and the highest for concern regarding the capability of fire and explosion. Table 1 applies only at the beginning of evaporation when the relationship between components reflects information provided in the MSDS. Composition of vapor during evaporation is difficult to predict because of possible preferential evaporation of the more/most volatile component(s). Vapor pressure and the evaporation potential of the mixture approximately double during the increase in temperature from 13 °C to 25 °C [24].
The risk of fire and explosion depends on temperature because of the influence on evaporation of components in the liquid [22,24]. The MSDS for the lacquer thinner discussed above indicates that the measured Flash Point for the product is −2 °C using the closed cup method [23]. At the temperature of the Flash Point, sufficient vapor emits from the surface of the liquid to be ignited by an energetic ignition source after passing through the opening in the testing apparatus [27]. As a result, Flash Point is one of several important indicators of risk in use of a product. Taken in isolation, the measured value considerably increases concern about safety in the use of this product, yet reality indicates that the product is routinely used in industry and in the home, almost always without incident. Clearly, additional information is needed to resolve this concern.
Table 2 provides additional information for the ingredients in the lacquer thinner under discussion, starting with Flash Points for the ingredients [28]. The Lower Flammable Limit (LFL) is the companion to the Flash Point. LFL is the concentration of vapor in air at the Flash Point [27,28,29]. Hence, LFL is the concentration of vapor at −2 °C. LFL is stated typically in units of percent. However, in this situation, expressing concentration in g/m3 is more intuitive in the calculations. The conversion between percent and g/m3 is analogous to the equation used to convert parts per million to mg/m3 where 1% = 10,000 ppm. Table 2 contains LFL values based on a temperature of 25 °C. This is the upper temperature to which the liquid is expected to be exposed.
Using data in Table 2, Le Chatelier’s equation [29], Equation (2), predicts the LFL for the mixture at the beginning of evaporation based on (LFL)i and xi for individual components to be 54 g/m3. This is consistent with the LFL values for the ingredients tabulated in Table 2.
L F L = 1 x i ( L F L ) i
where:
LFL = Lower Flammable Limit of the mixture, g/m3.
xi = mole fraction of component i in the mixture, unitless.
(LFL)i = Lower Flammable Limit of vapor of component, i, g/m3.
The (US) Bureau of Mines explored the question of LFL of mixtures many years ago [29]. The investigators determined that the concentration of LFL of organic substances ranges commonly from 40 to 45 g/m3 with outliers between 35 to 50 g/m3. Use of LeChatelier’s equation enables the prediction of LFL of mixtures by calculation. The LFL for gasoline is 48 g/m3. The value can be measured or predicted based on composition of ingredients. Gasoline is the sum of its parts, as are lacquer thinner and other organic solvents that could enter these structures.
The quantity of the product proposed for use in testing was 10 mL. This corresponds to 10 mL × 0.8 g/mL = 8 g based on information contained in the MSDS [23]. Based on this mass and the volume of the space of 2.5 m3, the maximum concentration averaged throughout the airspace in the absence of ventilation induced by natural forces would be 8 g/(2.5 m3) = 3.2 g/m3. For the airspace to contain a concentration of 54 g/m3 (the calculated LFL for the mixture), instantaneous evaporation must occur into a volume of 8 g/(54 g/m3) = 0.15 m3. This situation is very unlikely because evaporation in the airspace starting from zero is a slow process [24]. Similarly, continuous ventilation occurs in the airspace and in the critical region in which evaporation occurs.
Evaporation Rate or the rate of conversion of liquid to vapor emerges in this discussion as a parameter of critical importance. Liquids either in pure form or in mixtures do not evaporate instantly from zero to equilibrium levels or to the level needed to support combustion [24]. The Evaporation Rate Factor in Table 2 compares the relative rate of evaporation to evaporation of n-Butyl Acetate in a standard test [30,31]. A number >1 indicates more rapid evaporation. The ASTM test method covered determination of the rate of evaporation of volatile liquids of low viscosity using the Shell thin-film evaporometer.
The ASTM method suggests that of all of the ingredients in the product, toluene evaporates the most slowly. Other ingredients evaporate at 2 to 3 times this rate. This suggests that if evaporation of molecules of the ingredients in the mixture reflect behavior of the pure substance, evaporation of MEK, methanol and acetone would occur preferentially at the beginning of the process, leaving behind the toluene. Rapid loss of the small quantity of more volatile substances during early evaporation could diminish concern about formation of a hazardous mixture in the airspace especially when one opening is present and ventilation induced by natural forces is least. Evaporation of molecules in a mixture is difficult to predict because of possible interactions between them.
A question of interest and possible concern is the type of evaporation that occurs above the surface of the liquid. Evaporation of a liquid is the movement of molecules from the surface into the vapor phase above it. The layer of vapor + air immediately above the evaporating surface is the boundary layer [32]. The boundary layer is less than 1 mm in thickness. Evaporation of water and substances that behave in a similar manner occurs at the surface and increases with turbulent air movement. When turbulence is weak, evaporation decreases considerably. Evaporation of liquids that are not boundary-layer regulated occurs from inside the entire liquid layer. Such a mechanism applies to slowly evaporating mixtures such as oils and fuels that contain many molecular components [33,34,35]. Diffusion rate depends on the mass of the liquid and not area. Increasing wind speed does not increase the rate of evaporation. A combination of the two mechanisms is also possible.
Fingas showed that the evaporation of n-heptane (a chain containing 7 carbon atoms) showed strong dependence on turbulence, indicative of boundary-layer regulation [33,34,35]. Decane (carbon number = 10) showed a lesser effect, and dodecane (carbon number = 12) showed a negligible dependence on turbulence. Table 2 contains some information concerning heptane and dodecane. These studies showed the reason for the small or negligible amount of boundary-layer regulation shown by crude oils and petroleum products. Crude oil contains few components (often less than 3% of composition) with a carbon number less than 12. The more volatile petroleum products, gasoline and diesel fuel, have a limited number of compounds more volatile than decane and thus are also not strongly boundary-layer regulated if at all.
The final question to be resolved is how best to measure the vapor. The simplest means to do so is a commercially available instrument containing a datalogger and a non-specific sensor [36,37]. The most versatile of the non-specific sensors is the PhotoIonization (PID) sensor. The PID sensor contains an Ultra-Violet (UV) emitting lamp and an appropriate detector. Chemical bonds ionized by emission from the UV lamp are detectable using this sensor. The detector collects electrons liberated from molecules excited by the UV energy. The sensor is calibrated using isobutylene and reports concentration in ‘isobutylene units’. An instrument operated in passive mode will not disturb air currents induced by natural forces.
Where the focus of the study is the process and not discrimination of specific contaminants as in this situation and where preferential evaporation of individual component in the mixture may occur, detection of the signal is all that has importance. The response chart for the PID sensor [38] indicates detection of toluene, MEK and acetone. Table 2 provides the relative response of the PID sensor used in these instruments. The concentration of vapor of pure liquid is the product of (instrument reading) × (Correction Factor). Values of the Correction Factor < 1 indicate that the molecule is more sensitive to detection by this method than is isobutylene. The Correction Factors for the ingredients in lacquer thinner indicate that this solvent is almost ideal for use in a study of evaporation into the airspace of an isolated subsurface structure.
Discussion to this point has considered various factors that can impact on the safety of experiments performed using instruments positioned in an enclosed space ventilated by processes induced by natural forces. The enclosure in which the test occurred combined with the evaporation of a solvent mixture created a complex system. Equation (3) shows the generalized mathematical model that describes evaporation of liquid to form vapor and ventilation of the airspace [22]. Dispersion within the airspace of the structure accompanies vapor formation. Exchange of the internal atmosphere containing vapor involves the entry of uncontaminated air from the exterior.
C 2 = 1 Q ( G [ G Q C 1 ] e Q ( t 2 t 1 ) V )
where:
C2 is the concentration at time, t2, mg/m3.
C1 is the concentration at time, t1, mg/m3.
Q is the rate of airflow, m3/min.
G is the generation rate, mg/min.
t1 is time at moment 1, min.
t2 is time at moment 2, min.
V is volume of the space, m3.
Equation (3) compares concentration at t1 and t2. Equation (3) presumes that G and Q are constant at the two moments in time and that the dilution air contains negligible contamination.
A major requirement for conformity with the preceding equation is the presumption of rapid and thorough mixing of incoming air with resident air [22]. That is, the concentration of contaminant is uniform throughout the space at the two times, t1 and t2. This means that concentrations, C1 and C2 are really averages. The only way for this condition to occur in a real situation is through the rapid mixing of the air in the space.
In a study of CO in exhaust gas introduced into an isolated subsurface vault containing a manhole cover with one or more openings, McManus [11,39] showed the occurrence of rapid and thorough mixing and exchange with the external atmosphere. This study showed that the concentration of CO was almost identical at every moment in time at different levels in the structure as measured once per minute by datalogging instruments.
In the outdoor environment, Q is potentially influenced by wind flow across the surface of the ground and differences in temperature within the airspace and between the air at the top of the airspace and the air outside the airspace. McManus [11] determined that wind flow at ground level is rapidly changing, highly variable, and unpredictable when measured once per second or once per 2 s. In the situation discussed here, generation rate, G, diminishes as evaporation of the fixed volume of liquid occurs. Decrease in generation rate [22] is modeled as:
G = G 0 e α t
where:
G is the generation rate at any time t, mg/min.
G0 is the generation rate at t = 0, mg/min.
α is the evaporation rate, /s. (α is determined experimentally and presumed to be constant. In the outdoor environment, α may vary because of change in temperature in the airspace of the structure at the moment of evaporation of the solvent.)
t is the elapsed time (min).
The combination of Equations (3) and (4) and the underlying activities indicate that this is a complex system not fully describable at the level undertaken in this discussion.
The Method that follows is the culmination of a discussion that occurred in Section 1.1. The Method discusses equipment and provides the steps involved in preparing a contaminated atmosphere in an isolated subsurface structure and then follows the process of evaporation through instrumental monitoring. The intent of this trial was to confirm the safety provided through the application of the concepts discussed in Section 1.1 for application in a more extensive study.

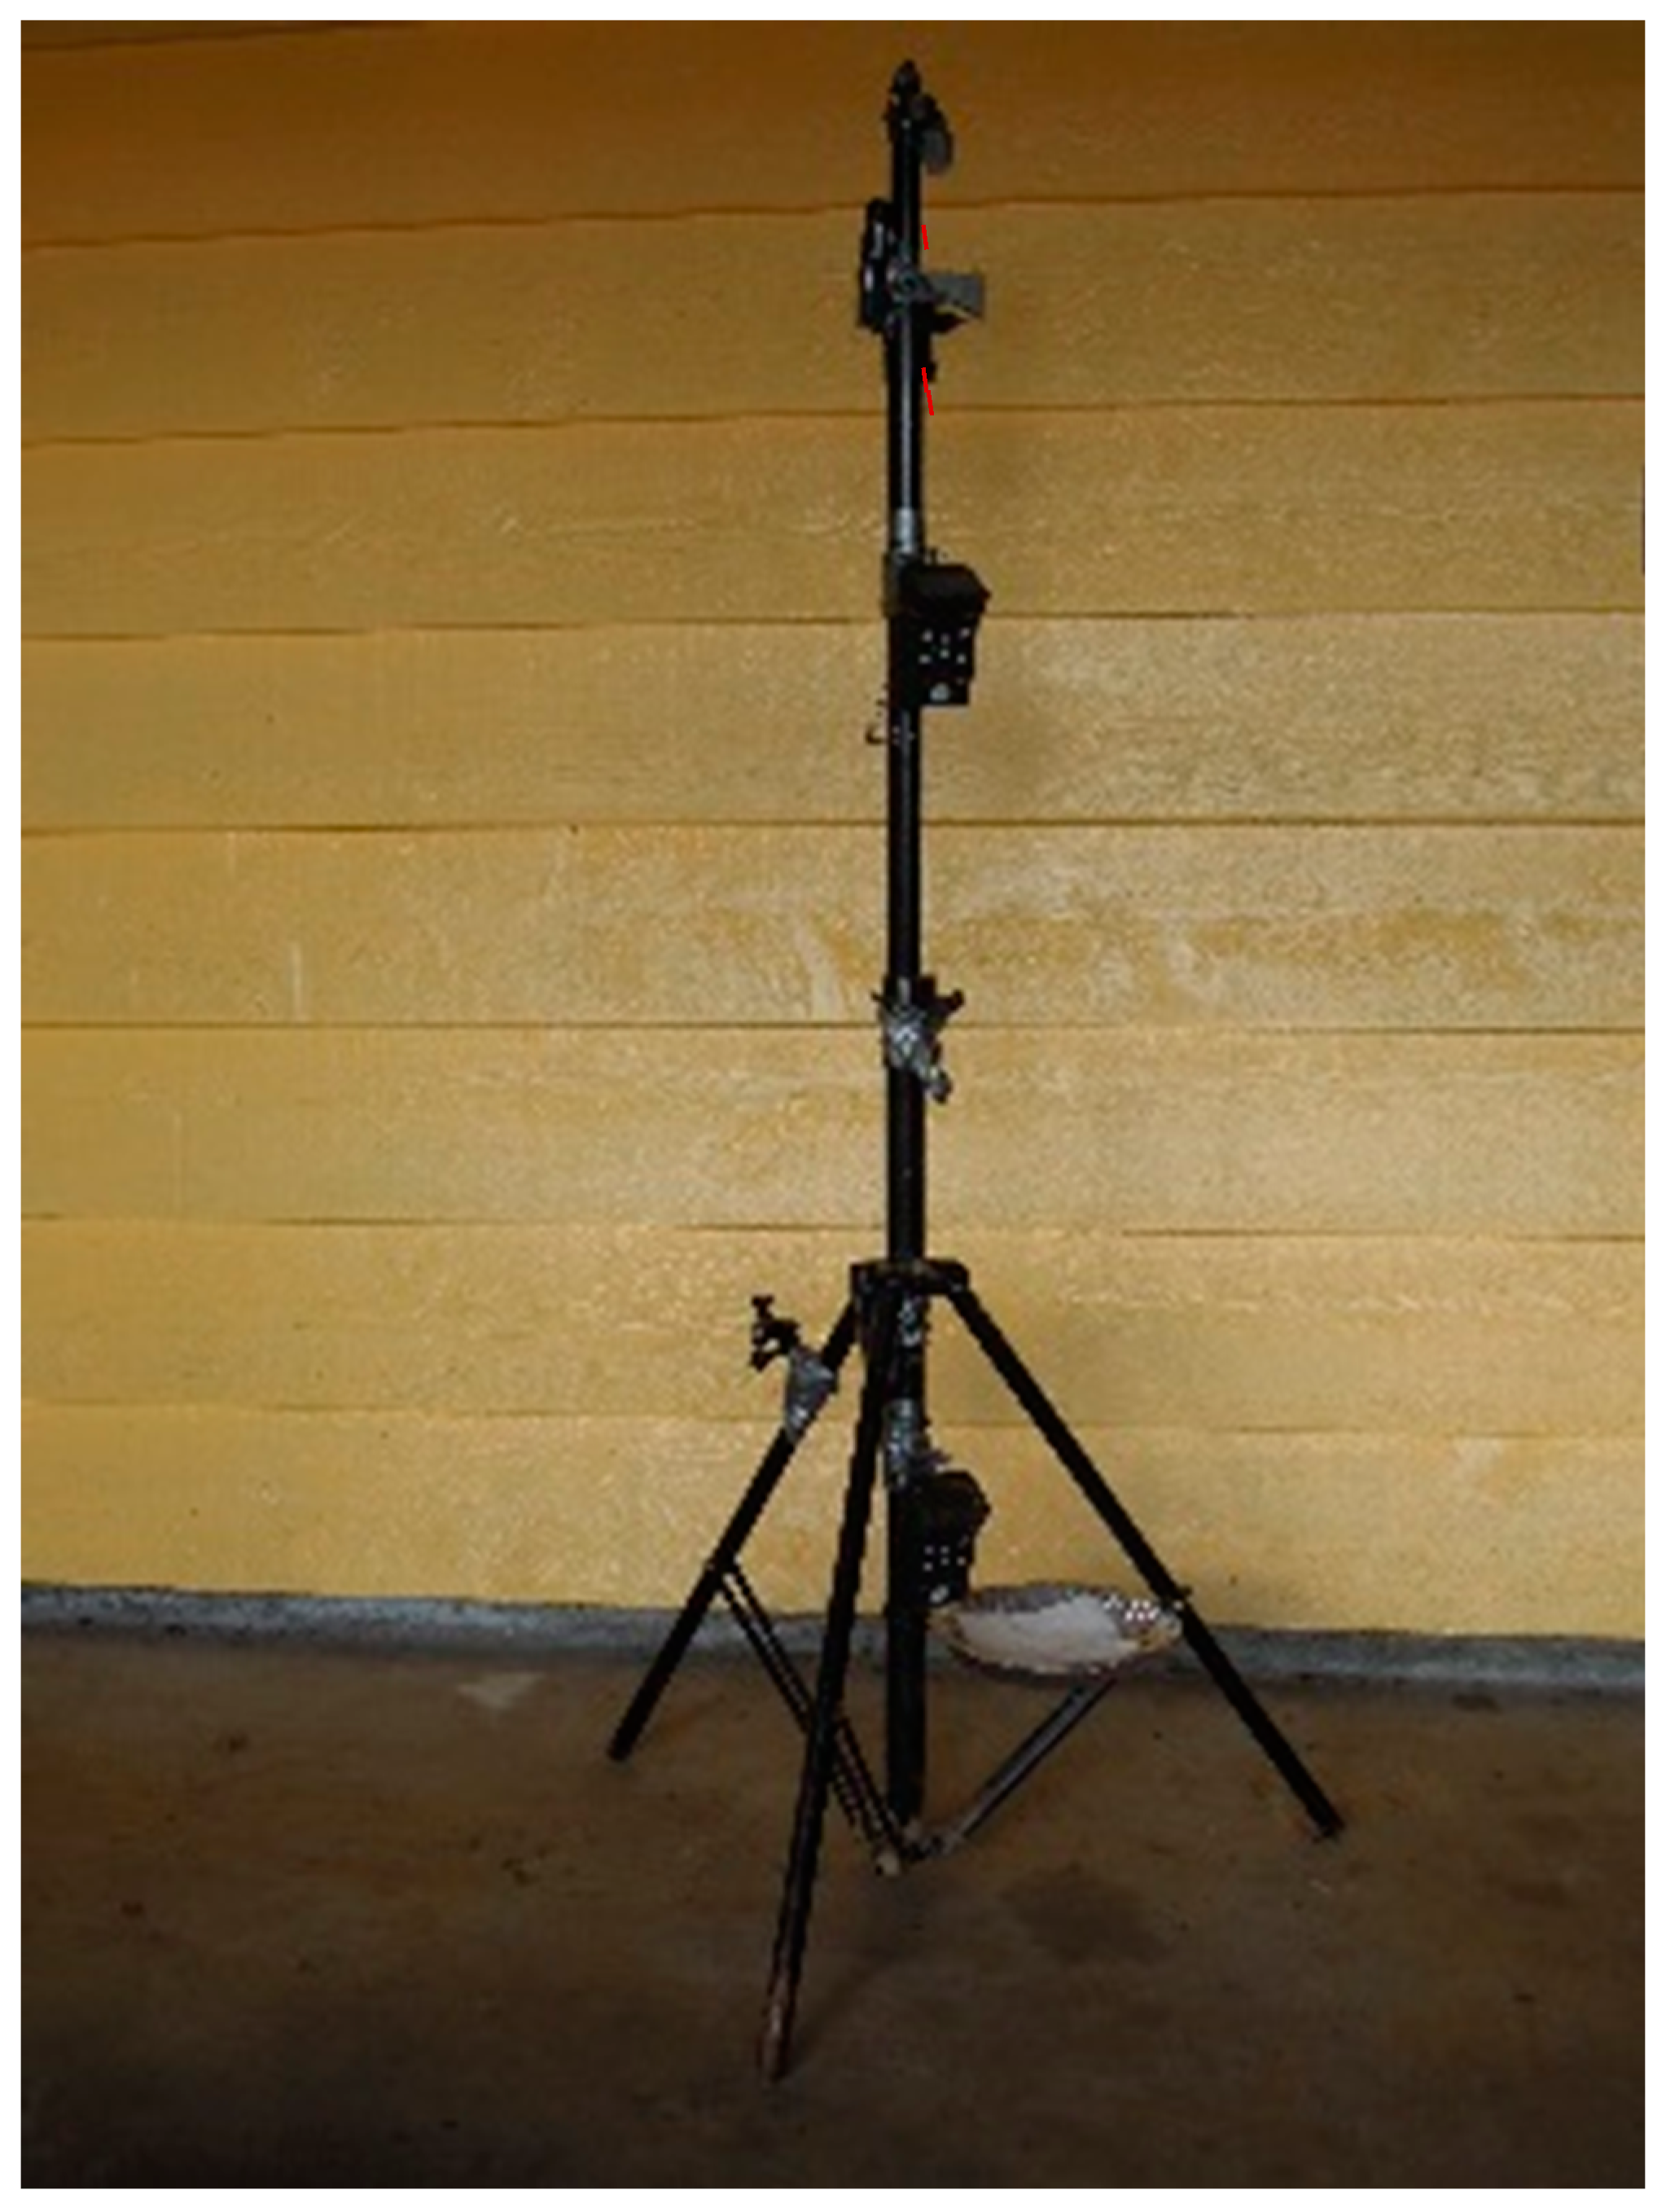
2. Materials and Methods
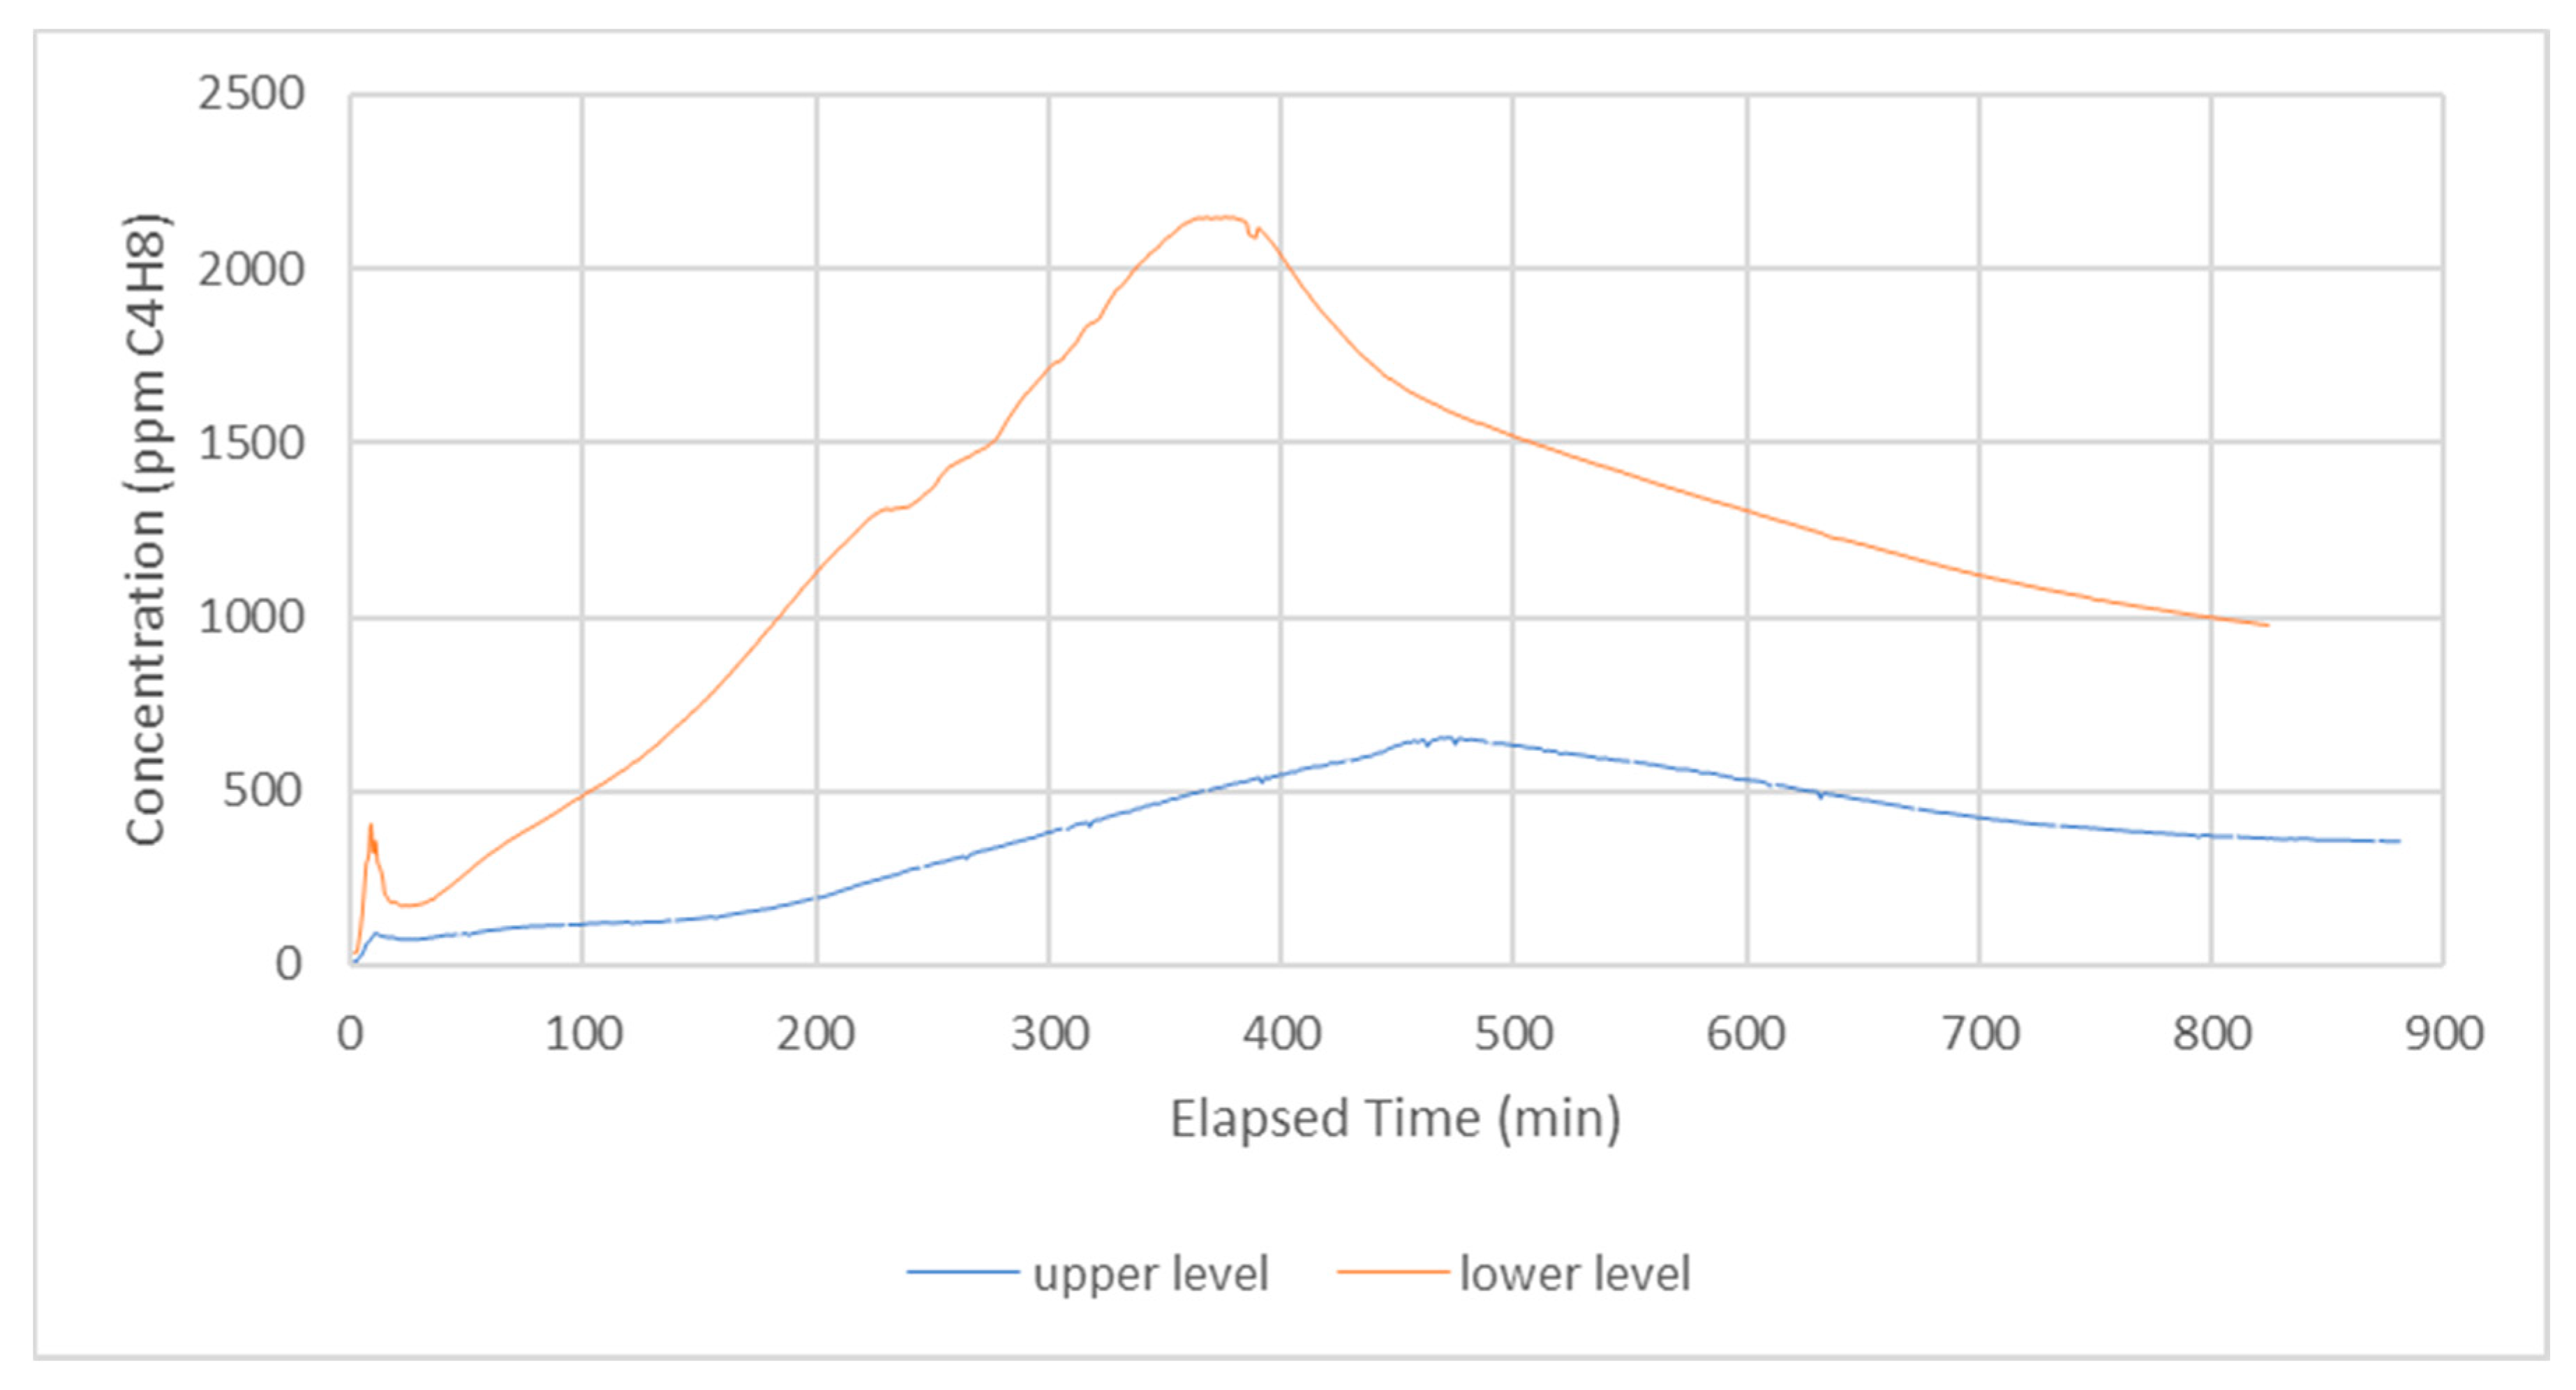
Air monitoring occurred in an isolated, subsurface structure, an out-of-service underground electrical vault having a height of 1.5 m and volume of 2.5 m3 made from precast concrete components. The structure is entered through a manhole cover containing one or more opening(s).
Readily available, commercial, 4-gas testing instruments (GfG 460, GfG Instrumentation, Ann Arbor, MI, USA) were used during these tests. These instruments contain sensors for oxygen, ignitable substances, carbon monoxide (CO), and hydrogen sulfide (H2S), a PID (PhotoIonization Device) sensor and a datalogger as described previously in more detail [11,39]. Only the PID sensor was operated during this work in order to prolong battery life to the extent possible. The PID sensor performs linearly to 2000 ppm, and curvilinearly to 3000 ppm, expressed in ‘isobutylene units’. The manufacturer tests these instruments to confirm safety in flammable and explosive atmospheres. The instruments were calibrated according to recommendations of the manufacturer.
The position of the instruments on the stand was 114 cm (45 in) and 38 cm (15 in) above the bottom, respectively (Figure 1). Hence, the instruments were about 76 cm apart from each other in the vertical direction. The lower instrument was about 15 cm from the surface of the pie plate containing the solvent under study. Previous experience had shown the absence of contamination in the structure under normal operating conditions.
To initiate the test, the instruments were activated and the manhole cover removed. Then, 10 mL of lacquer thinner [23] was poured onto a paper towel folded in four and positioned on an aluminum pie plate located near the bottom of the instrument stand (Figure 1) immediately prior to insertion into the space. The stand was positioned into the space and the manhole cover re-closed. The manhole cover had seven openings, six around the circumference and one in the middle. The six openings around the circumference were selectively plugged to prevent exchange of air. Selectively plugging the openings provided data for investigating the role of the number and area of the openings on exchange of air and concentration of substance detectable by the PID sensors. The test started around 7:00 a.m. and progressed until the batteries failed. The instruments operated up to 900 min. The instruments were removed from the space 24 h after the start of the test, the batteries recharged, and the dataloggers downloaded.
A canopy was used to prevent entry of rain and exposure of the work area to radiant heating by the sun. The interior of the structure was dry during the test.

3. Results

The test described here was intended to illustrate the proof of concept discussed in the section on method development. This test reports on the most heavily contaminated atmosphere detected by the instrument. A companion article reports on the full group of tests [40]. This article reported on results from a more extensive study of evaporation involving 20 repetitions in 3 groups (single opening in the manhole cover, center + circumferential openings, 2× circumferential openings). A second companion article [41] reported on the need for caution in use of short-duration data as an input into software used in long-duration predictive modeling of worker exposure. The work described in these articles proceeded without incident, in major part due to the confidence gained from the application of information provided in this article.
Figure 2 shows the composite curve (lower and upper instrument) for the test performed on 27 June 2016. This test involved a single opening in the manhole cover and produced the highest reading on the lower instrument (slightly above 2150 ppm of isobutylene equivalent.) The batteries were unable to operate the instrument for the full duration of the process from zero to contamination to zero. There was an initial rapid production of vapor at the lower level leading to a small peak followed by gradual increase to a major peak at 376 min of elapsed time. The initial small peak occurred in other samples [40]. The major peak at the upper-level sampling position occurred slightly more than 100 min later. The initial rapid burst of evaporation leading to the small peak may reflect preferential vapor formation by the more volatile substances in the formulation; namely MEK, methanol and acetone, as indicated in Table 2.
Given the preponderance of toluene in the formulation, the high sensitivity of the PID sensor to toluene, and the possible preferential evaporation of one or more of the other components early in the process, the signal at the major peak may reflect a high percentage of toluene. If this is correct, the concentration of toluene at the major peak was about 1140 ppm (0.1%) about 10 cm above the source and 346 ppm in the upper airspace of the structure. These concentrations are considerably less than the LFL of 1.27% (12,700 ppm) for toluene (Table 2). The odor threshold for toluene is as low as 0.16 ppm with a mean of 1.6 ppm [42]. Hence, when present in the air, toluene presents a readily detectable aromatic odor even at low concentration. A person with normal ability to detect aromatic odor likely would have little difficulty detecting the presence of toluene vapor during these tests, with the outcome of using respiratory protection to prevent overexposure.

4. Discussion

Isolated subsurface structures located in urban settings and accessed through a manhole cover containing one of more openings are vulnerable to the entry of volatile organic liquids because of nearby spills or the surreptitious disposal of unwanted products. Periodic fires and explosions in these structures illustrate that the entry of ignitable liquid products poses serious risk of injury and death to workers who enter and work inside them and to the general public. The published literature contains almost nothing concerning the study of these problems.
Method development for studying complex systems containing known hazards can introduce unknowns and uncertainties. Such was the case during this investigation. Minimizing the level of the unknowns and uncertainties prior to starting was fundamental to minimizing the risk posed by this work during method development and subsequent confirmation. Inadequate consideration of these possibilities during conceptualization can lead to failure and possible injury. One of the most important concepts discussed in the literature to create safety against failure is defense in depth—also known as multiple layers of protection [43,44]. Multiple layers of protection function on the premise that secondary, tertiary or quaternary layers of defense continue to offer protection in the event of failure of the primary layer.
The objective of discussion in Section 1.1 (Considerations in Method Development) was to identify modes of failure and modes of success. These form the basis for creating a method for further study that poses minimum risk. Failure of the system proposed for evaluating the evaporation of the solvent in the enclosed airspace would equal development of an uncontrolled hazardous atmosphere capable of causing high levels of overexposure and/or ignitability and/or explosiblility. The success of the system would equate to the preparation of a controlled, possibly hazardous atmosphere capable of being monitored by instruments and incapable of causing overexposure or becoming ignitable and/or explosible. Stating outcomes in this manner steers and focuses the discussion to a coherent end-point of success (or failure).
A primary consideration necessary for success is to prevent overexposure to substances in the lacquer thinner. Exposure during application onto the paper towel and lowering the instrument stand into the structure was very brief (less than one minute). As well, the geometry of handling the liquid minimized surface area (small surface area to volume ratio) and the potential for evaporation prior to pouring onto the paper towel. The instrument stand containing the wetted paper towel was lowered immediately into the structure and the manhole cover replaced. Entry into the structure did not occur. Containment in a ventilated structure not to be entered for any reason in an isolated and secure work area eliminated the potential for overexposure.
Vapor formation in the airspace of the structure depended on the volume of liquid and number of openings in the manhole cover (controllable variables), the difference in temperature during the day and between the interior of the space and the external surroundings, and possibly interior air movement and movement of the air along the ground (non-controllable variables). The system included the following processes: evaporation of a volatile liquid into the airspace above the paper towel; dispersion of the vapor into the airspace; movement of the airspace within the structure; exchange of air with the atmosphere in the structure [11,40,45]. Evaporation depends on temperature of surfaces, intrinsic characteristics of evaporation (boundary-layer regulated versus non-boundary layer regulated) and possibly air motion above the evaporating liquid [33,34,35]. Models and equations provide a partial basis for decision-making, as do the physical properties of ingredients in the product [22,23,24,25,26]. Limitations of detection by the instrument impose lower and upper limits on concentration of vapor in air [36,37,38]. Battery life imposes limits of time on the volume of liquid and tracking of concentration in air (zero to maximum to zero).
Many variables contribute to and detract from the safety of method development in a complex system. For this reason, the use of defense in depth is essential to ensure safe operation. In this situation, use of instruments tested for performance in a flammable/explosive atmosphere is an essential part of fire and explosion prevention to assure that a variable not identified previously or not fully appreciated cannot gain prominence beyond acceptable limits.
The study of the evaporation of volatile solvents containing ignitable ingredients is a necessary first step in a larger study directed toward the optimization of ventilation induced by natural forces in isolated subsurface structures. Isolated subsurface structures experience air exchange only through opening(s) in manhole covers. Sewers and other subsurface structures that are networked together by piping and duct share a common atmosphere. The latter is the result of ventilation induced by natural forces throughout the network. Hence, isolated subsurface structures experience greater risk for the development of an ignitable atmosphere following the entry of volatile liquids containing ignitable ingredients. The presence of an ignitable atmosphere in these structures at any time in their operational history, in particular the period between closure following one activity and reopening to perform another, poses an unnecessary, minimizable risk to public and worker safety. During preparation to enter and the entry itself to perform work, mechanical ventilation using portable equipment is a standard practice required by regulators.
Given the emphasis on gaining knowledge about optimizing ventilation through opening(s) in the manhole cover, the dimensions and volume of individual vaults have importance only to define limitation(s) in the latter process once optimization has occurred. At some point, a larger volume of the solvent used in developing the methodology potentially would pose a fire and explosion risk due to quantity available for evaporation. Of considerably greater concern is the hazard posed by an ignitable solvent containing ingredients considerably more volatile than toluene. Some of these latter concerns are potentially addressable by software used to predict exposure [41].
It is important to emphasize that the intent of the studies described above was not to circumvent the requirements for confined space entry, but rather to minimize the risk of working in them to the extent possible. Explosions and fires resulting in serious injuries have occurred during attempts to remove manhole covers from chambers containing ignitable atmospheres. There exists considerable incentive to prevent the formation of an ignitable atmosphere in these structures during the period between closure following one activity and reopening to perform another.

5. Conclusions

This article responds to the demand in a research study involving the evaporation of a volatile solvent containing ignitable ingredients to develop a safe system of work to ensure protection for the experimenter and the environment of the work area in advance of performing the study. This article shows that the development of a safe system in which to study the evaporation of a small quantity of a volatile solvent containing ignitable ingredients without risk of overexposure of the experimenter or risk of fire and explosion in an isolated subsurface chamber (a type of confined space) is possible through the coherent application of well-recognized physicochemical concepts. The considerations employed here produced, with reasonable confidence, the ability to anticipate operating conditions during this type of study. The development of a safe system for study of evaporation is a complex undertaking. This development required consideration about the capabilities of the instrument to detect volatile substances; the safety of the instrument in an ignitable atmosphere; safety during chemical handling and personal exposure; the volume of the structure (2.5 m3); the evaporation rate; the temperature of the airspace; and the ventilation of the structure governed by the number of opening(s) in the manhole cover. Lacquer thinner (a volatile, ignitable solvent mixture) is almost ideal for this type of study because of the efficiency of response of the PID sensor in the testing instrument to the ingredients in the solvent. A small volume of lacquer (10 mL) evaporating into the airspace of the structure under study produced a signal at the upper limit of linearity of the instrument when a single opening was present. The response of the PID to small concentrations of vapor coupled with the response at the upper limit of linearity enables the study of evaporation through a wide range of volumes of liquid up to the upper limit of 10 mL. This quantity of liquid, coupled with the presence of ingredients of varying rate of evaporation, produced acceptable results for the study of evaporation in this space under different conditions. The presence of a peak early in the process of evaporation suggests the occurrence of the preferential evaporation of ingredients more volatile than toluene. The signal persisted over a considerable period. Exhaustion of the battery in the instrument prior to the decrease in concentration to zero suggests that tracking the signal to the latter level would only be possible with the use of less liquid. The considerations described in this article and the confirmatory test support the use of this system for more in-depth characterization of evaporation under conditions reflecting the number and geometry of openings in the manhole cover. The methodology used in the development of this method is readily applicable to the future study of the evaporation of volatile solvents containing ignitable ingredients in other structures of this type.

Author Contributions

Conceptualization, T.N.M.; methodology, T.N.M.; validation, T.N.M.; formal analysis, T.N.M.; investigation, T.N.M.; resources, A.H..; data curation, T.N.M. and A.H.; writing—original draft preparation, T.N.M.; writing—review and editing, T.N.M., A.R. and A.H.; visualization, T.N.M.; supervision, A.H.; project administration, A.H.; funding acquisition, A.H. All authors have read and agreed to the published version of the manuscript.

Funding

This research received no external funding.

Acknowledgments

The financial support of CAPES (Coordenação de Aperfeiçoamento de Pessoal de Nível Superior), Brasilia, DF, Brasil, CNPq (Conselho Nacional de Desenvolvimento Científico e Tecnológico), formerly Conselho Nacional de Pesquisas, Brasilia, DF, Brasil (the Brazilian National Research Council), and Fundação Carlos Chagas Filho de Amparo à Pesquisa do Estado do Rio de Janeiro (FAPERJ) in pursuit of this work are gratefully acknowledged. The gracious and kind hospitality and permission to work on the property of Fred Thompson Contractors, Burnaby, British Columbia, Canada in performance of this work are gratefully acknowledged. The gracious assistance of Bob Henderson, President, GfG Instrumentation, Ann Arbor, MI in performance of this work similarly is gratefully acknowledged.

Conflicts of Interest

The authors declare no conflict of interest.

References

  1. BARPI (Bureau d’Analyse des Risques et Pollutions Industriels). Explosion of hydrocarbons in an urban sewerage network, April 22 1992, Guadalajara, Mexico. ARIA (Analyse, Recherche et Information sur les Accidents) No. 3543. Lyon, France: Direction Générale de la Prévention des Risques du ministère du Développement durable, Bureau d’Analyse des Risques et Pollutions Industriel. 2018. Available online: http://www.aria.developpement-durable.gouv.fr/wp-content/files_mf/FD_3543_guadalajara_1992_ang.pdf (accessed on 9 December 2018).
  2. Polonini, J. Bueiros transformam cidade em campo minado: 10 explosões que maracaram o Rio. O Globo, 13/07/2016, Rio de Janeiro. 2016. Available online: http://acervo.oglobo.globo.com/em-destaque/bueiros-transformam-cidade-em-campo-minado-10-explosoes-que-marcaram-rio-19704742 (accessed on 1 December 2018).
  3. Katz, S.H.; Meiter, E.R.; Bloomfield, J.J. Gas Hazards in Street Manholes (RI 2710); Department of the Interior, Bureau of Mines: Washington, DC, USA, 1925. [Google Scholar]
  4. Jones, G.W.; Perrott, G.S.J. Gases in Manholes: A Survey of a Utility in Boston, Mass (RI 3109); Department of the Interior, Bureau of Mines: Washington, DC, USA, 1931. [Google Scholar]
  5. IEEE (Institute of Electrical and Electronic Engineers). Preventing and mitigating manhole events. In White Paper Prepared by IEEE Insulating Conductors Committee–C34D; Institute of Electrical and Electronic Engineers: New York, NY, USA, 2015. [Google Scholar]
  6. Boeck, W.; Kruger, K. Arc motion and burn through in GIS. IEEE Transact. Power Deliv. 1992, 7, 254–261. [Google Scholar] [CrossRef]
  7. Jones, G.W.; Miller, W.E.; Campbell, J.; Yant, W.P. Ventilation of Manholes. Effect of Holes in the Covers on Natural Ventilation (RI 3307); Department of the Interior, Bureau of Mines: Washington, DC, USA, 1936; Issue 1. [Google Scholar]
  8. Jones, G.W.; Miller, W.E.; Campbell, J.; Yant, W.P. Ventilation of Manholes. Effect of the Size of the Manhole on Natural Ventilation (RI 3343); Department of the Interior, Bureau of Mines: Washington, DC, USA, 1937; Issue 2. [Google Scholar]
  9. Jones, G.W.; Baker, E.S.; Campbell, J. BM Ventilation of MANHOLES. Effect of Wind Velocity on Natural Ventilation (RI 3412); Department of the Interior, Bureau of Mines: Washington, DC, USA, 1938; Issue 3. [Google Scholar]
  10. Jones, G.W.; Miller, W.E.; Campbell, J. BM Ventilation of Manholes. Effect of Vertical Ducts in Combination with Openings in Manhole Covers on the Natural Ventilation (RI 3496); Department of the Interior, Bureau of Mines: Washington, DC, USA, 1940; Issue 4. [Google Scholar]
  11. McManus, T.N. Natural Ventilation of Isolated Subsurface Structures in the Infrastructure. D.Sc. Thesis, Universidade Federal Fluminense, Programa de Pós-Graduação em Engenharia Civil, Niteroí, Brasil, 2016. [Google Scholar]
  12. McManus, N. Safety and Health in Confined Spaces; CRC Press: Boca Raton, FL, USA, 1998. [Google Scholar]
  13. NIOSH (National Institute for Occupational Safety and Health). Worker Deaths in Confined Spaces (DHHS/PHS/CDC/NIOSH Pub. No. 94-103); Department of Health and Human Services, Public Health Service, Center for Disease Control, National Institute for Occupational Safety and Health: Cincinnati, OH, USA, 1994. [Google Scholar]
  14. NIOSH (National Institute for Occupational Safety and Health). Carbon Monoxide Poisoning and Death after the Use of Explosives in a Sewer Construction Project (DHHS (NIOSH) Publication No. 98-122); Department of Health and Human Services, National Institute for Occupational Health: Cincinnati, OH, USA, 1998. [Google Scholar]
  15. NIOSH. Suspected Inhalation Fatalities Involving Workers during Manual Tank Gauging, Sampling, and Fluid Transfer Operations on Oil and Gas Well Sites, 2010–2014; Department of Health and Human Services, Centers for Disease Control and Prevention, National Institute for Occupational Safety and Health: Cincinnati, OH, USA, 2015. Available online: http://www.cdc.gov/niosh/topics/fog/data.html (accessed on 19 January 2019).
  16. NIOSH/OSHA. Health and Safety Risks for Workers Involved in Manual Tank Gauging and Sampling at Oil and Gas Extraction Sites (DHHS (NIOSH) Publication Number 2016-108/ OSHA-HA-3843-2016); Department of Health and Human Services, Centers for Disease Control and Prevention, National Institute for Occupational Safety and Health: Cincinnati, OH, USA, 2016. [Google Scholar]
  17. NIOSH (National Institute for Occupational Safety and Health). Fatality Assessment and Control Evaluation (FACE) Program; Department of Health and Human Services, Centers for Disease Control and Prevention, National Institute for Occupational Safety and Health: Cincinnati, OH, USA, 2018; Available online: www.cdc.gov/niosh/face/ (accessed on 9 December 2018).
  18. OSHA (Occupational Safety and Health Administration). Selected Occupational Fatalities Related to Toxic and Asphyxiating Atmospheres in Confined Work Spaces as Found in Reports of OSHA Fatality/Catastrophe Investigations; U.S. Department of Labor, Occupational Safety and Health Administration (U.S. DOL/OSHA): Washington, DC, USA, 1985. [Google Scholar]
  19. OSHA (Occupational Safety and Health Administration). Fatality and Catastrophe Investigation Summaries; U.S. Department of Labor, Occupational Safety and Health Administration (U.S. DOL/OSHA): Washington, DC, USA, 2018; Available online: www.osha.gov/pls/imis/accidentsearch.html (accessed on 9 December 2018).
  20. Smith, P.A.; Lockhart, B.; Besser, B.W.; Michalskic, M.A.R. Exposure of unsuspecting workers to deadly atmospheres in below-ground confined spaces and investigation of related whole-air sample composition using adsorption gas chromatography. J. Occup. Environ. Hyg. 2014, 11, 800–808. [Google Scholar] [CrossRef] [PubMed]
  21. Wiegand, K.; Dunne, S.P. Radon in the workplace—A study of underground BT structures. Ann. Occup. Hyg. 1996, 40, 569–581. [Google Scholar] [CrossRef]
  22. Keil, C.B.; Simmons, C.E.; Anthony, T.R. Mathematical Models for Estimating Occupational Exposure to Chemicals, 2nd ed.; American Industrial Hygiene Association: Fairfax, VA, USA, 2009. [Google Scholar]
  23. Recochem. Material Safety Data Sheet for Lacquer Thinner; Recochem: Montreal, QC, Canada, 2011; Available online: http://canadiantire.wercsmart.com/SDSviewer/awsClient/document?productid=91002360&productguid=4df2ef6c-7e4f-47b2-9a77-cf3cce024580&DocumentKey=4df2ef6c-7e4f-47b2-9a77-cf3cce024580&HazdocumentKey=&MSDS=3 (accessed on 9 December 2018).
  24. AIHA (American Industrial Hygiene Association). IH Mod (Industrial Hygiene Models), 2.0, Support File, Generation Rate Estimation; American Industrial Hygiene Association: Falls Church, VA, USA, 2018. Available online: https://www.aiha.org/get-involved/VolunteerGroups/Pages/Exposure-Assessment-Strategies-Committee.aspx (accessed on 9 December 2018).
  25. Lira, C.T.; Elliot, J.R. ACTCOEFF.xls Spreadsheet. In For Use with Introductory Chemical Engineering Thermodynamics, 2nd ed.; Elliot, J.R., Lira, C.T., Eds.; Prentice Hall: New York, NY, USA, 2012; Available online: https://sourceforge.net/projects/chethermo/ (accessed on 17 December 2018).
  26. Randhol, P.; Engelien, H.K. Xlunifac, a Program for Calculation of Liquid Activity Coefficients Using the UNIFAC Model, Version 1.0. 2000. Available online: http://www.pvv.org/~randhol/xlunifac/ (accessed on 9 February 2019).
  27. McManus, N.; Green, G. The WHMIS Training Program; Training by Design, Inc.: North Vancouver, BC, Canada, 2001. [Google Scholar]
  28. NIOSH (National Institute for Occupational Safety and Health). NIOSH Pocket Guide to Chemical Hazards, DHHS (NIOSH) Publication No. 2005-149; August 2006, with Minor Technical Changes; September 2007, with Minor Technical Changes; Department of Health and Human Services, Centers for Disease Control and Prevention, National Institute for Occupational Safety and Health: Cincinnati, OH, USA, 2007. [Google Scholar]
  29. Zabetakis, M.G. Flammability Characteristics of Combustible Gases and Vapors (Bull. 627); Department of the Interior, Bureau of Mines: Washington, DC, USA, 1967. [Google Scholar]
  30. ASTM (American Society for Testing and Materials). Standard Test Methods for Evaporation Rates of Volatile Liquids by Shell Thin-Film Evaporometer, ASTM D3539-11; American Society for Testing and Material: West Conshohocken, PA, USA, 2011; (Withdrawn 2015). [Google Scholar]
  31. Eastman Chemical Company. Solvent Selector Chart; Eastman Chemical Company: Kingsport, TN, USA, 2018. [Google Scholar]
  32. Monteith, J.L.; Unsworth, M.H. Principles of Environmental Physics; Hodder and Stoughton: London, UK, 1990. [Google Scholar]
  33. Fingas, M. Evaporation modeling. In Oil Spill Science and Technology; Fingas, M., Ed.; Gulf Publishing: New York, NY, USA, 2011. [Google Scholar]
  34. Fingas, M. Modeling oil and petroleum evaporation. J. Petrol. Sci. Res. 2013, 2, 104–115. [Google Scholar]
  35. Fingas, M.F. (Ed.) Oil and petroleum evaporation. In Handbook of Oil Spill Science and Technology; John Wiley & Sons: New York, NY, USA, 2015. [Google Scholar]
  36. Chou, J. Hazardous Gas Monitors: A Practical Guide to Selection, Operation, and Applications; McGraw-Hill Professional: New York, NY, USA, 1999. [Google Scholar]
  37. GfG Instrumentation. Using Photoionization Detectors to Measure Toxic VOCs (AP 1021); GfG Instrumentation: Ann Arbor, MI, USA, 2013; Available online: https://goodforgas.com/wp-content/uploads/2013/12/AP1021_Using_PIDs_to_measure_toxic_VOCs_10_10_13.pdf (accessed on 21 March 2019).
  38. GfG Instrumentation. Chemical Ionization Potential (eV) and 10.6 eV Correction Factors (CF) (TN2004); GfG Instrumentation: Ann Arbor, MI, USA, 2009; Available online: https://goodforgas.com/wp-content/uploads/2013/12/TN2004_PID_gas_table_01_16_09.pdf (accessed on 7 December 2018).
  39. McManus, T.N.; Haddad, A. Ventilation of an isolated subsurface structure induced by natural forces. Infrastructures 2019, 4, 33. [Google Scholar] [CrossRef] [Green Version]
  40. McManus, T.N.; Haddad, A. Solvent evaporation in an isolated subsurface structure: An unrecognized and underappreciated risk. Infrastructures 2019, 4, 47. [Google Scholar] [CrossRef] [Green Version]
  41. McManus, T.N.; Haddad, A. Short-duration characterization of source emissions for use in predictive software models to assess worker exposure: A note of caution. Environ. Nat. Resour. Res. 2020, 10, 1–13. [Google Scholar] [CrossRef]
  42. AIHA (American Industrial Hygiene Association). Odor Thresholds for Chemicals with Established Occupational Health Standards, 2nd ed.; American Industrial Hygiene Association: Fairfax, VA, USA, 2013. [Google Scholar]
  43. Reason, J. Human Error; Cambridge University Press: Cambridge, UK, 1990. [Google Scholar]
  44. Coole, M.; Corkell, J.; Woodward, A. Defence in depth, protection in depth and security in depth: A comparative analysis towards a common usage language. In Proceedings of the 5th Australian Security and Intelligence Conference, Novotel Langley Hotel, Perth, WA, Australia, 5–7 December 2012. [Google Scholar]
  45. McManus, T.N.; Haddad, A.N. Visualizing air motion involving isolated subsurface structures: A critical tool for understanding ventilation induced by natural forces. Infrastructures 2019, 4, 59. [Google Scholar] [CrossRef] [Green Version]
Figure 1. Instrument test stand. The photo shows the two instruments and the pie plate containing the paper towel.
Infrastructures 05 00068 g001
Figure 2. Data plots for 27 June 2016.
Infrastructures 05 00068 g002
Table 1. Predicted Vapor Pressure for Components in the Mixture at 13 °C.
SubstanceWtBasisMWMolMoleFractionVPsatγVP Predicted
(%)(g)(g) xi(mmHg) (mmHg)
13 °C25 °C13 °C25 °C
Toluene60–8070920.80.614.5281.310.720.6
MEK10–2015720.20.256.398.91.08.615.0
Methanol5–107320.20.263.81242.728.755.9
Acetone1–98580.10.11432381.116.827.8
Total 100 1.31.0 * 64.8119.3
Notes: wt % is Weight Percent of the total weight; MW is Molecular Weight. VPsat at 13 °C is the saturated Vapor Pressure at equilibrium calculated by the software using Antoine’s equation. VP Predicted is the Vapor Pressure of the component calculated using Raoult’s equation (Equation (1)) at equilibrium. VP Predicted Total is the calculated Vapor Pressure exerted by vapor from the mixture at equilibrium. * reflects rounding error.
Table 2. Additional Information Concerning Lacquer Thinner.
SubstanceFlash PointLower Flammable Limit (25 °C)Evaporation Rate Factor n-BuAc = 1GfG PID Response Factor
°C%g/m3
Toluene41.3481.90.5
MEK−91.9563.80.9
Methanol116.7883.5NA
Acetone−182.6626.31.2
n-heptane 3.9
n-decane 0.1
Notes: Evaporation Rate Factor > 1.0 indicates that evaporation of the pure solvent occurs faster than n-Butyl Acetate. GfG PID Response Correction Factor provides the relative response of the PID sensor in instruments manufactured by GfG Instrumentation relative to the reading reported in isobutylene units. PID Response Correction Factor < 1.0 indicates response greater than predicted. Multiply by the Response Correction Factor to obtain the true reading in isobutylene units.

