Salivary Oxidative Stress Increases with the Progression of Chronic Heart Failure


1
Experimental Dentistry Laboratory, Medical University of Bialystok, 24a M. Sklodowskiej-Curie Street, 15-274 Bialystok, Poland
2
Department of Cardiology, Medical University of Bialystok, 24a M. Sklodowskiej-Curie Street, 15-274 Bialystok, Poland
3
Department of Hygiene, Epidemiology and Ergonomics, Medical University of Bialystok, 2c Mickiewicza Street, 15-233 Bialystok, Poland
*
Author to whom correspondence should be addressed.
J. Clin. Med. 2020, 9(3), 769; https://0-doi-org.brum.beds.ac.uk/10.3390/jcm9030769
Submission received: 3 February 2020
/
Revised: 6 March 2020
/
Accepted: 10 March 2020
/
Published: 12 March 2020
(This article belongs to the Special Issue Novel Biomarkers for Heart Disease)
Abstract
:The aim of the study was to evaluate the rate of reactive oxygen species (ROS) production, antioxidant barrier, and oxidative damage in non-stimulated (NWS) and stimulated (SWS) saliva as well as plasma/erythrocytes of 50 patients with chronic heart failure (HF) divided into the two subgroups: NYHA II (33 patients) and NYHA III (17 patients). The activity of superoxide dismutase and catalase was statistically increased in NWS of HF patients as compared to healthy controls. The free radical formation, total oxidant status, level of uric acid, advanced glycation end products (AGE), advanced oxidation protein products and malondialdehyde was significantly elevated in NWS, SWS, and plasma of NYHA III patients as compared to NYHA II and controls. We were the first to demonstrate that with the progression of HF, disturbances of enzymatic and non-enzymatic antioxidant defense, and oxidative damage to proteins and lipids occur at both central (plasma/erythrocytes) and local (saliva) levels. In the study group, we also observed a decrease in saliva secretion, total salivary protein and salivary amylase activity compared to age- and gender-matched control group, which indicates secretory dysfunction of salivary glands in patients with HF. Salivary AGE may be a potential biomarker in differential diagnosis of HF.
1. Introduction
Despite enormous progress made in the diagnosis and treatment of cardiovascular diseases, the incidence of chronic heart failure (HF) is steadily increasing and is the leading cause of death in adults. Thus, HF is not only a major clinical, but also an epidemiological and economic problem [1,2]. It is estimated that HF affects about 1%–2% of the population in developed countries, and in the age group of over 70 the disease already affects every 10th person [3]. According to the current definition, HF is a syndrome of symptoms such as dyspnea, swelling of the lower limbs, and decreased tolerance to physical activity, which may be accompanied by abnormalities in the physical examination (jugular vein dilatation, crackles over the lungs, peripheral swelling) [4]. Differentiation of HF patients based on the left ventricular ejection fraction (LVEF) is essential due to other underlying etiologies, demographic differences, co-morbidities, and responses to applied treatment [3]. Thus, we distinguish patients with normal LVEF (typically considered as ≥ 50%; HF with preserved EF (HFpEF)) as well as reduced LVEF (typically considered as < 40%; HF with reduced EF (HFrEF)) [3]. The cause of these ailments in HFrEF is a disturbed structure and/or function of the heart, which results in decreased cardiac output and increased intracardiac pressure at rest and/or during physical activity [1,2,4]. Despite varied pathogenesis (cardiac disease, pre- and post-inflammatory stress disorder, and heart arrhythmia), HF leads to impaired supply of oxygen to the body tissues depending on the current metabolic demand [1,2,4]. Importantly, many patients with HF have a history of myocardial infarction or revascularization [3].
Studies on HF indicate that an important role in its pathogenesis is played by oxidative stress [5,6,7]. This process creates an imbalance between the production of reactive oxygen species (ROS) and antioxidative defense, which leads to oxidative damage to proteins, lipids, and nucleic acids, causing structural damage to cells as well as disturbances in tissue integrity [8]. Indeed, the role of oxidative stress has been confirmed in the course of: Endothelial dysfunction, interstitial fibrosis of the heart, cardiomyocyte hypertrophy, and heart extracellular matrix remodeling [5,7,9,10]. Moreover, it has been demonstrated that in the early stages of HF, increased activity of antioxidant enzymes is the basic compensatory mechanism aimed at maintaining adequate blood flow and perfusion of tissues. However, HF progression leads to the depletion of antioxidant reserves and, along with increased free radical production, contributes to further progression of the disease [5,7,9,10].
Increasing attention is being paid to the use of saliva in biomedical diagnostics [11]. Unlike other bioliquids, saliva is a non-infectious laboratory material collected in a manner that is non-invasive, inexpensive, and stress-free for the patient. It is also worth noting that the composition of saliva reflects dynamic changes in the body, which makes this fluid an excellent tool for determining clinically useful biomarkers [12,13,14,15]. Salivary redox biomarkers are used in the diagnosis of diseases of affluence (obesity, insulin resistance, diabetes, chronic kidney disease) [16,17,18], neurodegenerative diseases (Alzheimer’s disease, Parkinson’s disease, dementia) [19,20], or cancer (colorectal, breast, ovarian cancer) [21,22]. However, salivary redox homeostasis has not been evaluated yet in patients with chronic heart failure. Considering that oxidative stress plays a key role in HF pathogenesis [5,6,7], secretory dysfunction of salivary glands may also occur in HF patients, similarly to other diseases with proven etiology of oxidative stress. Indeed, a relationship between oxidative stress and impaired salivary gland function has been demonstrated in obesity [23,24], insulin resistance [25,26], type 1 diabetes [27], and psoriasis [28]. Therefore, it is necessary to assess the salivary redox parameters in patients with HF, as well as the secretory function of the salivary glands. Because redox homeostasis cannot be characterized by a single biomarker, the aim of our work was to compare the rate of ROS production, enzymatic and non-enzymatic antioxidant barriers, and oxidative damage to proteins and lipids in non-stimulated and stimulated saliva, as well as plasma/erythrocytes of patients with chronic heart failure and healthy controls.
2. Materials and Methods
2.1. Ethical Issues
The study was approved by the Bioethics Committee of the Medical University of Bialystok, Poland (permission number R-I-002/75/2016). After a detailed explanation of the purpose of the study and presentation of possible risks, all persons involved agreed in writing to participate in the experiment.
2.2. Patients
The study group consisted of 50 patients (7 women and 43 men) treated in the Department of Cardiology with Intensive Cardiac Supervision of the Medical University of Bialystok Clinical Hospital from May 2018 to April 2019. In all patients, medical history, physical examination, resting ECG, echocardiography, chest X-ray as well as blood laboratory tests (blood count, electrolytes, glucose, hepatic and renal indicators, thyroid hormones, vitamin D, NT-proBNP, and BNP) were performed. The study included hemodynamically stable patients with chronic heart failure, qualified for the implantation of automatic cardioverter defibrillator [3]. The criterion of classification for the procedure was left ventricular ejection fraction (LVEF) ≤ 35%. Based on the classification of heart failure according to the New York Heart Association [3], the study group was divided into two subgroups of patients:
- NYHA II (n = 33)—patients with slight physical activity limitations—with no symptoms at rest, but in whom normal activity causes fatigue, palpitations, or shortness of breath;
- NYHA III (n = 17)—patients with significant physical activity limitations—with no symptoms at rest, but in whom activity lower than normal provokes symptoms.
All patients were qualified for examinations by the same experienced cardiologist (M. K.), based on the inclusion and exclusion criteria. In the study group, primary prevention has been applied to reduce the risk of sudden death and total mortality in patients with symptomatic HF (NYHA class II-III) and LVEF ≤ 35% (despite at least 3 months of optimal pharmacotherapy), who are expected to survive in good condition for more than one year, and have ischemic heart disease or dilated cardiomyopathy [3]. After classification for the study, all patients underwent coronary angiography (before the cardioverter implantation procedure).
The control group, matched to the study group by gender and age, consisted of 50 generally healthy patients (7 women and 43 men), enrolled for follow-up visits at the Restorative Dentistry Clinic of the Specialist Dental Infirmary of the Medical University of Bialystok from September 2018 to June 2019.
Only patients with a body mass index (BMI) within the range of 18.5–24.5 were qualified to both the study and control group. The exclusion criterion in both groups was the occurrence of chronic systemic and autoimmune diseases (type 1 diabetes, Sjogren’s syndrome, rheumatoid arthritis, psoriasis), lung, thyroid, liver, kidney, gastrointestinal tract diseases, infectious diseases (HCV, HBV and HIV infections), and immunity disorders. Moreover, the study did not allow patients with periodontal diseases, smokers, alcohol drinkers, or patients taking antibiotics, non-steroidal anti-inflammatory drugs, glucocorticosteroids, vitamins, and dietary supplements for the last 3 months. Detailed patient characteristics are presented in Table 1.
2.3. Research Material
The research material consisted of venous blood as well as non-stimulated whole saliva (NWS) and stimulated whole saliva (SWS) collected from patients via the spitting method. Material for all examinations was collected before implantation of an automatic cardioverter defibrillator or a resynchronization system.
2.4. Blood Collection
Upon fasting, after an overnight rest, venous blood (10 mL) was collected using S-Monovette® K3 EDTA blood collection system (Sarstedt). Blood samples were centrifuged at 1500× g (10 min, +4 °C; MPW 351, MPW Med. Instruments, Warsaw, Poland). In order for the sample to qualify for the study, it had to reveal no hemolysis. The upper layer, i.e., the plasma, was collected and erythrocytes were rinsed three times with a cold solution of 0.9% NaCl and hemolyzed by adding 9 volumes of cold 50 mM phosphate buffer with pH 7.4 (v/v) [29]. Butylated hydroxytoluene (BHT) antioxidant was added to the samples to protect them against oxidation processes (5 μL 0.5 M BHT in acetonitrile per 0.5 mL plasma/erythrocytes) [17]. The samples were stored at -80 °C (not longer than half a year).
2.5. Saliva Collection
Saliva was collected in the morning between 8 a.m. and 10 a.m. to minimize the effect of circadian rhythm on secretion. The procedure was performed in a room where patients were not disturbed, and were rested in a sitting position with the head slightly inclined downwards, with minimized facial and lip movements. After rinsing the mouth three times with distilled water at room temperature, the patients spat out the saliva accumulated at the bottom of the mouth into a sterile Falcon-type tube placed in an ice container. Saliva collected during the first minute was discarded [18,30]. Two hours prior to saliva collection, the study/control group had not consumed any food or drinks (excluding clean water) and refrained from performing oral hygiene procedures. Moreover, at least 8 h before saliva collection, the subjects had not taken any medications. The time of NWS collection was 10 min. After a 5-min break, SWS was collected for 5 min to a maximum volume of 5 mL, upon sprinkling 10 µL of 2% citric acid at the tip of the tongue every 30 s [18,30]. The collected saliva was immediately centrifuged (3000× g, 20 min, +4 °C) [17]. BHT (5 μL 0.5 M BHT in acetonitrile per 0.5 mL supernatant saliva) was added to the obtained supernatants to protect them from oxidation, and then they were frozen to −80 °C (and stored no longer than 6 months) [17].
2.6. Dental Examination
The dental examination was conducted in accordance with the World Health Organization criteria in artificial lighting, using a mirror, an explorer, and a periodontal probe [31]. Every examination was performed by the same dentist (A. K.), immediately after the non-stimulated and stimulated saliva collection. Decay, missing, filled teeth (DMFT), Papilla Bleeding Index (PBI), Gingival Index (GI), and the occurrence of carious lesions of root cement (CR) were determined. The DMFT index is the sum of teeth with caries (D), teeth extracted due to caries (M), and teeth filled because of caries (F). The PBI showed the intensity of bleeding from the gingival papilla after probing [32]. GI criteria include qualitative changes in the gingiva [33]. Inter-rater agreements were assessed in 30 patients. The reliability for all the parameters was > 0.98.
2.7. Salivary Protein
The salivary protein concentration was determined by spectrophotometric method using bicinchoninic acid (BCA) [34]. Under the influence of protein in alkaline environment, BCA forms a stable complex with Cu+ copper ions, that reaches its maximum absorbance at 562 nm wavelength. A commercial set of reagents (Thermo Scientific PIERCE BCA Protein Assay; Rockford, USA) was used to evaluate the salivary protein.
2.8. Salivary Amylase
The salivary amylase activity (EC 3.2.1.1) was determined spectrophotometrically using an alkaline solution of 3,5-dinitrosalicylic acid (DNS). We measured the absorbance of samples at 540 nm accompanying the increase in the concentration of reducing sugars released during the hydrolysis of starch catalyzed by salivary amylase. Salivary amylase activity was determined in duplicate samples and expressed in µmol/mg protein.
2.9. Redox Assays
2.10. Antioxidant Barrier
The activity of superoxide dismutase (SOD; E.C. 1.15.1.1) was determined by the Misra and Fridrovich method [37]. The test sample was heated to 37 °C, then adrenaline solution was added, and changes in absorbance at 480 nm wavelength were monitored. It was assumed that 1 unit of SOD corresponds to 50% inhibition of adrenaline self-oxidation to adrenochrome. SOD activity was expressed in mU/mg protein.
Catalase activity (CAT; EC 1.11.1.6) was determined by the Aebi spectrophotometric method [38]. The rate of hydrogen peroxide decomposition in the presence of a blind sample was assayed by measuring the decrease in absorbance at 240 nm wavelength. We defined 1 unit of CAT as the amount of the enzyme needed to decompose 1 mmol of hydrogen peroxide per minute. CAT activity was expressed in nmol H2O2/min/mg protein.
The activity of salivary peroxidase (Px; EC 1.11.1.7) was determined spectrophotometrically according to the method by Mansson-Rahemtulla et al. [39]. The method involves the reduction of 5,5′-dithiobis-(2-nitrobenzoic acid) (DTNB) to 5′-thio-2-nitrobenzoic acid (TNB). Changes in the absorbance of TNB, depending on Px activity, were measured at λ = 412 nm. The activity of Px was expressed in mU/mg protein.
The activity of glutathione peroxidase (GPx; EC 1.11.1.9) in erythrocytes was determined spectrophotometrically based on reduced nicotinamide adenine dinucleotide (NADPH) conversion to nicotinamide adenine dinucleotide cation (NADP+) [40]. The absorbance of the samples was measured at 340 nm wavelength. It was assumed that 1 GPx unit catalyzes the oxidation of 1 mmol NADPH per minute. The activity was expressed in mU/mg protein.
The concentration of reduced glutathione (GSH) was determined spectrophotometrically based on the reduction of DTNB to 2-nitro-5-mercaptobenzoic acid under the influence of GSH contained in the tested sample [41]. Absorbance of the samples was measured at 412 nm. The GSH concentration was calculated from the standard curve for GSH solutions and presented as µg/mg protein.
Uric acid (UA) concentration was determined spectrophotometrically using the ability of 2,4,6-tris(2-pyridyl)-s-triazine to form a blue complex with iron ions in the presence of UA. Absorbance of the samples was measured at 490 nm. We used a commercial set of reagents (QuantiChromTMUric Acid Assay Kit DIUA-250; BioAssay Systems, Hayward, CA, USA). UA concentration was expressed in ng/mg protein (NWS, SWS) and µg/mg protein (plasma).
The activity of antioxidant enzymes was determined in NWS, SWS, and erythrocytes, and the concentrations of non-enzymatic antioxidants were determined in NWS, SWS, and plasma. All determinations were performed in duplicate samples, and the absorbance of the samples was measured with the Infinite M200 PRO Multimode Microplate Reader (Tecan).
2.11. Redox Status and ROS Production
Total antioxidant capacity (TAC) was determined spectrophotometrically according to Erel [42]. Changes in absorbance of ABTS*+ (3-ethylbenzothiazoline-6-sulfonic acid radical cation) solution were measured at 660 nm. TAC was calculated from the standard curve for Trolox (6-hydroxy-2,5,7,8-tetramethylchroman-2-carboxylic acid). The intensity of ABTS*+ color is proportional to the content of antioxidants in the tested sample. The TAC level was expressed in Trolox µmol/mg protein.
Total oxidant status (TOS) was determined spectrophotometrically according to Erel [43]. In the presence of oxidants contained in the sample, iron Fe2+ ions were oxidized to Fe3+ irons which then formed a colored complex with xylenol orange. Absorbance of the created complex was measured at the TOS level calculated from the standard curve for hydrogen peroxide and presented as nmol H2O2/min/mg protein.
The oxidative stress index (OSI) was calculated by dividing TOS by TAC, and expressed in % [28].
The rate of ROS production in saliva was determined by chemiluminescence immediately after saliva collection [44]. Luminol was used as an electron acceptor, and hydrogen peroxide as a positive control. Chemiluminescence of samples was measured in 96-well microplates with black bottoms. ROS production rate was expressed as nmol O2-/min/mg protein.
TAC, TOS, and OSI levels were evaluated in NWS, SWS, and blood plasma, while the rate of ROS production was determined only in saliva samples. All determinations were performed in duplicate samples (TOS in triplicate samples) and the absorbance/chemiluminescence of samples was measured with Infinite M200 PRO Multimode Microplate Reader (Tecan).
2.12. Protein and Lipid Oxidation Products
The content of advanced glycation end products (AGE) was determined spectrofluorimetrically according to Kalousová et al. [45]. The samples were diluted in 0.02 M PBS buffer (1:5, v/v), and fluorescence was measured at 350 nm excitation wavelength and 440 nm emission. AGE content was expressed in arbitrary fluorescence units (AFU) per mg of total protein.
The concentration of advanced oxidation protein products (AOPP) was determined spectrophotometrically according to Kalousová et al. [45]. The samples were diluted in 0.02 M PBS buffer (1:5, v/v) and the oxidative capacity of iodine ions was evaluated at 340 nm wavelength. The concentration was expressed in nmol/mg protein.
The concentration of malondialdehyde (MDA) was determined spectrophotometrically using thiobarbituric acid (TBA) [46]. The absorbance of the samples was measured at 535 nm, and 1,1,3,3-tetraethoxypropane was used as a standard. The concentration was expressed in µmol/mg protein.
The content of oxidative products of protein and lipid modifications was determined in NWS, SWS, and blood plasma. All assays were performed in duplicate samples and the absorbance/fluorescence of the samples was measured with Infinite M200 PRO Multimode Microplate Reader (Tecan).
2.13. Statistical Analysis
Statistical analysis of the results was performed using GraphPad Prism 7.0 for MacOS (GraphPad Software, La Jolla, USA). The D’Agostino-Pearson test and Shapiro–Wilk test were used to evaluate the distribution of the results. The homogeneity of variance was checked by Levine’s test. The groups were compared using ANOVA analysis of variance and the Tukey’s test, and where no distribution normality was obtained, ANOVA Kruskal–Wallis and Dunn’s tests were used. Multiplicity adjusted p value was also calculated. Since most of the data showed a normal distribution, the results were presented as mean ± SEM. Correlations between redox biomarkers were assessed based on the Pearson correlation coefficient. The analysis of diagnostic usefulness of redox biomarkers was assessed by receiver operating characteristic (ROC) analysis. Statistically significant value was p ≤ 0.05.
The number of patients was determined based on the previous pilot study, and the power of the test was assumed as 0.9.
3. Results
3.1. Dental Examination and Salivary Gland Function
The secretory activity of salivary glands was analyzed based on salivary flow rate and evaluation of total protein concentration as well as α-amylase activity in saliva. We observed a significantly lower flow of NWS and SWS in patients with NYHA II and NYHA III compared to the controls (in all cases p ˂ 0.001). The total protein content was considerably lower only in NWS in patients from both groups compared to the control group (p = 0.04, p ˂ 0.001, respectively). The salivary amylase activity was considerably lower in NWS of NYHA II and NYHA III patients (p < 0.001, p = 0.009, respectively) and SWS of NYHA II patients (p = 0.02) compared to the controls. However, no significant differences in oral hygiene as well as gum and periodontal condition (DMFT, PBI, GI, and CR) were found in the study group compared to the controls (Table 2).
3.2. Salivary Antioxidants
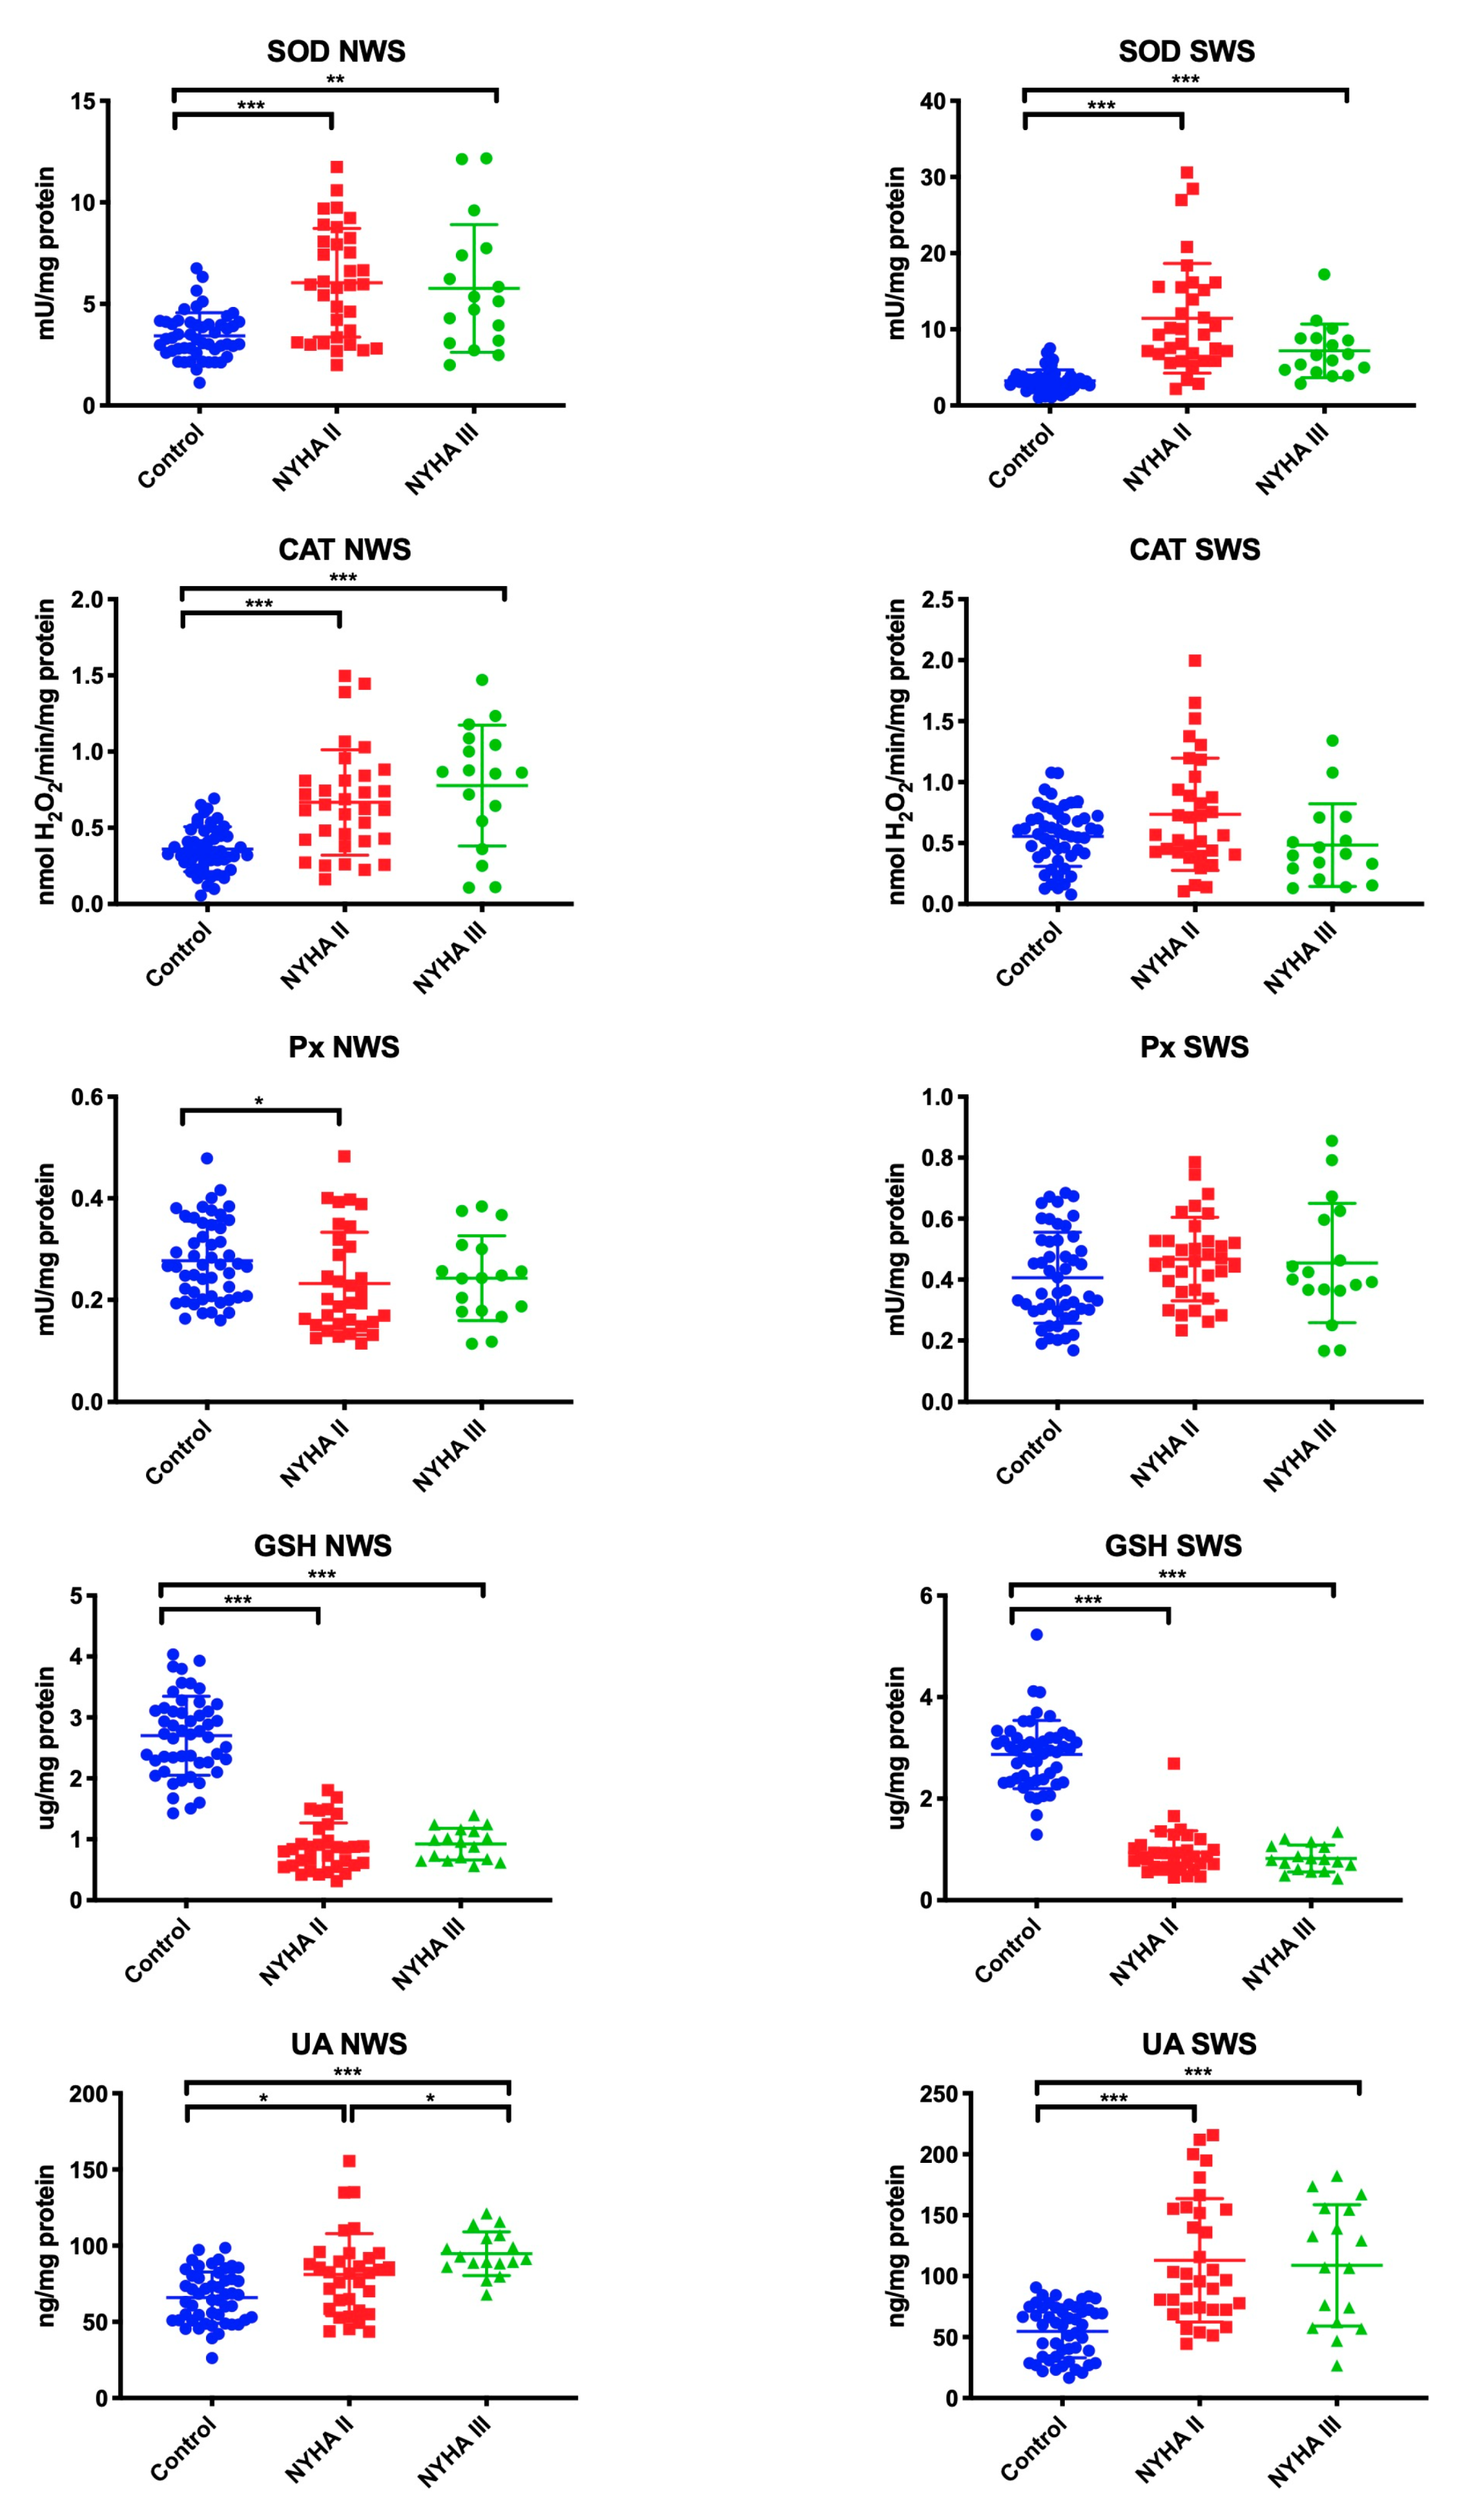
The antioxidant barrier was evaluated by measuring the activity of antioxidant enzymes (SOD, CAT, Px, GPx) as well as the concentration of non-enzymatic antioxidants (GSH, UA). In NWS, the activity of SOD (p ˂ 0.001, p = 0.009, respectively), CAT (in both cases p ˂ 0.001), and UA (p = 0.03, p ˂ 0.001, respectively) was significantly higher, while GSH content (in both cases p ˂ 0.001) was lower in NYHA II and NYHA III groups compared to the control group. The activity of Px (p = 0.02) was considerably lower in NWS of NYHA II patients than in healthy controls. Within the study group, only the concentration of UA was statistically significantly higher in NWS of NYHA II group compared to NYHA III (p = 0.02).
In SWS, the activity of SOD (p ˂ 0.001 in both groups) and UA (p ˂ 0.001 in both cases) was statistically significantly higher in NYHA II and NYHA III patients compared to the control group. On the other hand, GSH concentration was statistically considerably lower in patients with NYHA II and NYHA III compared to the controls (p ˂ 0.001 in both cases), similarly to NWS (Figure 1).
3.3. Salivary Total Antioxidant/Oxidant Status
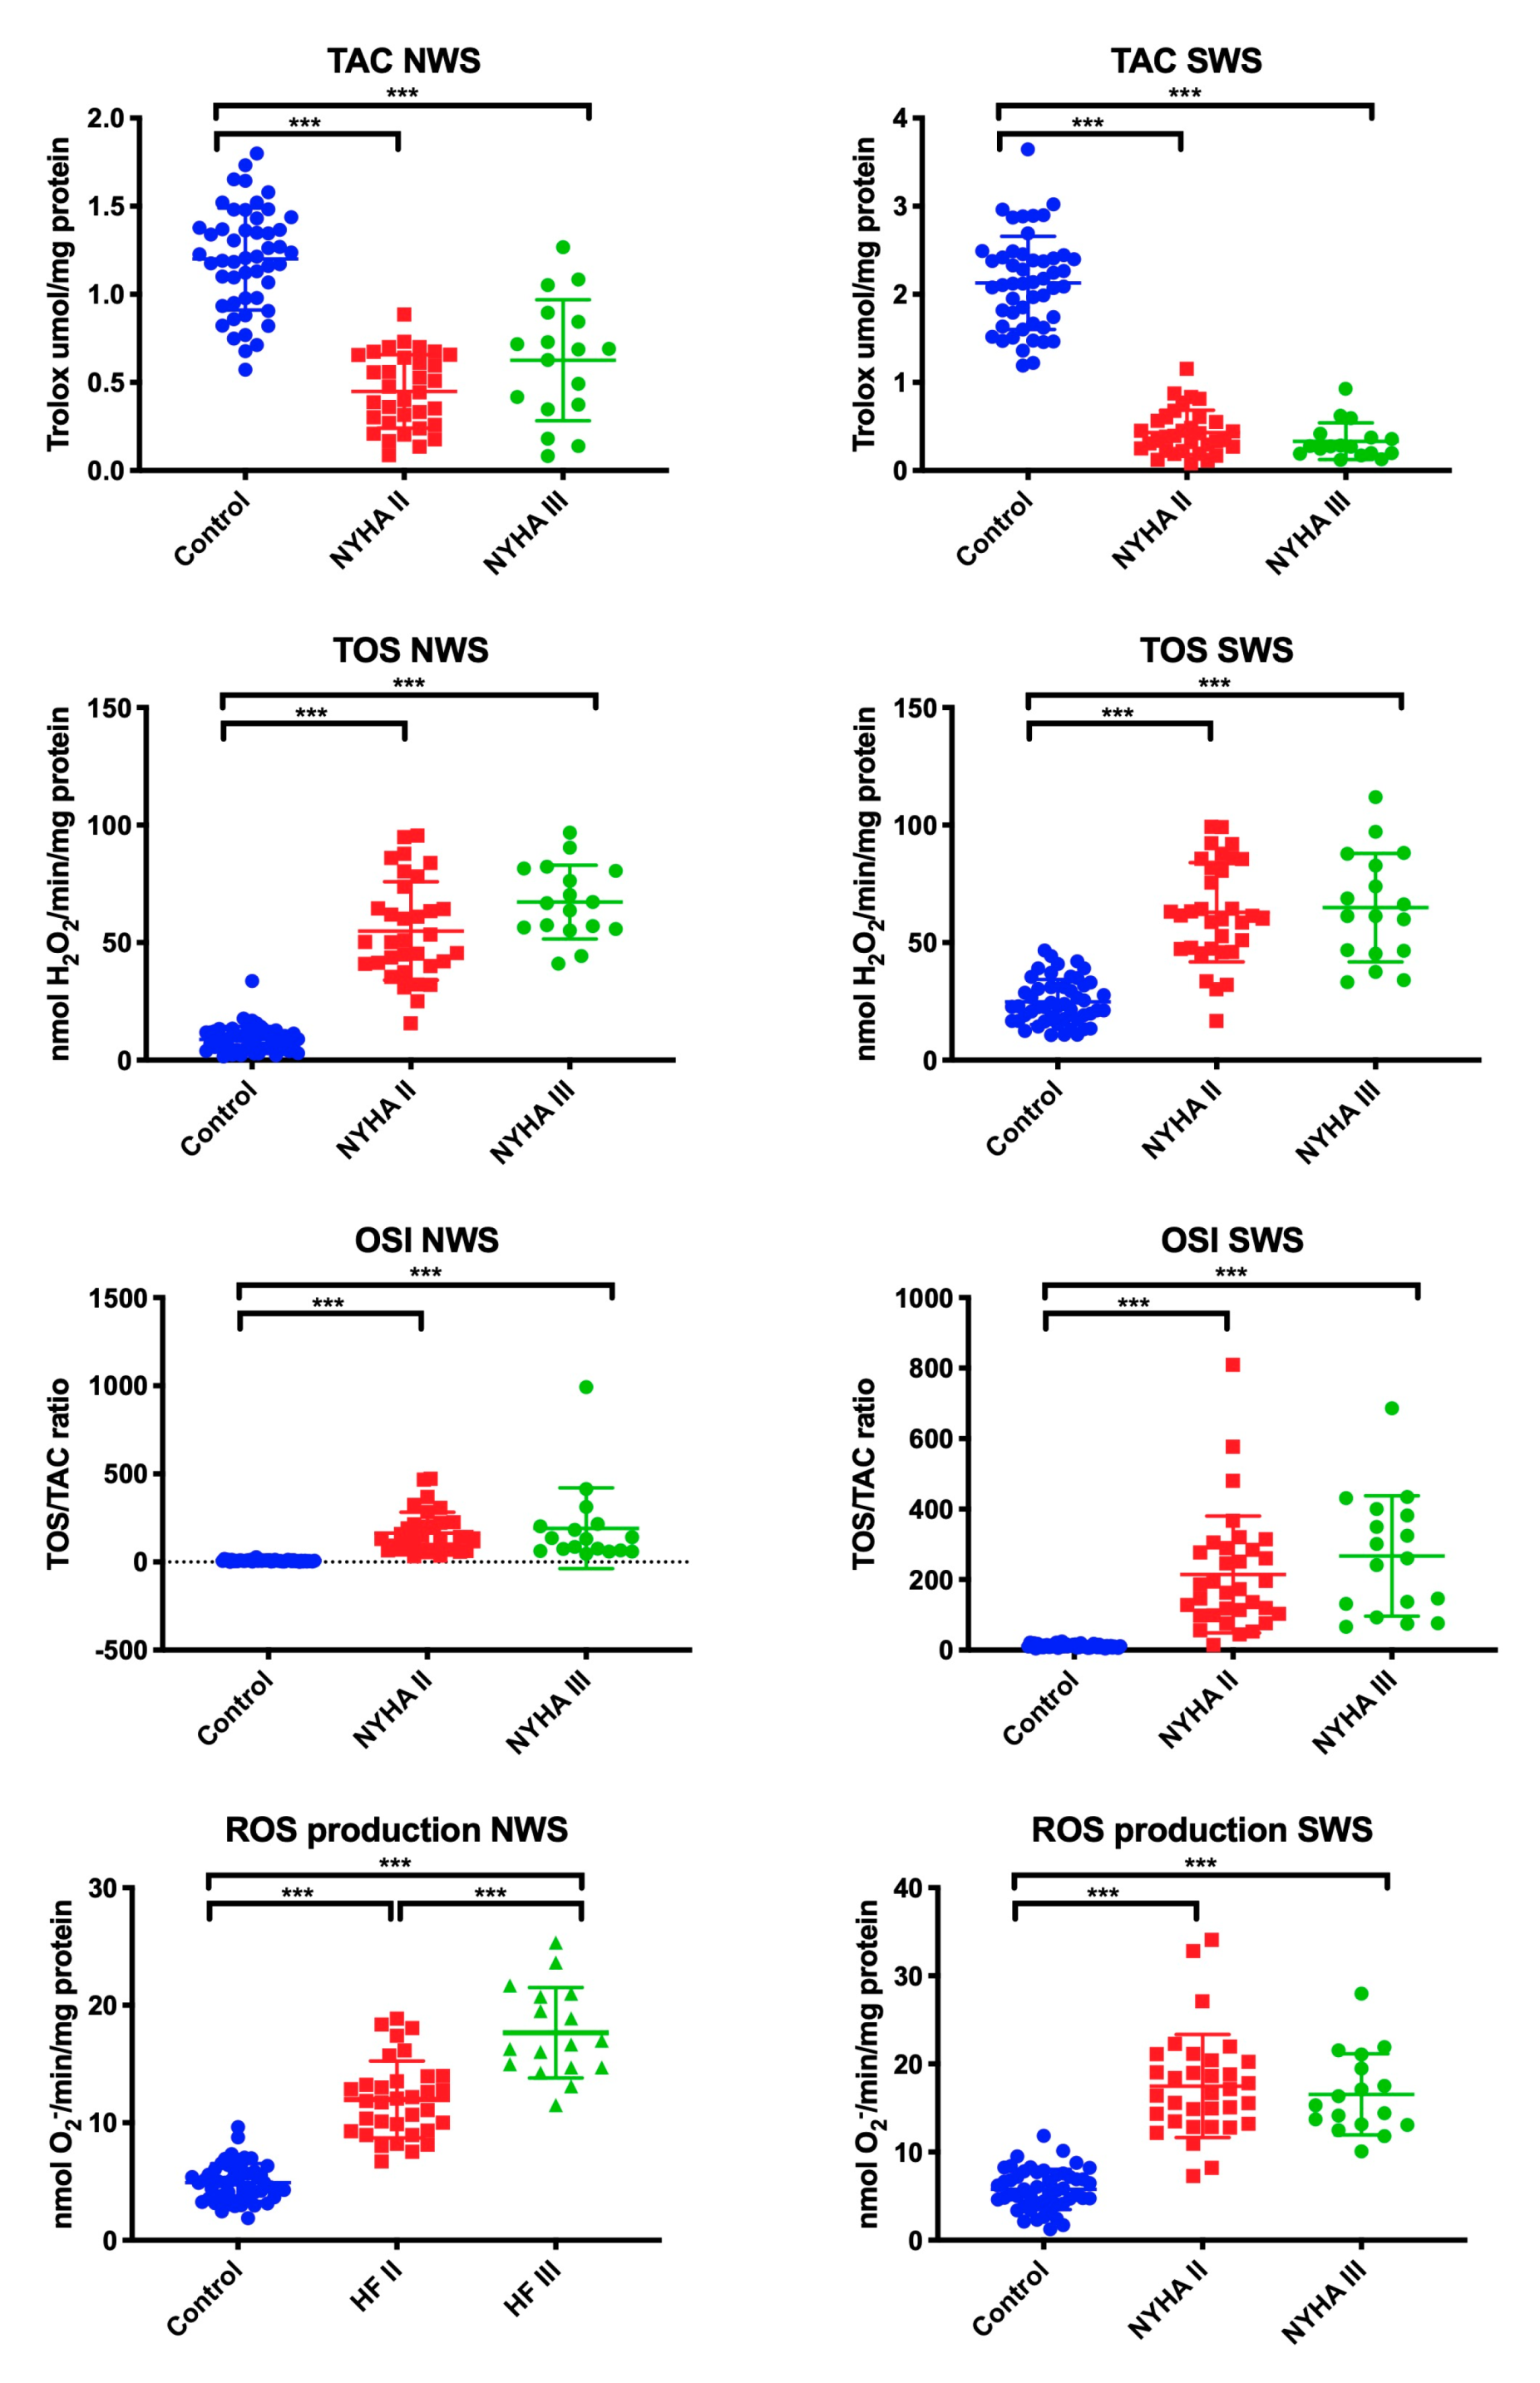
The total redox status was assessed by measuring TAC, TOS, and OSI (TAC/TOS ratio), while the rate of ROS production in saliva was determined by chemiluminescence. In NWS, the mean value of TOS, OSI, and ROS was statistically significantly higher in patients with NYHA II and NYHA III compared to the control group, and in case of ROS—also within the study group (higher in NYHA III). TAC determinations revealed that the values in patients from both study groups were considerably lower than in the control group (in all cases p ˂ 0.001).
In SWS, the mean value of TOS, OSI, and ROS was significantly higher in patients with NYHA II and NYHA III compared to the control group, while the mean value of TAC was lower (in all cases p ˂ 0.001) (Figure 2).
3.4. Salivary Oxidative Damage Products
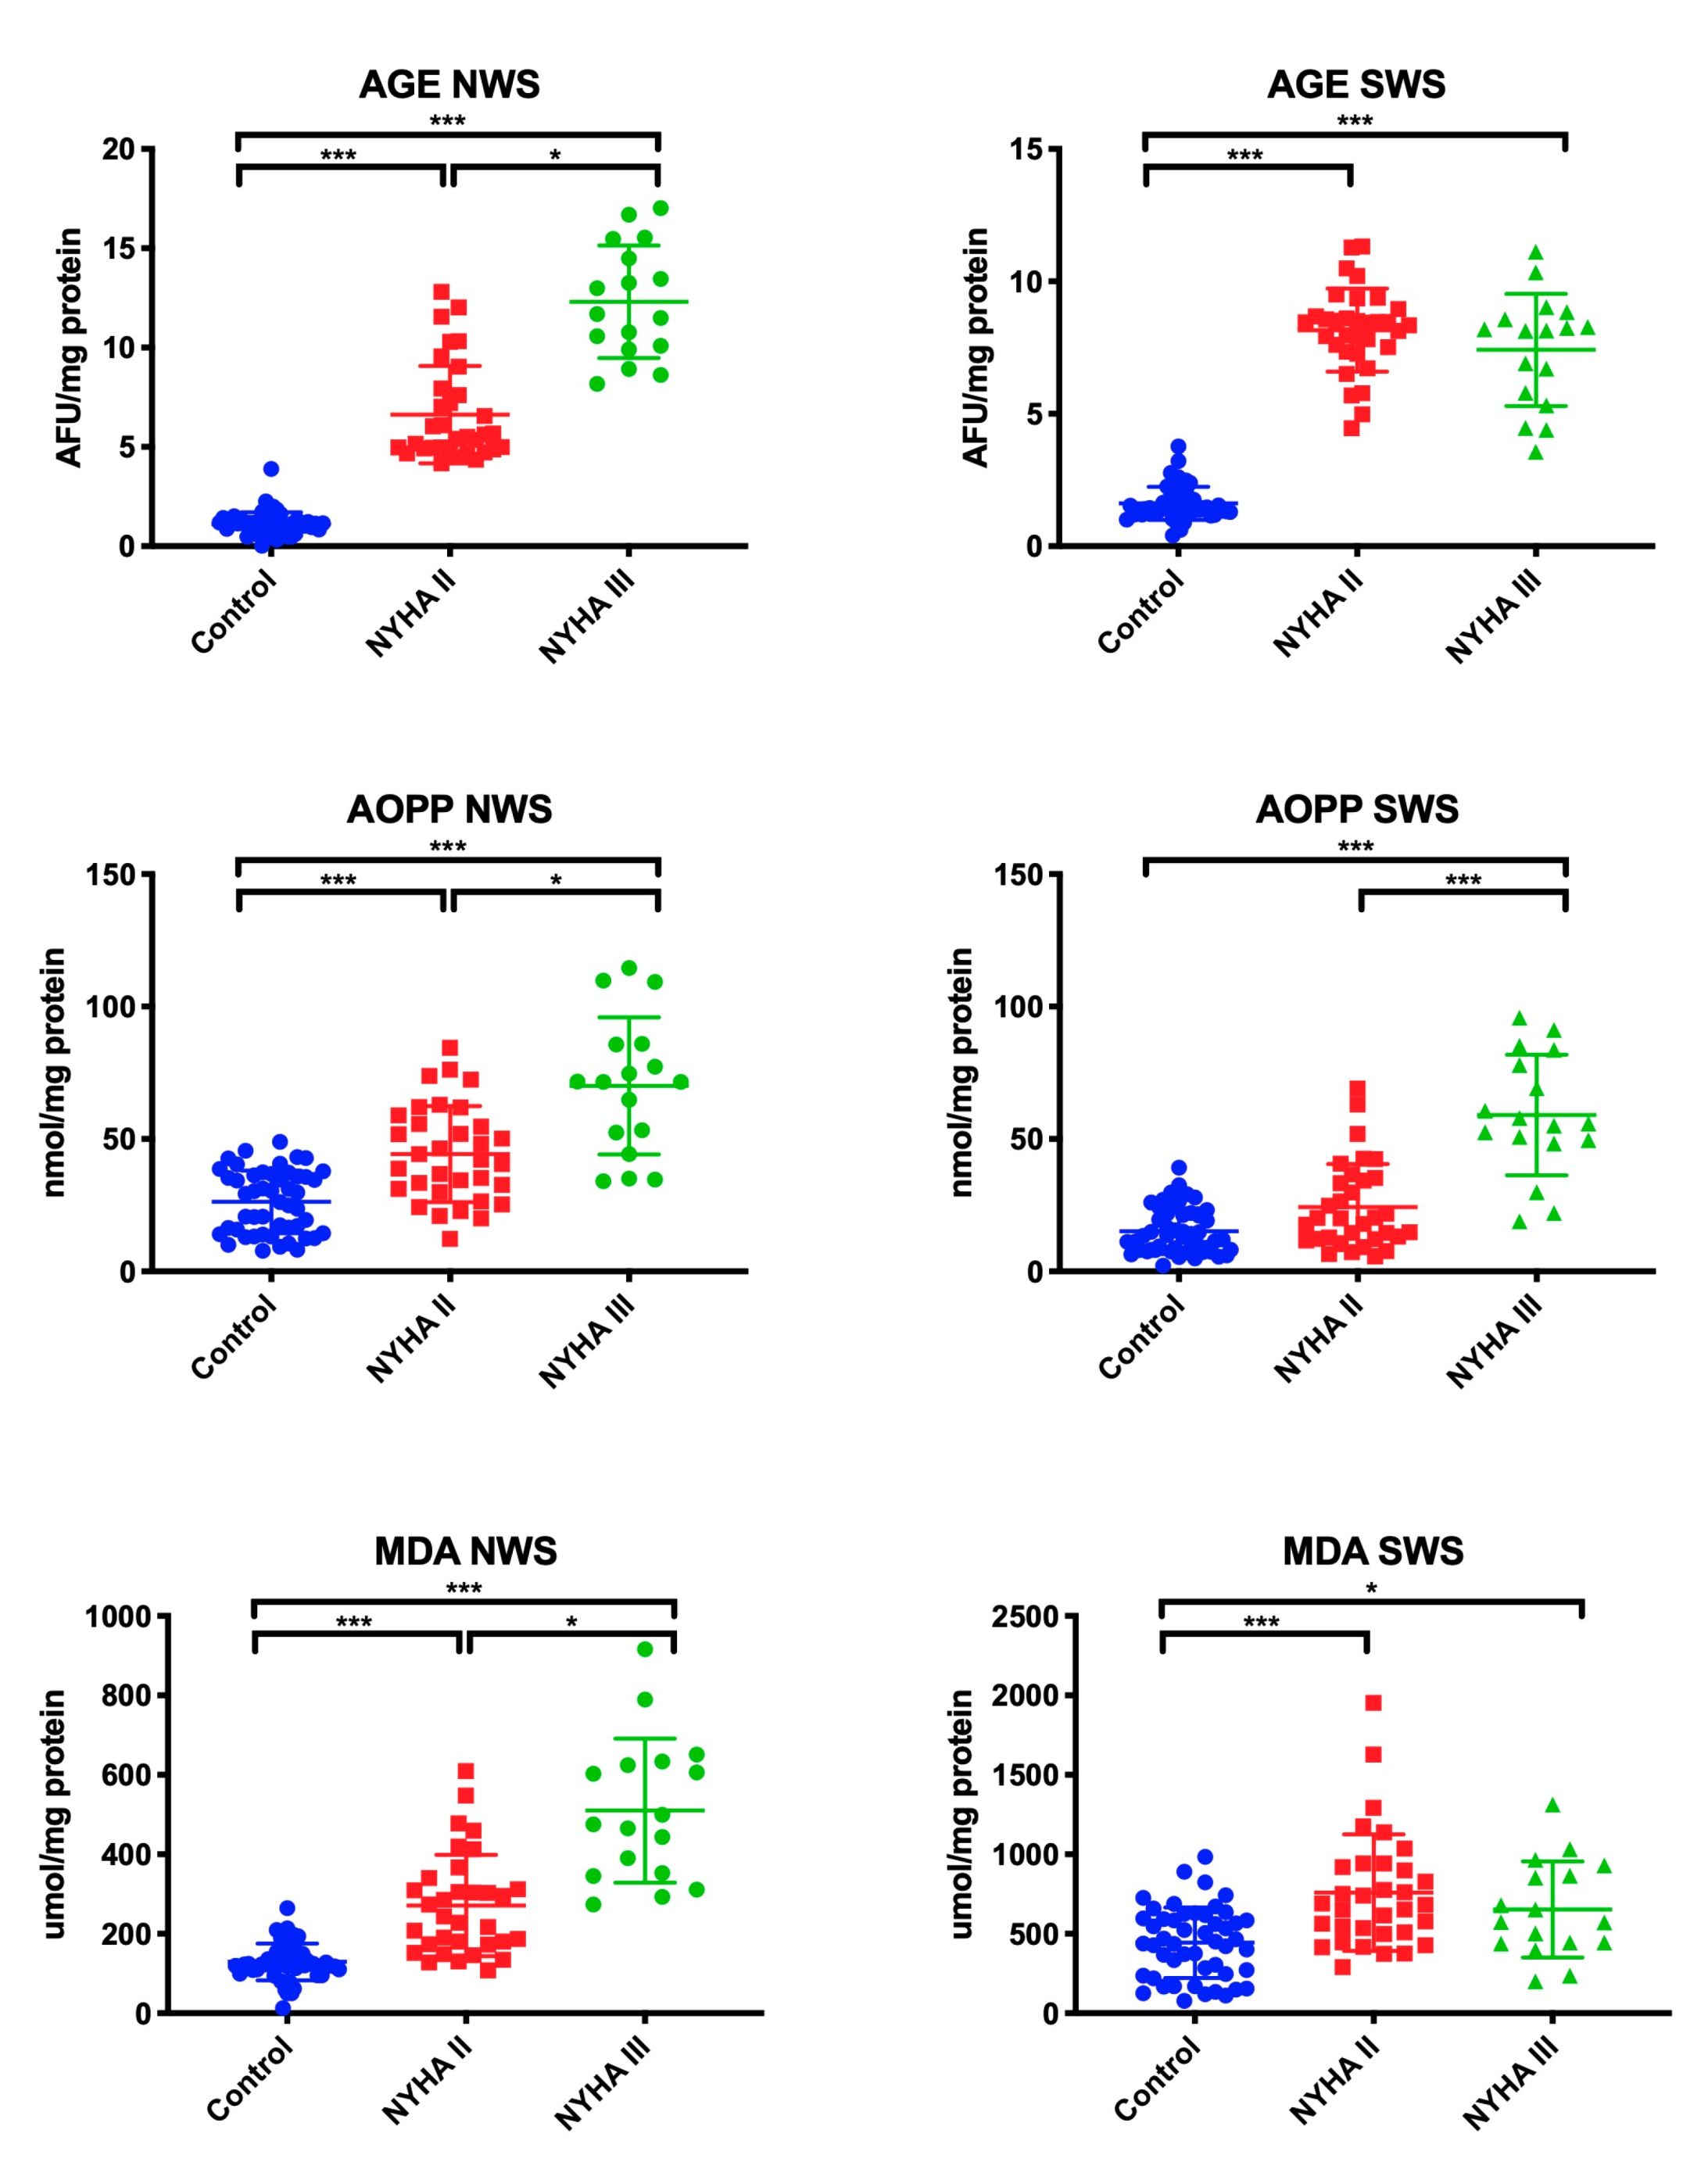
Oxidative stress was assessed by measuring the oxidative damage to proteins (AGE, AOPP) and lipids (MDA). We observed a significant increase in AGE, AOPP, and MDA concentrations in patients with NYHA II and NYHA III in comparison with the control group (in all cases p ˂ 0.001) and within the study group (p = 0.04, p = 0.03, p = 0.02, respectively).
In SWS, levels of AGE and MDA were considerably higher in NYHA II and NYHA III patients compared to healthy controls (p ˂ 0.001, p ˂ 0.001, p ˂ 0.001, p = 0.05, respectively). AOPP concentration was statistically significantly higher in patients with NYHA III compared to the control group (p ˂ 0.001), and in patients with NYHA III compared to those with NYHA II (p ˂ 0.001) (Figure 3).
3.5. Erythrocytes/Plasma Redox Biomarkers
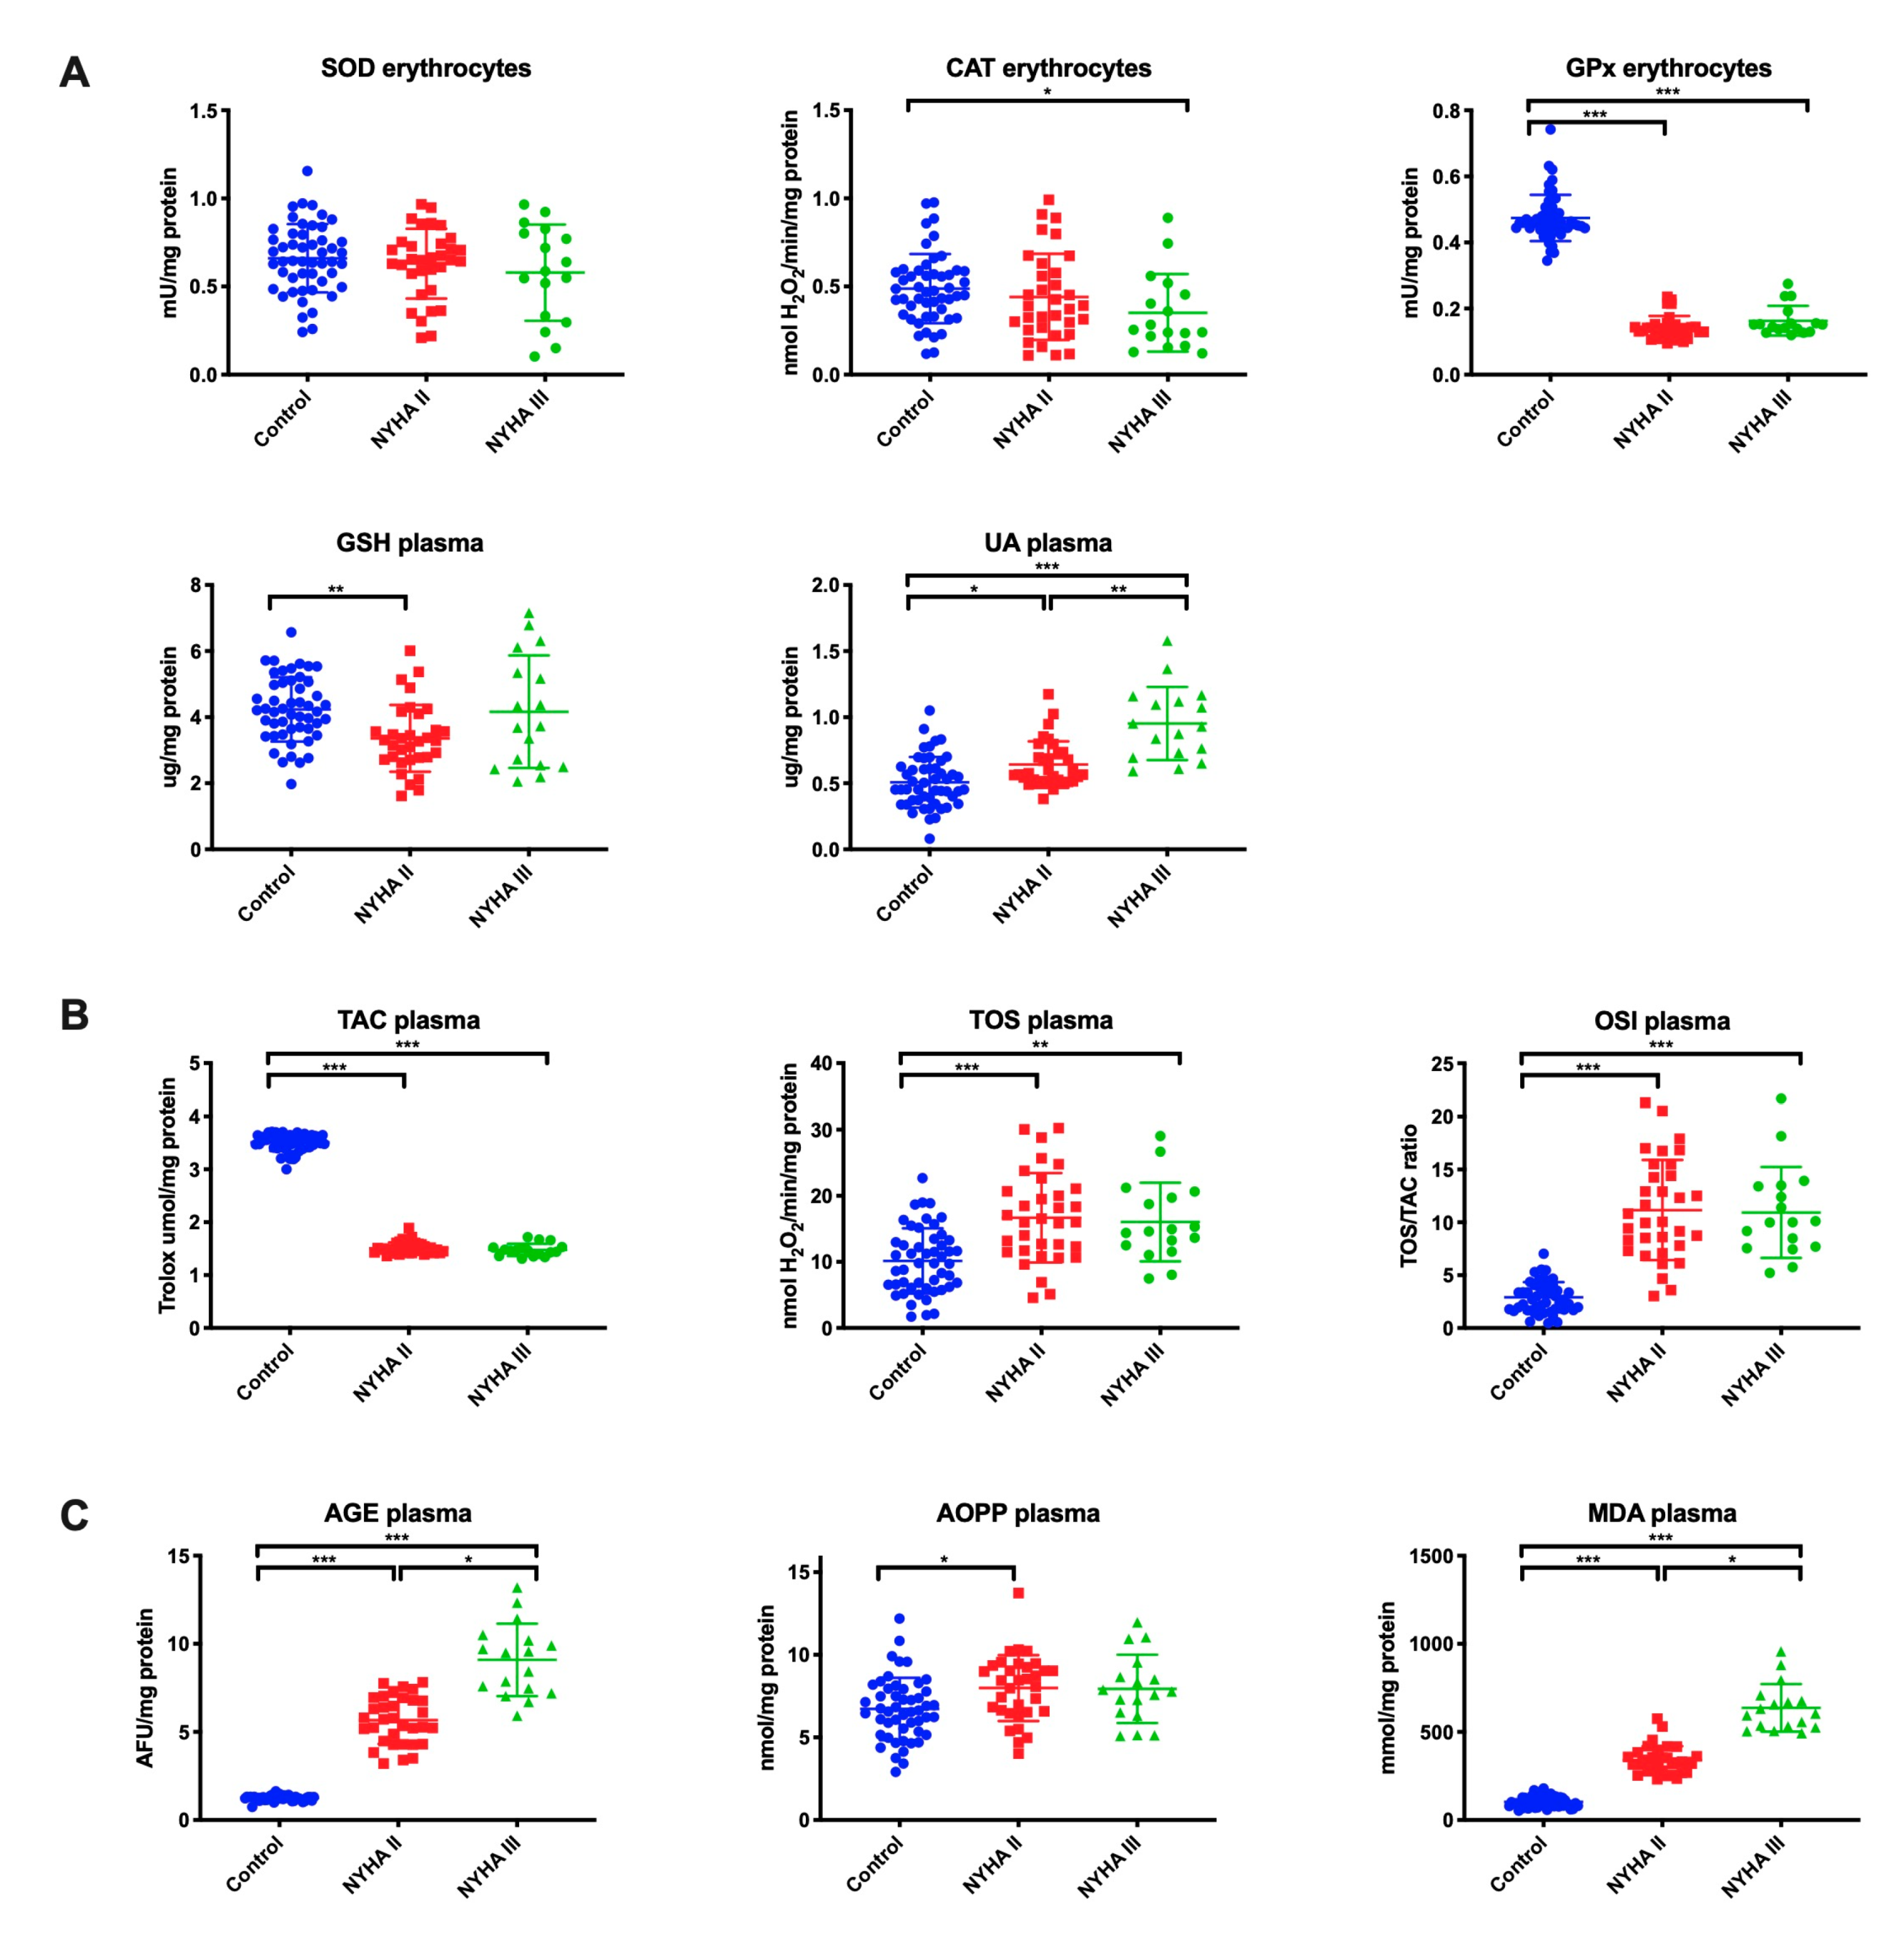
Antioxidant barrier (A), redox status (B), and oxidative damage to proteins and lipids (C) in the erythrocytes/plasma of HF patients and the control group are presented in Figure 4.
GPx activity (p ˂ 0.001 in both study groups) in erythrocytes was significantly lower in patients with NYHA II and NYHA III compared to the control group, whereas CAT activity (p = 0.03) in erythrocytes was lower only in NYHA III patients, and GSH concentration (p = 0.002) in plasma—only in NYHA II patients. UA concentration was considerably higher both in NYHA II and NYHA III patients compared to the control and within the study group (p = 0.02, p ˂ 0.001, p = 0.003, respectively) (Figure 4A).
TOS and OSI in plasma of NYHA II and NYHA III patients reached statistically significantly higher levels compared to the control group, while the level of TAC was lower (in all cases p ˂ 0.001) (Figure 4B).
The plasma concentrations of AGE and MDA were considerably higher in patients with NYHA II and NYHA III than in the control group (p ˂ 0.001, p ˂ 0.001, p ˂ 0.001, p = 0.02, respectively) and in patients with NYHA III compared to NYHA II (p = 0.04, p = 0.02, respectively). The content of AOPP was statistically significantly higher in NYHA II patients compared to the control group (p = 0.01) (Figure 4C).
3.6. Correlations
In the group of patients with chronic heart failure, we showed a positive correlation between SOD activity in saliva (both NWS and SWS) and ROS production rate (r = 0.825, p <0.0001 and r = 0.864, p <0.0001, respectively) and negative correlation between Px activity and ROS formation in NWS (r = −0.836, p <0.0001). In NWS and SWS we also showed a negative correlation between GSH and AGE concentration (r = −0.858, p <0.0001 and r = −0.873, p <0.0001, respectively) and GSH and AOPP (r = −0.814, p <0.0001 and r = −0.768, p <0.0001, respectively).
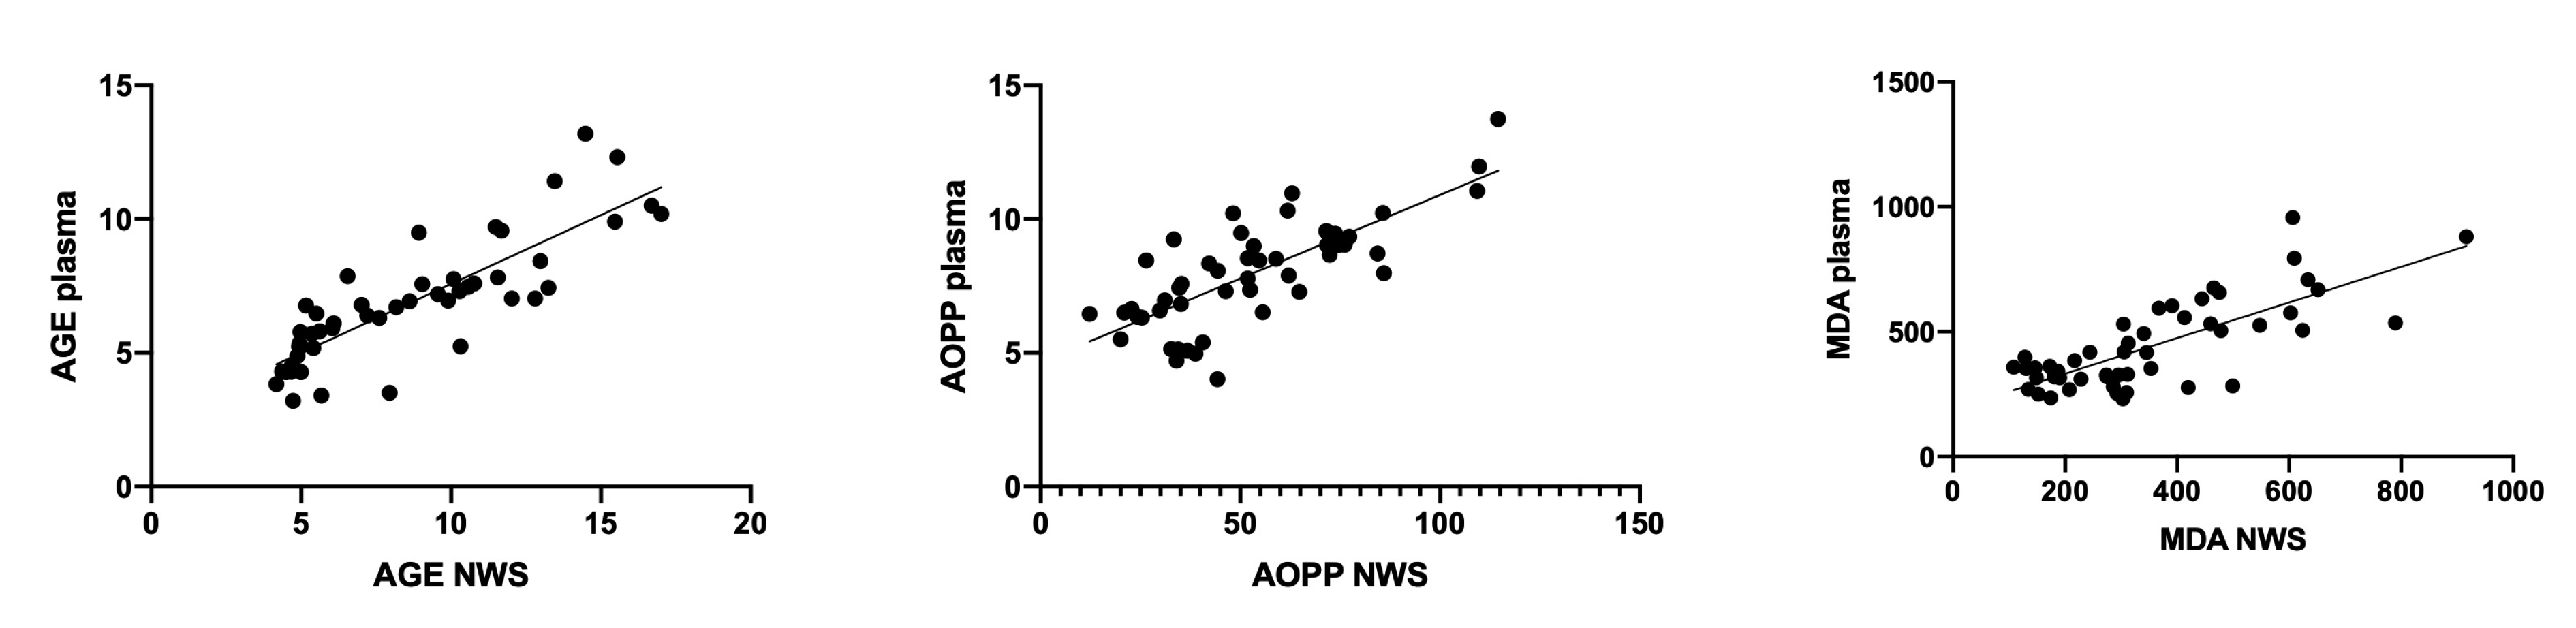
We also observed a negative correlation between NWS flow rate and AGE and MDA content (r = −0.846, p <0.0001 and r = −0.847, p <0.0001, respectively) and a positive relationship between ROS production rate in SWS and AOPP concentration (r = 0.892, p <0.0001). The concentration of AGE (r = 0.84, p <0.001), AOPP (r = 0.756, p <0.001), and MDA (r = 0.76, p <0.001) in NWS correlated positively with their plasma content (Figure 5).
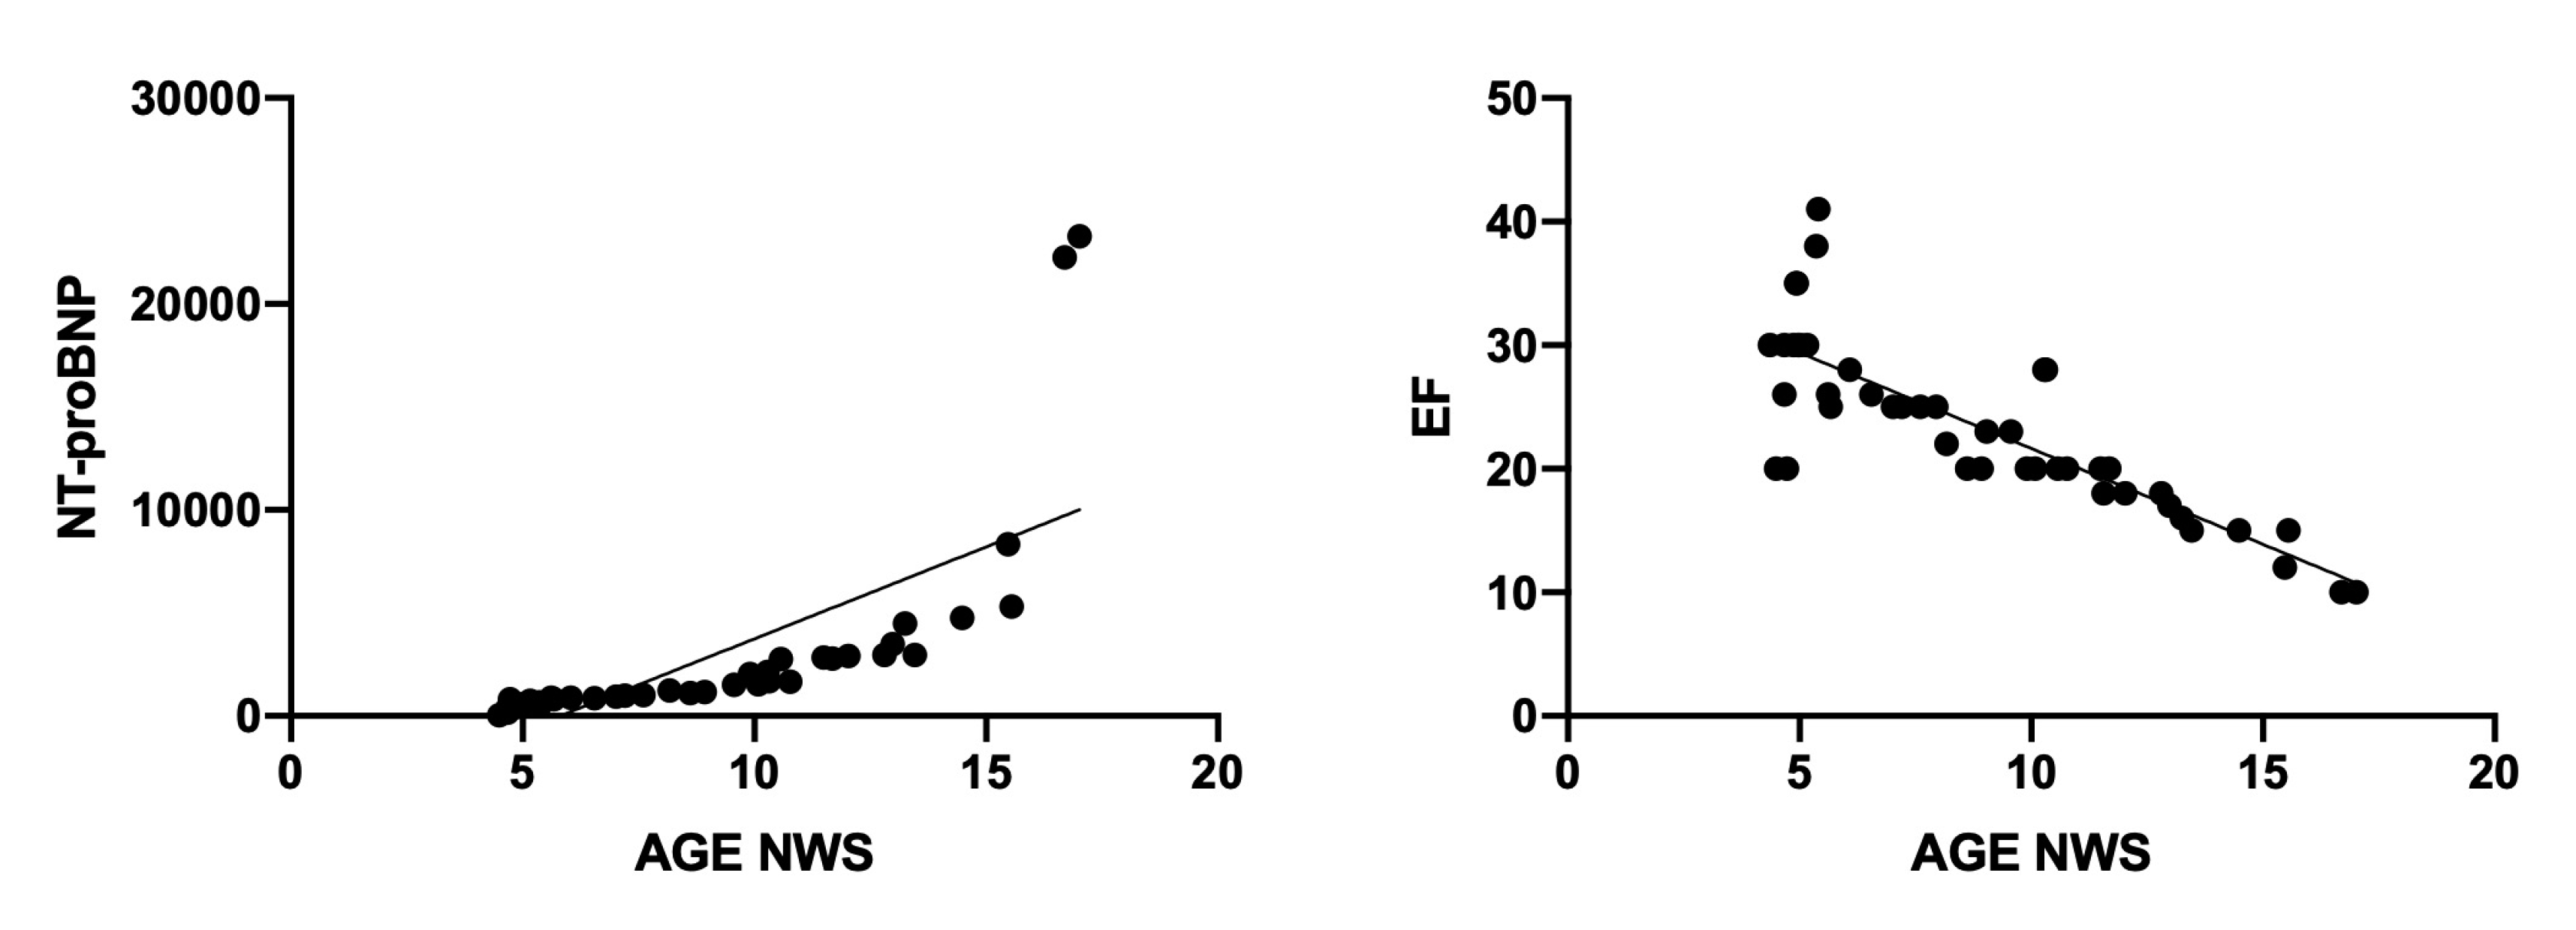
Interestingly, we also observed positive correlation between AGE content in NWS and serum NT-proBNP (r = 0.711, p <0.0001) and the negative relationship between the AGE content and cardiac ejection fraction (r = −0.832, p <0.0001) (Figure 6).
3.7. ROC Analysis
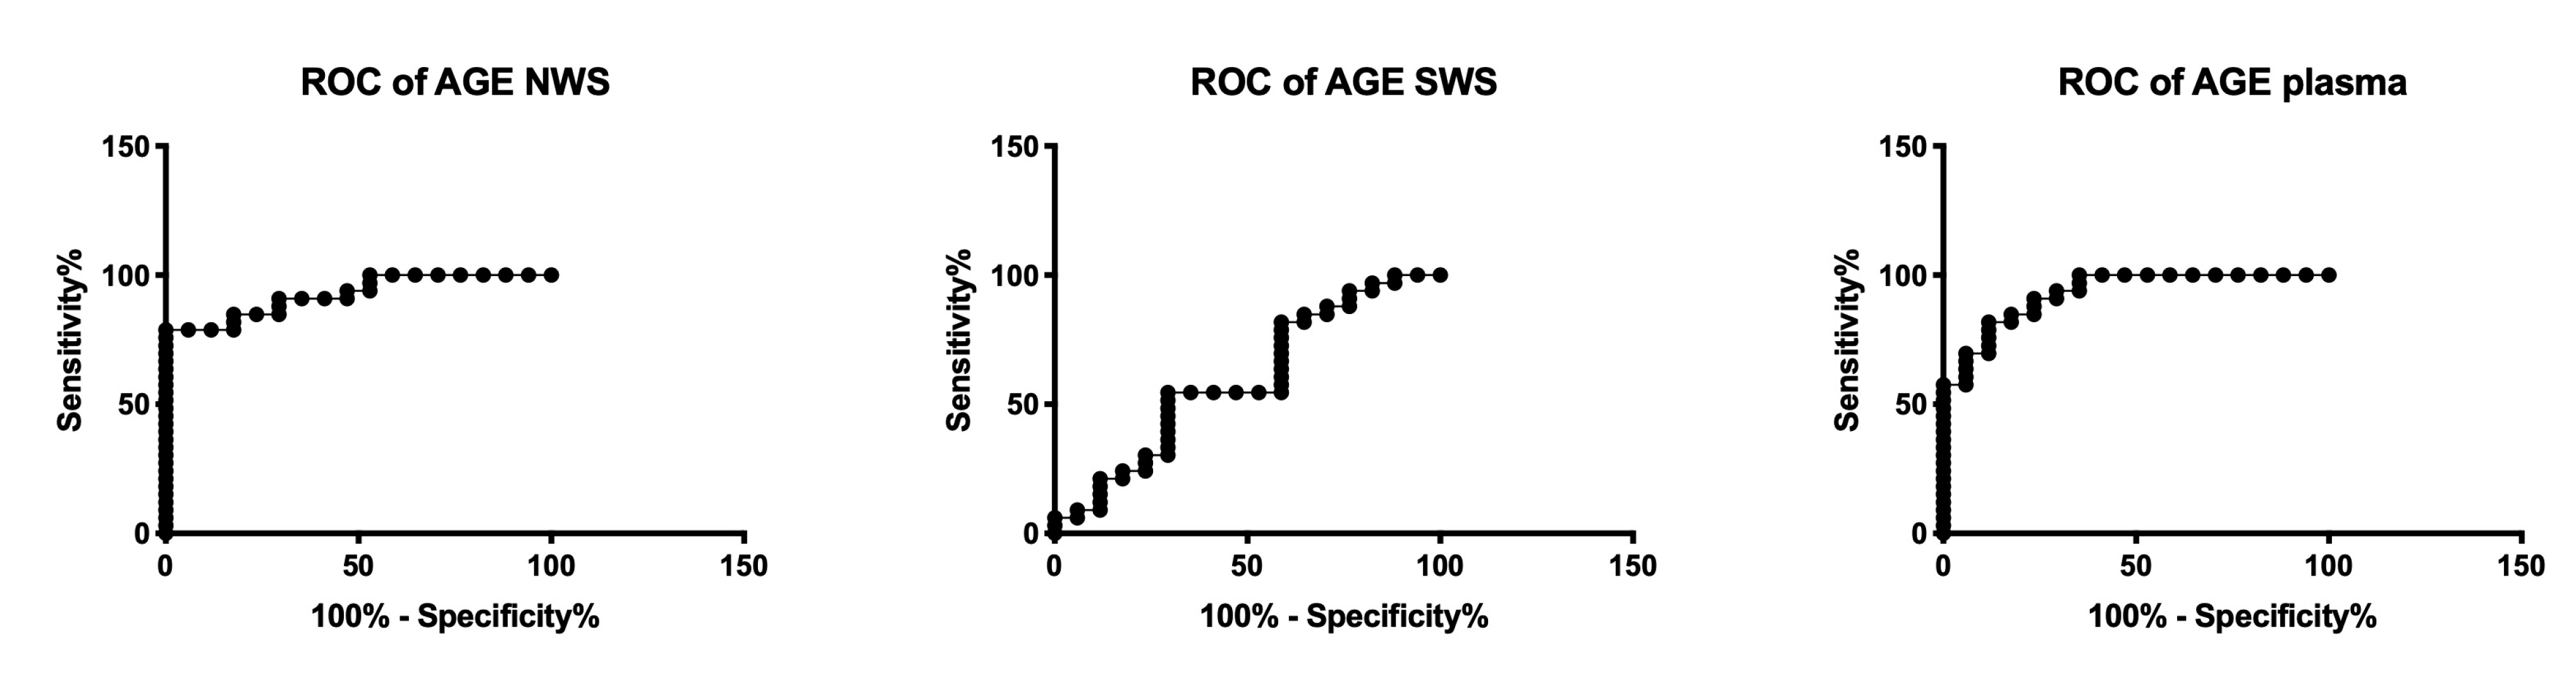
The results of ROC analysis for redox biomarkers are presented in Table 3. UA concentration in NWS and plasma, the rate of ROS production in NWS, and the concentration of all oxidative damage products in NWS (AGE, AOPP, MDA) significantly differentiate NYHA II patients compared to NYHA III. Moreover, the assessment of AOPP concentration in SWS, as well as AGE and MDA in plasma, has a high diagnostic value in differentiating the progression of chronic heart failure (Table 3, Figure 7).
4. Discussion
In the presented experiment, we studied the salivary gland function as well as redox homeostasis in the saliva and blood of HF patients. Generally, the progression of HF increases oxidative stress not only at the central level (blood), but also in the NWS and SWS. Additionally, in patients with HF, there is a dysfunction of salivary glands and abnormal protein secretion to saliva. Our study was the first to characterize salivary redox profile in HF patients and evaluate the clinical usefulness of salivary biomarkers in the differential diagnosis of heart failure.
HF is a clinical disease entity of multifactorial etiology connected with hypercholesterolemia, hypertension, diabetes, smoking, unbalanced diet, and sedentary lifestyle [1,2,4]. Oxidative stress is considered both the primary and secondary cause of HF, similarly to many other systemic diseases [5,6,7]. Indeed, the key contribution of oxidative stress in HF has been demonstrated in the pathogenesis of genetic, neurodegenerative, neoplastic, and metabolic diseases. Therefore, redox biomarkers are gaining increasing popularity in clinical laboratory diagnostics [47,48,49,50,51].
Direct analysis of reactive oxygen species in the body is a very difficult task. Each of the oxidants causes specific cellular (protein/lipid) modifications. Therefore, a number of different biomarkers must be used to assess redox homeostasis [52]. In our study, we evaluated enzymatic (SOD, CAT, Px) and non-enzymatic (GSH, UA) antioxidant systems, total redox status (TAC, TOS, OSI), as well as protein (AGE, AOPP) and lipid (MDA) oxidative damage products.
An important factor influencing therapeutic success is non-invasive collection of the material for examinations, which reduces patients’ anxiety and contributes to a greater desire to monitor one’s health status and diagnose the disease at its early stage. An interesting alternative to blood—which is commonly used in diagnostics—is saliva. This bioliquid is produced by large salivary glands (parotid, submandibular and sublingual) as well as numerous smaller salivary glands spread throughout the oral cavity. Saliva is blood plasma filtrate, and consists of electrolytes, proteins (immunoglobulins, enzymes, mucins), hormones, and vitamins. It is also a rich source of antioxidants (Px, CAT, SOD, GSH, UA) [14,53].
Antioxidants play an important role in preventing oxidative damage to biomolecules. In the group of HF patients, we observed a significant increase in the activity of salivary antioxidant enzymes (SOD in NWS and SWS, CAT in NWS), and increased concentration of UA (in NWS, SWS, and plasma) vs. the control, which can be considered an adaptive response of the body to intensified production of free radicals. It is also confirmed by positive correlation between SOD activity in NWS and SWS and free radical production rate. It is well known that the main source of ROS in HF is the excessive activation of the renin-angiotensin-aldosterone system [5,54], which stimulates the NFkB signaling pathway and thus boosts production of proinflammatory cytokines, but also the activity of NADPH oxidase (NOX), which is the primary source of free radicals in the cell [8]. This is also evidenced by the negative correlation between Px activity in NWS and ROS production rate. Px is the only salivary enzyme produced exclusively in the salivary glands [39,55]. Thus, a decrease in Px activity may reflect the reduced activity of NWS in preventing free radical damage. Additionally, it is believed that in physiological concentrations, the main role in neutralizing hydrogen peroxide is played by Px, whereas in the conditions of ROS overproduction (extremely high levels of H2O2) this role is taken over by CAT [50,56]. It is therefore not surprising that we observed decreased Px activity in NWS, significantly decreased GPx activity in erythrocytes, and increased CAT activity in NWS of HF patients compared to healthy subjects.
The most important salivary antioxidant is UA, which accounts for up to 70%–80% of the antioxidant capacity of saliva [53,57]. The results of our study indicated an increased release of UA into HF patients’ saliva (compared to the controls), additionally raised with the progression of the disease (significantly higher UA concentration in NYHA III group vs. NYHA II). Uric acid is formed with the participation of xanthine oxidase (XO) that transforms xanthine into hypoxanthine. The process also generates free oxygen and nitrogen radicals [58,59]. HF hypoperfusion and tissue hypoxia secondarily activate XO and are thus responsible for oxidative and nitrosative cell damage [54,60]. Interestingly, boosted XO activity increases the expression of extracellular matrix metalloproteinases, which constitutes an important factor involved in myocardial post-infarction remodeling [61,62]. These enzymes have damaging effects on the vascular endothelium, but may also disturb the remodeling of the extracellular matrix of salivary glands [63]. Thus, when in high concentrations, UA has a prooxidative effect. It was demonstrated that this compound not only generates ROS, but also produces intermediate compounds capable of alkylation of biomolecules [58,59,64]. Moreover, hyperuricemia reduces the production of nitric oxide (NO), which leads to endothelial dysfunction. It is said that oxidative stress induced by hyperuricemia is also a factor promoting the development of insulin resistance [65].
In light of the above, it is obvious that in HF patients, we observed a significant decrease in TAC (in NWS, SWS and plasma alike) compared to the control. This parameter represents the total ability to sweep free radicals [42]. Thus, decreased TAC levels suggest the exhaustion of antioxidant reserves in HF patients. However, thiol groups also have a considerable share in the antioxidant activity of saliva and blood (besides UA), which may be indirectly indicated by decreased concentration of GSH (in NWS, SWS, and plasma) in the study group.
Decreased efficiency of the antioxidant barrier increases the risk of oxidative damage to cell components. This was confirmed by raised levels of TOS and OSI, as well as significantly higher oxidative damage to proteins (↑AGE, ↑AOPP) and lipids (↑MDA) in the saliva and plasma of HF patients compared to the controls; and the negative correlation between GSH concentration in NWS as well as SWS and AGE and AOPP concentration. Interestingly, ROS production, protein glycation, and peroxidation of salivary/plasma lipids increased considerably with the progression of heart failure (higher content of AGE and MDA and increased rate of ROS production in NYHA III vs. NYHA II). This indicates the deepening of redox homeostasis disorders together with the severity/degree of disease progression.
A very common ailment in patients with HF is disturbed saliva secretion (xerostomia and hyposalivation). This was also confirmed by the results of our study. In HF patients, we observed impaired secretory function of salivary glands, as evidenced by decreased salivary secretion, significantly lower total protein content, and lowered activity of α-amylase in NWS and SWS compared to the control. A negative correlation between NWS salivary flow and AGE and MDA content, as well as a positive correlation between ROS production rate in SWS and AOPP concentration in HF patients may suggest the effect of oxidative stress on salivary gland dysfunction. It can be assumed that protein/lipid oxidation products are aggregated and accumulated in salivary glands, which—on the basis of positive feedback—boosts ROS production and leads to further oxidation of biomolecules [16,25,66]. In the end, the secretory cells of salivary glands are damaged, which is manifested by decreased production of NWS and SWS as well as disturbances in protein synthesis/secretion to saliva. Interestingly, protein oxidation products (especially AGE) also can increase the production of pro-inflammatory cytokines, which enhances damage to the salivary glands [16,25]. The impairment of salivary gland function in HF patients is evidenced not only by a decrease in salivary flow rate but also by a reduction in salivary amylase activity and total protein content. Indeed, salivary amylase is the most important salivary enzyme that has been widely recognized as a marker of salivary hypofunction [67]. Although the salivary flow rate was significantly reduced for both non-stimulated and stimulated saliva, changes in α-amylase activity as well as disturbed protein secretion to saliva were found only in NWS of HF patients. In resting conditions, 80% of saliva is secreted by submandibular glands, while in stimulation, this activity is taken over by parotid glands [29,55]. Therefore, in patients with HF, mainly submandibular dysfunction occurs. Importantly, hyposalivation can result in oral mucositis, burning of the mouth, chewing and swallowing disorders, as well as speech disorders [67]. However, the volume of saliva may also be affected by cardiovascular drugs. Medicines that reduce saliva secretion include thiazide diuretics, beta-blockers, calcium channel blockers, and ACE inhibitors [3,68].
Changes in the qualitative and quantitative composition of saliva may also predispose to dental caries and periodontal disease [67]. Therefore, patients with HF should receive an additional dental care. Nevertheless, an open question is the possibility of antioxidant supplementation to improve the condition of HF cases. Due to the high clinical relevance, this issue requires further research and observations.
An important part of our study was also the assessment of diagnostic utility of redox biomarkers. We used ROC analysis to demonstrate that numerous parameters with high sensitivity and specificity differentiate subjects with NYHA II vs. NYHA III. Particularly promising results were observed for salivary AGE (AUC = 0.93, sensitivity = 81.82%, specificity = 82.35%, NYHA II vs. NYHA III), which was additionally confirmed by a positive correlation between salivary AGE content and blood NT-proBNP concentration, as well as a negative correlation with ejection fraction. Furthermore, the AGE concentration in NWS correlated positively with their plasma content. Therefore, saliva is an alternative biological material to blood, and its collection is cheap, non-invasive, and painless. Our experiment is the first to evaluate salivary redox homeostasis in HF patients, therefore, further studies are required to evaluate the clinical value of salivary redox biomarkers in a larger group of patients.
Despite the restrictive criteria of inclusion and exclusion, our study involved elderly people diagnosed, apart from HF, with type 2 diabetes, hypercholesterolemia, or hypertension. Thus, when characterizing the redox balance of our patients, we must consider not only heart failure, but also the accompanying diseases as well as the aging process. Similarly, in human studies, the oxidative stress caused by chronic vascular disease (CVD) versus HFrEF cannot be differentiated. HF is more common in men [69,70,71]; however, the unequal gender distribution in our study may be due that women reach a similar HF risk as men only after the menopause [3]. In addition, we evaluated only the selected oxidative stress biomarkers, which is also a limitation of the study. The exact effect of cardiological drugs on redox parameters is also unknown.
In conclusion, in HF patients, disturbances in enzymatic and non-enzymatic antioxidant defense as well as oxidative damage to proteins and lipids occur in NWS, SWS, and plasma/erythrocytes. Redox homeostasis disorders generally worsen with HF progression, and some parameters of oxidative stress in saliva may be potential diagnostic biomarkers. In patients with HF, mainly submandibular salivary glands are affected. Due to the qualitative and quantitative changes in saliva, HF patients should be provided with additional dental care.
Author Contributions
Conceptualization, A.Z. and M.M.; Data curation, A.K. and M.M.; Formal analysis, A.K. and M.M.; Funding acquisition, A.Z. and M.M.; Investigation, A.Z. and M.M.; Methodology, A.K., A.Z. and M.M.; Project administration, A.Z. and M.M.; Resources, A.K, R.S and M.K.; Software, A.K. and R.S.; Supervision, A.Z. and M.K.; Validation, A.K and M.M.; Visualization, A.K. and M.M.; Writing – original draft, A.K. and M.M.; Writing – review & editing, A.Z. and M.M. All authors have read and agreed to the published version of the manuscript.
Funding
This research was funded by the Medical University of Bialystok, Poland (grant numbers: SUB/1/DN/20/002/1209; SUB/1/DN/20/002/3330).
Acknowledgments
The authors would like to thank Katarzyna Fejfer and Anna Skutnik for their help in collecting material for research.
Conflicts of Interest
The authors declare no conflict of interest.
References
- Ziaeian, B.; Fonarow, G.C. Epidemiology and aetiology of heart failure. Nat. Rev. Cardiol. 2016, 13, 368–378. [Google Scholar] [CrossRef] [Green Version]
- Orso, F.; Fabbri, G.; Maggioni, A. Pietro Epidemiology of heart failure. In Handbook of Experimental Pharmacology; Springer International Publishing AG: Berlin/Heidelberg, Germany, 2017. [Google Scholar]
- Ponikowski, P.; Voors, A. 2016 Esc guidelines for the diagnosis and treatment of acute and chronic heart failure: The Task Force for the diagnosis and treatment of acute and chronic heart failure of the European society of cardiology (ESC): Developed with the special contribution. Russ. J. Cardiol. 2017, 18, 891–975. [Google Scholar] [CrossRef]
- Seferovic, P.M.; Ponikowski, P.; Anker, S.D.; Bauersachs, J.; Chioncel, O.; Cleland, J.G.F.; de Boer, R.A.; Drexel, H.; Ben Gal, T.; Hill, L.; et al. Clinical practice update on heart failure 2019: Pharmacotherapy, procedures, devices and patient management. An expert consensus meeting report of the Heart Failure Association of the European Society of Cardiology. Eur. J. Heart Fail. 2019, 21, 1169–1186. [Google Scholar] [CrossRef]
- Chen, Q.M.; Morrissy, S.; Alpert, J.S. Oxidative Stress and Heart Failure. In Comprehensive Toxicology: Third Edition; Elsevier Science: Amsterdam, The Netherlands, 2017; ISBN 9780081006122. [Google Scholar]
- Bayeva, M.; Gheorghiade, M.; Ardehali, H. Mitochondria as a therapeutic target in heart failure. J. Am. Coll. Cardiol. 2013, 61, 599–610. [Google Scholar] [CrossRef] [Green Version]
- Van der Pol, A.; van Gilst, W.H.; Voors, A.A.; van der Meer, P. Treating oxidative stress in heart failure: Past, present and future. Eur. J. Heart Fail. 2019, 21, 425–435. [Google Scholar] [CrossRef] [PubMed]
- Maciejczyk, M.; Żebrowska, E.; Chabowski, A. Insulin Resistance and Oxidative Stress in the Brain: What’s New? Int. J. Mol. Sci. 2019, 20, 875. [Google Scholar] [CrossRef] [PubMed] [Green Version]
- Szczurek, W.; Szyguła-Jurkiewicz, B. Oxidative stress and inflammatory markers-the future of heart failure diagnostics? Kardiochirurgia i Torakochirurgia Pol. 2015, 12, 145. [Google Scholar]
- Tsutsui, H.; Kinugawa, S.; Matsushima, S. Oxidative stress and heart failure. Am. J. Physiol. Hear. Circ. Physiol. 2011, 147, 77–81. [Google Scholar] [CrossRef] [PubMed] [Green Version]
- Yoshizawa, J.M.; Schafer, C.A.; Schafer, J.J.; Farrell, J.J.; Paster, B.J.; Wong, D.T.W. Salivary biomarkers: Toward future clinical and diagnostic utilities. Clin. Microbiol. Rev. 2013, 26, 781–791. [Google Scholar] [CrossRef] [PubMed] [Green Version]
- Maria, V.; Beniamino, P.; Andrea, M.; Carmen, L. Oxidative stress, plasma/salivary antioxidant status detection and health risk factors Vadalà Maria1, Palmieri Beniamino2, Malagoli Andrea3, Laurino Carmen4. Asian J. Med. Sci. 2017, 8, 32–41. [Google Scholar] [CrossRef] [Green Version]
- Malathi, L.; Rajesh, E.; Aravindha Babu, N.; Jimson, S. Saliva as a diagnostic tool. Biomed. Pharmacol. J. 2016, 9. [Google Scholar] [CrossRef]
- Javaid, M.A.; Ahmed, A.S.; Durand, R.; Tran, S.D. Saliva as a diagnostic tool for oral and systemic diseases. J. Oral Biol. Craniofacial Res. 2016, 6, 61–76. [Google Scholar] [CrossRef] [PubMed] [Green Version]
- Zhang, C.Z.; Cheng, X.Q.; Li, J.Y.; Zhang, P.; Yi, P.; Xu, X.; Zhou, X.D. Saliva in the diagnosis of diseases. Int. J. Oral Sci. 2016, 8, 133–137. [Google Scholar] [CrossRef] [PubMed] [Green Version]
- Zalewska, A.; Ziembicka, D.; Żendzian-Piotrowska, M.; Maciejczyk, M. The Impact of High-Fat Diet on Mitochondrial Function, Free Radical Production, and Nitrosative Stress in the Salivary Glands of Wistar Rats. Oxid. Med. Cell. Longev. 2019, 2019, 2606120. [Google Scholar] [CrossRef] [PubMed] [Green Version]
- Maciejczyk, M.; Szulimowska, J.; Skutnik, A.; Taranta-Janusz, K.; Wasilewska, A.; Wiśniewska, N.; Zalewska, A. Salivary Biomarkers of Oxidative Stress in Children with Chronic Kidney Disease. J. Clin. Med. 2018, 7, 209. [Google Scholar] [CrossRef] [PubMed] [Green Version]
- Świderska, M.; Maciejczyk, M.; Zalewska, A.; Pogorzelska, J.; Flisiak, R.; Chabowski, A. Oxidative stress biomarkers in the serum and plasma of patients with non-alcoholic fatty liver disease (NAFLD). Can plasma AGE be a marker of NAFLD? Free Radic. Res. 2019. [Google Scholar] [CrossRef]
- Kułak-Bejda, A.; Waszkiewicz, N.; Bejda, G.; Zalewska, A.; Maciejczyk, M. Diagnostic Value of Salivary Markers in Neuropsychiatric Disorders. Dis. Markers 2019, 2019, 1–6. [Google Scholar] [CrossRef] [Green Version]
- Klimiuk, A.; Maciejczyk, M.; Choromańska, M.; Fejfer, K.; Waszkiewicz, N.; Zalewska, A. Salivary Redox Biomarkers in Different Stages of Dementia Severity. J. Clin. Med. 2019, 8, 840. [Google Scholar] [CrossRef] [Green Version]
- Sawczuk, B.; Maciejczyk, M.; Sawczuk-Siemieniuk, M.; Posmyk, R.; Zalewska, A.; Car, H. Salivary Gland Function, Antioxidant Defence and Oxidative Damage in the Saliva of Patients with Breast Cancer: Does the BRCA1 Mutation Disturb the Salivary Redox Profile? Cancers (Basel.) 2019, 11, 1501. [Google Scholar] [CrossRef] [Green Version]
- Gornitsky, M.; Velly, A.M.; Mohit, S.; Almajed, M.; Su, H.; Panasci, L.; Schipper, H.M. Altered levels of salivary 8-oxo-7-hydrodeoxyguanosine in breast cancer. JDR Clin. Transl. Res. 2016, 1, 171–177. [Google Scholar] [CrossRef]
- Zalewska, A.; Kossakowska, A.; Taranta-Janusz, K.; Zięba, S.; Fejfer, K.; Salamonowicz, M.; Kostecka-Sochoń, P.; Wasilewska, A.; Maciejczyk, M. Dysfunction of Salivary Glands, Disturbances in Salivary Antioxidants and Increased Oxidative Damage in Saliva of Overweight and Obese Adolescents. J. Clin. Med. 2020, 9, 548. [Google Scholar] [CrossRef] [PubMed] [Green Version]
- Fejfer, K.; Buczko, P.; Niczyporuk, M.; Ładny, J.R.; Hady, H.R.; Knaś, M.; Waszkiel, D.; Klimiuk, A.; Zalewska, A.; Maciejczyk, M. Oxidative Modification of Biomolecules in the Nonstimulated and Stimulated Saliva of Patients with Morbid Obesity Treated with Bariatric Surgery. Biomed Res. Int. 2017, 2017, 4923769. [Google Scholar] [CrossRef] [PubMed] [Green Version]
- Zalewska, A.; Maciejczyk, M.; Szulimowska, J.; Imierska, M.; Błachnio-Zabielska, A. High-Fat Diet Affects Ceramide Content, Disturbs Mitochondrial Redox Balance, and Induces Apoptosis in the Submandibular Glands of Mice. Biomolecules 2019, 9, 877. [Google Scholar] [CrossRef] [PubMed] [Green Version]
- Kołodziej, U.; Maciejczyk, M.; Miasko, A.; Matczuk, J.; Knas, M.; Zukowski, P.; Zendzian-Piotrowska, M.; Borys, J.; Zalewska, A. Oxidative modification in the salivary glands of high fat-diet induced insulin resistant rats. Front. Physiol. 2017, 8, 20. [Google Scholar] [CrossRef] [Green Version]
- Maciejczyk, M.; Kossakowska, A.; Szulimowska, J.; Klimiuk, A.; Knaś, M.; Car, H.; Niklińska, W.; Ładny, J.R.; Chabowski, A.; Zalewska, A. Lysosomal Exoglycosidase Profile and Secretory Function in the Salivary Glands of Rats with Streptozotocin-Induced Diabetes. J. Diabetes Res. 2017, 2017, 1–13. [Google Scholar] [CrossRef] [Green Version]
- Skutnik-Radziszewska, A.; Maciejczyk, M.; Fejfer, K.; Krahel, J.; Flisiak, I.; Kołodziej, U.; Zalewska, A. Salivary Antioxidants and Oxidative Stress in Psoriatic Patients: Can Salivary Total Oxidant Status and Oxidative Status Index Be a Plaque Psoriasis Biomarker? Oxid. Med. Cell. Longev. 2020, 2020, 9086024. [Google Scholar] [CrossRef] [Green Version]
- Maciejczyk, M.; Zalewska, A.; Ładny, J.R. Salivary Antioxidant Barrier, Redox Status, and Oxidative Damage to Proteins and Lipids in Healthy Children, Adults, and the Elderly. Oxid. Med. Cell. Longev. 2019, 2019, 1–12. [Google Scholar] [CrossRef] [Green Version]
- Knaś, M.; Maciejczyk, M.; Sawicka, K.; Hady, H.R.; Niczyporuk, M.; Ładny, J.R.; Matczuk, J.; Waszkiel, D.; Żendzian-Piotrowska, M.; Zalewska, A. Impact of morbid obesity and bariatric surgery on antioxidant/oxidant balance of the unstimulated and stimulated human saliva. J. Oral Pathol. Med. 2016, 45, 455–464. [Google Scholar] [CrossRef]
- WHO. Oral Health Surveys—Basic Methofd; World Health Organization: Geneva, Switzerland, 2013; p. 1.137. [Google Scholar]
- Lobene, R.R.; Mankodi, S.M.; Ciancio, S.G.; Lamm, R.A.; Charles, C.H.; Ross, N.M. Correlations among gingival indices: A methodology study. J Periodontol 1989, 60, 159–162. [Google Scholar] [CrossRef]
- Löe, H. The Gingival Index, the Plaque Index and the Retention Index Systems. J. Periodontol. 1967, 38, 610–616. [Google Scholar] [CrossRef]
- Walker, J.M. The Bicinchoninic Acid (BCA) Assay for Protein Quantitation. In The Protein Protocols Handbook; Humana Press: Totowa, NJ, USA, 1994; pp. 5–8. [Google Scholar]
- Maciejczyk, M.; Szulimowska, J.; Taranta-Janusz, K.; Werbel, K.; Wasilewska, A.; Zalewska, A. Salivary FRAP as A Marker of Chronic Kidney Disease Progression in Children. Antioxidants 2019, 8, 409. [Google Scholar] [CrossRef] [PubMed] [Green Version]
- Borys, J.; Maciejczyk, M.; Krȩtowski, A.J.; Antonowicz, B.; Ratajczak-Wrona, W.; Jablonska, E.; Zaleski, P.; Waszkiel, D.; Ladny, J.R.; Zukowski, P.; et al. The redox balance in erythrocytes, plasma, and periosteum of patients with titanium fixation of the jaw. Front. Physiol. 2017, 8, 386. [Google Scholar] [CrossRef] [PubMed] [Green Version]
- Misra, H.P.; Fridovich, I. The role of superoxide anion in the autoxidation of epinephrine and a simple assay for superoxide dismutase. J. Biol. Chem. 1972, 247, 3170–3175. [Google Scholar] [PubMed]
- Aebi, H. 13Catalase in Vitro. Methods Enzymol. 1984, 105, 121–126. [Google Scholar]
- Mansson-Rahemtulla, B.; Baldone, D.C.; Pruitt, K.M.; Rahemtulla, F. Specific assays for peroxidases in human saliva. Arch. Oral Biol. 1986, 31, 661–668. [Google Scholar] [CrossRef]
- Paglia, D.E.; Valentine, W.N. Studies on the quantitative and qualitative characterization of erythrocyte glutathione peroxidase. J. Lab. Clin. Med. 1967, 70, 158–169. [Google Scholar]
- Griffith, O.W. Determination of glutathione and glutathione disulfide using glutathione reductase and 2-vinylpyridine. Anal. Biochem. 1980, 106, 207–212. [Google Scholar] [CrossRef]
- Erel, O. A novel automated direct measurement method for total antioxidant capacity using a new generation, more stable ABTS radical cation. Clin. Biochem. 2004, 37, 277–285. [Google Scholar] [CrossRef]
- Erel, O. A new automated colorimetric method for measuring total oxidant status. Clin. Biochem. 2005, 38, 1103–1111. [Google Scholar] [CrossRef]
- Kobayashi, H.; Gil-Guzman, E.; Mahran, A.M.; Sharma, R.K.; Nelson, D.R.; Thomas, A.J.; Agarwal, A. Quality control of reactive oxygen species measurement by luminol-dependent chemiluminescence assay. J. Androl. 2001, 22, 568–574. [Google Scholar]
- Kalousová, M.; Skrha, J.; Zima, T. Advanced glycation end-products and advanced oxidation protein products in patients with diabetes mellitus. Physiol. Res. 2002, 51, 597–604. [Google Scholar] [PubMed]
- Buege, J.A.; Aust, S.D. Microsomal Lipid Peroxidation. Methods Enzymol. 1978, 52, 302–310. [Google Scholar] [PubMed]
- Tsiropoulou, S.; Dulak-Lis, M.; Montezano, A.C.; Touyz, R.M. Biomarkers of Oxidative Stress in Human Hypertension. In Hypertension and Cardiovascular Disease; Andreadis, E.A., Ed.; Springer International Publishing: Cham, UK, 2016; pp. 151–170. ISBN 978-3-319-39599-9. [Google Scholar]
- Mao, P. Oxidative Stress and Its Clinical Applications in Dementia. J. Neurodegener. Dis. 2013, 2013, 319898. [Google Scholar] [CrossRef] [PubMed]
- Peluso, I.; Raguzzini, A. Salivary and Urinary Total Antioxidant Capacity as Biomarkers of Oxidative Stress in Humans. Patholog. Res. Int. 2016, 2016, 5480267. [Google Scholar] [CrossRef] [PubMed] [Green Version]
- Maciejczyk, M.; Heropolitanska-Pliszka, E.; Pietrucha, B.; Sawicka-Powierza, J.; Bernatowska, E.; Wolska-Kusnierz, B.; Pac, M.; Car, H.; Zalewska, A.; Mikoluc, B. Antioxidant Defense, Redox Homeostasis, and Oxidative Damage in Children With Ataxia Telangiectasia and Nijmegen Breakage Syndrome. Front. Immunol. 2019, 10, 2322. [Google Scholar] [CrossRef]
- Morris, A.A.; Ko, Y.-A.; Udeshi, E.; Jones, D.P.; Butler, J.; Quyyumi, A. Novel Biomarkers of Oxidative Stress are Associated with Risk of Death and Hospitalization in Patients with Heart Failure. J. Card. Fail. 2018, 24, S21. [Google Scholar] [CrossRef] [Green Version]
- Lushchak, V.I. Free radicals, reactive oxygen species, oxidative stress and its classification. Chem Biol Interact 2014, 224c, 164–175. [Google Scholar] [CrossRef]
- Knaś, M.; Maciejczyk, M.; Waszkiel, D.; Zalewska, A. Oxidative stress and salivary antioxidants. Dent. Med. Probl. 2013, 50, 461–466. [Google Scholar]
- Higashi, Y.; Noma, K.; Yoshizumi, M.; Kihara, Y. Endothelial function and oxidative stress in cardiovascular diseases. Circ. J. 2009, 73, 411–418. [Google Scholar] [CrossRef] [Green Version]
- Żukowski, P.; Maciejczyk, M.; Waszkiel, D. Sources of free radicals and oxidative stress in the oral cavity. Arch. Oral Biol. 2018, 92, 8–17. [Google Scholar] [CrossRef]
- Day, B.J. Catalase and glutathione peroxidase mimics. Biochem. Pharmacol. 2009, 77, 285–296. [Google Scholar] [CrossRef] [PubMed] [Green Version]
- Battino, M.; Ferreiro, M.S.; Gallardo, I.; Newman, H.N.; Bullon, P. The antioxidant capacity of saliva. J. Clin. Periodontol. 2002, 29, 189–194. [Google Scholar] [CrossRef] [PubMed] [Green Version]
- Glantzounis, G.; Tsimoyiannis, E.; Kappas, A.; Galaris, D. Uric Acid and Oxidative Stress. Curr. Pharm. Des. 2005, 11, 4145–4151. [Google Scholar] [CrossRef] [PubMed]
- Sautin, Y.Y.; Johnson, R.J. Uric Acid: The Oxidant-Antioxidant Paradox. Nucleosides, Nucleotides and Nucleic Acids 2008, 27, 608–619. [Google Scholar] [CrossRef] [PubMed] [Green Version]
- Hare, J.M.; Johnson, R.J. Uric acid predicts clinical outcomes in heart failure: Insights regarding the role of xanthine oxidase and uric acid in disease pathophysiology. Circulation 2003, 2003, 1951–1953. [Google Scholar] [CrossRef] [Green Version]
- Cleutjens, J.P.M.; Creemers, E.E.J.M. Integration of concepts: Cardiac extracellular matrix remodeling after myocardial infarction. J. Cardiac Fail. 2002, 8, S344–S348. [Google Scholar] [CrossRef]
- Rajagopalan, S.; Meng, X.P.; Ramasamy, S.; Harrison, D.G.; Galis, Z.S. Reactive oxygen species produced by macrophage-derived foam cells regulate the activity of vascular matrix metalloproteinases in vitro: Implications for atherosclerotic plaque stability. J. Clin. Invest. 1996, 98, 2572–2579. [Google Scholar] [CrossRef] [Green Version]
- Maciejczyk, M.; Pietrzykowska, A.; Zalewska, A.; Knaś, M.; Daniszewska, I. The Significance of Matrix Metalloproteinases in Oral Diseases. Adv. Clin. Exp. Med. 2016, 25, 383–390. [Google Scholar] [CrossRef] [Green Version]
- Gersch, C.; Palii, S.P.; Imaram, W.; Kim, K.M.; Karumanchi, S.A.; Angerhofer, A.; Johnson, R.J.; Henderson, G.N. Reactions of peroxynitrite with uric acid: Formation of reactive intermediates, alkylated products and triuret, and in vivo production of triuret under conditions of oxidative stress. Nucleosides Nucleotides Nucleic Acids 2009, 28, 118–149. [Google Scholar] [CrossRef] [Green Version]
- Lytvyn, Y.; Perkins, B.A.; Cherney, D.Z.I. Uric Acid as a Biomarker and a Therapeutic Target in Diabetes. Can. J. Diabetes 2015, 39, 239–246. [Google Scholar] [CrossRef]
- Maciejczyk, M.; Skutnik-Radziszewska, A.; Zieniewska, I.; Matczuk, J.; Domel, E.; Waszkiel, D.; Żendzian-Piotrowska, M.; Szarmach, I.; Zalewska, A. Antioxidant Defense, Oxidative Modification, and Salivary Gland Function in an Early Phase of Cerulein Pancreatitis. Oxid. Med. Cell. Longev. 2019, 2019, 1–14. [Google Scholar] [CrossRef] [PubMed]
- Carpenter, G.H. The Secretion, Components, and Properties of Saliva. Annu. Rev. Food Sci. Technol. 2013, 4, 267–276. [Google Scholar] [CrossRef] [PubMed]
- Smith, J.G.; Newton-Cheh, C.; Almgren, P.; Struck, J.; Morgenthaler, N.G.; Bergmann, A.; Platonov, P.G.; Hedblad, B.; Engstrm, G.; Wang, T.J.; et al. Assessment of conventional cardiovascular risk factors and multiple biomarkers for the prediction of incident heart failure and atrial fibrillation. J. Am. Coll. Cardiol. 2010, 56, 1712–1719. [Google Scholar] [CrossRef] [PubMed] [Green Version]
- Devore, A.D.; Braunwald, E.; Morrow, D.A.; Duffy, C.I.; Ambrosy, A.P.; Chakraborty, H.; McCague, K.; Rocha, R.; Velazquez, E.J. Initiation of Angiotensin-Neprilysin Inhibition after Acute Decompensated Heart Failure: Secondary Analysis of the Open-label Extension of the PIONEER-HF Trial. JAMA Cardiol. 2019, 5, 202–207. [Google Scholar] [CrossRef]
- Wachter, R.; Senni, M.; Belohlavek, J.; Straburzynska-Migaj, E.; Witte, K.K.; Kobalava, Z.; Fonseca, C.; Goncalvesova, E.; Cavusoglu, Y.; Fernandez, A.; et al. Initiation of sacubitril/valsartan in haemodynamically stabilised heart failure patients in hospital or early after discharge: Primary results of the randomised TRANSITION study. Eur. J. Heart Fail. 2019, 21, 998–1007. [Google Scholar] [CrossRef] [Green Version]
- Greene, S.J.; Butler, J.; Albert, N.M.; DeVore, A.D.; Sharma, P.P.; Duffy, C.I.; Hill, C.L.; McCague, K.; Mi, X.; Patterson, J.H.; et al. Medical Therapy for Heart Failure With Reduced Ejection Fraction: The CHAMP-HF Registry. J. Am. Coll. Cardiol. 2018, 72, 351–366. [Google Scholar] [CrossRef]
Figure 1.
Enzymatic and non-enzymatic antioxidants in non-stimulated and stimulated of HF patients and the control group. Abbreviations: CAT—catalase; GPx—glutathione peroxidase; GSH—reduced glutathione; NWS—non-stimulated whole saliva; NYHA II—class II in the New York Heart Association (NYHA) classification of the heart failure; NYHA III—class III in the New York Heart Association (NYHA) classification of the heart failure; Px—salivary peroxidase; SOD—superoxide dismutase-1; SWS—stimulated whole saliva; UA—uric acid. Differences statistically important at: p *< 0.05, **< 0.01, ***< 0.001.

Figure 2.
Total antioxidant/oxidant status in non-stimulated and stimulated saliva of HF patients and the control group. Abbreviations: NWS—non-stimulated whole saliva; NYHA II—class II in the New York Heart Association (NYHA) classification of the heart failure; NYHA III—class III in the New York Heart Association (NYHA) classification of the heart failure; OSI—oxidative stress index; SWS—stimulated whole saliva; TAC—total antioxidant capacity; TOS—total oxidant status. Differences statistically important at: p **< 0.01, ***< 0.001.

Figure 3.
Oxidative damage to proteins and lipids in non-stimulated and stimulated saliva of HF patients and the control group. Abbreviations: AGE—advanced glycation end products; AOPP—advanced oxidation protein products; MDA—malondialdehyde; NWS—non-stimulated whole saliva; NYHA II—class II in the New York Heart Association (NYHA) classification of the heart failure; NYHA III—class III in the New York Heart Association (NYHA) classification of the heart failure; SWS—stimulated whole saliva. Differences statistically important at: p *< 0.05, ***< 0.001.

Figure 4.
Antioxidant barrier (A), redox status (B), and oxidative damage to proteins and lipids (C) in the erythrocytes/plasma of HF patients and the control group. Abbreviations: AGE—advanced glycation end products; AOPP—advanced oxidation protein products; CAT—catalase; GPx—glutathione peroxidase; GSH—reduced glutathione; MDA—malondialdehyde; NYHA II—class II in the New York Heart Association (NYHA) classification of the heart failure; NYHA III—class III in the New York Heart Association (NYHA) classification of the heart failure; OSI—oxidative stress index; Px—salivary peroxidase; SOD—superoxide dismutase-1; TAC—total antioxidant capacity; TOS—total oxidant status; UA—uric acid. Differences statistically important at: p *< 0.05, ***< 0.001.

Figure 5.
Correlations between salivary and plasma AGE, AOPP, and MDA in patients with heart failure. Abbreviations: AGE—advanced glycation end products; AOPP—advanced oxidation protein products; MDA—malondialdehyde; NWS—non-stimulated whole saliva.
Figure 5.
Correlations between salivary and plasma AGE, AOPP, and MDA in patients with heart failure. Abbreviations: AGE—advanced glycation end products; AOPP—advanced oxidation protein products; MDA—malondialdehyde; NWS—non-stimulated whole saliva.

Figure 6.
Correlations between salivary AGE content, serum NT-proBNP, and cardiac ejection fraction in patients with heart failure. Abbreviations: AGE—advanced glycation end products; EF—ejection fraction; NT-proBNP—N-terminal fragment of prohormone B-type natriuretic peptide; NWS—non-stimulated whole saliva.

Figure 7.
Receiver operating characteristic (ROC) analysis of AGE in non-stimulated and stimulated saliva as well as plasma of NYHA II and NYHA III patients. Abbreviations: AGE—advanced glycation end products; NWS—non-stimulated whole saliva; NYHA II—class II in the New York Heart Association (NYHA) classification of the heart failure; NYHA III—class III in the New York Heart Association (NYHA) classification of the heart failure; SWS—stimulated whole saliva.


Table 1.
Clinical characteristics of chronic heart failure (HF) patients and the control group.
| Patient Characteristics | Control n = 50 | NYHA II n = 33 | NYHA III n = 17 | ANOVA p | |
|---|---|---|---|---|---|
| Gender | Male n (%) | 43 (86) | 29 (87.88) | 14 (82.35) | NA |
| Female n (%) | 7 (14) | 4 (12.12) | 3 (17.65) | NA | |
| Age | 67.57 ± 1.11 | 64.2 ± 1.69 | 69.35 ± 2.57 | 0.069 | |
| WBC (x 103/µL) | 7.4 ± 0.16 | 7.25 ± 0.32 | 8.25 ± 0.46 | 0.068 | |
| RBC (x 106/µL) | 4.5 ± 0.06 | 4.72 ± 0.30 | 4.41 ± 0.13 | 0.573 | |
| HGB (g/dL) | 14.07 ± 0.36 | 13.41 ± 0.27 | 13.4 ± 0.34 | 0.494 | |
| HCT (%) | 39 ± 0.43 | 39.77± 0.78 | 39.04 ± 0.99 | 0.552 | |
| MCV (fL) | 91.2 ± 0.60 | 90.97 ± 1.15 | 88.86 ± 1.37 | 0.373 | |
| MCH (pg) | 33.62 ± 0.34 | 30.73 ± 0.50 | 29.69 ± 0.56 * | <0.001 | |
| MCHC (g/dL) | 34.5 ± 0.36 | 33.75 ± 0.96 | 33.39 ± 0.56 | 0.059 | |
| RDW-SD (fL) | 45.54 ± 0.16 | 46.56 ± 0.94 | 47.52 ± 0.95 | 0.091 | |
| RDV-CV (%) | 14.9 ± 0.19 | 13.99 ± 0.27 | 14.71 ± 0.44 | 0.066 | |
| PLT (x103/µL) | 249 ± 1.79 | 187.4 ± 7.84 * | 203.7 ± 15.44 | <0.001 | |
| CRP (mg/L) | 2.9 ± 0.2 | 3.2 ± 0.64 | 3.5 ± 0.85 | 0.308 | |
| Na+ (mmol/L) | 139.2 ± 0.62 | 138.5 ± 0.45 | 136.6 ± 0.85 | 0.229 | |
| K+ (mmol/L) | 4.2 ± 0.1 | 4.67 ± 0.10 | 4.74 ± 0.14 | 0.06 | |
| Creatinine (mg/dL) | 0.9 ± 0.02 | 1.07 ± 0.06 | 1.32 ± 0.06 | 0.051 | |
| GFR (ml/min) | 86. 03 ± 2.44 | 82.92 ± 0.59 | 72.33 ± 0.79 | 0.057 | |
| TSH (µIU/mL) | 1.08 ± 0.03 | 1.03 ± 0.13 | 1.38 ± 0.30 | 0.06 | |
| FT3 (pg/mL) | 2.31 ± 0.06 | 2.42 ± 0.11 | 2.29 ± 0.10 | 0.315 | |
| Vit. D3 (ng/mL) | 24.3 ± 0.69 | 18.16 ± 1.41 * | 15.07 ± 2.17 * | <0.001 | |
| AST (IU/L) | 20.04 ± 0.87 | 23.46 ± 1.36 | 23.8 ± 1.83 | 0.06 | |
| Glucose (mg/dL) | 91.5 ± 2.5 | 99.96 ± 3.83 | 99.8 ± 2.35 | 0.08 | |
| NT-proBNP (pg/mL) | ND | 1831 ± 173 | 4128 ± 382 | <0.001 # | |
| EF | ND | 25.9 ± 1.24 | 19.24 ± 1.31 | 0.001 # | |
| RR (mmHg) | SBP | 125.3 ± 0.33 | 130.6 ± 3.81 | 123.2 ± 3.67 | 0.112 |
| DBP | 71.3 ± 0.61 | 75.97 ± 2.16 | 74.94 ± 1.99 | 0.06 | |
| HR | ND | 70.97 ± 2.20 | 75.94 ± 2.59 | NA | |
| Type 2 diabetes n (%) | 6 (12) | 2 (11.76) | 4 (23.53) | NA | |
| Cardiac dysrhythmia (atrial flutter and fibrillation) n (%) | - | 10 (30.30) | 10 (58.82) | NA | |
| Coronary artery disease n (%) | - | 14 (42.42) | 6 (35.29) | NA | |
| Hypercholesterolemia n (%) | - | 22 (66.67) | 13 (76.47) | NA | |
| Myocardial infarction n (%) | - | 5 (15.15) | 1 (5.88) | NA | |
| Hypertension n (%) | 17 (34) | 26 (78.79) | 12 (70.59) | NA | |
| Medications | ASA n (%) | 4 (8) | 16 (48.48) | 6 (35.29) | NA |
| Alpha receptor blocker n (%) | - | 3 (9.09) | 2 (11.76) | NA | |
| Beta receptor blocker n (%) | 6 (12) | 26 (78.79) | 15 (88.24) | NA | |
| Ca2+ channel blocker n (%) | 4 (8) | 9 (27.27) | 6 (35.29) | NA | |
| AT1- receptor blocker n (%) | - | 7 (21.21) | 8 (47.1) | NA | |
| Diuretics n (%) | 10 (20) | 27 (81.82) | 17 (100) | NA | |
| ACE n (%) | 7 (14) | 19 (57.58) | 9 (52.94) | NA | |
| Cardiac glycosides n (%) | - | 4 (12.12) | 2 (11.76) | NA | |
| Organic nitrate n (%) | - | 1 (3.03) | 0 (0) | NA | |
| Statins n (%) | 8 (16) | 19 (57.58) | 9 (52.94) | NA | |
Abbreviations: ACE—angiotensyn converting enzyme; ALT—alanine transferase; ASA—acetylsalicylic acid; AST—aspartate aminotransferase; CRP—c-reactive protein; DBP—diastolic blood pressure; EF—ejection fraction; FT3—free fraction of triiodothyronine; FT4—free fraction of thyroxine; GFR—glomerular filtration rate; HCT—hematocrit; HGB—hemoglobin concentration; HR—heart rate; K—potassium; MCH—mean corpuscular hemoglobin; MCHC—mean corpuscular hemoglobin concentration MCV—mean corpuscular volume; MPV— mean platelet volume; Na—sodium; NT-proBNP—N-terminal fragment of prohormone B-type natriuretic peptide; NWS—non-stimulated whole saliva; NYHA II—class II in the New York Heart Association (NYHA) classification of the heart failure; NYHA III—class III in the New York Heart Association (NYHA) classification of the heart failure; PCT—procalcitonin; PDW—platelet distribution width; P-LCR—platelet large cell ratio; PLT – platelets; RBC – red blood cells; RDW-CV – red cell distribution width, coefficient of variation; RDW-SD—red cell distribution width, standard deviation; RR—blood pressure; SBP—systolic blood pressure; TSH—thyroid stimulating hormone; WBC—white blood cells. *p ˂ 0.05 vs. the control group (Tukey’s test); #p ˂ 0.05 vs. NYHA II (Student’s t-test).
Table 2.
Salivary gland function and stomatological characteristics of HF patients and control subjects.
Table 2.
Salivary gland function and stomatological characteristics of HF patients and control subjects.
| Patient Characteristics | Control n = 50 | NYHA II n = 33 | NYHA III n = 17 | ANOVA p |
|---|---|---|---|---|
| NWS flow rate (mL/min) | 0.38 ± 0.01 | 0.27 ± 0.02 * | 0.25 ± 0.02 * | <0.001 |
| SWS flow rate (mL/min) | 1.28 ± 0.02 | 0.79 ± 0.07 * | 0.76 ± 0.07 * | <0.001 |
| NWS total protein (μg/mL) | 1352 ± 62.73 | 1094 ± 63.84 * | 8865 ± 67.08 * | <0.001 |
| SWS total protein (μg/mL) | 1014 ± 57.36 | 1023 ± 56.12 | 1309 ± 142.8 | 0.09 |
| Salivary amylase NWS (µmol/mg protein) | 0.2 ± 0.01 | 0.08 ± 0.01 * | 0.13 ± 0.01 * | <0.001 |
| Salivary amylase SWS (µmol/mg protein) | 0.27 ± 0.02 | 0.17 ± 0.01 * | 0.18 ± 0.01 | 0.01 |
| DMFT | 29.32 ± 0.53 | 29.96 ± 0.89 | 30.09 ± 0.69 | NS |
| PBI | 2.09 ± 0.07 | 2.12 ± 0.27 | 2.07 ± 0.24 | 0.92 |
| GI | 2.05 ± 0.06 | 2.06 ± 0.15 | 2.18 ± 0.14 | 0.71 |
| CR | 0.78 ± 0.73 | 0.63 ± 0.1 | 0.7 ± 0.48 | 0.91 |
Abbreviations: CR—root caries; DMFT—decayed, missing, filled teeth index; GI—gingival index; n—number of patients; NWS—non-stimulated saliva; NYHA II—class II in the New York Heart Association (NYHA) classification of the heart failure; NYHA III—class III in the New York Heart Association (NYHA) classification of the heart failure; PBI—papilla bleeding index; SWS—stimulated saliva. * p ˂ 0.05 vs. the control group.
Table 3.
Receiver operating characteristic (ROC) analysis of oxidative stress biomarkers in non-stimulated and stimulated saliva as well as plasma/erythrocytes of NYHA II and NYHA III patients.
Table 3.
Receiver operating characteristic (ROC) analysis of oxidative stress biomarkers in non-stimulated and stimulated saliva as well as plasma/erythrocytes of NYHA II and NYHA III patients.
| NWS | SWS | Plasma/Erythrocytes | ||||||||||||||||
|---|---|---|---|---|---|---|---|---|---|---|---|---|---|---|---|---|---|---|
| Parameter | AUC | 95% Confidence Interval | p Value | Cutt-off | Sensitivity (%) | Specificity (%) | AUC | 95% Confidence Interval | p Value | Cut-off | Sensitivity (%) | Specificity (%) | AUC | 95% Confidence Interval | p Value | Cut-off | Sensitivity (%) | Specificity (%) |
| Antioxidants | ||||||||||||||||||
| SOD (mU/mg protein) | 0.5526 | 0.3788 to 0.7263 | 0.5457 | > 5.616 | 57.58 | 58.82 | 0.6952 | 0.5457 to 0.8446 | 0.0249 | > 7.742 | 57.58 | 58.82 | 0.5544 | 0.3678 to 0.7409 | 0.5322 | > 0.6417 | 57.58 | 58.82 |
| CAT (nmol H2O2/min/mg protein) | 0.6061 | 0.4246 to 0.7875 | 0.223 | < 0.72 | 57.58 | 58.82 | 0.6894 | 0.5316 to 0.8472 | 0.033 | > 0.4727 | 63.64 | 62.5 | 0.6176 | 0.4517 to 0.7836 | 0.1765 | > 0.3321 | 57.58 | 58.82 |
| Px/GPx (mU/mg protein) | 0.5686 | 0.4024 to 0.7349 | 0.4304 | < 0.2229 | 57.58 | 58.82 | 0.5561 | 0.3737 to 0.7386 | 0.5189 | > 0.4433 | 57.58 | 58.82 | 0.6791 | 0.5257 to 0.8325 | 0.0396 | < 0.1417 | 63.64 | 64.71 |
| GSH (ug/mg protein) | 0.5918 | 0.4334 to 0.7502 | 0.2916 | < 0.8745 | 57.58 | 58.82 | 0.574 | 0.4062 to 0.7417 | 0.3954 | > 0.8199 | 57.58 | 58.82 | 0.6239 | 0.4368 to 0.8109 | 0.1546 | < 3.37 | 57.58 | 58.82 |
| UA (ng/mg protein) | 0.7219 | 0.5818 to 0.862 | 0.0108 | < 88.53 | 69.7 | 70.59 | 0.5152 | 0.34 to 0.6903 | 0.8618 | > 104.2 | 42.42 | 41.18 | 0.852 | 0.748 to 0.9561 | <0.0001 | < 0.7263 | 75.76 | 76.47 |
| Total antioxidant/oxidant status | ||||||||||||||||||
| TAC (Trolox umol/mg protein) | 0.6667 | 0.4881 to 0.8453 | 0.0555 | < 0.5182 | 57.58 | 58.82 | 0.6275 | 0.4644 to 0.7905 | 0.1431 | > 0.3163 | 63.64 | 64.71 | 0.5686 | 0.3907 to 0.7465 | 0.4304 | > 1.475 | 51.52 | 58.82 |
| TOS (nmol H2O2/min/mg protein) | 0.6916 | 0.5459 to 0.8373 | 0.0277 | < 58.8 | 57.58 | 58.82 | 0.5152 | 0.3393 to 0.691 | 0.8618 | < 61.38 | 48.48 | 47.06 | 0.5205 | 0.354 to 0.687 | 0.8138 | > 15.14 | 57.58 | 58.82 |
| OSI (TOS/TAC ratio) | 0.5312 | 0.358 to 0.7044 | 0.72 | > 132.6 | 51.52 | 52.94 | 0.6078 | 0.435 to 0.7807 | 0.2153 | < 195.3 | 57.58 | 58.82 | 0.5116 | 0.3448 to 0.6784 | 0.8941 | > 10.03 | 51.52 | 52.94 |
| ROS production (nmol O2-/min/mg protein | 0.877 | 0.7811 to 0.9729 | <0.0001 | < 14.49 | 81.82 | 82.35 | 0.5526 | 0.3832 to 0.7219 | 0.5457 | > 15.96 | 54.55 | 52.94 | ND | ND | ND | ND | ND | ND |
| Oxidative damage products | ||||||||||||||||||
| AGE (AFU/mg protein) | 0.9251 | 0.8565 to 0.9937 | <0.0001 | < 9.3 | 81.82 | 82.35 | 0.5936 | 0.4192 to 0.7679 | 0.2823 | > 8.173 | 54.55 | 52.94 | 0.9287 | 0.8582 to 0.9992 | ˂0.0001 | < 7.028 | 81.82 | 82.35 |
| AOPP (nmol/mg protein) | 0.7879 | 0.653 to 0.9228 | 0.0009 | < 52.89 | 69.7 | 70.59 | 0.8948 | 0.8039 to 0.9858 | <0.0001 | < 38.69 | 81.82 | 82.35 | 0.5294 | 0.3548 to 0.704 | 0.7354 | > 7.937 | 57.58 | 58.82 |
| MDA (umol/mg protein) | 0.8699 | 0.7727 to 0.9671 | <0.0001 | < 349.1 | 78.79 | 76.47 | 0.5722 | 0.4005 to 0.7439 | 0.4069 | > 651.3 | 54.55 | 52.94 | 0.9804 | 0.9491 to 1.012 | ˂0.0001 | < 498.8 | 93.94 | 94.12 |
Abbreviations: AGE—advanced glycation end products; AOPP—advanced oxidation protein products; CAT—catalase; GPx—glutathione peroxidase; GSH—reduced glutathione; MDA—malondialdehyde; NWS—non-stimulated whole saliva; NYHA II—class II in the New York Heart Association (NYHA) classification of the heart failure; NYHA III—class III in the New York Heart Association (NYHA) classification of the heart failure; OSI—oxidative stress index; Px—salivary peroxidase; ROS—reactive oxygen species; SOD—superoxide dismutase; SWS—stimulated whole saliva; TAC—total antioxidant capacity; TOS—total oxidant status; UA—uric acid. Differences statistically important at: p < 0.05.
© 2020 by the authors. Licensee MDPI, Basel, Switzerland. This article is an open access article distributed under the terms and conditions of the Creative Commons Attribution (CC BY) license (http://creativecommons.org/licenses/by/4.0/).
Share and Cite
MDPI and ACS Style
Klimiuk, A.; Zalewska, A.; Sawicki, R.; Knapp, M.; Maciejczyk, M. Salivary Oxidative Stress Increases with the Progression of Chronic Heart Failure. J. Clin. Med. 2020, 9, 769. https://0-doi-org.brum.beds.ac.uk/10.3390/jcm9030769
AMA Style
Klimiuk A, Zalewska A, Sawicki R, Knapp M, Maciejczyk M. Salivary Oxidative Stress Increases with the Progression of Chronic Heart Failure. Journal of Clinical Medicine. 2020; 9(3):769. https://0-doi-org.brum.beds.ac.uk/10.3390/jcm9030769
Chicago/Turabian StyleKlimiuk, Anna, Anna Zalewska, Robert Sawicki, Małgorzata Knapp, and Mateusz Maciejczyk. 2020. "Salivary Oxidative Stress Increases with the Progression of Chronic Heart Failure" Journal of Clinical Medicine 9, no. 3: 769. https://0-doi-org.brum.beds.ac.uk/10.3390/jcm9030769
Note that from the first issue of 2016, this journal uses article numbers instead of page numbers. See further details here.