Characterization of Enhanced ITZ in Engineered Polypropylene Fibers for Bond Improvement


1
Department of Civil Engineering, National Institute of Technology Rourkela, Odisha 769008, India
2
Department of Civil Engineering, University of Victoria, 3800 Finnerty Road, Victoria, BC V8W 2Y2, Canada
*
Author to whom correspondence should be addressed.
J. Compos. Sci. 2020, 4(2), 53; https://0-doi-org.brum.beds.ac.uk/10.3390/jcs4020053
Submission received: 15 April 2020
/
Revised: 3 May 2020
/
Accepted: 8 May 2020
/
Published: 11 May 2020
(This article belongs to the Special Issue Polymer Composites and Fibers)
Abstract
:The interfacial transition zone (ITZ) is well known to be a zone of high porosity and lesser strength and is the weak zone in the fiber-reinforced matrix. This study aims to evaluate the improvement in the bonding between engineered polypropylene fibers and the surrounding mortar matrix. The improvement was implemented by modifying the ITZ, which develops between the fibers and the cementitious matrix. Two commercially available repair materials have been used in this study, Mix M and Mix P. Mix M served as the base material for the prepared fibers, whereas Mix P is a fiber-reinforced repair mortar and provides a comparison. A total of six types of mixes have been investigated. The improved bonding is tested by coating the polypropylene fibers with supplementary cementitious materials (SCM) using an innovative patented concept. In this study, silica fume and metakaolin are used as the SCM because of their fine size and pozzolanic capacity. The study involves multiple items of investigation, including mechanical tests such as compressive strength, direct tensile strength, and three-point bending tests. Energy-dispersive X-ray spectroscopy (EDS) of the different mixes helped in evaluating and analyzing the ITZ between the fiber and matrix.
1. Introduction
Fiber-reinforced concrete (FRC) is increasingly being used in the field due to its high toughness and energy absorption capacity. Early application of FRC can be traced back to the 1960s when randomly dispersing steel fiber was employed in analogy with traditional steel reinforcing bars [1]. Cement composites exhibited the general brittle characteristics under failure loads allowing the steel fibers to bridge the propagating cracks. Steel FRC possesses a long history of successful application [2], whereas recent research shows a growing interest in synthetic fibers. Synthetic fibers, such as polypropylene (PP), polyethylene, polyvinyl chloride, and many others [3], have some substantial advantages over metallic ones. The typical characteristics of synthetic fibers include chemical stability in aggressive environments, exemption from oxidation, lightness, easy stocking and handling, and electromagnetic transparency. As a result, they have been used in a variety of places including road pavements [4], storm sewers, water drains [5], etc.
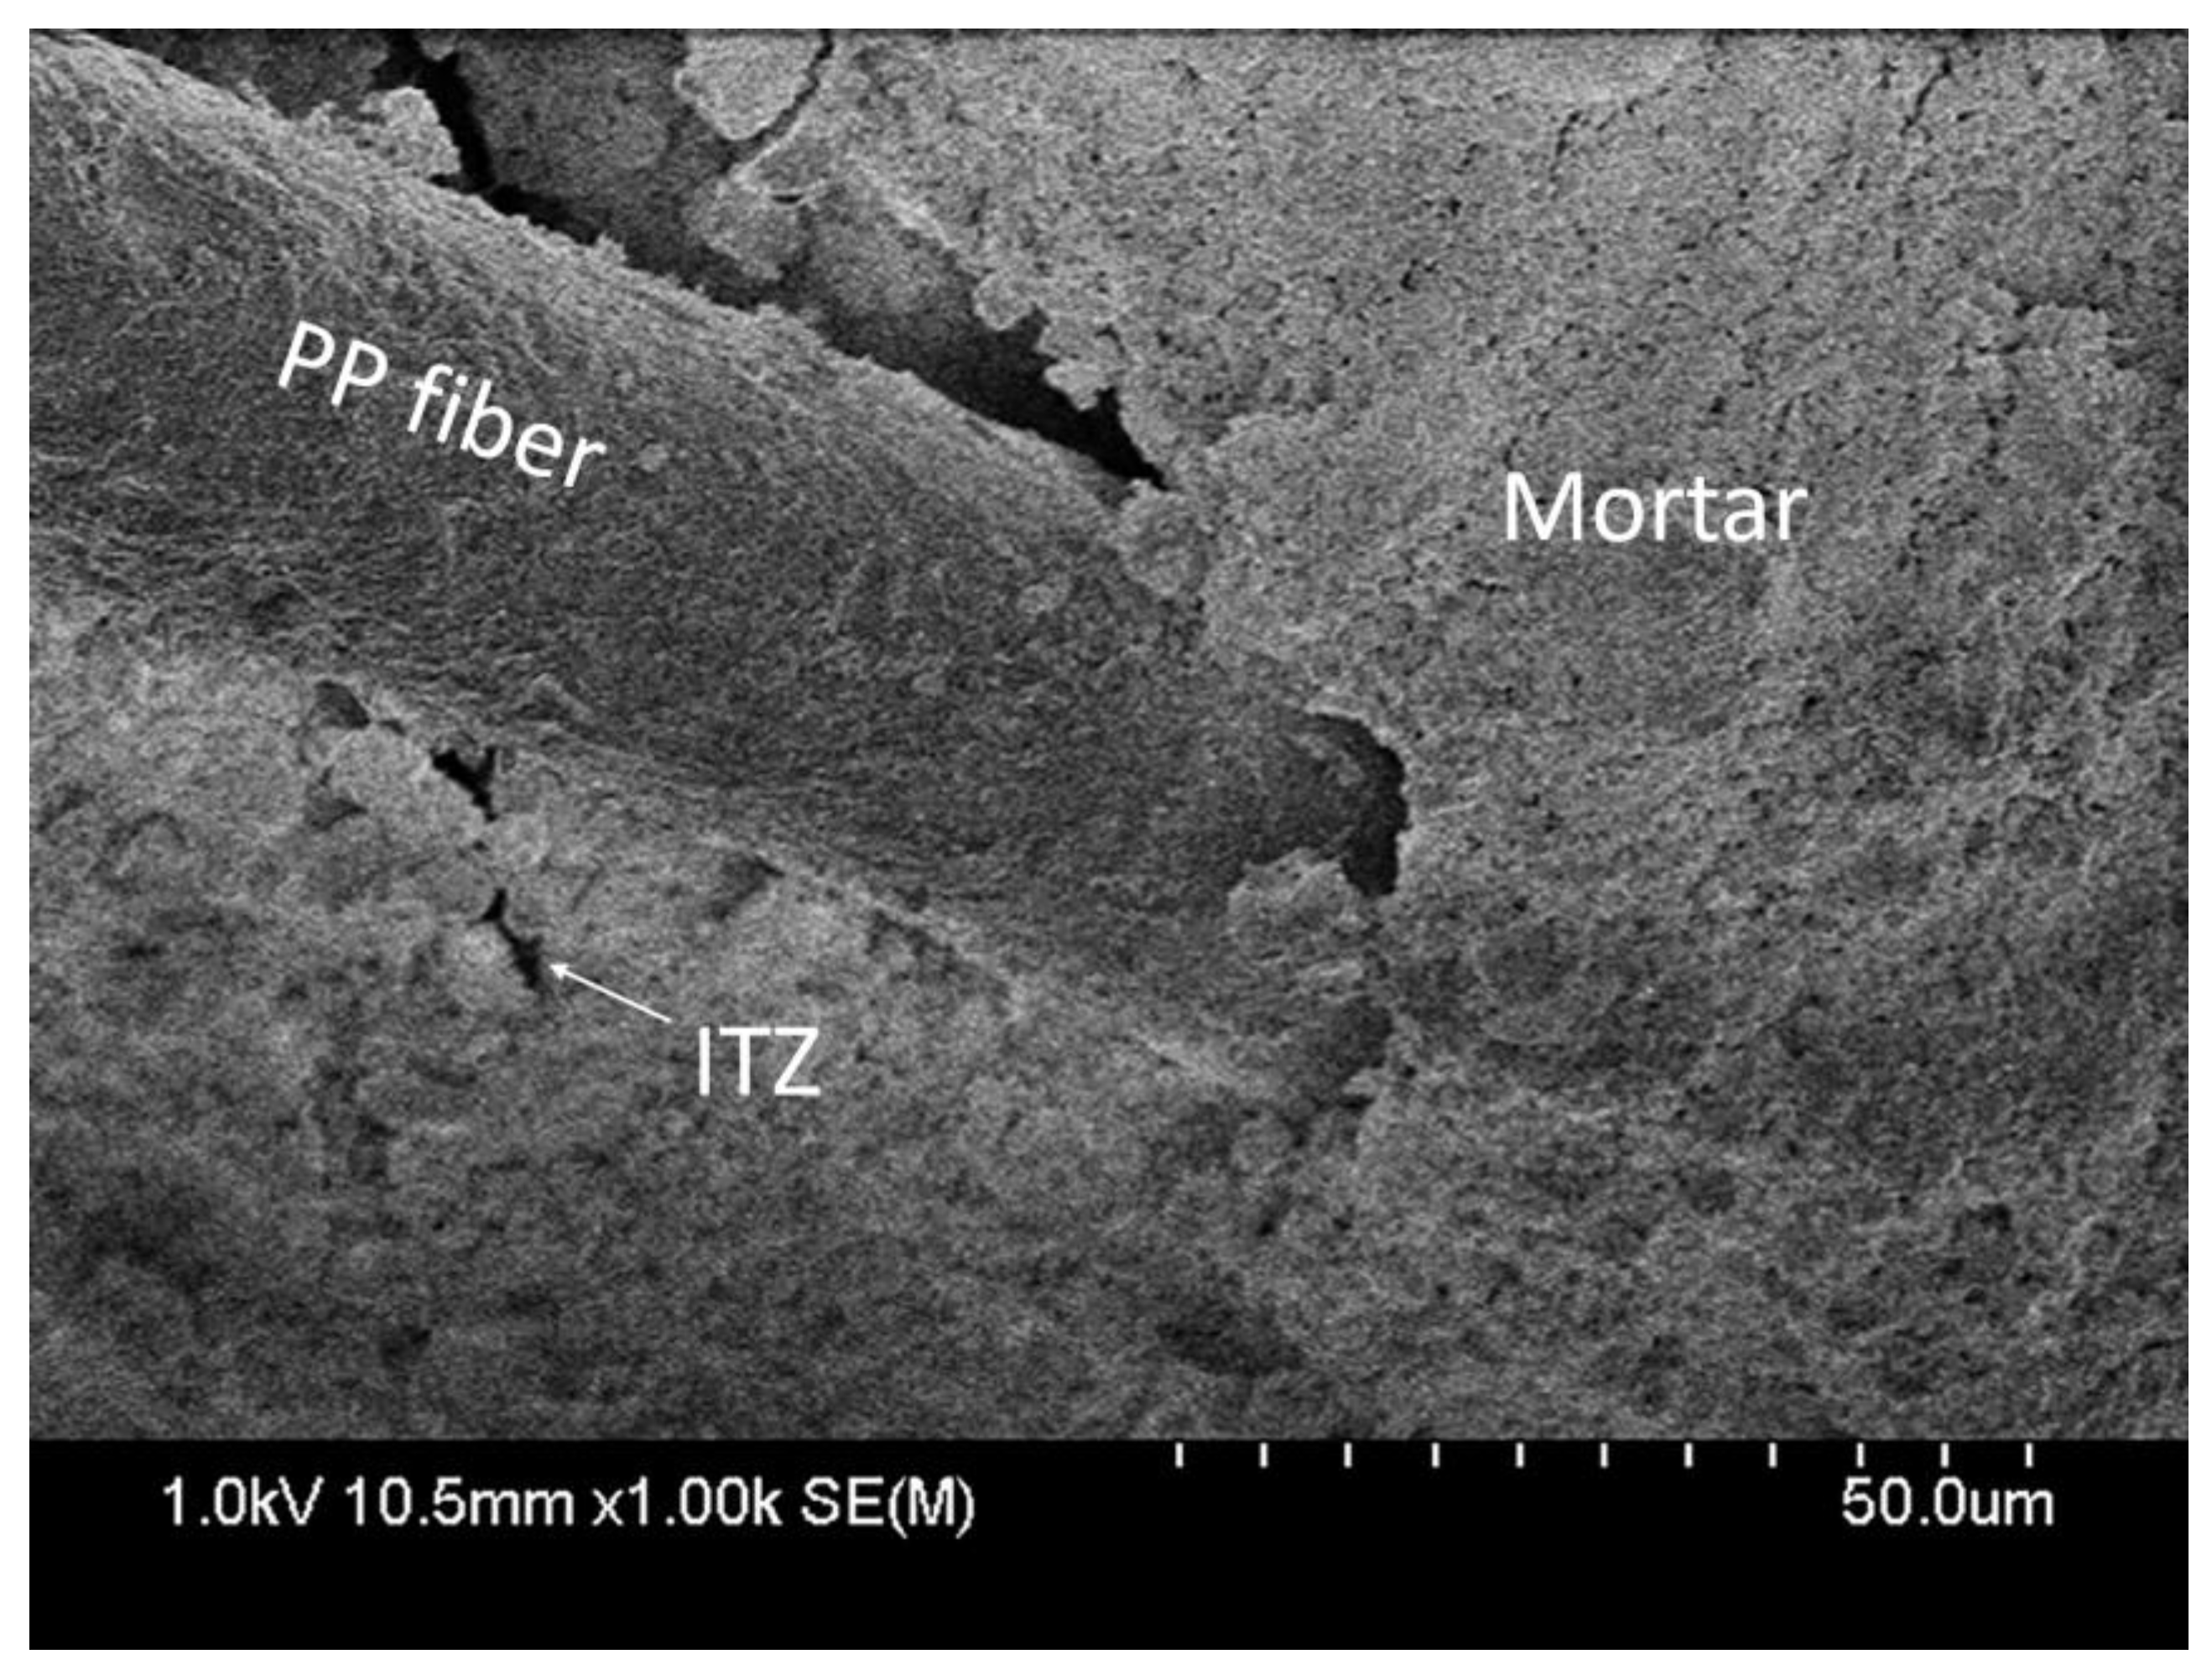
A major issue associated with using synthetic fibers is caused by their lack of hydrophilicity. They react very little with the concrete matrix and consequently, loading is hardly transferred from the matrix to the fibers [1]. Another major challenge is the interfacial transition zone (ITZ). Figure 1 shows that owing to the “wall effect”, the matrix around macroscopic particles such as aggregates and fibers does not pack as efficiently as in the rest of the matrix [6,7]. Poor bonding between the aggregates/fibers and the cement matrix generates a weak ITZ [8] that hinders full exploitation of the fiber strength [6]. To address these shortcomings, many approaches have been investigated. These are described below.
Surface treatment has been considered one of the viable techniques to improve ITZ. Some treatment methods previously reported in the literature include cold plasma treatment [9], mechanical micropitting treatment [10], flame treatment [11], wet chemical treatment [12], and nanosilica treatment [1]. Mechanical micropitting treatment involves creating indentations on the fiber surface by pressing the fibers between two hardened steel surfaces. This method may cause cross-section loss and is hard to be applied on short fibers with small diameters. Wet chemical treatment method requires the use of the acid or any other solution etching the fiber surface such that the frictional properties of fibers are improved. This method can result in degradation of the mechanical performance of the fiber if excessive etching takes place. In addition, disposal of etching chemicals causes environmental issues. The problem with flame or heat treatment is the increase in brittleness of the fiber materials after the treatment. Compared to these methods, cold plasma treatment is relatively eco-friendly, fast, and does not exhibit excessive brittleness. Cold plasma treatment can reduce the surface energy of the polymer surface and thus convert the hydrophobic structure of PP surfaces to hydrophilic, which increases chemical bonding with the cementitious matrix [13]. However, the cold plasma method can still produce detrimental waste unless some specific gas composition is selected [9]. Some researchers [14] have previously used nanosilica as the coating to improve the bonding between the matrix and the PP fibers. The silica nanoparticles are deposited on PP fibers via the rapid acid-catalyzed sol–gel technique [15]. The use of nanoparticles is associated with an increase in the cost which could potentially limit the application of this technique.
Based on the literature review, there exists a need to surface treat the fibers with a material that is relatively eco-friendly and low cost. SCMs such as metakaolin and silica fume are considered to be sustainable and environmental-friendly materials. There are limited CO2 emissions during metakaolin production [16,17] and silica fume is a waste material from the industrial process [18]. Over the years, SCMs have been used to deal with the porous ITZ [19,20]. Pozzolans, including metakaolin, silica fume, and fly ash are chemically reactive with calcium hydroxide in the concrete to form cementitious materials, which results in a denser ITZ. Physically, using microfillers such as metakaolin and silica fume can also fill up the voids between the reinforcement and matrix. As an example, most researchers have concluded that silica fume is indeed instrumental in enhancing concrete properties by improving the ITZ [21,22,23]. However, SCM, which is normally used to replace cement content by up to 20% volume [24,25,26], does not clearly target the ITZ. Previous studies have proved that the densification of ITZ is possible by coating coarse aggregates with silica fume [21]. Other researchers [27] have shown that the addition of pozzolans such as silica fume and fly ash does help in the densification of the ITZ which, in turn, improves the mechanical strength and durability [27,28].
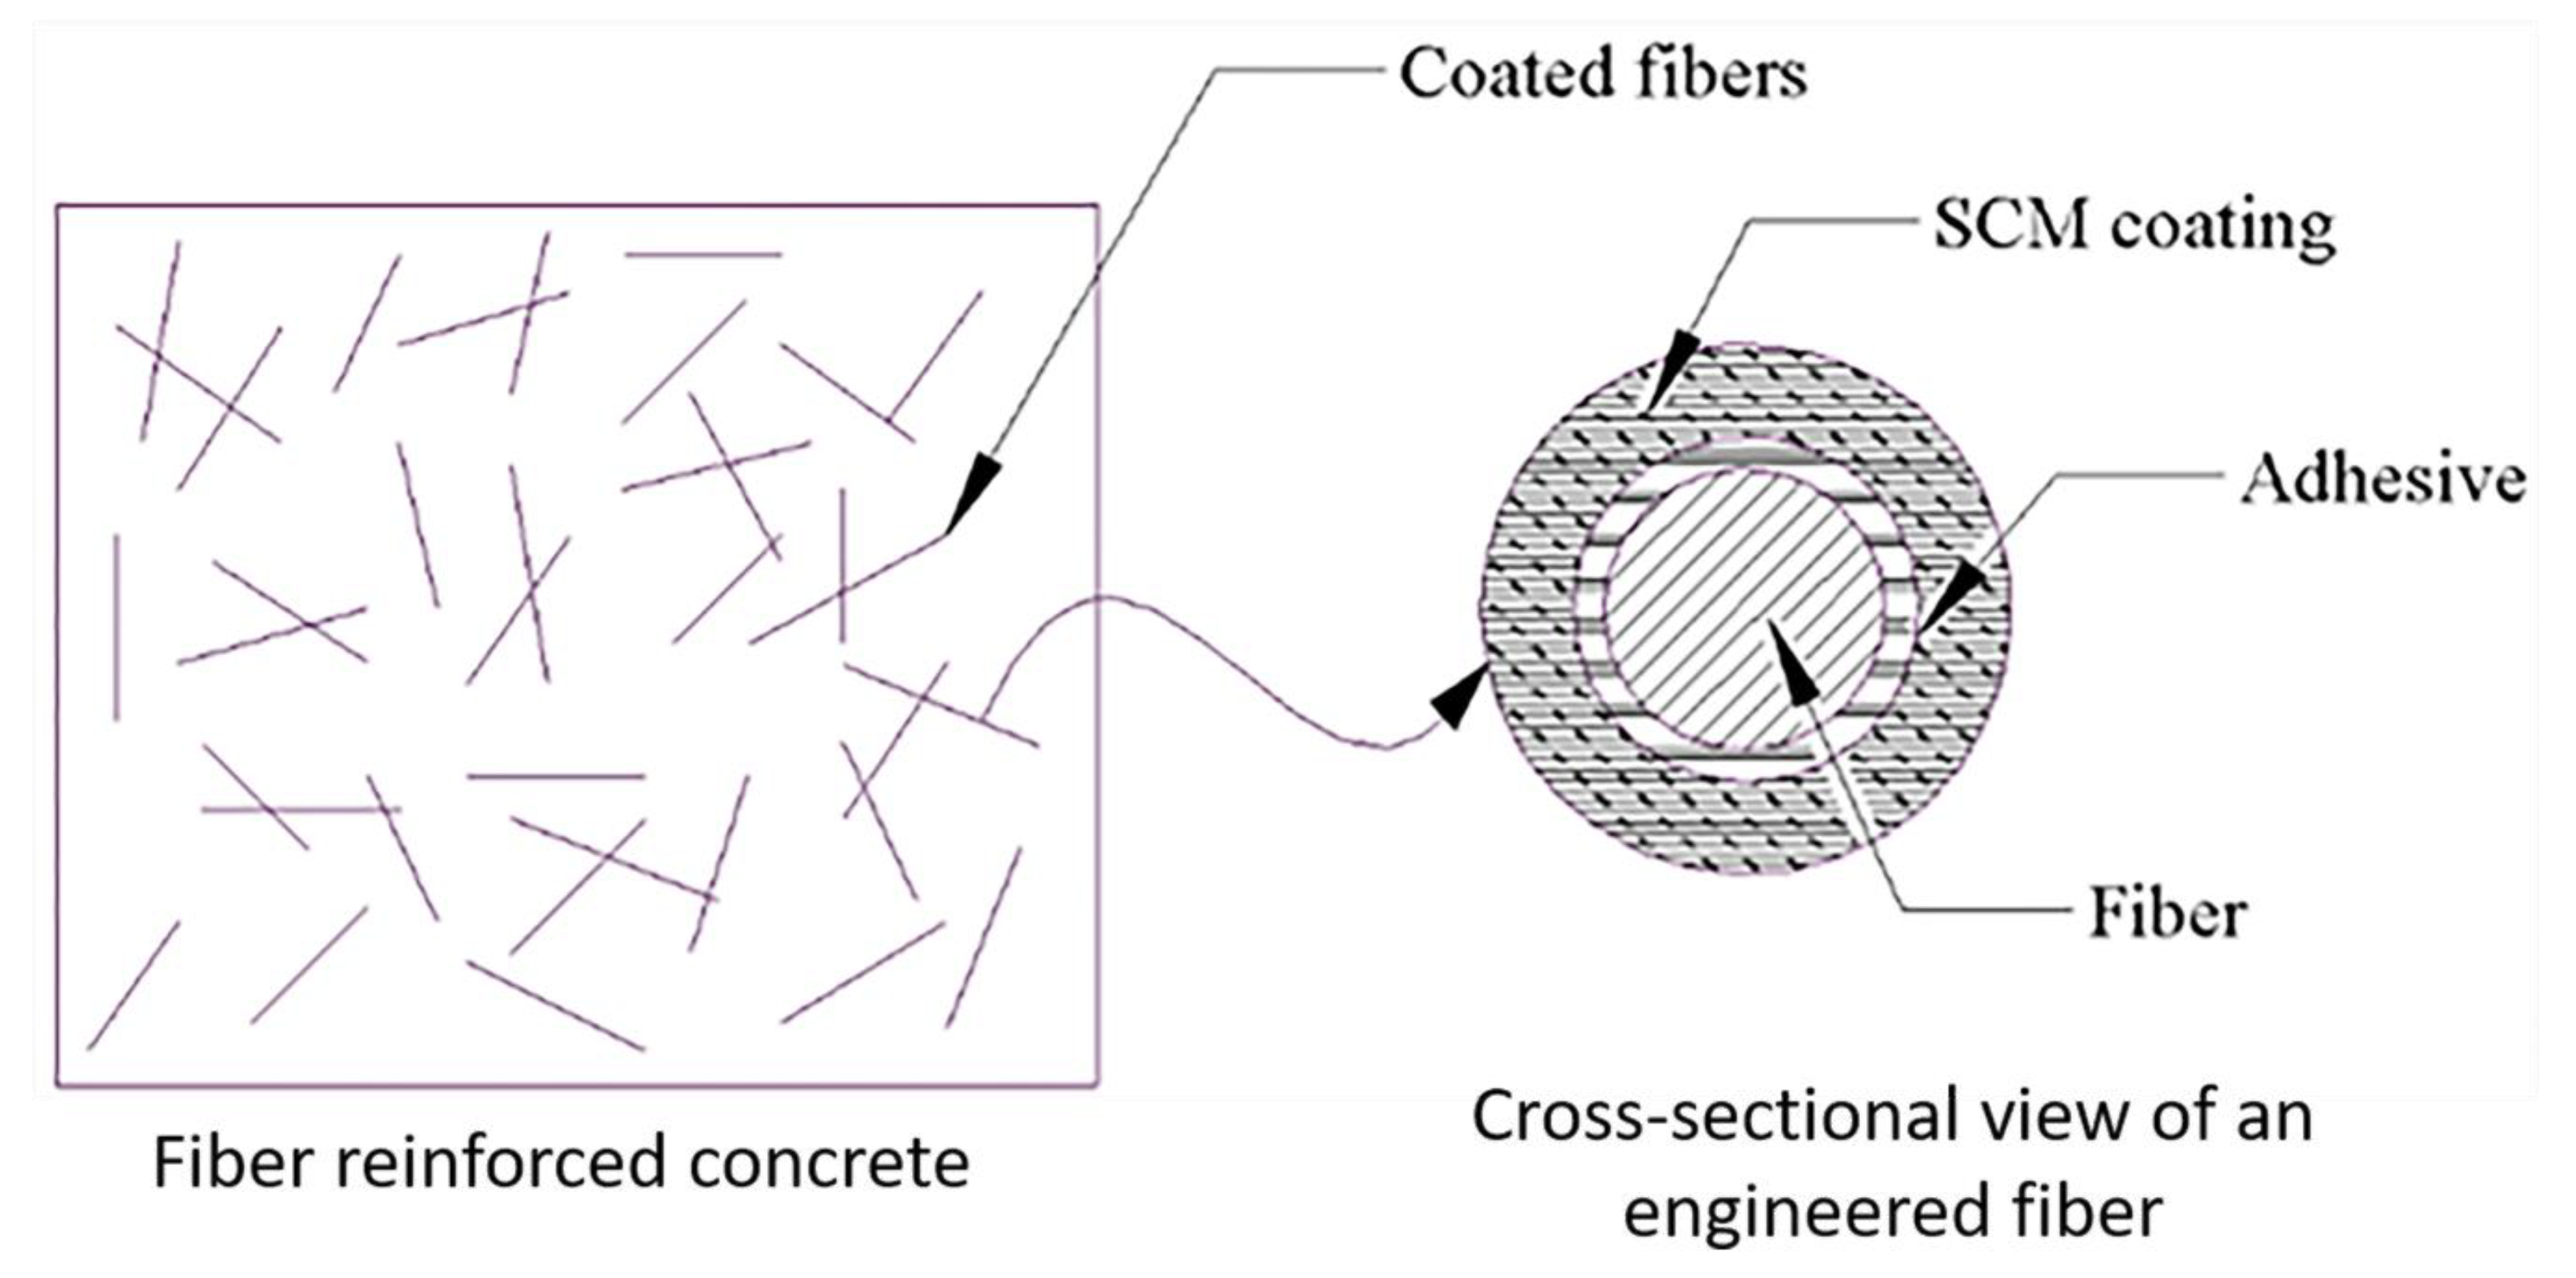
In this study, a novel method to surface treat the PP fibers with SCMs is proposed. The core of this method is based on an invention by Gupta titled “Surface Treatment for Concrete Reinforcement” [29]. The focus of this research was to investigate the effectiveness of surface-treating fibers for improved bond strength. The proposed method utilizes pozzolans including silica fume and metakaolin. The presence of such pozzolans is usually expected to improve the strength of the matrix. Instead of adding to the entire mix, these pozzolans targeted only in the regions requiring their use in ITZs surrounding the fibers [29]. To achieve this, a new method is developed which disperses the PP fibers, applies adhesive to every fiber, and adheres pozzolans to the fibers (Figure 2). In addition, one commercially available repair material is used as the base material where the surface-treated fibers are added. Repair materials are now widely used to extend the lifetime of structures and thus have a greater need for maintaining the safety and serviceability [30]. Most of these repair materials comprise a component of cement, polymer, and at times, both [30,31,32]. The base material in this study is classified as a cementitious repair mortar.
2. Materials and Methods
2.1. Materials
In this study, polypropylene fibers are treated with two SCMs to produce engineered surface-treated fibers (ESTF) of two kinds: silica fume-coated and metakaolin-coated fibers. Since silica fume has a finer grain size and greater surface area to volume ratio, it is expected to improve the ITZ more than metakaolin, however, in this study both the materials are used to provide an insight into their relative performance. The cementitious mortars used are repair mortars, namely, Mix M and Mix P, as described later in this section. Fibers are added to Mix M and a comparison is made to unmodified Mix M and Mix P.
2.1.1. Polypropylene Fibers
In this study, a 100% virgin polypropylene microfiber was used. The mechanical properties of the fiber as stated in the material safety data sheet [33] are listed in Table S1 available in the Supplementary Materials section.
2.1.2. Repair Mortars
In this study, commercially available Mix M and Mix P were used which can be described as cementitious mortar and polymer-modified cementitious mortar, respectively. For the preparation of samples, only potable water was added to make the mix workable. As per the data sheets, Mix M is especially suited for cold weather installations and the repair of freezer floors. It is available in 25 kg polyethylene-lined bags. Mix P is suited for vertical and overhead concrete repairs, including precast/prestressed, tilt-up, post-tensioned, and cast-in-place concrete. It is available in bags of 22.7 kg. The chemical composition of Mix M and Mix P are listed in Tables S2 and S3, respectively, available in the Supplementary Materials section. The information was provided by the supplier.
2.1.3. Fiber Coating Materials
(a) Metakaolin: highly reactive class N pozzolan metakaolin was used in this study. Chemically, it contained 100% calcined kaolin. The properties of the metakaolin used, as extracted from the safety data sheet [34], are listed in Table S4 available in the Supplementary Materials section. (b) Silica fume: properties of the silica fume used in this study are listed in Table S5 available in the Supplementary Materials section as per the information from the material safety data sheet [35].
2.1.4. Adhesive
A multi-purpose adhesive with a compatible spray applicator is used. The adhesive is used to assist the coating of fibers with metakaolin and silica fume. A spray adhesive ensures even distribution and minimizes irregularities. Chemical composition extracted from the material safety data sheet [36] are listed in Table S6 available in the Supplementary Materials section.
2.2. Mixture Proportioning
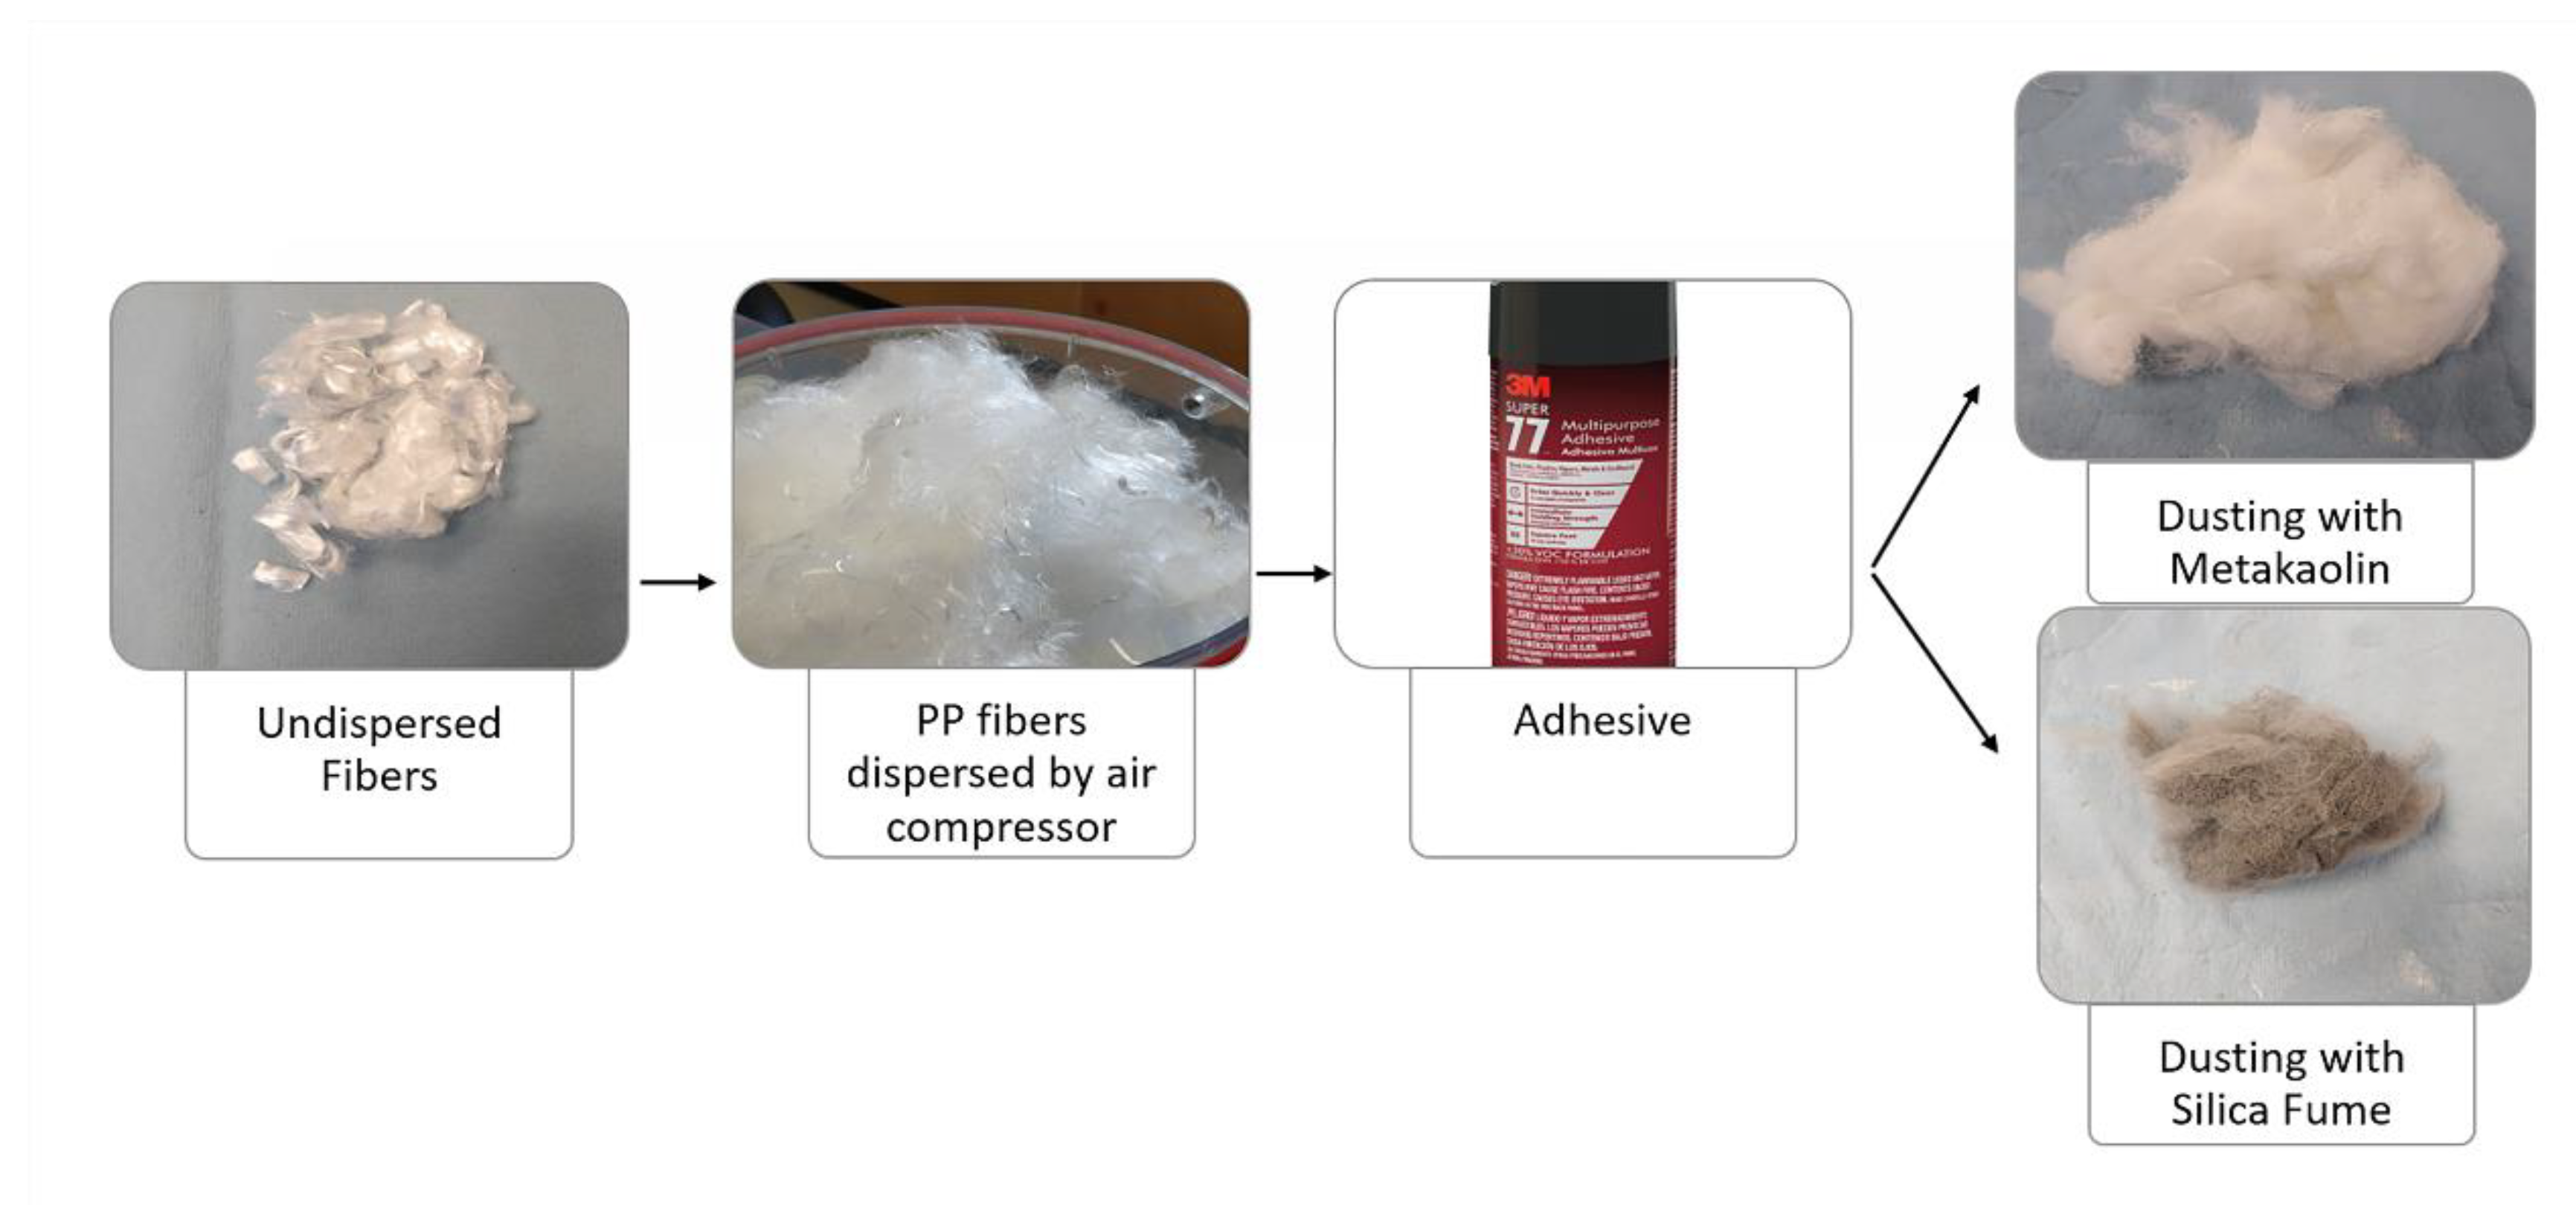
A total of six mixes were prepared including control samples, with and without fibers. The fibers were coated with the help of an enclosed chamber. The chamber had a small opening fitted with a nozzle. Through the opening, air was blown using an air compressor to keep fibers agitated. Using the air compressor, the fibers were first dispersed inside the chamber, next the multi-purpose adhesive was sprayed and the air compressor was used to coat the fibers as evenly as possible. Coated fibers were obtained by dusting the SCM over the fibers coated with adhesive. The air compressor was used again to distribute the SCM throughout the fibers inside the chamber. Figure 3 illustrates the basic procedure. To separate the fibers from the adhered mesh-like formations, the fibers were chopped to obtain filaments in the range of 3–6 mm length, thus maintaining an aspect ratio between 100 and 200. It should be noted that this lab-based procedure does not guarantee complete coating of all fibers. The unevenness of the coating might prove to be better in terms of binding with the mortar, however, this aspect requires further detailed investigation. The SCM content was estimated to be about 19.96% by weight as the percentage of the original untreated fibers taken for the coating procedure.
The water content was used as prescribed in the technical sheet of the repair mixes used. In the case where Mix M was used as the base material, the water content was slightly increased from the prescribed to take into account the water adsorption and the expected reduction in workability due to the PP fibers and was kept consistent throughout the mixes, including control mixes without fibers. On analysis of Mix P, the amount of fiber was found to be about 0.2% by weight. To simulate the same reinforcement in mix M, the total amount of the treated fiber was also kept at 0.2% for all specimens.
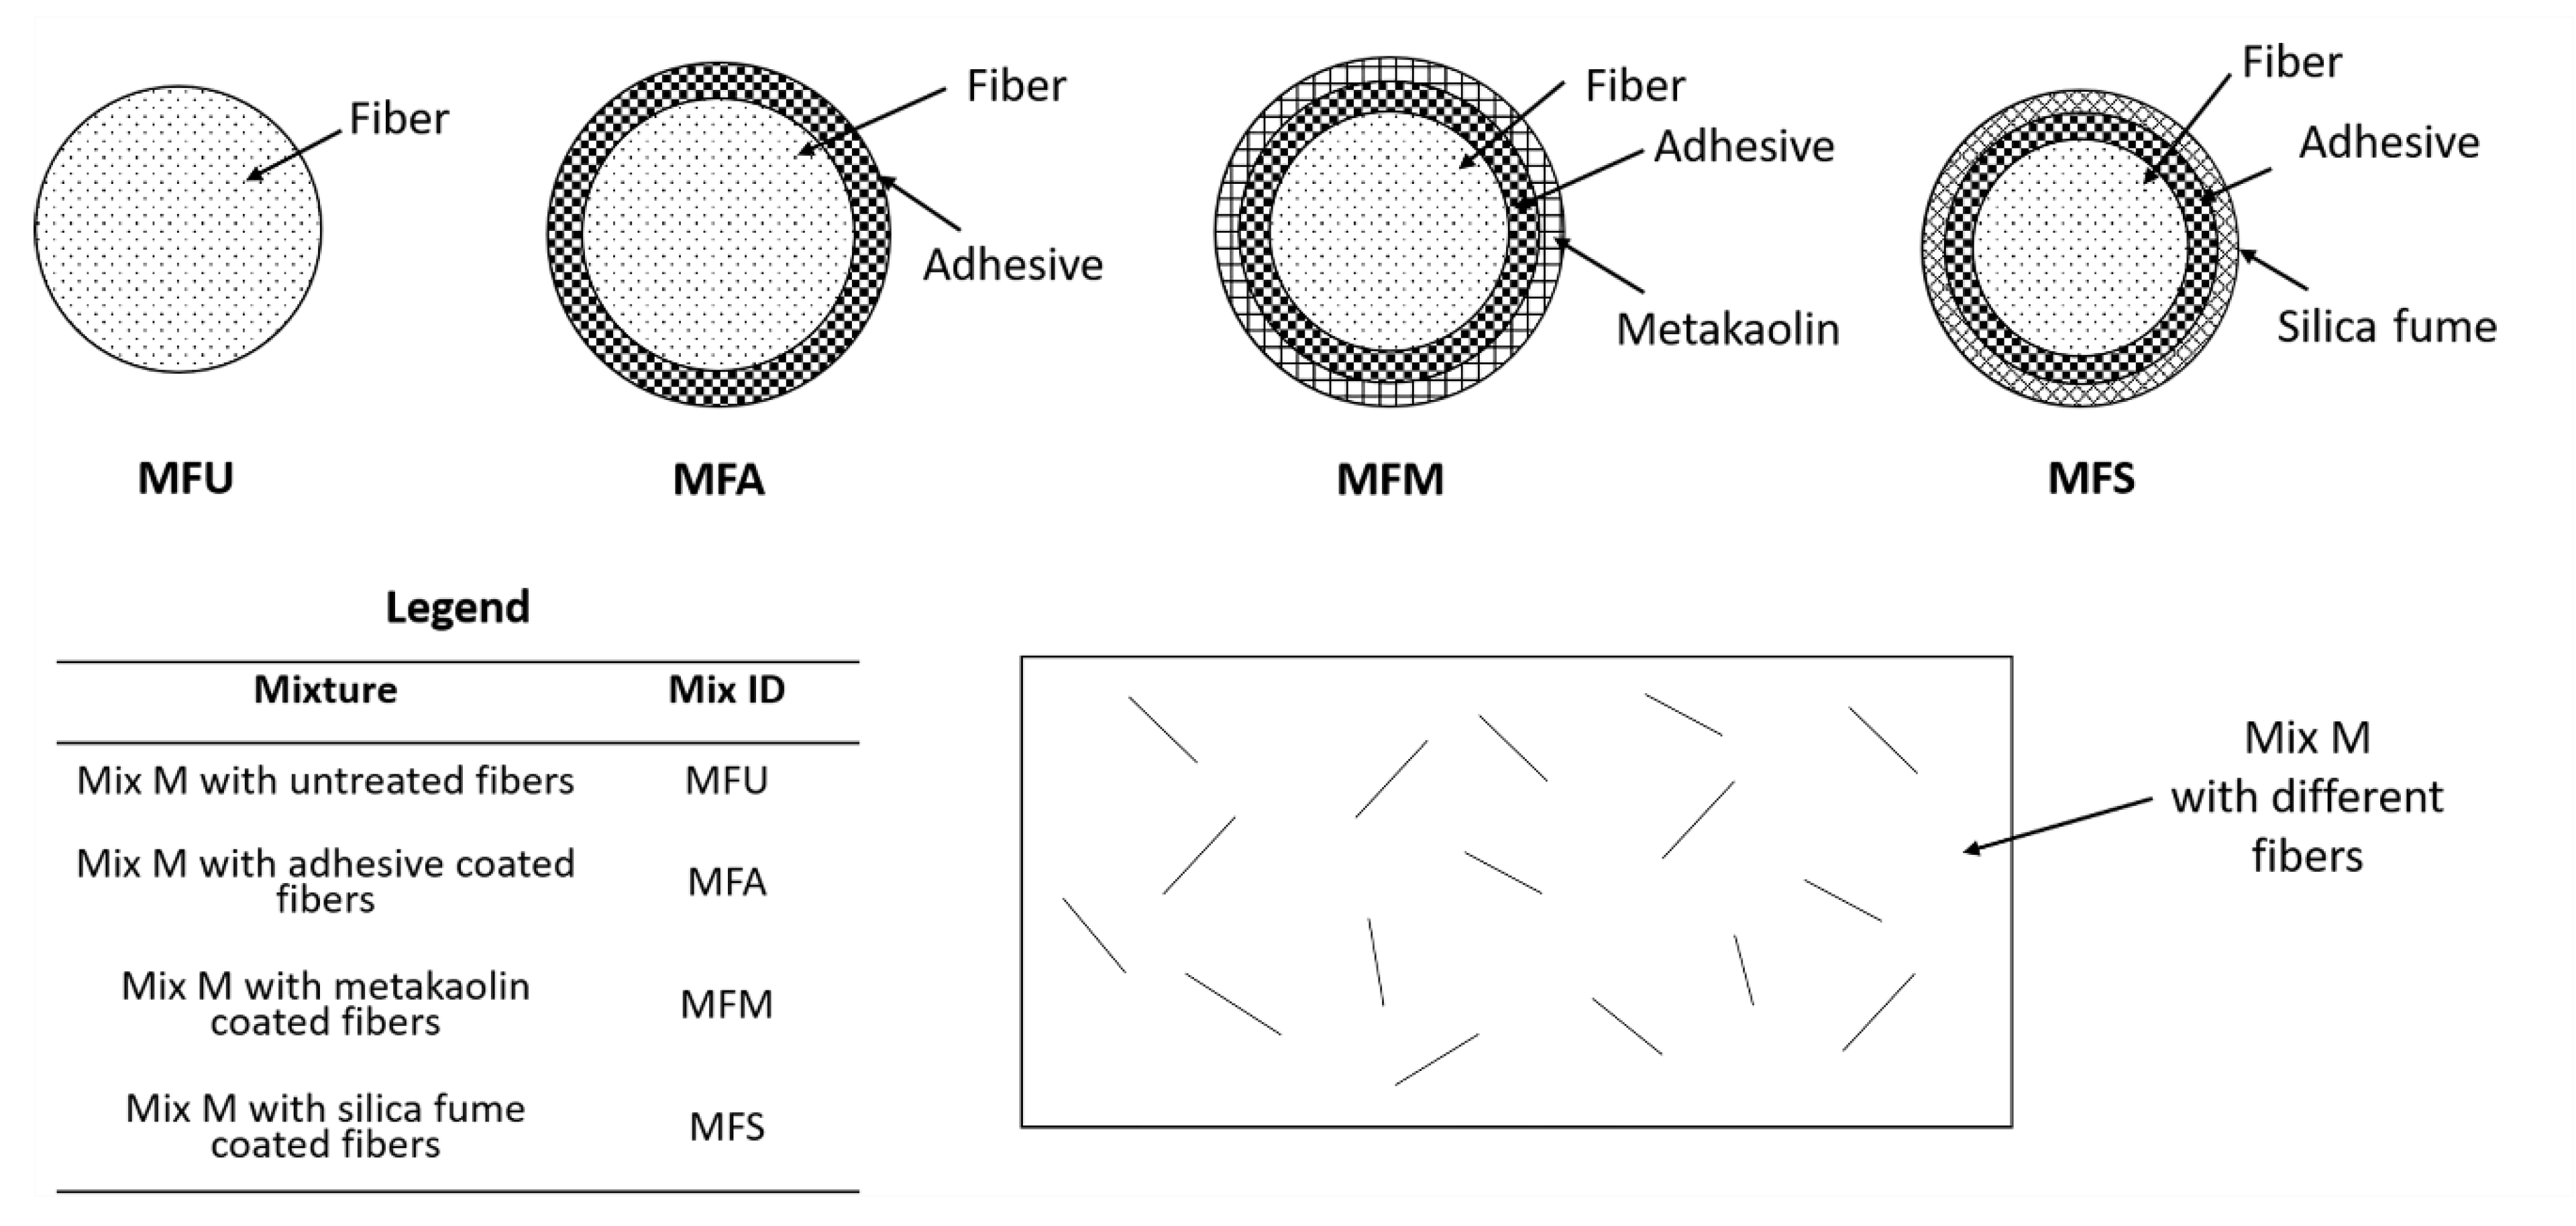
The various mixes were prepared to capture the effect of incrementally adding layers of coating on the virgin fiber. The first mix contains uncoated virgin PP fibers, the next mix contained the adhesive layer only, the succeeding mix contained metakaolin coated over the adhesive, and the final mix contained silica fume coated over the adhesive (Figure 4). As discussed in earlier sections, the commercially available repair mix P already contains fibers. Hence, no additional mixes were prepared with mix P. Instead, the mix was used as is to serve as a comparative mix to this study. Table 1 lists the mix designs and the number of samples cast for each mix.
2.3. Specimen Preparation
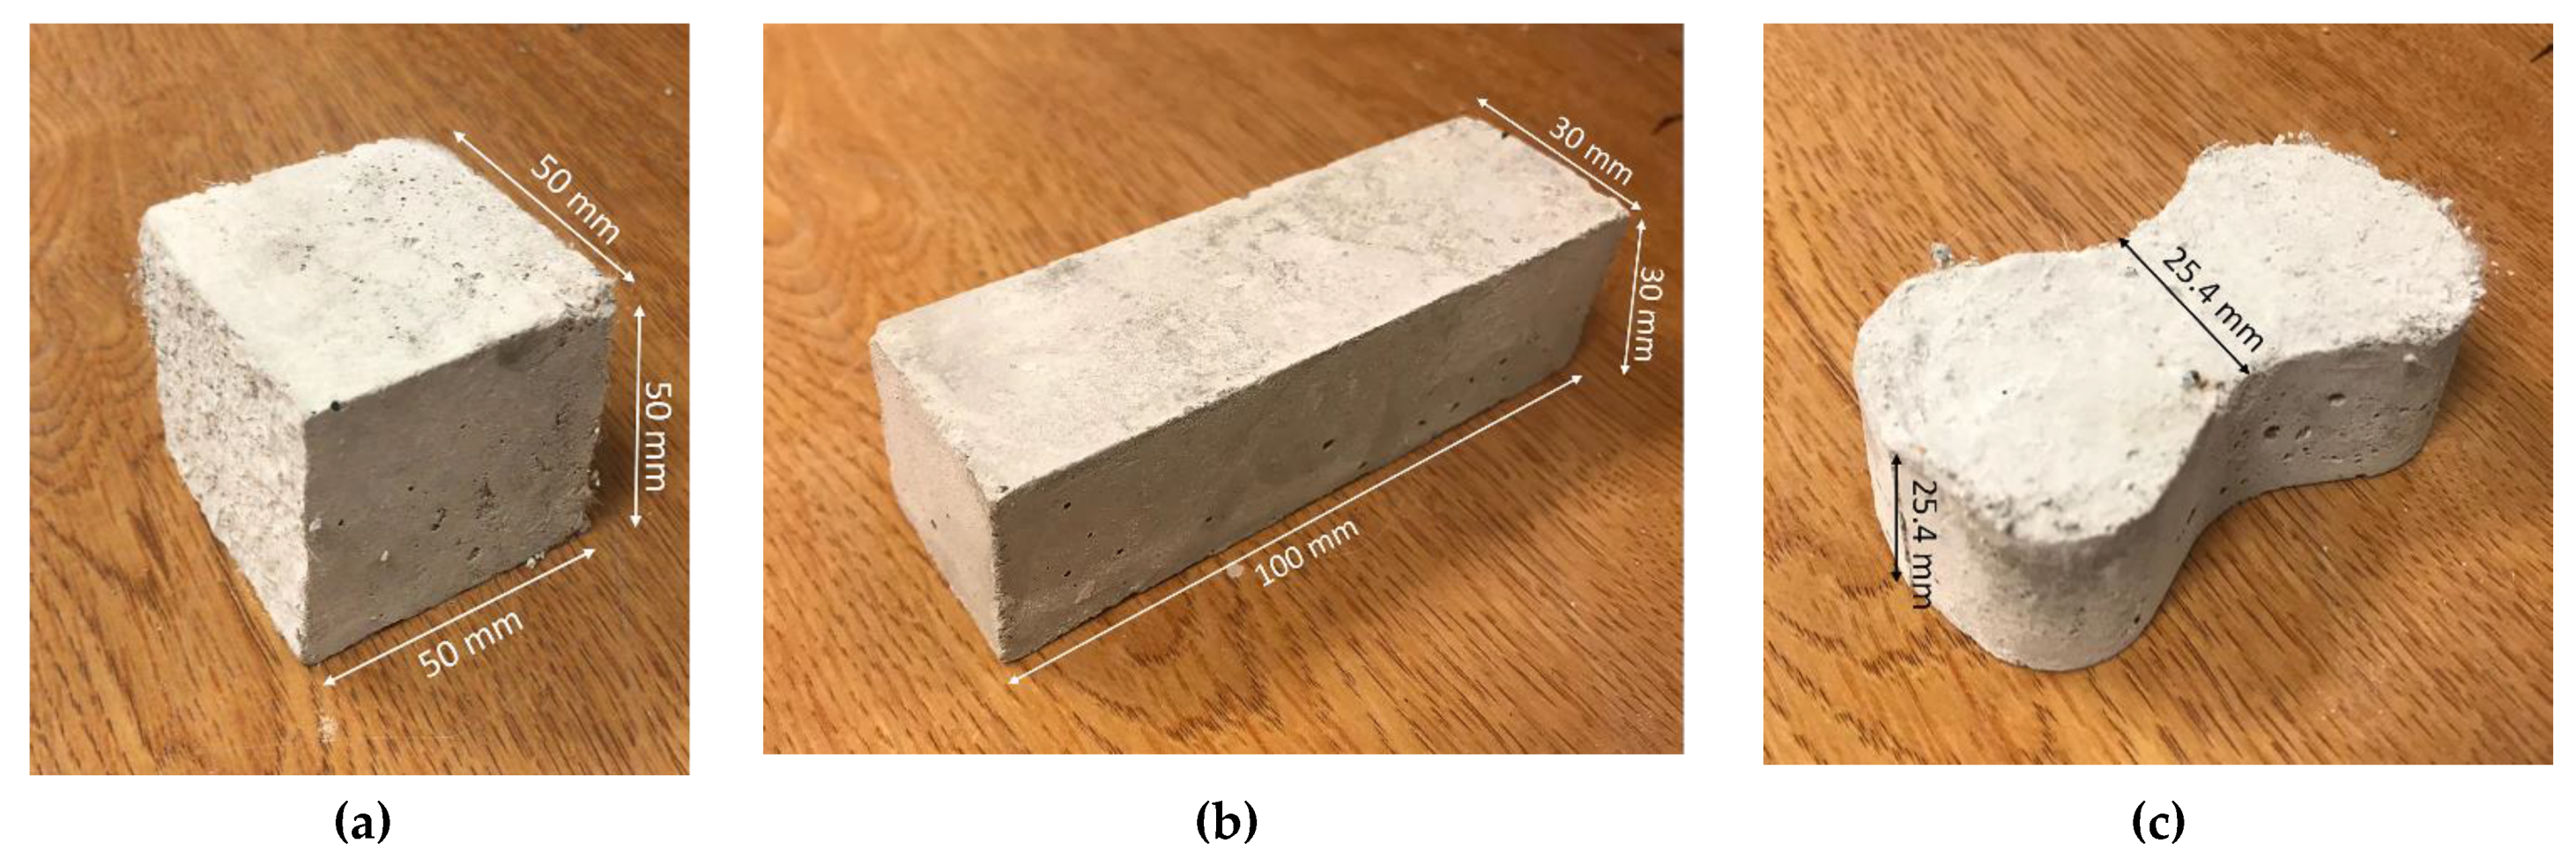
Mortar cubes were cast in accordance with ASTM C109 [37]. Each of the cubes (50 mm in size) was cast in two layers with a hand tamping technique used for consolidation. A total of 6 cubes for each mix were cast for determination of compressive strength. Briquette samples prepared were cast and tested to determine the tensile strength of the mixes. The briquettes had a cross-section of 645.16 mm2 at the neck. Briquette molds used were in accordance with ASTM C307 [38]. Both the width of the neck and thickness was 25.4 mm as per the provisions of ASTM. A total of 6 specimens for each mix were prepared to test the tensile strength. In addition to the ASTM standard tests on mortars as stated above, beams of size (30 mm × 30 mm × 100 mm) were cast. Figure 5 shows the cast specimens of each type. These specimens were prepared to determine the modulus of rupture in flexure for each of the mixes. A total of 6 beams were prepared for each mixture type. Immediately after molding, specimens were sealed in plastic sheets to minimize the evaporation of moisture from the fresh mix. Specimens were stored at 23 ± 2 °C for 24 h before demolding. Demolded samples were stored in water at a temperature of 23 ± 2 °C. All the mixes were immersed in separate water containers to avoid cross-contamination from the effect of leaching of free lime or constituents of SCMs.
2.4. Experimental Investigation
2.4.1. Compressive Strength Test
Sides of the mortar cubes were evened out using sandpaper to ensure even load distribution from the testing machine to the specimen face. Specimens were taken out of the curing water and allowed to attain saturated surface dry condition before carrying out tests. Tests were performed in accordance with ASTM C109 [37]. FORNEY compression testing machine F-650 was used in conjunction with FORNEY TestPilot digital indicator for this test. The machine has a load capacity of 2891 kN. The load was applied at a rate of 0.6 MPa/s. Tests were conducted at 14 and 28 days, and three specimens were tested at each age.
2.4.2. Tensile Strength Test
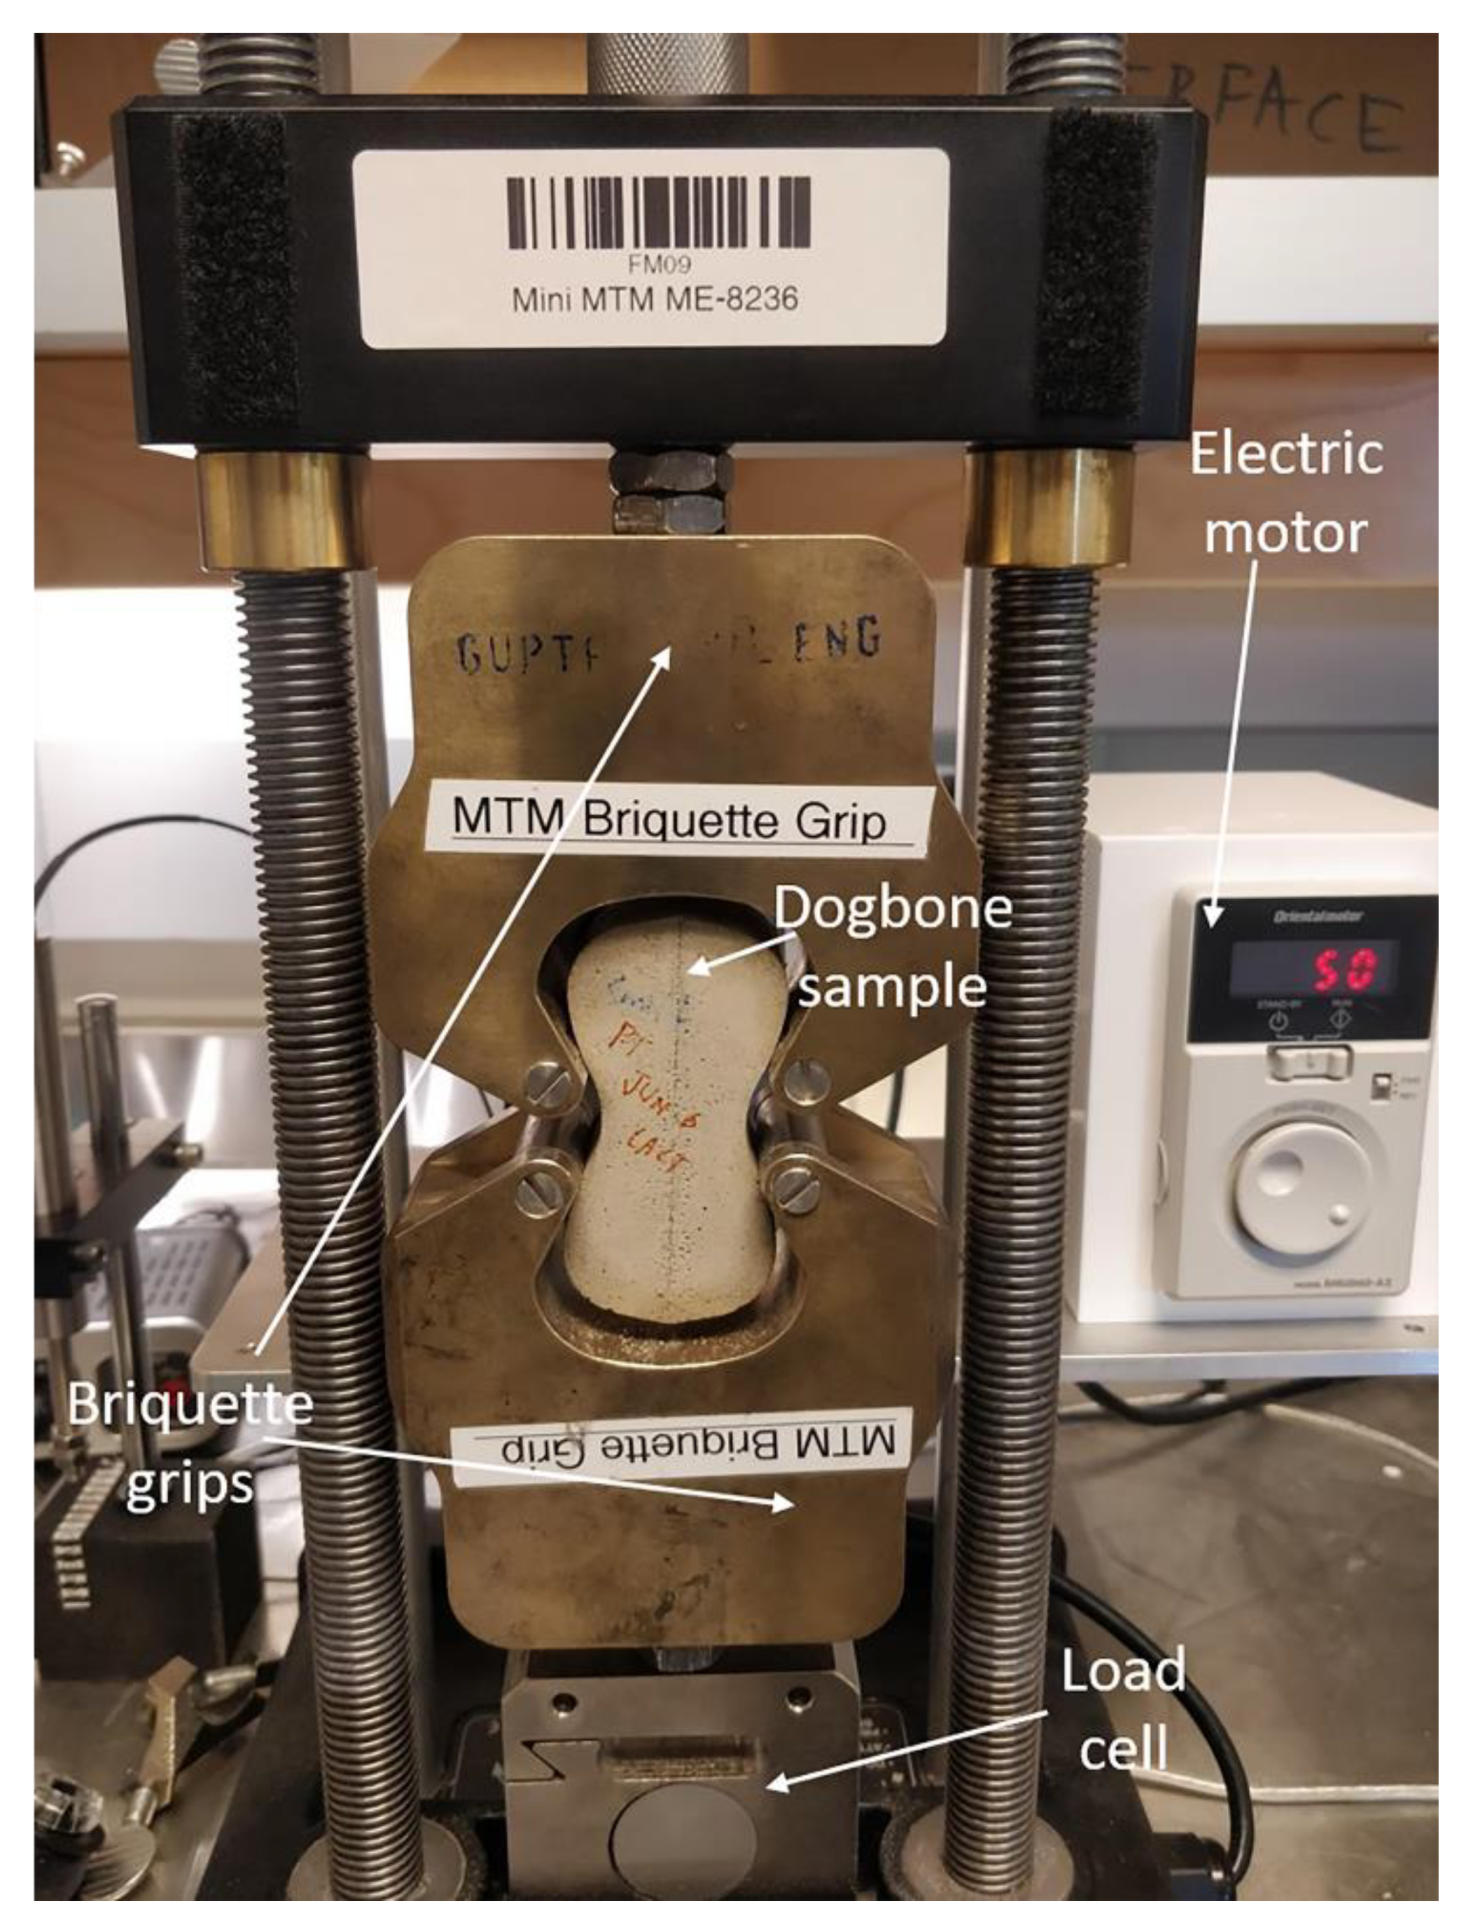
Specimens were taken out of the curing tank and allowed to attain saturated surface dry condition before carrying out tests. A total of at least 6 specimens per mix were molded. The test was conducted using PASCO® Materials Testing Machine ME-8236 used in conjunction with briquette grips. The machine had a load cell capacity of 7100 N. In its original capacity, ME-8236 operates using a manual crankshaft, to regulate the process of controlling speed and load rate. The machine was modified by adding an electric motor BMUD60-A2 from Oriental Motor®. The setup is shown in Figure 6 below. The motor comprises a brushless DC Motor Driver compatible with a single-phase 100–120 VAC power supply. Using the motor, the speed was set to 50 rpm, which translated to a displacement rate of 0.5 mm/min on the briquette sample. This automation in the machine resulted in a much more constant loading rate. The machine was coupled with the PASCO® 550 Universal Interface to connect to the PASCO Capstone software. The deflection of the coupon samples was determined by the software from the number of rotations made by the threads of the machine. The deflection and loads were recorded at a sampling frequency of 25 Hz. The direct tensile test was carried out at 14 and 28 days of curing and six specimens were tested for each age.
2.4.3. Three-Point Flexural Test
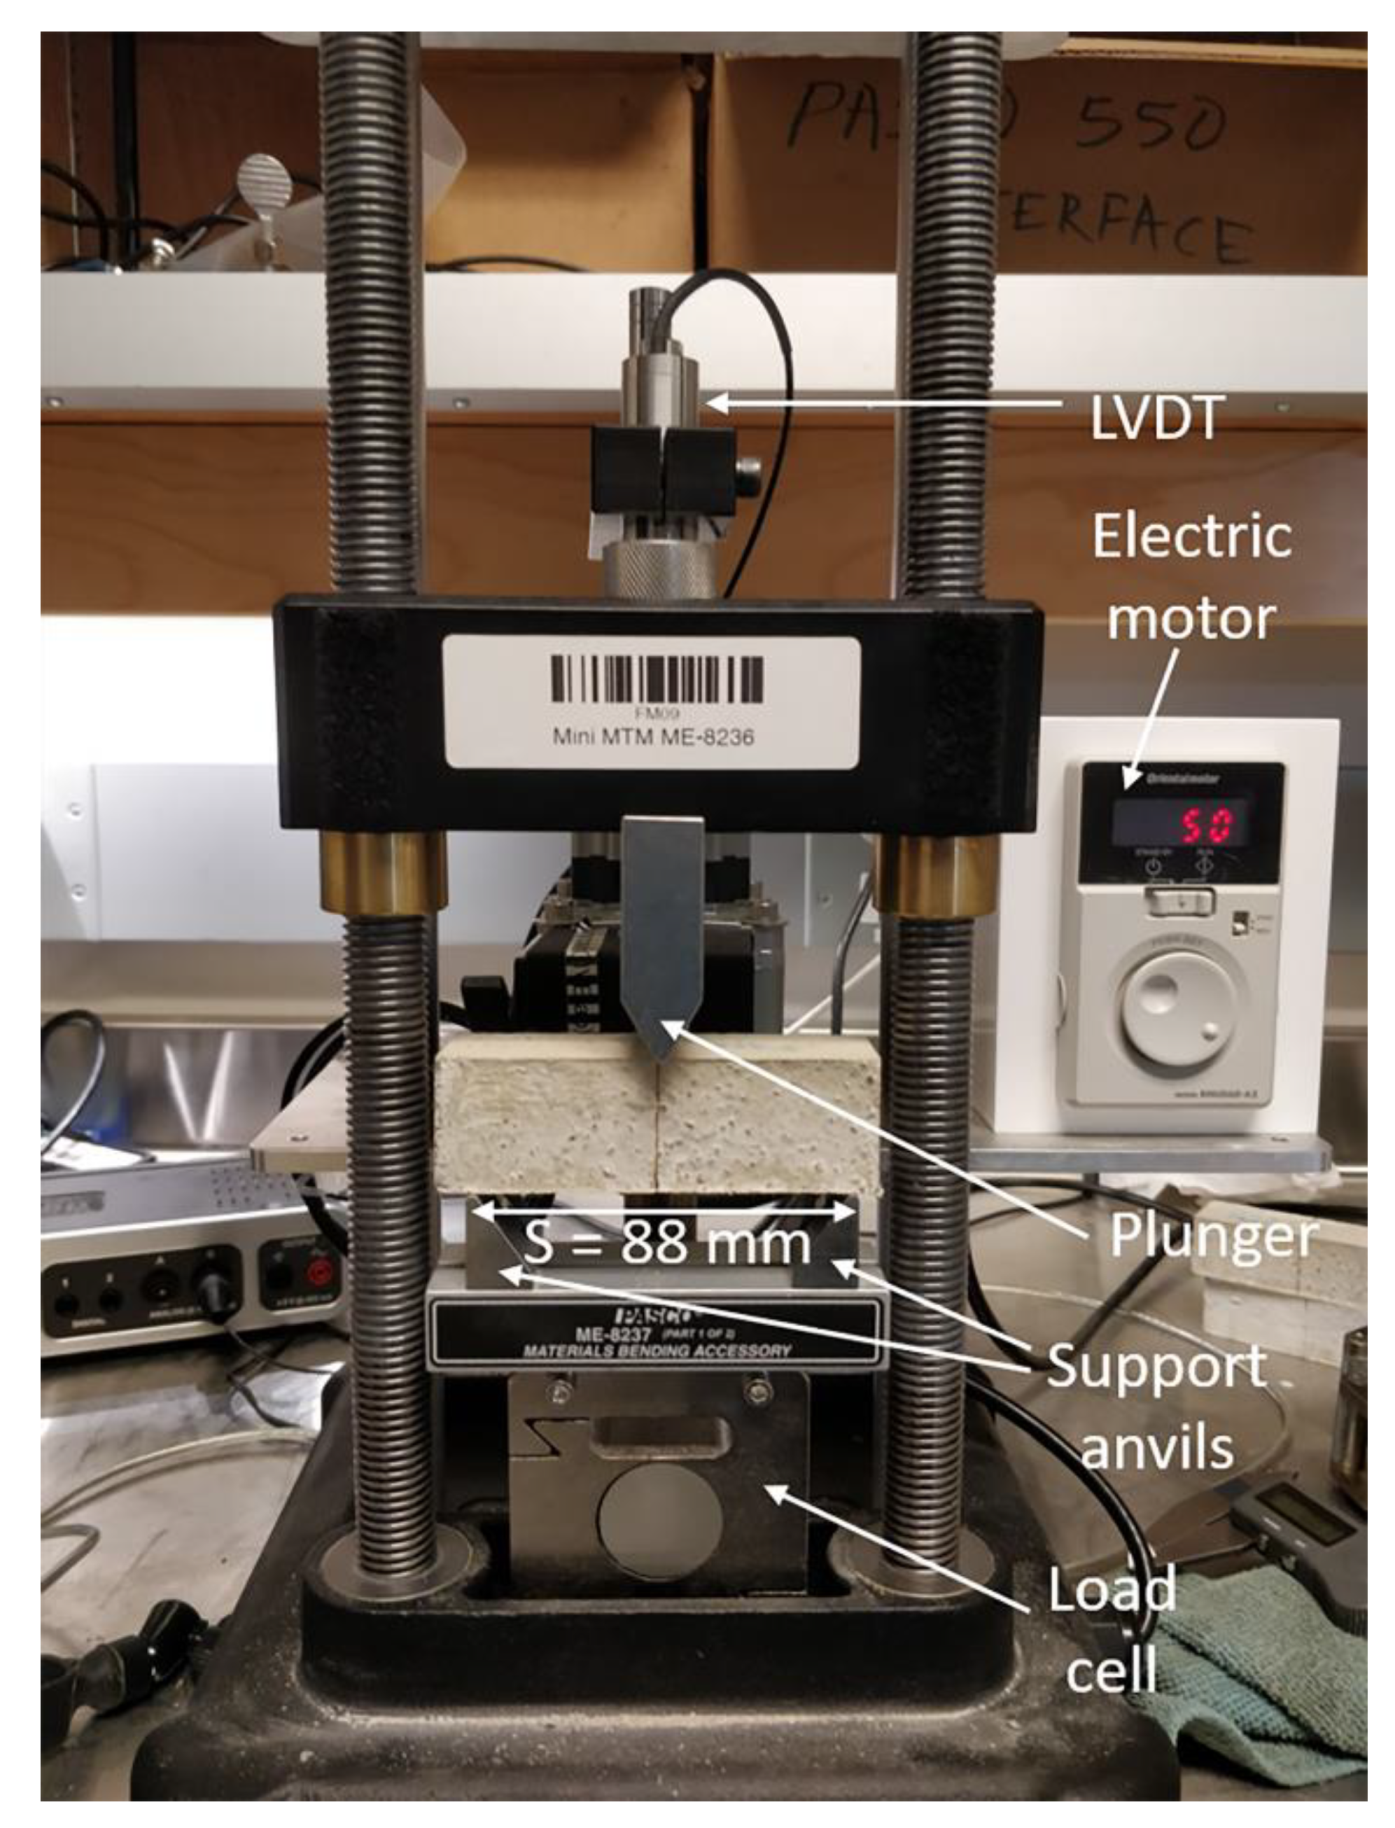
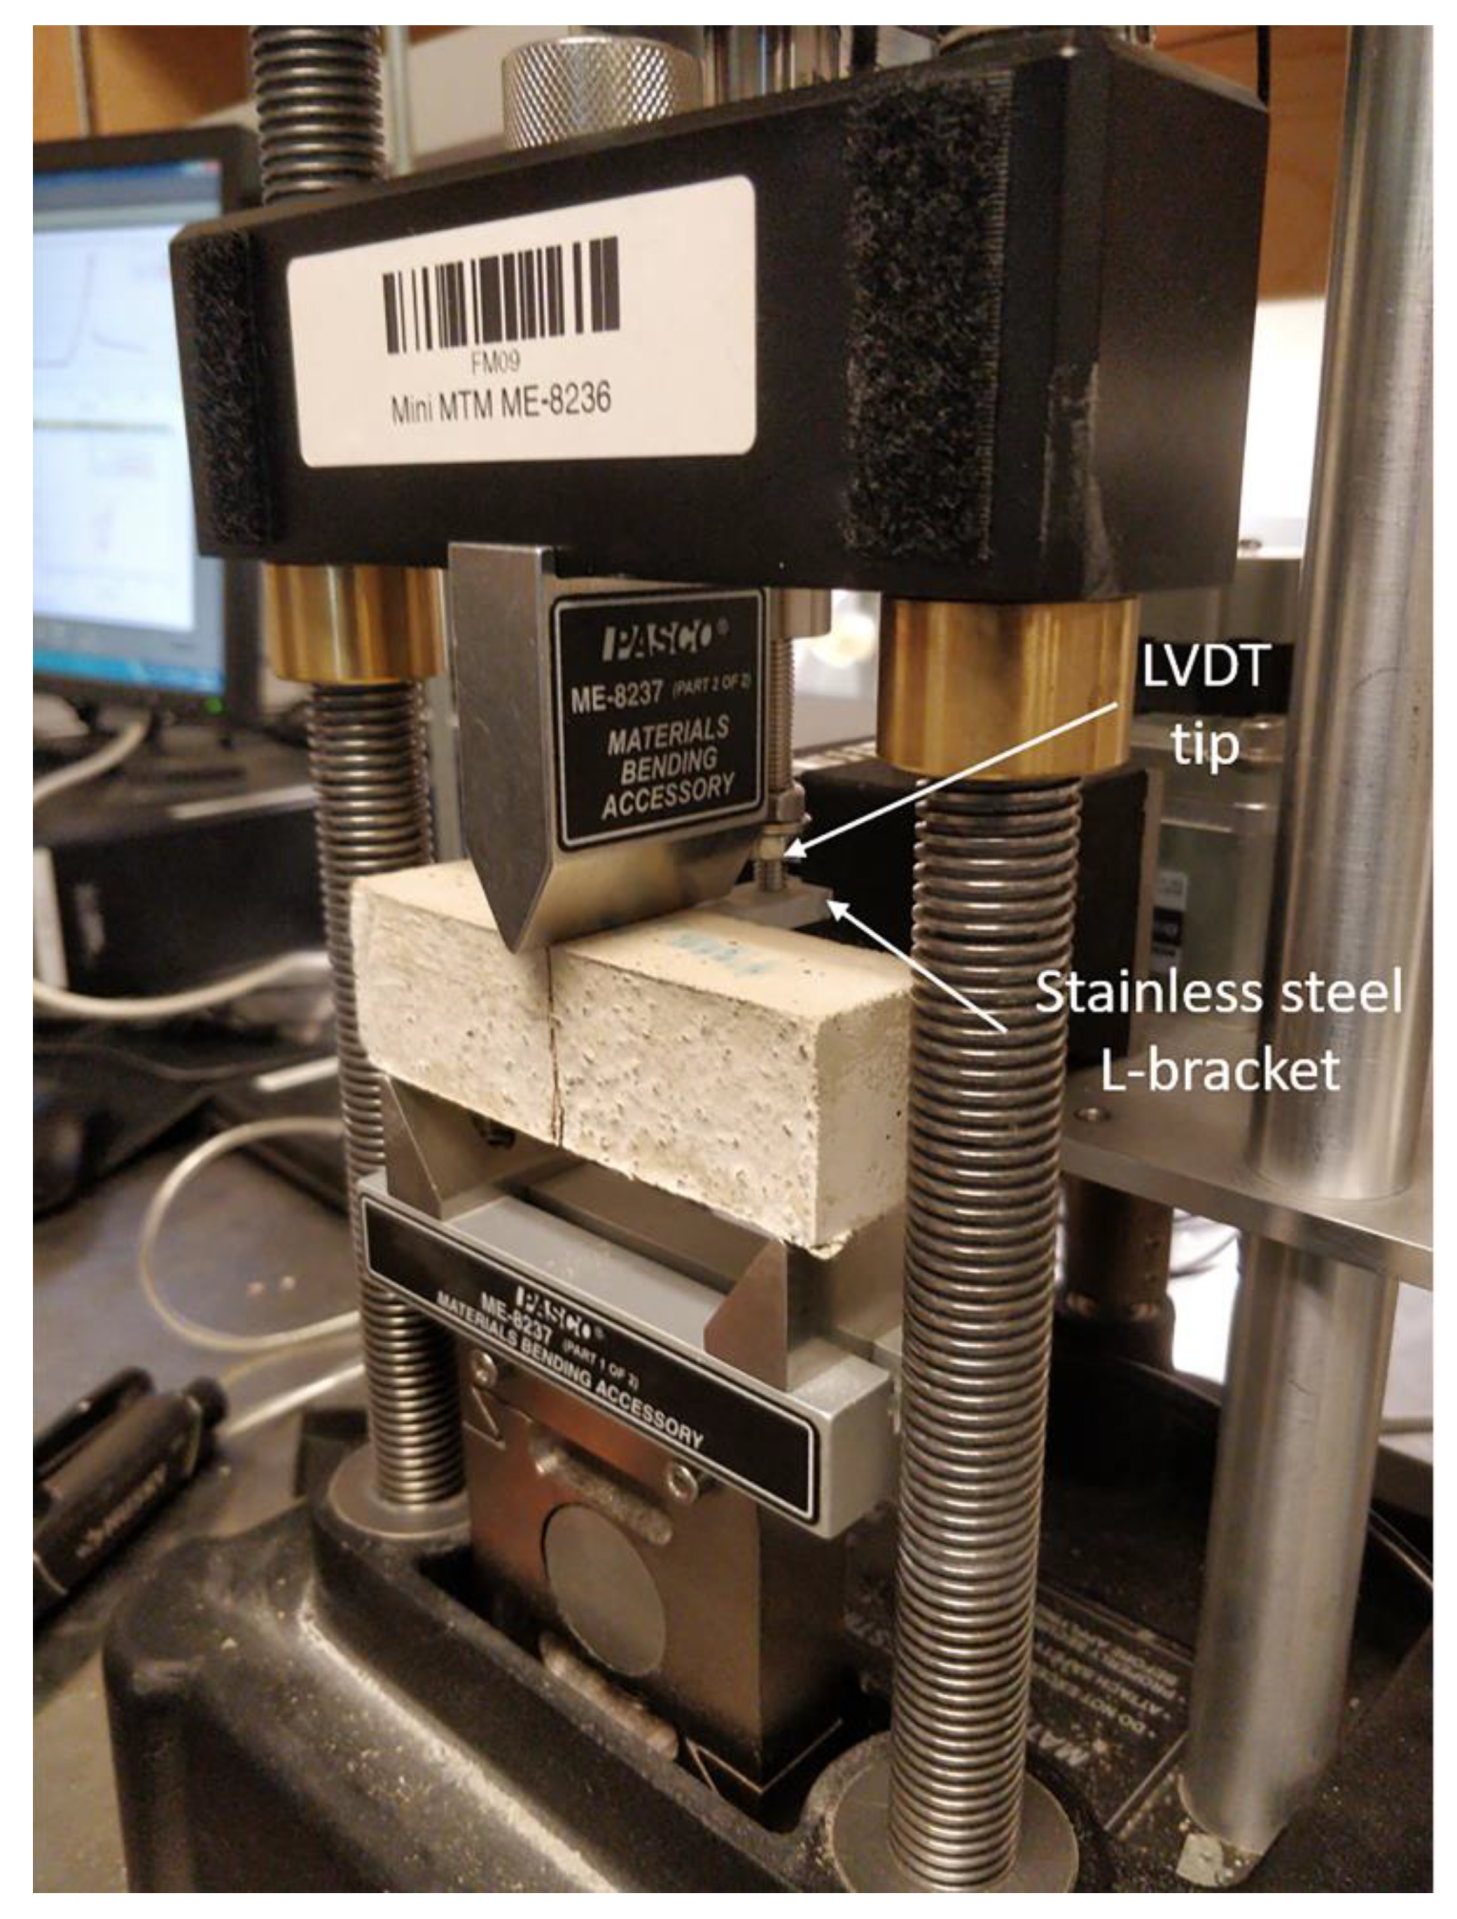
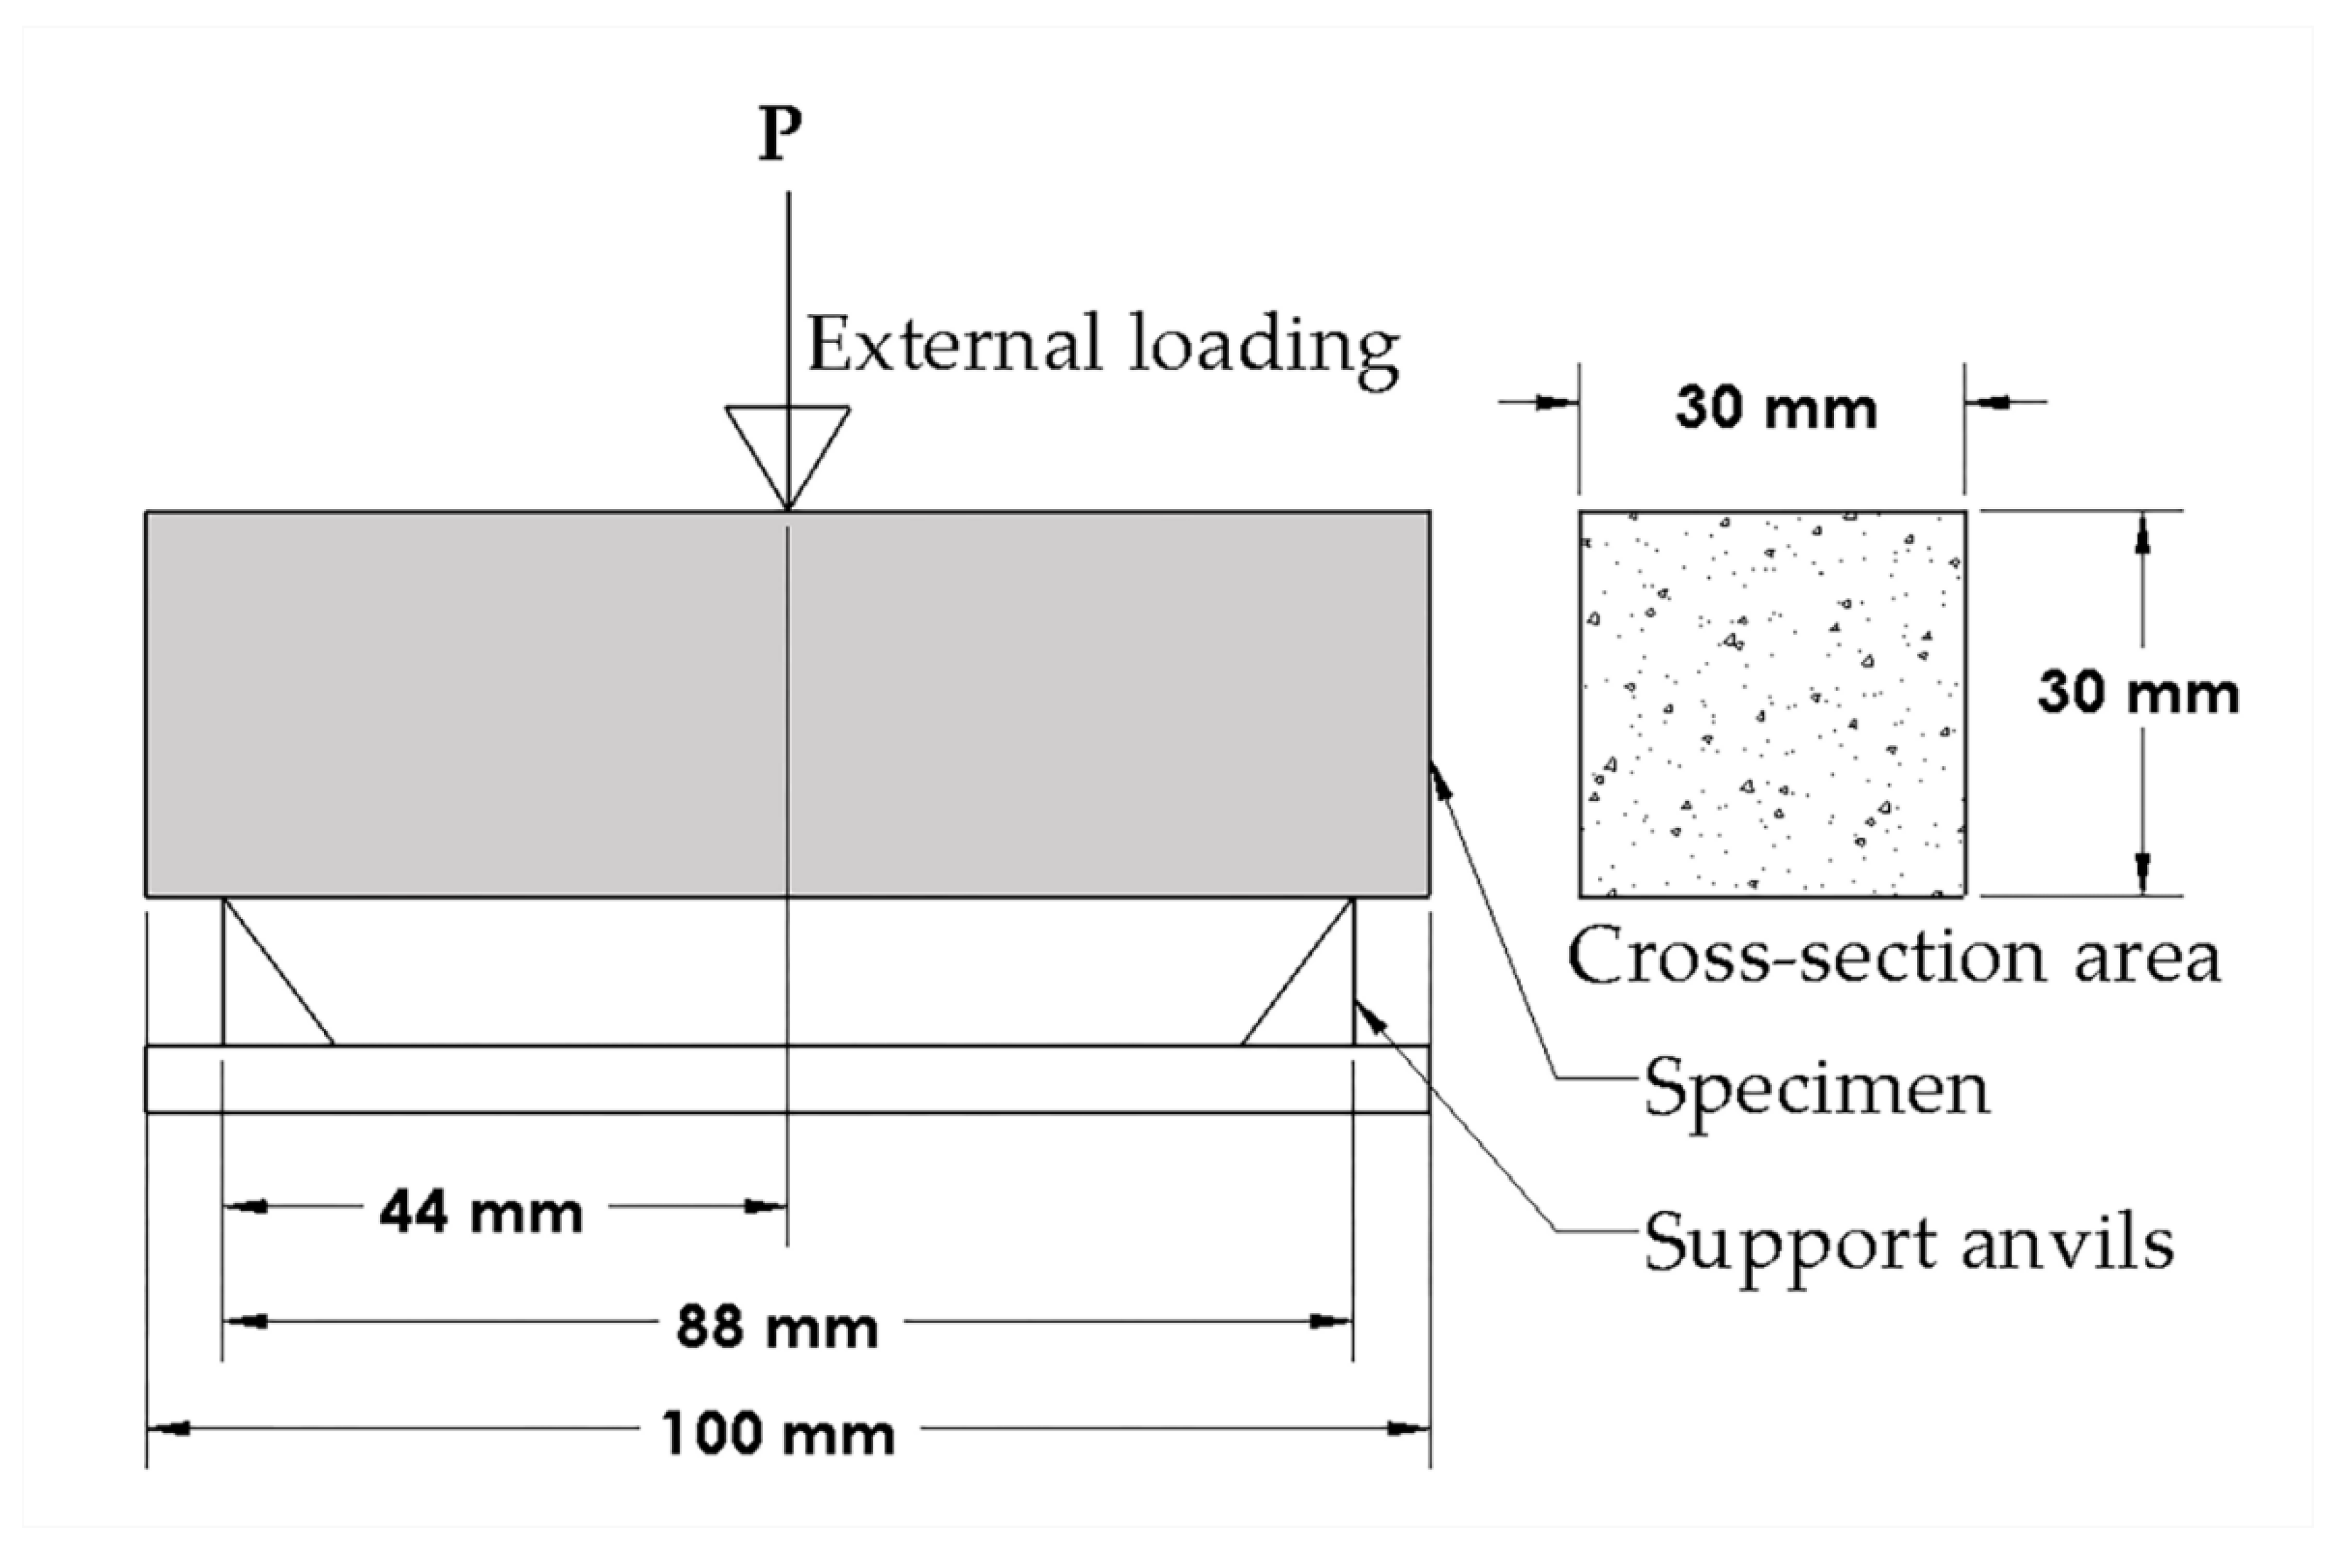
Mortar beams were cast to determine the flexural strength (modulus of rupture). To carry out flexural strength tests using the three-point bending setup, the same PASCO® ME-8236 equipment as described above was used. The briquette grips were replaced by the ME-8237 materials bending accessory provided by PASCO®. The accessory included a plunger and adjustable support anvils. For this study, the span length between the anvils was kept constant at 88 mm (Figure 7). Displacement measurements were recorded with the help of the LD620-25 linear variable differential transformer (LVDT) produced by OMEGA®. The LVDT had a range of 25 mm with an excitation voltage of 10–30 Vdc @ 25 mA and had an output of ± 5 Vdc with a bandwidth of 500 Hz. The LVDT was kept in contact at the midspan of the beam with the help of stainless-steel L-brackets attached to the beams using fast-setting epoxy resin (Figure 8). A total of at least 6 specimens per mix were cast. Three-point bending tests were conducted at a strain rate of 0.5 mm/min at 14 and 28 days of curing. Three specimens were tested at each testing age.
2.4.4. Microscopic Analysis
The ESTF were observed under an optical microscope for a preliminary examination of the metakaolin and silica fume coatings. Trinocular stereo zoom microscope produced by AmScope © was used for the examination. Specifications of the microscope include 7–45× continuous zoom magnification power with a super widefield optical system and a 10 cm working distance. It is also enabled with a trinocular port that added photo-capturing capability once interfaced with a computer system.
Specimens containing coated fiber samples (MFM and MFS) were analyzed under a SEM to check for the coating of fibers and bonding with the matrix. Elemental mapping on each fiber sample was done on fiber surfaces to evaluate the effectiveness of the coating method used. Additionally, the interface between fiber and matrix was analyzed to evaluate the effect on the interfacial transition zone. Scanning electron microscopy was done using Hitachi S-4800 FESEM (Figure S1 in the Supplementary Materials section). The equipment has a 1 and 1.4 nm resolution at 15 and 1 kV, respectively, and a magnification range from 30× to 800,000×. Slices from dog-bone samples were cut using a wet tile saw. The cut slices were kept in an airtight chamber attached to a vacuum pump immediately after the cutting process was over. This was done for a period of at least 3 days to retard the formation of any hydration product after the samples are cut. The samples were placed in a vacuum chamber immediately after being cut and surface dried for a period of at least 3 days. The sliced samples were further cleaned and vacuumed for a period of 24 h using the Hitachi ZoneSEM desktop sample cleaner, which uses UV light to remove contaminants. The Cressington 208C was used to carbon coat the samples to allow SEM imaging on the nonconductive samples. Carbon coating of samples is also recommended by the manufacturer in cases where EDX is to be done as carbon does not absorb and fluoresce as much as other coatings.
3. Results and Discussion
3.1. Strength in Compression
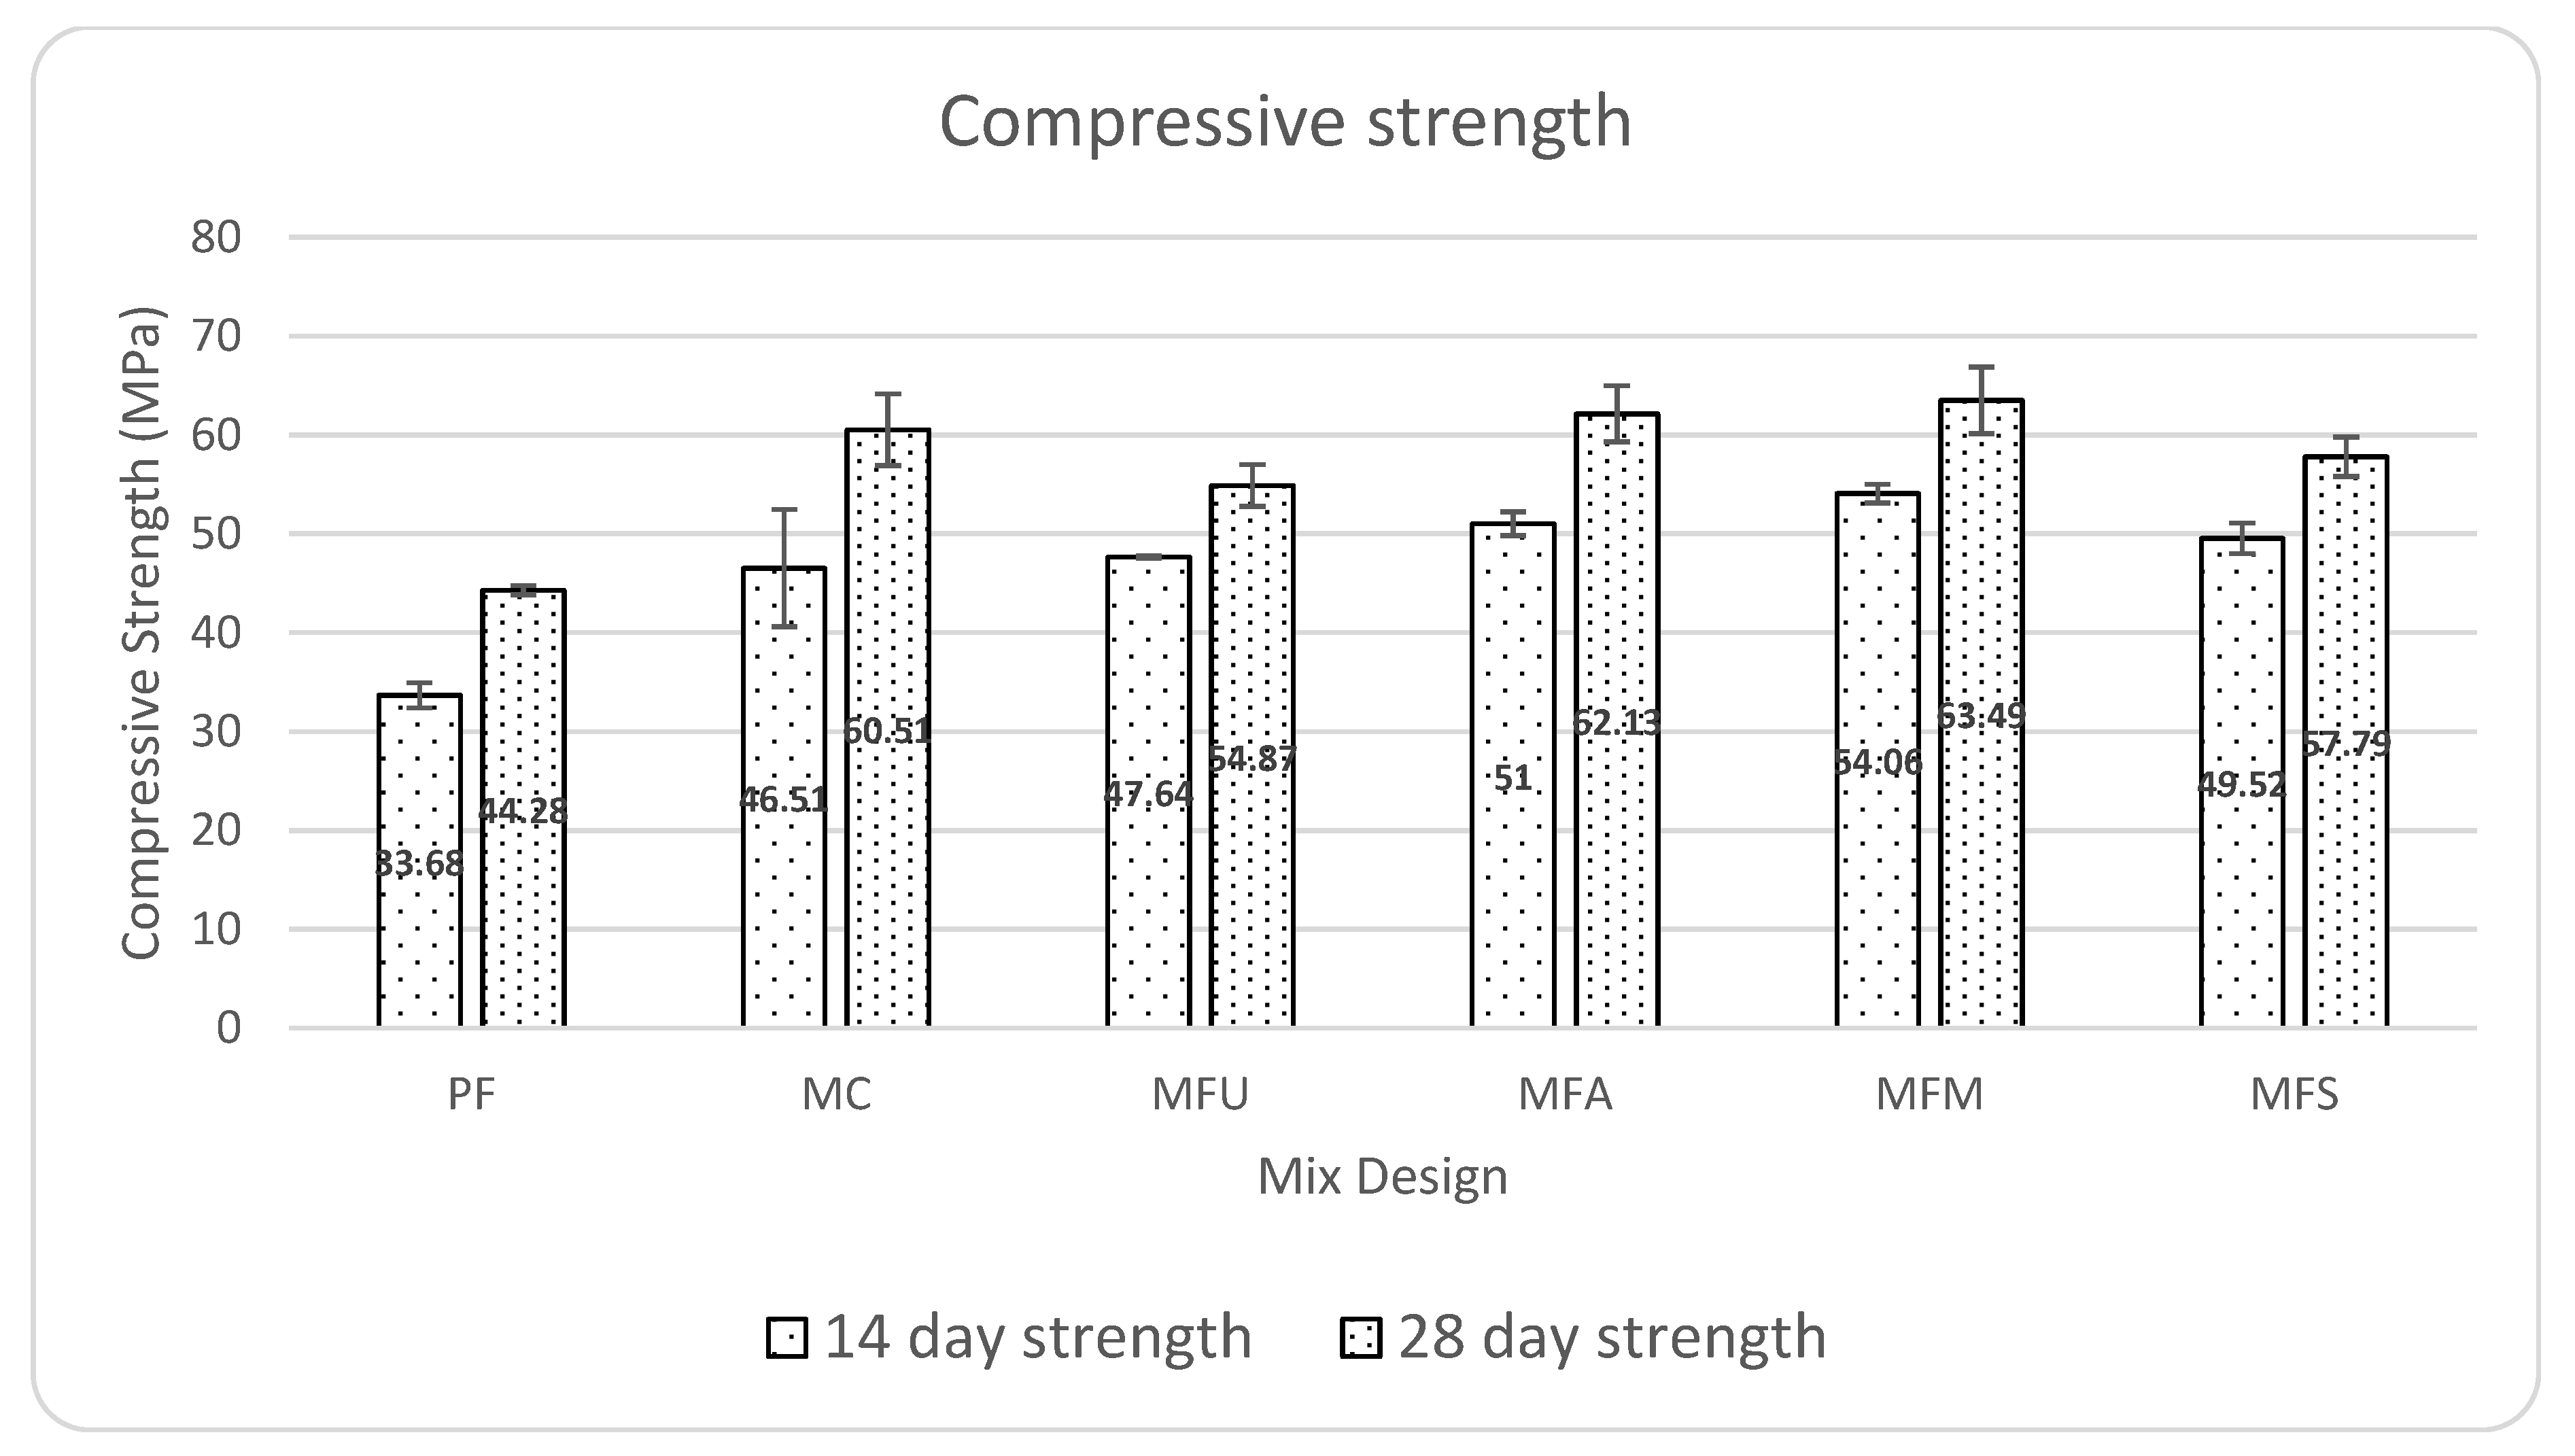
Figure 9 shows the results of the compressive tests done for all the mixes measured at both 14- and 28-day strength. Average compressive strength is presented for various mixes with error bars.
Compared to the base material (MC), the mix reinforced with untreated polypropylene fiber (MFU) showed a drop in compressive strength by 2.43% at 14-day age and 9.32% at 28-day age. When studying the effect of treatment of fibers, metakaolin-treated fibers (MFM) showed an increase of 7.05% (14-day strength) and 15.71% (28-day strength) on average, whereas silica fume-coated fibers (MFS) showed an improvement of 3.94% (14-day strength) and 5.32% (28-day strength) from untreated polypropylene fibers (MFU) in the same matrix. On comparing the base material (MC) with the commercially available fiber-reinforced repair material, the increase in strength was 38.09% at 14 days and 36.65% at 28 days.
The compressive strength due to metakaolin increased by 13.47% when comparing 14-day MFU and MFM samples. Other studies [39] showed an increase of 3.27% on replacing 5% cement with metakaolin. In this study, by using a much lower amount of metakaolin, the strength increased by 13.47% as compared to 3.27%.
On comparing the 28 days cured samples, the cube strength of MFM increased by 15.71% compared with MFU. A study [26] showed an increase of as high as 16.8% in compressive strength on the addition of 20% metakaolin which is 100 times the amount of metakaolin used in the present study. The same study [26] also showed an increase of 7.9% in compressive strength in the case of silica fume, whereas the present study used 0.01 times the amount of silica fume to report a cube strength improvement of 5.32%. This further suggests that the position of the SCM in addition to the SCM properties itself plays an important role in the mechanical strength of the material. Researchers [40] have shown interest in metakaolin due to its microfiller and pozzolanic properties. Pozzolanic materials such as metakaolin and silica fume react with portlandite to produce additional cementitious gel [41]. In the case of metakaolin, the pozzolanic property is the ability to react with calcium hydroxide in the presence of water to form hydrated silicate gel products that possess cementitious properties [42,43]. Although the calculations for the improvements were made using the averages, it is essential to keep in mind that these averages were found out within the limits of experimental error which have been quantified in terms of the standard deviation (as included in Figure 9).
Further, a statistical validation test was performed on the compressive strength results using the one-way analysis of variance (ANOVA) technique in MATLAB. The one-way ANOVA was conducted to compare the effect of coating on the compressive strength. The ANOVA technique has been previously used by researchers [44] to understand the statistical variation in tests done on mortars. The statistical confidence of the effect of the coating on the compressive strength was analyzed. The probability p that the null hypothesis is true was determined for the three critical mixes, namely, MFU, MFM, and MFS. A threshold of p = 0.05 was considered and the comparisons were made. The p values greater than the threshold value of 0.05 were considered statistically insignificant. On comparing the three mixes, the value for p for 14 days was found to be 0.0033. The analysis of variance showed that the effect of the coating on the compressive strength was significant, p = 0.0033 for 14-day strength. Similarly, the 28-day strength was also validated using the one-way ANOVA test, p = 0.0295. Since the probability p was less than the threshold in both the cases, this shows that the comparisons are significant and the coating does improve the compressive strength.
3.2. Strength in Direct Tension
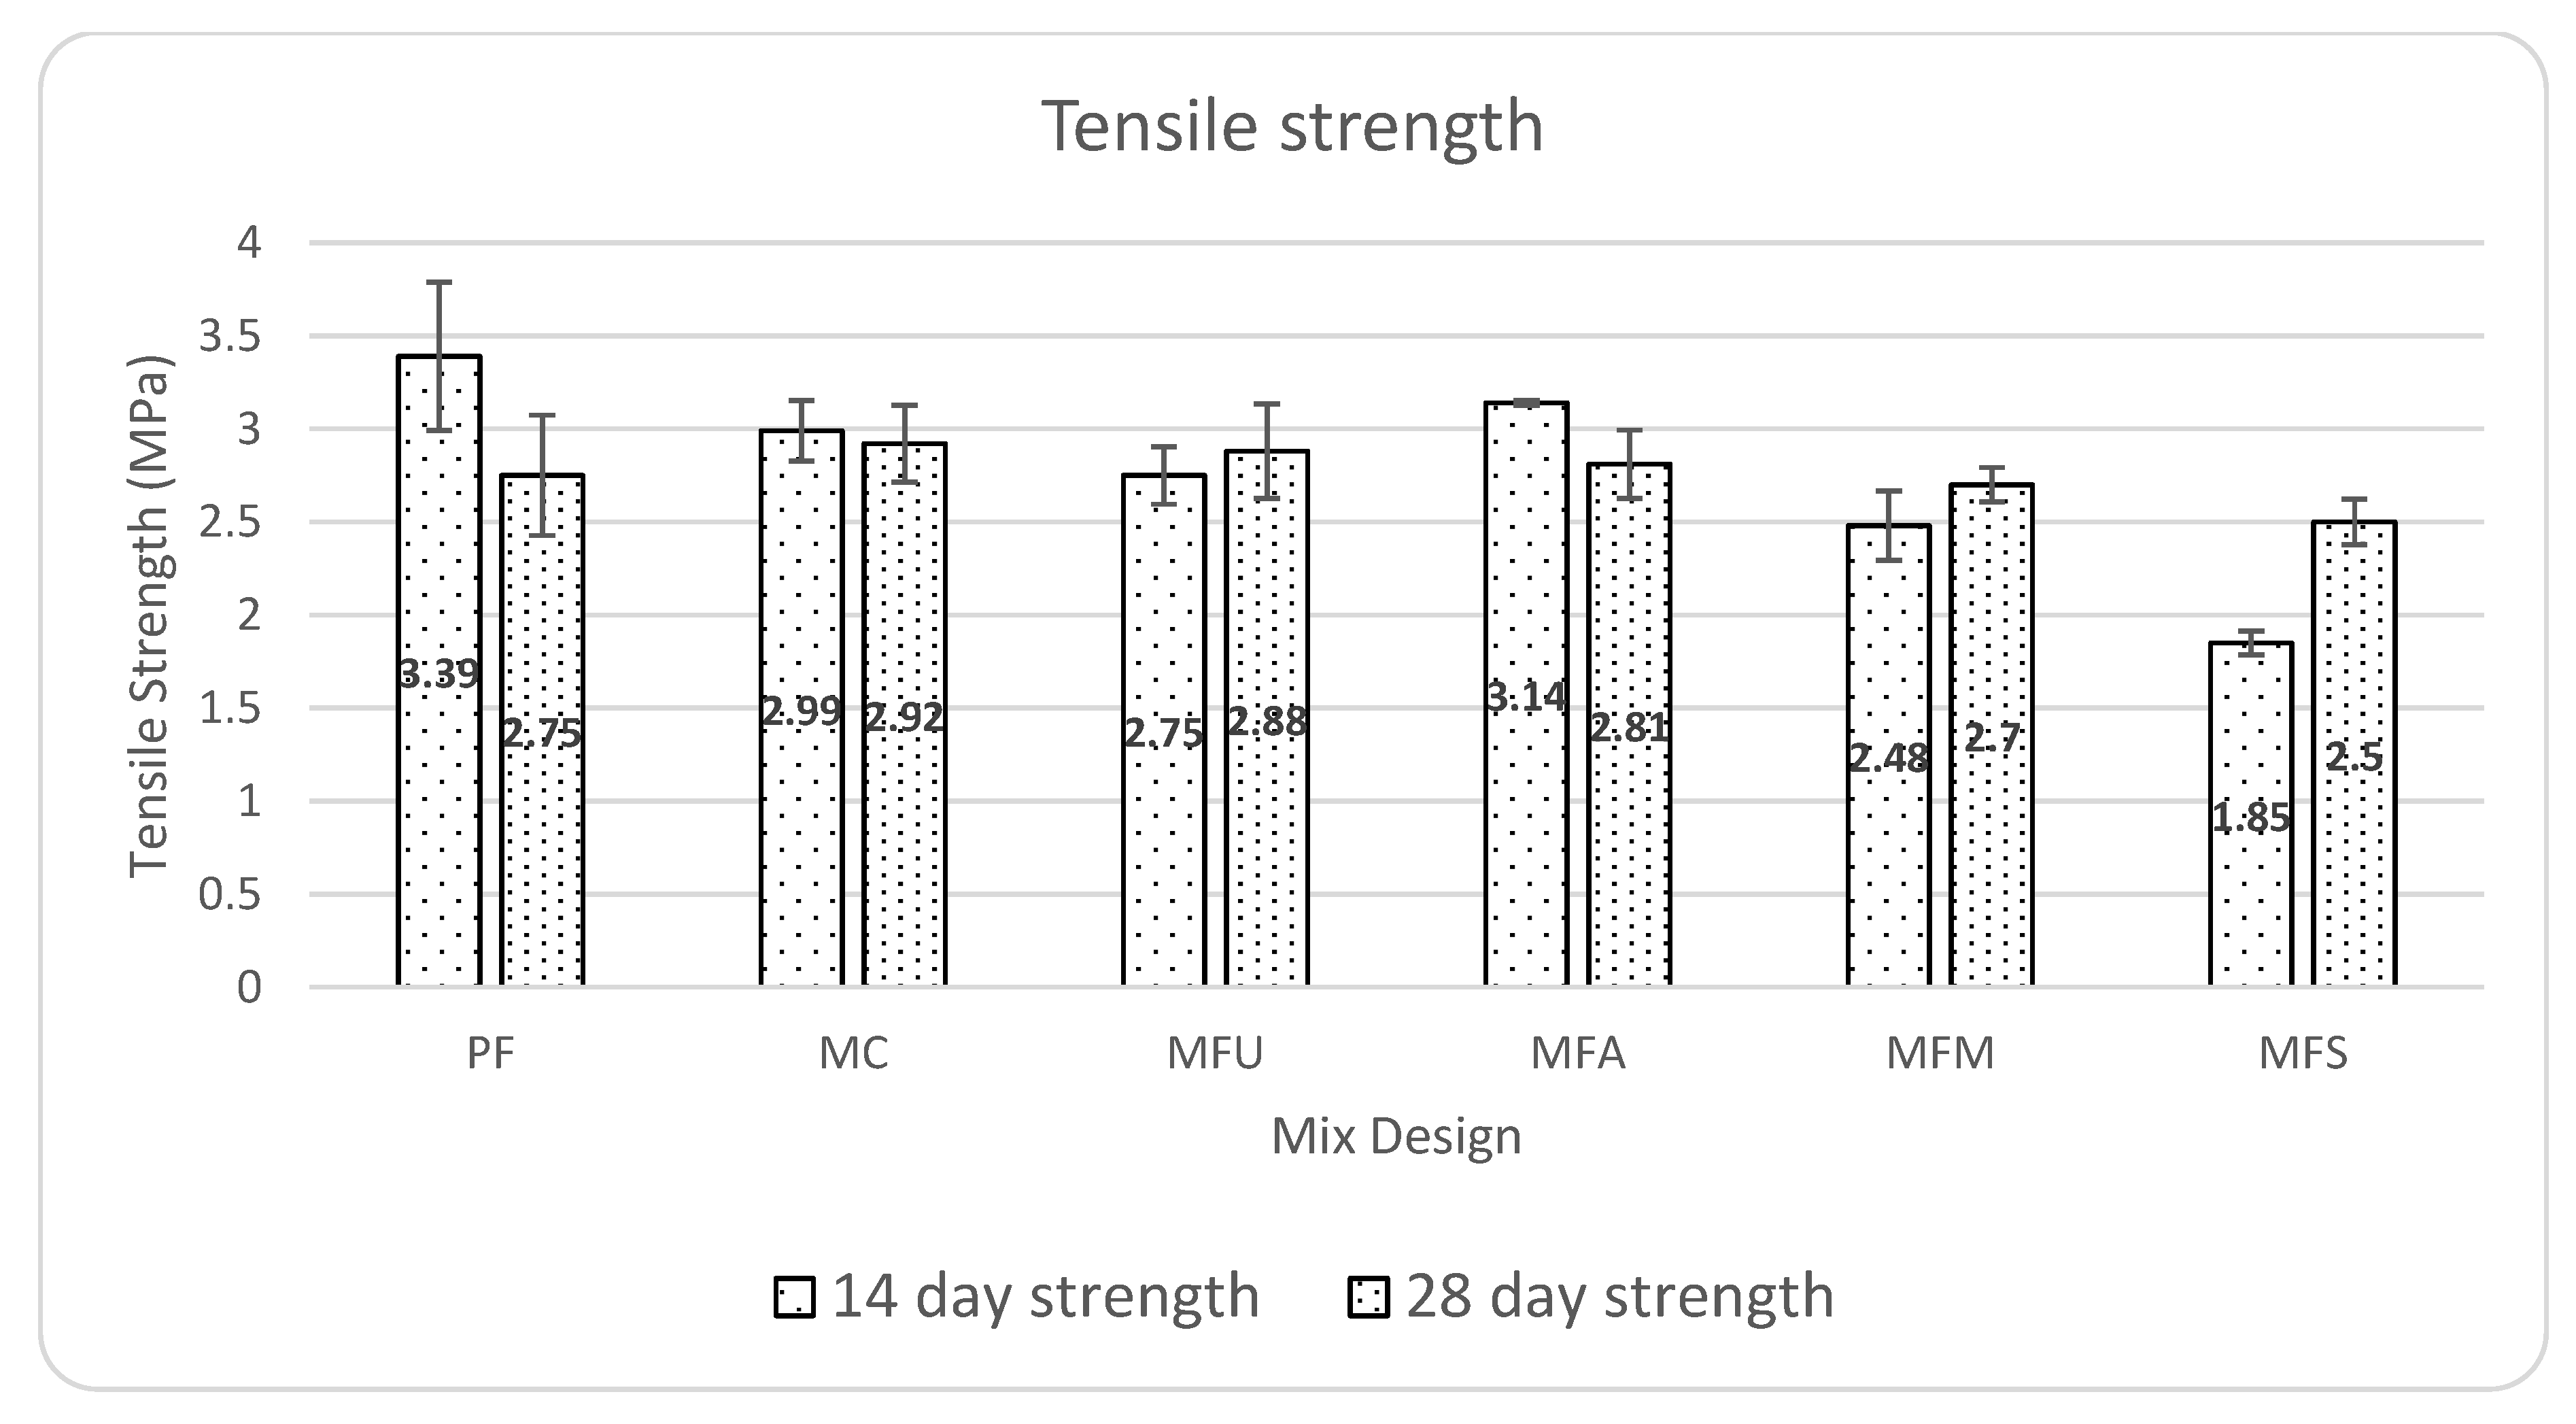
Figure 10 shows the results of the direct tension tests conducted on mortar briquettes (also referred to as dog-bones or coupons) for all the mixes measured at both 14- and 28-day strength. Average tensile strength is presented for various mixes with error bars.
The tensile strength was calculated by dividing the peak (maximum) load by the cross-sectional area of the failure plane which was calculated by determining the actual length and depth at the section of failure of the dog-bone specimens using digital calipers. The following is the equation used to calculate the tensile strength of the mixes:
where P is peak load in N, b is the width, and d is the depth of the coupon at failure surface in millimeters.
Given the relatively high standard deviations in the first peak values, the tensile strength does not show any significant difference in the addition of fibers to the base material (MC). PF mixture showed the highest strengths both at 14 and 28 days of curing. The relatively high strength in mix PF possibly indicates a better overall mix design of the product. Additionally, it also possibly indicates the presence of an inclusive and compatible mix of fibers by the supplier. For further investigation, fibers in mix P (PF mix) were studied under SEM and an optical microscope. This revealed a better dispersion of fibers in the commercial mix P. The diameter of fibers in the commercial mix P (PF) was found to be about 15 µ, whereas the fibers used and modified in this study for other mixes were of 30 µ in diameter.
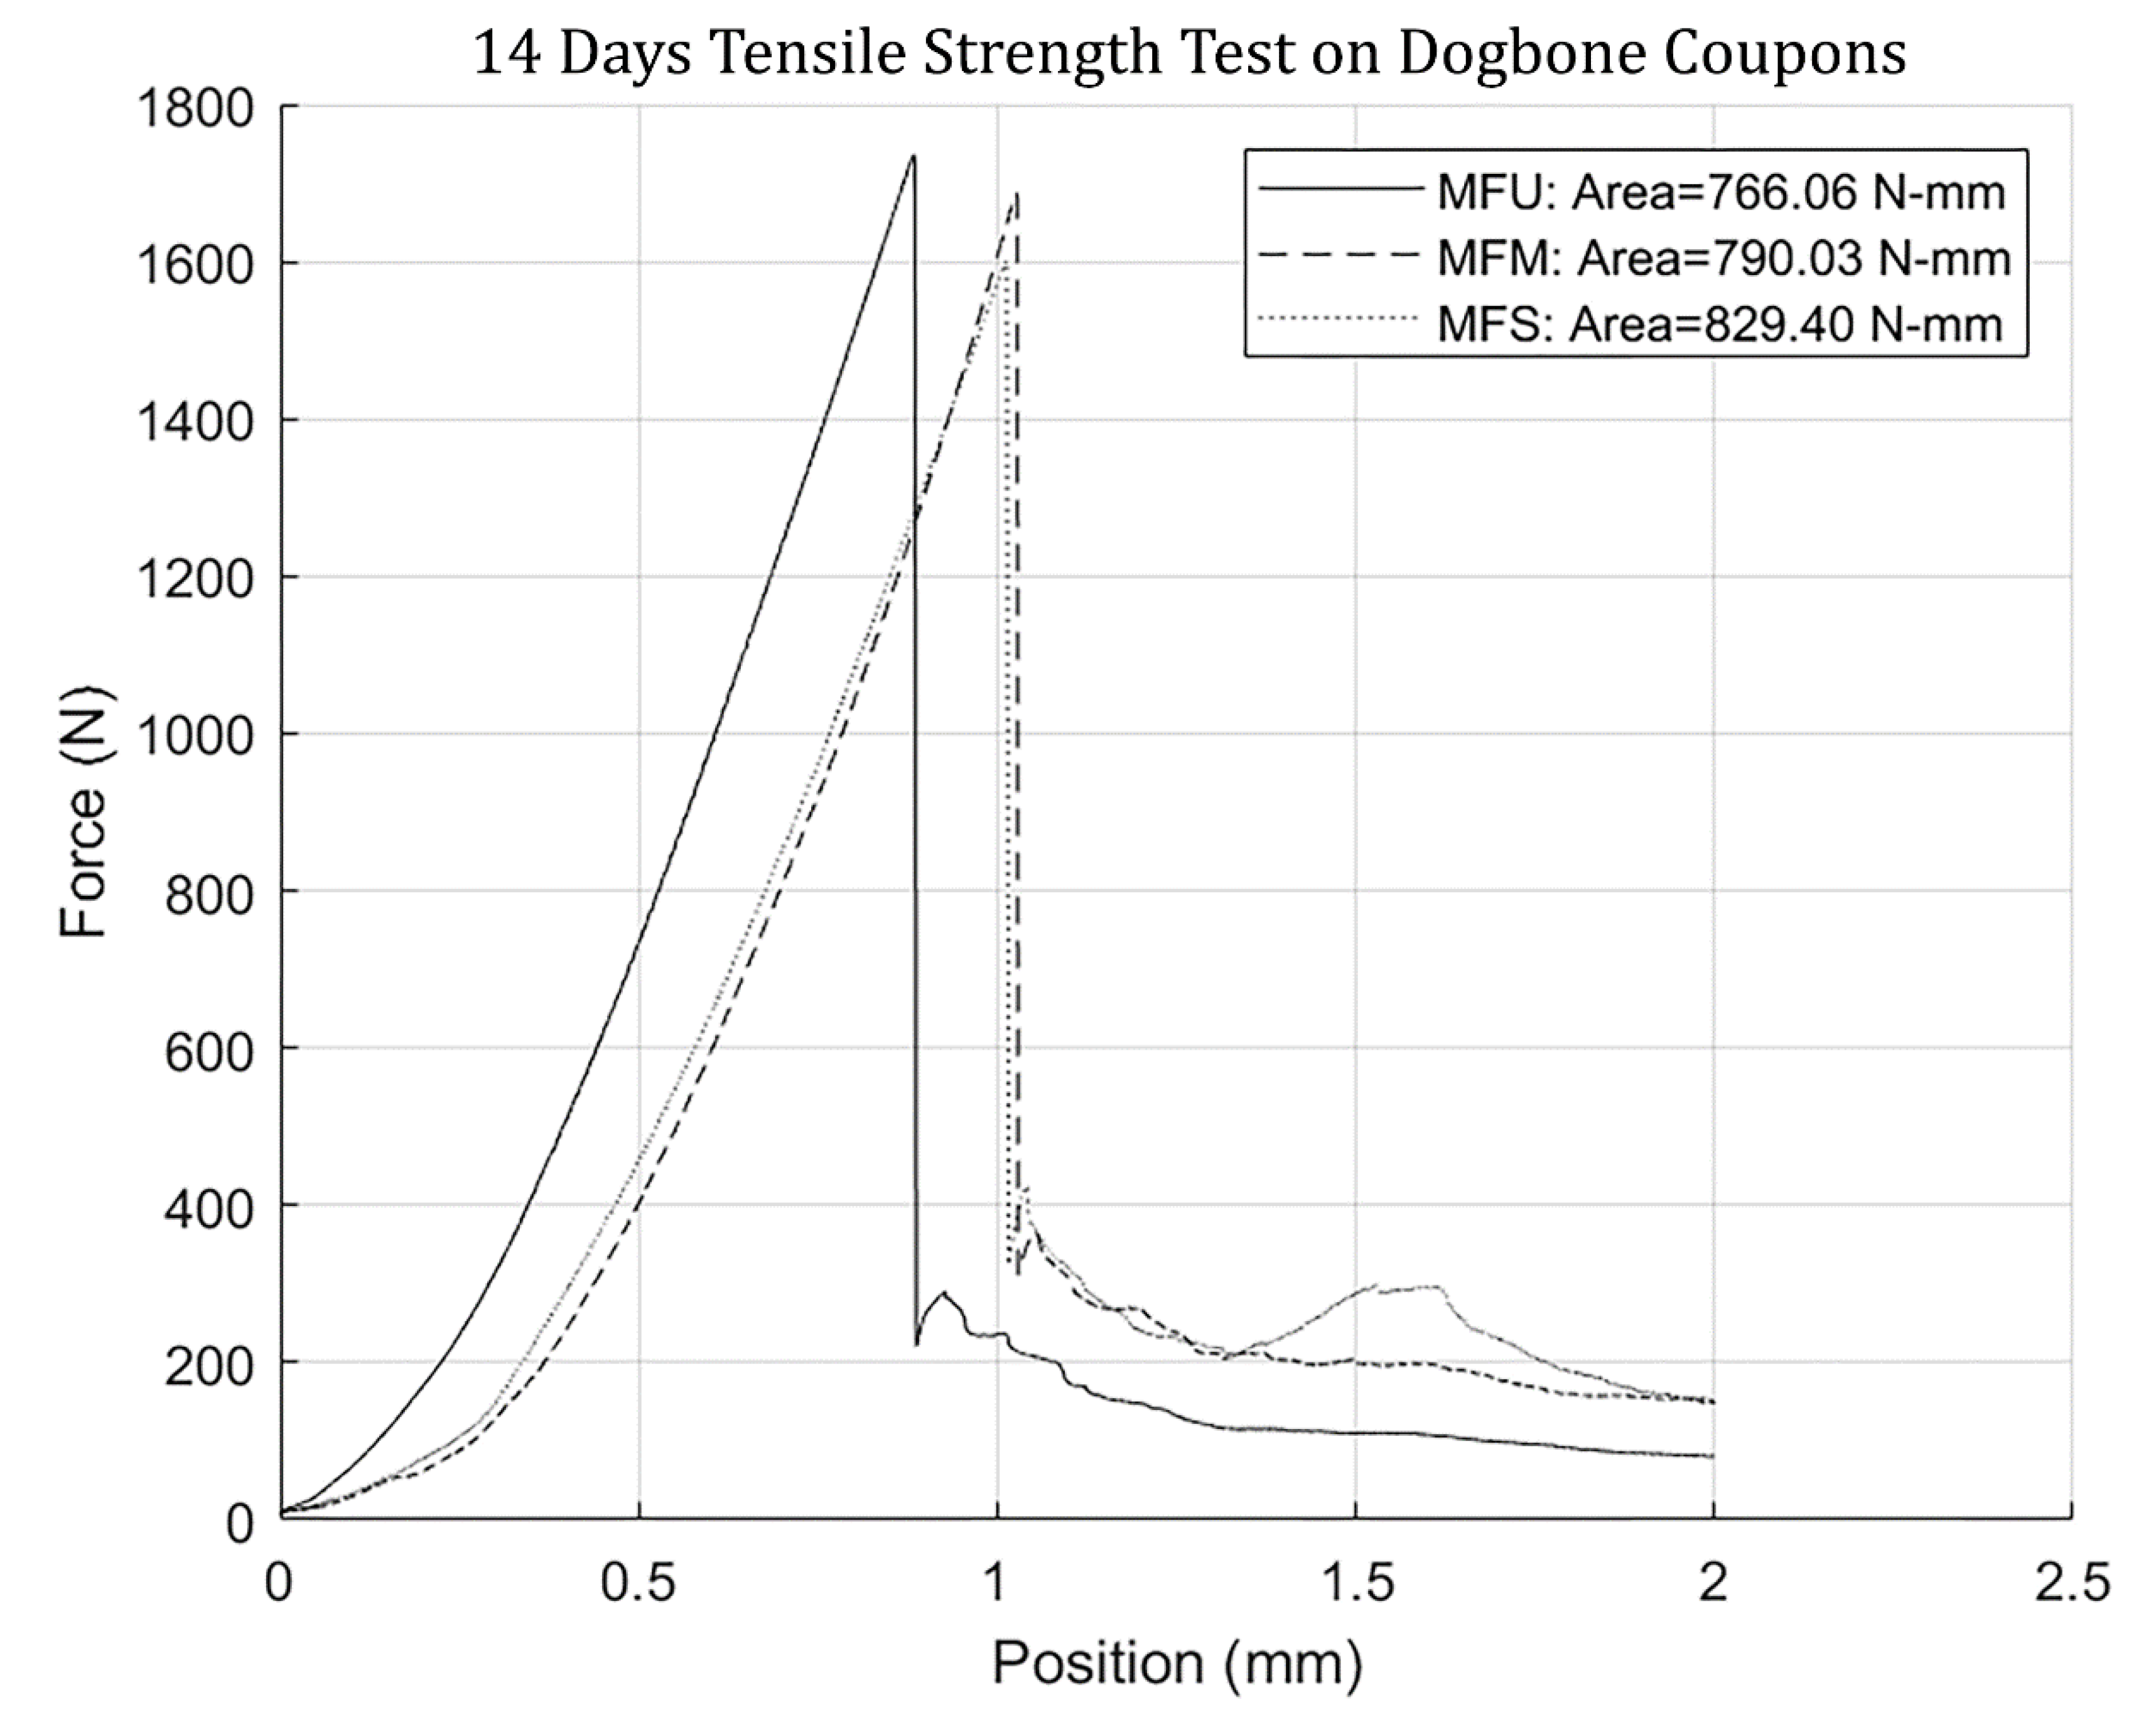
The area under the tensile curve (Figure 11) represents the toughness of the specimens. Toughness of MFU, MFM, and MFS samples was 766.06, 790.03, and 829.40 N-mm, respectively. Samples reinforced with treated fiber (including MFM and MFS) showed ductile behavior, and the toughness value is slightly higher than that of untreated fibers coupons (MFU). Albeit, this is not a significant improvement and may not be representative of all the samples. This aspect needs to be studied in future studies.
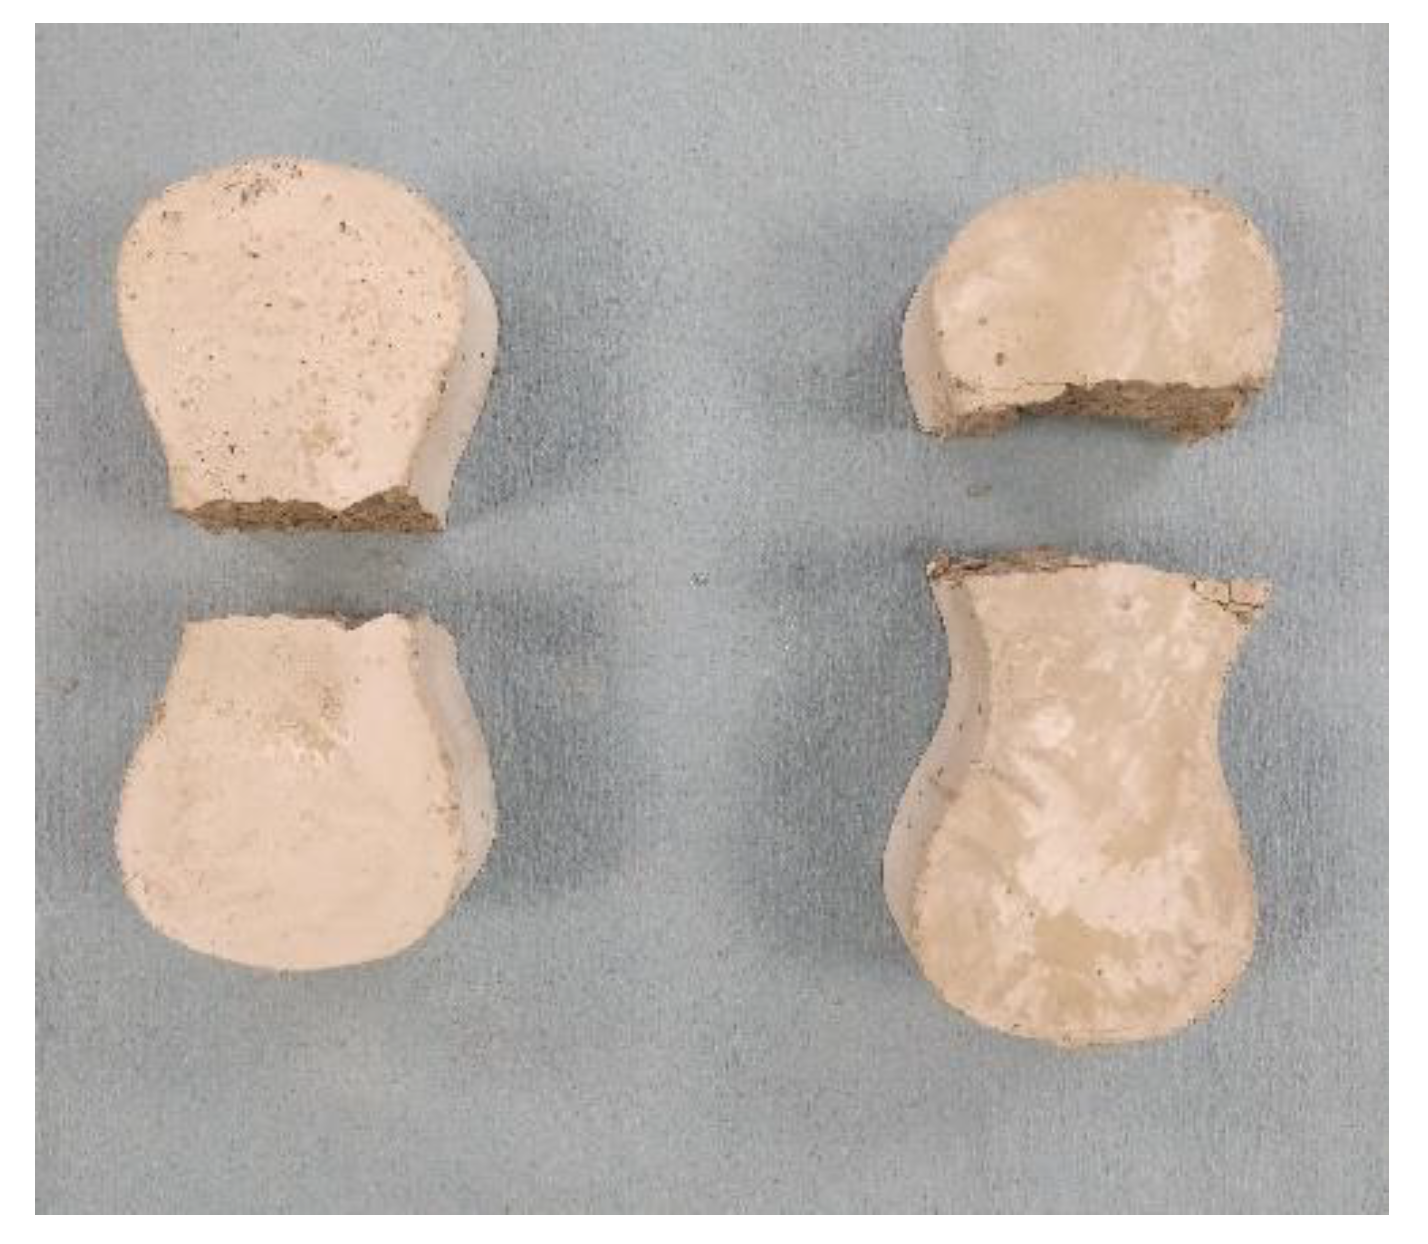
Fiber-reinforced samples using laboratory prepared fibers (MFU, MFA, MFM, and MFS) exhibited ductile fracture after reaching peak loads. The fracture planes resembled ductile fracture patterns observed in metals subjected to uniaxial tension. This is a possible indicator of the shift to plastic failure on adding fibers as opposed to brittle failure in unreinforced samples (MC) (Figure 12). These results were typical for most of the fiber-reinforced samples tested under direct tension.
3.3. Flexural Strength
Figure 13 shows a schematic diagram of the three-point bending test. The modulus of rupture was calculated using the following formula:
where = modulus of rupture in MPa, P = peak load applied on the beam in N, S = support span in mm (kept constant at 88 mm for the study), b = width of the beam ( 30 mm), and d = depth of the beam (30 mm).
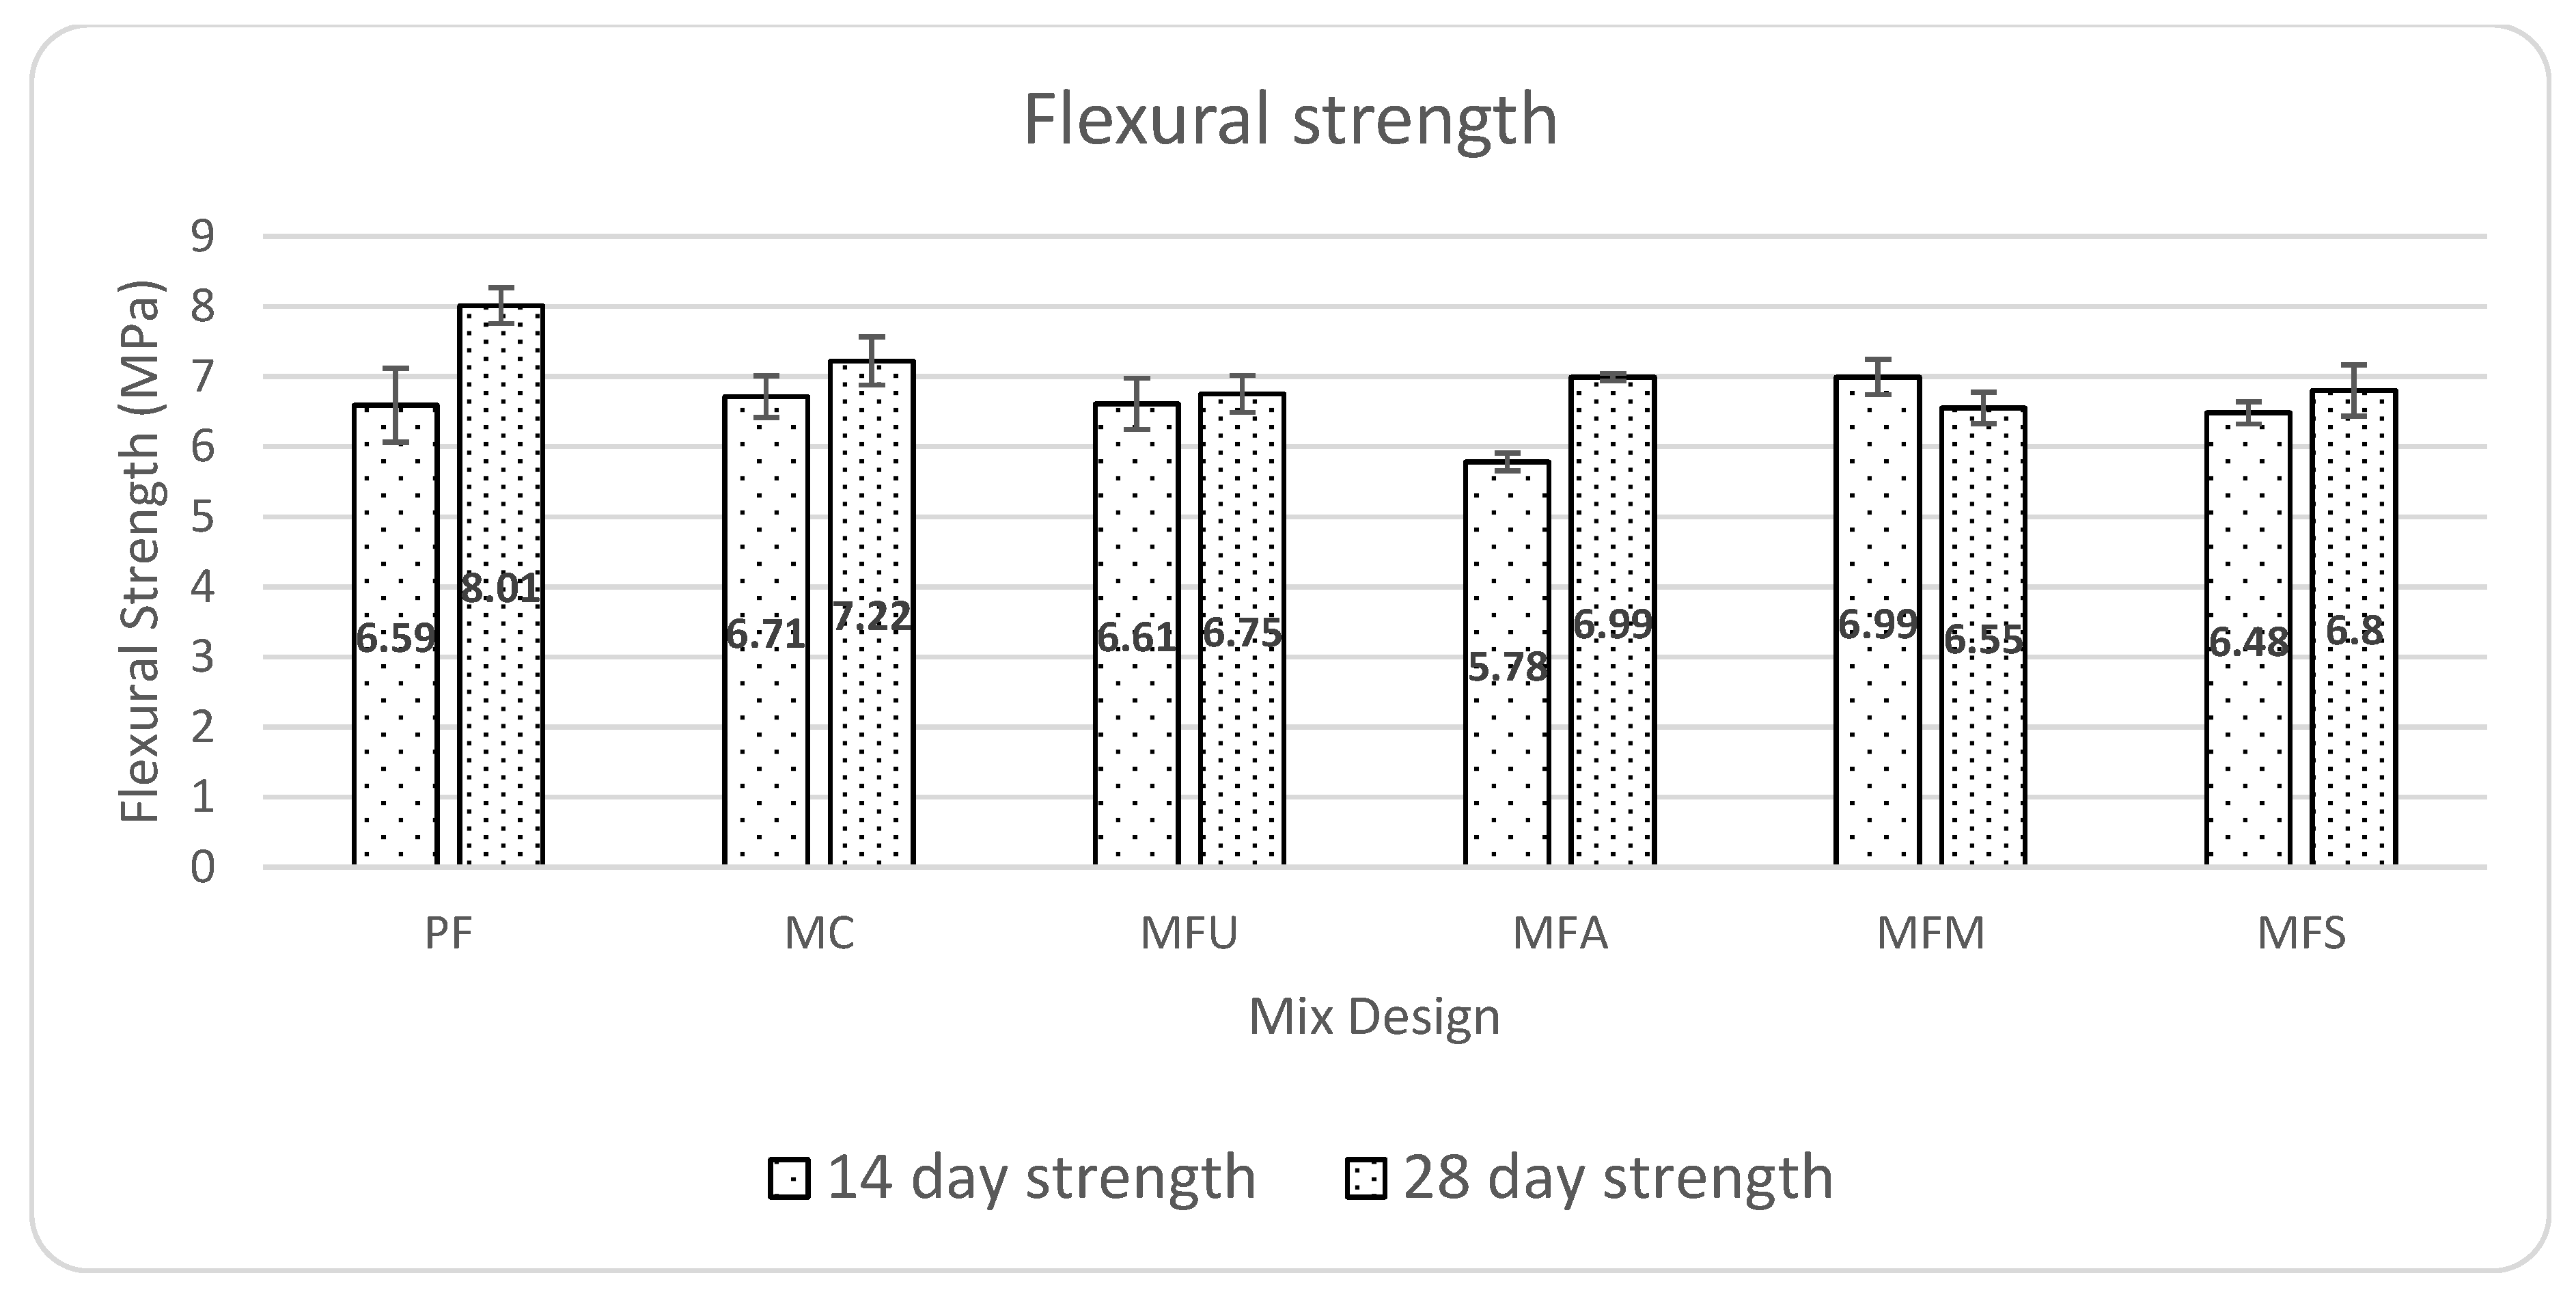
Figure 14 shows the flexural strength results of the mortar beams for all the mixes measured at both 14- and 28-day strength. Average flexural strength is presented for various mixes with error bars.
Considering the first peak behavior, the results do not indicate any significant change in the modulus of rupture after the addition of fibers. This might be a consequence of the low dosage of fibers (0.2% by binder weight), which, in turn, means that the surface area of fiber coated with the SCM is small. Other researchers [45] reported an improvement of as small as 1.94% when 5% metakaolin was replaced in OPC. This indicates that the addition of small amounts of metakaolin does not have a significant impact on the bending strength of concrete.
One possible reason for the relatively neutral response of the flexural strength to the coating could be the poor workability. On addition of polypropylene fibers, the workability of cementitious composites reduces with an increase in the dosage of fibers [46,47]. The reduced workability is a likely factor that prevented proper compaction and placement of the mix in the small beam molds. This might have led to the reduced strength when coated fibers were used in the mix.
3.4. Optical Microscopy
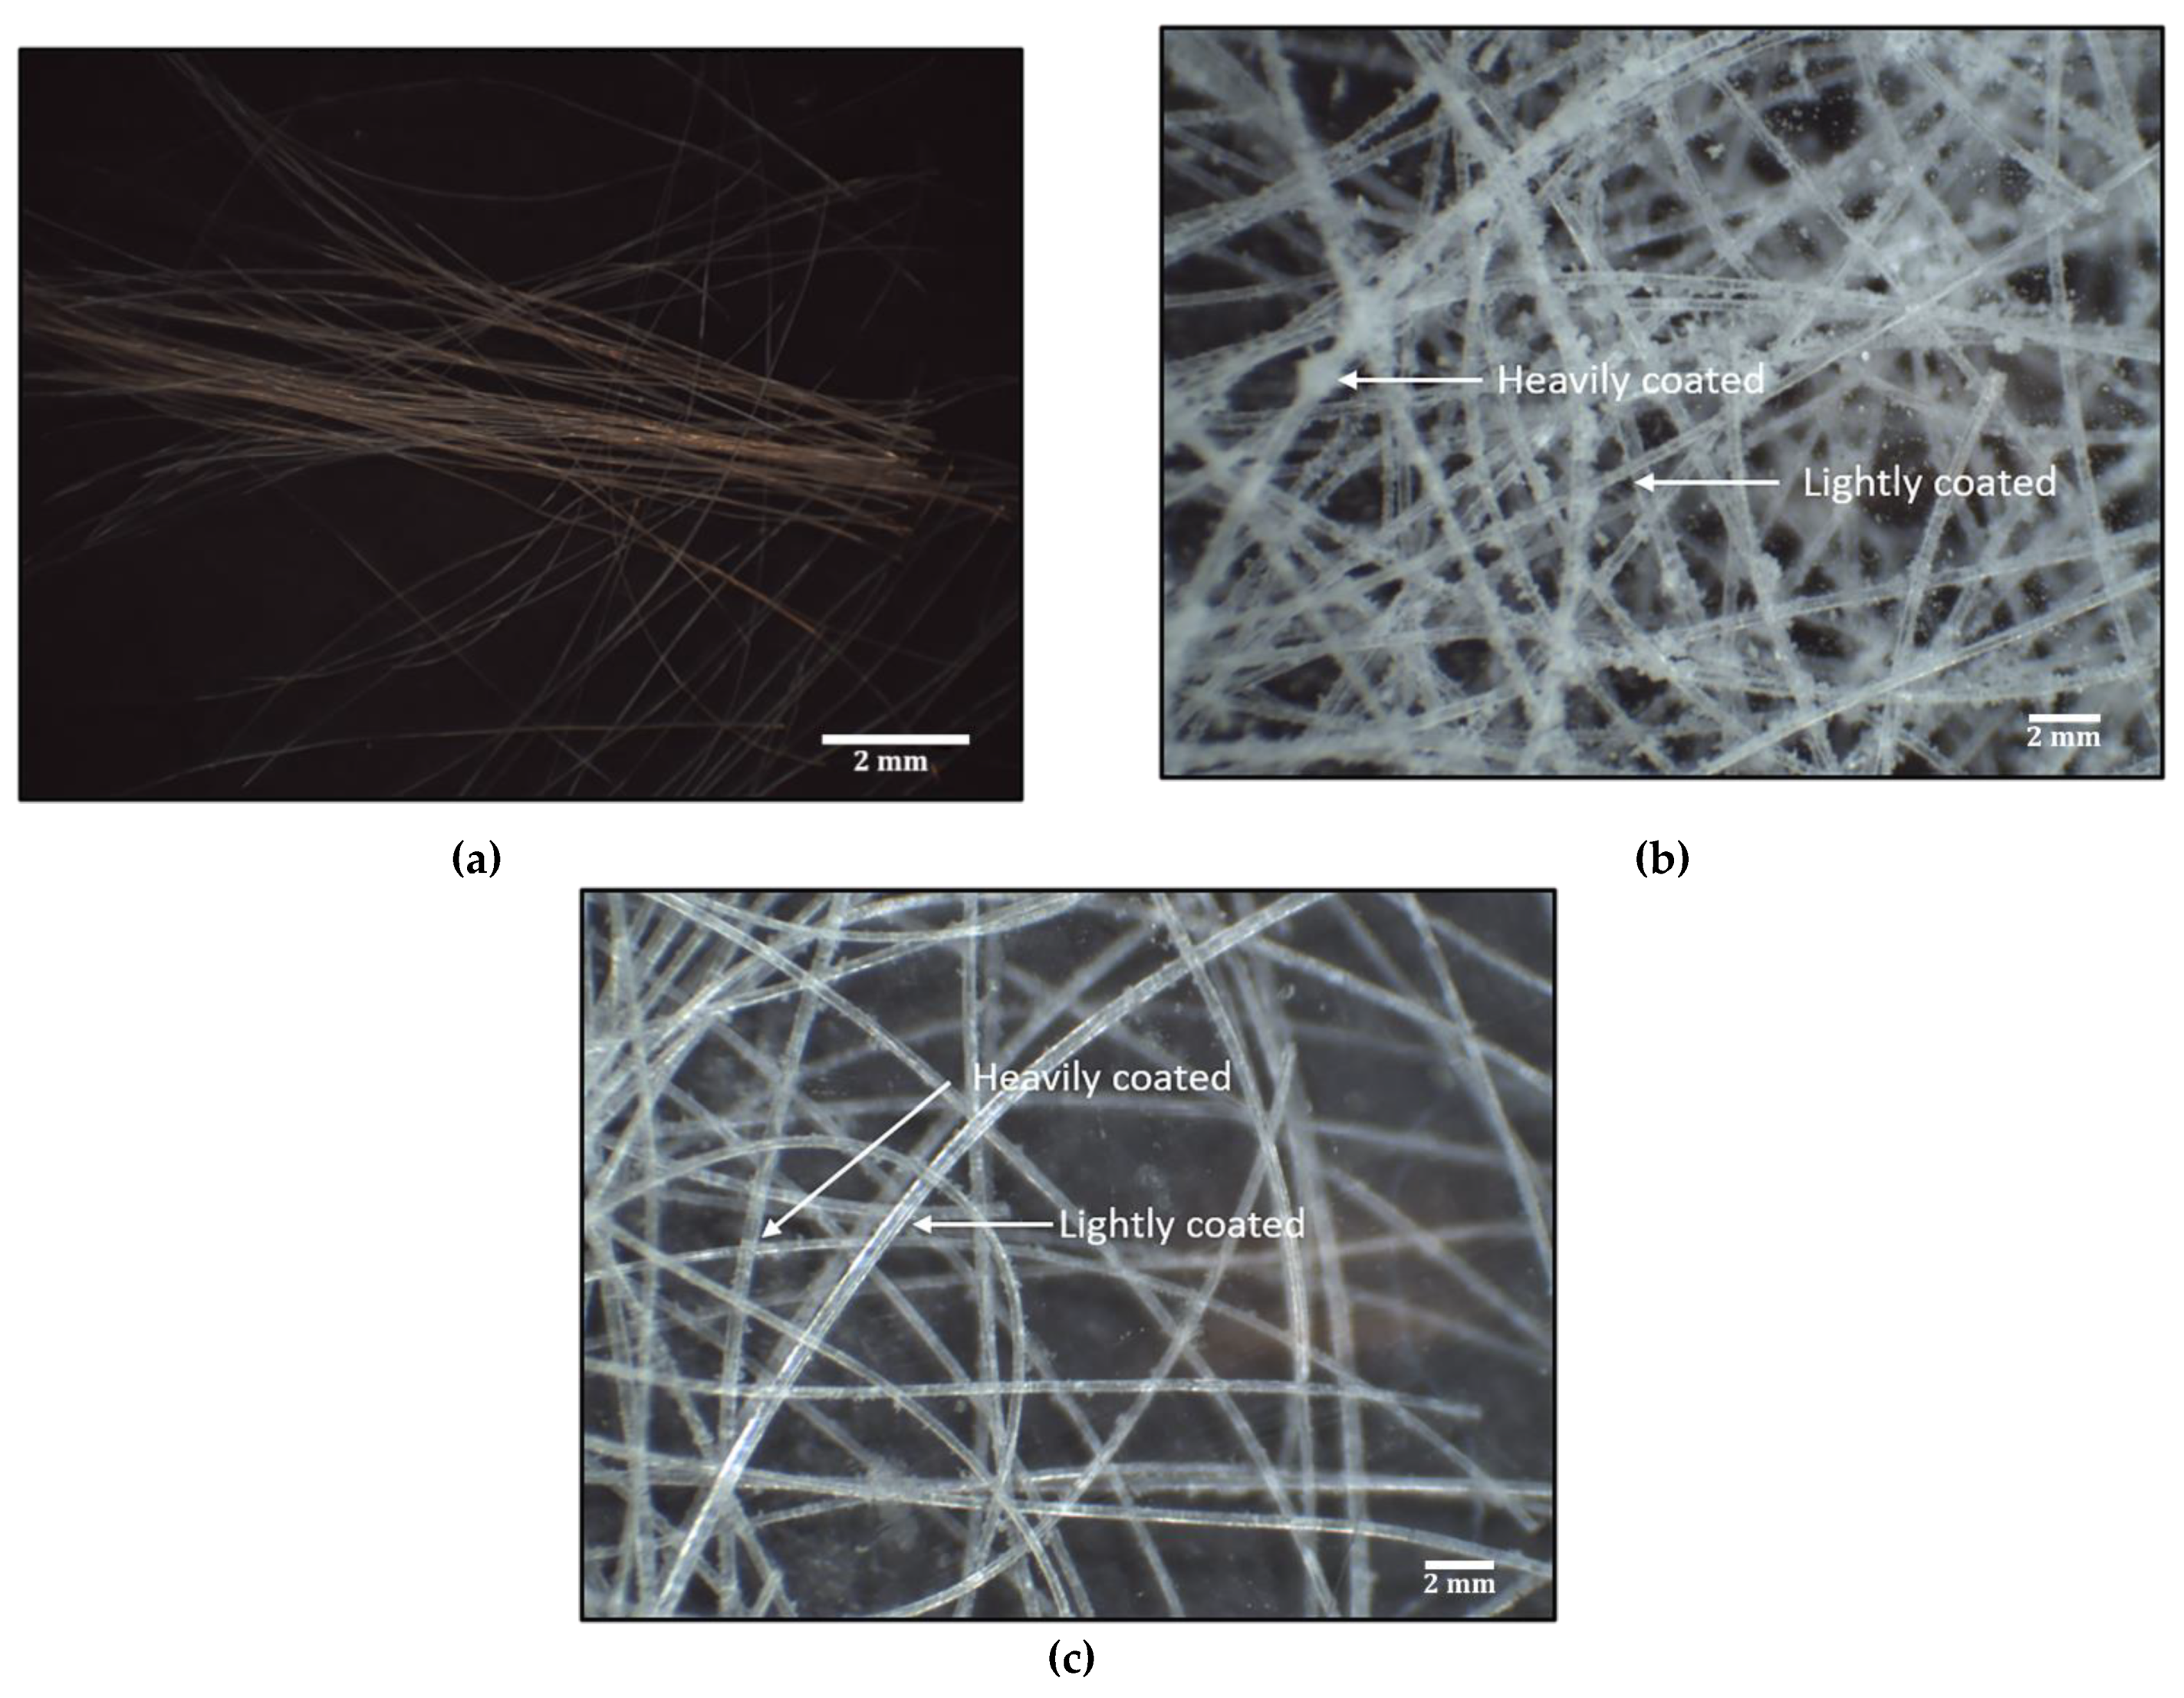
Figure 15 shows a preliminary investigation on the coated fiber samples using optical microscopy. A scale bar is also included in the images. Figure 15a shows virgin untreated polypropylene fibers without any coating, Figure 15b shows polypropylene fibers treated with metakaolin coating, and Figure 15c shows silica fume-coated polypropylene samples. Visually in Figure 15b,c, it appears that the fiber is uniformly coated either heavily or lightly with the SCM. Even distribution and uniformity of pozzolan material is further investigated under an SEM in Section 3.5.
3.5. Scanning Electron Microscopy
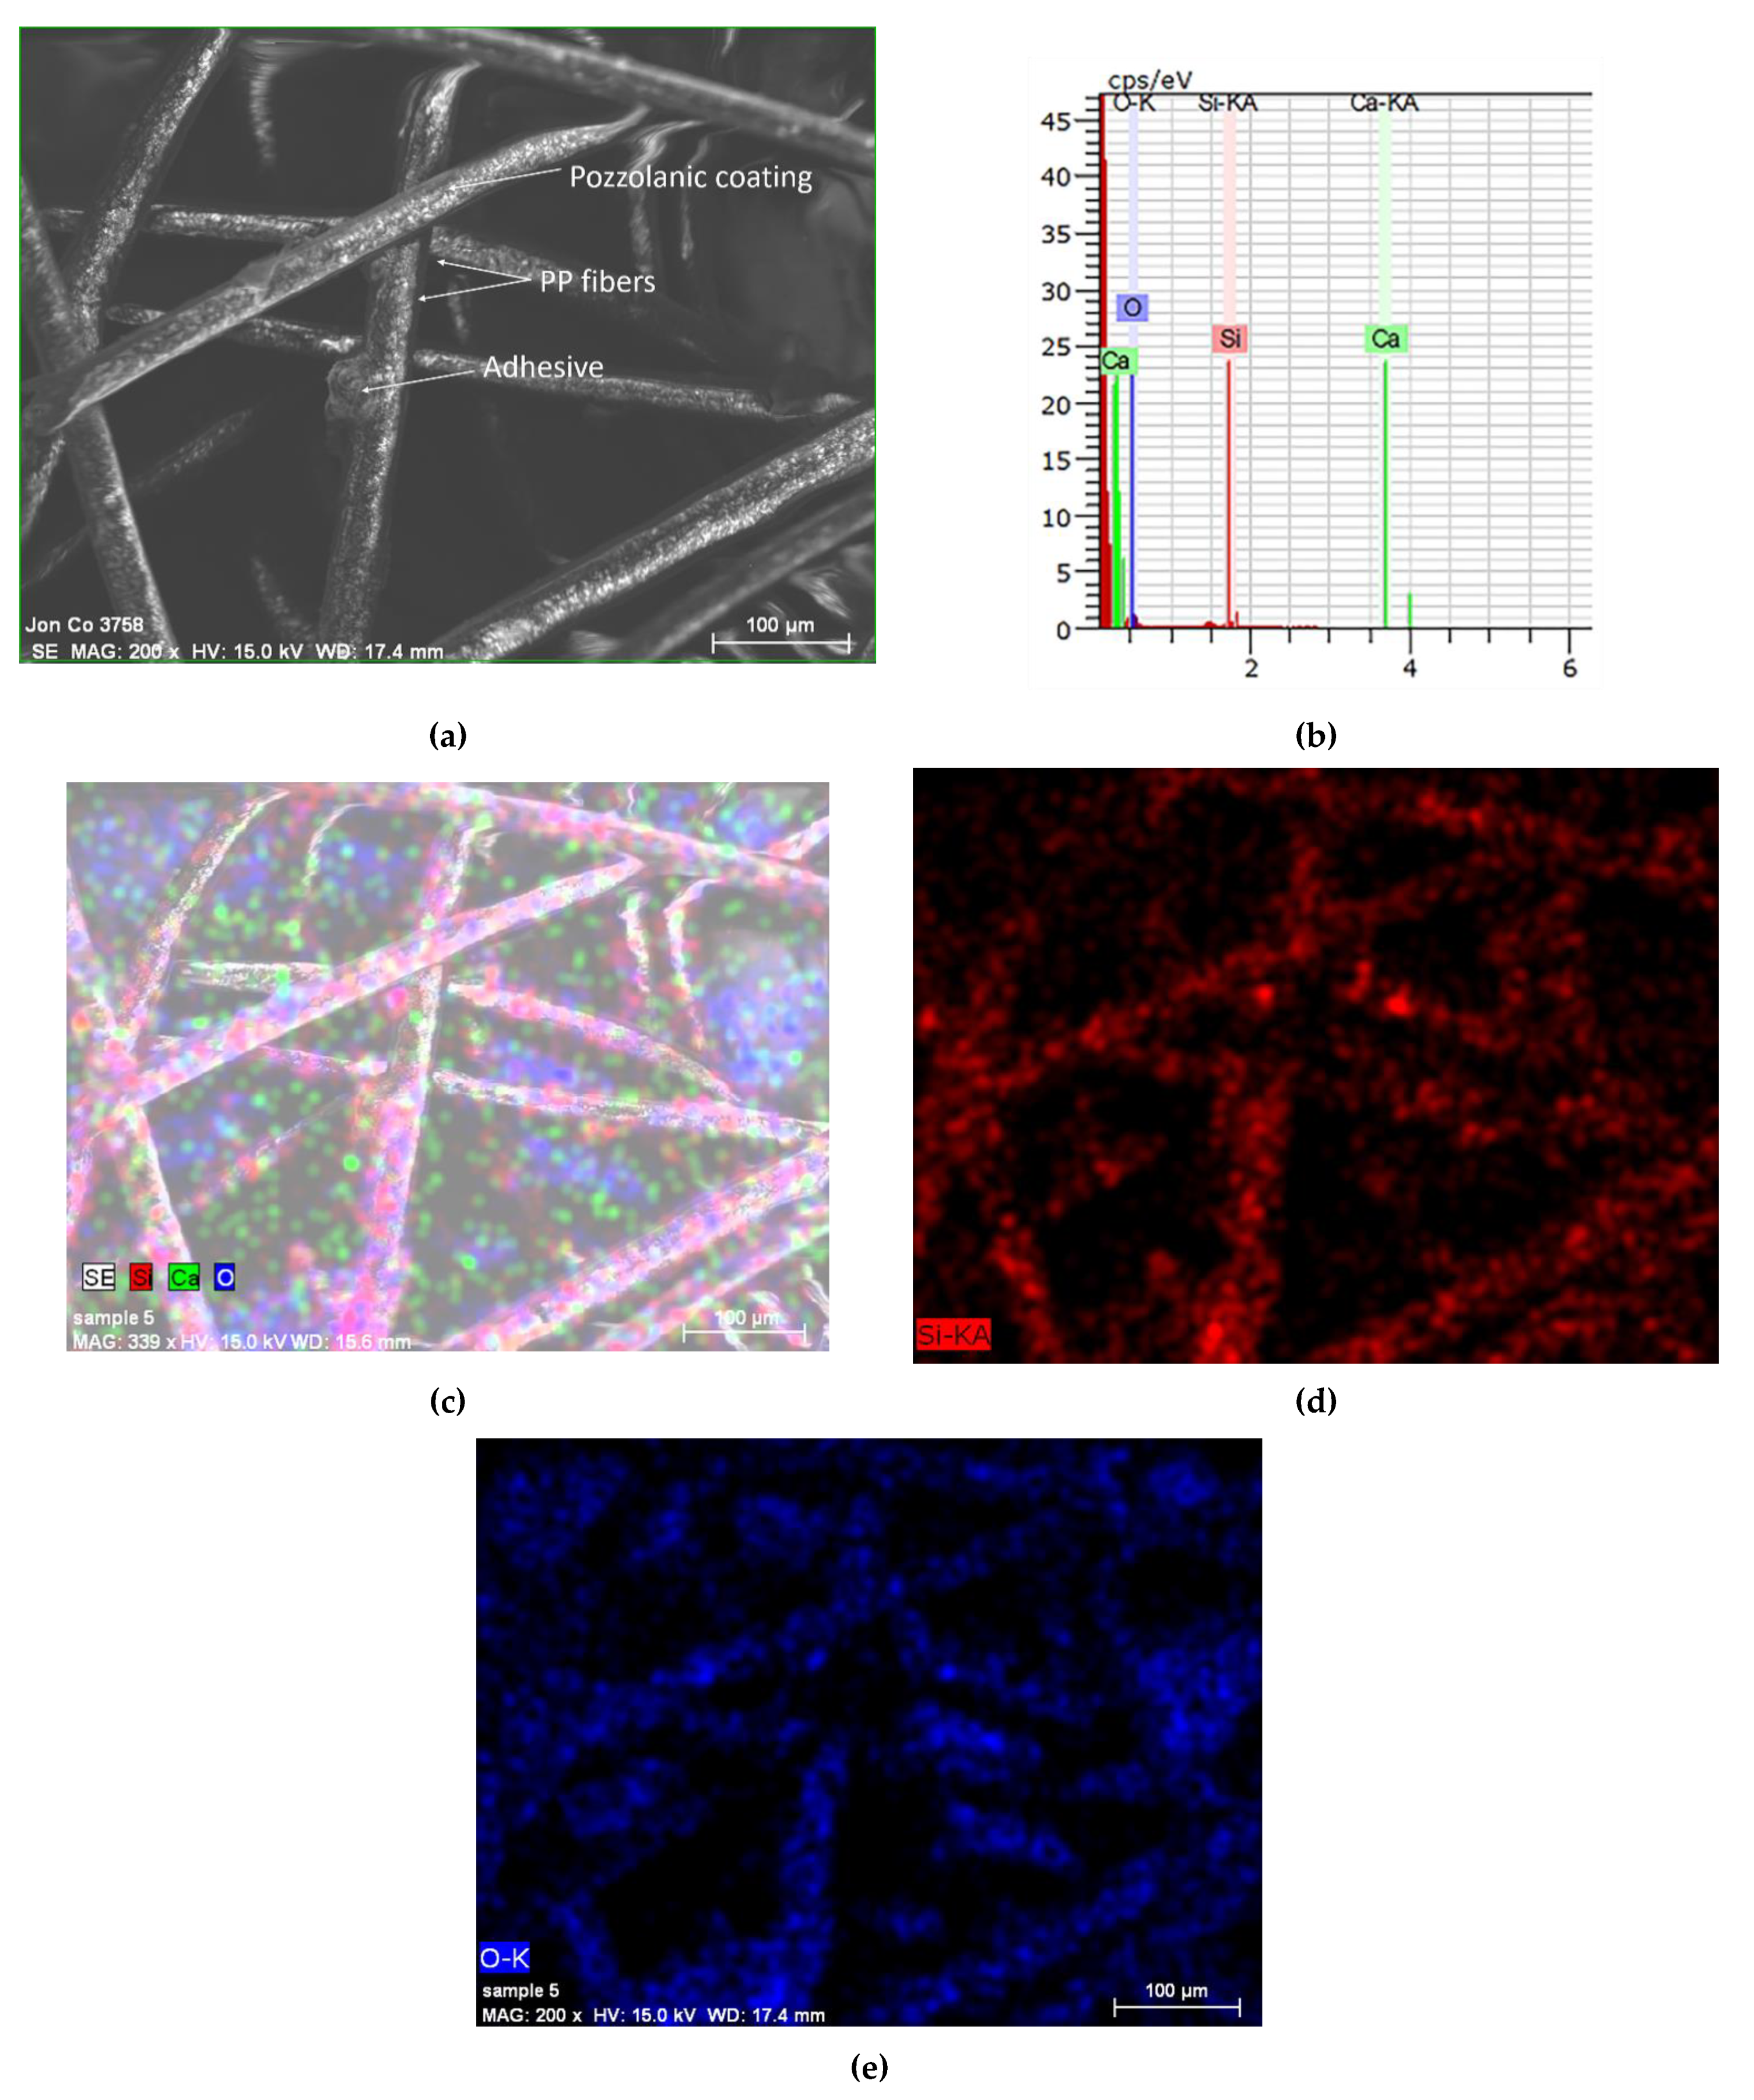
After the SCM coating procedure was carried out on fibers, they were analyzed under an SEM and energy dispersive X-ray spectroscopy (EDS). The microscopy images revealed the presence of a varying concentration of SCM on the fiber surface. However, pozzolanic materials seem to be present throughout the surface. Since the effect of ITZ is progressive and is most significant in the first 15–20 µm closest to the reinforcement [6], even a small amount of coating can be sufficient to provide the desired results. The evenness of the coating was not visible using optical microscopy owing to the fine nature of the particles of the SCMs used; however, it was evident under the SEM. Figure 16a distinctly shows the coating of metakaolin as brighter spots on the surface of the fiber. Bruker Quantax (EDS) System was used for X-ray spectroscopy to reveal the elements in the sample. The spectroscopy revealed peaks corresponding to elements such as silicon, oxygen, and calcium. The equipment demonstrates the ability to show the true spatial distribution of each element of interest in the given sample. The magnification level was set at 200× with an accelerating voltage of 15 kV and a working distance of 17.4 mm for the parent image. Using Figure 16a as the parent image, elemental mapping was done on it to reveal the positioning of the elements which showed spectrum peaks (Figure 16b). The elemental mapping revealed the positioning of silicon (shown in Figure 16d) and oxygen (shown in Figure 16e) from the pozzolan (metakaolin) on the fiber surface. As indicated by the datasheet of metakaolin and other studies [48], it was inferred that the primary components in metakaolin were oxides of aluminum and silicon. Elements such as silicon and oxygen, which corresponded to the peaks in Figure 16b, are seen with their spatial distribution in Figure 16d,e. Figure 16d,e shows the distribution of the constituents of the SCM. Outline of the fibers in the parent image can be made out in the images showing elemental mapping, indicating the presence of SCM on the surface of the fiber.
4. Conclusions and Recommendations
Based on the study conducted, the following conclusions are drawn:
- The compressive strength improved on addition of metakaolin-coated fibers when comparing MFU and MFM samples. In this study, by using 1/25th of the amount of metakaolin used in other studies, the strength increased by 13.47% as compared to the reported 3.27%.
- The compressive strength of a cementitious composite is affected by not only the amount of SCM but also by the position they occupy in the matrix. By concentrating the SCM on the parts of the matrix where it is needed the most (boundaries of the reinforcement), an improvement of strength can be achieved by using a fraction of the SCM material.
- PF mixture showed the highest strengths both at 14 and 28 days of curing. The relatively high strength in mix PF indicates the presence of an inclusive and compatible mix of fibers by the supplier. This may be further confirmed with the microscopic investigation of Mix P. The material sample of PF mix studied under microscopy showed better dispersion and presence of finer fibers (~15 µ).
- The bending strength tests did not show any significant improvement with the addition of fibers. This was attributed to the small dosage of fibers and low amounts of SCM.
- Spectroscopy on the coated fibers indicated that the surface treatment procedure used in this study successfully coated the PP fibers with SCMs.
- Recommendations for future work include using higher strength fibers at higher dosages to study the effectiveness of fiber coating explicitly. Additionally, developing and modifying existing methods to quantify the improvement in fiber–matrix bond interactions accurately, such as using a core cutter method or fiber pullout method may be done. Conducting 56-day tests to allow for complete interaction between the coated fibers and released lime to take place may also be studied.
Supplementary Materials
The following are available online at https://0-www-mdpi-com.brum.beds.ac.uk/2504-477X/4/2/53/s1, Figure S1: (a) AmScope © Trinocular stereo zoom microscope setup and (b) Hitachi S-4800 FESEM.; Table S1: polypropylene fiber properties; Table S2: chemical composition of Mix M; Table S3: chemical composition of Mix P; Table S4: physical properties of metakaolin; Table S5: physical properties of silica fume; and Table S6: chemical composition of the adhesive.
Author Contributions
Conceptualization, R.G.; methodology, R.B., R.G., and B.W.; software, R.B.; validation, R.B. and B.W.; formal analysis, R.B. and B.W.; investigation, R.B.; resources, R.B.; data curation, R.B.; writing—original draft preparation, R.B.; writing—review and editing, B.W. and R.G.; visualization, R.B. and B.W.; supervision, R.G.; project administration, R.G.; and funding acquisition, R.G. and B.W. All authors have read and agreed to the published version of the manuscript.
Funding
This research was funded by Natural Sciences and Engineering Research Council of Canada (NSERC), grant number CRDPJ 533917-18.
Acknowledgments
Financial support of Natural Sciences and Engineering Research Council of Canada (NSERC) is greatly appreciated. Involvement and guidance of Terry Bergen and Peter Dias from Read Jones Christoffersen Ltd. is also acknowledged. Assistance from technical staff Armando Tura and Geoff Burton is gratefully acknowledged. Assistance and inputs provided by Maryam Monazami is greatly appreciated. Assistance and guidance provided by Jonathan Rudge during SEM imaging is greatly acknowledged.
Conflicts of Interest
The authors declare no conflicts of interest.
References
- Signorini, C.; Sola, A.; Malchiodi, B.; Nobili, A.; Gatto, A. Failure mechanism of silica coated polypropylene fibres for Fibre Reinforced Concrete (FRC). Constr. Build. Mater. 2020, 236, 117549. [Google Scholar] [CrossRef]
- Usman, M.; Farooq, S.H.; Umair, M.; Hanif, A. Axial compressive behavior of confined steel fiber reinforced high strength concrete. Constr. Build. Mater. 2020, 230, 117043. [Google Scholar] [CrossRef]
- Zollo, R.F. Fiber-reinforced concrete: An overview after 30 years of development. Cem. Concr. Compos. 1997, 19, 107–122. [Google Scholar] [CrossRef]
- Nobili, A.; Lanzoni, L.; Tarantino, A.M. Experimental investigation and monitoring of a polypropylene-based fiber reinforced concrete road pavement. Constr. Build. Mater. 2013, 47, 888–895. [Google Scholar] [CrossRef] [Green Version]
- Lanzoni, L.; Nobili, A.; Tarantino, A.M. Performance evaluation of a polypropylene-based draw-wired fibre for concrete structures. Constr. Build. Mater. 2012, 28, 798–806. [Google Scholar] [CrossRef]
- Scrivener, K.; Crumbie, A.K.; Laugesen, P. The Interfacial Transition Zone (ITZ) Between Cement Paste and Aggregate in Concrete. Interface Sci. 2004, 12, 411–421. [Google Scholar] [CrossRef]
- Diamond, S.; Huang, J. The ITZ in concrete—a different view based on image analysis and SEM observations. Cem. Concr. Compos. 2001, 23, 179–188. [Google Scholar] [CrossRef]
- Mondal, P.; Shah, S.P.; Marks, L.D. Nanomechanical Properties of Interfacial Transition Zone in Concrete. In Nanotechnology in Construction 3; Springer Science and Business Media LLC: Berlin/Heidelberg, Germany, 2009; pp. 315–320. [Google Scholar]
- Felekoğlu, B.; Tosun, K.; Baradan, B. A comparative study on the flexural performance of plasma treated polypropylene fiber reinforced cementitious composites. J. Mater. Process. Technol. 2009, 209, 5133–5144. [Google Scholar] [CrossRef]
- Singh, S.; Shukla, A.; Brown, R. Pullout behavior of polypropylene fibers from cementitious matrix. Cem. Concr. Res. 2004, 34, 1919–1925. [Google Scholar] [CrossRef]
- Cheng, K.-B.; Liu, J.-Y.; Hwang, J.-F.; Lee, M.-H.; Hsieh, C.-C. Study on the electrical and surface properties of Polyamide 6 woven fabrics using pen-type radio frequency plasma treatment. J. Ind. Text. 2011, 41, 185–200. [Google Scholar] [CrossRef]
- Morent, R.; De Geyter, N.; Verschuren, J.; De Clerck, K.; Kiekens, P.; Leys, C. Non-thermal plasma treatment of textiles. Surf. Coatings Technol. 2008, 202, 3427–3449. [Google Scholar] [CrossRef]
- Trejbal, J.; Nežerka, V.; Somr, M.; Fladr, J.; Potocký, Š.; Artemenko, A.; Tesarek, P. Deterioration of bonding capacity of plasma-treated polymer fiber reinforcement. Cem. Concr. Compos. 2018, 89, 205–215. [Google Scholar] [CrossRef]
- Arias, J.P.M.; Vazquez, A.; Escobar, M.M. Use of sand coating to improve bonding between GFRP bars and concrete. J. Compos. Mater. 2012, 46, 2271–2278. [Google Scholar] [CrossRef]
- Guglielmi, M. Sol-gel science. Mater. Chem. Phys. 1990, 26, 211–212. [Google Scholar] [CrossRef]
- Bakera, A.T.; Alexander, M.G. Use of metakaolin as supplementary cementitious material in concrete, with focus on durability properties. RILEM Tech. Lett. 2019, 4, 89–102. [Google Scholar] [CrossRef] [Green Version]
- Badogiannis, E.; Sfikas, I.; Voukia, D.V.; Trezos, K.G.; Tsivilis, S.G. Durability of metakaolin Self-Compacting Concrete. Constr. Build. Mater. 2015, 82, 133–141. [Google Scholar] [CrossRef]
- Guo, Z.; Jiang, T.; Zhang, J.; Kong, X.; Chen, C.; Lehman, D.E. Mechanical and durability properties of sustainable self-compacting concrete with recycled concrete aggregate and fly ash, slag and silica fume. Constr. Build. Mater. 2020, 231, 117115. [Google Scholar] [CrossRef]
- Khatri, R.; Sirivivatnanon, V.; Gross, W. Effect of different supplementary cementitious materials on mechanical properties of high performance concrete. Cem. Concr. Res. 1995, 25, 209–220. [Google Scholar] [CrossRef]
- Lothenbach, B.; Scrivener, K.; Hooton, R. Supplementary cementitious materials. Cem. Concr. Res. 2011, 41, 1244–1256. [Google Scholar] [CrossRef]
- Ping, X.; Beaudoin, J. Modification of transition zone microstructure—Silica fume coating of aggregate surfaces. Cem. Concr. Res. 1992, 22, 597–604. [Google Scholar] [CrossRef]
- Mindess, S. Bonding in Cementitious Composites: How Important is it. MRS Proc. 1987, 114, 3. [Google Scholar] [CrossRef]
- Cheng-Yi, H.; Feldman, R. Hydration reactions in portland cement-silica fume blends. Cem. Concr. Res. 1985, 15, 585–592. [Google Scholar] [CrossRef] [Green Version]
- Ganesh, Y.S.V.; Durgaiyya, P.; Shivanarayana, C.; Prasad, D.S.V. Compressive strength of concrete by partial replacement of cement with metakaolin. In Proceedings of the International Conference on Functional Materials, Characterization, Solid State Physics, Power, Thermal and Combustion Energy: FCSPTC-2017, Andhra Pradesh, India, 7–8 April 2017; Volume 1859, p. 20059. [Google Scholar]
- Narmatha, M.; Felixkala, T. Meta kaolin–The Best Material for Replacement of Cement in Concrete. IOSR J. Mech. Civ. Eng. 2016, 13, 66–71. [Google Scholar] [CrossRef]
- Chu, S.; Kwan, A. Co-addition of metakaolin and silica fume in mortar: Effects and advantages. Constr. Build. Mater. 2019, 197, 716–724. [Google Scholar] [CrossRef]
- Paiva, H.; Silva, A.M.D.S.; Velosa, A.; Cachim, P.; Ferreira, V. Microstructure and hardened state properties on pozzolan-containing concrete. Constr. Build. Mater. 2017, 140, 374–384. [Google Scholar] [CrossRef]
- Poon, C.; Kou, S.; Lam, L. Compressive strength, chloride diffusivity and pore structure of high performance metakaolin and silica fume concrete. Constr. Build. Mater. 2006, 20, 858–865. [Google Scholar] [CrossRef]
- Gupta, R. US Patent for Surface Treatment for Concrete Reinforcement Patent. U.S. Patent 9,908,813, 6 March 2018. [Google Scholar]
- Wang, B.; Gupta, R.; Dias, P.; Bergen, T. Coefficient of Permeability of Cement-based Repair Materials. In Proceedings of the First International Conference on New Horizons in Civil Engineering, Victoria, BC, Canada, 25–27 April 2018; p. 8. [Google Scholar]
- Al-Zahrani, A.M.; Maslehuddin, M.; Al-Dulaijan, S.; Ibrahim, M. Mechanical properties and durability characteristics of polymer- and cement-based repair materials. Cem. Concr. Compos. 2003, 25, 527–537. [Google Scholar] [CrossRef]
- Durability Performance of Repaired Reinforced Concrete Beams. ACI Mater. J. 1994, 91. [CrossRef]
- Fibermesh- Concrete Solutions by Propex, “Fibermesh150-12mmDatasheet.pdf”. Available online: http://www.rindler-gmbh.at/data-rindler/uploads/hotlinks_appfilelink/Fibermesh150-12mmDatasheet.pdf (accessed on 26 January 2020).
- Burgess Pigment, “Calcined Aluminum Silicate”. Available online: https://www.burgesspigment.com/tds/burgess-optipozz/?pdf=true (accessed on 26 January 2020).
- Kryton International Inc. “TDS-Con-Fume.pdf”. Available online: https://www.kryton.com/technical-info/technical-data-sheets/TDS-Con-Fume.pdf (accessed on 26 January 2020).
- 3M, “Safety Data Sheet: 3M(TM) Super 77(TM) Multipurpose Adhesive (Aerosol)”. Available online: https://multimedia.3m.com/mws/mediawebserver?mwsId=SSSSSuUn_zu8l00x482xN8mvNv70k17zHvu9lxtD7SSSSSS-- (accessed on 26 January 2020).
- C01 Committee Test Method for Compressive Strength of Hydraulic Cement Mortars (Using 2-in. or [50-mm] Cube Specimens). ASTM Int. 2016. [CrossRef]
- D01 Committee Test Method for Tensile Strength of Chemical-Resistant Mortar, Grouts, and Monolithic Surfacings. ASTM Int. 2018. [CrossRef]
- Wild, S.; Khatib, J.; Jones, A. Relative strength, pozzolanic activity and cement hydration in superplasticised metakaolin concrete. Cem. Concr. Res. 1996, 26, 1537–1544. [Google Scholar] [CrossRef]
- Dinakar, P.; Sahoo, P.K.; Sriram, G. Effect of Metakaolin Content on the Properties of High Strength Concrete. Int. J. Concr. Struct. Mater. 2013, 7, 215–223. [Google Scholar] [CrossRef] [Green Version]
- Wild, S.; Khatib, J. Portlandite consumption in metakaolin cement pastes and mortars. Cem. Concr. Res. 1997, 27, 137–146. [Google Scholar] [CrossRef]
- Khatib, J.; Baalbaki, O.; Elkordi, A.A. Metakaolin. In Waste and Supplementary Cementitious Materials in Concrete; Elsevier BV: Amsterdam, The Netherlands, 2018; pp. 493–511. [Google Scholar]
- Gameiro, A.; Silva, A.M.D.S.; Faria, P.; Grilo, J.; Branco, T.; Veiga, M.D.R.D.S.; Velosa, A. Physical and chemical assessment of lime–metakaolin mortars: Influence of binder:aggregate ratio. Cem. Concr. Compos. 2014, 45, 264–271. [Google Scholar] [CrossRef] [Green Version]
- Zou, D.; Li, K.; Xie, S.; Liu, Y.; Ren, W.; Shi, L.; Liu, Z. Feasibility of assessing segregation in internally cured mortar based on the variation of properties. Constr. Build. Mater. 2017, 147, 750–757. [Google Scholar] [CrossRef]
- Qian, X.; Li, Z. The relationships between stress and strain for high-performance concrete with metakaolin. Cem. Concr. Res. 2001, 31, 1607–1611. [Google Scholar] [CrossRef]
- Ahmed, T.A.H.; Daoud, O.M.A. Influence of Polypropylene Fibres on Concrete Properties. IOSR J. Mech. Civ. Eng. 2016, 13, 9–20. [Google Scholar] [CrossRef]
- Ibrahim, Y.A.; Maroof, N.R.; Abdulrahman, A.R. Influence of Polypropylene Fibre on Strength and Workability Properties of Cement Mortar. In Proceedings of the 2019 International Engineering Conference (IEC), Erbil, Iraq, 23–25 June 2019; pp. 221–226. [Google Scholar]
- Menshaz, A.M.; Johari, M.A.M.; Ahmad, Z.A. Characterization of metakaolin treated at different calcination temperatures. In Proceedings of the International Conference of Global Network for Innovative Technology and Awam International Conference in Civil Engineering (Ignite-Aicce’17): Sustainable Technology And Practice For Infrastructure and Community Resilience, Penang, Malaysia, 8–9 August 2017; Volume 1892, p. 20028. [Google Scholar]
Figure 1.
Scanning electron microscope (SEM) image showing polypropylene fiber, interfacial transition zone (ITZ), and mortar.
Figure 1.
Scanning electron microscope (SEM) image showing polypropylene fiber, interfacial transition zone (ITZ), and mortar.

Figure 2.
Schematic diagram of the proposed method of improvement of ITZ.

Figure 3.
Chart showing the process of fiber preparation.

Figure 4.
Different mix designs with Mix M as the base material.

Figure 5.
Specimens cast for testing: (a) mortar cube, (b) beam, and (c) dog-bone/coupon.

Figure 6.
Details of the direct tensile strength test in progress.

Figure 7.
Details of the flexure strength test in progress.

Figure 8.
Arrangement of the displacement measuring set up for beams.

Figure 9.
Compressive Strength of different mixes at 14 and 28 days.

Figure 10.
Tensile strength of different mixes with 14 and 28 days strength.

Figure 11.
Load vs. displacement curves comparing untreated polypropylene fiber (MFU), metakaolin-treated fibers (MFM), and silica fume-coated fibers (MFS).
Figure 11.
Load vs. displacement curves comparing untreated polypropylene fiber (MFU), metakaolin-treated fibers (MFM), and silica fume-coated fibers (MFS).

Figure 12.
Brittle failure of unreinforced mortar mix, base material (MC) (left) and ductile cup and cone fracture for reinforced mortar, MFS (right).
Figure 12.
Brittle failure of unreinforced mortar mix, base material (MC) (left) and ductile cup and cone fracture for reinforced mortar, MFS (right).

Figure 13.
Schematic diagram of three-point bending test on mortar beam specimen.

Figure 14.
Flexural strength of different mixes with 14- and 28-days strength.

Figure 15.
Images showing various fibers used in the study: (a) untreated polypropylene (10× magnification) fiber, (b) polypropylene fiber coated with metakaolin (45× magnification), and (c) silica fume coated polypropylene fiber (45× magnification).
Figure 15.
Images showing various fibers used in the study: (a) untreated polypropylene (10× magnification) fiber, (b) polypropylene fiber coated with metakaolin (45× magnification), and (c) silica fume coated polypropylene fiber (45× magnification).

Figure 16.
SEM images of metakaolin-coated fibers (clockwise from top left): (a) image showing coating at 200× magnification, (b) spectrum showing the constituent peaks, (c) elemental map of oxygen and silicon, (d) elemental map of silicon only, and (e) elemental map showing oxygen only.
Figure 16.
SEM images of metakaolin-coated fibers (clockwise from top left): (a) image showing coating at 200× magnification, (b) spectrum showing the constituent peaks, (c) elemental map of oxygen and silicon, (d) elemental map of silicon only, and (e) elemental map showing oxygen only.


Table 1.
Different mix designs and the number of samples cast.
| SI No | Mixture | Mix ID | Water Content (% by Weight of the Repair Mortar) | Working Time (mins) | Fiber Type | Number of Samples Cast | ||
|---|---|---|---|---|---|---|---|---|
| Cubes | Coupons | Beams | ||||||
| 1 | Mix P (commercial mix with fibers) | PF | 17 | 5 | Commercial fiber-reinforced repair mortar | 6 | 6 | 6 |
| 2 | Mix M (control mix M without fibers) | MC | 10 | 45 | No fiber added | 6 | 6 | 6 |
| 3 | Mix M with untreated fibers | MFU | 10 | 45 | Micropolypropylene fibers with no coating | 6 | 6 | 6 |
| 4 | Mix M with adhesive-coated fibers | MFA | 10 | 45 | Micropolypropylene fibers coated with spray adhesive only | 6 | 6 | 6 |
| 5 | Mix M with metakaolin-coated fibers | MFM | 10 | 45 | Micropolypropylene fibers coated with spray adhesive and dusted with metakaolin | 6 | 6 | 6 |
| 6 | Mix M with silica fume-coated fibers | MFS | 10 | 45 | Micropolypropylene fibers coated with spray adhesive and dusted with silica fume | 6 | 6 | 8 |
© 2020 by the authors. Licensee MDPI, Basel, Switzerland. This article is an open access article distributed under the terms and conditions of the Creative Commons Attribution (CC BY) license (http://creativecommons.org/licenses/by/4.0/).
Share and Cite
MDPI and ACS Style
Bajaj, R.; Wang, B.; Gupta, R. Characterization of Enhanced ITZ in Engineered Polypropylene Fibers for Bond Improvement. J. Compos. Sci. 2020, 4, 53. https://0-doi-org.brum.beds.ac.uk/10.3390/jcs4020053
AMA Style
Bajaj R, Wang B, Gupta R. Characterization of Enhanced ITZ in Engineered Polypropylene Fibers for Bond Improvement. Journal of Composites Science. 2020; 4(2):53. https://0-doi-org.brum.beds.ac.uk/10.3390/jcs4020053
Chicago/Turabian StyleBajaj, Rishabh, Boyu Wang, and Rishi Gupta. 2020. "Characterization of Enhanced ITZ in Engineered Polypropylene Fibers for Bond Improvement" Journal of Composites Science 4, no. 2: 53. https://0-doi-org.brum.beds.ac.uk/10.3390/jcs4020053