Article

Thermal Behavior of a Light Timber-Frame Wall vs. a Theoretical Simulation with Various Insulation Materials

by
Konstantinos Ninikas
1,
Porfyrios Tallaros
1,
Andromachi Mitani
1,
Dimitrios Koutsianitis
1,
Georgios Ntalos
1,
Hamid R. Taghiyari
2 and
Antonios N. Papadopoulos
3,*
1
Department of Forestry, Wood Science and Design, Faculty of Technology, University of Thessaly, GR-431 00 Karditsa, Greece
2
Wood Science and Technology Department, Faculty of Materials Engineering & New Technologies, Shahid Rajaee Teacher Training University, Tehran 16788-15811, Iran
3
Laboratory of Wood Chemistry and Technology, Department of Forestry and Natural Environment, International Hellenic University, GR-661 00 Drama, Greece
*
Author to whom correspondence should be addressed.
Submission received: 17 December 2021 / Revised: 3 January 2022 / Accepted: 5 January 2022 / Published: 8 January 2022
(This article belongs to the Special Issue Feature Papers in Journal of Composites Science in 2021)

Abstract

:
The objective of this paper is to compare the thermal behavior of a light frame timber wall by measuring 15 test samples with various insulation materials versus a theoretical simulation with the use of a software. This work establishes the variance between the two different methods to measure the thermal transmittance coefficient of timber walls. It is verified that the mean percentage alteration between the two methods is 4.25%. Furthermore, this approach proved that with the use of a simulation software, additional readings (humidity, vapor flux, heat flux, and vapor pressure) can also be considered and measured, enhancing the overall development of a timber wall. This can provide additional information regarding to the characteristics of the masonry’s elements assisting in an improved design of a timber wall with upgraded performance.

1. Introduction

In the recent years an upsurge of wooden structures has been observed and more specifically timber buildings are being erected in most developed countries of the world. As a result, the increased interest of manufacturers to engage in research, development, and fabrication of new building materials as well as the improvement of building construction systems. A timber house is an environmentally friendly habitat which consists of several characteristics such as energy-efficiency, anti-seismic behavior, light weight, and enhanced structural safety and comfort [1]. Based on the above, various factors have to be met during the implementation of such a building project. One key element is the design of an adequate building envelope which incorporates acceptable thermal insulation properties in all of the elements of the building including the masonry, the roof, the frame, the ceiling, and the floor. The masonry from a light timber frame is applied to the external walls of a structure but also to the indoor partitions of a house with an appropriate thermal and sound insulation and membranes with resistance to moisture.
The light timber frame masonry is utilized in wooden buildings in combination with various insulating materials suitable for the specific type of buildings. Insulating materials in a light timber-frame building are usually the extruded and expanded polystyrene, stone wool, mineral wool, and fiberglass [2]. The lightweight building materials offer improved thermal insulation, allowing the most effective temperature control inside the building [3]. Insulating materials can be classified according to their chemical or physical structure. The European market for insulation materials is characterized by the dominance of inorganic fibrous materials (i.e., stone wool and fiberglass, which represent 60% of the market). A total of 27% of the market is represented by organic materials, which are expanded and extruded polystyrene, as well as polyurethane foam. All other insulation materials represent only 13% of the European market [4]. With the construction of light-frame timber houses in various climatic regions and with the rise of new materials, great importance was given to the thermal insulation and heat transfer properties of timber-frame walls [5,6]. With regard to the low thermal conductivity coefficient of wood compared to other materials [7,8,9], it can be deduced that a light timber-frame wall can provide a structure with adequate mechanical properties and with an acceptable level of thermal insulation. Several wood-based composites have been designed and constructed with such properties that are promising for a diverse range of uses [10].
The thermal transmittance coefficient (U-value), as well as the thermal resistance coefficient (R-value), are used to measure the thermal insulation properties. In practice, the coefficient of thermal resistance measures the difficulty with which heat passes through a material or layers of materials (system) with a temperature difference on both sides equal to one-degree Kelvin (1° K). The higher the R-value, the better the thermal insulation of the material [11]. Heat losses through a structural element are defined by the coefficient of thermal conductivity (λ-value), which gives the amount of heat transferred to the unit of time in a constant temperature field through the unit surface of a structural element, when the air temperature difference on both sides of the structural element is equal to one unit [12]. Depending on the measured values of the two factors, it is determined whether the light-frame timber masonry has the optimal or not thermal behavior.
In this paper, the HT-Flux simulation software was applied to measure the thermal behavior of a light-frame timber masonry. Wakili and Tanner [13] presented the results of three methods for determining the U-value when examining walls made of perforated porous clay bricks. One was tested in a hot box according to EN ISO 8990: 1996, and the other two methods referred to theoretical calculations according to EN 1745: 2002. The results of this study showed that the U-value was between 0.115 and 0.128 W/m²K (i.e., 3–5% higher compared to the thermal insulation properties of a wooden structure). Kucerova et al. [14] studied the housing condition of a timber building with regard to the heat transfer coefficient and exhibited that after several years of use, the U-value was 0.04 W/m²K higher than the value resulted by the software calculation. As a consequence, it deviated from the expected value and it also proven that the construction of the timber building met the current thermal requirements based on the building standards.
Researchers developed a light-frame timber using plant residues and wood by-products, originated from a close proximity range to the harvesting point [11]. Insulation boards made of pine bark and hemp were placed in this wall. Readings for the thermal behavior of the individual materials were undertaken, and as a result of this the thermal conductivity of the entire masonry was analyzed. The outcome of the experimental measurements for the thermal conductivity of the masonry that refer to the thermal behavior of each material showed a relatively high value: λ = 0.262 W/m*K. Furthermore, the percentage of insulation was 51.2%, which presented a satisfactory rate of thermal resistance for a masonry with R = 1547 m2*K/W. In another study [15] low density insulation boards from cannabis residues and pine bark were constructed. This study demonstrated that the thermal conductivity was improved when the percentage of the cannabis content was increased (70% and 80%). On the contrary, the boards with low content of cannabis, with a percentage of 10% and 20%, led to insulation composites with insufficient mechanical properties. Moreover, Antov et al., investigated the potential of using wood fibers for producing wood-based composites for structural applications with promising physical properties [16].
In the quest of an ideal light-frame timber wall, many aspects and parameters have to be considered. Cost and time are the two most critical ones. This study’s approach, aims to identify the differences between the construction of a timber wall with specific dimensions with various insulation materials versus a wall designed through a simulation software with regard to comparing the thermal behavior of these two dissimilar setups. Furthermore, it is expected to be determined if any other characteristics and properties of this timber wall can be concluded by using the minimum possible resources, man-hours and a lower cost of materials.

2. Materials and Methods

Under laboratory conditions, a light timber-frame test wall was designed and constructed to host a synthesis of five dissimilar insulation materials in contemplation of measuring the thermal transmittance values of fifteen different combinations within the test wall. At the same time, a simulation software was used to undertake the same fifteen readings aiming to compare the differences between these two methods.

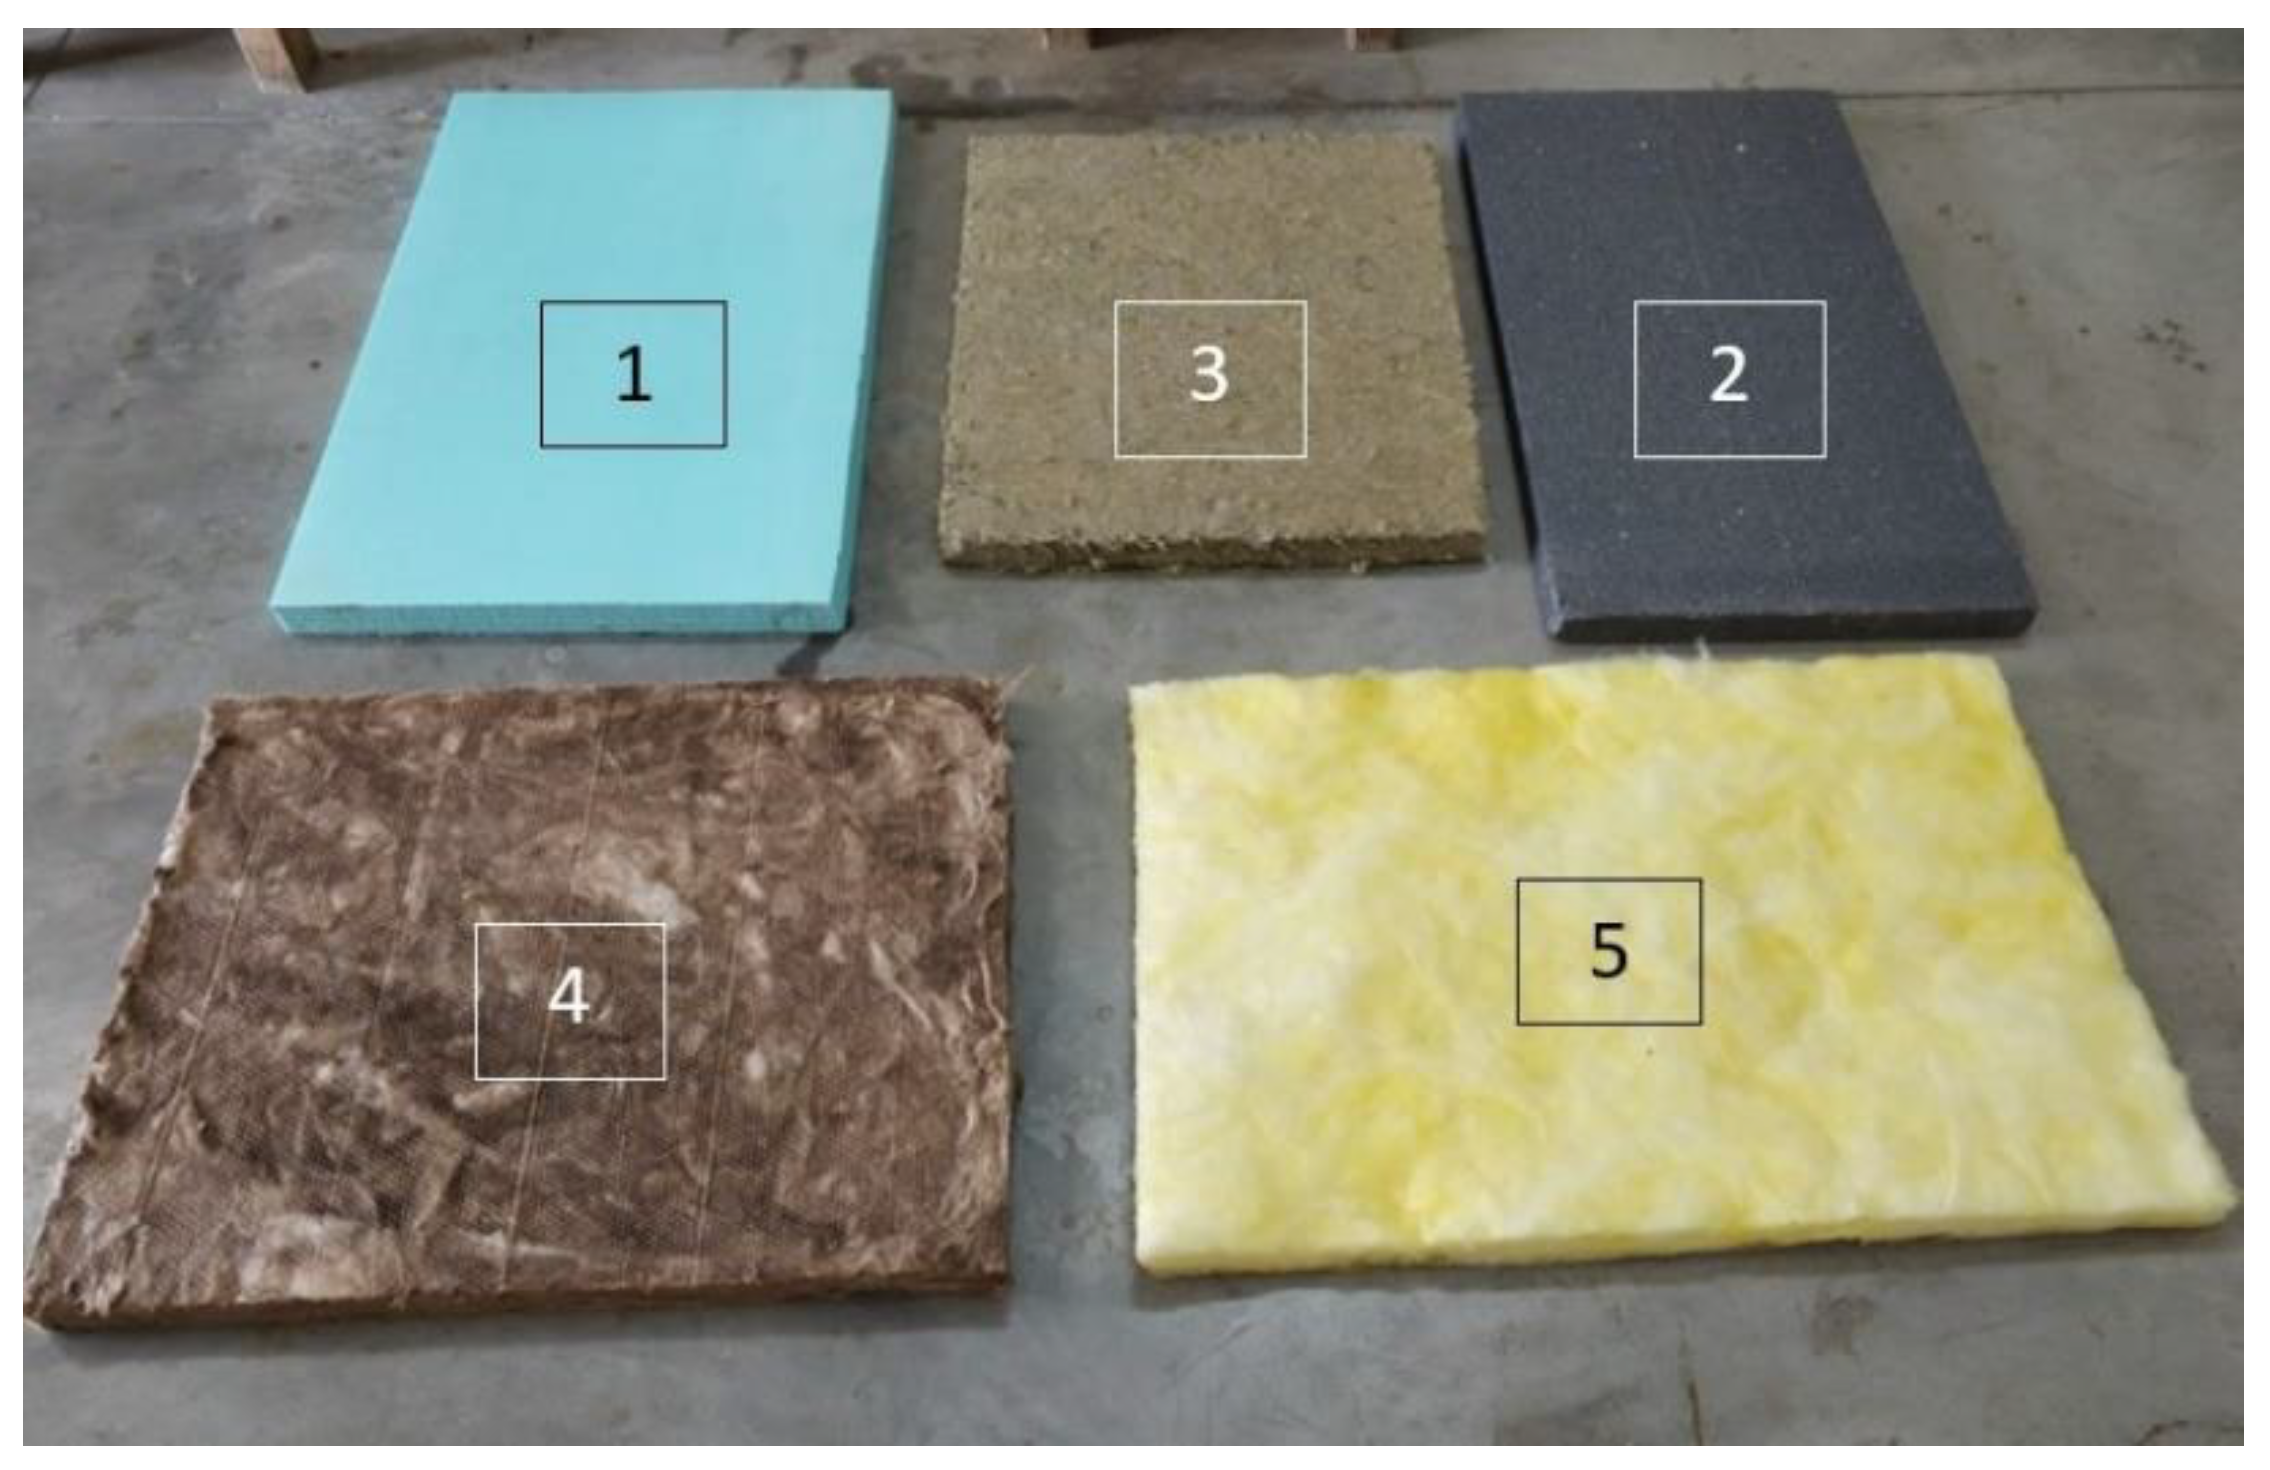
2.1. Insulation Materials
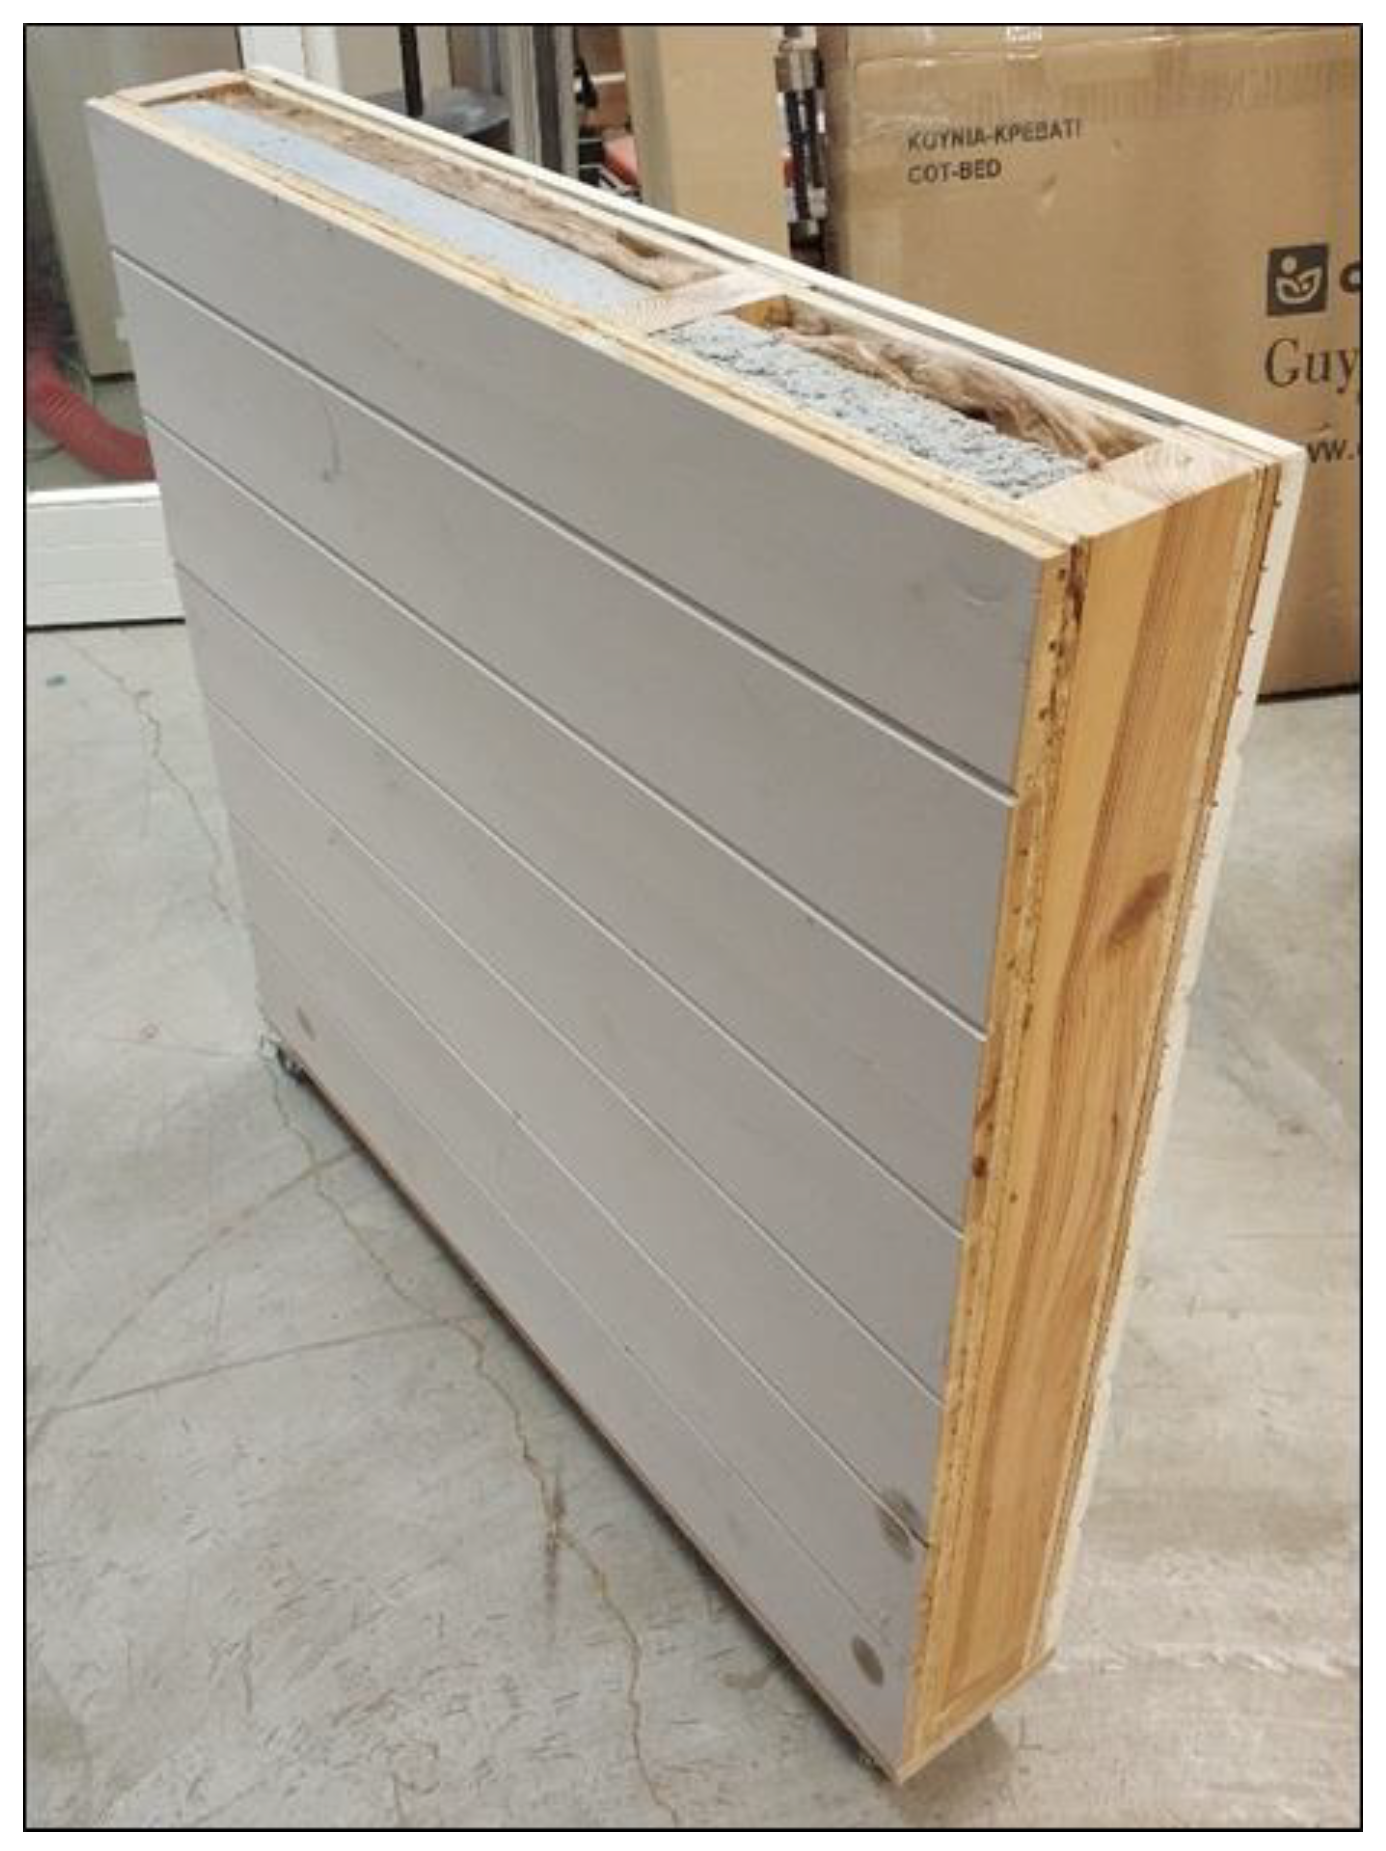
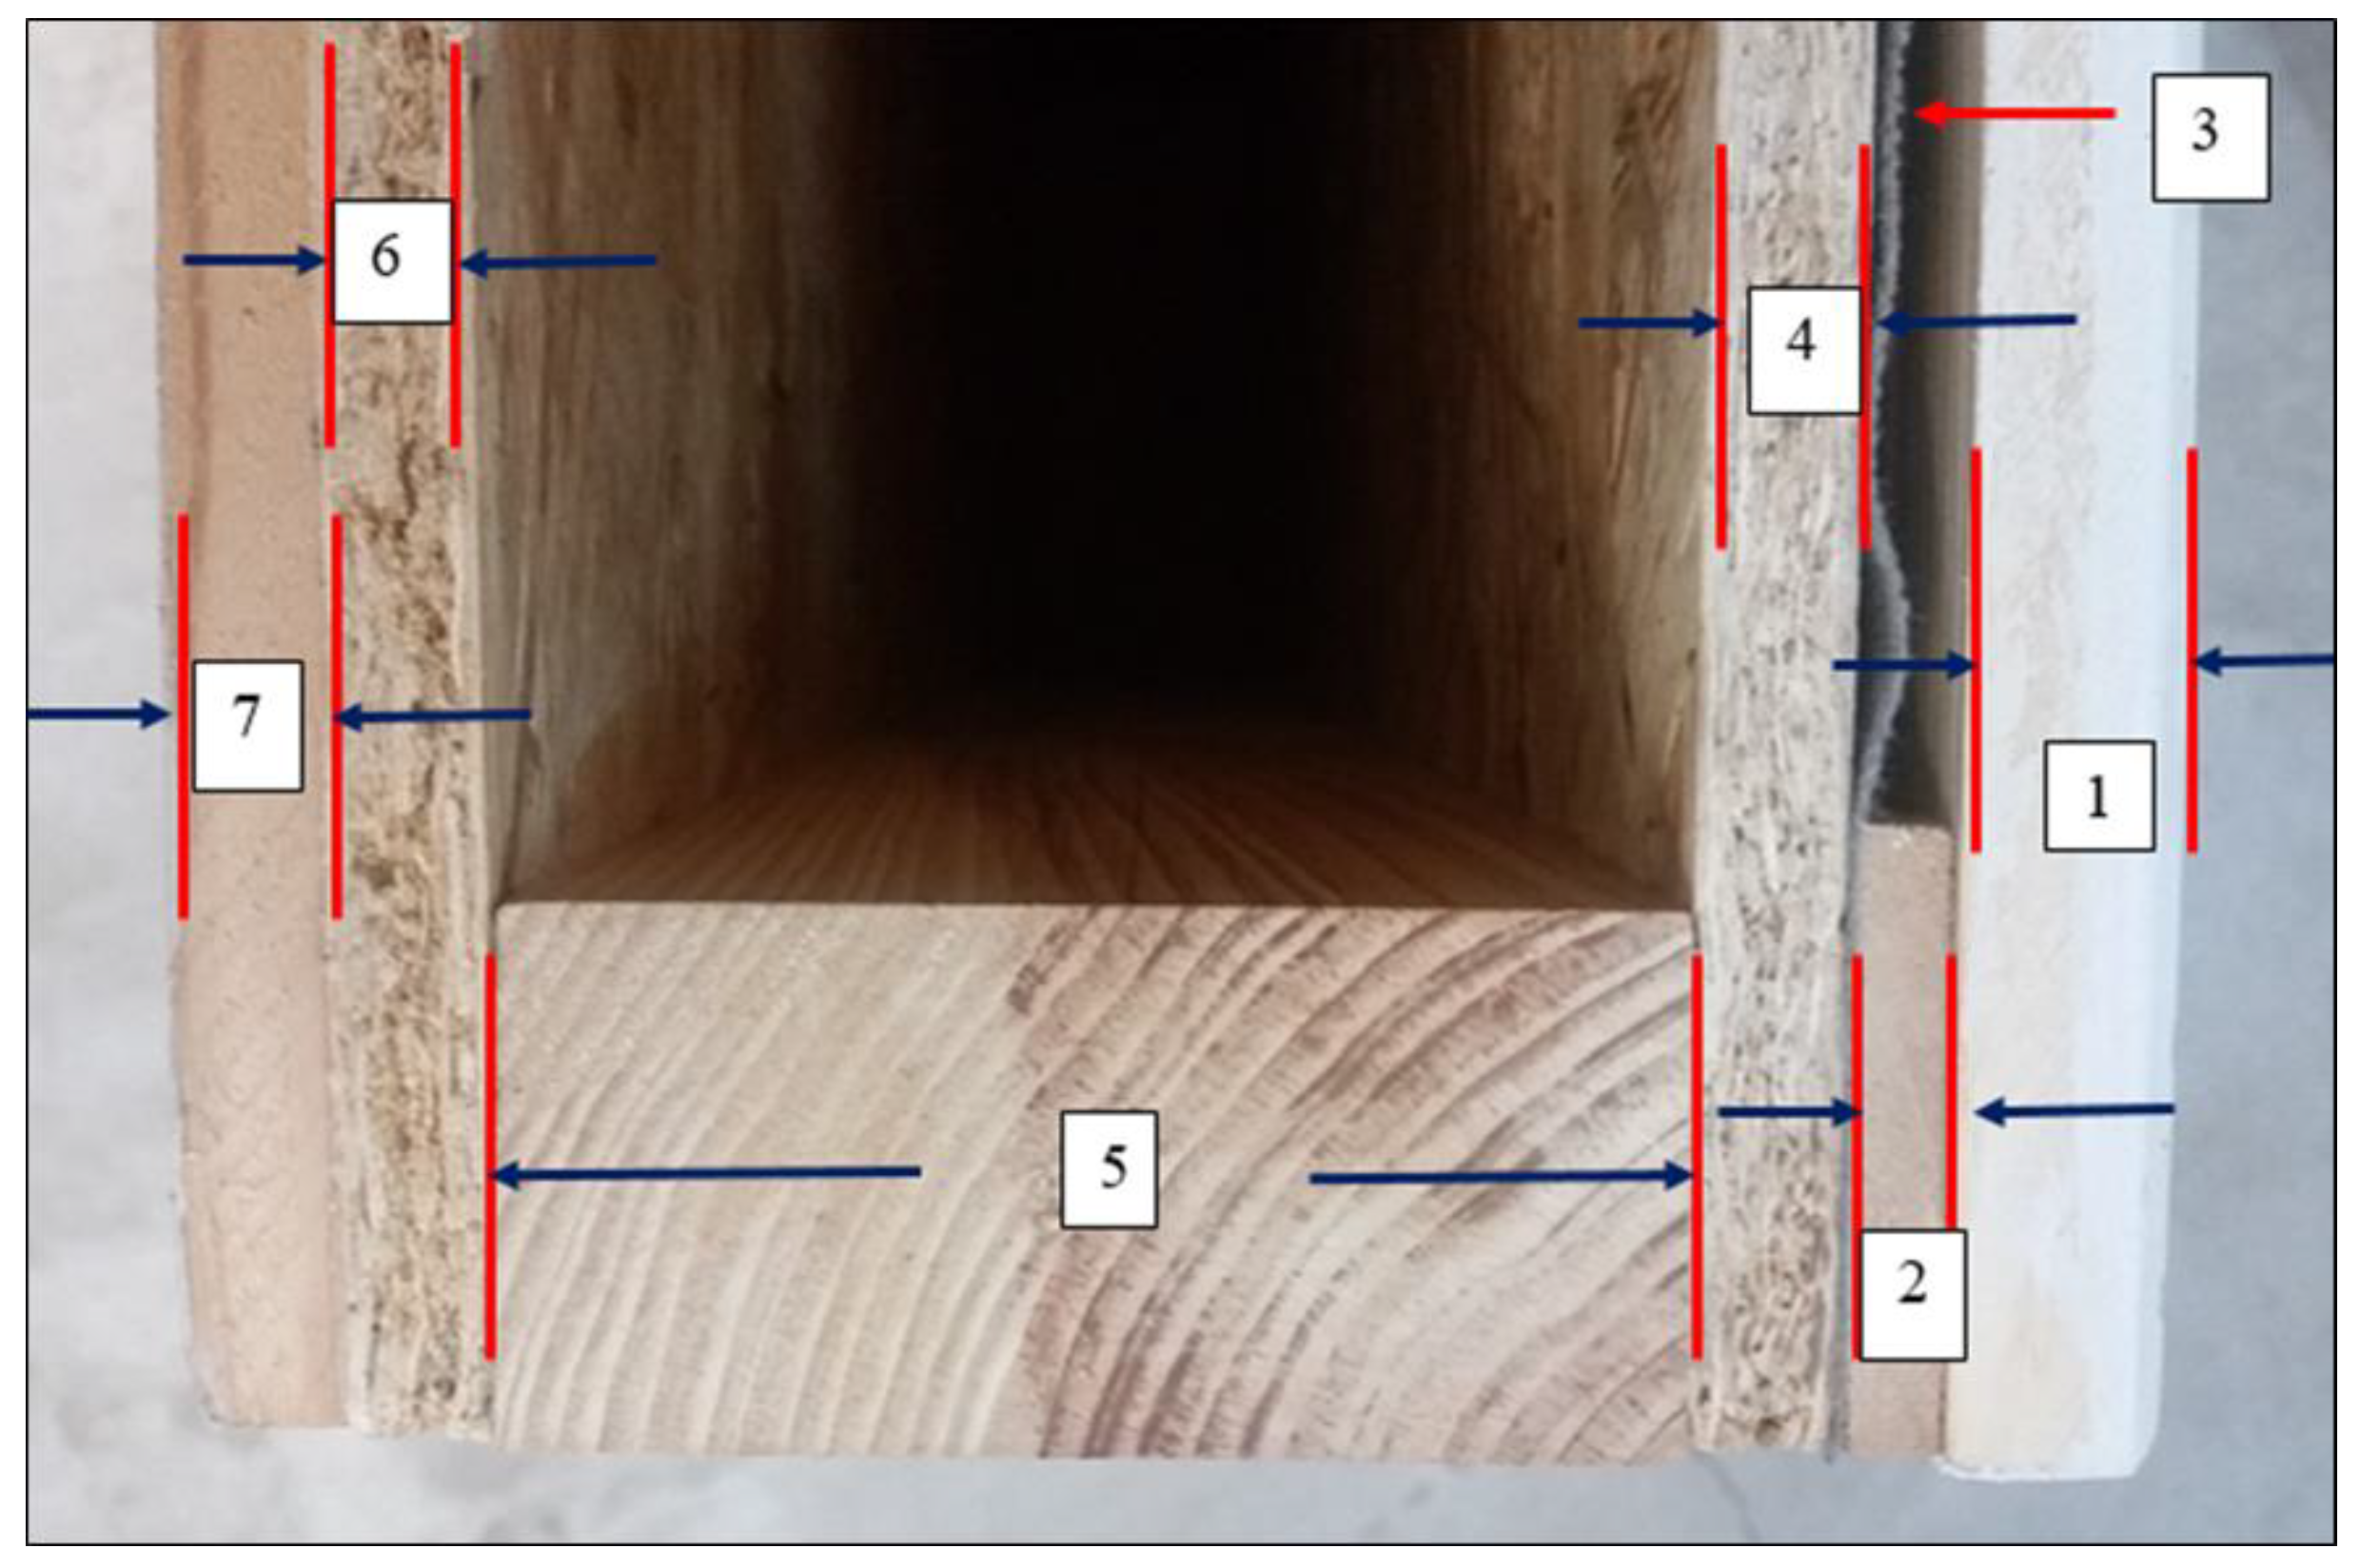
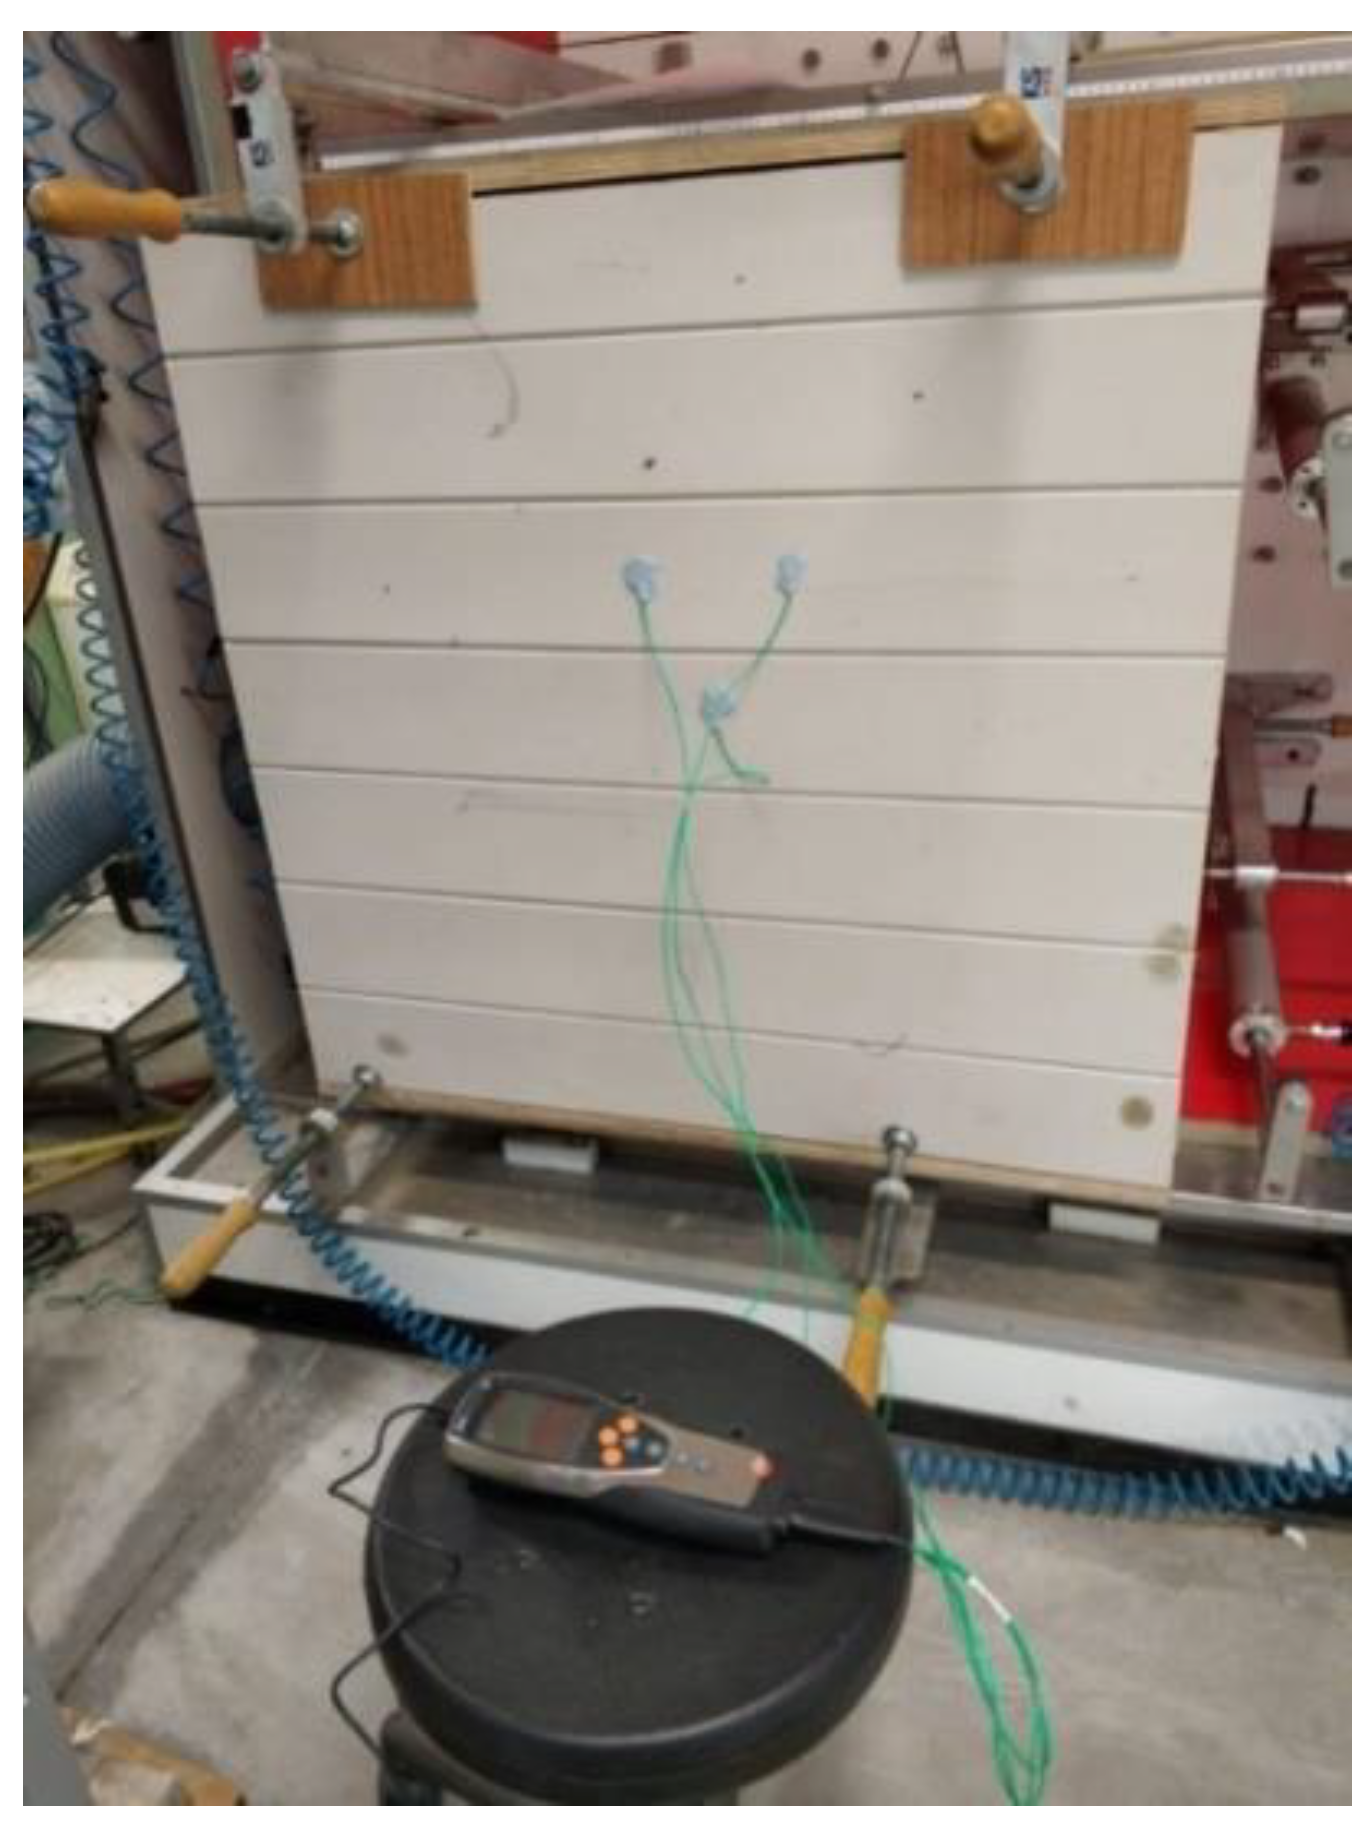
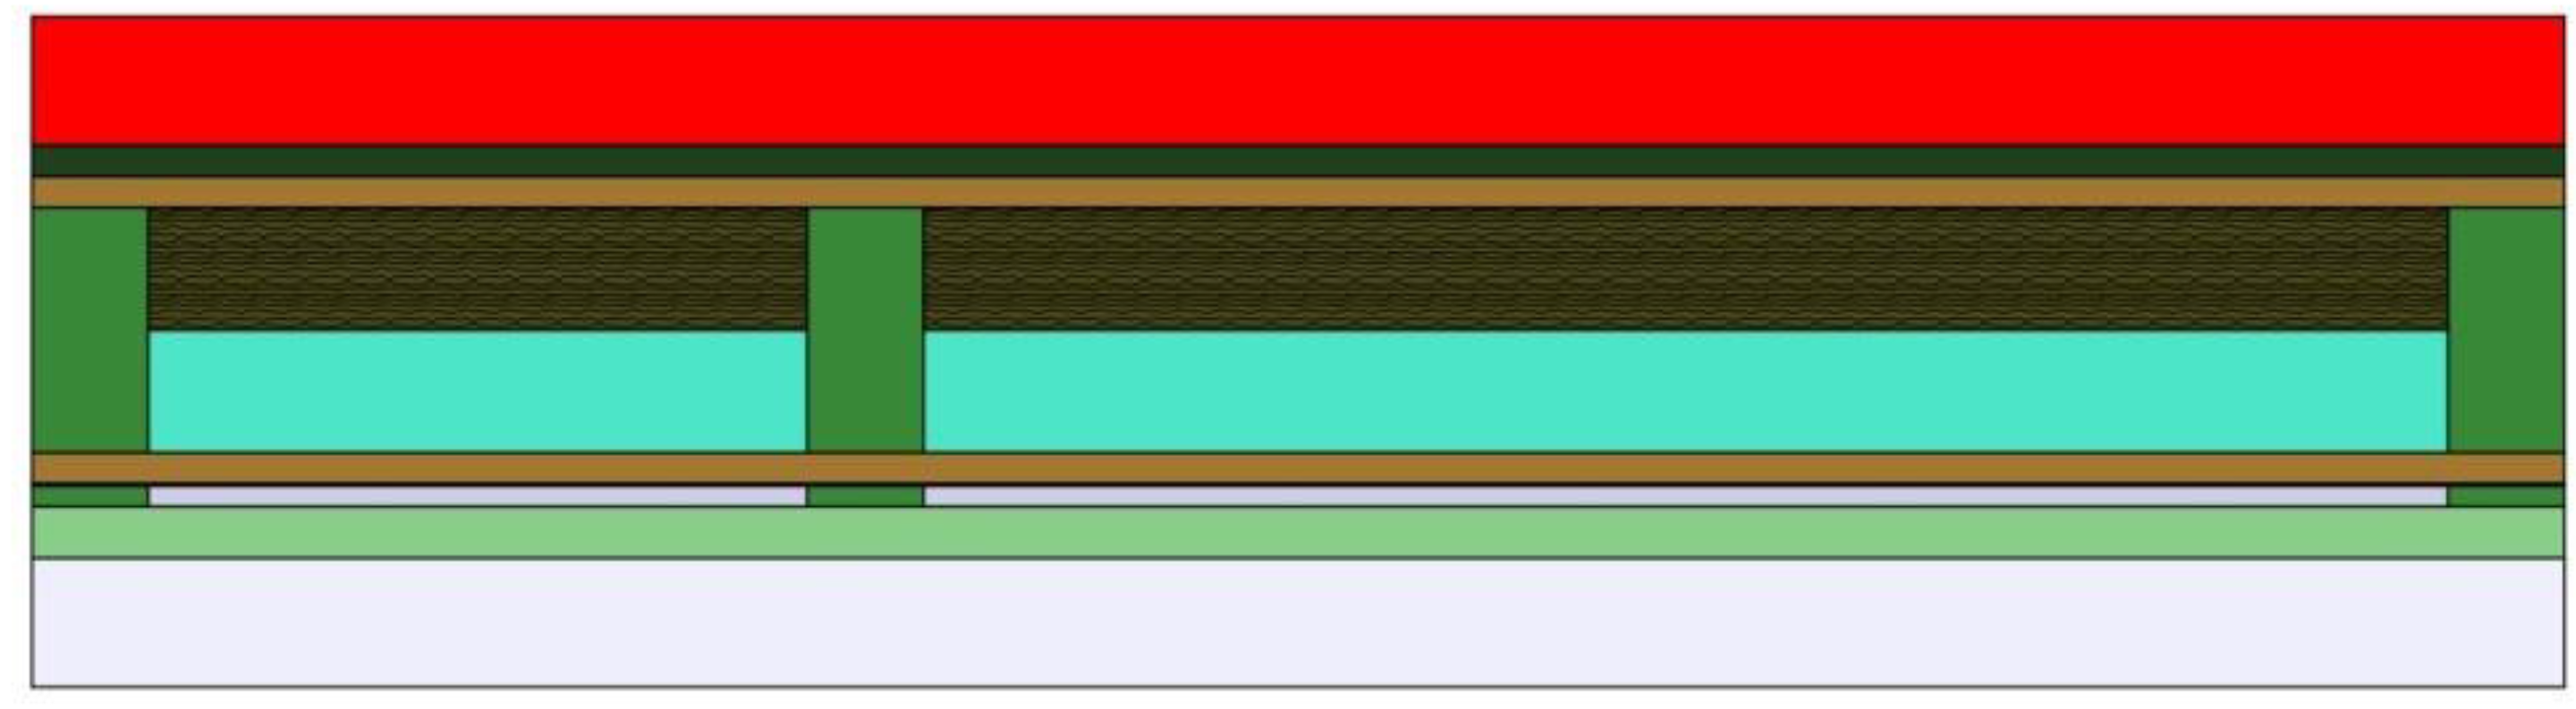
Five commercial insulating materials were selected for the preliminary approach as shown in Figure 1 (extruded polystyrene, expanded polystyrene, rock wool, mineral wool, and glass wool). Each insulation material had the same thickness of 50 mm and corresponds to a sample code displayed in Table 1. The experimental design was based on two layers of insulation material for each test wall measurement, either two layers of the same material or combinations of the five insulation materials as presented (Table 2). The thermal transmittance (U-Values) of these boards were provided by the manufacturer of each material and these values were used during the simulation process.

2.2. Test Wall

A test wall was constructed as described above. The dimensions of this light-frame timber masonry were of 980 mm width and 950 mm height (Figure 2). The total thickness was 160 mm (Figure 3) and the thickness of the individual layers are presented in Table 3.
The methodology of the experiment with regard to the application of the fifteen different insulation setups within the timber wall follows.
The five insulation materials (all with the same thickness of 50 mm) were cut to such dimensions to fill the wall’s voids. A total of 15 different configurations were undertaken as presented in Table 2. A hot box apparatus was used to assist with the thermal transmittance measurements. The following temperature conditions were set for all of the 15 tests: an outdoor temperature (Te) of 7 °C (±1 °C) and indoor temperature (Ti) of 20 °C (±1 °C). Each individual test wall was positioned in a hot box apparatus for a 24h period.
A heat flux measuring device (Testo North America, West Chester, USA) (HFM-Testo 635-2/ accuracy: ±0.2 °C/operating temperature: −20 to +50 °C with a wireless humidity/temperature probe) was used to measure the thermal transmittance as shown in Figure 4. This apparatus measures the specific heat flow (q) and the air temperatures for the two sides (Ti ‘warm’ and Te ‘cold’) of the window with the assistance of a wireless temperature probe [17]. Having reading from these three parameters, the U-Value is calculated automatically using Equation (1):
U = q/(Ti − Te) (W/m2K)
Equation (1): thermal transmittance.
The above method was performed for all fifteen possible combinations with the different insulating materials and U-Value readings were taken, respectively (Figure 5).

2.3. Simulation Software

The HT-flux software was selected for the simulation process of the same light-frame timber wall. This include an automatic U-Value calculator of an inhomogeneous wall. Along with the measurements, the layers and the materials used can be displayed with details [18]. The design of the light-frame timber masonry was completed with the exact same way as the actual construction of the test wall using the same setup with regard to the dimensions, thickness and different layers of all materials used. Every single element of this timber-frame wall was incorporated into the software with values based on the characteristics of every different material (i.e., studs, dissimilar insulation materials, wooden boards, and humidity protection membrane). The output of this setup resulted the U-Value for the masonry. Having completed the design of the test wall, the software can visualize the wall with a color variation to identify the layers of the test wall as displayed in Figure 6.

2.4. Statistical Analysis

Hierarchical cluster analyses were carried out using SPSS/18 (2009). For cluster analysis, Ward methods (with squared Euclidean method and distance intervals) were carried out. Cluster analysis categorizes different treatments based on multiple properties. Dendrograms will then reveal the similarities, and/or dissimilarities, within treatments, based on all of the properties that have been involved in the analysis. Fitted-line and contour plots were created in Minitab software, version 16.2.2 (Minitab Inc., New York, NY, USA).

3. Results and Discussion

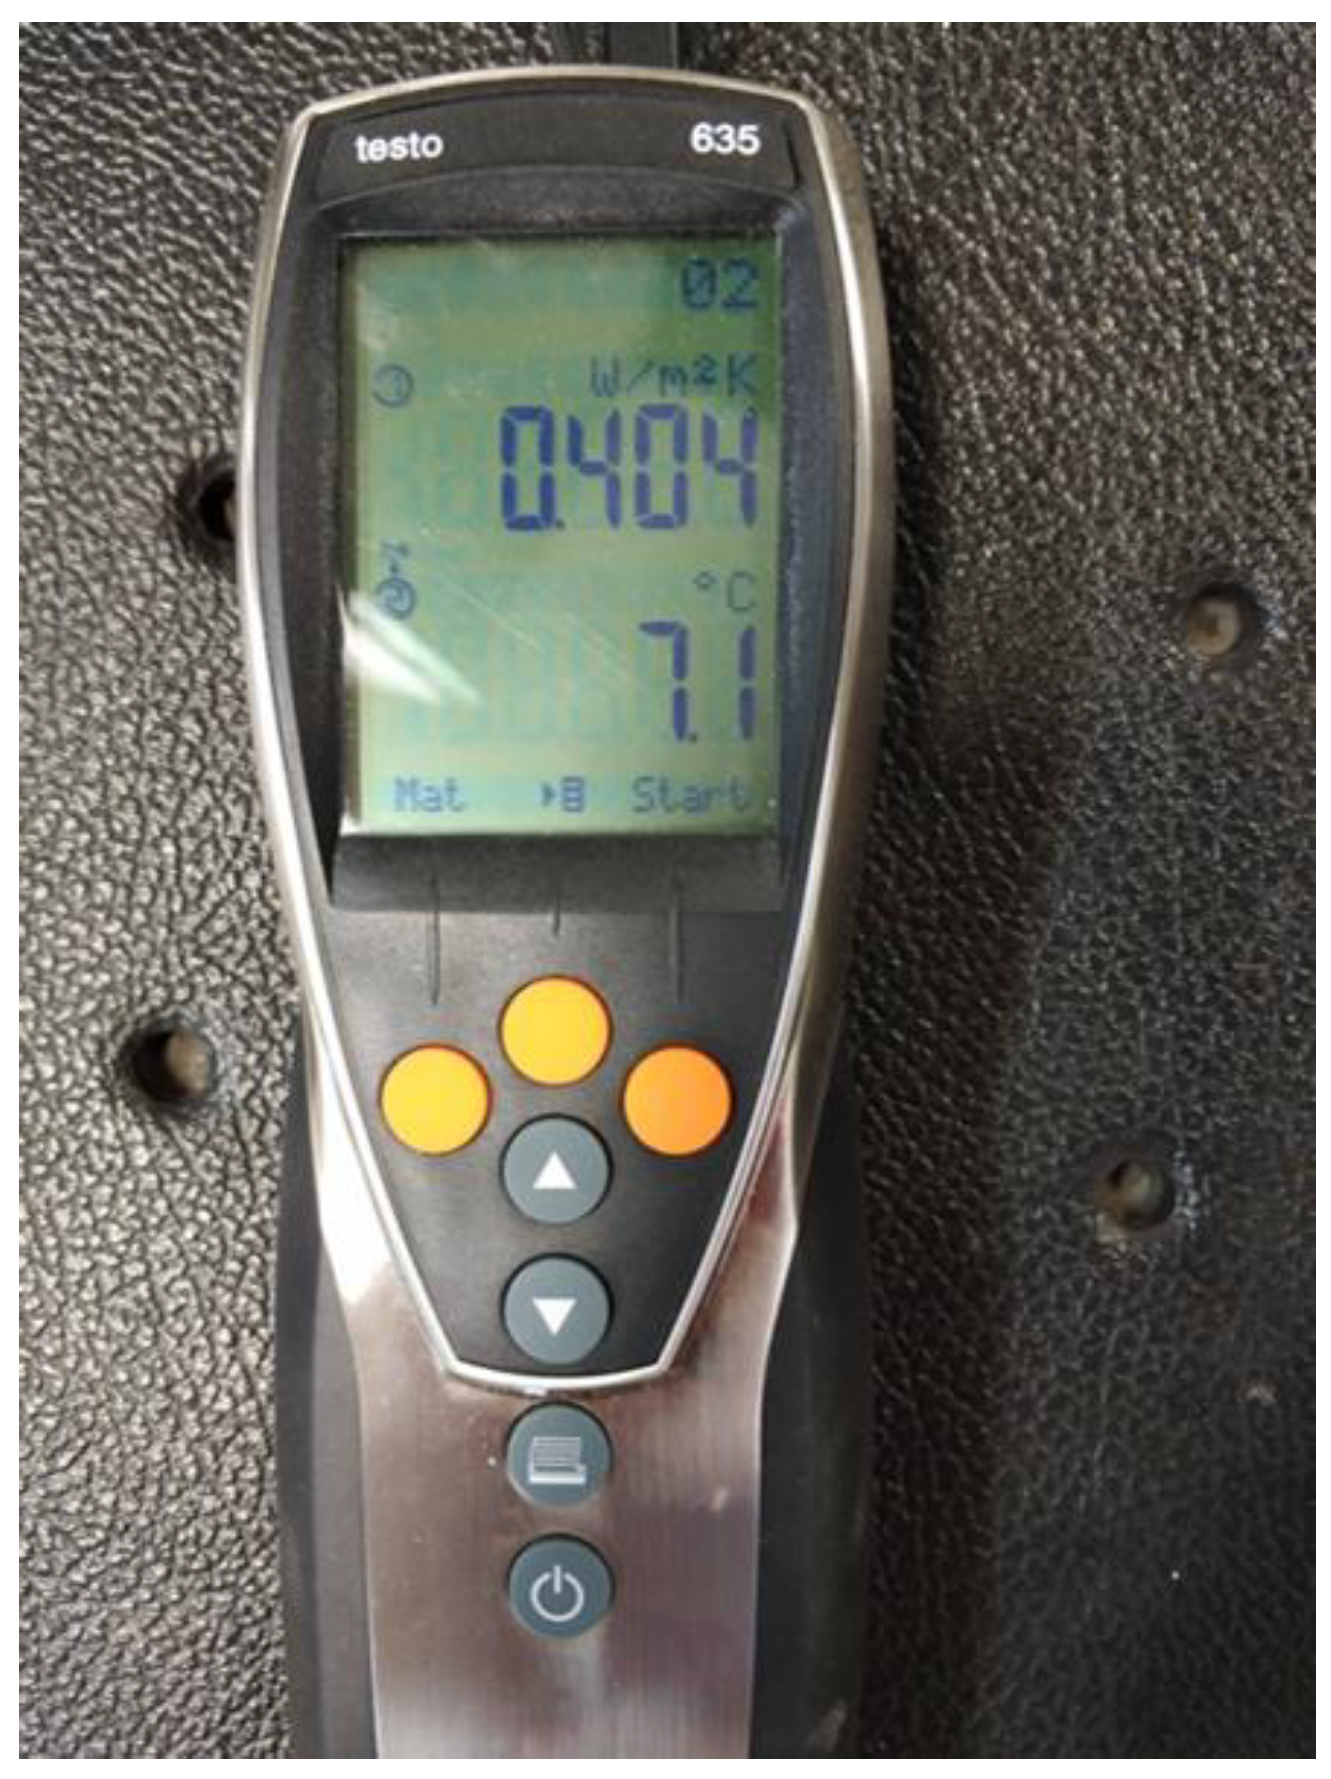
3.1. Results of the Test Wall

According to the following summary presented in Table 4, it was observed that from the insulating materials placed in the timber wall, the best thermal behavior was the one with the combination of two layers of expanded polystyrene (BB) and with the polystyrene and mineral wool (BD) with the lowest value, both with a U-Value of 0.394 (W/m2*K) and with an outdoor temperature of 7.0 °C. The thermal behavior of each test specimen is related to the percentage of all of the materials which consist the specimen, which in our case is the timber wall. The volume of the insulation material is approximately 70% of the overall timber wall. This result was anticipated due to the low U-Values given by the manufacturers of the specific materials.

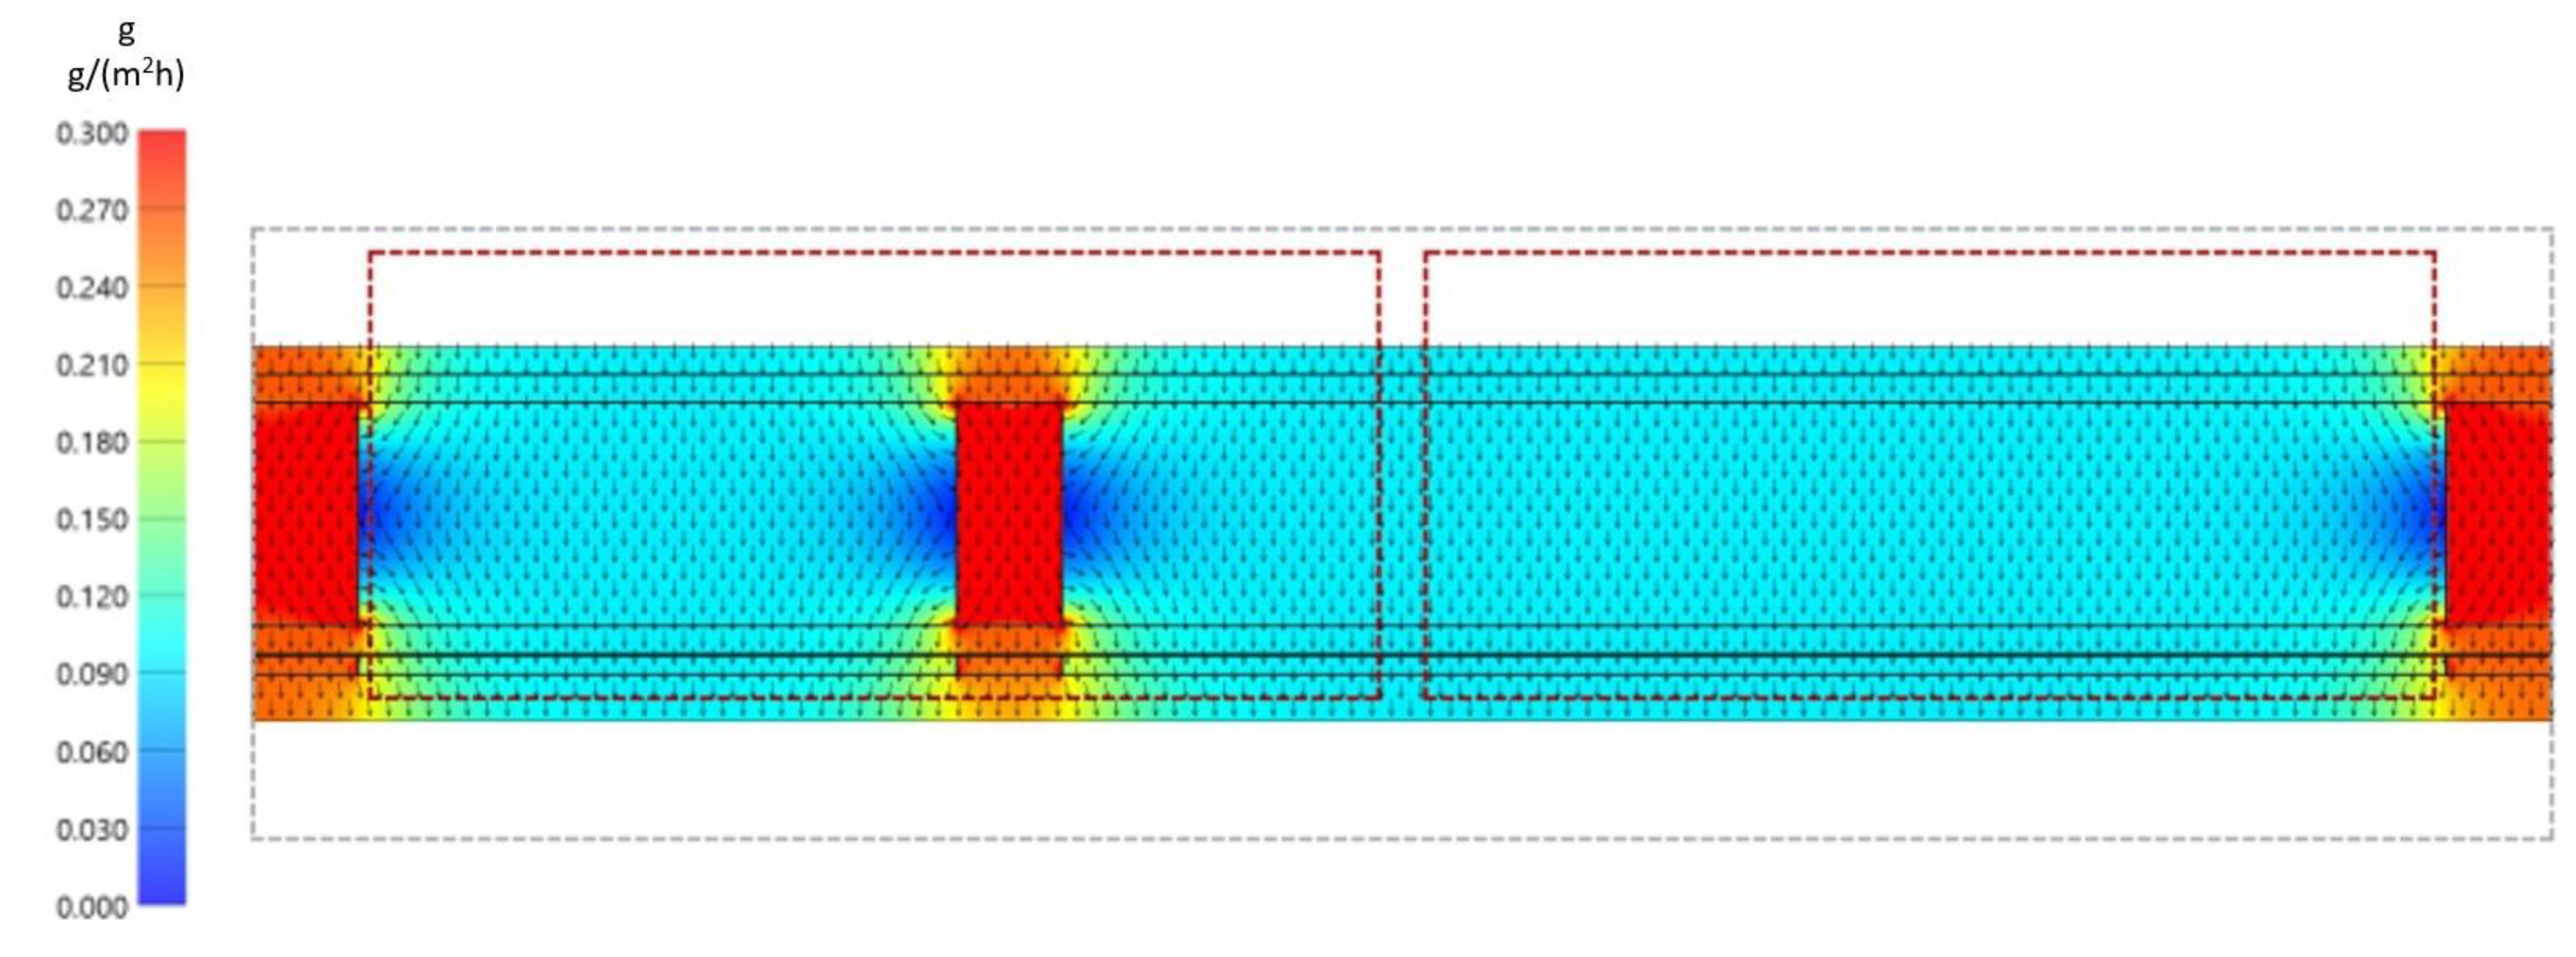
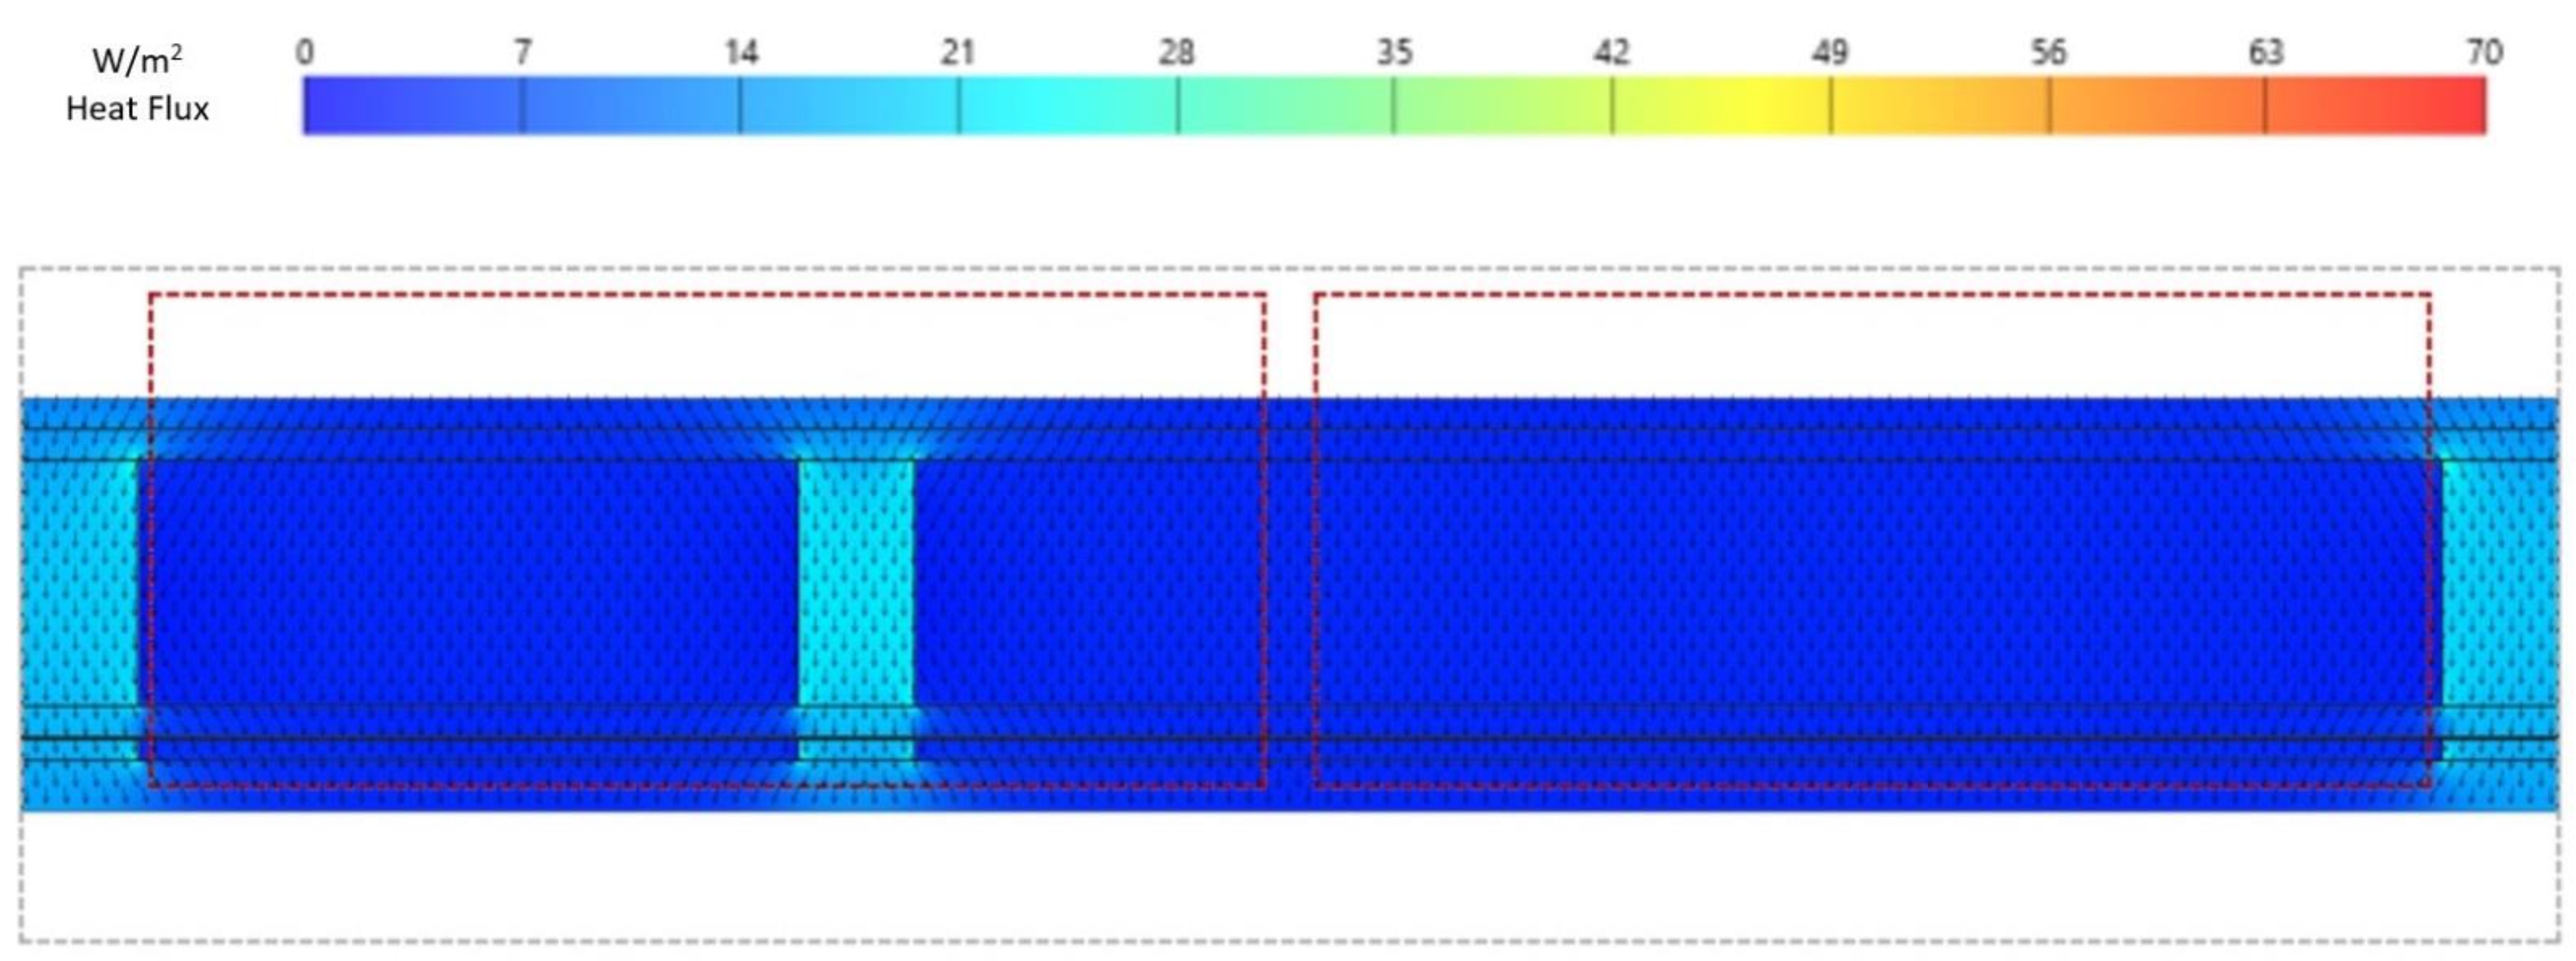
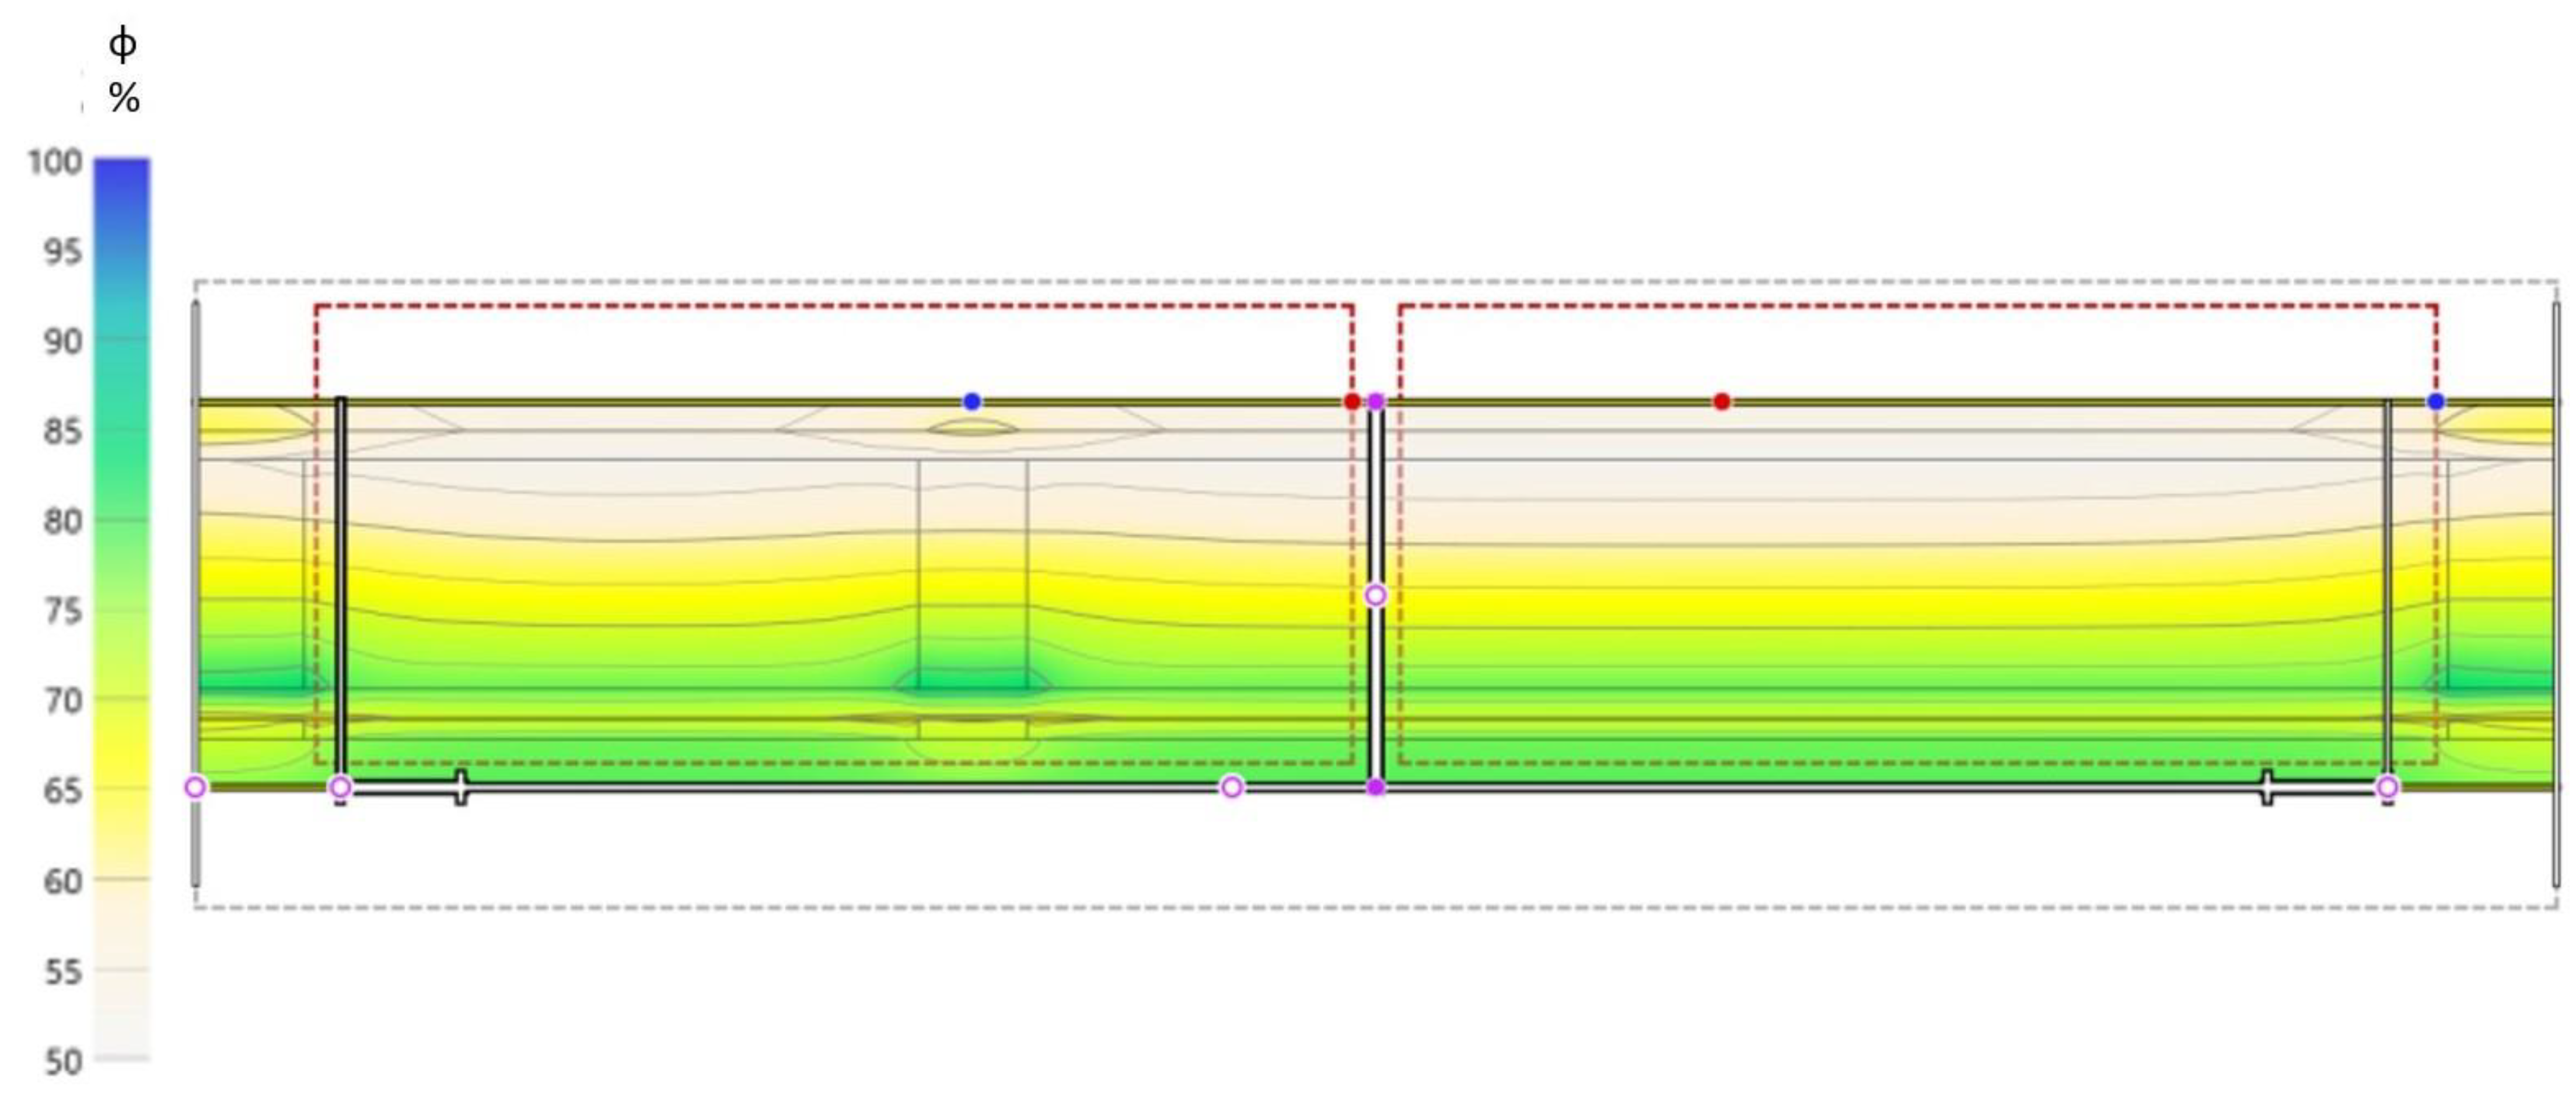
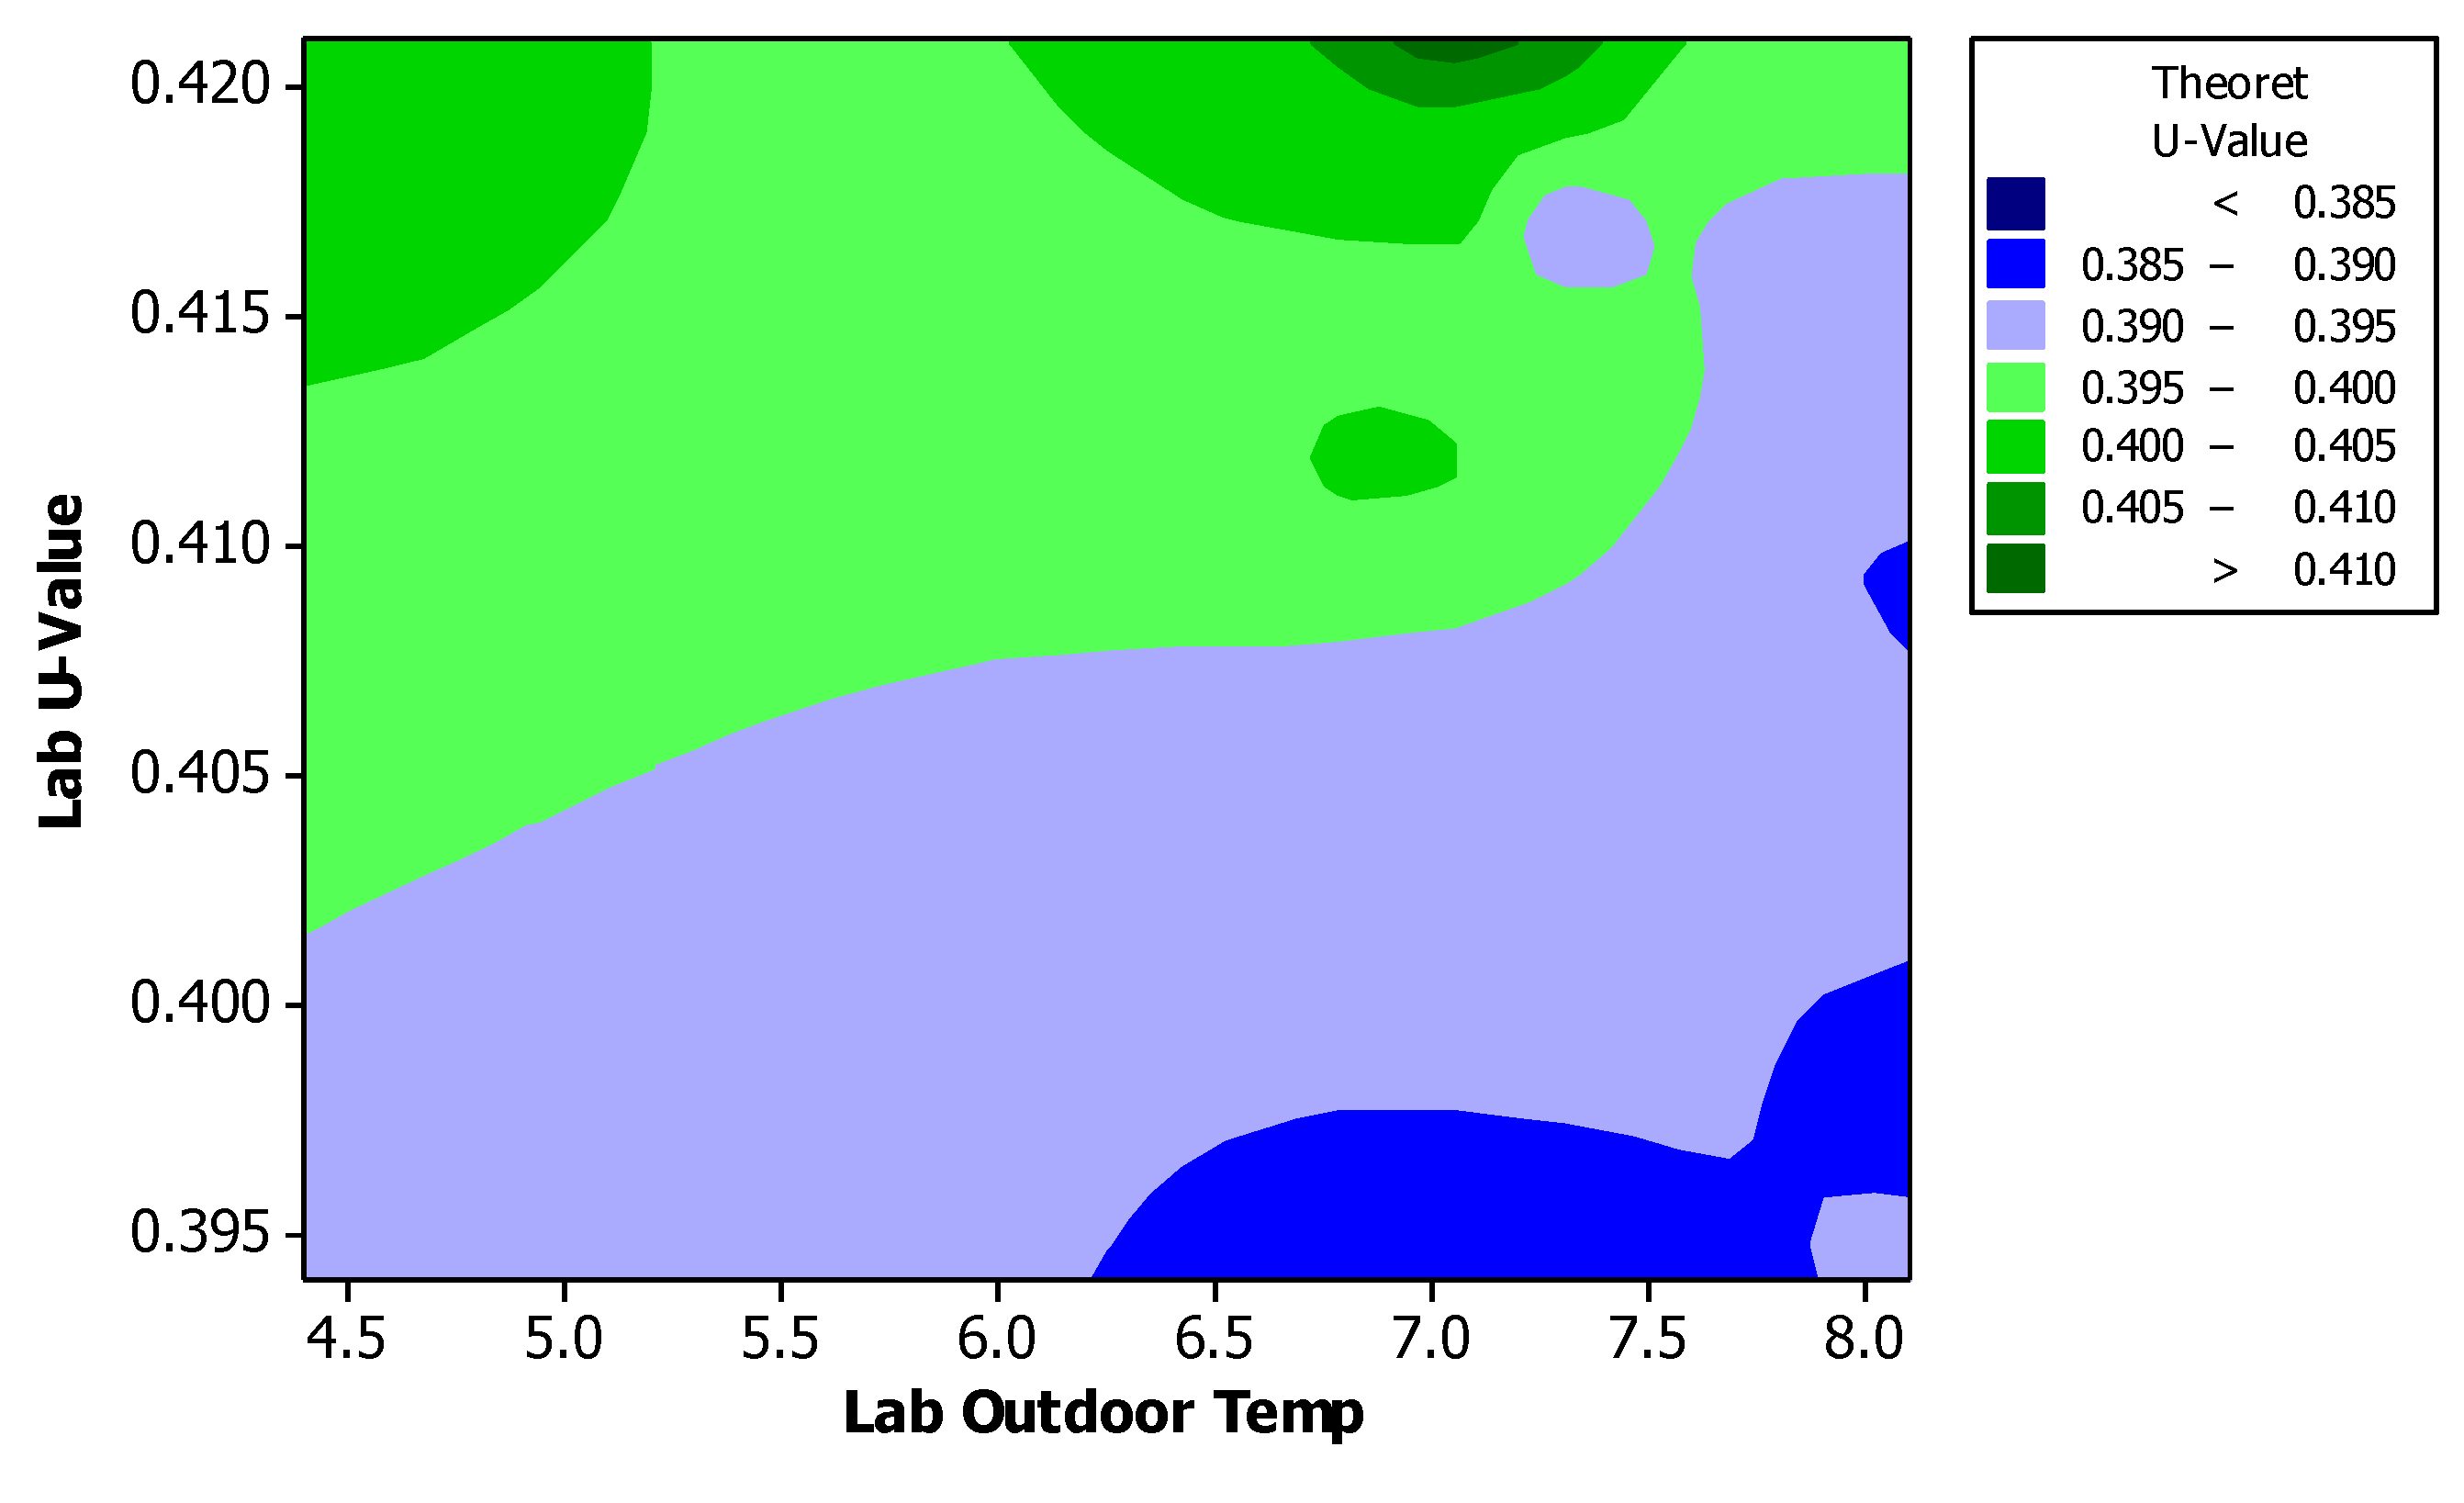
3.2. Results of the Theoretical Simulation

According to the Table 5 below, it was noticed that from the insulating materials filling the timber masonry, the best thermal behavior was the combination of two layers of expanded polystyrene (BB) with a U-value of 0.384 (W/m2*K) and with outdoor temperature of 5.0 °C. With the use of the software, the maintenance of a stable temperature, both indoors and outdoors, was an easy task compared to the actual test wall, which resulted again the best performance with the same synthesis of insulation boards.

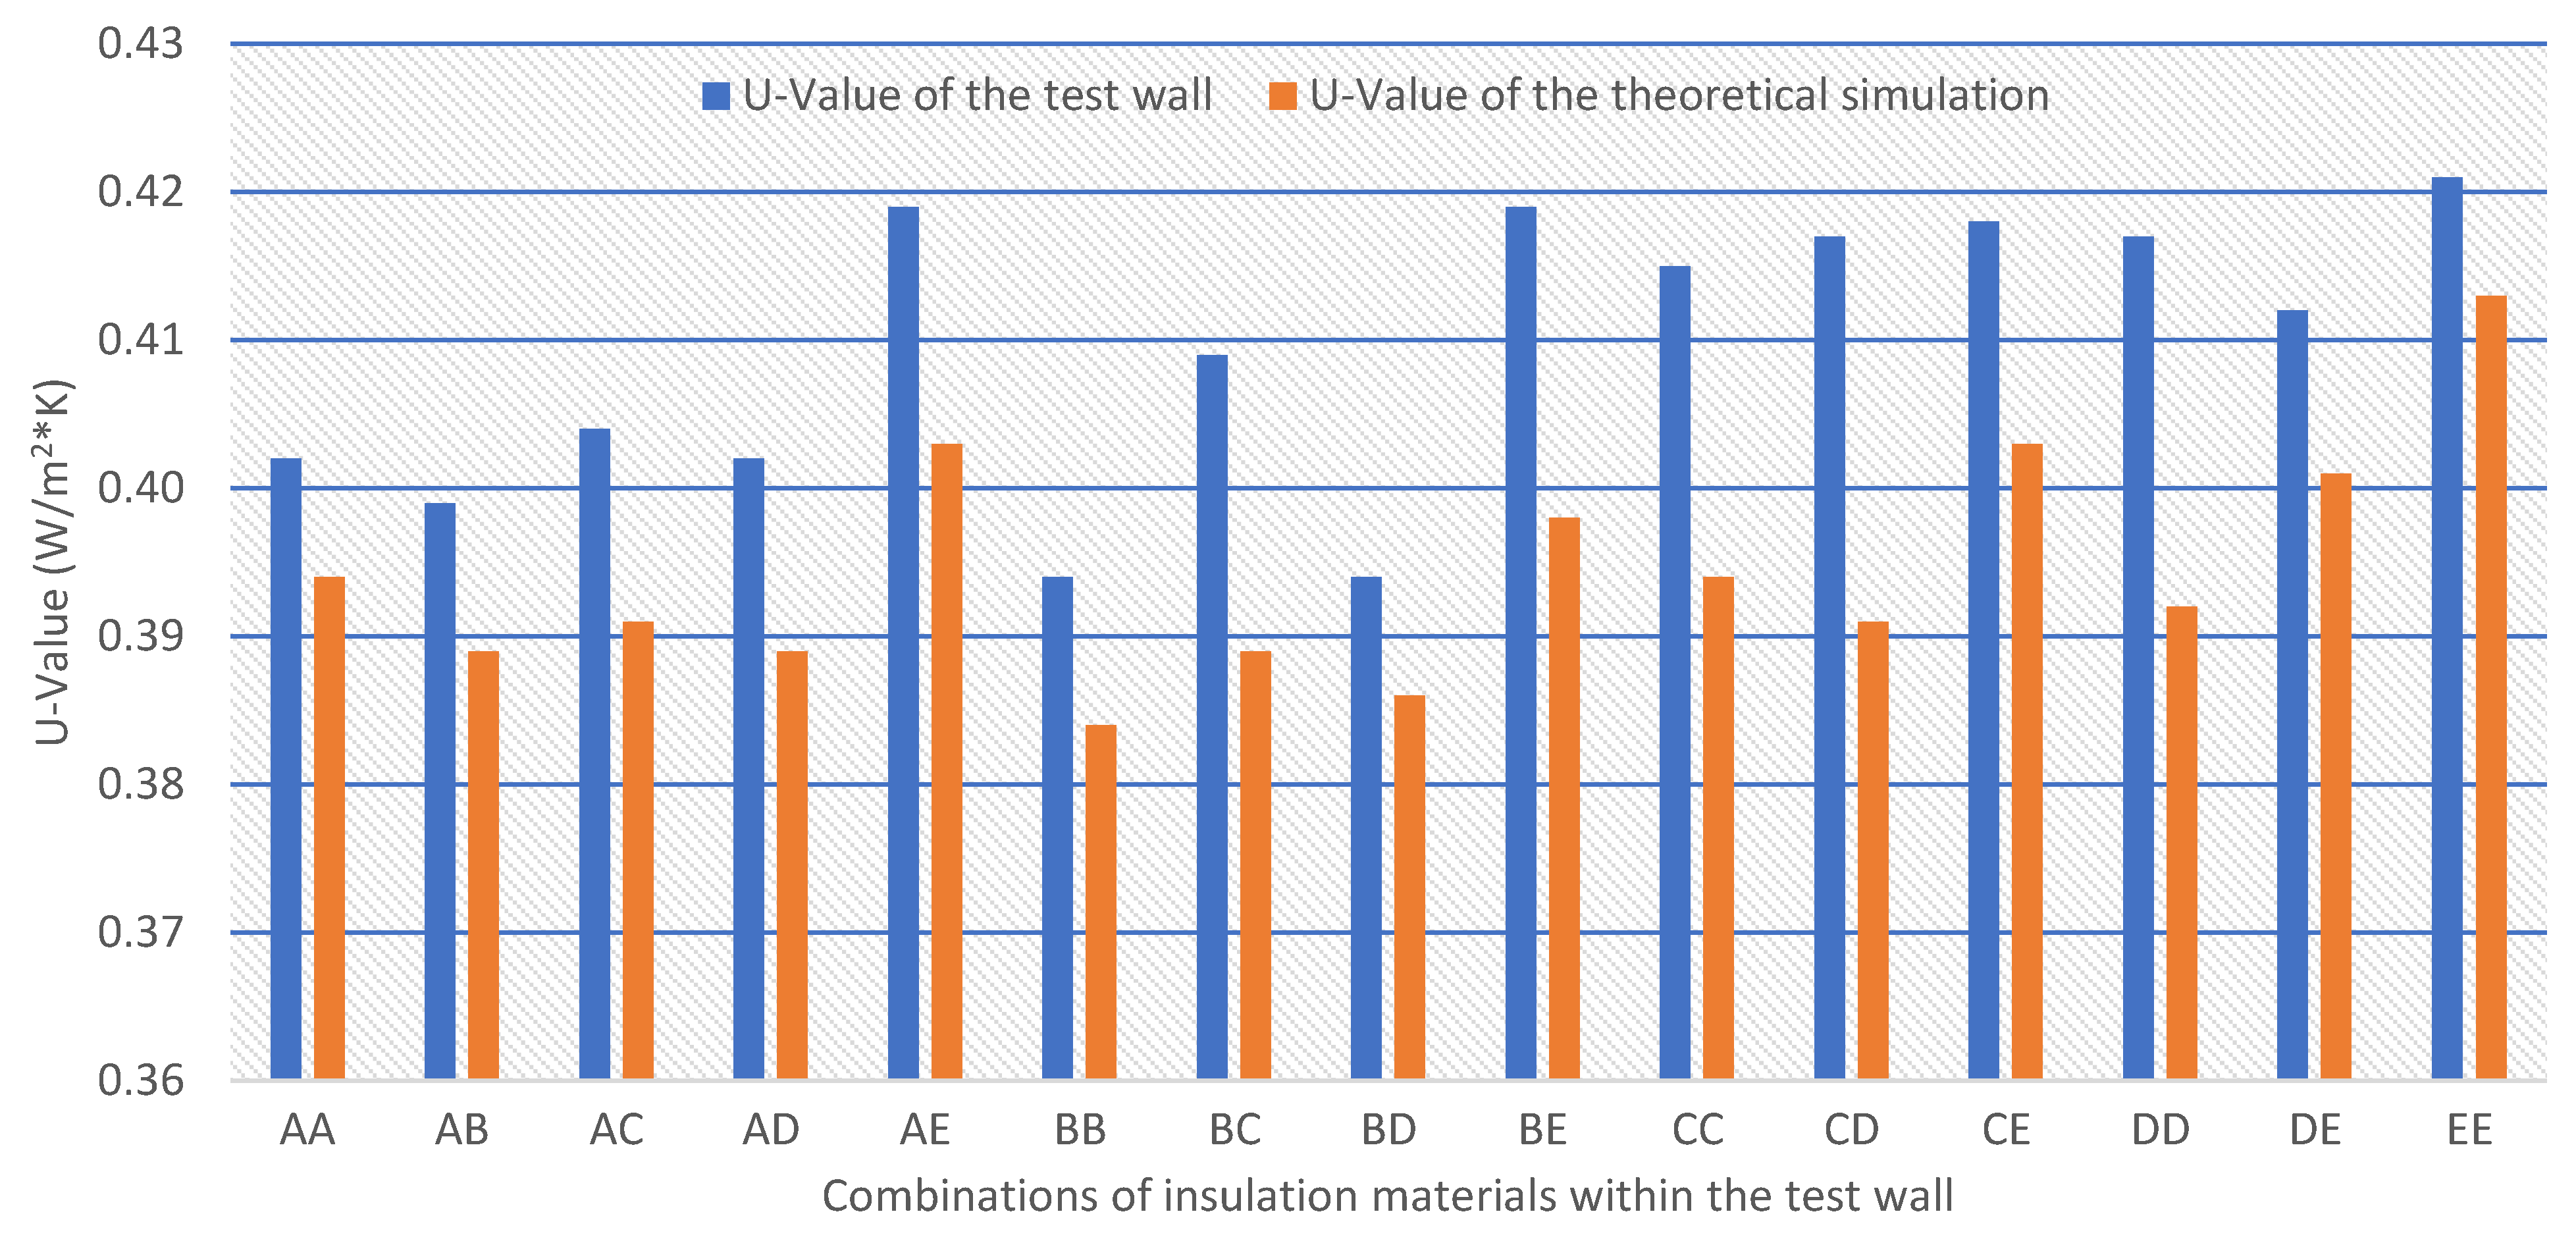
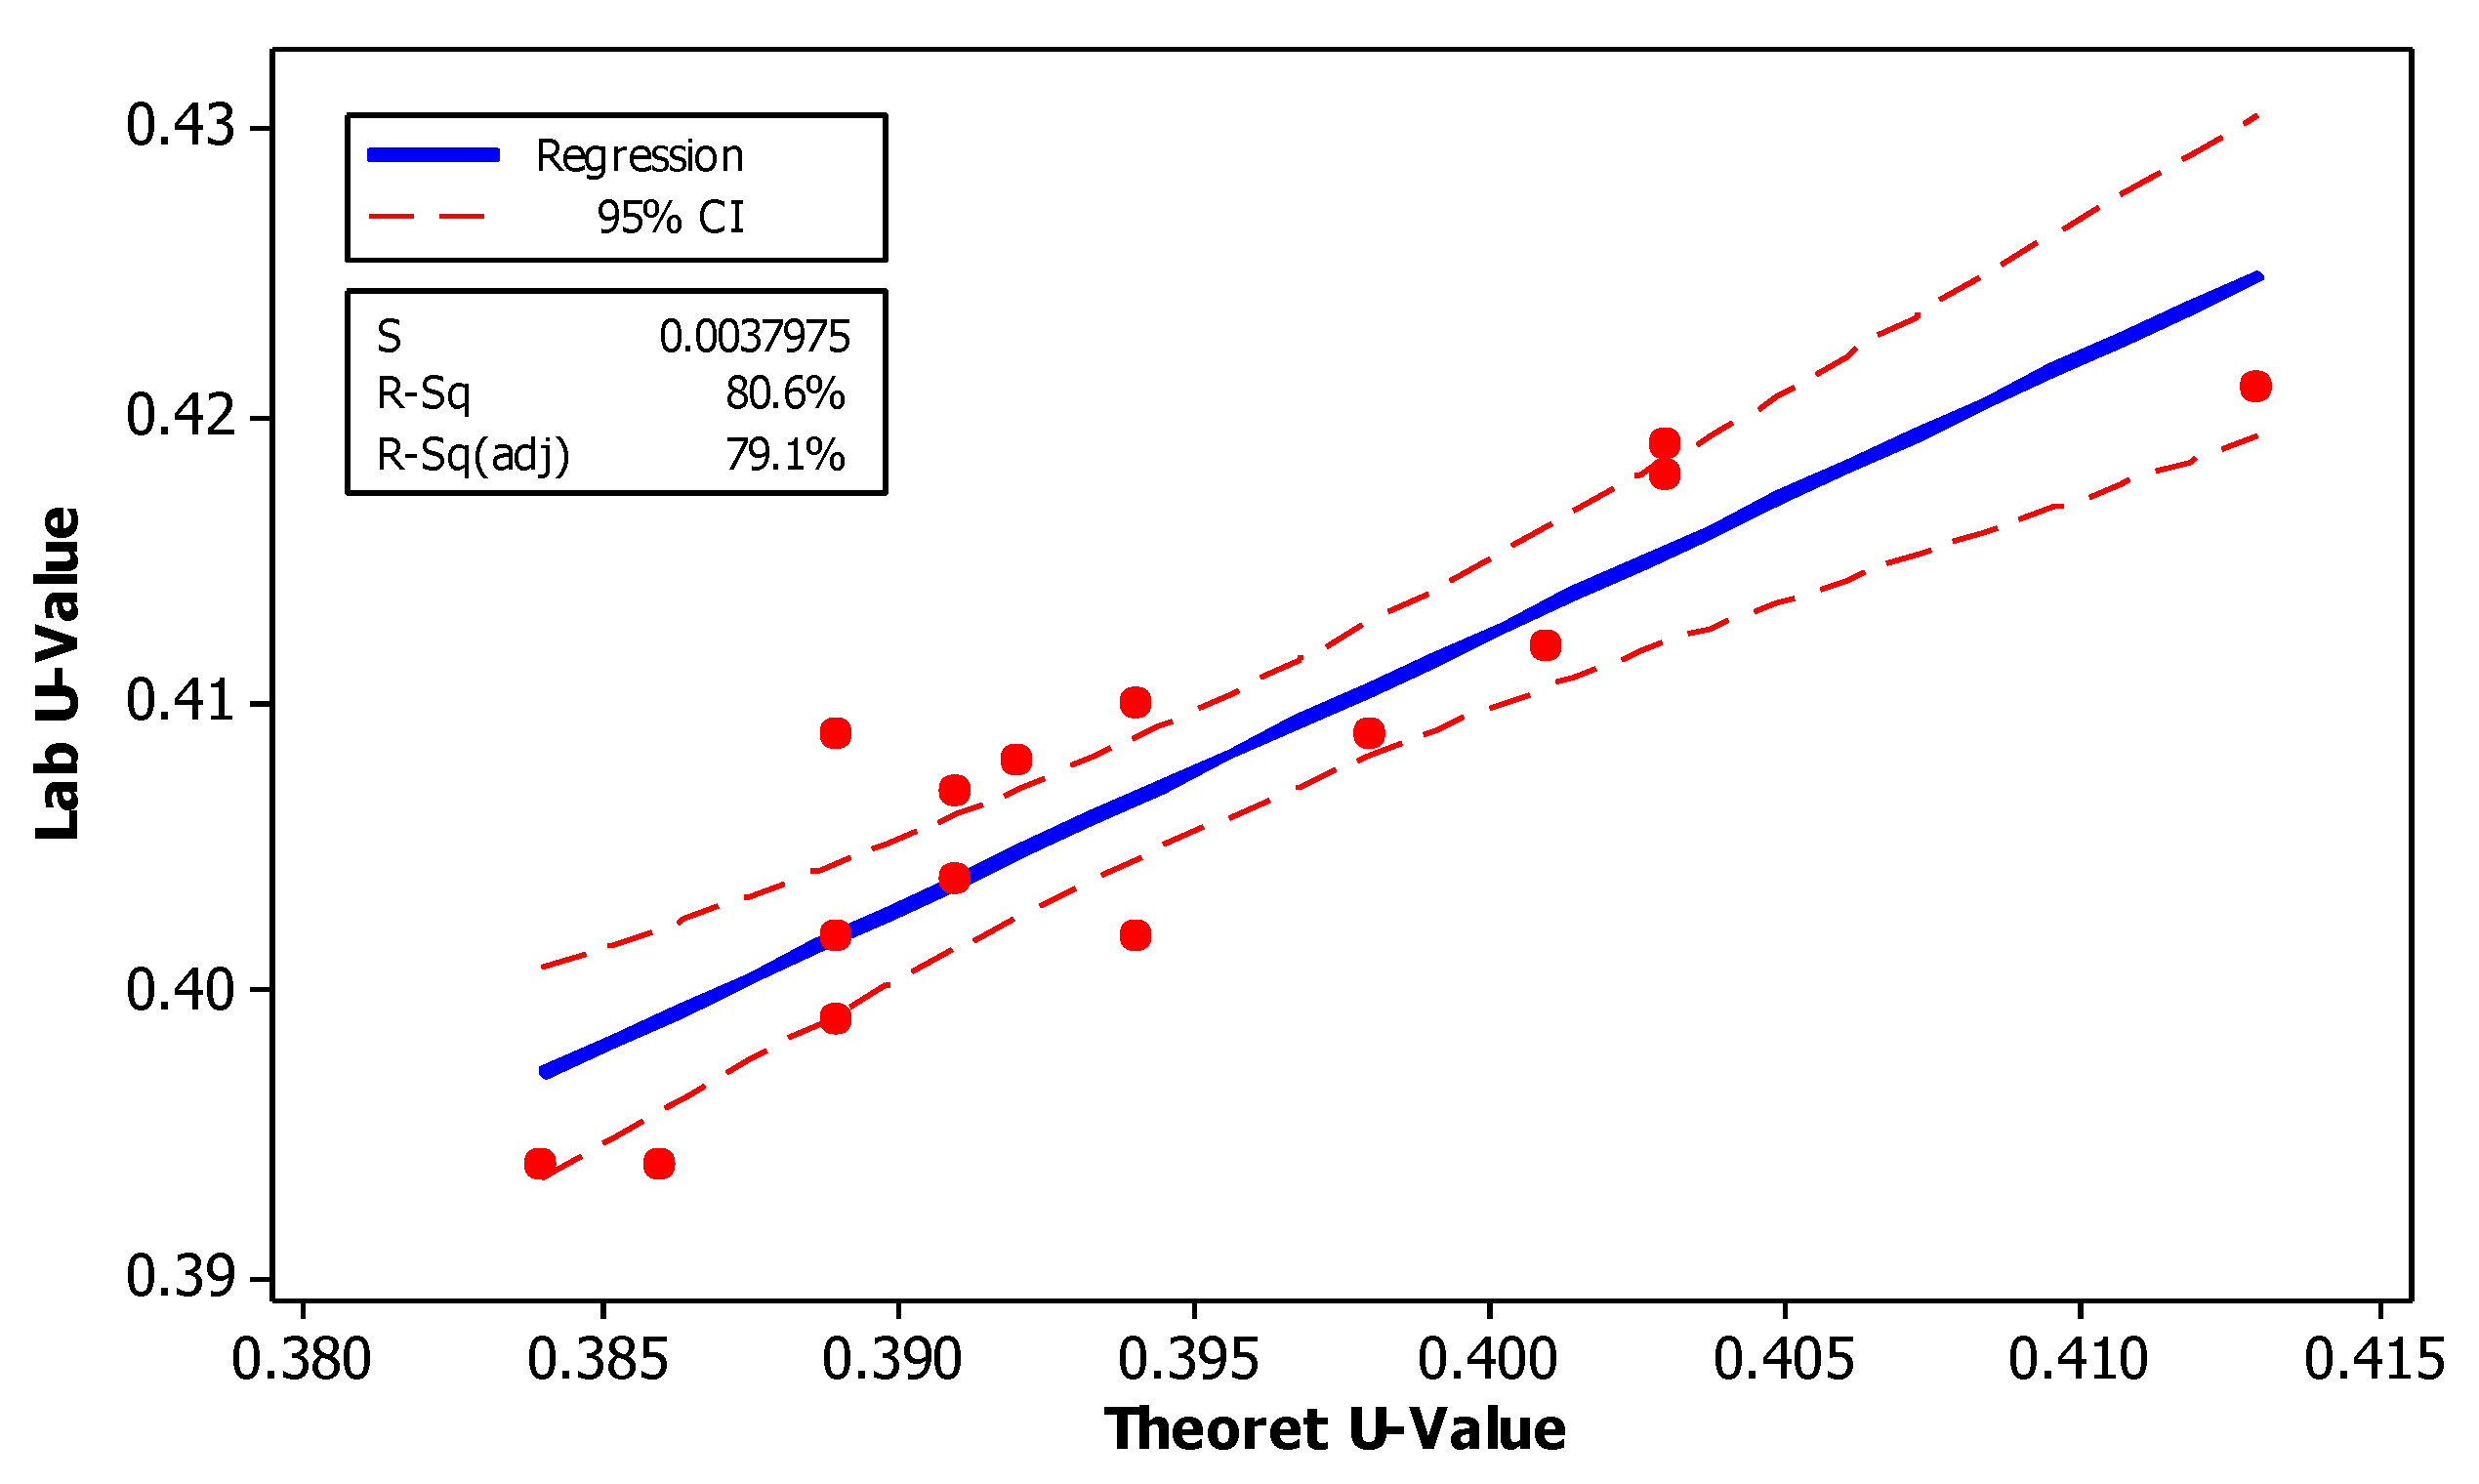
3.3. Comparison of the Two Methods

The lower the U-value is, the better the thermal behavior of the particular measured material. In Figure 7, there is a graphic illustration, with the highest and lowest readings of the U-values for all of the fifteen measurements, respectively. It is witnessed that the value difference between the two measuring methods was quite small as displayed below. The greatest percentage variation between the two methods was at the “CD” setup with a value of 6.64% and the lowest was at the “EE” setup with a value of 1.93%. This is translated into a mean percentage difference of 4.28%. There are several parameters which are challenging to be determined with accuracy in a test wall and affect the thermal behavior (amongst them the humidity, the vapor pressure, and flow). These variables couldn’t be measured with ease at the test wall. On the contrary, the simulation software took those into account. Therefore, the prementioned deviation is noted in the comparison.

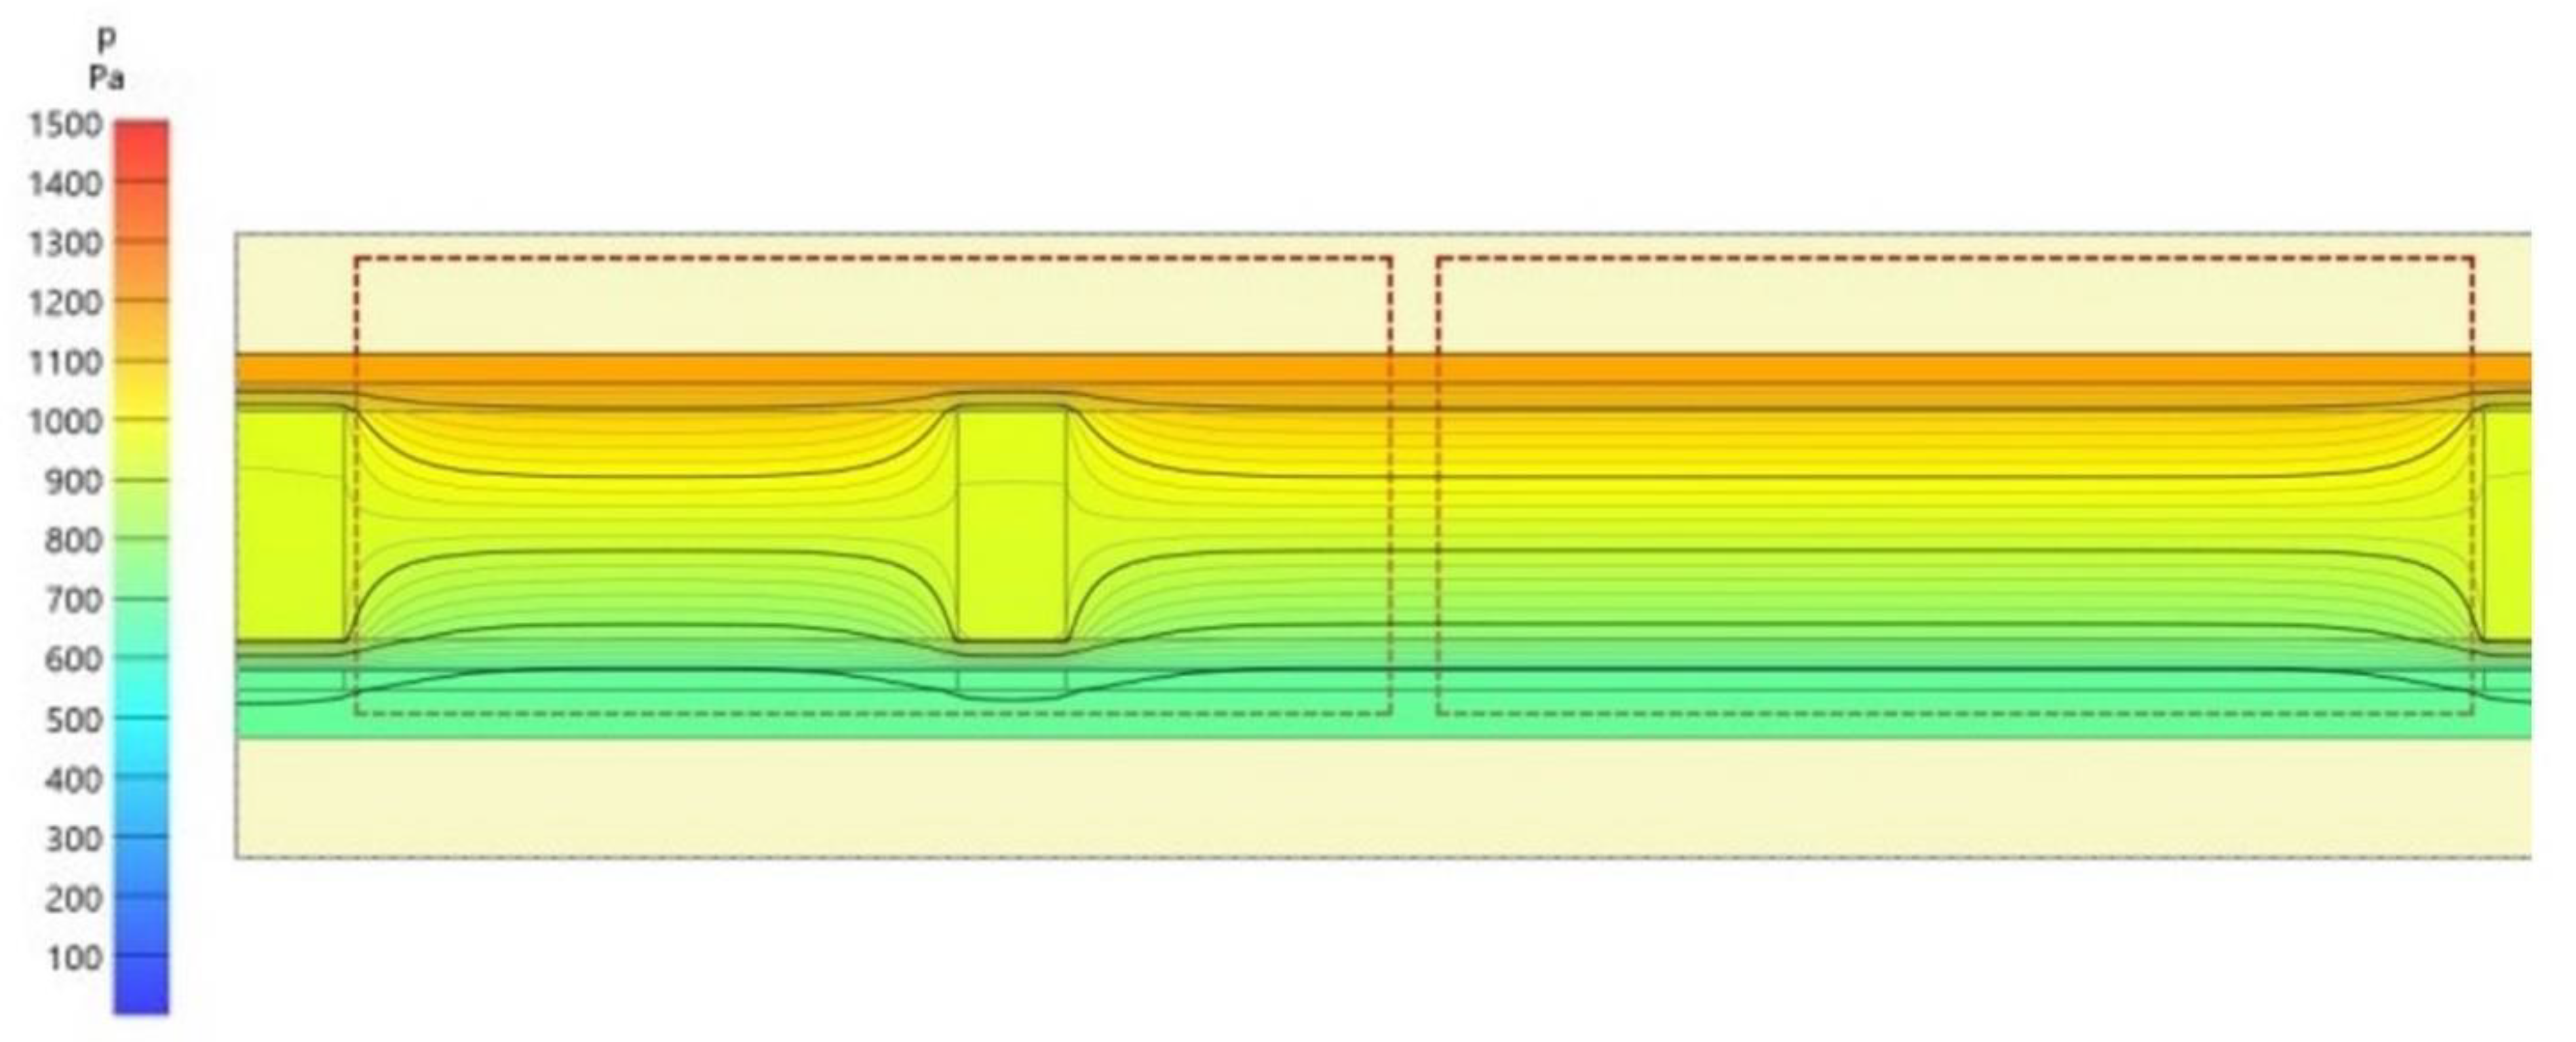
3.4. Additional Features of the Simulation Software

In addition to the U-value readings, the HT-flux simulation software has other available features adequate to display various simulation characteristics, such as heat flow, humidity, vapor flow, and water vapor pressure. The software, having implemented the same design as the test wall, is able to visualize the parts of this wall where the prementioned characteristics may affect the performance of the wall. This is being displayed through a color variation which on a scale exhibit the actual value of each feature.
Through the theoretical simulation, there is a potential of extracting more information concerning the characteristics of the timber frame masonry’s structural elements.
The variance in the pressure of the water vapor from the lowest to the highest temperature’s side can be visualized. The side of the wall with the higher temperature has more pressure which decreases linearly, without difference between the materials consisting the timber wall towards the temperature’s lower side (as can be seen in Figure 8 below).
The temperature deviation between the two surfaces of the timber wall creates water vapor that accumulates in its body. Figure 9 exhibits a greater increase of water vapor (dark red color) on the surface of the timber stud, with a smaller accumulation in the inner part of their contact with the thermal insulation material. In the middle part of the timber frame masonry, a very low level of vapor is visible (which is displayed with the light blue color).
Figure 10 below indicates the heat flux projection with the color palette used to demonstrate the local heat flux, through the color variation scale. The light blue color exhibits the highest heat flux in this wall which is 25 W/m2. In the area corresponding to the specific color, the studs function as the connecting part of the timber framed wall, simulating the actual construction. The combination of insulating materials has been placed in its intermediate part. This section appears in dark blue, which indicates a lower heat flow. Thermal bridges are displayed in the material with the lowest thermal resistance.
Figure 11 presents the percentage of moisture that penetrates the timber wall in each different element. It is observed that in the studs, the surface moisture is reduced in relation to the surface of the wall filled with insulation material. However, the part of the timber wall that consist of the studs, on the outer side, reveals increased humidity in relation to the thermally insulated part of the timber wall.

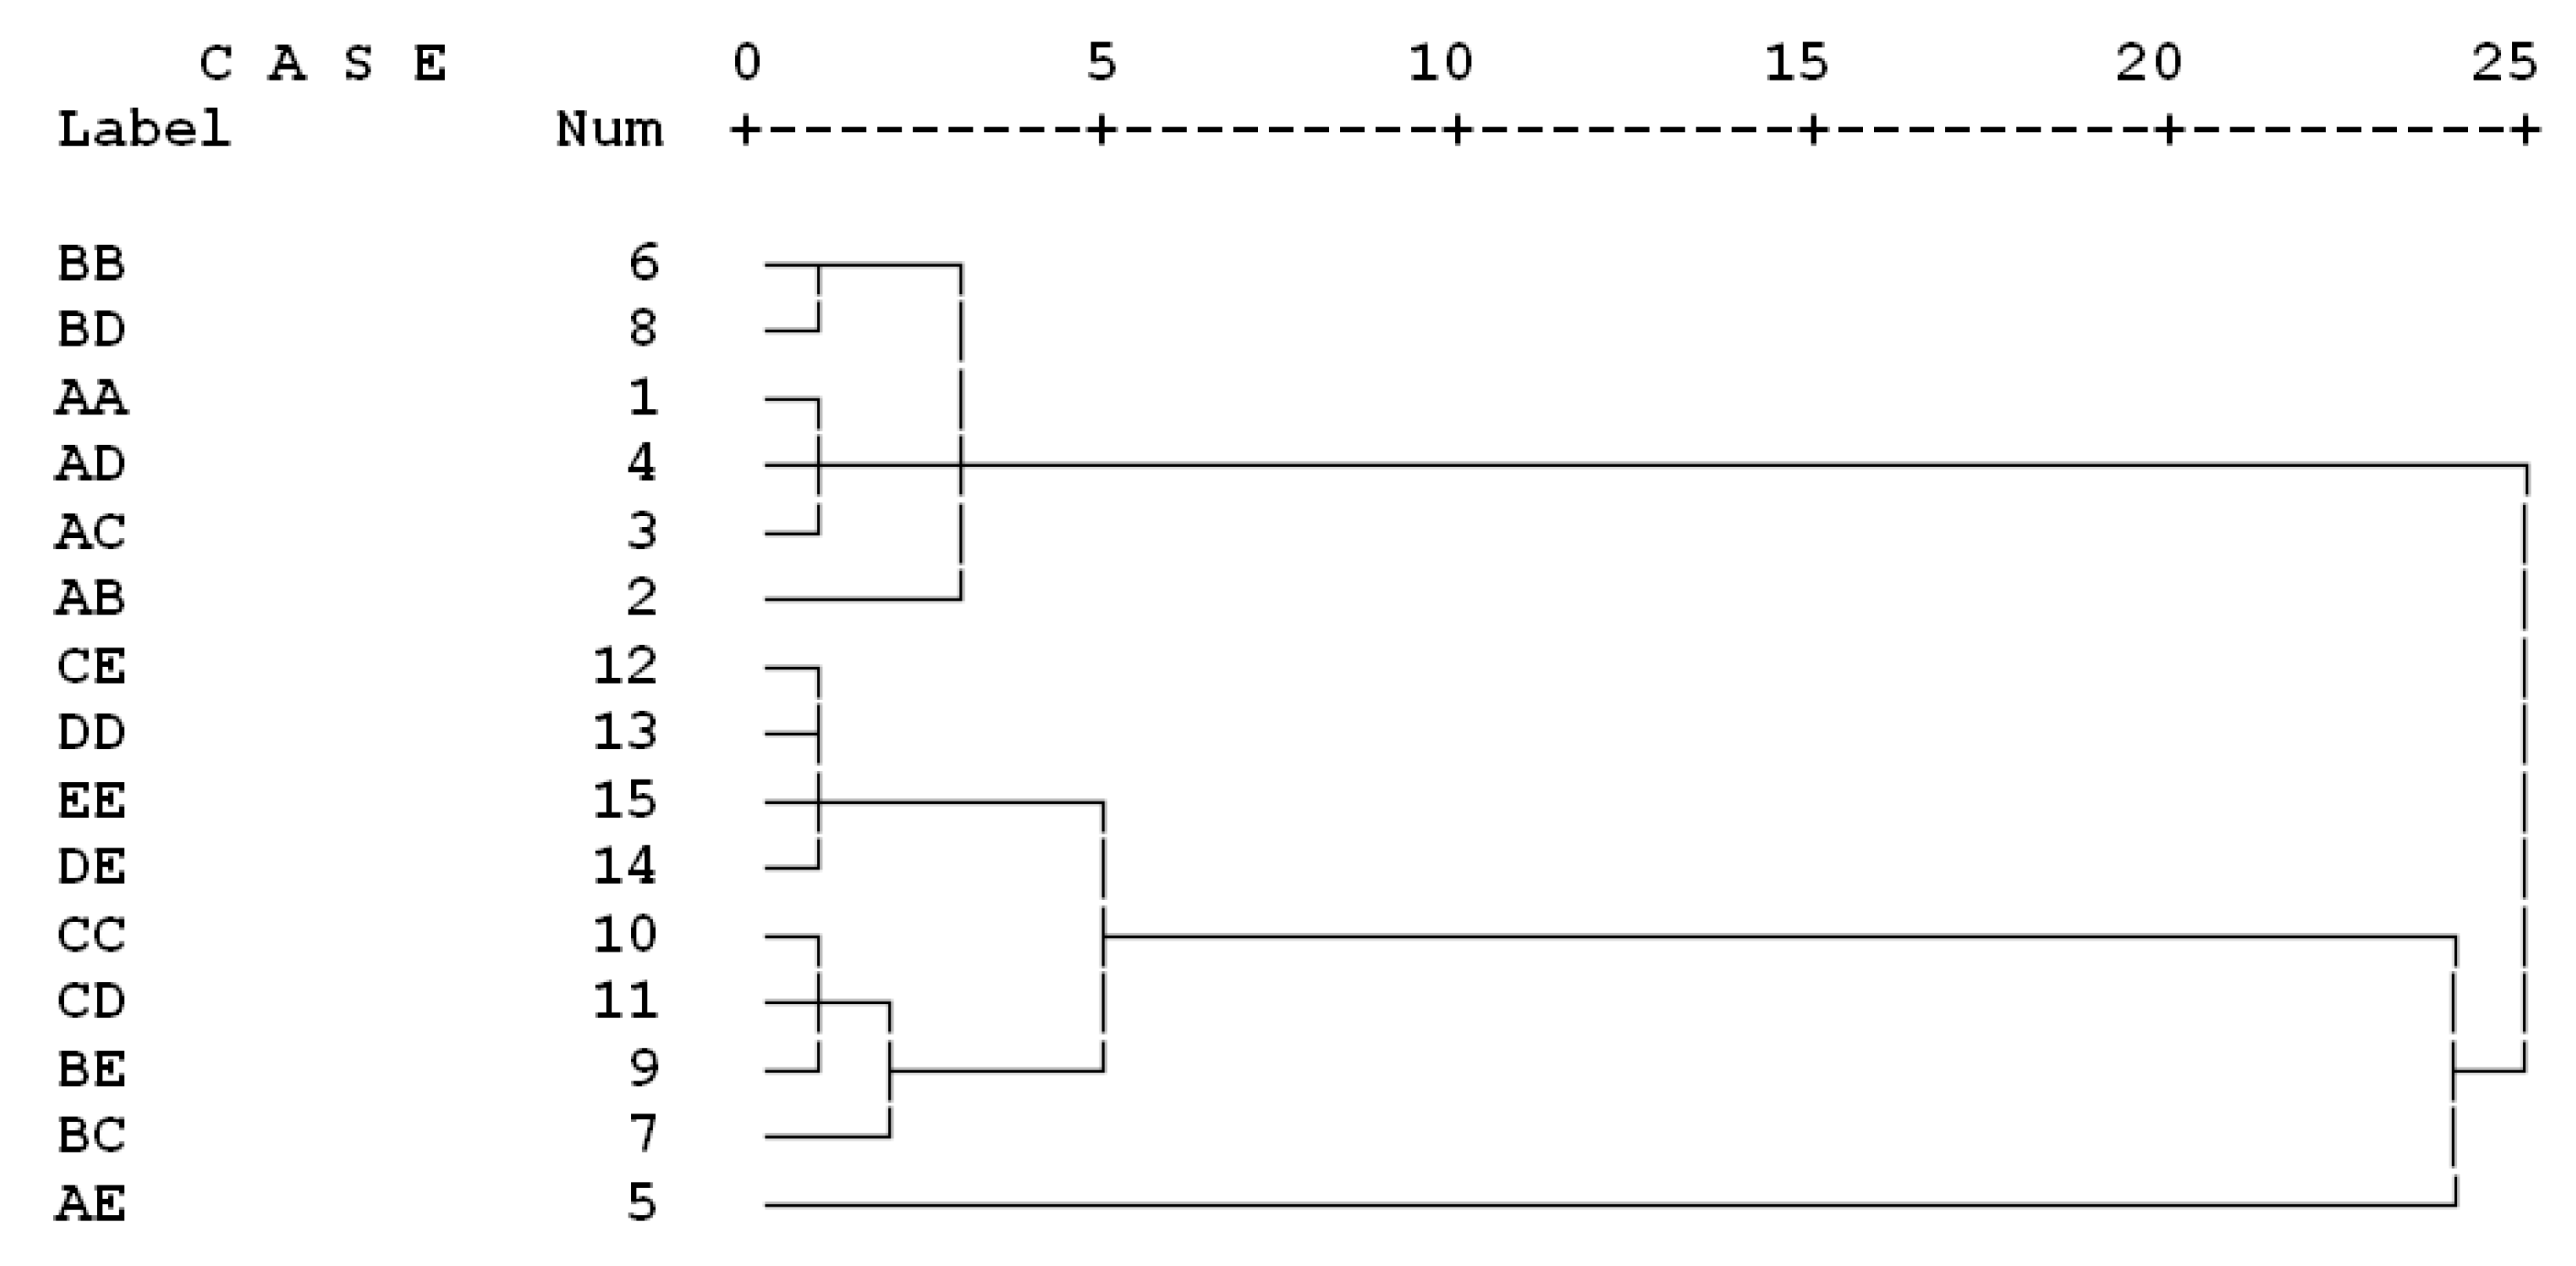
3.5. Cluster Analysis

In this connection, normalized regression analysis between the two thermal transmittance coefficient values (practically measured at the laboratory, and theoretically calculated by a simulation software) demonstrated a rather high R-squared value (as high as 80% as shown in Figure 12). Moreover, contour plot among the lab and theoretical values provided further significant corroborating evidence illustrated as two distinct zones in the graph (although slight discrepancies in the graph were observed as displayed in Figure 13). This clearly indicated that theoretical calculation can provide a reliable basis for primary prediction of U-Values in timber-frame walls, where a high number of replications and material combinations would be costly. Once the primary evaluation is carried out and the target material combinations determined, further practical evaluation by real specimens can give a better scope of the overall U-Values.
Cluster analysis based on the thermal transmittance coefficients and the outdoor temperatures demonstrated two distinct groups clustered remotely to each other (Figure 14). Moreover, the wall type AE was also clustered distinctly and remote from the above mentioned two groups. All wall types having E in their combinations (with an exception of the AE wall type) were collectively clustered in one group. This clearly indicated the decisive effect of glass wool on the thermal transmittance behavior of light timber-frame walls. Moreover, all wall types with extruded polystyrene (denoted as A) were also clustered in a separate distinct group (with an exception of the AE wall type). This again revealed the significant impact of extruded polystyrene on the thermal transmittance coefficient of walls. Combination of the impacts of A and E, and their interactions as well, eventually resulted in wall type AE being separately clustered to the two above mentioned groups. Based on the cluster analysis, it was concluded that the overall thermal behavior of light timber-frame walls are closely dependent on the materials used to produce them, and two materials may have a higher impact on the overall thermal transmittance coefficients, the glass wood, and the extruded polystyrene.

4. Conclusions

This research assessed the thermal transmittance values that emerged from the construction of a light frame timber wall followed by a series of laboratory measurements with a variation of fifteen different insulation setups within this wall. These values were compared to the outputs using a heat flux theoretical simulation software.
The test wall with the fifteen dissimilar insulation configurations gave a series of readings with the use of a Heat Flux Meter (HFM), the “Testo 635-2”. The laboratory conditions were stable and monitored with specific indoor and outdoor conditions throughout the completion of the experimental procedure which lasted 24 h per test sample. The required time to complete the physical measurements was sixteen days and forty-eight manhours (including the construction and recording the readings of all of the fifteen different specimens).
The same design was undertaken with the use of the HT-Flux simulation software. Twelve manhours were required for this approach. For this simulation there was no cost for materials at all. Concurrently, the software assisted greatly to establish several characteristics which affect the thermal performance of the wall which were not possible to be identified with the first approach (construction and measurements of a test timber wall).
Parameters which play a key role to a series of potential improvements during the timber wall design were ascertained. The vapor pressure, the humidity, the heat flux and the vapor flow were monitored and displayed during the design phase with the use of the software. The percentage variation between the two U-value measuring methods was at an average of 4.28%. That corresponded to a U-value of 0.384 (W/m2*K) with the use of the software and a U-Value of 0.421 (W/m2*K) measured at the test wall and a U-value of 0.394 (W/m2*K) with the use of the software and a U-Value of 0.413 (W/m2*K) again measured at the test wall for the “BB” and the “EE” configurations, respectively.
The typical approach using a simulation software is to maintain the experimental cost as low as possible. However, it was proven in this study that the measurements were very close, in absolute values, having employed these two methods.
This study validated the eventuality of using commercial insulation boards as filling material towards achieving the foremost expected outcome in terms of the thermal behavior of a timber wall.
The future steps following this research should be focused on formatting insulation boards from agricultural and wood-based residues and studying their thermal transmittance behavior. This is expected to be very critical once characteristics such as humidity and vapor content for these types of insulation boards are anticipated to have relative high values. Therefore, the use of this simulation software is estimated to assist in wall-design alterations to facilitate the minimum retain of water during the wall’s construction stage.

Author Contributions

Methodology, K.N., A.M., D.K., P.T. and G.N.; validation, K.N., A.M., D.K., P.T. and G.N.; investigation, K.N., A.M., D.K., G.N. and A.M.; writing—original draft preparation, K.N., G.N. and A.N.P.; writing—review and editing, G.N., H.R.T. and A.N.P.; visualization, K.N., A.M., D.K. and G.N.; supervision, G.N., H.R.T. and A.N.P. All authors have read and agreed to the published version of the manuscript.

Funding

This research received no external funding.

Data Availability Statement

The data presented in this study are available on request from the corresponding author.

Conflicts of Interest

The authors declare no conflict of interest.

References

  1. Švajlenka, J.; Kozlovská, M. Evaluation of the efficiency and sustainability of timber-based construction. J. Clean. Prod. 2020, 259, 120835. [Google Scholar] [CrossRef]
  2. Caniato, M.; Bettarello, F.; Ferluga, A.; Marsich, L.; Schmid, C.; Fausti, P. Thermal and acoustic performance expectations on timber buildings. Build. Acoust. J. 2017, 24, 219–237. [Google Scholar] [CrossRef]
  3. Stec, A.A.; Hull, T.R. Assessment of the fire toxicity of building insulation materials. Energy Build. 2011, 43, 498–506. [Google Scholar] [CrossRef]
  4. Papadopoulos, A. Properties Specifications of Thermal Insulation Materials; Heat Transfer Laboratory, Aristotle University of Thessaloniki: Thessaloniki, Greece, 2004; Available online: https://docplayer.gr/556822-Prologos-agis-m-papadopoylos-anapl-kathigitis-a-p-th.html (accessed on 6 December 2021).
  5. Zarr, R.R.; Burch, D.M.; Fanney, A.H. Heat and moisture transfer in wood-based wall construction: Measured versus predicted. NIST Build. Sci. Ser. 1995, 173, 1–2. [Google Scholar]
  6. Dalgliesh, W.A.; Cornick, S.M.; Maref, W.; Mukhopadhyaya, P. Hygrothermal performance of building envelopes: Uses for 2d and 1d simulation. In Proceedings of the 10th Conference on Building Science and Technology, Ottawa, ON, Canada, 12–13 May 2005. [Google Scholar]
  7. Taghiyari, H.R.; Norton, J.; Tajvidi, M. Effects of Nano-Materials on Different Properties of Wood-Composite Materials. In Bio-based Wood Adhesives: Preparation, Characterization and Testing; CRC Press; Taylor & Francis Group: Boca Raton, FL, USA, 2017; pp. 310–339. [Google Scholar]
  8. Bergman, T.; Lavine, A.; Incropera, F.; DeWitt, D. Fundamentals of Heat and Mass Transfer, 7th ed.; John Wiley & Sons: New York, NY, USA, 2011. [Google Scholar]
  9. Taghiyari, H.R.; Soltani, A.; Esmailpour, A.; Hassani, V.; Gholipour, H.; Papadopoulos, A.N. Improving thermal conductivity coefficient in oriented strand lumber (OSL) using sepiolite. Nanomaterials 2020, 10, 599. [Google Scholar] [CrossRef] [PubMed] [Green Version]
  10. Kristak, L.; Kubovsky, I.; Reh, R. New Challenges in Wood and Wood-Based Materials. Polymers 2021, 13, 2538. [Google Scholar] [CrossRef] [PubMed]
  11. Ninikas, K. Evaluation of the Thermal Performance of a Wooden Masonry with Insulation Boards Constructed from Wood By-Products and Agricultural Residues. Master’s Thesis, Technological Educational Institute of Thessaly, Karditsa, Greece, May 2018. [Google Scholar]
  12. T.O.T.E.E 20701-2/2010. Thermophysical Properties of Building Materials and Control of the Thermal Insulation Adequacy of Buildings, 1st ed.; Technical Chamber of Greece: Athens, Greece, July 2010; Available online: http://www.mie.uth.gr/ekp_yliko/TOTEE-20701-2-Final%CE%A4%CE%95%CE%95_1.pdf (accessed on 8 December 2021).
  13. Wakili, K.G.; Tanner, C. U-value of a dried wall made of perforated porous clay bricks: Hot box measurement versus numerical analysis. Energy Build. 2003, 35, 675–680. [Google Scholar] [CrossRef]
  14. Kucerova, L.; Černíková, M.; Hrubá, B. Thermal properties of wooden buildings in relation to computer software. Adv. Mater. Res. 2014, 899, 193–196. [Google Scholar]
  15. Ninikas, K.; Mitani, A.; Koutsianitis, D.; Ntalos, G.; Taghiyari, H.R.; Papadopoulos, A.N.N. Thermal and Mechanical Properties of Green Insulation Composites made from Cannabis and Bark Residues. J. Compos. Sci. 2021, 5, 132. [Google Scholar] [CrossRef]
  16. Antov, P.; Jivkov, V.; Savov, V.; Simeonova, R.; Yavorov, N. Structural Application of Eco-Friendly Composites from Recycled Wood Fibres Bonded with Magnesium Lignosulfonate. Appl. Sci. 2020, 10, 7526. [Google Scholar] [CrossRef]
  17. TESTO 635-2 Temperature & Moisture Apparatus. Available online: https://www.testo.com/en-US/testo-635-2/p/0563-6352 (accessed on 30 December 2021).
  18. HTflux Hygric and Thermal Simulation Software. Available online: https://www.htflux.com/en/documentation/boundary-conditions/ (accessed on 30 December 2021).
Figure 1. The five insulation materials used—described in Table 1.
Jcs 06 00022 g001
Figure 2. The light-frame timber wall with two dissimilar insulation materials.
Jcs 06 00022 g002
Figure 3. Top view (detail) of the constructed light-frame timber wall.
Jcs 06 00022 g003
Figure 4. Installation of the masonry in the quality control mechanism for the measurement of thermal permeability using the TESTO 635-2 heat flux measuring apparatus.
Jcs 06 00022 g004
Figure 5. The U-value readings.
Jcs 06 00022 g005
Figure 6. Completion of the design of the light-frame timber masonry. The color variation displays the different materials used based on the Table 3 (masonry board, studs, insulation, humidity membrane, OSB, etc).
Jcs 06 00022 g006
Figure 7. Comparative graphic representation of the U-Values. Laboratory measurements, blue bars; simulation software, red bars.
Jcs 06 00022 g007
Figure 8. Theoretical simulation display of the timber wall’s water vapor pressure.
Jcs 06 00022 g008
Figure 9. Theoretical simulation display of the vapor flow.
Jcs 06 00022 g009
Figure 10. Theoretical simulation display of the heat flux.
Jcs 06 00022 g010
Figure 11. Theoretical simulation display of the humidity.
Jcs 06 00022 g011
Figure 12. Contour plots between laboratory measurements and theoretical simulations. Theoretical simulation; U-Value, thermal transmittance coefficient.
Jcs 06 00022 g012
Figure 13. Minitab plots between laboratory measurements and theoretical simulations, demonstrating high and significant R-squared value (80%).
Jcs 06 00022 g013
Figure 14. Cluster analysis based on the thermal transmittance coefficients and the outdoor temperatures (the 15 treatments clustered to each other are defined in Table 4 and Table 5).
Jcs 06 00022 g014
Table 1. Sample code correspondence to the insulating materials.
NumberSample CodeName of Insulating Material
1AExtruded polystyrene
2BExpanded polystyrene
3CStone wool
4DMineral wool
5EGlass wool
Table 2. Combination of insulating materials.
Number of ExperimentsCombination of Insulating Materials
1AA
2AB
3AC
4AD
5AE
6BB
7BC
8BD
9BE
10CC
11CD
12CE
13DD
14DE
15EE
Table 3. Masonry layers used (thickness).
NumberDescriptionThickness (mm)
1Exterior masonry board (Pine)20
2Ventilation lath (Pine)8
3Ventilation-humidity membrane1
4Oriented Strand Board (OSB)12
5Void for Insulation95
6Oriented Strand Board (OSB)12
7Interior masonry board (Pine)12
Table 4. Laboratory readings of the thermal transmittance, the indoor and outdoor temperatures of the timber wall with the combinations of the insulating materials.
Sample NameInsulating Material 1Insulating Material 2Indoor Temperature Ti (°C)Outdoor Temperature Te (°C)U-Value * (W/m2*K)
AAExtruded polystyreneExtruded polystyrene207.10.402
ABExtruded polystyreneExpanded polystyrene208.10.399
ACExtruded polystyreneStone wool207.10.404
ADExtruded polystyreneMineral wool207.00.402
AEExtruded polystyreneGlass wool204.40.419
BBExpanded polystyreneExpanded polystyrene207.00.394
BCExpanded polystyreneStone wool208.10.409
BDExpanded polystyreneMineral wool207.00.394
BEExpanded polystyreneGlass wool208.00.419
CCStone woolStone wool208.00.415
CDStone woolMineral wool208.00.417
CEStone woolGlass wool207.10.418
DDMineral woolMineral wool207.30.417
DEMineral woolGlass wool206.90.412
EEGlass woolGlass wool207.10.421
* U-value: thermal transmittance coefficient
Table 5. The readings of the thermal transmittance, the indoor and outdoor temperatures through a theoretical analysis with the combinations of the insulating materials.
Sample NameInsulating Material 1Insulating Material 2Indoor Temperature Ti (°C)Outdoor Temperature Te (°C)U-Value (W/m2*K)
AAExtruded polystyreneExtruded polystyrene205.00.394
ABExtruded polystyreneExpanded polystyrene205.00.389
ACExtruded polystyreneStone wool205.00.391
ADExtruded polystyreneMineral wool205.00.389
AEExtruded polystyreneGlass wool205.00.403
BBExpanded polystyreneExpanded polystyrene205.00.384
BCExpanded polystyreneStone wool205.00.389
BDExpanded polystyreneMineral wool205.00.386
BEExpanded polystyreneGlass wool205.00.398
CCStone woolStone wool205.00.394
CDStone woolMineral wool205.00.391
CEStone woolGlass wool205.00.403
DDMineral woolMineral wool205.00.392
DEMineral woolGlass wool205.00.401
EEGlass woolGlass wool205.00.413
Publisher’s Note: MDPI stays neutral with regard to jurisdictional claims in published maps and institutional affiliations.

