Article

In-Process Monitoring of Changing Dynamics of a Thin-Walled Component During Milling Operation by Ball Shooter Excitation

1
MTA-BME Lendület Machine Tool Vibration Research Group, H-1111 Budapest, Hungary
2
Department of Applied Mechanics, Budapest University of Technology and Economics, H-1111 Budapest, Hungary
*
Author to whom correspondence should be addressed.
J. Manuf. Mater. Process. 2020, 4(3), 78; https://0-doi-org.brum.beds.ac.uk/10.3390/jmmp4030078
Submission received: 12 June 2020 / Revised: 24 July 2020 / Accepted: 27 July 2020 / Published: 3 August 2020
(This article belongs to the Special Issue Machine Tool Dynamics)

Abstract

:
During the milling of thin-walled workpieces, the natural frequencies might change radically due to the material removal. To avoid resonant spindle speeds and chatter vibration, a precise knowledge of the instantaneous modal parameters is necessary. Many different numerical methods exist to predict the changes; however, small unmodelled effects can lead to unreliable results. The natural frequencies could be measured by human experts based on modal analysis for an often interrupted process; however, this method is not acceptable during production. We propose an online measurement method with an automatic ball shooter device which can excite a wide frequency range of the flexible workpiece. The method is presented for the case of blade profile machining. The change of the natural frequencies is predicted based on analytical models and finite element simulations. The measurement response for the impulse excitation of the ball shooter device is compared to the results of impulse modal tests performed with a micro hammer. It is shown that the ball shooter is capable of determining even the slight variation of the natural frequencies during the machining process and of distinguishing the slight change caused by different clamping methods. An improved FE model is proposed to include the contact stiffness of the fixture.

1. Introduction

Several factors affect the productivity of manufacturing by milling processes. One key component is the material removal rate, which cannot be arbitrarily increased due to undesirable vibrations. The most critical form of vibrations is called chatter, which can result in unacceptable surface quality and possible damage in the milling tool and/or in machining centre components [1,2,3,4,5].
The preferable machining parameters, where chatter does not occur, are usually illustrated on the so-called stability chart, from which one can select optimal technological parameters in order to achieve acceptable surface quality and the highest available material removal rate [6,7,8]. Usually, the most productive parameter regions are located near the pockets of the so-called stability lobes. In these regions, however, large-amplitude stationary vibrations can occur due to resonant excitation, which results in significant surface location errors [9], but it can be compensated with a well-defined tool path correction.
According to [10], over the past six decades, an extensive number of studies have addressed the investigation of productivity and chatter, still, the relationship between tool wear and chatter is complex and is still an open field of research.
In [11] it is shown that the vibration amplitude has a direct influence the surface quality and on tool life; consequently, even in the case of stable milling processes, tool wear can still be progressed due to the large-amplitude stationary vibration, in contrast to turning, where stable operation results in continuous and smooth chips. Therefore, not only stability but also large-amplitude stationary vibrations must be considered during the analysis of tool wear. In [12] the authors introduce the so-called superchart, which is the stability lobe diagram presented together with the surface location error. This surface error relates to the large-amplitude stationary vibrations, thereby one can select stable machining conditions while obtaining indirect information about tool wear. A comprehensive literature review about tool wear associated with chatter can be found in [10,13] and all the references therein.
In addition, according to [14], at lower spindle speeds, it is more likely that chatter appears for a new tool, while chatter may vanish later as tool wear starts to appear. The most accepted explanation for this is the effect of process damping when the flank face of the tool is in contact with the workpiece, thereby increasing the achievable stability domain. The explanation of process damping and tool wear is out of the scope of this paper, although there exist several models in the literature [15,16,17,18].
It is well-known that the dynamic properties of the workpiece and the machining centre greatly affect the performance of the milling operation. The position of the lobes in the stability chart is primarily influenced by the natural frequencies of the system. Consequently, there is an essential need to accurately determine these dynamic parameters in the interest of precise stability chart production. An additional challenge in this task is that dynamic behaviour can vary significantly during the machining process itself. The dynamic characteristics of a tool may vary, depending on the actual configurations of the machine tool structure within the workspace [19,20,21,22] and it may also change for different spindle speeds (e.g., Campbell diagram) [23]. In addition, the changing dynamic behaviour can also correspond to the workpiece, as its geometry varies according to the removed material quantity. These phenomena can be substantial and can result in a significant change in the stability lobe diagrams [24,25,26,27,28] for thin-walled parts where sometimes 90% of the original material is removed, such as in case of turbine blade manufacturing, cutting tubular parts, pocket milling and rib machining. It is the varying workpiece dynamics which is in the focus of this study.
To model thin-walled parts, a reasonable choice is the Finite Element Analysis (FEA). Although FEA can be applied to any complex structure, the geometry of the model and the corresponding mesh have to be frequently updated due to the removed material. This procedure requires considerable computational effort and time. In addition, despite the fact that the stiffness of a structure can accurately be determined with a properly created FE model, the modelling of the contact surfaces makes the results for the natural frequencies very sensitive for parameter tuning. For accurate modelling of contact surfaces (e.g., clampings), spring-damper elements can be inserted; however, the parameters must be tuned based on measurement results.
The receptance coupling method is widely used to properly update the model and to reduce the computational time [29,30,31]. It can be based on both FEA and real measurement. However, it should be noted that complete modal testing requires a trained expert and it is very time-consuming as well. Even with the receptance coupling method, it is still difficult to properly model the entire operation, since the model errors are accumulating during the material removal phase.
A possible solution is to “pause” the milling process at certain steps and perform modal testing in the meantime. This allows the model to be corrected and adapted to the measurement results step by step. This lengthy process could be accepted during the fine-tuning of the milling operation, but it is not feasible in mass production; the modal parameters can change slowly in time by the ageing of the components, or simply by using a new tool. Modal testing during the cutting process presents additional challenges [32], since, in case of traditional modal testing, the Frequency Response Function (FRF) can be determined from the response of impulse excitation induced by a modal hammer [33]. However, during the hammer excitation of thin-walled workpieces, the so-called multiple-hitting (prall) phenomenon can easily occur causing non-ideal input force, which should be avoided.
A ball shooter device can replace the modal hammer and eliminate many of its disadvantages. Just to name a few: the shorter impact time of pellet shots reduces the multiple-hitting effect, leading to a wide achievable frequency bandwidth, therefore vibration modes with very high frequencies can be excited; it can access hidden locations of the workpiece; the use of traditional modal hammer poses safety risk during the rotating milling tool; the ball shooter has high repeatability capabilities and it can be triggered precisely by external signals; combining the ball shooter with an automatic unmanned expert monitoring system, the milling process does not need to be paused [34]. Please note that a detailed investigation of pellet impacts for impulse excitation can be found in [35].
Our goal in this paper is to measure the varying natural frequencies automatically during the milling process by means of using a ball shooter device. As a first step, this may be enough to avoid chatter at a higher material removal rate to increase the productivity, since it makes it possible to keep track of optimal positions of the varying stability lobes [36,37]. With this on-line information, the spindle speed could be fine-tuned properly, since the preferable technological parameters are usually close to the resonant speeds.
One current drawback of the ball shooter device is that we have only partial information about the force signal, which is essential for the modal analysis. In this study, it is shown that the spectrum of the excitation is so large that even a single acceleration signal is satisfactory to determine the natural frequencies accurately.
The paper is organized as follows: in Section 2.1, the investigated blade-type workpiece is introduced. Then, in Section 2.2, an analytical approach is presented to give an insight into the underlying effect of the pulsating natural frequencies. Section 2.3 presents the results of the FEA. In Section 3. the measurement results of the impulse tests, performed with a micro hammer and the ball shooter, are analysed. Finally, an improved FEA model is provided in order to fit the model to the measurement results. Conclusions are presented, and we discuss future research directions.

2. Materials and Methods

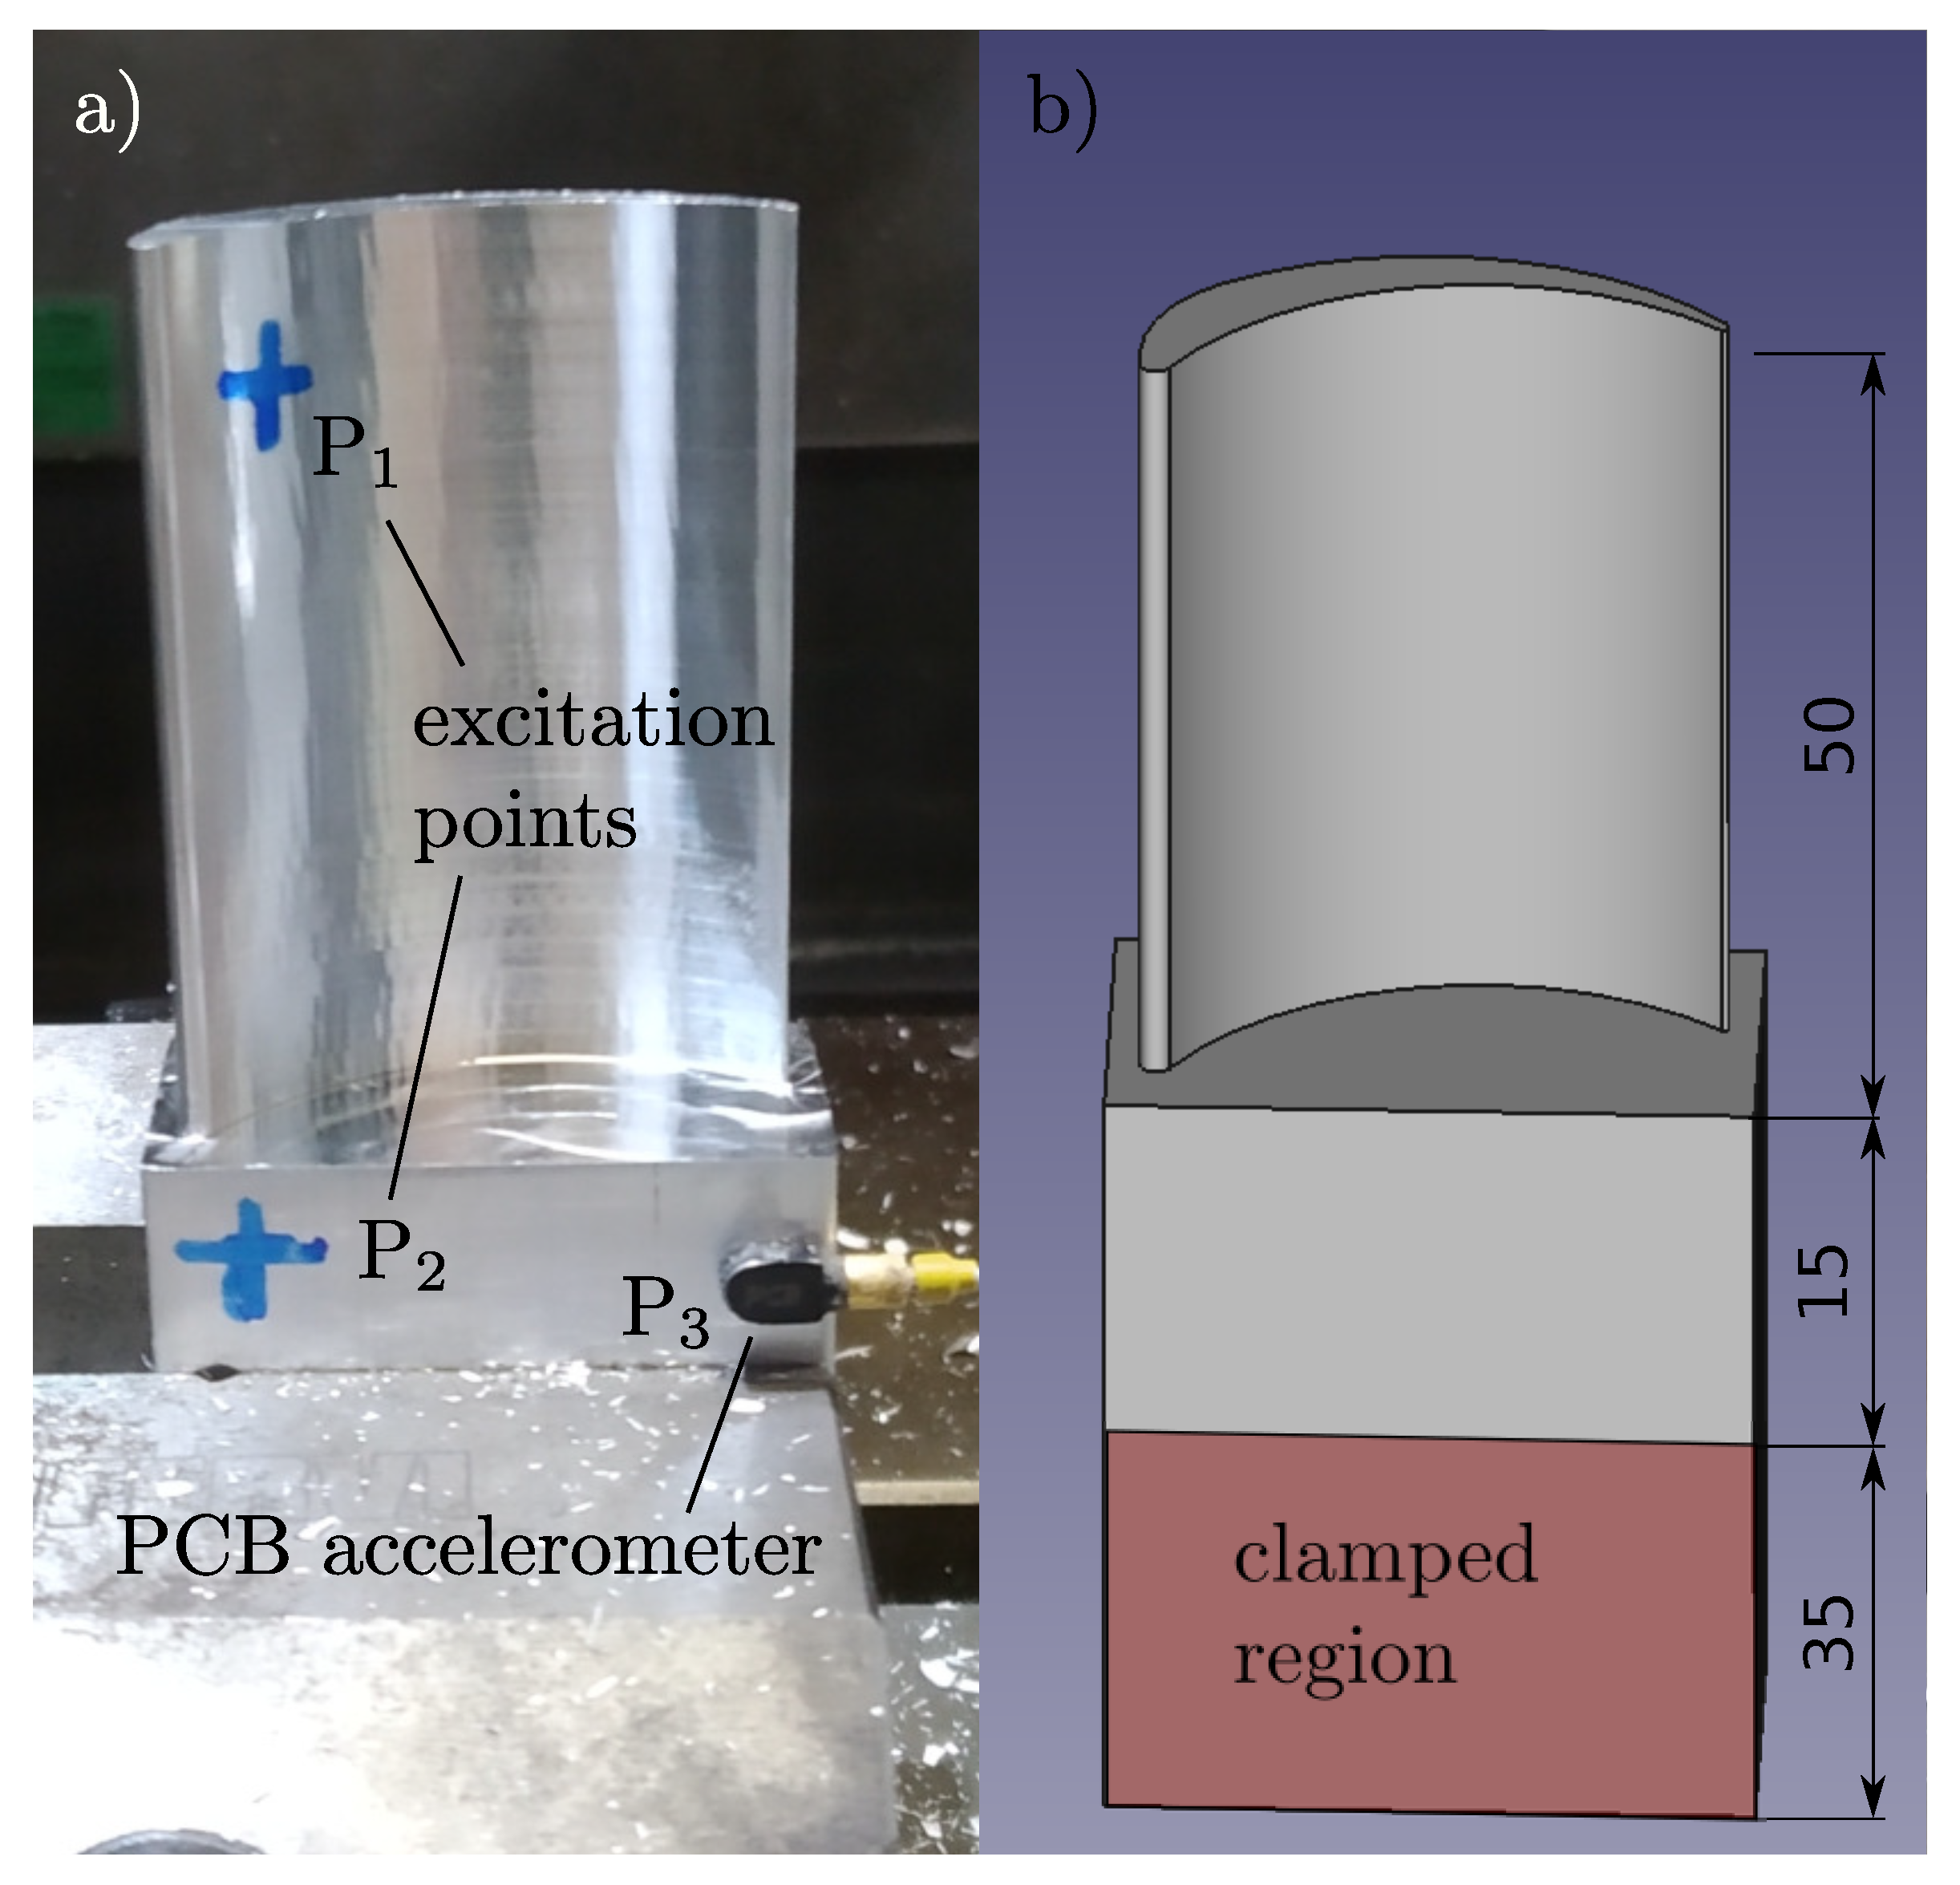
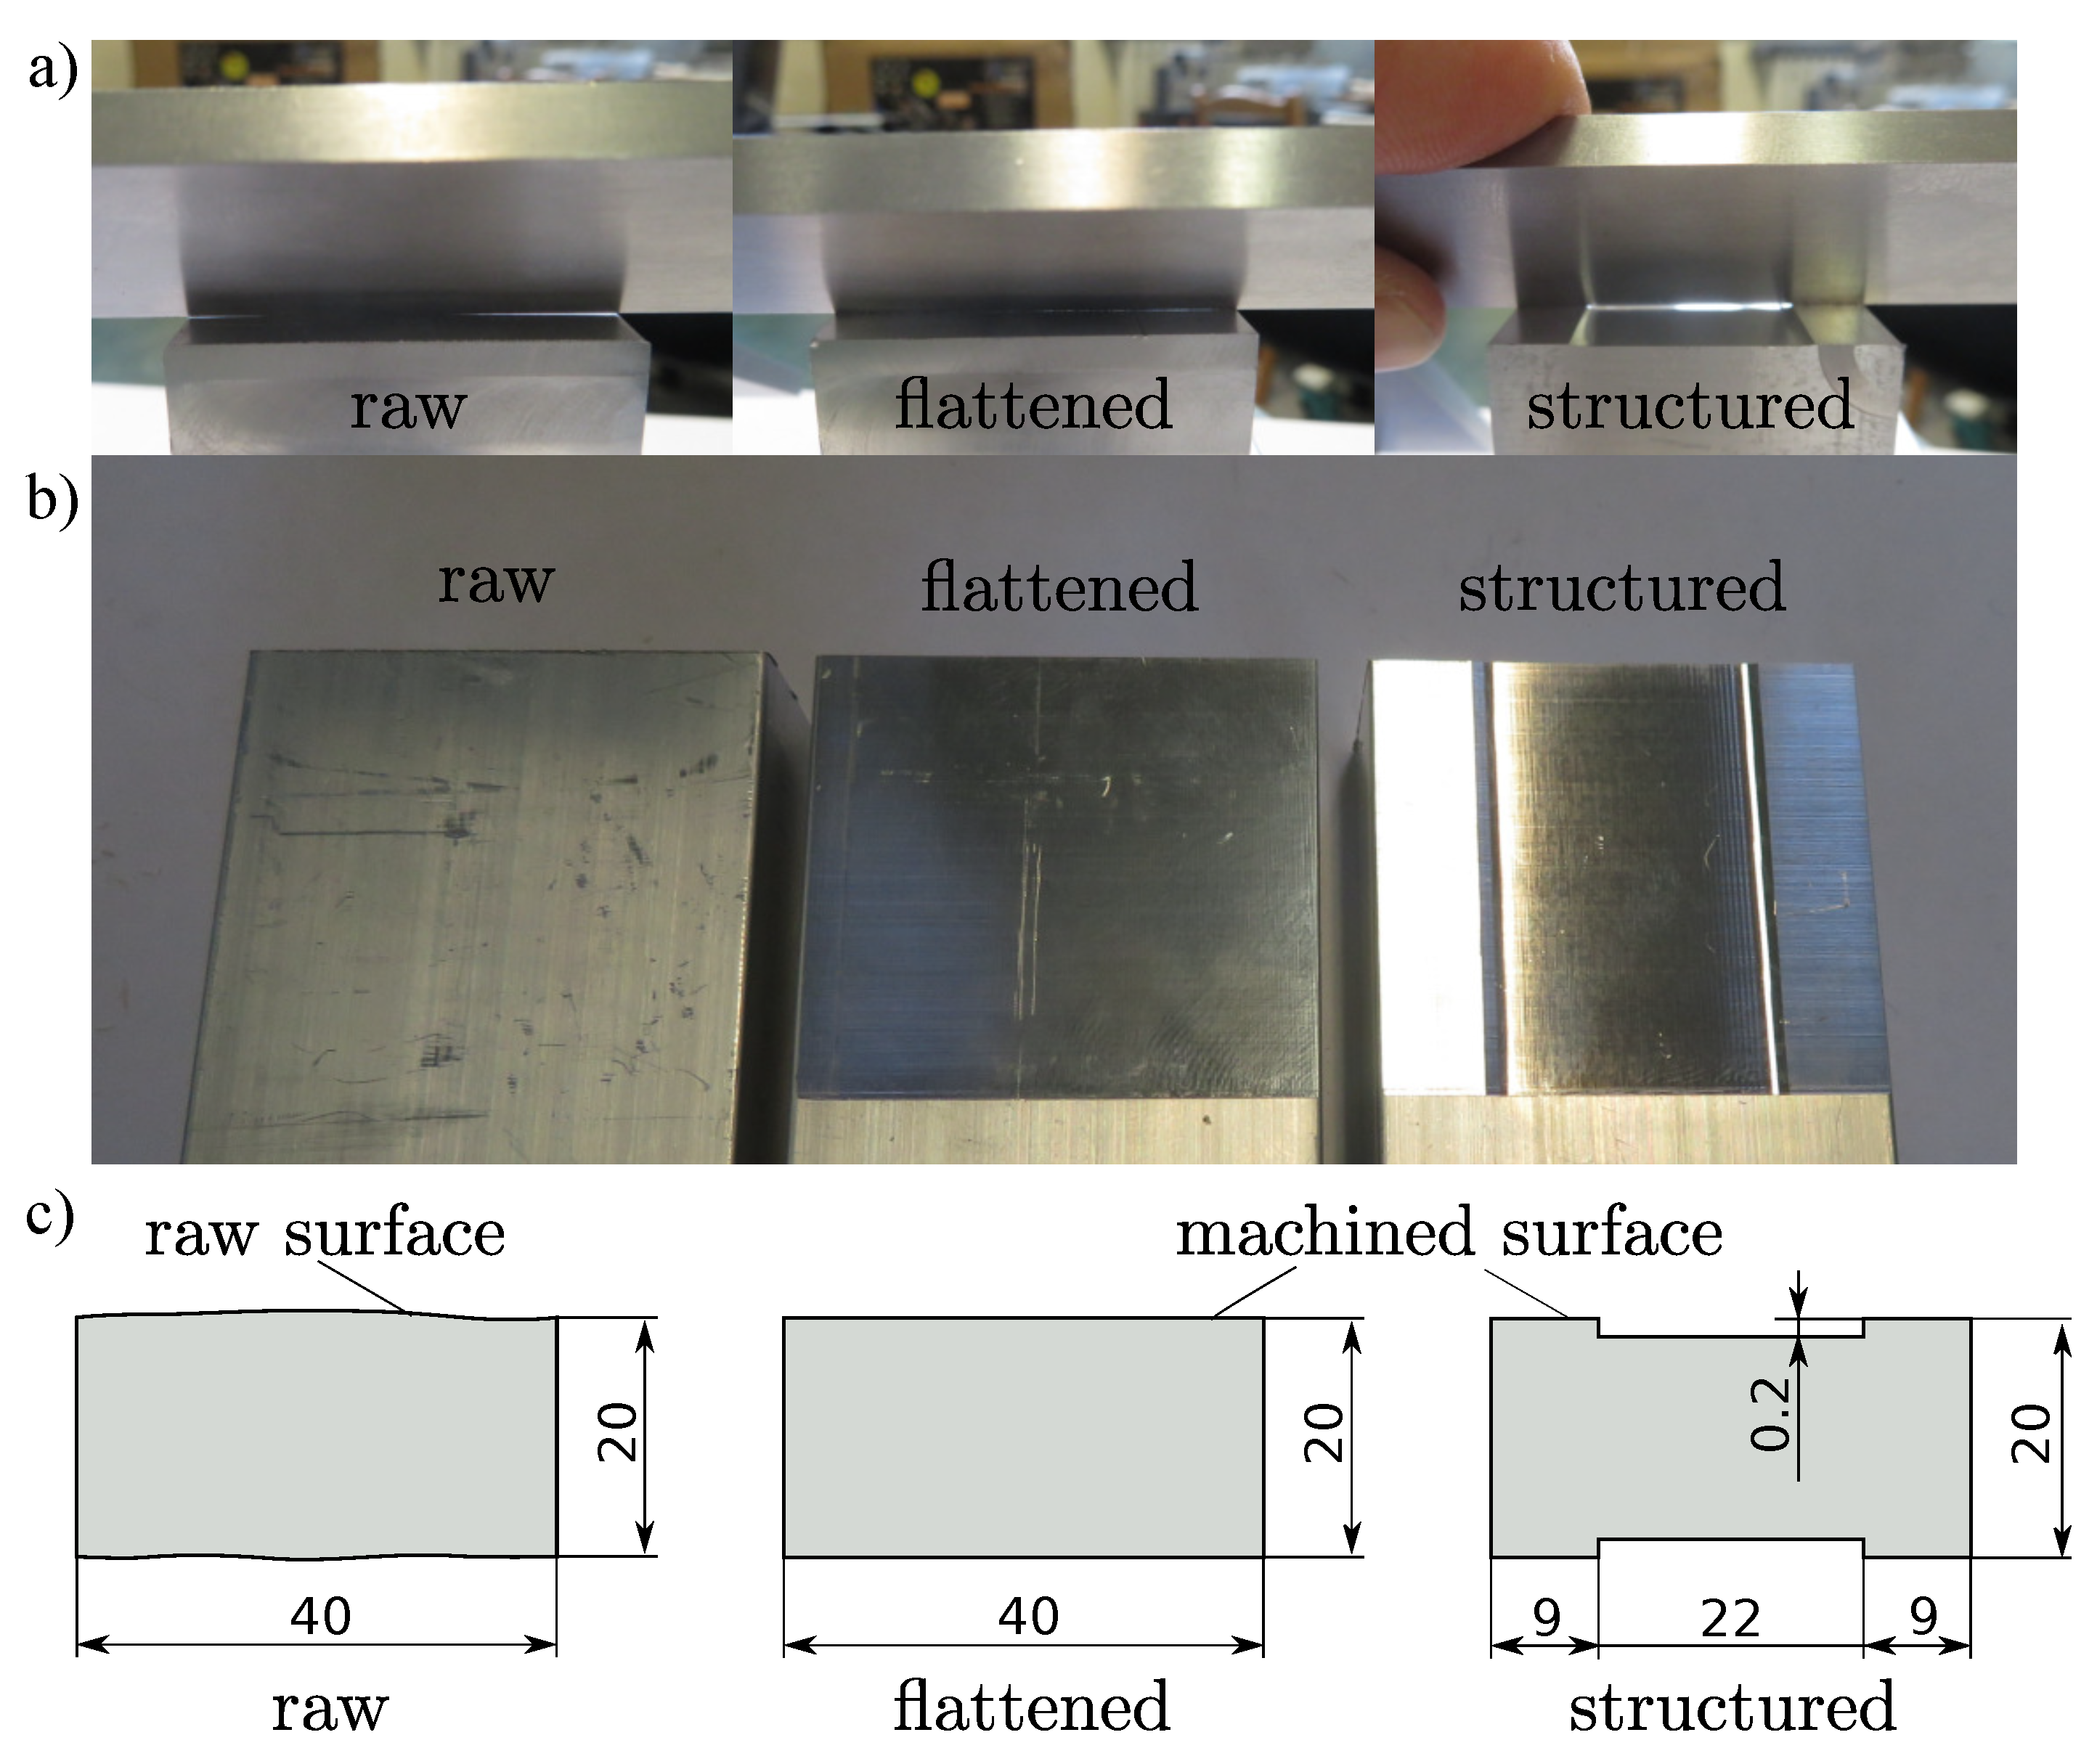
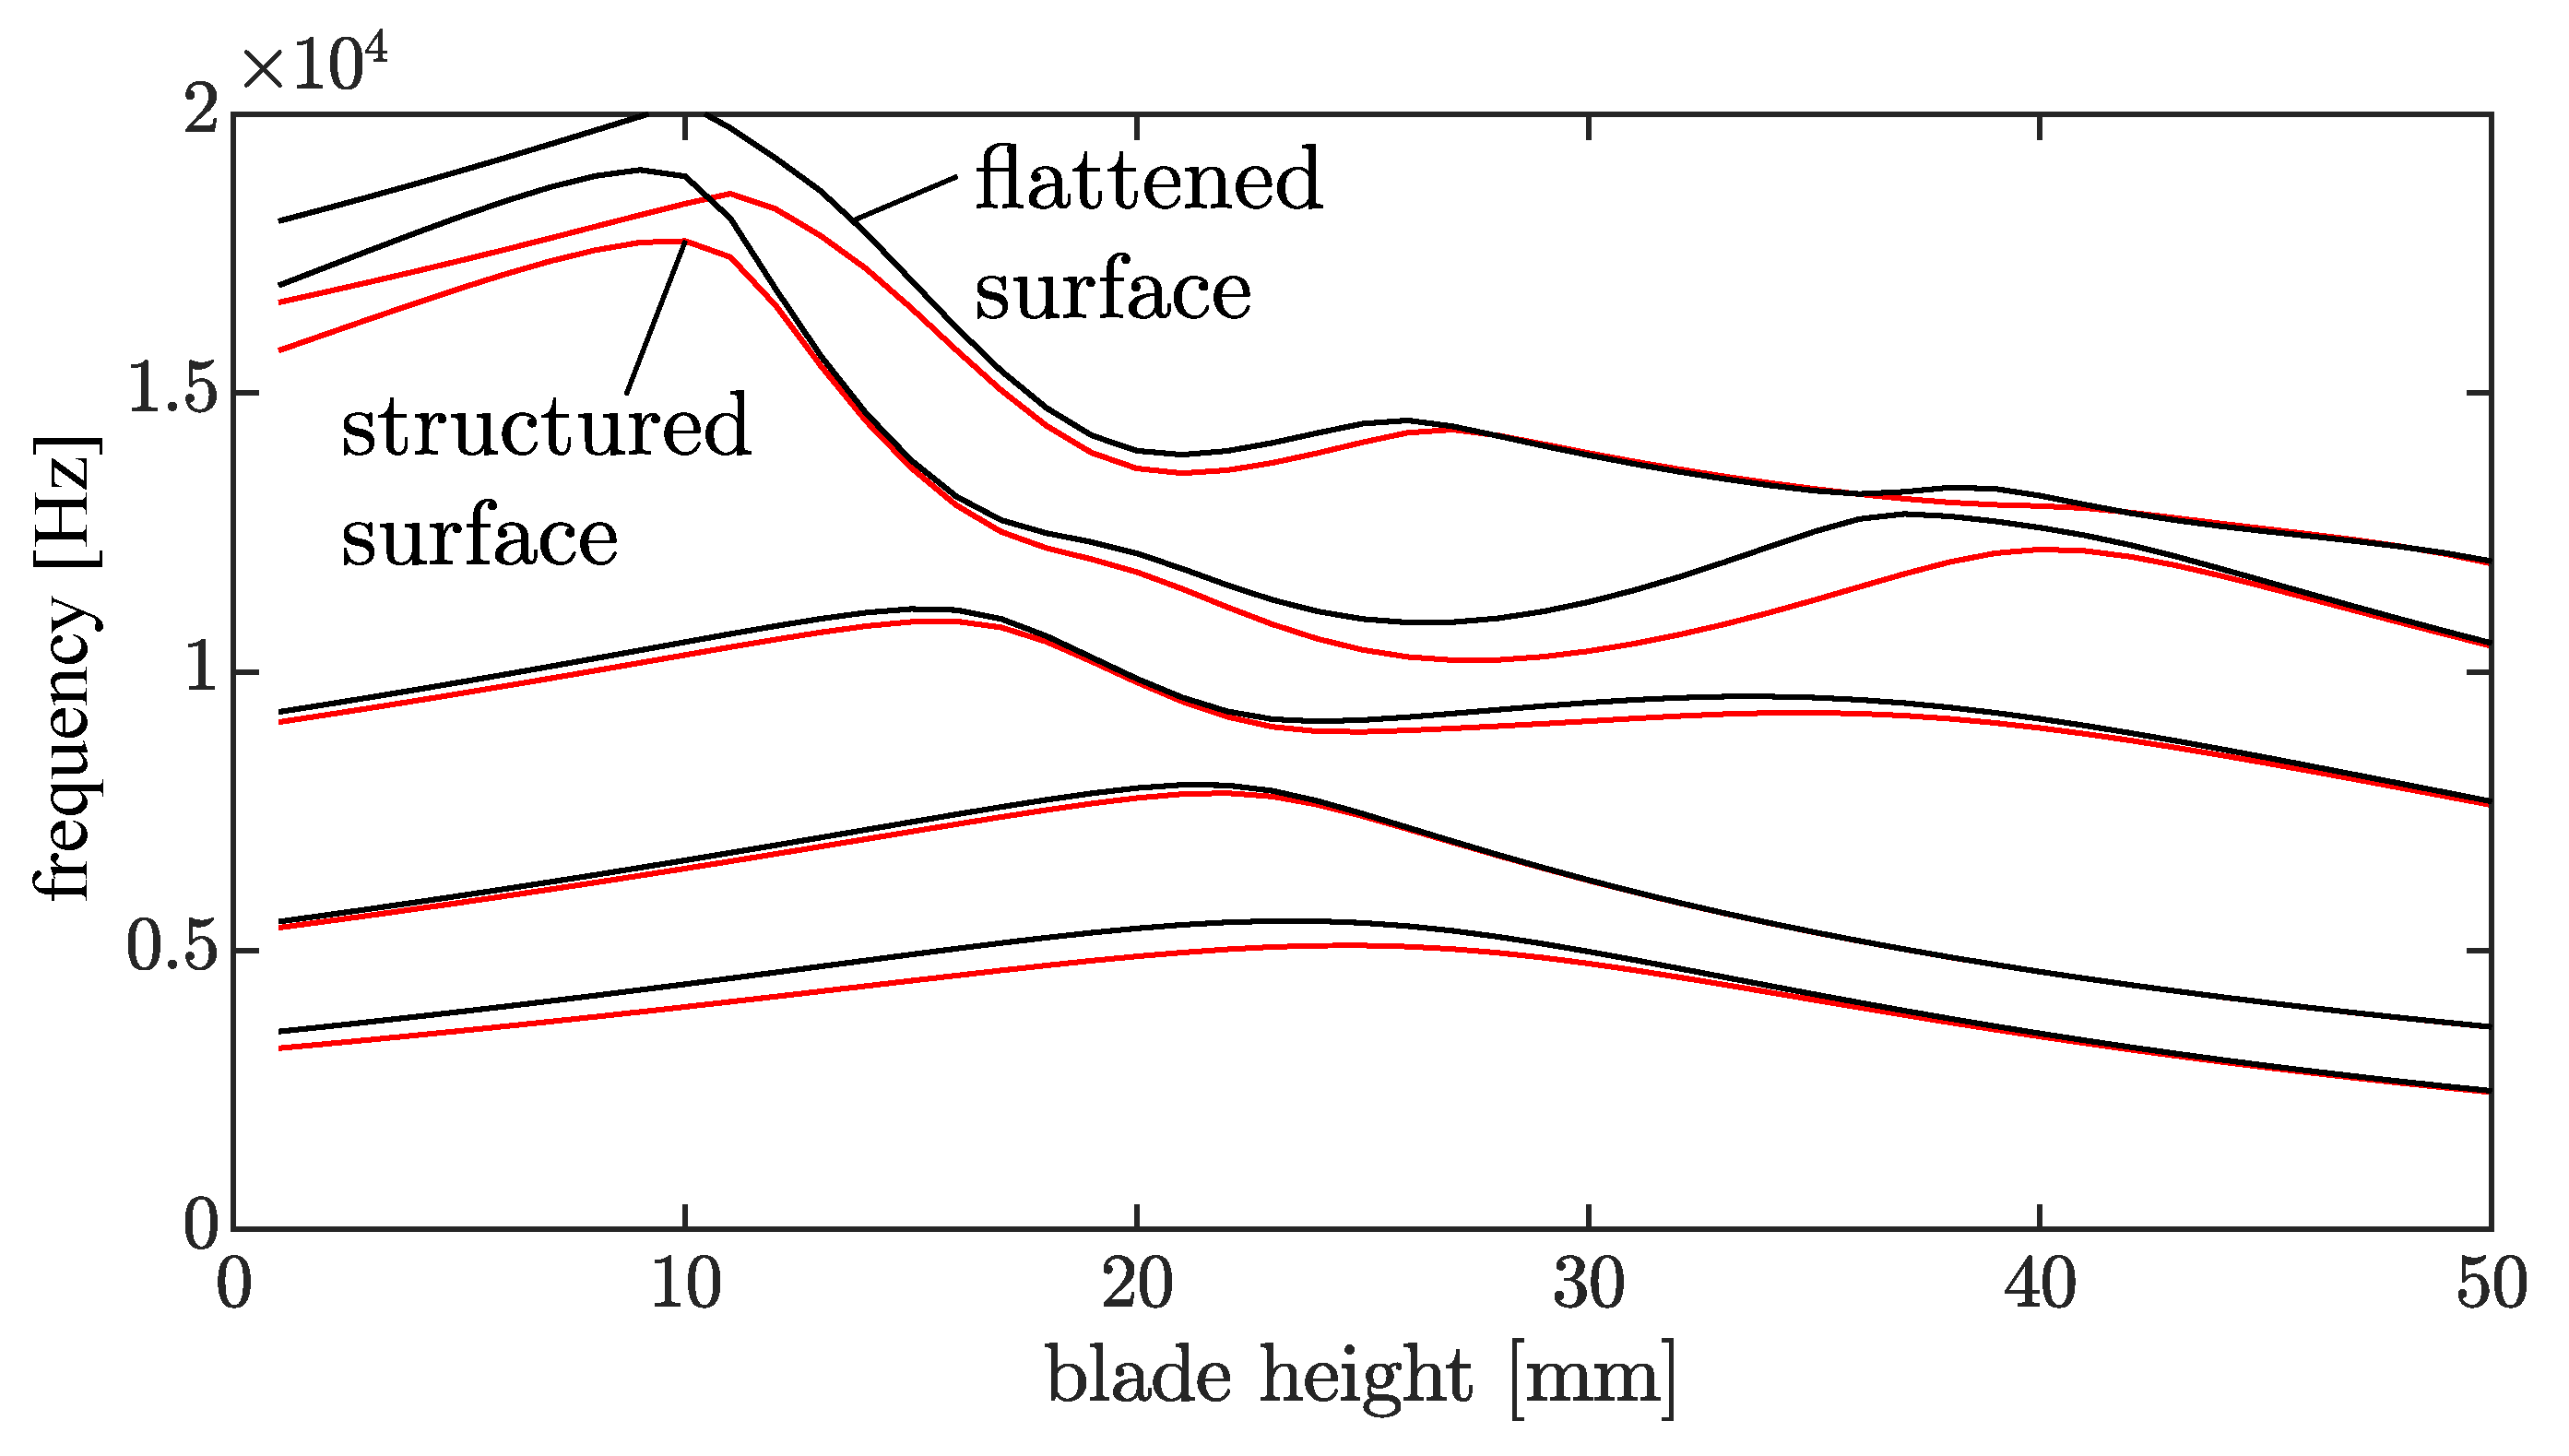
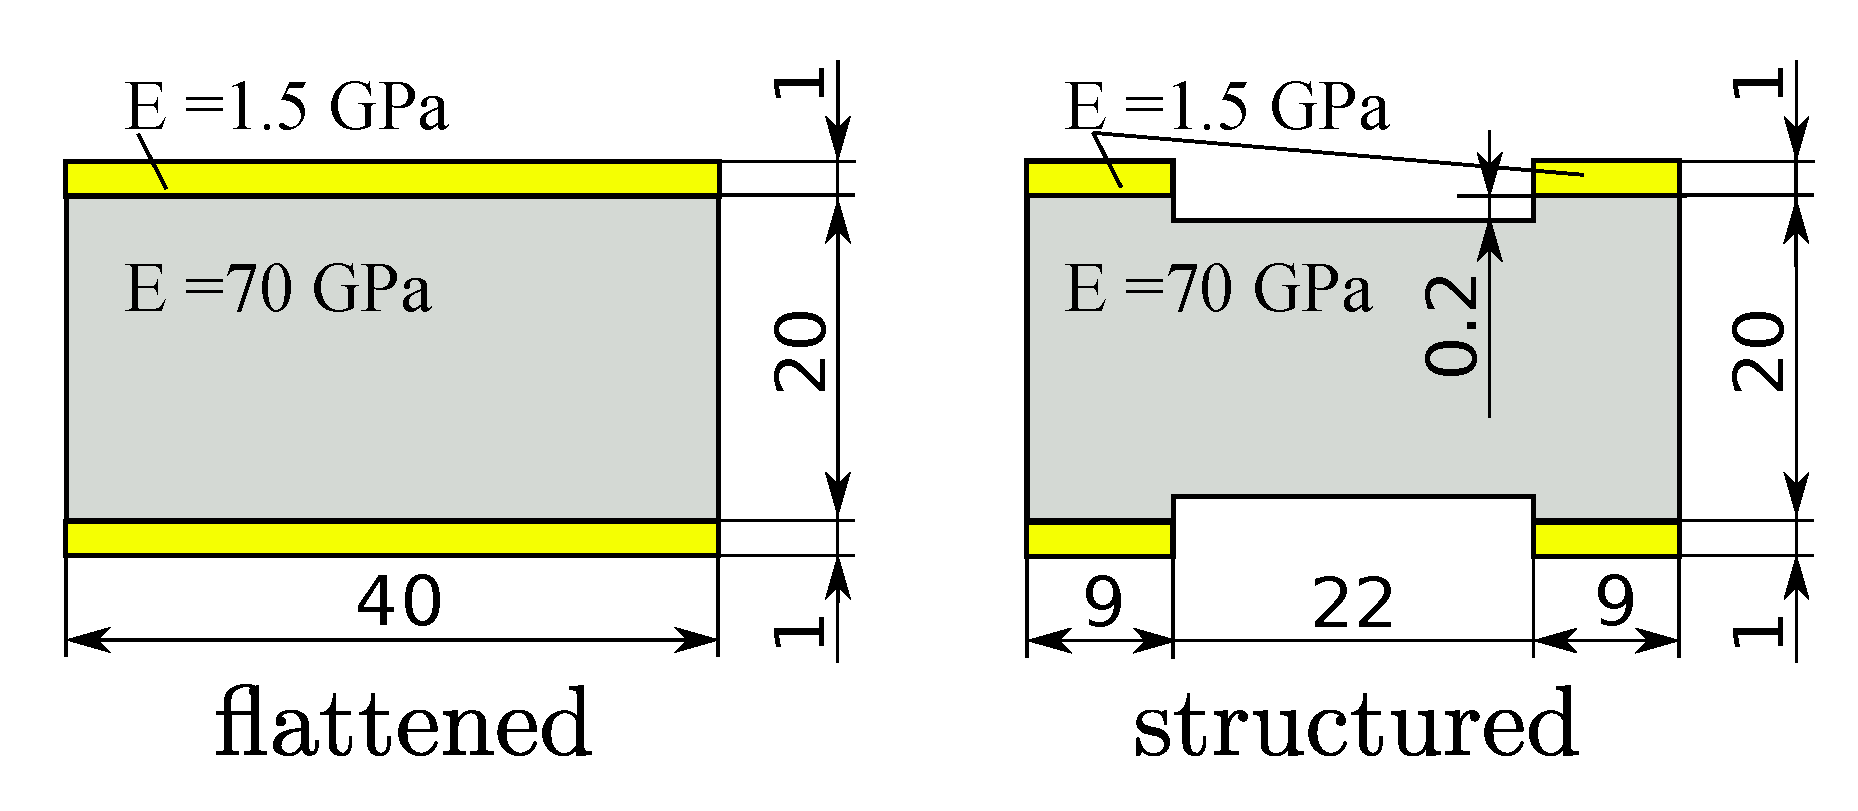
2.1. Blade Profile—Test Case

In this section, we present the details of the investigated turbine blade. In numerous studies, a simple plate type workpiece is used to demonstrate the changing dynamics of the workpiece [38]; in some cases, more complex parts are also investigated [26]. Our case study mimics a turbine blade which is machined from a single rectangular rod. Its geometry is designed in order to keep it simple but being detailed enough to present an industrial component (see Figure 1). The aluminium (A2024-T351) workpiece is clamped along the length of 35 mm and it is machined from the top by 2 mm axial depth of cuts. Natural frequencies are determined as a function of the instantaneous blade height with different approaches in the following sections. To see the effect of the clamping connection, three different clamping surfaces were designed and analysed. Firstly, the row surface (Figure 2a) where no surface treatment was done, secondly, the flattened surface (Figure 2b) where the surface has been machined and finally the structured surface (Figure 2c) which is used to enforce the contact on the sides of the workpiece, only. All three clampings are analysed in the measurements, while only the latter two are investigated by theoretical models.

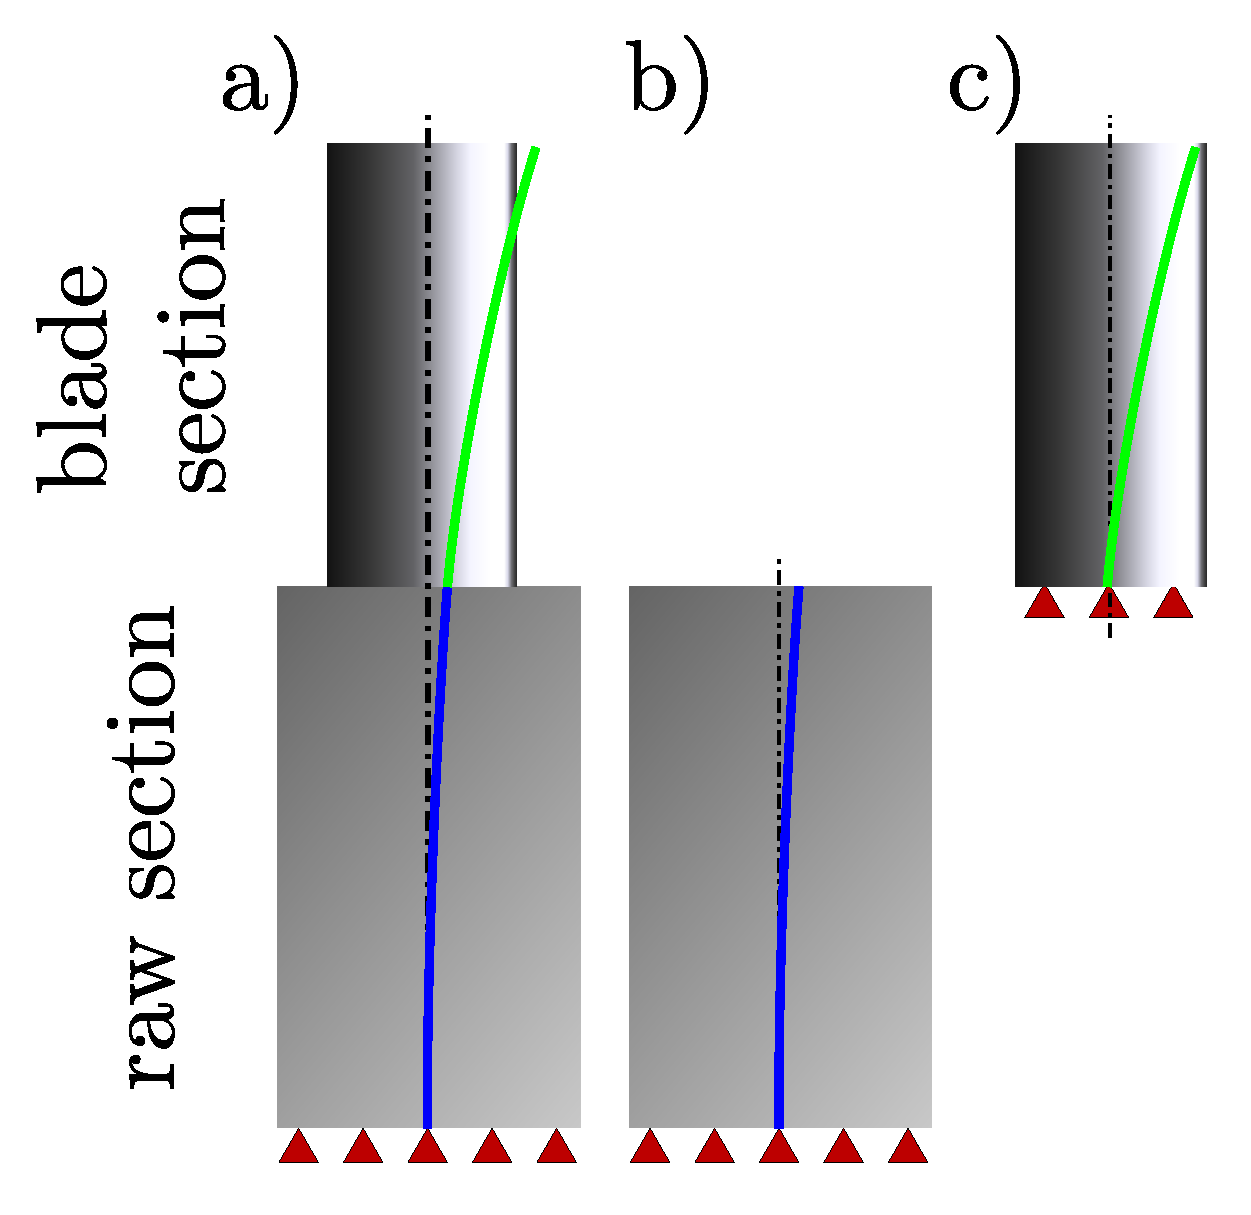
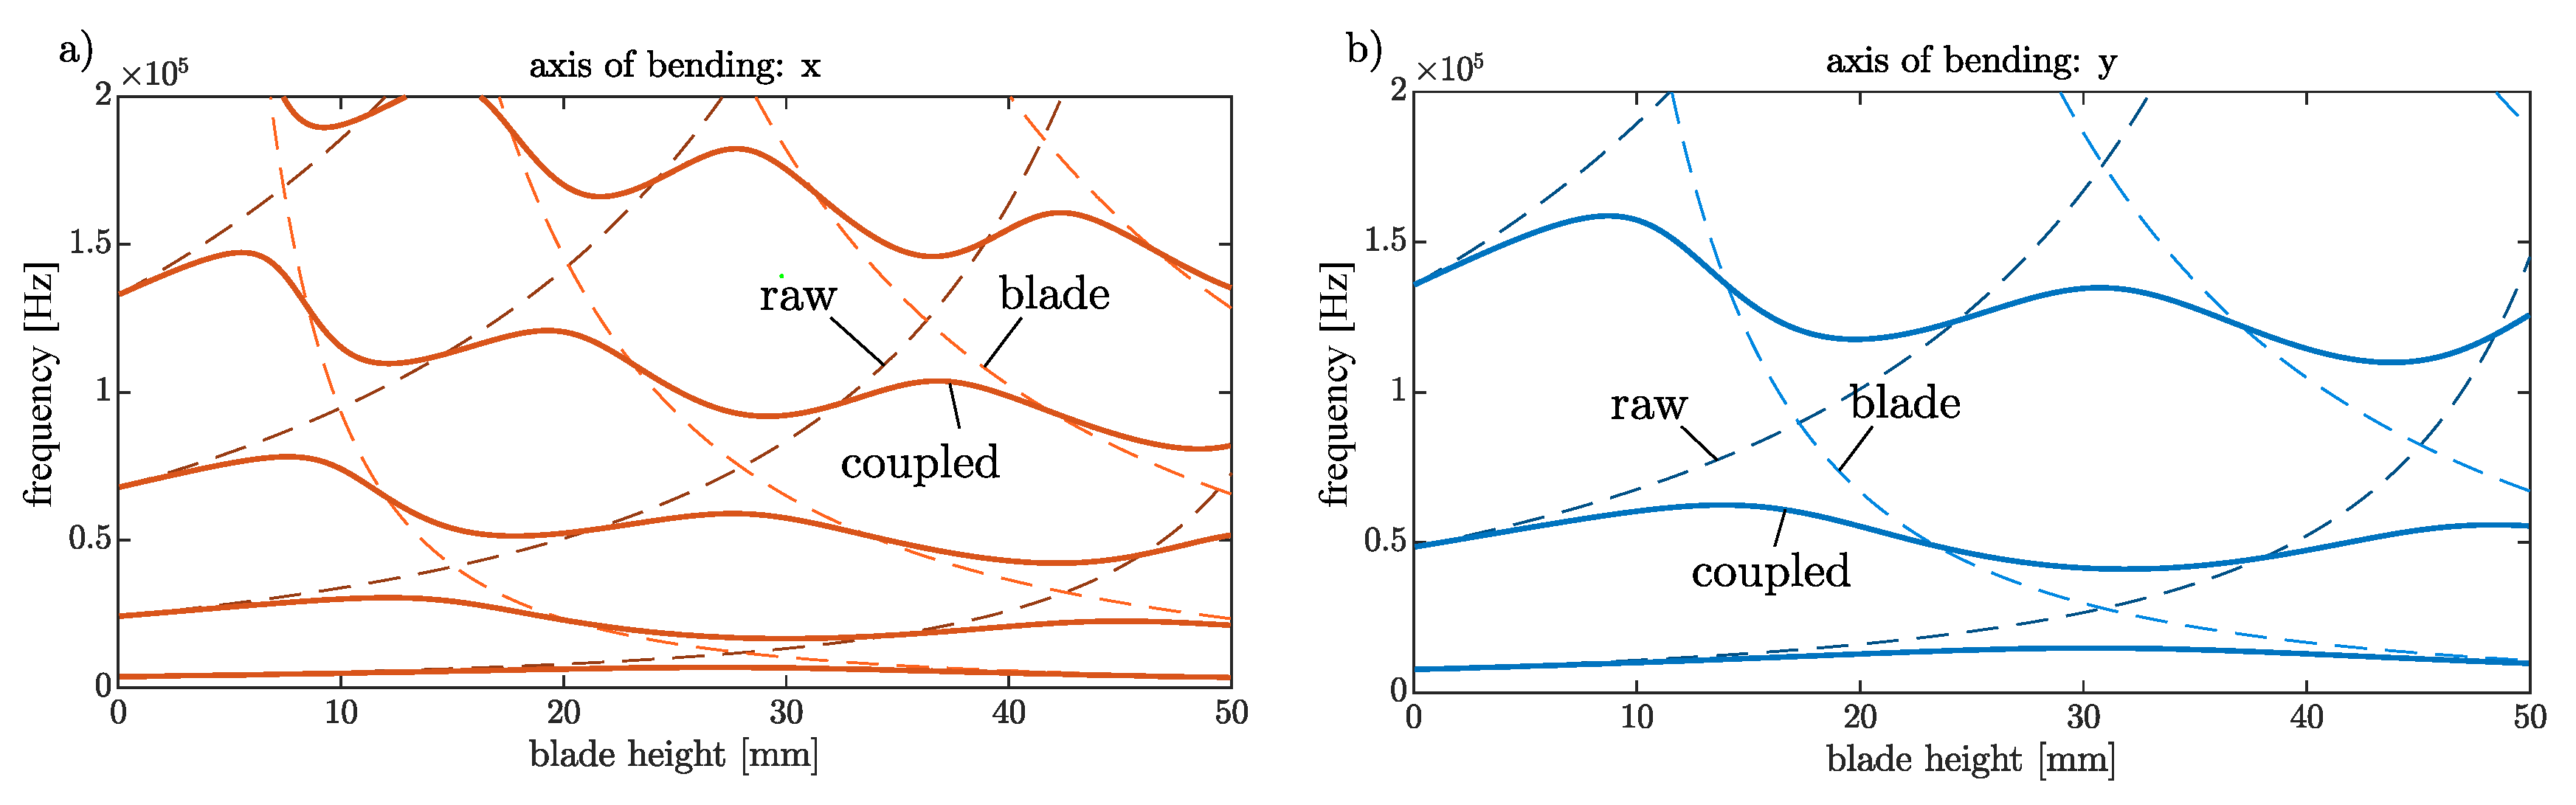
2.2. Analytical Approach
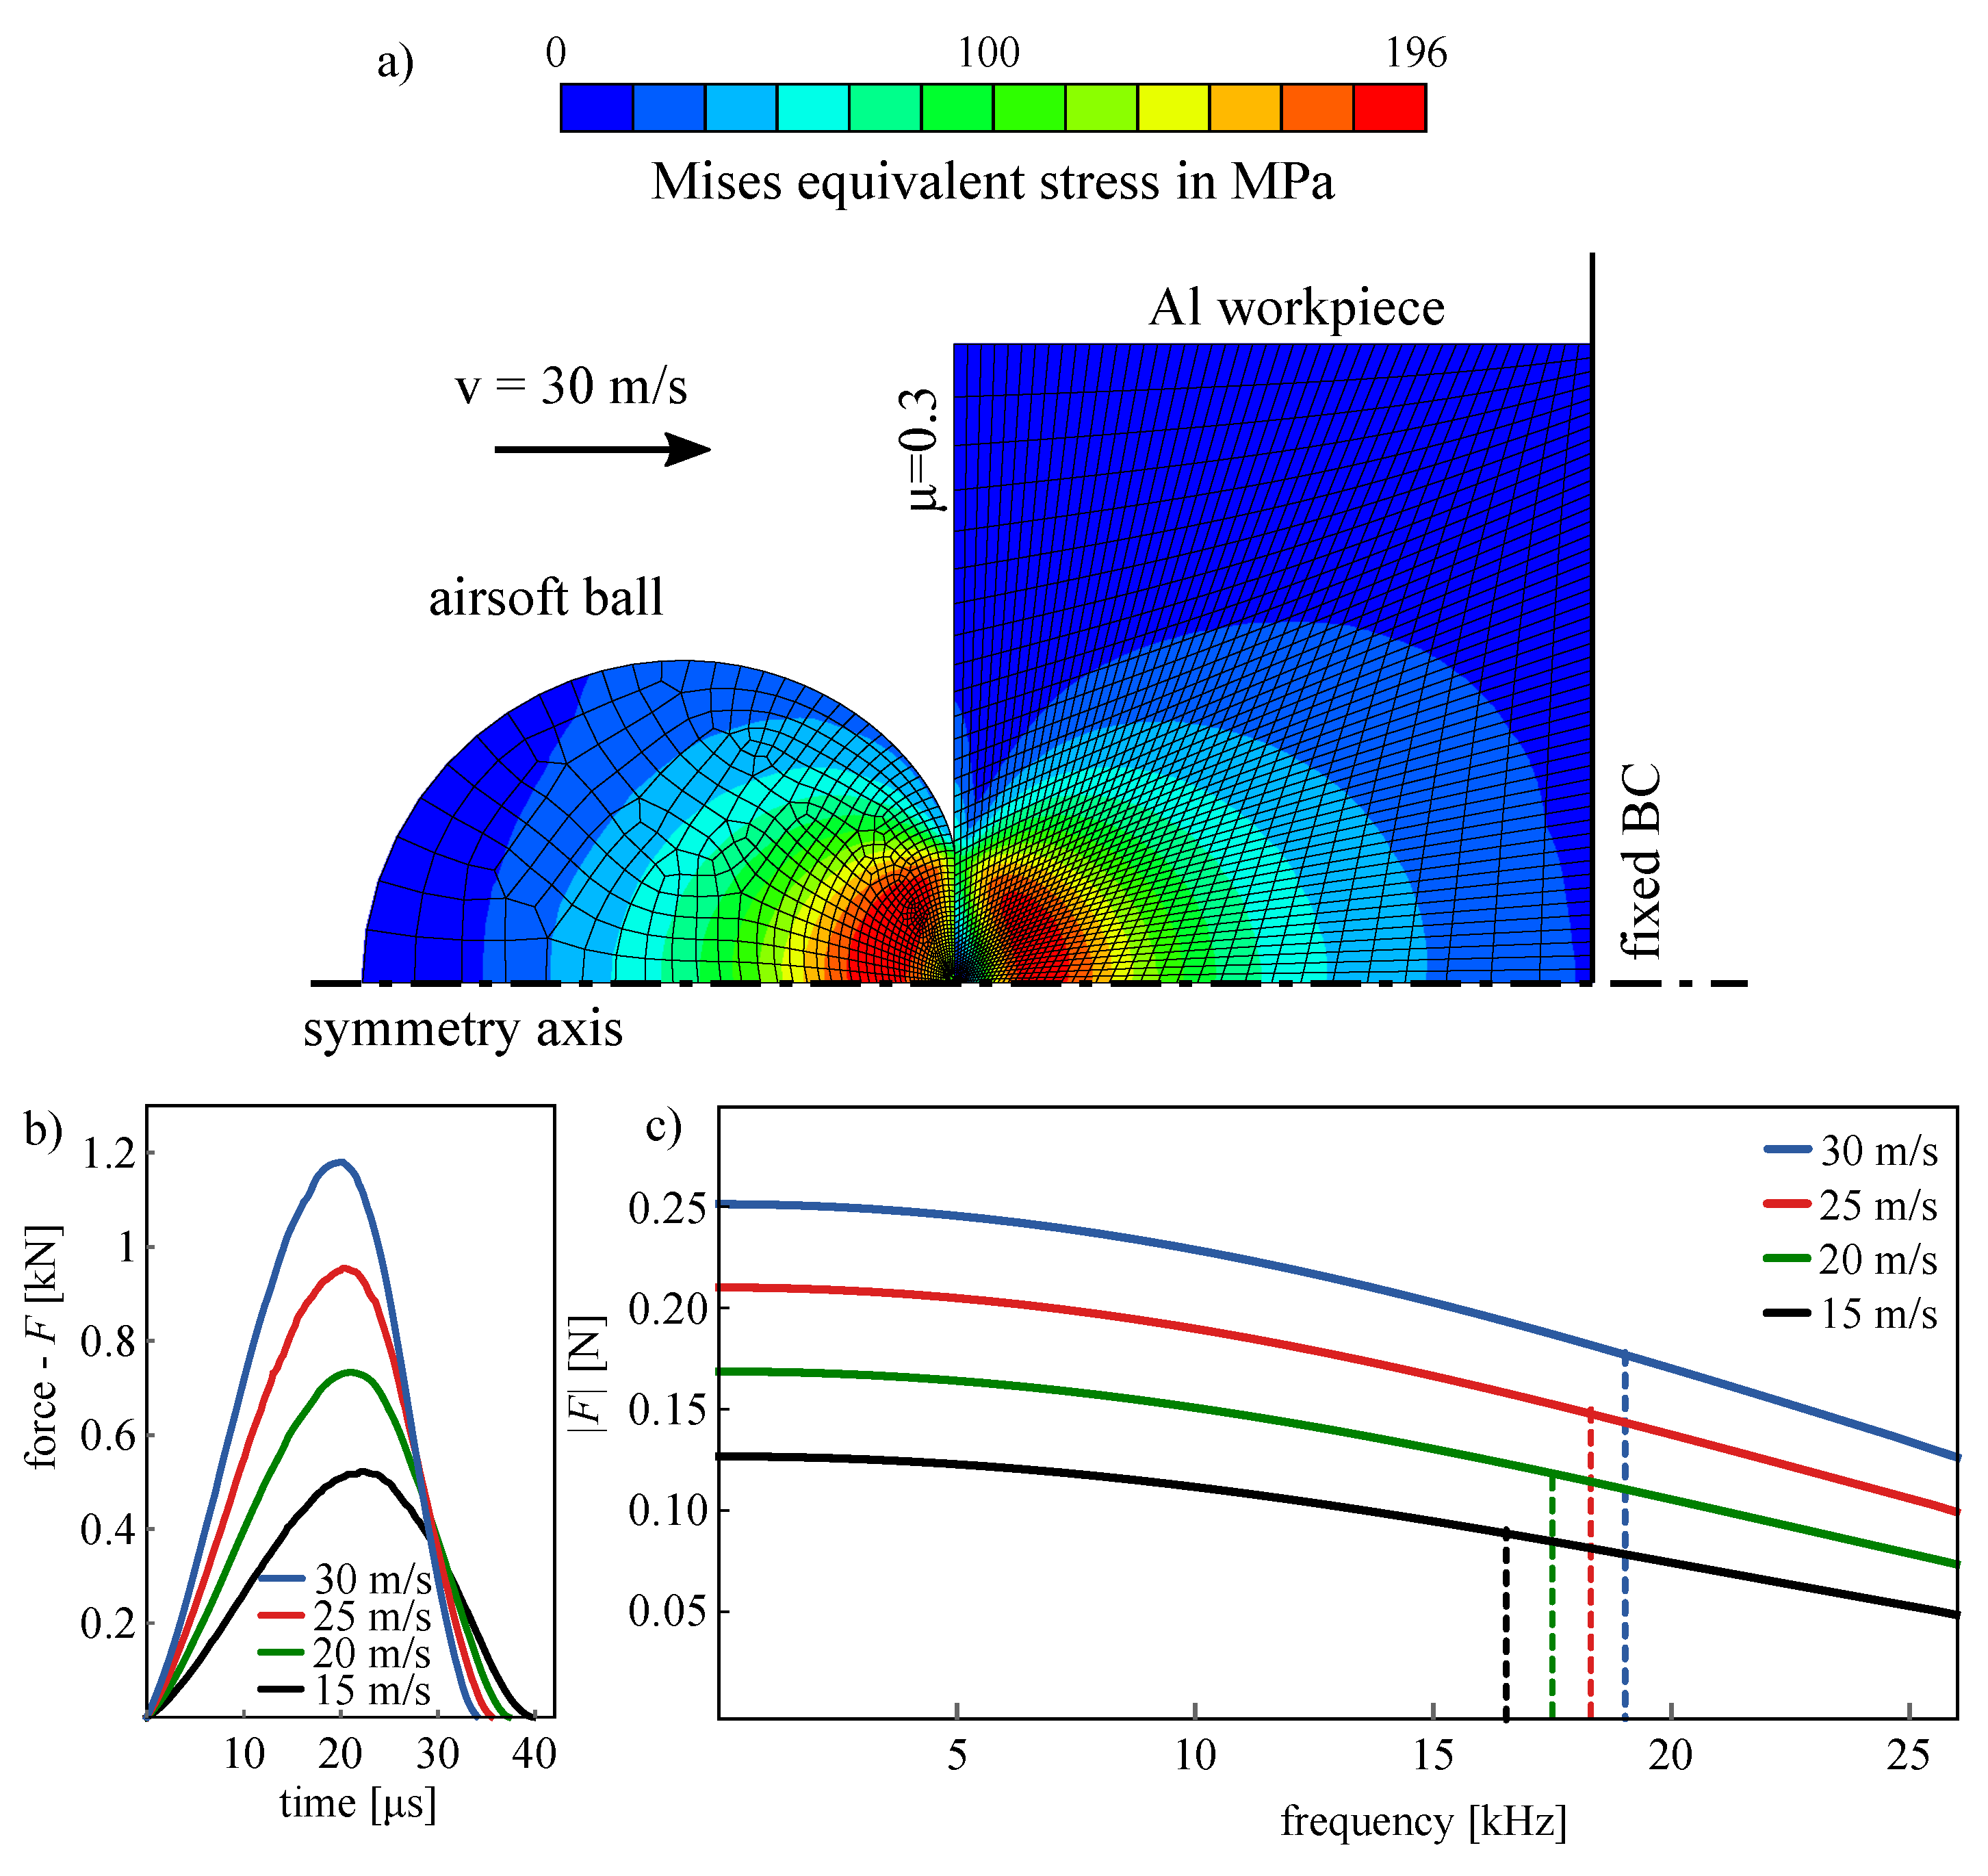
In this section, an analytical approach is presented to give an insight into the underlying reason of the changing natural frequencies. The geometry could be considered to be a beam-type structure, thus, an analytical method is used as a first approximation. This model is appropriate to highlight the expected effects of stiffness and mass change, which can increase or decrease the natural frequencies depending on the blade height.
If the cross-section of the original raw workpiece is significantly larger than the cross-section of the blade part, then the stiffness of the blade is much smaller; therefore, it can be modelled as a simple cantilever beam. Moreover, if the mass of the blade section is negligible compared to the original raw part then it is not influenced by the more flexible blade and the raw section can also be modelled as a cantilever beam. The idea and a schematic drawing of this decomposition is presented in Figure 3. The resulting natural frequencies ω n , i of the separated components can be computed analytically from the following formula
ω n , i = β i 2 L 2 E I ρ A ,
where E is the Young’s modulus, I is the second moment of area, ρ is the density, A is the area of the cross-section and L is the length of the given section. The β i values are the roots of the corresponding transcendental characteristic equation, with a first few well-known solutions: β 1 2 = 3.516 , β 2 2 = 22.034 , β 3 2 = 61 , 71 , β 4 2 = 120.9 ... [39]. These simplified analytical values are plotted with thin dashed curves in Figure 4a,b for the bending vibration modes along the x and y axis, respectively. The used material and geometrical parameters are presented in Table 1 and Table 2. Please note that here 83% of the material was removed during the milling process in order to form the desired turbine blade profile. The larger the cross-section reduction compared to the raw part, the higher the fluctuation in the natural frequencies. Therefore, in case of extreme reduction, natural frequencies tend to these specific curves.
The solution of the coupled system can be calculated analytically based on the corresponding coupled partial differential equations continuum beams’ bending vibration, as it is presented in detail in [40]. The derivation is based on the closed-form expression of FRF through the derivation of the bending vibration of continuum beams based on the distributed transfer function method with a suitable Green function. Here, only the final result of the coupled system is presented. In Figure 4, the thick curves show the expected fluctuation. It is shown that the natural frequencies of the coupled modes follow the natural frequencies of the separated models, denoted by dashed curves. Intersections of two dashed curves can be considered to be attractive points, to which the natural frequencies of the coupled model tend. However, they are smoothed out if the cross-section reduction gets smaller, leading to the pulsation of the natural frequency along the blade height.
In Figure 5 the natural frequencies corresponding to bending modes along the x and y axis are plotted together. Please note that in this analytical solution we assume no coupling between the vibration modes along x and y directions; however, due to the asymmetric shape of the blade and its plate-like form, these crossing terms are expected to be smoothed out.

2.3. FEA Analysis

The analytical solution is useful to get an insight into the effects of the material removal process; however, it can hardly handle asymmetric structures with complex geometry. In this section, FE analysis of the workpiece with different types of clampings is established. The analysis is performed in Abaqus [41] software using 8-node linear brick elements (C3D8) with full integration. The average element size was 1 mm. The nodes along the contact surfaces were fixed in all directions. The applied material properties are presented in Table 1 for the AlMgSi1 workpiece. The first few natural frequencies as a function of blade height s are presented in Figure 6 with flattened and structured clamping surfaces. The curves have the same tendency as predicted by the analytical model; however, due to the spatial description, the interaction between the segments is more complicated. The numerical values of the natural frequencies of bending modes along coordinate y are similar in the analytical model and in the FEA only at zero blade height s = 0 , since the analytical model does not consider the coupling between the x and y directional vibration, which is more relevant at higher blade heights. Furthermore, even at blade height s = 0 , for which the workpiece has a uniform rectangular cross-section, the higher natural frequencies are deviating caused by the special clamping method.
The sensitivity of the clapping is also visible by the deviation between the natural frequencies of the workpiece with the flattened and the structured clamping surfaces (see the black and red curves in Figure 6. The natural frequencies of the workpiece are 2–10% lower for the ideally clamped structured surface compared to the flattened one.
The sudden change in the mode shapes at different blade heights is represented in Figure 7. It is visible at the switching point that the modes shapes are changing significantly. For instance, the second mode shape appears as a bending mode at lower blade heights (<15 mm); however, at higher blade heights (>15 mm), torsional vibration mode becomes relevant.

3. Results

3.1. Measurement

In this section, the measurement results are presented for the machined turbine blade. During the measurements, a ball shooter device is placed in front of the machine tool at ∼1 m distance (as shown in Figure 8) which is aimed to point to P 1 in order to excite the workpiece for modal testing, while the excitation of the micro hammer (B&K Type 8203 with B&K 2647-A charge amplifier) is applied in both points P 1 and P 2 (see Figure 1).
Please note that the position and height of excitation point P 1 were constant during the entire machining operation, therefore, in case of small blade heights ( s < 10 mm), point P 1 was located on the rectangular (raw) surface, while for larger blade heights ( s > 10 mm), P 1 was on the turbine profile. This leads to different excitation causing a slightly different response, which is visible on the latter charts. Point P 2 was selected in a way to eliminate this problem; however, this was feasible by selecting a point close to the clamping which is very stiff, leading to no optimal excitation.
As a response for the input force excitation, the accelerations were recorded close to the clamping at point P 3 (see in Figure 1) on the workpieces using a PCB 352C23 accelerometer. The signals were acquired by a National Instruments data acquisition system with NI 9234 Input Modules in a NI cDAQ-9178 Chassis at a sampling rate of 51.2 kHz without any additional filtering except to the natural high-pass filter of the accelerometer with cutoff frequency f c of 2 Hz. The blade profiles were milled layer-by-layer with 2 mm axial depth of cut and the excitations were performed in the 26 layers by the micro modal hammer in points P 1 and P 2 and by the ball shooter at point P 1 . The average of three measurements was used in one layer for each point in order to reduce the uncertainty for both types of excitations. Thus, the total number of excitations are: the ball shooter at P1: 78, the micro hammer at P1: 78 and at P2: 78. It is important to note that the excitation by the micro modal hammer was difficult and time-consuming even for a trained expert, while the ball shooter was triggered automatically and the three excitations were performed under approximately 10 s without the problem of multiple-hitting phenomena, which was a typical problem for the micro hammer excitation.

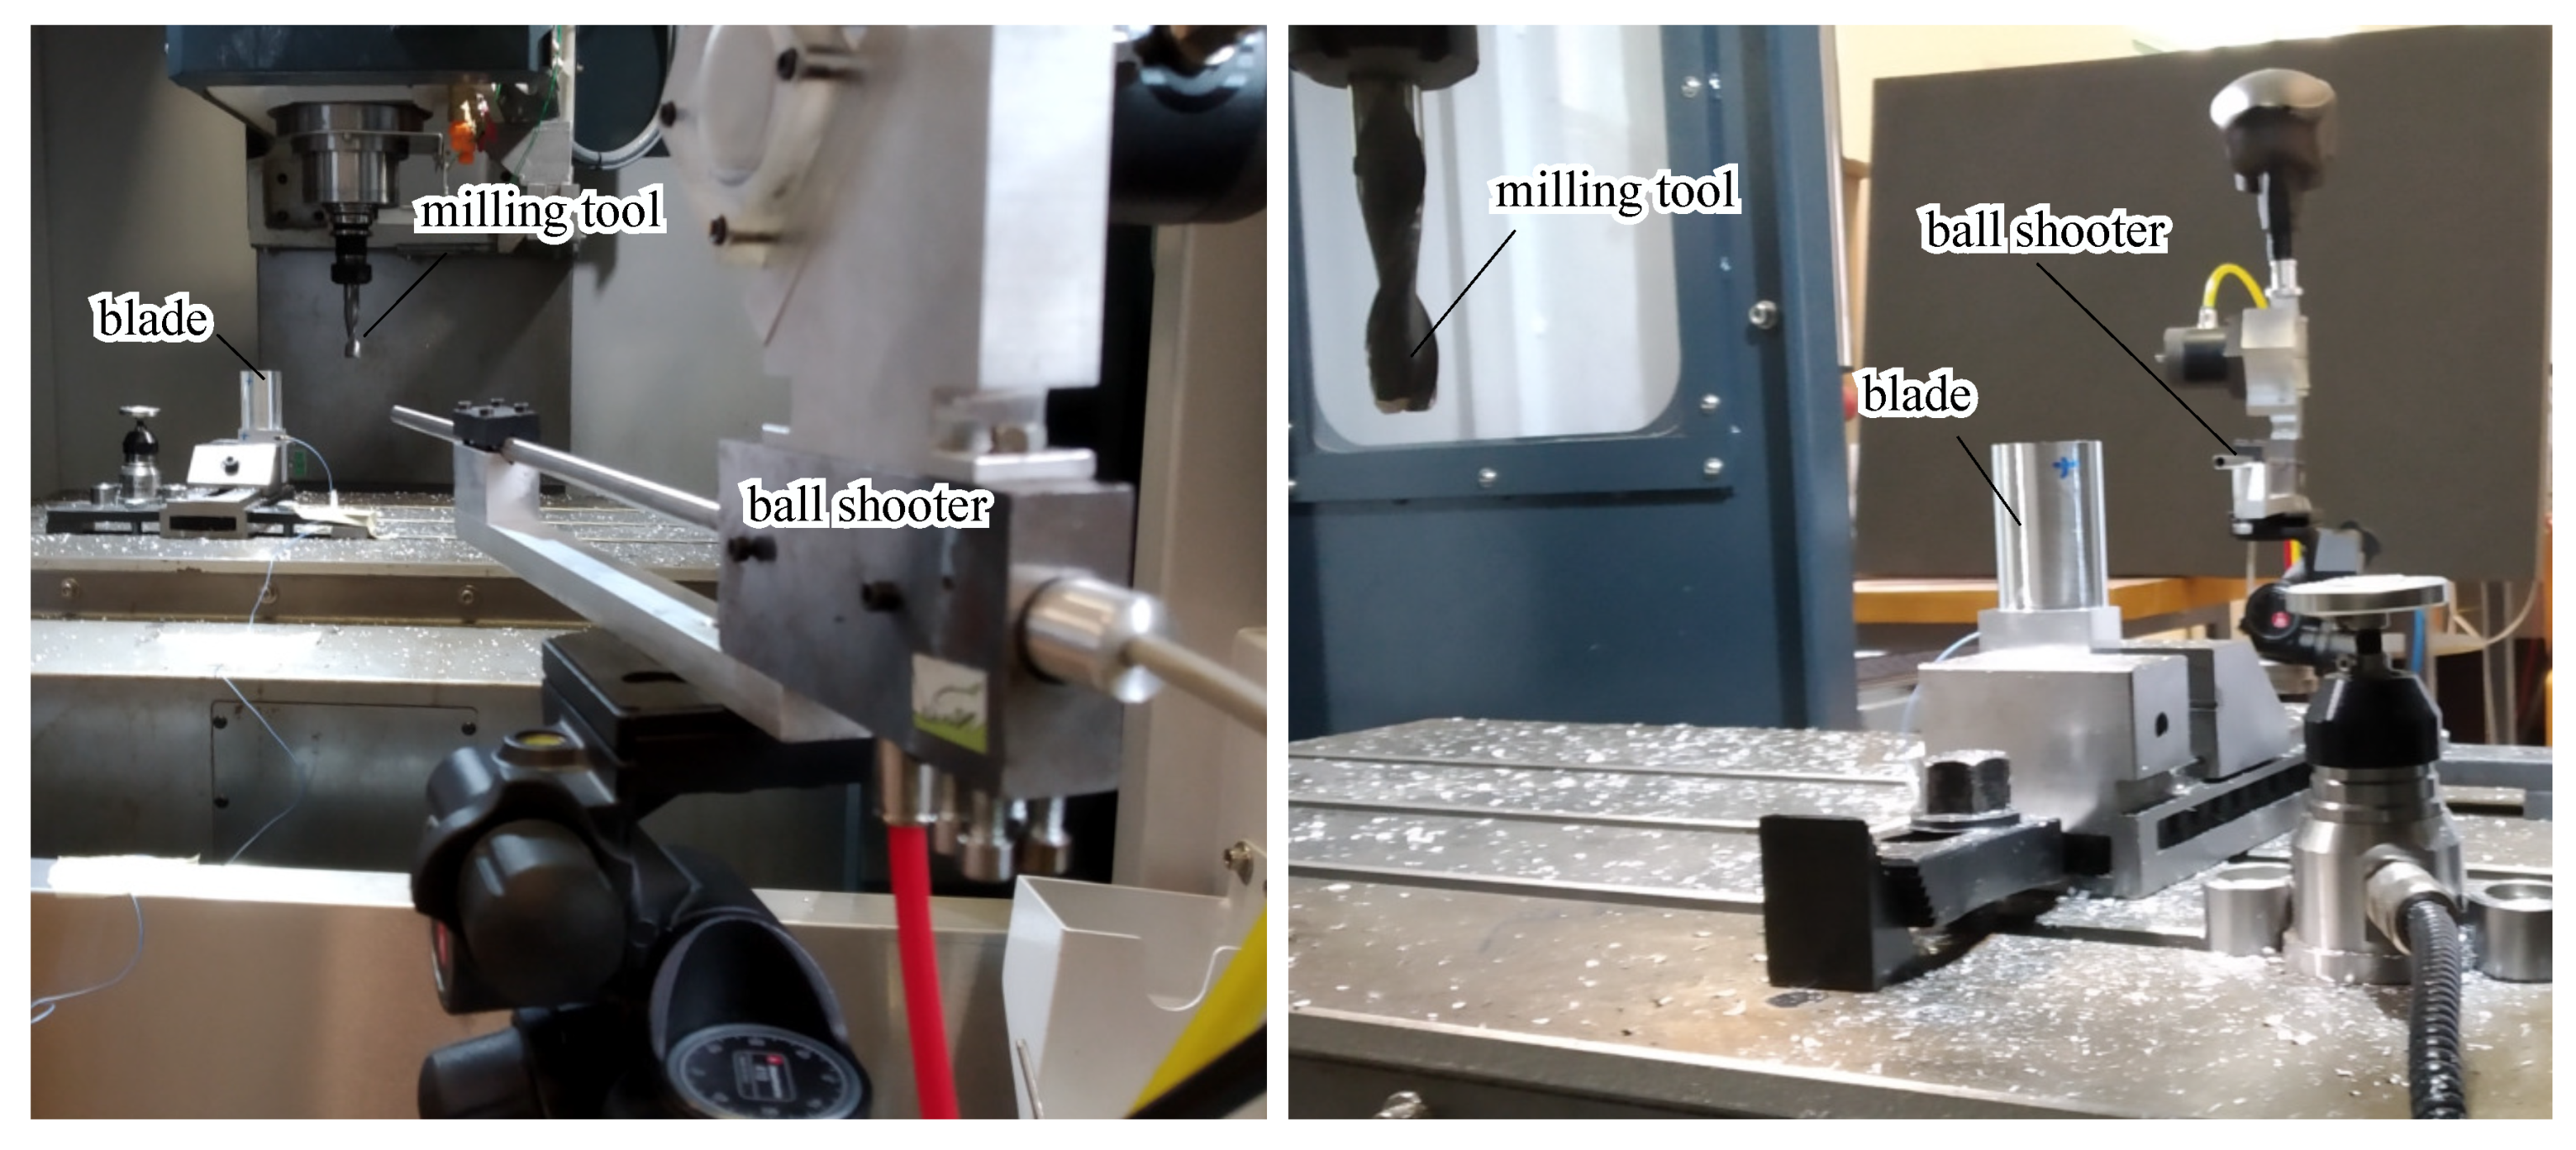
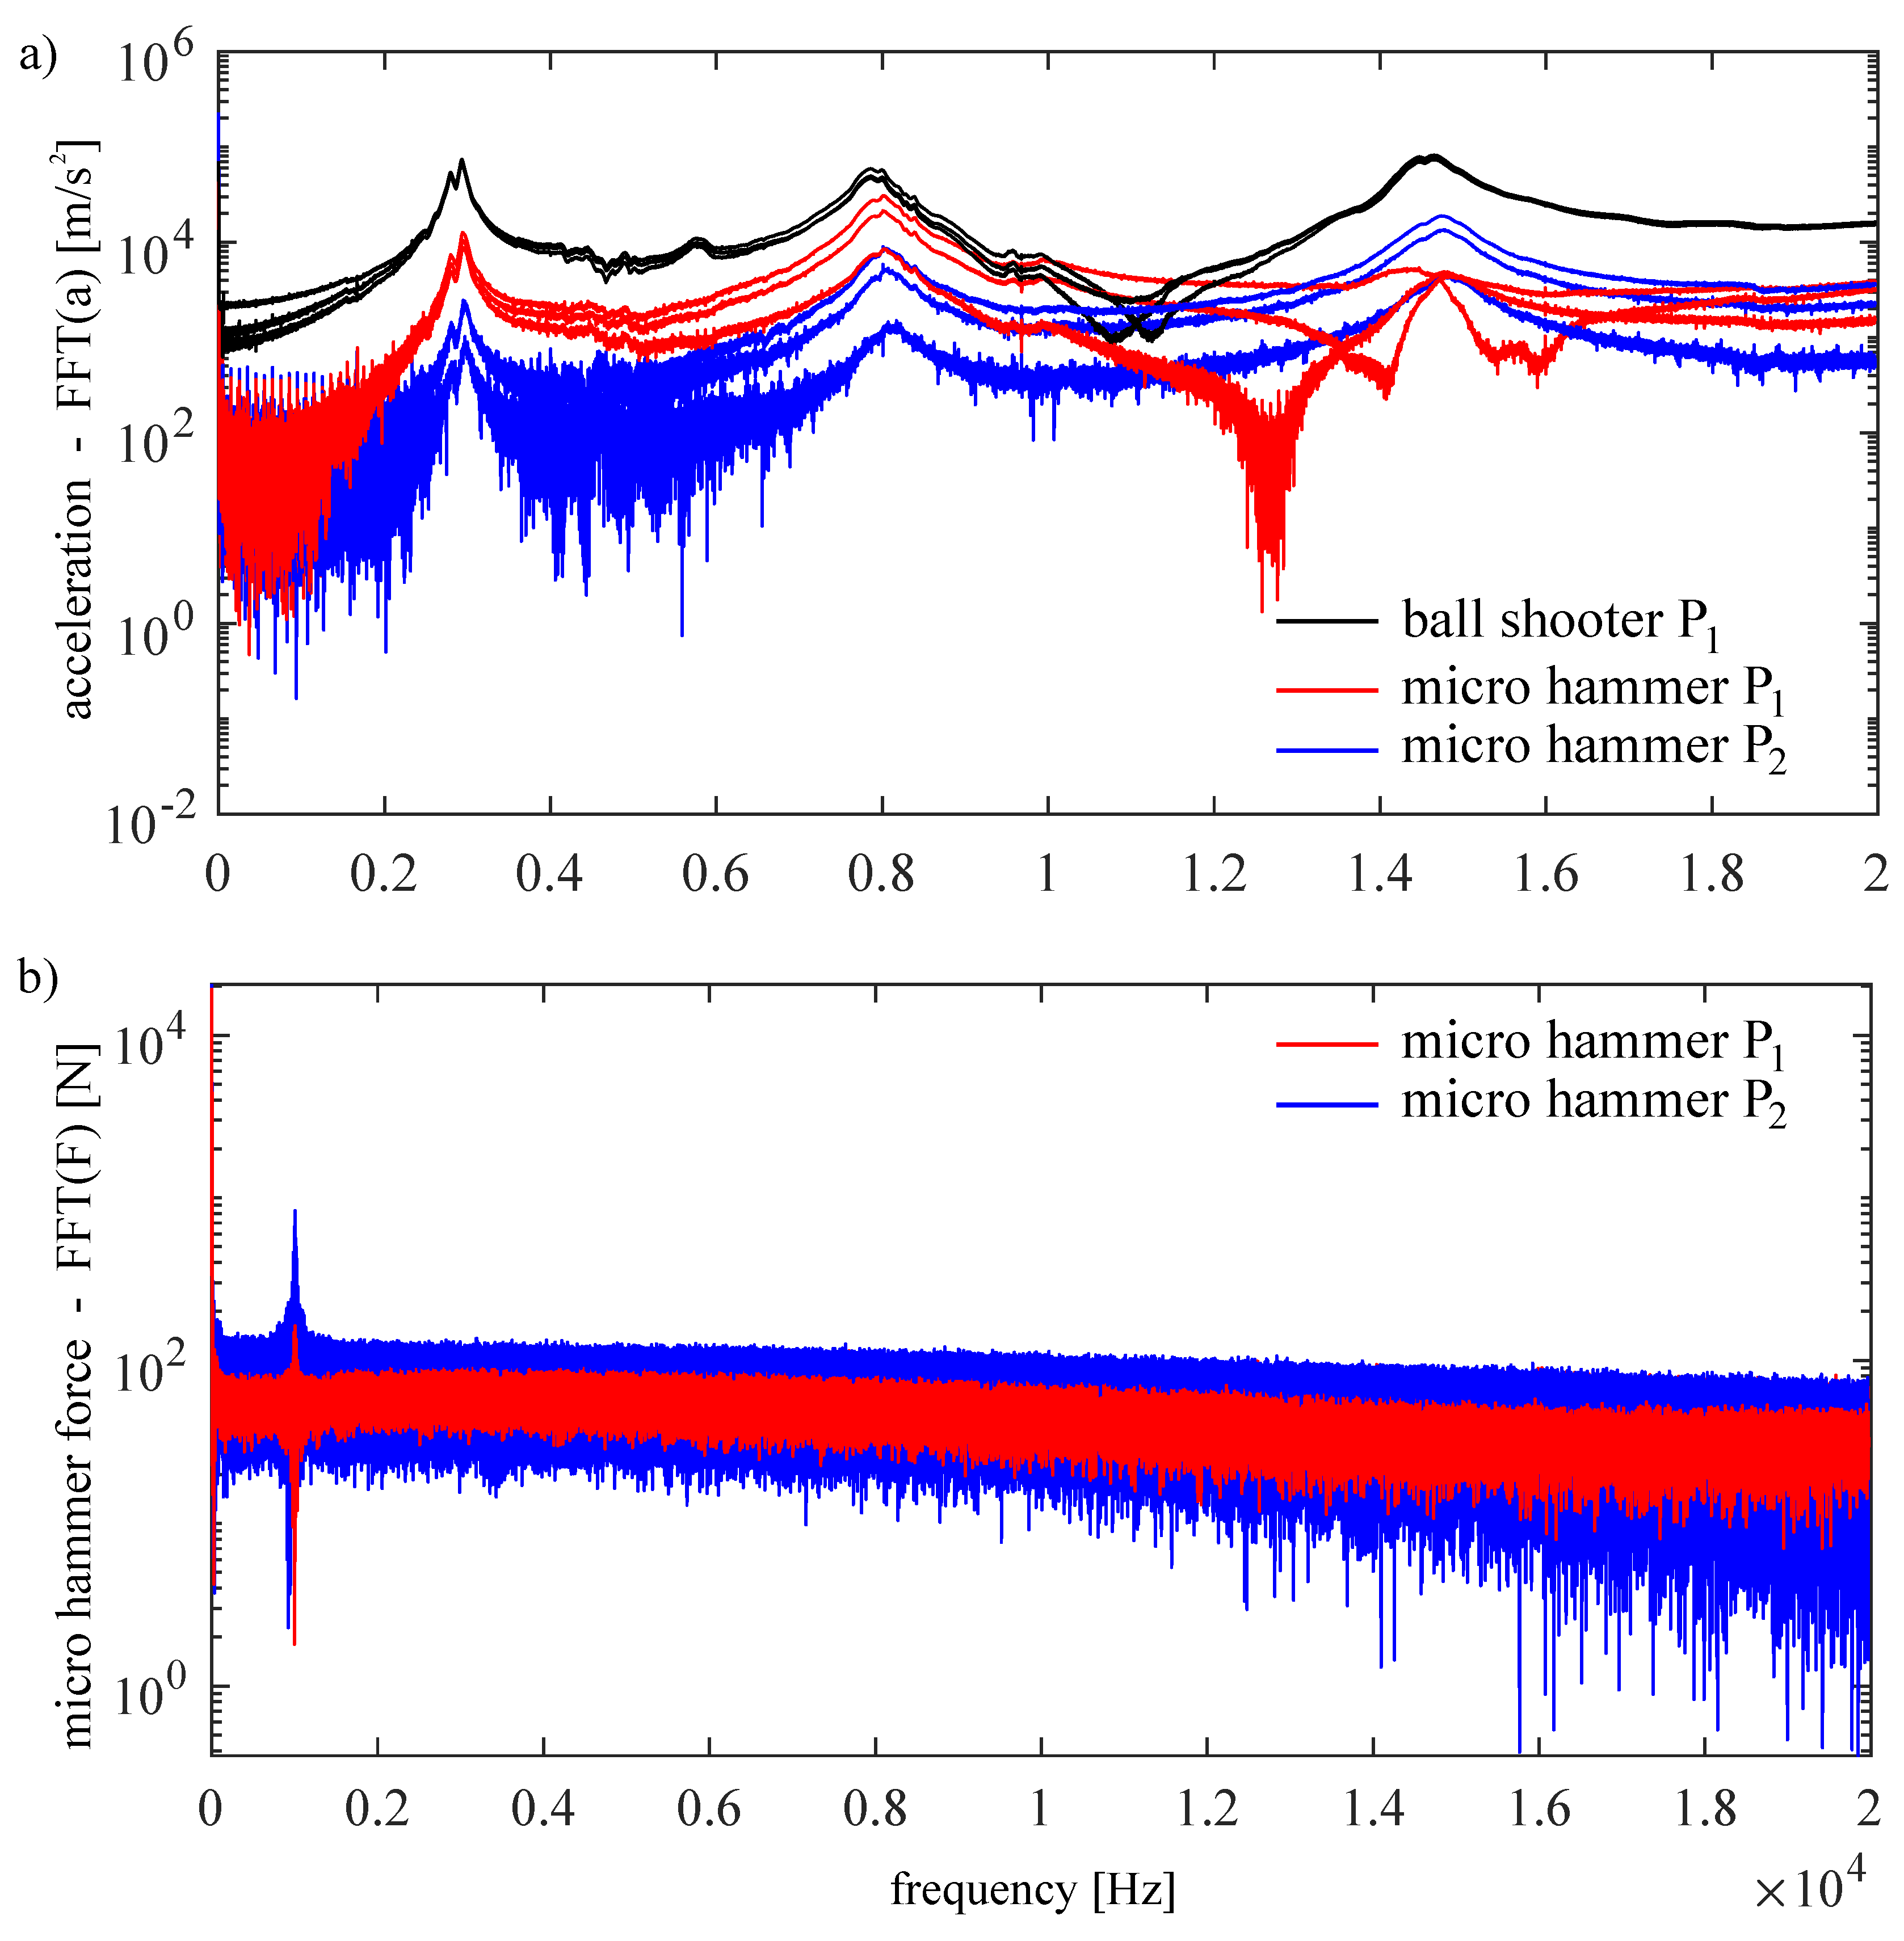
3.1.1. Impulse Excitation with a Ball Shooter

The applied device is presented in [34] and further analyzed in [35]. It is specifically designed for exciting milling tools during rotation using a ball-shooting test, which is able to analyse changing natural frequencies as a function of the spindle speed. The commercial airsoft pellets (Madbull Precision 97 Ultimate Heavy Sniper BB - madbull.com) are spherical balls with diameter d = 5.95 ± 0.01 mm and average mass m = 0.43 g. The typical pellet impact at velocities of v = 25 m/s has a short pulse length, less than 40 ms for airsoft bullets, which results in an excitation bandwidth up to 30 kHz. The method and idea presented in [34] were applied for micro-milling tools to determine the modal parameters in [42].
Typical measurement signals of the excitation and the measured response in the frequency domain for the micro hammer and the ball shooter are presented in Figure 9. It should be noted that the response level is much higher in case of the pellet impact and the corresponding force level is examined further by FEA in the next subsection.

3.1.2. Analysis of Impact Spectrum with Finite Element Simulations

Due to the lack of a measurable excitation force signal in case of the ball shooter, the impact characteristics and the applicability of the airsoft ball excitation method was validated using FEA in Abaqus.
The material behaviour of the airsoft ball during the impact shows significant viscoelastic- viscoplastic properties, which could be effectively modelled using the instantaneous elastic-plastic boundary model of the two-layer viscoplastic constitutive model (for further details see [35]). The applied elastic-plastic model describes the yielding behaviour with associative flow rule based on the von Mises yield criterion with linear isotropic hardening. According to the Hertz-theory infinite stress occurs at the contact point, thus elastic-plastic deformation is assumed for the aluminium workpiece as well using an elastic-perfectly plastic constitutive model. The applied material parameters are listed in Table 3.
The impact velocities of v = 15 , 20 , 25 , 30 m/s were analysed by means of an axisymmetric FE model (see Figure 10a) with a mesh of structured CAX8 elements and using Coulomb- friction ( μ = 0.3 ) .
As a result of the FE simulation, the contact force characteristics during the impact were evaluated (see Figure 10b), from which the excitation spectrum could also be obtained. The dashed lines in Figure 10c indicate the frequency limit corresponding to 3 dB . The spectrum of the ball shooter excitation can be considered nearly constant below 20 kHz, thus, the frequency response function is proportional to the Fourier transform of the measured response (acceleration) signal. It can directly be used to determine the natural frequencies and even the damping ratios. To determine the compliance precisely, the exact force level is needed; however, in our case it is not necessary in order to properly tune the spindle speed and avoid chatter vibration.

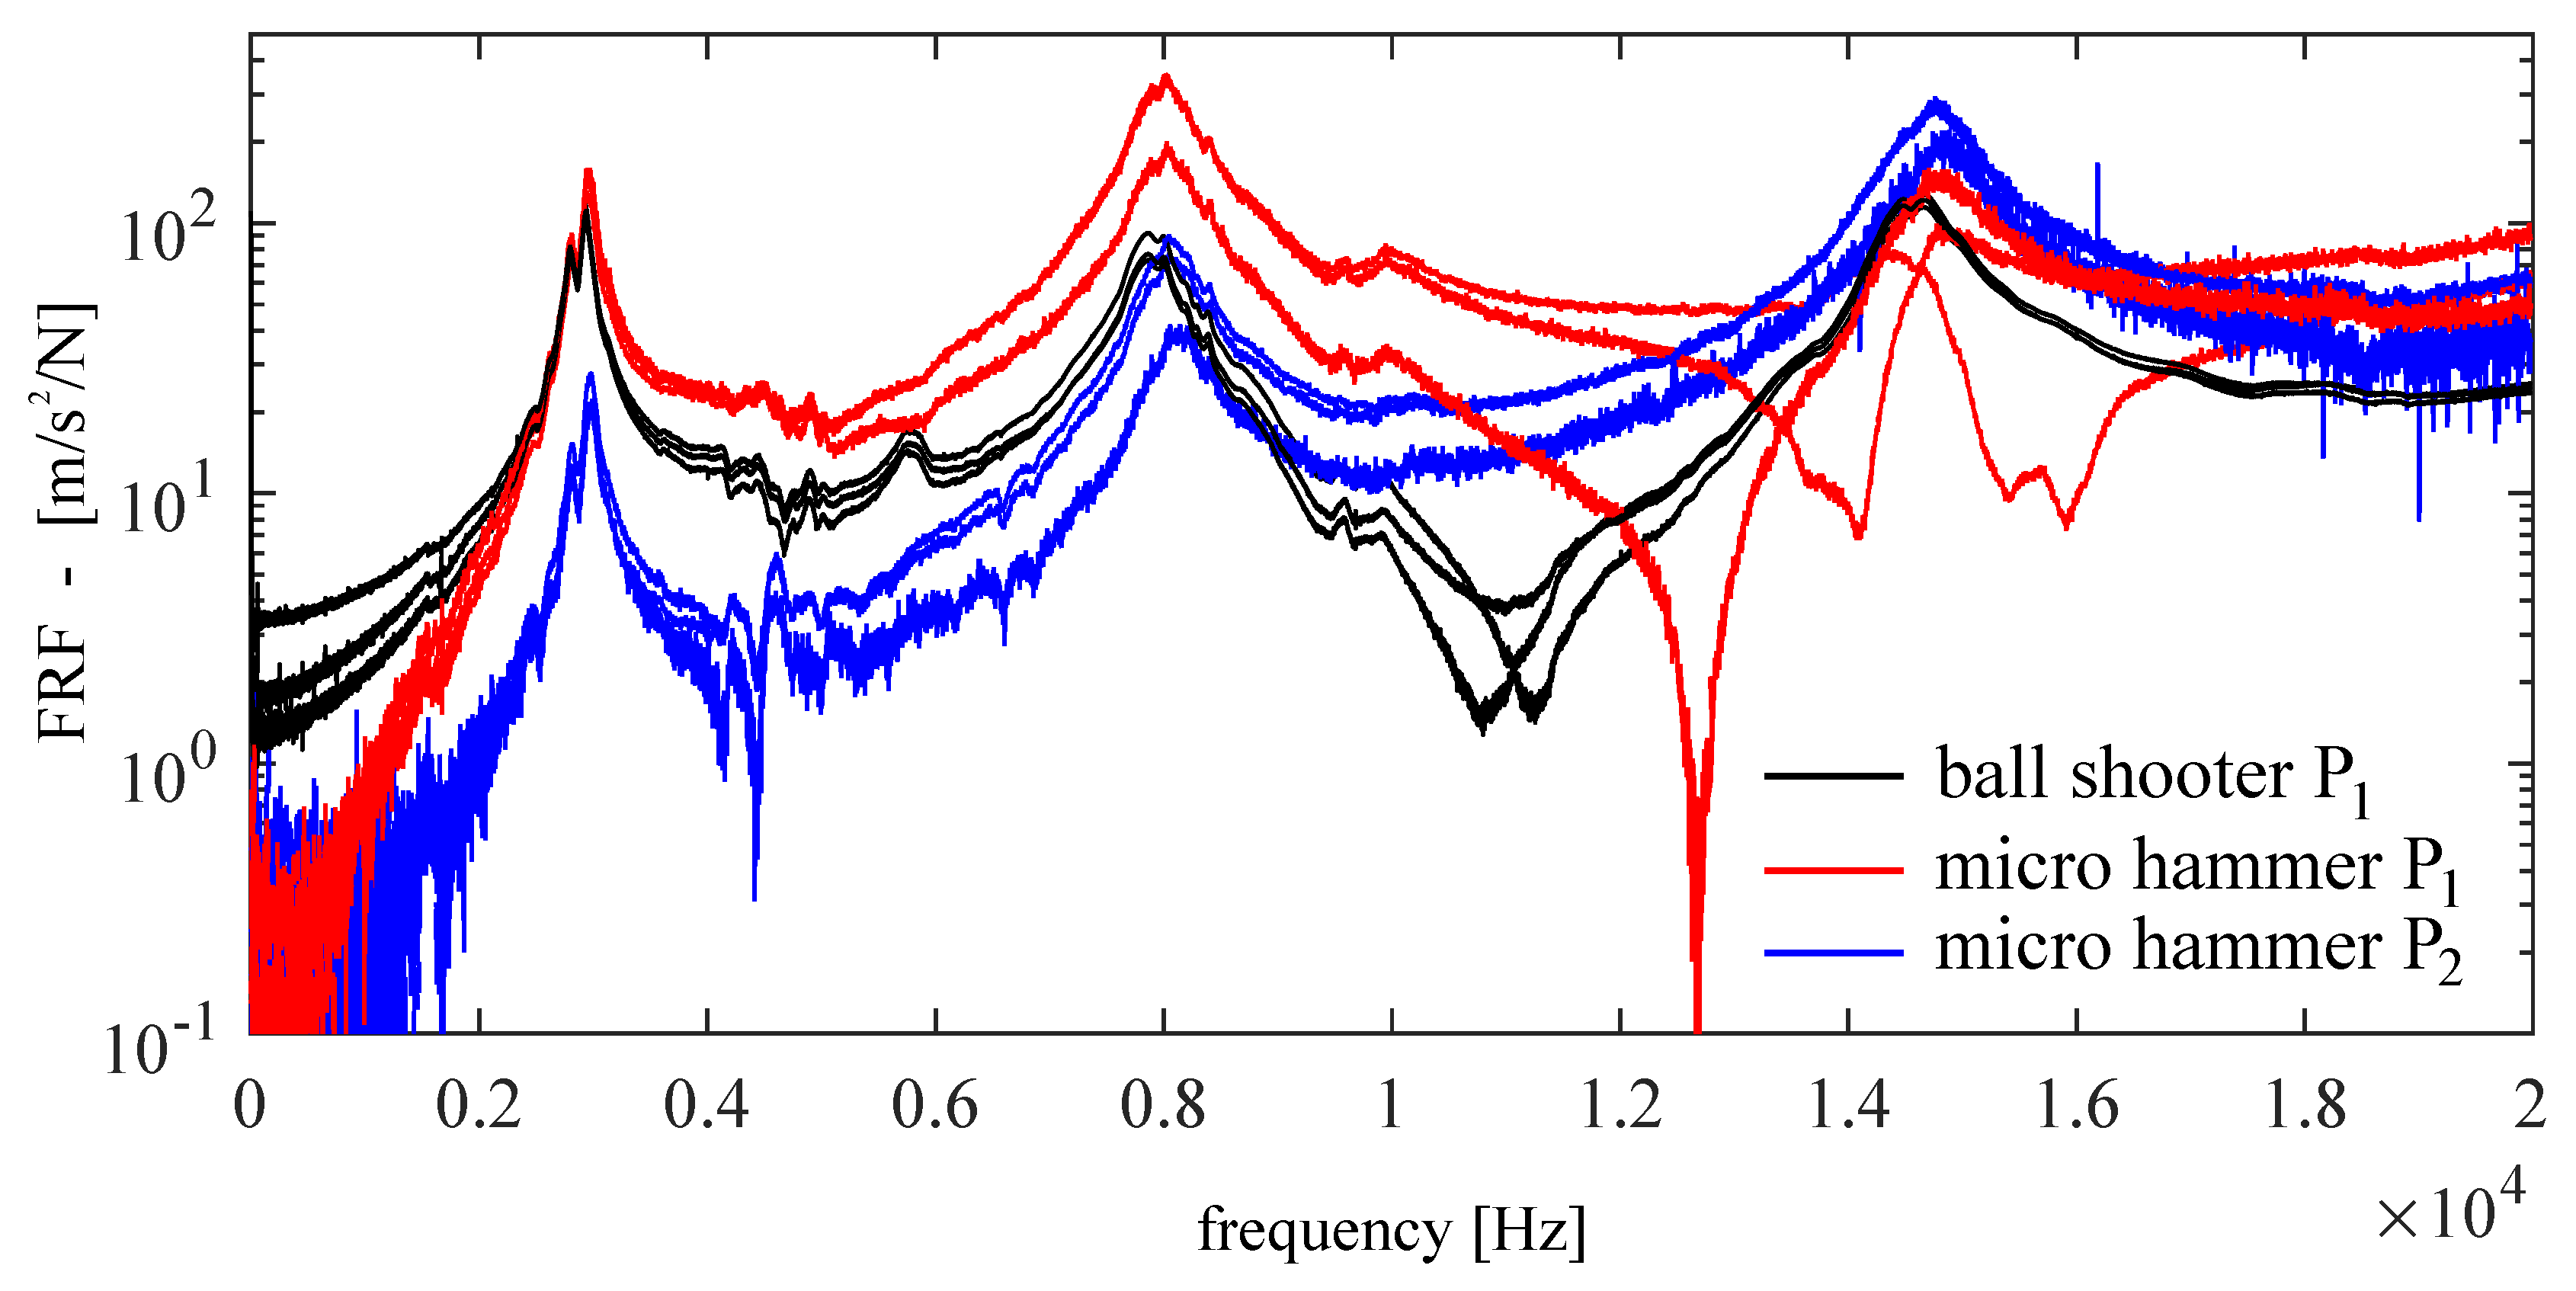
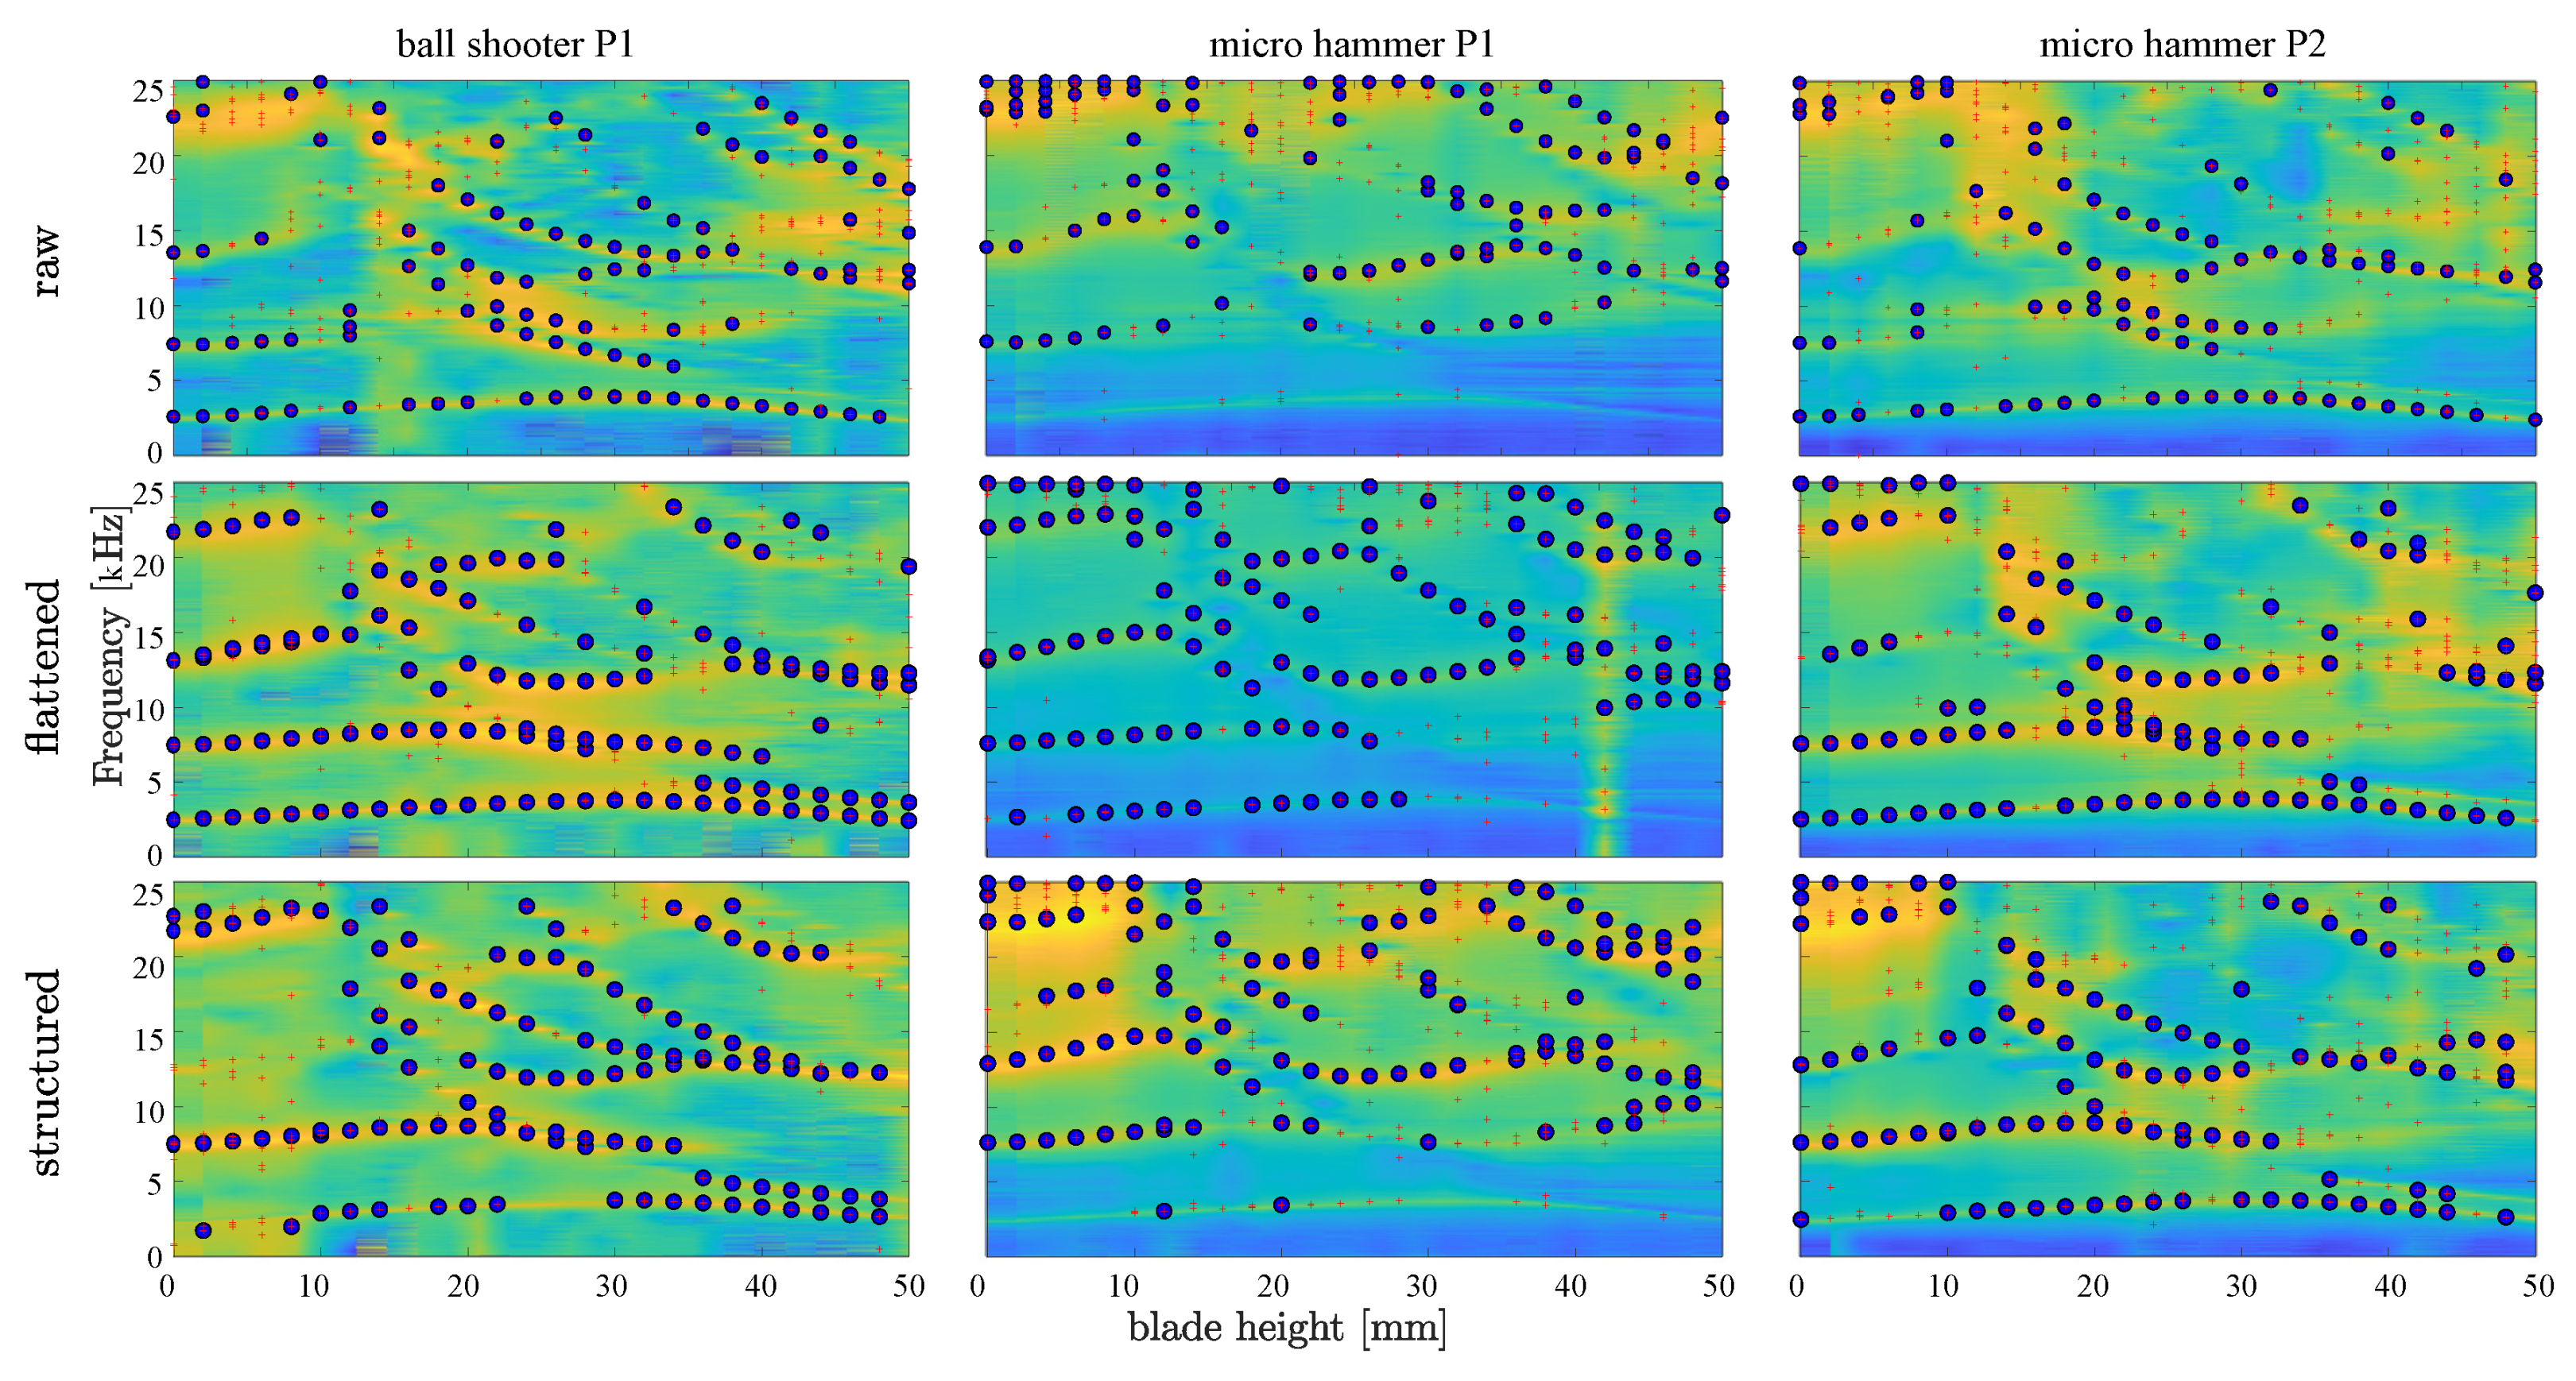
3.2. Measured Impulse Responses

In this subsection, the measured impulse responses and the fitted model parameters are discussed. Figure 11 shows typical measured FRFs at blade height s = 8 mm for micro hammer signal at different excitation points (P 1 and P 2 ) together with the scaled FFT (Fast Fourier Transform) of the raw response induced by the pellet impact at P 1 . During the measured impulse responses, a 1 s time window was used resulting in 1 Hz frequency resolution in the FRFs.
From the measured FRFs, the frequency peaks can be well recognized even above 10 kHz for both the micro modal hammer and the ball shooter. It is clearly shown that the automatic ball shooter can provide more consistent signals and smoother function by means of eliminating the uncertainty of human factors.
As a next step, the average of the three measured responses is plotted as a function of the blade height (see Figure 12). The natural frequencies are fitted based on the Impulse Dynamic Subspace method (IDS) [43]. In this method, the impulse response functions corresponding to the three individual excitations are calculated and the response is decomposed based on the Green function representation of the oscillatory system. By means of a singular value decomposition, the most dominant vibration modes can be determined. Six modes are identified for each impulse and marked by red crosses in the figure. Where the difference of two adjacent natural frequencies for all three excitations is less than 50 Hz, the fitted mode is marked by blue circles, indicating that the results are consistent.
Figure 12 shows that each row provides almost identical results in the frequencies, thus the quality of the ball shooter excitation is at least as good as the excitation of the micro hammer. The only difference can be spotted in the fitted malicious modes, which are faulty numerical results created during the fitting process. The right column in Figure 12 shows that the FRF involving a very rigid point (P 2 ) in the measurements produces more non-consistent modal fittings at large blade heights.
The slight difference between natural frequencies for each clamping surface (raw, flattened and structured surface) could be detected by all methods. This difference is around 5%; however, in some range of the blade height s = 25–30 mm it can reach 20%. In case of the raw clamping surface, the fitting of modal parameters includes more malicious modes, which might be caused by the non-modelled nonlinear behaviour of the connection.
In all cases, for smaller blade height the second natural frequency predicted by the FE model is not visible due to the direction of the excitation and sensing. This is a typical problem if the modal analysis is performed only at one point. This problem could be eliminated by performing excitation and sensing in multiple directions and locations. Adding an aiming capability to the ball shooter device could solve the problem of excitation, or using a 5-axis milling machine which could rotate and place the workpiece itself into a proper position while the ball shooter is fixed in one place.
It should be noted that the measured natural frequencies are much lower than the ones predicted by means of the FE model. The major factor causing these discrepancies is the model of the ideally rigid clamping of the surfaces.

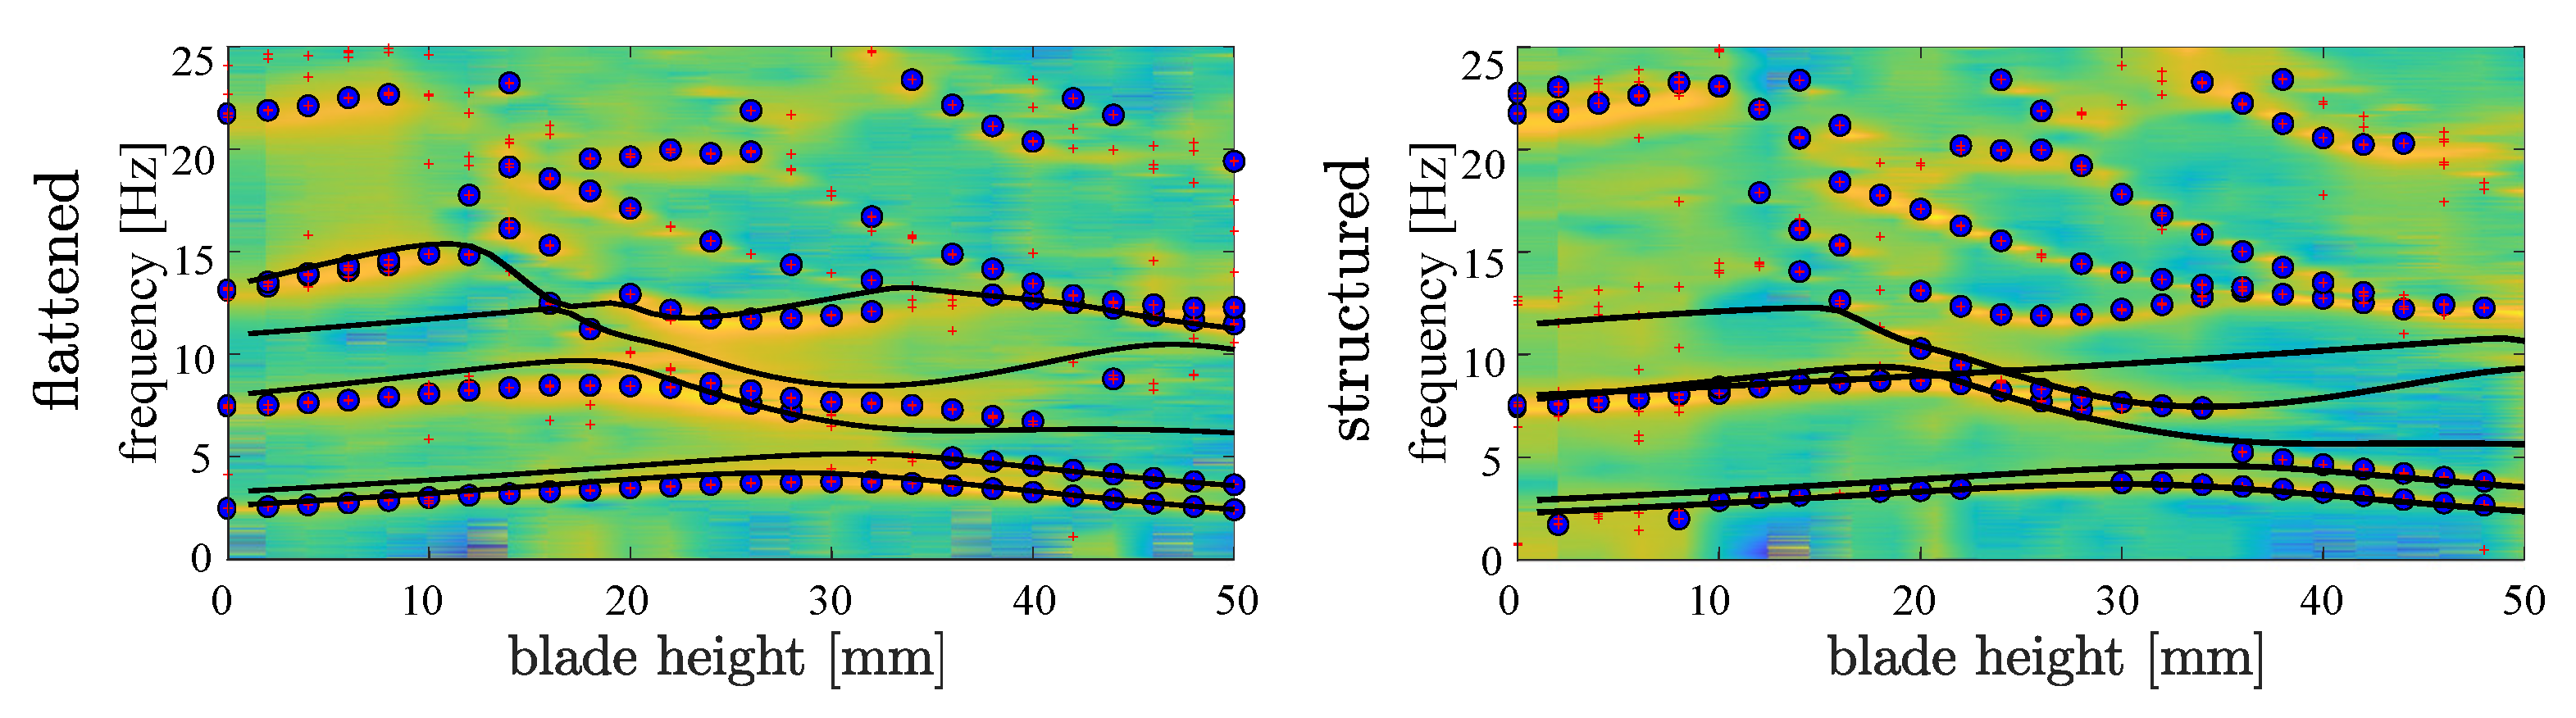
3.3. Improved FE Model

In practice, it is well known that modelling ideal clamping can lead to falsely increased natural frequencies compared to the measured ones. A simple solution to solve this problem is to add a thin elastic contact layer between the workpiece and the clamping unit. After a few steps of iteration, a layer with 1 mm thickness is added with the elastic modulus of 1.5 GPa, as it is depicted in Figure 13. This improved contact model provides good approximation in case of the structured surface, where the contact patch is well defined, as shown in Figure 14.

4. Conclusions and Outlook

In the present work, it is shown that the pellet impact of a ball shooter device is suitable to determine the natural frequencies and its real-time variation during the machining in case of a flexible workpiece. The bandwidth of the excitation is large enough to assume it to be constant in a wide frequency range and it is capable of capturing the natural frequencies based on the measured response only.
This automatic system can be used during the milling process to measure online even the rapid change of the natural frequencies of the workpiece due to the material removal without the need for interaction of a trained expert. By means of the IDS method, an unmanned automatic system can be constructed to determine the modal parameters. The precise knowledge of the instantaneous natural frequencies could be used to tune the spindle speed in order to eliminate the resonant vibration or to avoid chatter vibration. In addition, it can be used to fine-tune the FE model, to support the improved design of the blade profile.
The method is fast and it can accurately determine the frequencies, so it could also be used in mass production to follow the slowly varying dynamical properties. The only drawback of the current ball shooter design is that the force amplitude is not known exactly and the compliance cannot be determined precisely. The solution of this problem is a part of an ongoing ERC Proof of Concept project.

Author Contributions

Conceptualization, D.B.; Data curation, D.B.; Formal analysis, A.K.K., A.K., S.B. and D.H.; Funding acquisition, D.B., A.K.K. and G.S.; Investigation, A.K.K., A.K., S.B. and D.H.; Methodology, D.B.; Project administration, D.B.; Supervision, D.B.; Writing–original draft, D.B. and A.K.K.; Writing–review & editing, D.B. and G.S. All authors have read and agreed to the published version of the manuscript.

Funding

This paper was supported by the Hungarian Scientific Research Fund OTKA FK-124462 and PD-124646 and by the UNKP-19-3 New National Excellence Program of the Ministry for Innovation and Technology. This project has received funding from the European Research Council (ERC) under the European Union’s Horizon 2020 research and innovation programme (Grant agreement No. 862308). The research reported in this paper has been supported by the National Research, Development and Innovation Fund (TUDFO/51757/2019-ITM, Thematic Excellence Program).

Acknowledgments

SIREN PoC team to creat the ball shooter device.

Conflicts of Interest

The authors declare no conflict of interest.

References

  1. Tlusty, J.; Spacek, L. Self-excited Vibrations on Machine Tools; Nakl. CSAV: Prague, Czech Republic, 1954. [Google Scholar]
  2. Tobias, S. Machine-tool Vibration; Blackie: London, UK, 1965. [Google Scholar]
  3. Altintas, Y. Manufacturing Automation—Metal Cutting Mechanics, Machine Tool Vibrations and CNC Design, 2nd ed.; Cambridge University Press: Cambridge, UK, 2012. [Google Scholar]
  4. Altintas, Y.; Stépán, G.; Merdol, D.; Dombóvári, Z. Chatter stability of milling in frequency and discrete time domain. Cirp J. Manuf. Sci. Technol. 2008, 1, 35–44. [Google Scholar] [CrossRef]
  5. Yadav, A.; Talaviya, D.; Bansal, A.; Law, M. Design of Chatter-Resistant Damped Boring Bars Using a Receptance Coupling Approach. J. Manuf. Mater. Process. 2020, 4, 53. [Google Scholar] [CrossRef]
  6. Insperger, T.; Stépán, G. Semi-discretization method for delayed systems. Int. J. Numer. Methods Eng. 2002, 55, 503–518. [Google Scholar] [CrossRef]
  7. Cao, L.; Huang, T.; Shi, D.; Zhang, X.M.; Ding, H. Active chatter suppression in low immersion intermittent milling process. J. Manuf. Sci. Eng. 2020, 1–21. [Google Scholar] [CrossRef]
  8. Cherukuri, H.; Perez-Bernabeu, E.; Selles, M.; Schmitz, T. Machining chatter prediction using a data learning model. J. Manuf. Mater. Process. 2019, 3, 45. [Google Scholar] [CrossRef] [Green Version]
  9. Schmitz, T.L.; Mann, B.P. Closed-form solutions for surface location error in milling. Int. J. Mach. Tools Manuf. 2006, 46, 1369–1377. [Google Scholar] [CrossRef]
  10. Siddhpura, M.; Paurobally, R. A review of chatter vibration research in turning. Int. J. Mach. Tools Manuf. 2012, 61, 27–47. [Google Scholar] [CrossRef]
  11. Kayhan, M.; Budak, E. An experimental investigation of chatter effects on tool life. Proc. Inst. Mech. Eng. Part J. Eng. Manuf. 2009, 223, 1455–1463. [Google Scholar] [CrossRef] [Green Version]
  12. Zapata, R.; DeMarco, C.; Schmitz, T. The Milling Dynamics “Super Diagram”: Combining Stability and Surface Location Error. In Proceedings of the American Society for Precision Engineering Annual Meeting, ASPE 2009, Monterey, CA, USA, 4–9 October 2009. [Google Scholar]
  13. Caixu, Y.; Haining, G.; Xianli, L.; Liang, S.Y.; Lihui, W. A review of chatter vibration research in milling. Chin. J. Aeronaut. 2019, 32, 215–242. [Google Scholar]
  14. Munoa, J.; Beudaert, X.; Dombovari, Z.; Altintas, Y.; Budak, E.; Brecher, C.; Stepan, G. Chatter suppression techniques in metal cutting. CIRP Ann. 2016, 65, 785–808. [Google Scholar] [CrossRef]
  15. Clancy, B.E.; Shin, Y.C. A comprehensive chatter prediction model for face turning operation including tool wear effect. Int. J. Mach. Tools Manuf. 2002, 42, 1035–1044. [Google Scholar] [CrossRef]
  16. Tyler, C.T.; Schmitz, T.L. Analytical process damping stability prediction. J. Manuf. Process. 2013, 15, 69–76. [Google Scholar] [CrossRef]
  17. Altintas, Y.; Eynian, M.; Onozuka, H. Identification of dynamic cutting force coefficients and chatter stability with process damping. CIRP Ann. 2008, 57, 371–374. [Google Scholar] [CrossRef]
  18. Budak, E.; Tunc, L.T. Identification and modeling of process damping in turning and milling using a new approach. CIRP Ann. 2010, 59, 403–408. [Google Scholar] [CrossRef]
  19. Bravo, U.; Altuzarra, O.; de Lacalle, L.L.; Sánchez, J.; Campa, F. Stability limits of milling considering the flexibility of the workpiece and the machine. Int. J. Mach. Tools Manuf. 2005, 45, 1669–1680. [Google Scholar] [CrossRef]
  20. Thevenot, V.; Arnaud, L.; Dessein, G.; Cazenave–Larroche, G. Influence of Material Removal on the Dynamic Behavior of Thin-walled Structures in Peripheral Milling. Mach. Sci. Technol. 2006, 10, 275–287. [Google Scholar] [CrossRef]
  21. Denkena, B.; Schmidt, C. Experimental investigation and simulation of machining thin-walled workpieces. Prod. Eng. 2007, 1, 343–350. [Google Scholar] [CrossRef]
  22. Otto, A.; Khasawneh, F.A.; Radons, G. Position-dependent stability analysis of turning with tool and workpiece compliance. Int. J. Adv. Manuf. Technol. 2015, 79, 1453–1463. [Google Scholar] [CrossRef]
  23. Stepan, G.; Beri, B.; Miklos, A.; Wohlfart, R.; Bachrathy, D.; Porempovics, G.; Toth, A.; Takacs, D. On stability of emulated turning processes in HIL environment. CIRP Ann. 2019, 68, 405–408. [Google Scholar] [CrossRef]
  24. Budak, E.; Tunc, L.; Alan, S.; Özgüven, H.N. Prediction of workpiece dynamics and its effects on chatter stability in milling. CIRP Ann. 2012, 61, 339–342. [Google Scholar] [CrossRef]
  25. Seguy, S.; Dessein, G.; Arnaud, L. Surface roughness variation of thin wall milling, related to modal interactions. Int. J. Mach. Tools Manuf. 2008, 48, 261–274. [Google Scholar] [CrossRef] [Green Version]
  26. Li, Z.L.; Tuysuz, O.; Zhu, L.M.; Altintas, Y. Surface form error prediction in five-axis flank milling of thin-walled parts. Int. J. Mach. Tools Manuf. 2018, 128, 21–32. [Google Scholar] [CrossRef]
  27. Song, Q.; Ai, X.; Tang, W. Prediction of simultaneous dynamic stability limit of time–variable parameters system in thin-walled workpiece high-speed milling processes. Int. J. Adv. Manuf. Technol. 2011, 55, 883–889. [Google Scholar] [CrossRef]
  28. Stepan, G.; Kiss, A.K.; Ghalamchi, B.; Sopanen, J.; Bachrathy, D. Chatter avoidance in cutting highly flexible workpieces. CIRP Ann. 2017, 66, 377–380. [Google Scholar] [CrossRef]
  29. Tuysuz, O.; Altintas, Y. Frequency Domain Updating of Thin-Walled Workpiece Dynamics Using Reduced Order Substructuring Method in Machining. J. Manuf. Sci. Eng. 2017, 139, 071013. [Google Scholar] [CrossRef]
  30. Tuysuz, O.; Altintas, Y. Time-domain modeling of varying dynamic characteristics in thin-wall machining using perturbation and reduced-order substructuring methods. J. Manuf. Sci. Eng. 2018, 140, 011015. [Google Scholar] [CrossRef]
  31. Wan, M.; Dang, X.B.; Zhang, W.H.; Yang, Y. Optimization and improvement of stable processing condition by attaching additional masses for milling of thin-walled workpiece. Mech. Syst. Signal Process. 2018, 103, 196–215. [Google Scholar] [CrossRef]
  32. Kiss, A.K.; Hajdu, D.; Bachrathy, D.; Stepan, G. Operational stability prediction in milling based on impact tests. Mech. Syst. Signal Process. 2018, 103, 327–339. [Google Scholar] [CrossRef] [Green Version]
  33. Ewins, D.J. Modal Testing, Theory, Practice, and Application, 2nd ed.; Wiley: Hoboken, NJ, USA, 2000. [Google Scholar]
  34. Takács, D.; Wohlfart, R.; Miklós, Á.; Krajnyák, G.; Tóth, A.; Stépán, G. Ball shooting tests for identification of modal parameter variation in rotating main spindles. Procedia CIRP 2018, 77, 481–484. [Google Scholar] [CrossRef]
  35. Berezvai, S.; Kossa, A.; Bachrathy, D.; Stepan, G. Numerical and experimental investigation of the applicability of pellet impacts for impulse excitation. Int. J. Impact Eng. 2018, 115, 19–31. [Google Scholar] [CrossRef]
  36. Kruth, J.P.; Liu, A.M.M.; Vanherck, P.; Lauwers, B. A strategy for selection of optimal cutting parameter in high-speed milling to avoid chatter vibration. Int. J. Prod. Eng. Comput. 2002, 4, 35–42. [Google Scholar]
  37. Reith, M.J.; Stépán, G. Optimization of material removal rate for orthogonal cutting with vibration limits. Period. Polytech. Mech. Eng. 2012, 56, 91–97. [Google Scholar] [CrossRef] [Green Version]
  38. Eksioglu, C.; Kilic, Z.; Altintas, Y. Discrete-time prediction of chatter stability, cutting forces, and surface location errors in flexible milling systems. J. Manuf. Sci. Eng. 2012, 134, 061006. [Google Scholar] [CrossRef]
  39. Meirovitch, L. Fundamentals of Vibrations; Waveland Press: Long Grove, IL, USA, 2010. [Google Scholar]
  40. Kiss, A.K.; Bachrathy, D.; Stepan, G. Effects of varying dynamics of flexible workpieces in milling operations. J. Manuf. Sci. Eng. 2020, 142, 011005. [Google Scholar] [CrossRef]
  41. Smith, M. ABAQUS/Standard User’s Manual, Version 6.9; Dassault Systèmes Simulia Corp: Providence, RI, USA, 2009. [Google Scholar]
  42. Wiederkehr, P.; Wilck, I.; Siebrecht, T. Determination of the dynamic behaviour of micro-milling tools at higher spindle speeds using ball-shooting tests for the application in process simulations. CIRP Ann. 2020, 69, 97–100. [Google Scholar] [CrossRef]
  43. Dombovari, Z. Dominant modal decomposition method. J. Sound Vib. 2017, 392, 56–69. [Google Scholar] [CrossRef]
Figure 1. (a) The machined final blade profile with the excitation (P1, P2) and sensing point (P3) together with the small sized accelerometer. (b) The CAD model of the blade.
Jmmp 04 00078 g001
Figure 2. Different clamping surfaces of the turbine blade: the raw surface in the left, flattened in the middle and the structured surface in the right column. (a) The top row shows the picture of the surface contours created by a light test, (b) the middle row shows the picture of the clamped surface sections and (c) the bottom row shows the (non-scaled) schematic drawing of the cross-sections.
Jmmp 04 00078 g002
Figure 3. Schematic representation of the coupled beam model (a) and the two separated components (b,c). The assumed deformation is represented by blue and green curves in the raw and the blade parts, respectively.
Jmmp 04 00078 g003
Figure 4. The fluctuation of the natural frequencies in the function of the blade height calculated by the simplified analytical model. Thick curves present the frequency fluctuations of the coupled part while thin curves represent the decomposed models. (a) bending vibration along the x axis (b) bending vibration along the y axis.
Jmmp 04 00078 g004
Figure 5. The fluctuation of the natural frequencies in the function of the blade height for both x and y directional bending modes calculated by the simplified analytical model.
Jmmp 04 00078 g005
Figure 6. The natural frequencies as a function of the blade height calculated by the FEA for ideally rigid constraints at the flattened (black) and the structured (red) clamping surfaces.
Jmmp 04 00078 g006
Figure 7. The mode shapes of the first 4 natural frequencies at different blade heights for the ideally fixed flattened geometry.
Jmmp 04 00078 g007
Figure 8. The measurement setup with the ball shooter and the clamped workpiece at the final stage of the machining of the blade profile ( s = 50 mm).
Jmmp 04 00078 g008
Figure 9. The top panel (a) represents the spectrum of the measured acceleration responses induced by the ball shooter at P 1 (black) and the micro hammer at P 1 (red) and P 2 (blue) (three responses for each impulse), while the bottom panel (b) presents the spectrum of the applied excitation force by the micro modal hammer at blade height s = 8 mm.
Jmmp 04 00078 g009
Figure 10. (a) The applied FE model with maximal deformation and stresses for v = 30 m / s , (b) the impact force characteristics and (c) the impact force spectrum and the limit corresponding to 3 dB for v = 15 , 20 , 25 , 30 m / s .
Jmmp 04 00078 g010
Figure 11. Typical Frequency Responses Functions for the micro hammer excitation at points P 1 (red) & P 2 (blue) and for the ball shooter excitation at P 1 (black) considering a constant force spetrum at blade height s = 8 mm.
Jmmp 04 00078 g011
Figure 12. The measured averaged Frequency Response Function in the function of the blade height presented as a waterfall diagram. The colour scale denotes the logarithmic amplitude of the averaged FRF, the red crosses denote all the fitted natural frequencies by means of the ISD method for each excitation and the blue circles denote the consistent fitted natural frequencies.
Jmmp 04 00078 g012
Figure 13. Schematics of the clamping geometries with the additional artificial elastic layer.
Jmmp 04 00078 g013
Figure 14. The natural frequencies of the FE model with the artificial elastic layer (black lines) and the measured averaged Frequency Response Function in the function of the blade height presented as a waterfall diagram. The colour scale denotes the logarithmic amplitude of the averaged FRF, the red crosses denote all the fitted natural frequencies by means of the ISD method for each excitation and the blue circles denote the consistent fitted natural frequencies.
Jmmp 04 00078 g014
Table 1. Material properties of the aluminium (A2024-T351) workpiece.
NameUnitValue
Densitykg/m 3 2700
Young’s modulusGPa70
Poisson’s ratio10.35
Table 2. Geometrical properties.
NameUnitRaw SecionBlade Secion
Areamm 2 800137.7
second moment of area to axis xmm 4 26,6661500
second moment of area to axis ymm 4 106,66612,330
Table 3. The applied elastic-plastic material parameters of the airsoft ball and the aluminum wall.
ParameterUnitAirsoft BallWall
Density[kg/m 3 ]39002700
Elastic modulus[GPa]2.3170
Poisson’s ratio[1]0.250.35
Initial yield stress[MPa]23.71324
Plastic hardening[MPa]1659.720

