Technical Note

Study on the Coastline Evolution in Sopot (2008–2018) Based on Landsat Satellite Imagery

1
Department of Transport and Logistics, Gdynia Maritime University, Morska 81-87, 81-225 Gdynia, Poland
2
Department of Geodesy and Oceanography, Gdynia Maritime University, Morska 81-87, 81-225 Gdynia, Poland
3
Department of Navigation and Hydrography, Polish Naval Academy, Śmidowicza 69, 81-127 Gdynia, Poland
4
Department of Geodesy, Gdańsk University of Technology, Gabriela Narutowicza 11/12, 80-233 Gdańsk, Poland
*
Author to whom correspondence should be addressed.
J. Mar. Sci. Eng. 2020, 8(6), 464; https://0-doi-org.brum.beds.ac.uk/10.3390/jmse8060464
Submission received: 5 June 2020 / Revised: 20 June 2020 / Accepted: 22 June 2020 / Published: 24 June 2020
(This article belongs to the Special Issue Marine Measurements: Theory, Methods and Applications)

Abstract

:
The coastline is the boundary between the water surface in a reservoir or watercourse and the land, which is characterised by high instability and functional diversity. For these reasons, research on coastal monitoring has been conducted for several decades. Currently, satellite images performed with synthetic aperture radars (SARs) are used to determine its course and variability together with high-resolution multispectral imagery from satellites such as IKONOS, QuickBird, and WorldView, or moderate-resolution multispectral images from Landsat satellites. This paper analysed the coastline variability in Sopot (2008–2018) based on Landsat satellite imagery. Furthermore, based on multispectral images obtained, it was determined how the beach surface in Sopot changed. Research has shown that the coastline keeps moving away from the land every year. This was particularly noticeable between 2008 and 2018 when the coastline moved on average 19.1 m towards the Baltic Sea. Moreover, it was observed that the area of the sandy beach in Sopot increased by 14 170.6 m2, which translates into an increase of 24.7% compared to 2008. The probable cause of the continuous coastline shift towards the sea and the increase of the beach surface is the oceanographic phenomenon called tombolo, which occurred in this area as a result of the construction of a yacht marina near the coast.

Graphical Abstract

1. Introduction

The coastline is a dynamically changing boundary between land and water [1], characterized by instability and functional diversity depending on the region [2]. This boundary is important for the ecological and economic policies of coastal states because areas located in the coastal zone are rich in natural resources. This results in about 50% of the world’s population being currently settled in zones located within 100 km from the coastline [3]. Therefore, coastal monitoring research is currently being conducted in areas such as deltas and estuaries [4,5], wetlands [6], bays [7] and other geographical forms along the coast [8].
Coastline formation is the result of many factors (both anthropogenic and natural), which include, for example, sea erosion, water level rise [9], sediment transport [10], earthquakes [11], sea currents, tides, waving, flooding of coastal areas [12], rise in ocean temperature and acidity levels [13], sea water intrusion [14], biological activity and river regulation. According to research [15,16], sea erosion has the greatest influence on shoreline shape. As a result, 24–70% of all sandy beaches on Earth are moving back into the land [17,18]. In Europe, about 15,100 km of the coastline erodes (out of a total of 101,000 km) and the continent shrinks by about 15 km2 yearly [19]. In Europe, this is particularly noticeable in countries such as France, Greece and Italy, where 20–30% of the total length of the shoreline shifts inland, even by a few meters a year [20]. The process of water erosion can be observed in particular in the Gulf of Guinea between Cameroon and Ivory Coast, where the coastline moves inland by up to 10 m a year. Since the 1960s, in these areas erosion has posed a serious threat to the stability of buildings in the coastal zone and has resulted in the need for artificial shore protection [21]. Another example of the negative effects of sea erosion includes the Wouri river estuary in Cameroon, which shifts by about 3 m a year and thus poses a great risk of the flooding of mangroves, which are among the richest, most complex ecosystems of the Earth with the greatest biological production [22].
At the end of the 20th century, satellite image analysis became the most popular solution used to determine the coastline course in an accurate, fast manner and on a large scale [23]. Among others, it uses imagery performed with synthetic aperture radars (SARs), which are assembled on European Remote Sensing (ERS) satellites [24], high-resolution multispectral images (0.5–2.5 m) from DubaiSat satellites [25], IKONOS, QuickBird [26], WorldView [27] and moderate resolution multispectral imagery taken from Landsat satellites [28]. Alternative methods for determining the shoreline course are geodetic measurements [29,30], especially with the use of the Global Positioning System (GPS) and photogrammetric measurements [31,32] made with the use of manned or unmanned flying systems. Although these methods were characterized by high measurement accuracy (up to several centimetres), they covered a relatively small area [33].
Landsat is one of the most frequently used programs for remote acquisition of Earth photographs from space. Currently, these are taken by two Landsat series satellites: Landsat-7 and Landsat-8, the former having failed quite a long time ago (in 2003) and generating “damaged” images. The Landsat program makes available satellite multispectral imagery of medium spatial and temporal resolution which have been available free of charge since 2008. For this reason, they are the backbone of many applications (Geocover 2000, i3, NLT, and OnEarth layers in the National Aeronautics and Space Administration (NASA) World Wind; TruEarth in Google Earth and Maps; TerraColor in Windows Live Maps/Virtual Earth 3D).
Thanks to universal access to satellite images, Landsat is widely used in many areas, such as agriculture [34], forestry [35], environmental protection [36], hydrology [37] and spatial planning [38]. Many researchers [39,40,41] are currently also using Landsat imagery of the Earth in visible light, near- and mid-infrared light to monitor the coastline, in particular, in order to determine its spatial and temporal variability (from 10 to 30 years). This is possible thanks to an extensive database of satellite images, even decades old [39,40,41,42]. However, please note that some of them may have a low spatial resolution that can directly affect the accuracy of shoreline determination [23].
Due to the wide spectrum of application of remote-sensing data, it was decided to determine the spatial and temporal coastline variability of the waterbody adjacent to the pier in Sopot (Poland) in the years 2008–2018. For this purpose, multispectral images taken by Landsat satellites available for free on the Google Earth Pro platform were used. The chosen waterbody is special because a unique oceanographic phenomenon, called tombolo, occurs there as a result of the construction of a nearby marina. This phenomenon leads to a constant shoreline shift towards the sea, which negatively impacts both the aquatic environment and human [43,44,45,46]. Therefore, it seems reasonable to monitor the coastline variability in this waterbody to prevent it from moving, e.g., by performing silting works where appropriate.

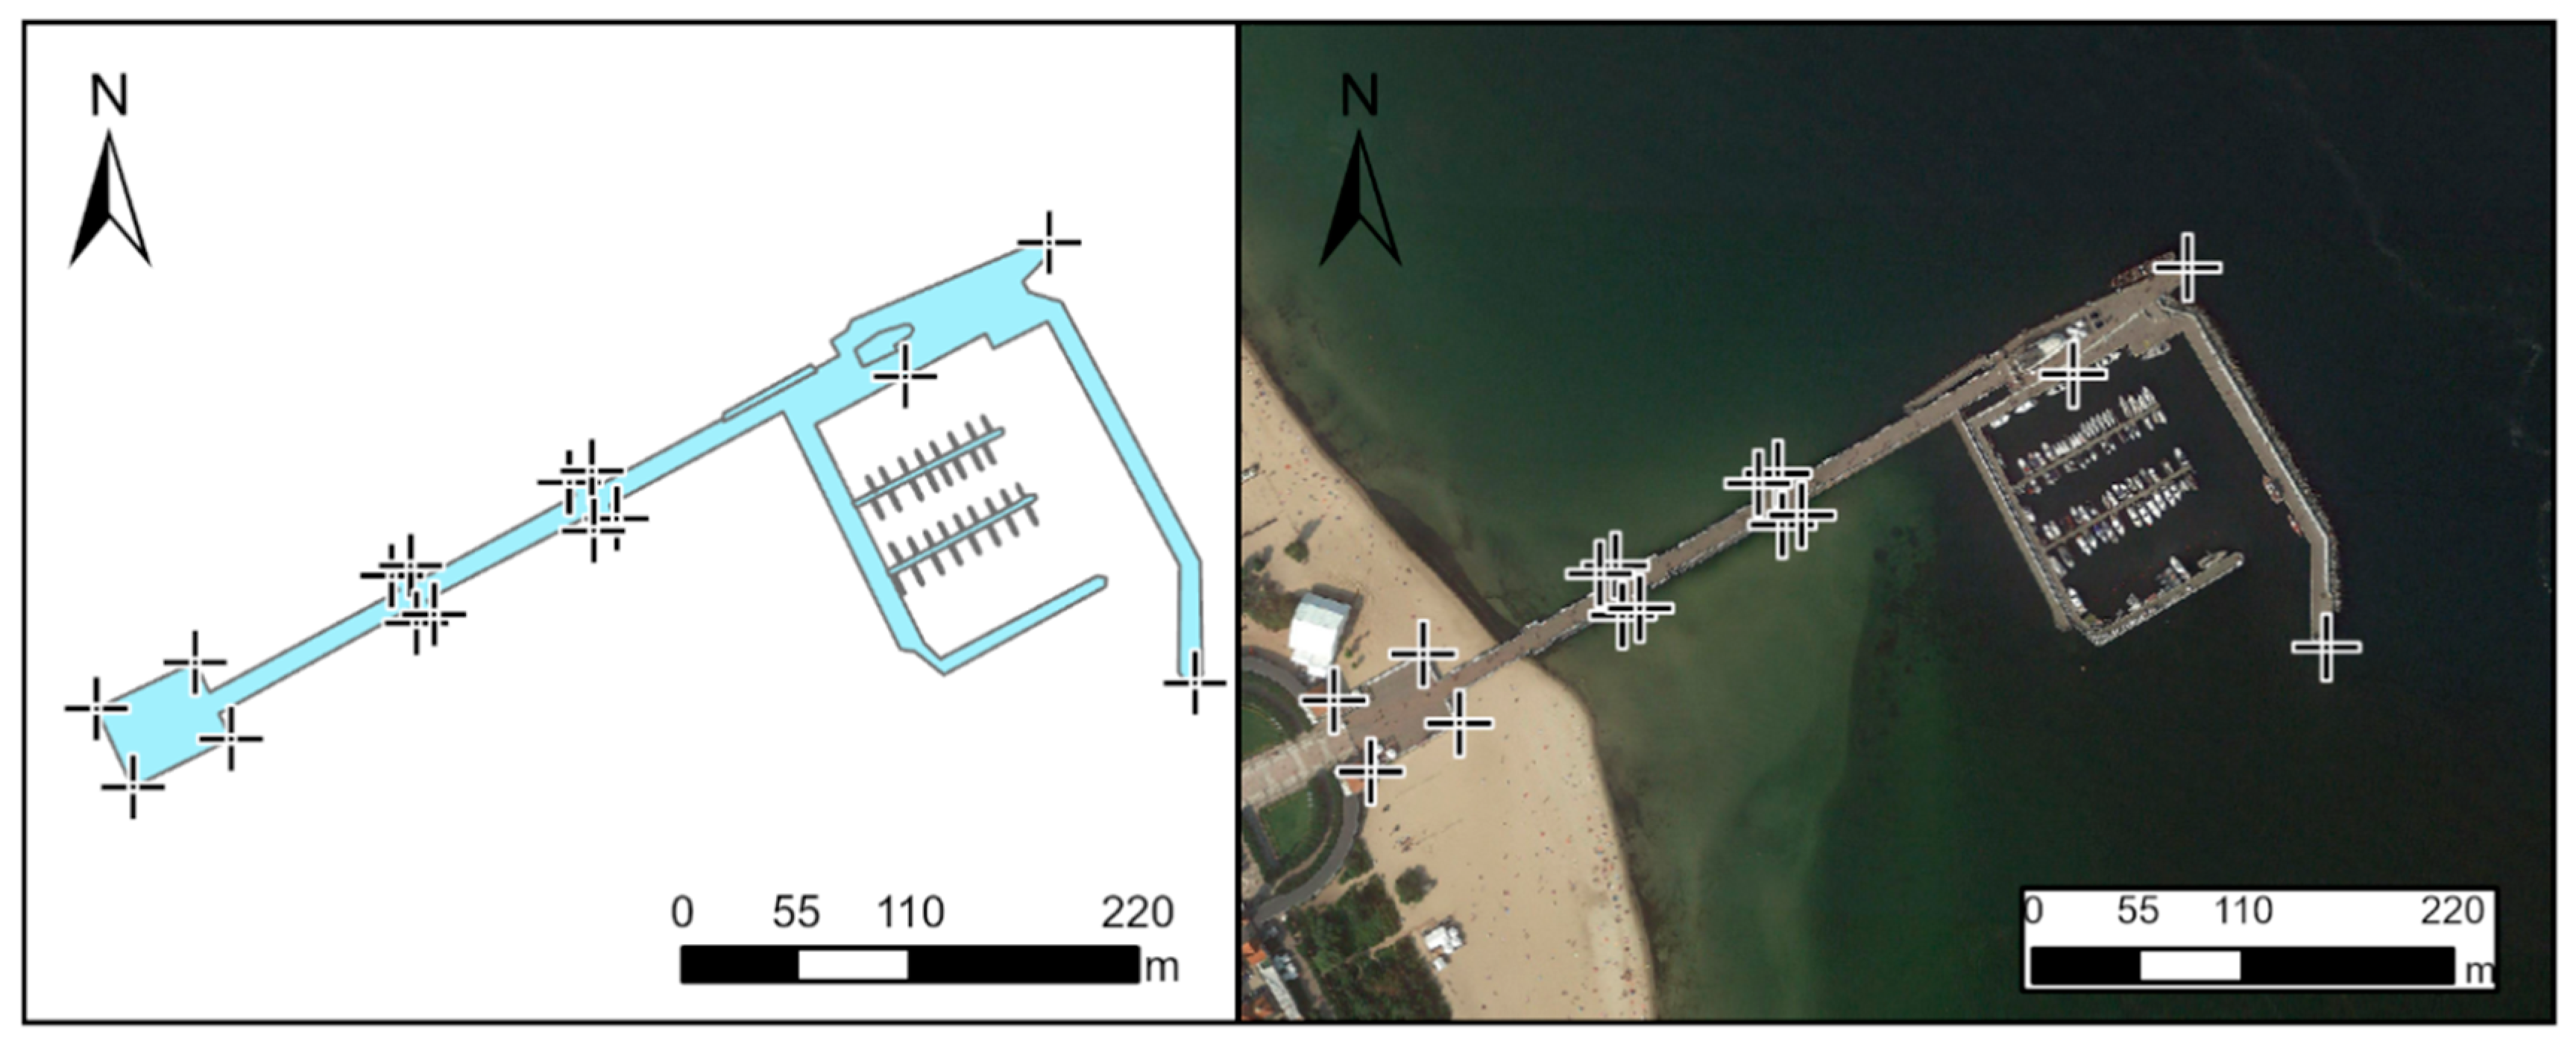
2. Materials and Methods—Vectorization of Satellite Images Taking into Account Hydrological Data

ArcGIS software was used for data processing. Satellite images from Copernicus and Landsat were used for the analyses and constituted a source of data on the coastline course. For these images to be cartometric, they had to be given in a specific coordinate system. Therefore, taking into account the scale of these images, the first stage of works was undertaken, i.e., georeferencing [47] (Figure 1). This process was based on the determination of control (reference) points for both the vector layer (pier model), drawn on the basis of a topographic map from the Geoportal website and a satellite imagery. Once these were determined, raster calibration was conducted, i.e., transformation and recording information about the given spatial reference. For research purposes, the pier model and satellite image were fitted into the Universal Transverse Mercator (UTM) system for publishing nautical charts [48].
Prior to the analyses, a reference line was established against which the coastline shifts from 2010–2018 were calculated against the 2008 shoreline. It was assumed to be 800 m long and to cover both the left and right sides of the pier in Sopot. Subsequently, the coastlines were drawn based on satellite images from the Google Earth Pro platform to start the vectorization process [47] (Figure 2).
The waving range and sea levels can cause a coastline shift. Taking into account that the waving range is very small along the Polish Baltic coast and the waves are short and steep [49], it was decided not to take it for the analysis of the shoreline variability in Sopot. However, it was decided to analyse the differences in sea levels (Table 1). The data were obtained from the Institute of Meteorology and Water Management-National Research Institute (IMGW-PIB) gauging station in Gdynia, which is nearest to the place of measurements [50].
Based on the sea-level data from the gauging station in Gdynia, it can be seen that in selected years the averages and medians are similar. The difference between the minimum and maximum sea-level value in a given month and year is less than 1 m. Therefore, it is not necessary to relate the coastlines to the mean level of the Baltic Sea for the Kronstadt mareograph.

3. Results

This chapter analyses changes in the beach surface and the coastline variability in Sopot in the years 2008–2018. As a measure of change assessment, an increase or decrease of the beach area was assumed compared to 2008 (m2) and the standard deviation of the distance between the 2008 shoreline and the land–water boundary determined between 2010–2018 (m).

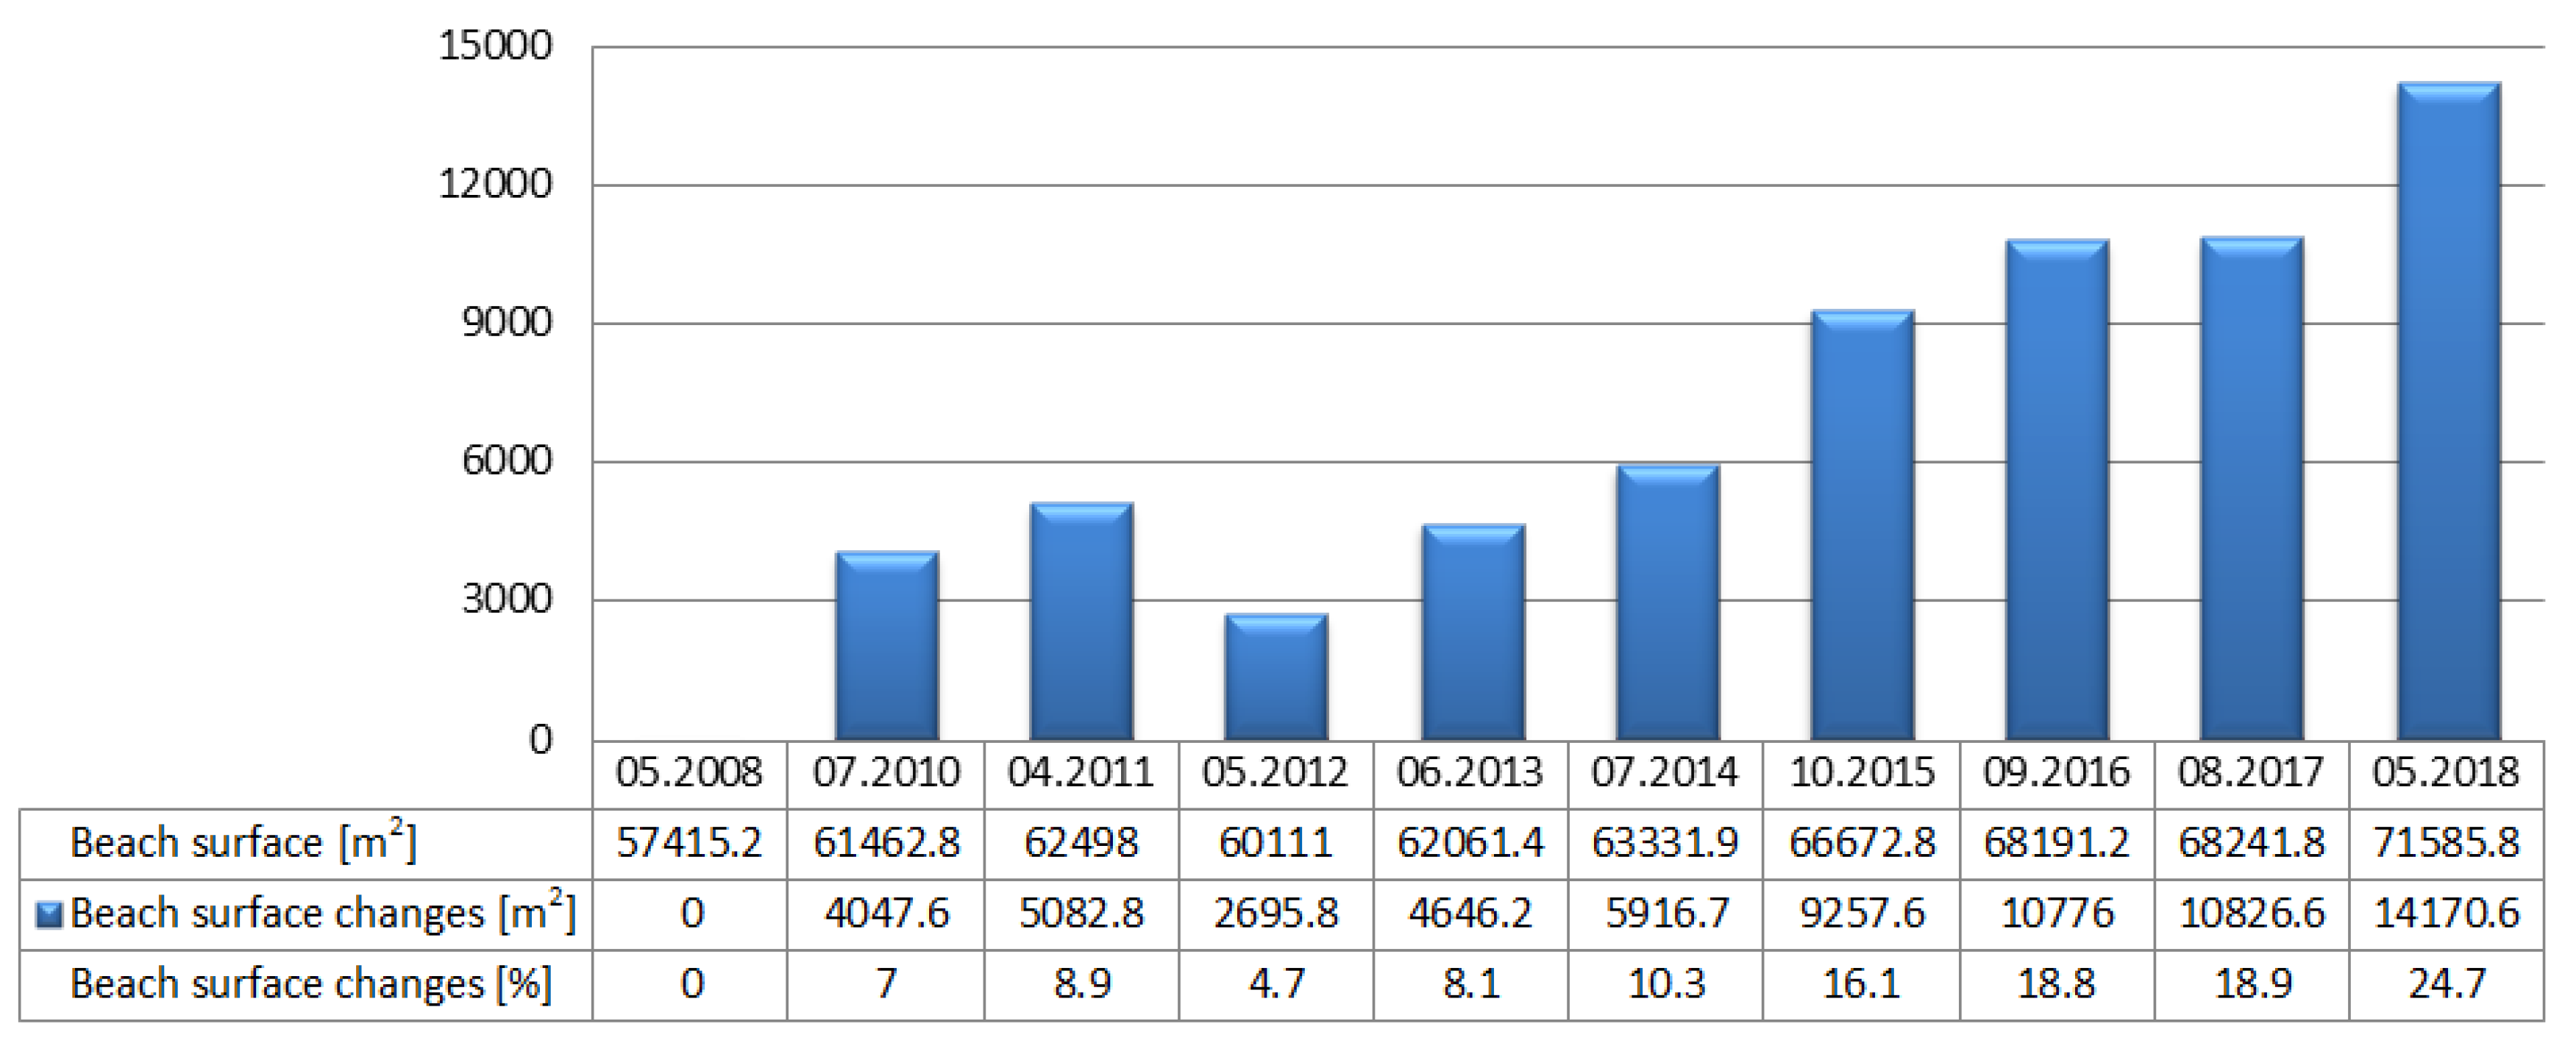
3.1. Analysis of Beach Surface Changes in Sopot

After completion of the vectorization for all the coastlines and assessment of factors that may affect their location, the beach surface changes in Sopot were analysed. To do so, it was necessary to determine the boundaries of the area between the beginning of the beach and the shoreline. Then they had to be converted to polygons. Next, with the Calculate Geometry tool, available in ArcGIS software, information about the beach surface in specific years was obtained (Figure 3).
Based on the results obtained, we can see that the land area adjacent to the waterbody near the pier in Sopot had the smallest surface (57,415.2 m2) in May 2008, i.e., before marina construction started. The beach area was the largest (71,585.8 m2) in May 2018, i.e., 7 years after the marina was commissioned. Note that over the 10 years the beach increased by 14,170.6 m2, which is a 24.7% growth compared to 2008. Moreover, from Figure 3 it follows that the beach surface in Sopot kept growing every year, except for 2012. Waving, visible in the satellite image of May 2012, which worsened the coastline visibility, is the probable cause (Figure 4). The next factor which contributed to the coastline visibility on satellite image in 2014 are longshore, rip and undertow currents [51].

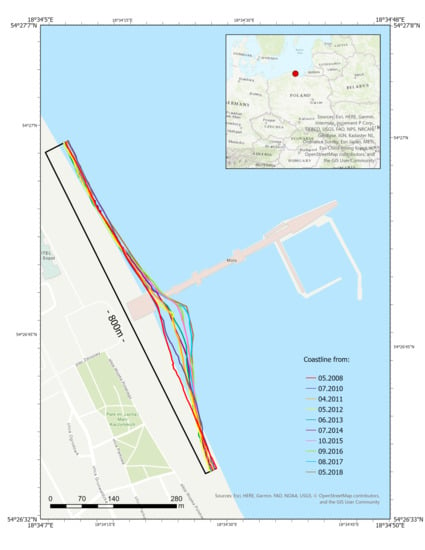
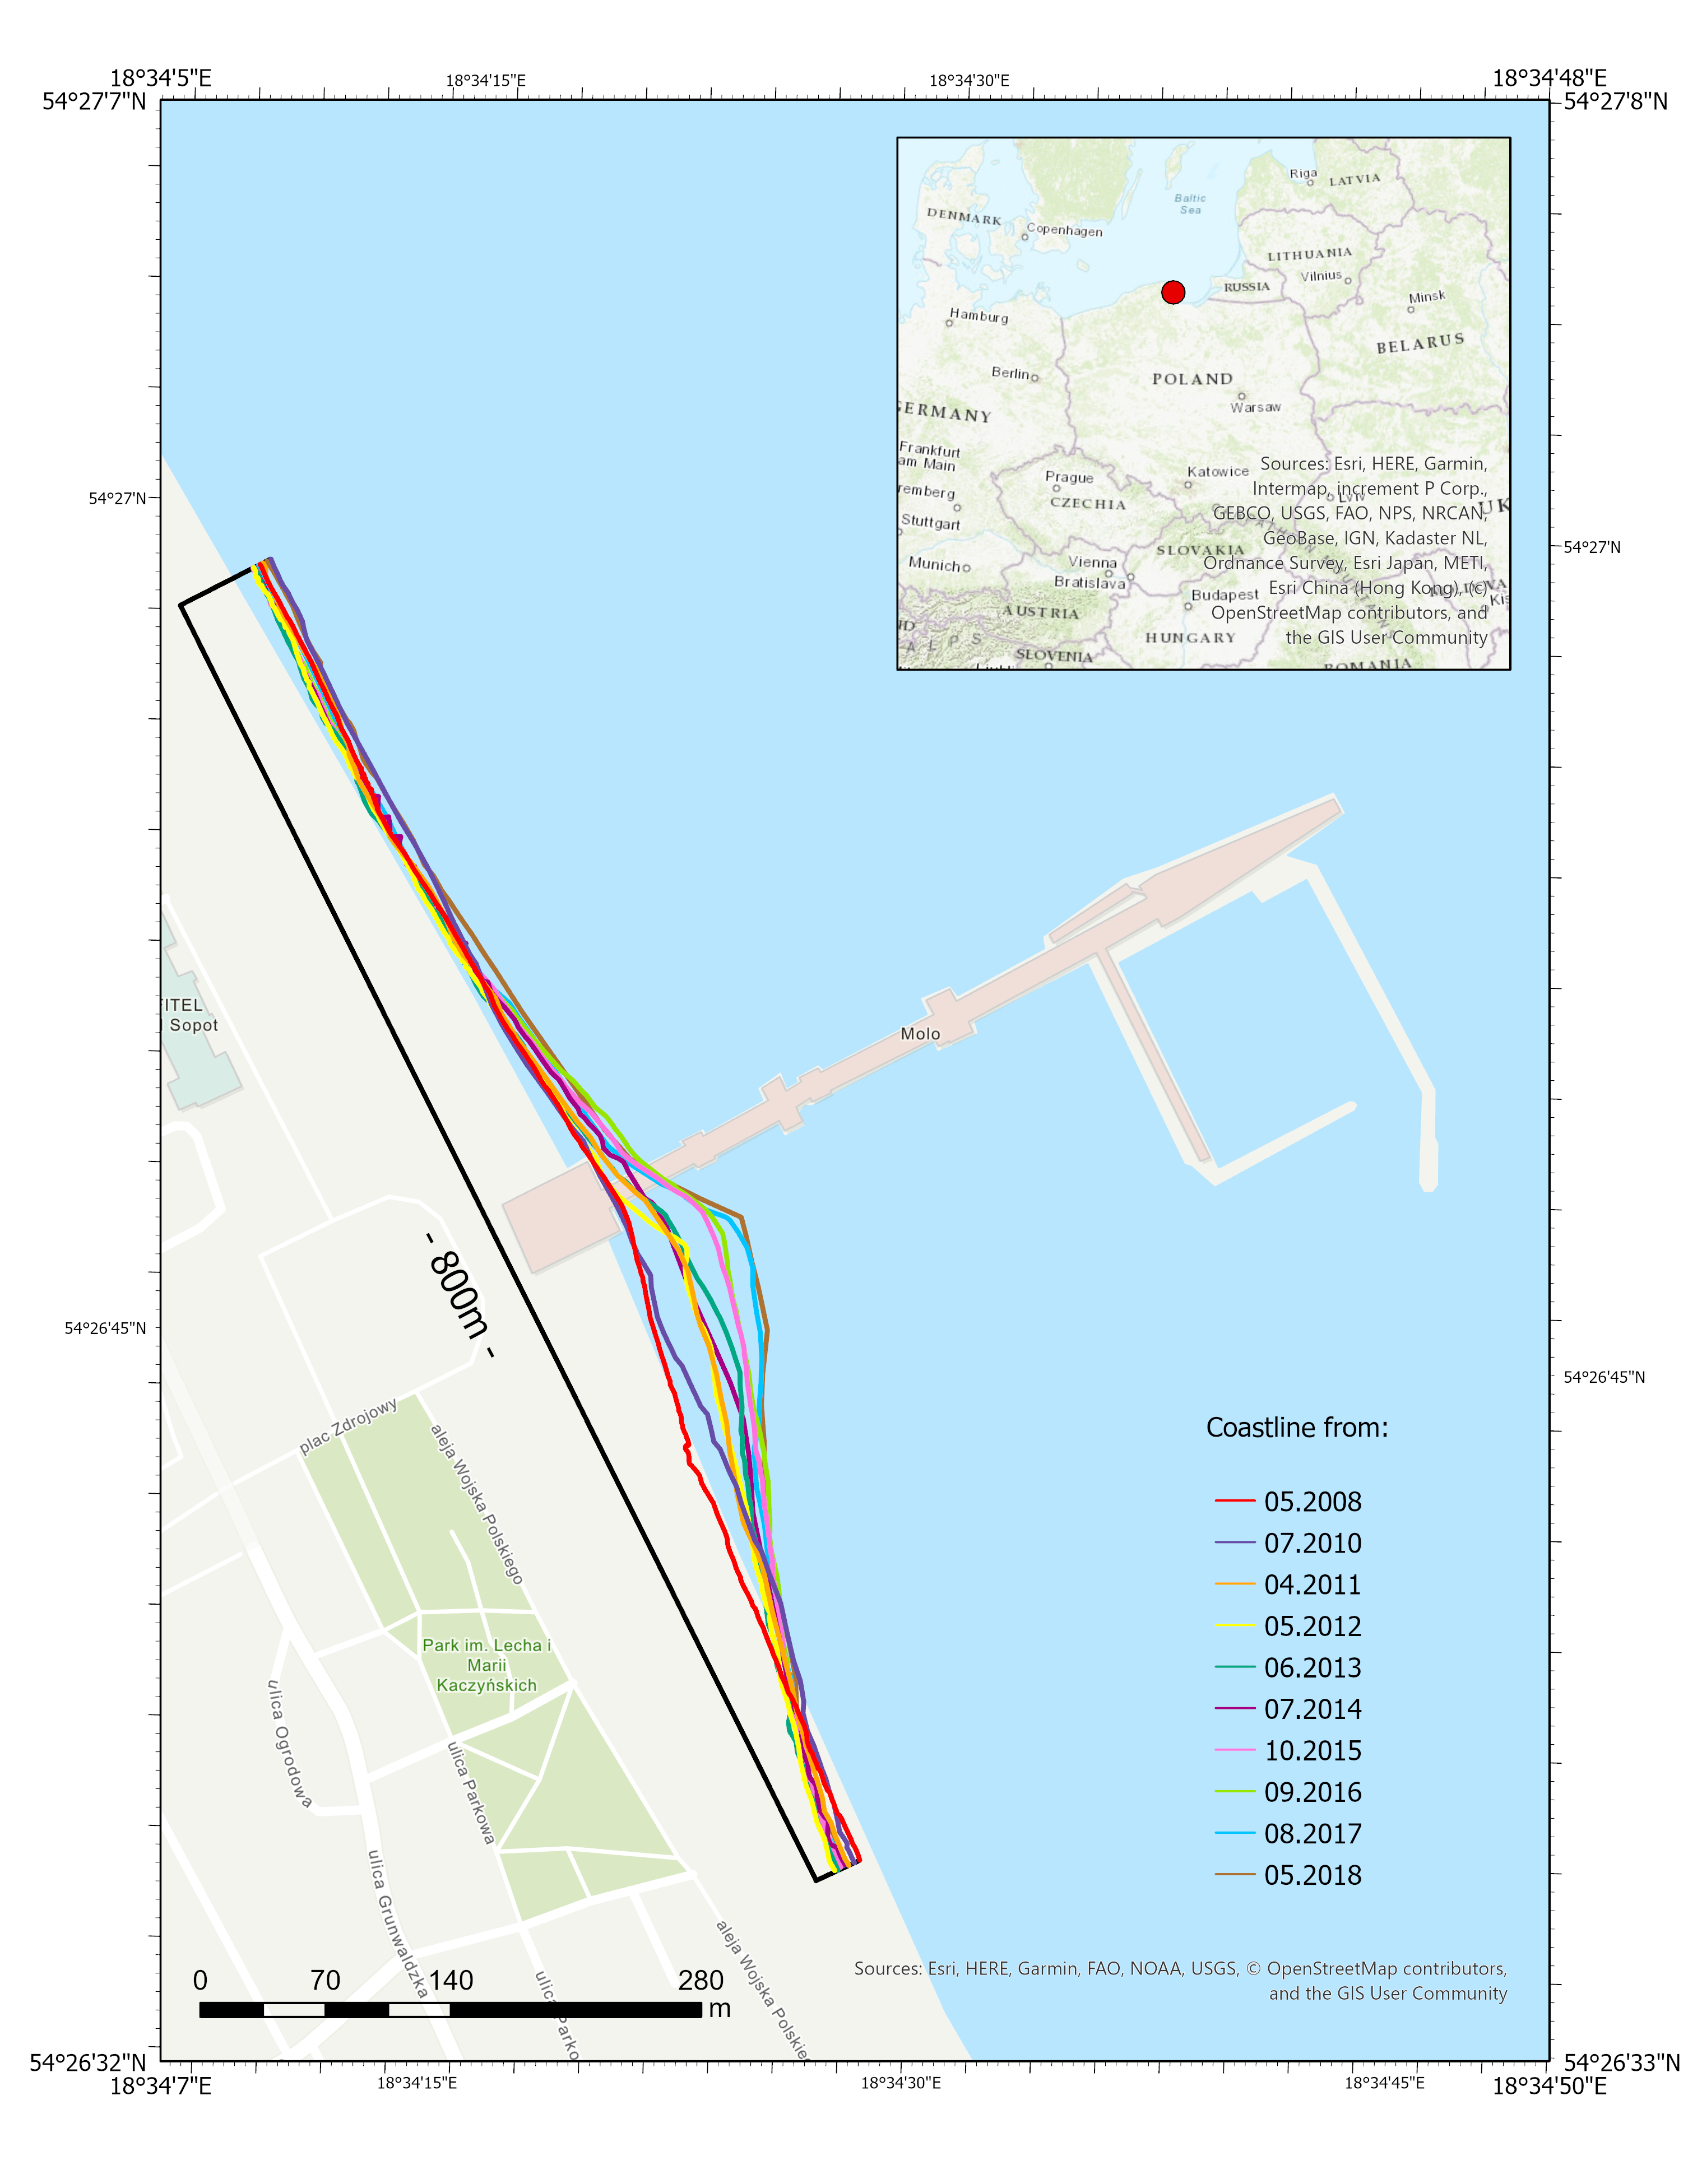
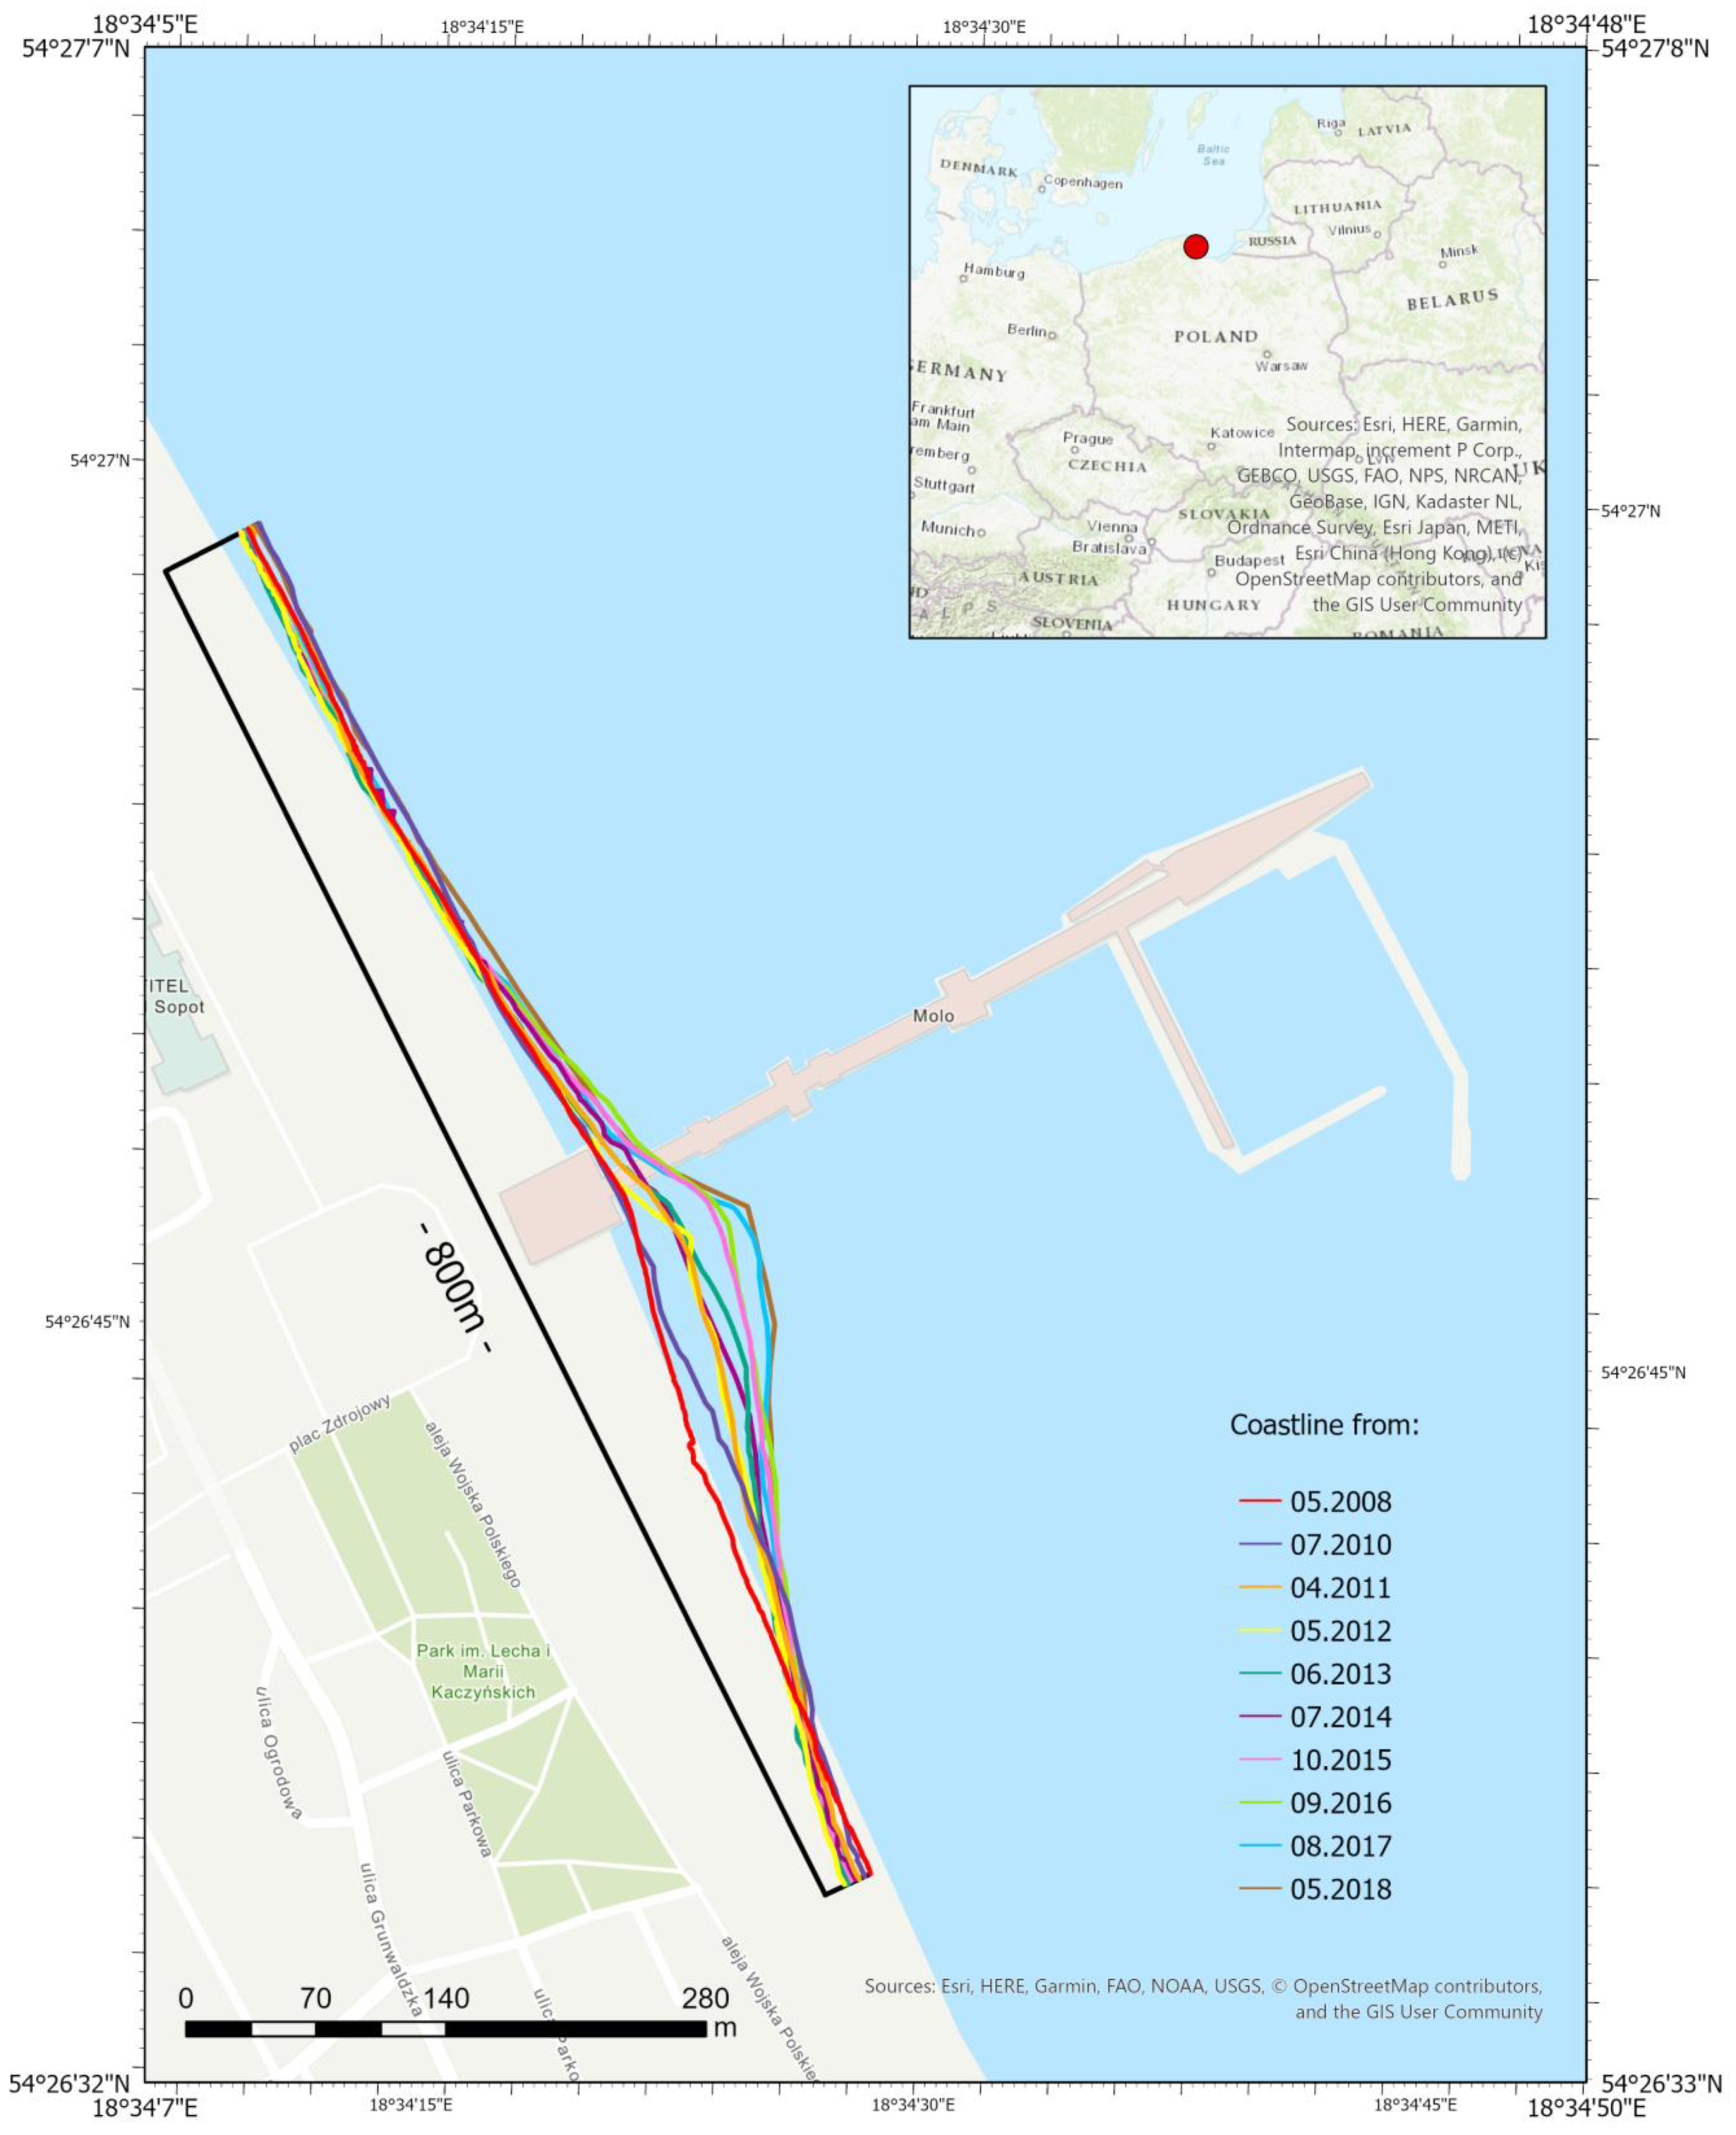
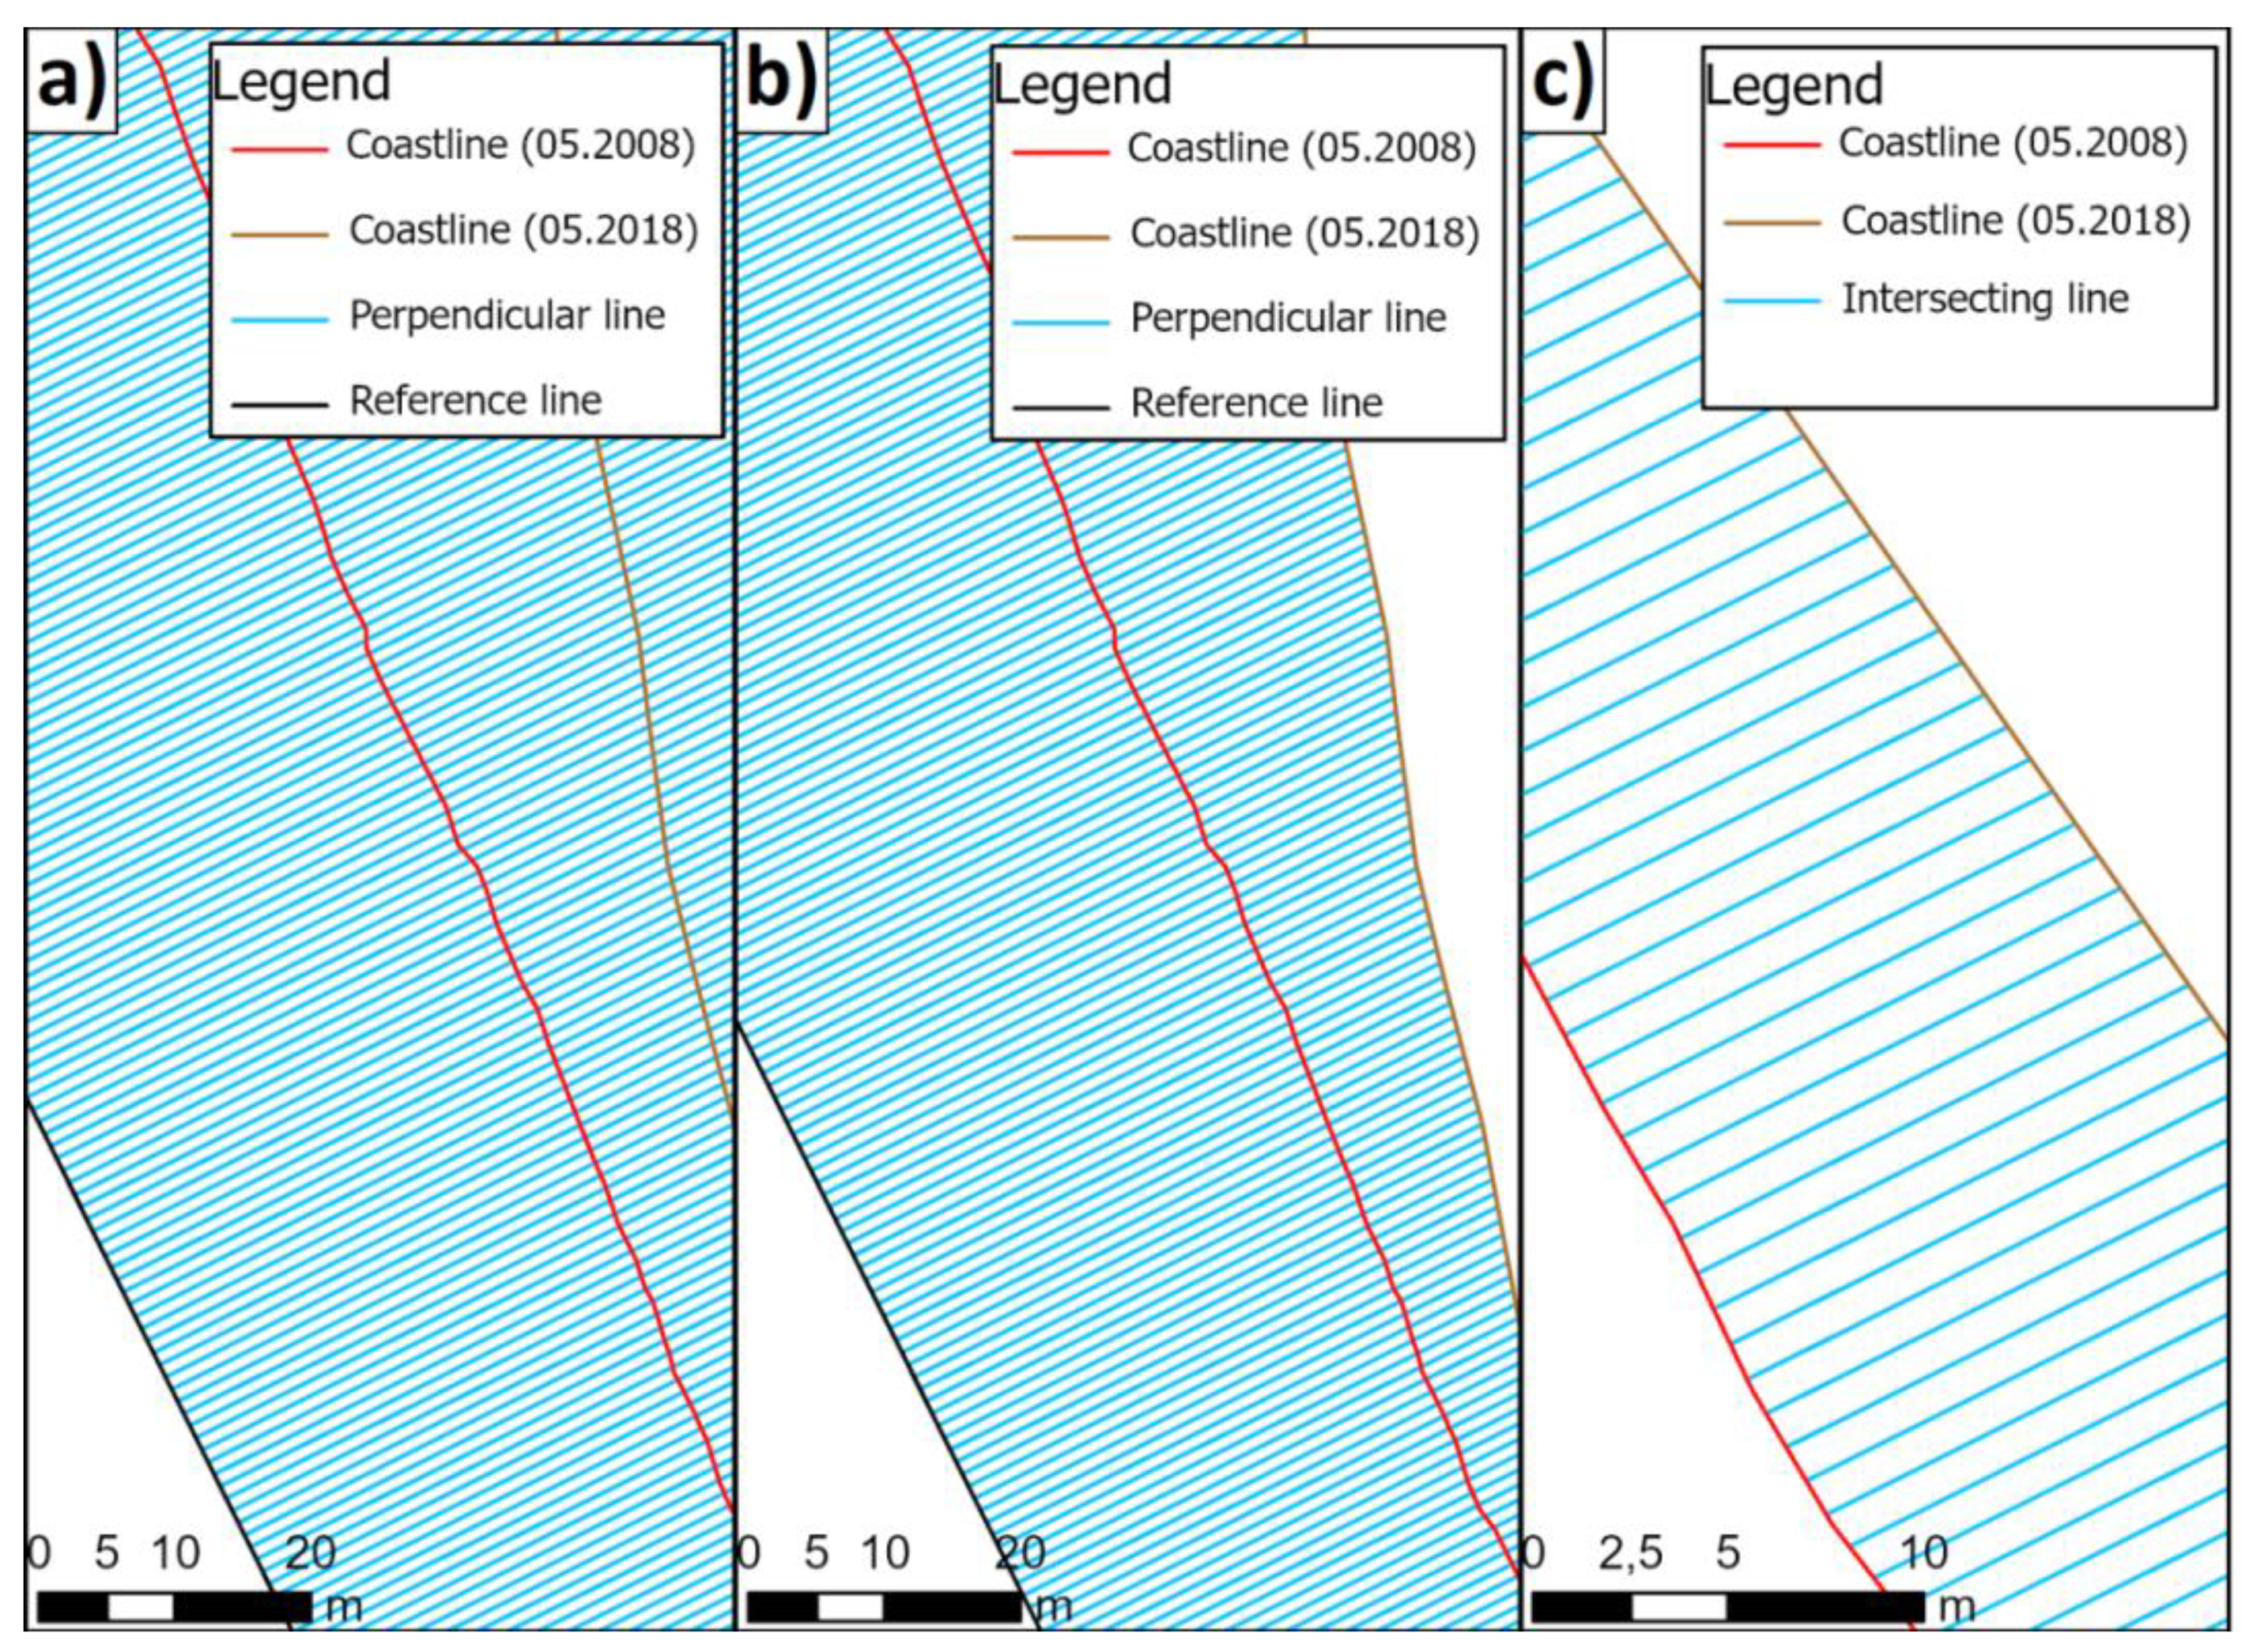
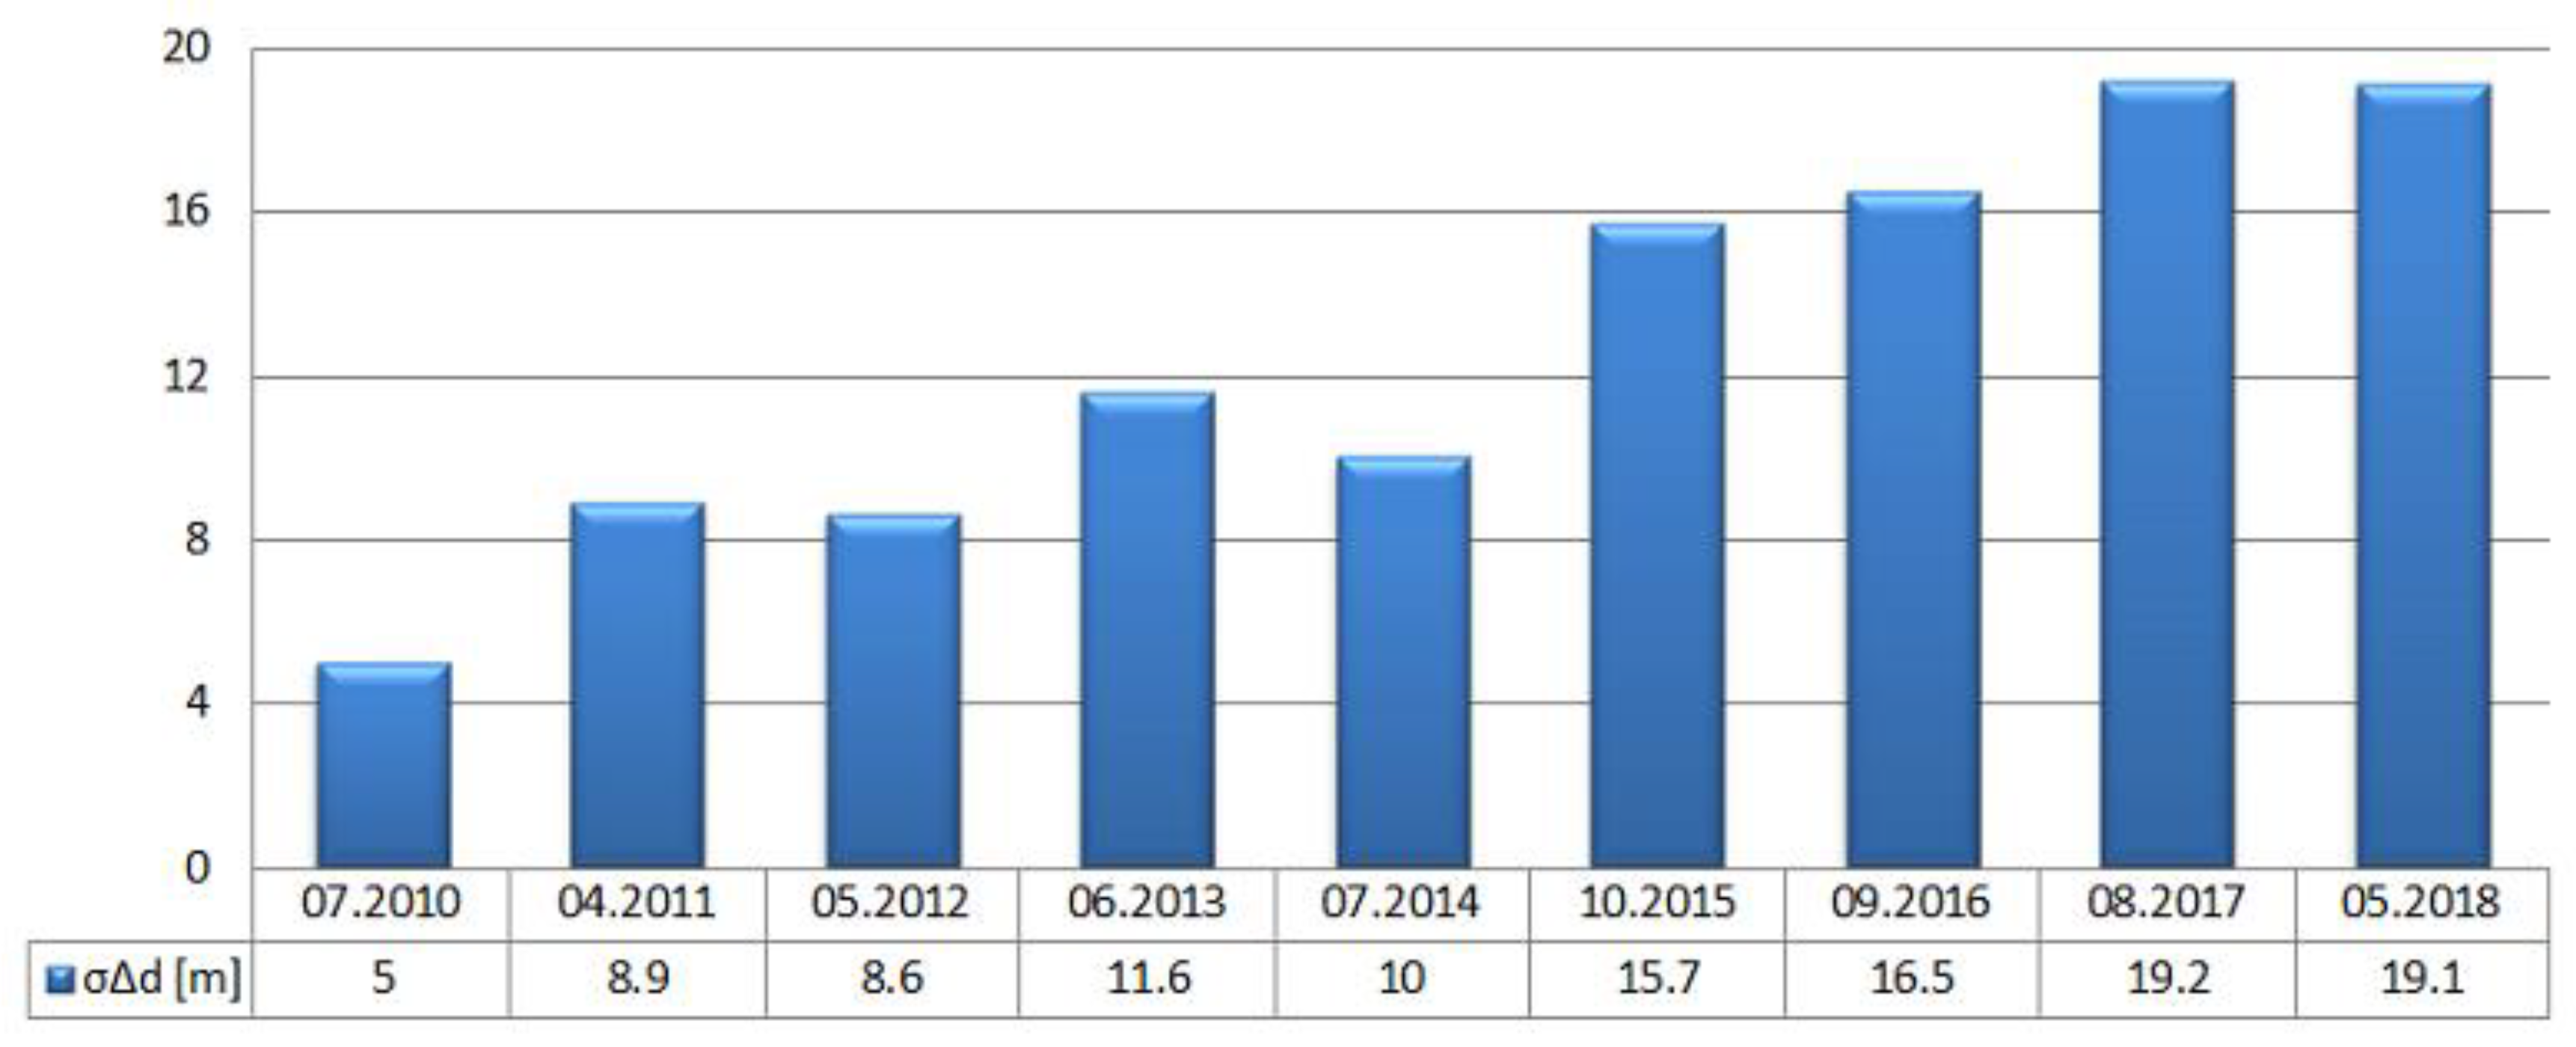
3.2. Analysis of Coastline Variability in Sopot

Next, coastline variability in the years 2008–2018 was assessed. The distance between the land-water boundary from 2008 and remaining shorelines determined for the years 2010–2018 was taken as a measure of the assessment of changes. To determine them, the Digital Shoreline Analysis System (DSAS) extension of the ArcGIS software was used, which allowed the statistics of changes in the land-water boundary to be calculated based on time series [52]. The calculation procedure starts with defining a reference line in the form:
X R L = b · Y R L + a ,
where:
X R L , Y R L —rectangular coordinates PL-UTM of the points that determine the reference line,
b —slope of the reference line,
a —x-intercept of the reference line.
The distance from the reference line to the coastline was then calculated. For this purpose, straight lines were drawn perpendicular to the reference line, which can be described by the formula (Figure 5a):
X P L i = 1 b · Y P L i + a i ,
where:
X P L i , Y P L i —rectangular coordinates PL-UTM of the points that determine the i-th line perpendicular to the reference line,
i —numbering of perpendicular lines, increasing southwards.
The Formula (2) does not provide the numerical value of parameter a i because it depends on the distance between successive perpendicular lines. It was assumed for this study that the distance will be 1 m.
The distances between the reference line and the coastline ( d i ) were calculated from the coordinates of these lines intersecting with the perpendicular line drawn to the reference line (Figure 5b):
d i = ( X R L i X C i ) 2 + ( Y R L i Y C i ) 2 ,
where:
X R L i , Y R L i —rectangular coordinates PL-UTM of the reference line intersection points with the i-th line perpendicular to it,
X C i , Y C i —rectangular coordinates PL-UTM of the coastline intersection points with the i-th line perpendicular to the reference line.
After calculating the distance between the reference line and the coastline from 2008–2018, the spatial and temporal variability of the land–water boundary at the pier in Sopot was determined. For this purpose, distances were calculated between the 2008 shoreline and the land–water boundary determined for 2010–2018 ( Δ d i ) using the following formula (Figure 5c):
Δ d i = d 2010 2018 i d 2008 i ,
where:
d 2010 2018 i —distance between the coastline determined for the years 2010–2018 and the reference line calculated along the i-th line perpendicular to the reference line,
d 2008 i —distance between the coastline determined for 2008 and the reference line calculated along the i-th line perpendicular to the reference line.
It was possible to calculate the standard deviation of the distance between the 2008 shoreline and the land–water boundary determined between 2010–2018 ( σ Δ d ) (Figure 6):
Δ d ¯ = i = 1 n Δ d i n ,
σ Δ d = i = 1 n ( Δ d i Δ d ¯ ) 2 n ,
where:
Δ d ¯ —arithmetic mean of the distances between the 2008 shoreline and the land–water boundary determined for 2010–2018,
n —the number of lines perpendicular to the reference line.
From Figure 6 it follows that the coastline keeps moving away from the land every year, with the exception of the years 2012, 2014 and 2017. Note that the standard deviations of the distance between the 2008 shoreline and the land–water boundary between 2011 and 2012 are very similar. This may be due to the fact that the marina construction, which is the main reason for the formation of tombolo in Sopot, was commissioned in mid-2011. Thus, within a year of this event, there were no significant changes in the coastline shape. The value of the σ Δ d in 2014 is smaller by 1.6 m than for the previous year. It is caused by wave motion [53,54] visible on the satellite image from the Google Earth Pro platform (Figure 4). Strong waves that occur transverse transport to the shore contribute to the sediment movement towards the sea [55]. Another factor that can affect the shoreline shape are undertow currents [51]. Moreover, it should be emphasised that the standard deviations of the distance between the 2008 coastline and the land-water boundary between 2017 and 2018 are almost identical, 19.2 and 19.1 m respectively. This may have been due to silting works carried out in the area to extract about 6 000 m3 of sand from the beach around the pier in 2017 [56].

4. Discussion

The paper discusses the analysis of coastline variability in Sopot (2008–2018) based on Landsat satellite imagery. Apart from determining the spatial and temporal shoreline variability, the beach surface changes in Sopot were also analysed.
The conducted research indicates that the most effective and optimal method of determining the coastline course is currently an analysis of satellite images taken using SAR and multispectral imagery from satellites such as IKONOS, QuickBird, WorldView or Landsat. It allows accurate (less than 1 m), fast and large-scale determination of the land–water boundary. In addition, this method enables the spatial and temporal shoreline variability (from 10 to 30 years) to be determined thanks to extensive databases which contain satellite images, even decades old. However, it should be noted that historical satellite imagery are characterized by low resolution and may miss hydrological data, e.g., sea levels or waving, which are necessary to precisely determine the land–water boundary [57].
The presented results are clearly indicative of a Sopot coastline shift. This was particularly noticeable between 2008 and 2018 when the shoreline moved on average 20 m towards the Baltic Sea. As the coastline moves away from the land, a continuous increase in the beach surface in Sopot was observed. Based on conducted analyses, the sandy area increased by 14,170.6 m2, which is 24.7% more than in 2008. This is very apparent on the right side of the pier, where a strip of land called tombolo [43,44,45,46] has formed between the shoreline and the yacht marina. The tombolo phenomenon forms as a result of the interaction between the hydrotechnical structure and hydrodynamic processes [58]. One of the elements that changes its properties when encountering an obstacle (e.g., breakwater) is waving. The wave coming to the edge bends around the obstacle, causing change in the direction of wave propagation [59]. Refraction is also of key importance for the development of the tombolo phenomenon. It consists in the fact that during the wave refraction most of the energy transported by it dissipates, while the remaining part causes the formation of currents. In the coastal zone, the strongest of them is the longshore current. All the aforementioned factors cause sediment transport. Sediments transported by the longshore current accumulate on the up-current side of the building, while their erosion occurs on the down-current side of the building [55]. This phenomenon causes many negative effects on both the aquatic and human environments, including navigational hazards, the blooming of cyanobacteria and other bacteria, and moving sand away from other places, e.g., from the Orłowo Cliff. Therefore, it is crucial to monitor coastline variability in this waterbody to prevent its shifting.

Author Contributions

Conceptualization, M.S. and C.S.; Data curation, M.S. and O.L.; Formal analysis, A.M. and P.D.; Investigation, A.M. and P.B.; Methodology, P.B. and P.D.; Supervision, C.S.; Validation, C.S.; Visualization, O.L. and P.D.; Writing—original draft, M.S. and O.L.; Writing—review and editing, A.M. and P.B. All authors have read and agreed to the published version of the manuscript.

Funding

This research received no external funding.

Conflicts of Interest

The authors declare no conflict of interest.

References

  1. Li, Z.; Zhai, J.; Wu, F. Shape similarity assessment method for coastline generalization. ISPRS Int. J. Geo-Inf. 2018, 7, 283. [Google Scholar] [CrossRef] [Green Version]
  2. Sui, L.; Wang, J.; Yang, X.; Wang, Z. Spatial-temporal characteristics of coastline changes in Indonesia from 1990 to 2018. Sustainability 2020, 12, 3242. [Google Scholar] [CrossRef] [Green Version]
  3. Li, J.; Ye, M.; Pu, R.; Liu, Y.; Guo, Q.; Feng, B.; Huang, R.; He, G. Spatiotemporal change patterns of coastlines in Zhejiang Province, China, over the last twenty-five years. Sustainability 2018, 10, 477. [Google Scholar] [CrossRef] [Green Version]
  4. Chu, Z.X.; Yang, X.H.; Feng, X.L.; Fan, D.J.; Li, Y.K.; Shen, X.; Miao, A.Y. Temporal and spatial changes in coastline movement of the Yangtze Delta during 1974–2010. J. Asian Earth Sci. 2013, 66, 166–174. [Google Scholar] [CrossRef]
  5. Cowart, L.; Corbett, D.R.; Walsh, J.P. Shoreline change along sheltered coastlines: Insights from the Neuse River Estuary, NC, USA. Remote Sens. 2011, 3, 1516–1534. [Google Scholar] [CrossRef] [Green Version]
  6. Kuleli, T.; Guneroglu, A.; Karsli, F.; Dihkan, M. Automatic detection of shoreline change on coastal Ramsar wetlands of Turkey. Ocean Eng. 2011, 38, 1141–1149. [Google Scholar] [CrossRef]
  7. Martínez, C.; Quezada, M.; Rubio, P. Historical changes in the shoreline and littoral processes on a headland bay beach in central Chile. Geomorphology 2011, 135, 80–96. [Google Scholar] [CrossRef]
  8. Zhang, X.; Pan, D.; Chen, J.; Zhao, J.; Zhu, Q.; Huang, H. Evaluation of coastline changes under human intervention using multi-temporal high-resolution images: A case study of the Zhoushan Islands, China. Remote Sens. 2014, 6, 9930–9950. [Google Scholar] [CrossRef] [Green Version]
  9. Mury, A.; Jeanson, M.; Collin, A.; James, D.; Etienne, S. High resolution shoreline and shelly ridge monitoring over stormy winter events: A case study in the megatidal Bay of Mont-Saint-Michel (France). J. Mar. Sci. Eng. 2019, 7, 97. [Google Scholar] [CrossRef] [Green Version]
  10. Mahamud, U.; Takewaka, S. Shoreline change around a river delta on the Cox’s Bazar coast of Bangladesh. J. Mar. Sci. Eng. 2018, 6, 80. [Google Scholar] [CrossRef] [Green Version]
  11. Nikolakopoulos, K.; Kyriou, A.; Koukouvelas, I.; Zygouri, V.; Apostolopoulos, D. Combination of aerial, satellite, and UAV photogrammetry for mapping the diachronic coastline evolution: The case of Lefkada island. ISPRS Int. J. Geo-Inf. 2019, 8, 489. [Google Scholar] [CrossRef] [Green Version]
  12. Kanwal, S.; Ding, X.; Sajjad, M.; Abbas, S. Three decades of coastal changes in Sindh, Pakistan (1989–2018): A geospatial assessment. Remote Sens. 2020, 12, 8. [Google Scholar] [CrossRef] [Green Version]
  13. Zhang, Y.; Hou, X. Characteristics of coastline changes on Southeast Asia islands from 2000 to 2015. Remote Sens. 2020, 12, 519. [Google Scholar] [CrossRef] [Green Version]
  14. Fu, Y.; Guo, Q.; Wu, X.; Fang, H.; Pan, Y. Analysis and prediction of changes in coastline morphology in the Bohai Sea, China, using remote sensing. Sustainability 2017, 9, 900. [Google Scholar] [CrossRef] [Green Version]
  15. Martínez, C.; Contreras-López, M.; Winckler, P.; Hidalgo, H.; Godoy, E.; Agredano, R. Coastal erosion in central Chile: A new hazard? Ocean Coast. Manag. 2018, 156, 141–155. [Google Scholar] [CrossRef]
  16. Narra, P.; Coelho, C.; Sancho, F. Multicriteria GIS-based estimation of coastal erosion risk: Implementation to Aveiro Sandy Coast, Portugal. Ocean Coast. Manag. 2019, 178, 104845. [Google Scholar] [CrossRef]
  17. Bird, E.C.F. Coastline Changes: A Global Review; Wiley: Chichester, UK, 1985. [Google Scholar]
  18. Luijendijk, A.; Hagenaars, G.; Ranasinghe, R.; Baart, F.; Donchyts, G.; Aarninkhof, S. The state of the world’s beaches. Sci. Rep. 2018, 8, 6641. [Google Scholar] [CrossRef]
  19. National Institute of Coastal and Marine Management of The Netherlands. A Guide to Coastal Erosion Management Practices in Europe: Lessons Learned. Available online: http://www.eurosion.org/shoreline/lessons_learned.pdf (accessed on 5 June 2020).
  20. Bitan, M.; Zviely, D. Sand beach nourishment: Experience from the Mediterranean coast of Israel. J. Mar. Sci. Eng. 2020, 8, 273. [Google Scholar] [CrossRef] [Green Version]
  21. Angoni, H.; Tatchim, A.P.; Nkonmeneck, B.A.; Nguekam, E. Use of the wood in coastal fisheries zones of Cameroun. Rev. D’ethnoécol. 2015, 7, 1–14. [Google Scholar]
  22. Fossi Fotsi, Y.; Pouvreau, N.; Brenon, I.; Onguene, R.; Etame, J. Temporal (1948–2012) and dynamic evolution of the Wouri estuary coastline within the Gulf of Guinea. J. Mar. Sci. Eng. 2019, 7, 343. [Google Scholar] [CrossRef] [Green Version]
  23. Viaña-Borja, S.P.; Ortega-Sánchez, M. Automatic methodology to detect the coastline from Landsat images with a new water index assessed on three different Spanish Mediterranean deltas. Remote Sens. 2019, 11, 2186. [Google Scholar] [CrossRef] [Green Version]
  24. Dellepiane, S.; De Laurentiis, R.; Giordano, F. Coastline extraction from SAR images and a method for the evaluation of the coastline precision. Pattern Recognit. Lett. 2004, 25, 1461–1470. [Google Scholar] [CrossRef]
  25. Al-Mansoori, S.; Al-Marzouqi, F. Coastline extraction using satellite imagery and image processing techniques. Int. J. Curr. Eng. Technol. 2016, 6, 1245–1251. [Google Scholar]
  26. Wang, X.; Liu, Y.; Ling, F.; Liu, Y.; Fang, F. Spatio-temporal change detection of Ningbo coastline using Landsat time-series images during 1976–2015. ISPRS Int. J. Geo-Inf. 2017, 6, 68. [Google Scholar] [CrossRef] [Green Version]
  27. Maglione, P.; Parente, C.; Vallario, A. Coastline extraction using high resolution WorldView-2 satellite imagery. Eur. J. Remote Sens. 2014, 47, 685–699. [Google Scholar] [CrossRef]
  28. Xu, N. Detecting coastline change with all available Landsat data over 1986–2015: A case study for the State of Texas, USA. Atmosphere 2018, 9, 107. [Google Scholar] [CrossRef] [Green Version]
  29. Specht, C.; Weintrit, A.; Specht, M.; Dąbrowski, P. Determination of the territorial sea baseline—Measurement aspect. IOP Conf. Ser. Earth Environ. Sci. 2017, 95, 1–10. [Google Scholar] [CrossRef] [Green Version]
  30. Specht, M.; Specht, C.; Wąż, M.; Dąbrowski, P.; Skóra, M.; Marchel, Ł. Determining the variability of the territorial sea baseline on the example of waterbody adjacent to the municipal beach in Gdynia. Appl. Sci. 2019, 9, 3867. [Google Scholar] [CrossRef] [Green Version]
  31. Basterretxea, G.; Orfila, A.; Jordi, A.; Fornós, J.; Tintoré, J. Evaluation of a small volume renourishment strategy on a narrow Mediterranean beach. Geomorphology 2007, 88, 139–151. [Google Scholar] [CrossRef] [Green Version]
  32. Del Río, L.; Gracia, F.J.; Benavente, J. Shoreline change patterns in sandy coasts. A case study in SW Spain. Geomorphology 2013, 196, 252–266. [Google Scholar] [CrossRef] [Green Version]
  33. An, M.; Sun, Q.; Hu, J.; Tang, Y.; Zhu, Z. Coastline detection with Gaofen-3 SAR images using an improved FCM method. Sensors 2018, 18, 1898. [Google Scholar] [CrossRef] [Green Version]
  34. Prishchepov, A.V.; Radeloff, V.C.; Dubinin, M.; Alcantara, C. The effect of Landsat ETM/ETM + image acquisition dates on the detection of agricultural land abandonment in Eastern Europe. Remote Sens. Environ. 2012, 126, 195–209. [Google Scholar] [CrossRef]
  35. DeVries, B.; Verbesselt, J.; Kooistra, L.; Herold, M. Robust monitoring of small-scale forest disturbances in a tropical montane forest using Landsat time series. Remote Sens. Environ. 2015, 161, 107–121. [Google Scholar] [CrossRef]
  36. Yusuf, Y.; Matsuoka, M.; Yamazaki, F. Damage assessment after 2001 Gujarat earthquake using Landsat-7 satellite images. J. Indian Soc. Remote Sens. 2001, 29, 17–22. [Google Scholar] [CrossRef]
  37. Santillan, J.; Makinano, M.; Paringit, E. Integrated Landsat image analysis and hydrologic modeling to detect impacts of 25-year land-cover change on surface runoff in a Philippine watershed. Remote Sens. 2011, 3, 1067–1087. [Google Scholar] [CrossRef] [Green Version]
  38. Yuan, F.; Sawaya, K.E.; Loeffelholz, B.C.; Bauer, M.E. Land cover classification and change analysis of the Twin Cities (Minnesota) Metropolitan Area by multitemporal Landsat remote sensing. Remote Sens. Environ. 2005, 98, 317–328. [Google Scholar] [CrossRef]
  39. Rasuly, A.; Naghdifar, R.; Rasoli, M. Monitoring of Caspian Sea coastline changes using object-oriented techniques. Procedia Environ. Sci. 2010, 2, 416–426. [Google Scholar] [CrossRef] [Green Version]
  40. Rokni, K.; Ahmad, A.; Selamat, A.; Hazini, S. Water feature extraction and change detection using multitemporal landsat imagery. Remote Sens. 2014, 6, 4173–4189. [Google Scholar] [CrossRef] [Green Version]
  41. Zhang, T.; Yang, X.; Hu, S.; Su, F. Extraction of coastline in aquaculture coast from multispectral remote sensing images: Object-based region growing integrating edge detection. Remote Sens. 2013, 5, 4470–4487. [Google Scholar] [CrossRef] [Green Version]
  42. Almonacid-Caballer, J.; Sánchez-García, E.; Pardo-Pascual, J.E.; Balaguer-Beser, A.; Palomar-Vázquez, J. Evaluation of annual mean shoreline position deduced from Landsat imagery as a mid-term coastal evolution indicator. Mar. Geol. 2016, 372, 79–88. [Google Scholar] [CrossRef]
  43. Masnicki, R.; Specht, C.; Mindykowski, J.; Dąbrowski, P.; Specht, M. Accuracy analysis of measuring X-Y-Z coordinates with regard to the investigation of the tombolo effect. Sensors 2020, 20, 1167. [Google Scholar] [CrossRef] [Green Version]
  44. Specht, C.; Lewicka, O.; Specht, M.; Dąbrowski, P.; Burdziakowski, P. Methodology for carrying out measurements of the tombolo geomorphic landform using unmanned aerial and surface vehicles near Sopot pier, Poland. J. Mar. Sci. Eng. 2020, 8, 384. [Google Scholar] [CrossRef]
  45. Specht, C.; Mindykowski, J.; Dąbrowski, P.; Maśnicki, R.; Marchel, Ł.; Specht, M. Metrological aspects of the tombolo effect investigation—Polish case study. In Proceedings of the 2019 IMEKO TC-19 International Workshop on Metrology for the Sea (IMEKO 2019), Genova, Italy, 3–5 October 2019. [Google Scholar]
  46. Specht, M.; Specht, C.; Mindykowski, J.; Dąbrowski, P.; Maśnicki, R.; Makar, A. Geospatial modeling of the tombolo phenomenon in Sopot using integrated geodetic and hydrographic measurement methods. Remote Sens. 2020, 12, 737. [Google Scholar] [CrossRef] [Green Version]
  47. Urbański, J. GIS in Nature Study; University of Gdańsk Publishing House: Gdańsk, Poland, 2008. (In Polish) [Google Scholar]
  48. Council of Ministers of the Republic of Poland. Ordinance of the Council of Ministers of 15 October 2012 on the National Spatial Reference System; Council of Ministers of the Republic of Poland: Warsaw, Poland, 2012. (In Polish)
  49. Rokiciński, K. Geographical and hydrometeorogical characteristics of Baltic Sea as are for asymetric warfare. Sci. J. Polish Naval Acad. 2007, 1, 65–82. (In Polish) [Google Scholar]
  50. IMGW-PIB. Hydrological Data. Available online: https://dane.imgw.pl/datastore (accessed on 5 June 2020). (In Polish).
  51. Leatherman, S.P. Undertow, Rip Current, and Riptide. J. Coast. Res. 2012, 28, 3–5. [Google Scholar]
  52. Mujabar, S.; Chandrasekar, N. A shoreline change analysis along the coast between Kanyakumari and Tuticorin, India, using digital shoreline analysis system. Geo-Spat. Inf. Sci. 2011, 14, 282–293. [Google Scholar]
  53. Källstrand, B.; Bergström, H.; Højstrup, J.; Smedman, A.S. Mesoscale Wind Field Modifications over the Baltic Sea. Bound. Layer Meteorol. 2000, 95, 161–188. [Google Scholar] [CrossRef]
  54. Stigebrandt, A. Physical Oceanography of the Baltic Sea. In A Systems Analysis of the Baltic Sea, 1st ed.; Wulff, F.V., Rahm, L., Larsson, P., Eds.; Springer: Berlin/Heidelberg, Germany, 2001; pp. 19–74. [Google Scholar]
  55. Ostrowski, R.; Stella, M.; Szmytkiewicz, P.; Kapiński, J.; Marcinkowski, T. Coastal Hydrodynamics beyond the Surf Zone of the South Baltic Sea. Oceanologia 2018, 60, 264–276. [Google Scholar] [CrossRef]
  56. Sopot NaszeMiasto.pl. In Sopot, They Continue to Strengthen and Expand the Beach. Available online: https://sopot.naszemiasto.pl/w-sopocie-kontynuuja-umacnianie-i-poszerzanie-plazy-wideo/ar/c2-4318220 (accessed on 5 June 2020). (In Polish).
  57. Specht, M.; Specht, C.; Wąż, M.; Naus, K.; Grządziel, A.; Iwen, D. Methodology for performing territorial sea baseline measurements in selected waterbodies of Poland. Appl. Sci. 2019, 9, 3053. [Google Scholar] [CrossRef] [Green Version]
  58. Gross, M.G.; Gross, E. Oceanography: A View of the Earth, 7th ed.; Prentice Hall: Upper Saddle River, NJ, USA, 1995. [Google Scholar]
  59. World Meteorological Organization. Guide to Wave Analysis and Forecasting, 2nd ed.; WMO: Geneva, Switzerland, 1998. [Google Scholar]
Figure 1. Control points on the pier in Sopot.
Jmse 08 00464 g001
Figure 2. The coastline course in the waterbody adjacent to the pier in Sopot in 2008–2018.
Jmse 08 00464 g002
Figure 3. Beach surface changes in Sopot between 2010–2018 compared to 2008.
Jmse 08 00464 g003
Figure 4. Satellite image showing the Sopot coastline in July 2014.
Jmse 08 00464 g004
Figure 5. Analysis of coastline variability in Sopot using the Digital Shoreline Analysis System (DSAS) model: drawing perpendicular lines to the reference line (a), intersecting perpendicular lines between the 2018 coastline and the reference line (b) and calculating distances between the 2008 shoreline and the land–water boundary determined for 2018 (c).
Jmse 08 00464 g005
Figure 6. Coastline variability in Sopot in 2008–2018.
Jmse 08 00464 g006
Table 1. Sea levels from the Institute of Meteorology and Water Management-National Research Institute (IMGW-PIB) gauging station in Gdynia in 2008–2018 [50].
Month and YearNumber of MeasurementsMinimum Value [cm]Maximum Value [cm]Mean Value [cm]Median Value [cm]
05.20088618492.7551.3516.9514.3
07.20104464496.4538.7513.0512.5
04.20118618492.7551.3516.9514.3
05.20124459476.9520.3501.5501.7
06.20134301477.8527.2503.2503.1
07.20144432479.9520.4500.1498.5
10.20154445459.0518.0488.2487.0
09.20164320474.0533.0506.0507.0
08.20174464490.0536.0512.9513.0
05.20184464472.0514.0491.6492.0

