Carbon Balance in Salt Marsh and Mangrove Ecosystems: A Global Synthesis


Tropical Coastal & Mangrove Consultants, 52 Shearwater Drive, Pakenham, VIC 3810, Australia
J. Mar. Sci. Eng. 2020, 8(10), 767; https://0-doi-org.brum.beds.ac.uk/10.3390/jmse8100767
Submission received: 5 September 2020
/
Revised: 25 September 2020
/
Accepted: 27 September 2020
/
Published: 30 September 2020
(This article belongs to the Special Issue Feature Reviews in Marine Science and Engineering)
Abstract
:Mangroves and salt marshes are among the most productive ecosystems in the global coastal ocean. Mangroves store more carbon (739 Mg CORG ha−1) than salt marshes (334 Mg CORG ha−1), but the latter sequester proportionally more (24%) net primary production (NPP) than mangroves (12%). Mangroves exhibit greater rates of gross primary production (GPP), aboveground net primary production (AGNPP) and plant respiration (RC), with higher PGPP/RC ratios, but salt marshes exhibit greater rates of below-ground NPP (BGNPP). Mangroves have greater rates of subsurface DIC production and, unlike salt marshes, exhibit active microbial decomposition to a soil depth of 1 m. Salt marshes release more CH4 from soil and creek waters and export more dissolved CH4, but mangroves release more CO2 from tidal waters and export greater amounts of particulate organic carbon (POC), dissolved organic carbon (DOC) and dissolved inorganic carbon (DIC), to adjacent waters. Both ecosystems contribute only a small proportion of GPP, RE (ecosystem respiration) and NEP (net ecosystem production) to the global coastal ocean due to their small global area, but contribute 72% of air–sea CO2 exchange of the world’s wetlands and estuaries and contribute 34% of DIC export and 17% of DOC + POC export to the world’s coastal ocean. Thus, both wetland ecosystems contribute disproportionately to carbon flow of the global coastal ocean.
Keywords:
biogeochemistry; carbon; carbon balance; ecosystem; ecosystem processes; mangrove; salt marsh; wetland1. Introduction
Salt marshes and mangrove forests are intertidal ecosystems comparable sensu lato in that they both occupy the coastal land–sea interface; the former mostly in sheltered temperate and high- latitude coastlines, the latter along quiescent subtropical and tropical shores [1]. Both ecosystems are characterized by a rich mixture of terrestrial and marine organisms, forming unique estuarine food webs, and play an important role in linking food webs, inorganic and organic materials, and biogeochemical cycles between the coast and adjacent coastal zone. Structurally simple compared to other ecosystems, salt marshes and mangroves harbor few plant species, but they are functionally complex, having ecosystem attributes analogous to those of other grasslands and forests, respectively, but also functioning in many ways like other estuarine and coastal ecosystems [1,2,3].
Drivers such as salinity, geomorphology, and tidal regime impose structural and functional constraints and foster adaptations and physiological mechanisms to help these wetland plants subsist in waterlogged saline soils. Tides and waves (to a much lesser extent) are an auxiliary energy subsidy that allows both ecosystems to store and transport newly fixed carbon, sediments, food and nutrients, and to do the work of exporting wastes, heat, gases and solutes to the atmosphere and adjacent coastal zone. This subsidized energy is used indirectly by organisms to shunt more of their own energy into growth and reproduction, making tidal power one of the main drivers regulating these intertidal systems [1]. Tidal circulation is complex, as marsh and forest topography and morphology and the tidal prism regulate the degree of mixing and trapping of water and suspended matter within adjacent tidal waters and the wetland communities [1].
Food webs within these wetlands are composed of mixtures of terrestrial, estuarine and marine fauna and flora that help to actively cycle nutrients and carbon. Plankton communities in adjacent creeks and waterways are productive and abundant, and well-adapted to complex hydrology and water chemistry. These opaque tidal waters host organisms ranging in size from viruses to reptiles, such as alligators and crocodiles.
Salt marshes and mangrove forests are carbon-rich ecosystems that are perceived to play a role in climate regulation, biogeochemical cycling, and in capturing and preserving large amounts of carbon that counterbalance anthropogenic CO2 emissions [4,5,6]. It is unclear to what extent both ecosystems constitute a significant carbon sink in the global coastal ocean, and whether restoring and replanting new marshes and mangroves will assist in ameliorating climate change. Thus, an improved understanding of carbon allocation and balance within these ecosystems is urgently needed. In this synthesis, similarities and differences in carbon cycling in both ecosystems are identified to better understand how they function, especially with regard to their role in carbon cycling in the global coastal ocean.
2. Allocation of Carbon Stocks
Salt marshes and mangrove forests both store large quantities of organic carbon (CORG) in soils and, to a lesser extent, in plant biomass (Figure 1). On average, soil CORG to a depth of 1 m comprises 77% and 95% of the total CORG stocks in mangrove forests and salt marshes, respectively.
Carbon stocks in mangroves and salt marshes; above-ground biomass CORG accounts for 15% and 1% of total CORG in mangroves and salt marshes, respectively. Mangrove below-ground biomass CORG accounts for twice (8%) the total carbon stocks of salt marshes (4%). Total CORG stock in mangrove forests is twice as great as in salt marshes on a per hectare basis (Table 1). Globally, mangrove CORG stocks (6.17 Pg) are, on average, three times greater than salt marshes (1.84 Pg) due to greater stocks on both a per area basis and the fact that there are 1.5 times more mangrove forests than salt marshes worldwide (Table 1). Of course, carbon stocks vary greatly within both ecosystems as a function of ecosystem age, intertidal position, and species composition, as well as in terms of geographic, climatic and environmental factors.
Median CORG content in salt marsh (5.8%) soils is greater than in mangrove soils (2.6%), but there is a wide spread of values in both wetland types, varying from 0.1% to 30% [50,51]. The wide range of soil CORG content undoubtedly reflects different geomorphological, climatic and environmental factors, as well as ecosystem age, species composition and hydrology. Similarly, C/N ratios are highly variable for the same reasons, varying within both marshes and mangroves, by 5/1 to 60/1 [50,51], respectively.
3. Primary Production and Plant Respiration
Rates of gross and net primary production in salt marshes and mangrove forests are among the highest for aquatic ecosystems and are within the range of rates for terrestrial grasslands and humid forests [52]. Median rates of gross primary production (GPP), aboveground net primary production (AGNPP) and canopy (plant) respiration (RC) are greater for mangroves than salt marshes (Figure 2), although there is significant variation in rates reflecting species-specific differences in production among salt marsh and mangrove plants; nutrient status; wetland age; and other factors such as soil salinity, location, hydrology, intertidal position and temperature.
Rates of belowground root production (Table 2) are significantly greater in salt marshes (one-way ANOVA on ranks; p < 0.05), although mangrove root production has most likely been greatly underestimated due to problems with methodology and the lack of empirical measurements [53]. Rates of benthic microalgal productivity in both salt marshes and mangroves (Table 2) are not significantly different (one-way ANOVA on ranks; p > 0.05). PGPP/RC ratios are significantly greater in mangrove forests than in salt marshes (one-way ANOVA on ranks; p < 0.001) and are equivalent to those estimated for tropical terrestrial forests [52].
4. Soil Carbon Biogeochemistry
4.1. Soil-Air/Water Fluxes
Salt marsh and mangrove soils are waterlogged and saline and inundated for a part of every day. Usually but not always composed of silt and clay particles, soil of both ecosystems is penetrated by roots, rhizomes, and pieces of dead plant material. Having similar C and nutrient contents (Section 2), it is not surprising that they have rates of soil respiration that are not significantly different (one-way ANOVA on ranks; p > 0.05), except for significantly lower rates of oxygen uptake in mangrove soils (Table 3); these oxygen fluxes are significantly lower than those of dissolved inorganic carbon (DIC) and CO2 [94].
In contrast, rates of CH4 release are, on average, nine times greater from salt marsh soils than from mangrove deposits (Table 3). Methanogenesis is not a large decomposition pathway in mangrove soils [50], probably due to the vertically depth-elongated zones of sulfate, iron and manganese reduction, in which rates vary irregularly and even peak at various depths to 1 m [94]. In salt marsh soils, rates of sulfate, iron, and manganese reduction decline over the upper 10–20 cm and presumably methanogenesis then becomes the dominant diagenetic pathway in deeper soils [86]. Methanogenesis in mangrove soils is ordinarily low, but high rates of methanogenic activity have been measured in organically polluted mangroves, and otherwise competitive sulfate-reducing and methanogenic bacteria can coexist if there is sufficient labile organic matter [50]. In salt marsh soils, measured CH4 production rates vary considerably depending on the dominance of sulfate and iron-reduction but are often measurable in deep (30–100 cm) soils [86].
4.2. Soil DIC Production
In mangrove soils, respired carbon as DIC (and dissolved organic carbon (DOC) and CH4) is produced to a depth of at least 1 m [94] and perhaps to greater depths considering that there is no indication of a clear decline in production rates measured over surface−100 cm profiles [94]. These continuously high rates are likely sustained by decomposition of deep roots, release of root exudates, activities of deep-dwelling crabs and recycling of an extraordinarily large pool of dead roots and subsurface bacterial biomass [1,52]. Due to a number of geophysical and geochemical factors [94], early diagenesis of soil organic matter in mangroves is unlikely to be in steady-state, as it is in most subtidal coastal and marine sediments [1]. This phenomenon results in a discrepancy between decomposition processes in surface and subsurface soils, in which rates of respiration across the soil–water/air interface are not directly linked to respiratory processes in deeper soil layers. As a result, rates of surface soil respiration equate to only about one-third of subsurface respiration, as measured by DIC release from incubated soils (Table 3). In salt marshes, in contrast, early diagenesis of organic matter is probably in steady-state as surface respiration rates are equivalent to subsurface DIC production rates (Table 3). Oxygen, carbon dioxide and DIC fluxes across the soil surface/air–water interface have long been presumed to represent total carbon decomposition, assuming steady-state diffusion of gases and solutes from within the entire soil profile [1]. As discussed in Section 6, it may be that subsurface and surface respiration in soil marsh soils are similarly spatially separated, helping to account for export of DIC, DOC and CH4.
4.3. CORG Burial in Soils
Rates of CORG burial in salt marsh soils are greater than rates in mangrove soils (Table 3), although the differences are not significant (one-way ANOVA on ranks, p > 0.05). There are wide variations in burial rates among locations, depending on a variety of factors, such as geomorphology, intertidal position, climate, extent of terrestrial and marine input, habitat age, species composition and soil texture [4,6]. Along with seagrasses, salt marshes and mangrove forests sequester more organic carbon on a per area basis than all other terrestrial and marine ecosystems (see Table 3 in reference [6]).
5. Carbon Biogeochemistry in Tidal Waters
5.1. CO2 and CH4 Emissions
Rates of CO2 emissions from mangrove and salt marsh tidal waters (Table 4) are equivalent (one-way ANOVA on ranks; p < 0.05), but rates of CH4 emissions (Table 4) are significantly greater from salt marsh waters (one-way ANOVA on ranks; p < 0.05), probably reflecting the higher rates of methanogenesis in marsh soils (Table 3).
5.2. Carbon Export
Rates of particulate organic carbon (POC) export to adjacent tidal waters are three times greater (one-way ANOVA on ranks, p < 0.05) in mangroves than in salt marshes (Table 5). Similarly, DOC export is more than twice the rate in mangroves than in salt marshes (Table 5); DIC export is nearly three times greater in mangroves than in salt marshes (Table 5). However, export of dissolved CH4 is four times greater in salt marshes than in mangroves; methanogenesis is likely to be greater in deeper salt marsh soils than in mangroves, as reflected in the higher rates of CH4 release from soils and tidal waters (Table 3 and Table 4). The greater rates of organic carbon export from mangroves probably reflect the higher rates of primary production, litter production and soil mineralization in deep soils. Monsoonal rainfall in the tropics may facilitate greater export during the wet season.
6. Whole-Ecosystem Carbon Mass Balance
Sufficient data exist to construct carbon mass balance models of mangrove (Figure 3) and salt marsh (Figure 4) ecosystems. The salt marsh model is derived from the data in this review, while the mangrove mass balance is derived from [94], revised and updated from an earlier iteration [188]. This revised mangrove model shows that about 63% of GPP is respired by the forest canopy. The salt marsh budget indicates that about 47% of GPP is respired by salt marsh plants. Mangrove NPP is vested nearly equally in litter, wood and belowground roots, with about 40% of litter exported to adjacent tidal waters; salt marsh NPP is vested mostly in belowground roots (72%). Unlike in the mangrove mass balance, salt marsh below- and aboveground NPP are inexplicably greater than GPP, implying that either below- and/or aboveground production are overestimates or that GPP is underestimated by about 30%. The standard deviation of the salt marsh GPP data is 73% of the mean with a range of 45 Mg C ha−1 a−1 (GPP mean = 17.7 Mg C ha−1 a−1), suggesting that these data have a wide margin of error. Pre-eddy covariance data [143] estimate GPP, plant R and NPP for salt marshes of 112, 10.7 and 11.5 Tg C a−1, respectively, which nearly balance assuming that the estimate for root production (69 Tg C a−1) is correct. However, plant R would be too low, equating to only 9.5% of GPP, resulting in an extraordinarily high PGPP/RC ratio of 10.5; both values are highly unlikely compared to those estimated for other vegetated ecosystems [1]. In both ecosystems, most roots produced (90% for mangroves, 78% for salt marshes) are shunted into the soil CORG pool for eventual decomposition; the remainder is buried (estimates from [189]). The balance of buried carbon is derived equally from litter and the soil pool. About 12% of mangrove NPP and 22% of marsh NPP is eventually sequestered in soils, supporting the estimate that salt marshes sequester proportionally more CORG in soils than mangroves.
CORG decomposition in mangrove soils to a depth of 1 m (158 Tg C yr−1) is greater than NPP (114 Tg C a−1), implying that (1) the measurements of below-ground microbial decomposition are overestimates (due to methodological shortcomings; variable incubation times, etc.); (2) other sources of allochthonous carbon, such as marine and terrestrial inputs are required to balance carbon flow; and/or (3) centuries-old CORG is also being mineralized, such as CORG buried prior to when the mangroves inhabited the unvegetated mudflat. As the export of DIC, DOC and CH4 from mangrove subsurface soils to adjacent tidal waters (175 Tg C a−1) is within the error estimate of the measured rates of total soil CORG mineralization (158 Tg C a−1), it is likely that allochthonous sources of carbon are important in mangrove carbon flow, such as imports from adjacent seagrass beds and coastal plankton. Additionally, the budget does not account for carbon fixed by benthic cyanobacterial mats and other nitrogen-fixing biota on the forest floor, roots and rhizomes, tree stems, litter and downed wood; these are very productive assemblages but too patchy in distribution to extrapolate beyond a square meter. Further, buried CORG is likely to be a source of respired carbon since measurements of isotopes in a subtropical Australian mangrove indicate that carbon deposited centuries ago is still susceptible to decomposition and subsequent tidal export [190]. Incubation experiments with coastal wetlands have also indicated the potential for sea-level rise to increase remineralization of previously buried carbon [191].
In both ecosystems, pCO2 and pCH4 supersaturation of adjacent tidal waters leads to significant CO2 and CH4 release to the atmosphere. The mean rates of total soil mineralization imply that the turnover time of the entire soil CORG pool (including dead and live roots) is in the order of 25 years for mangroves and 20 years for salt marshes, which is in agreement with the fact that mangrove roots decompose more slowly than marsh plant roots [189] and that most mangrove and salt marsh soil organic matter is composed of higher plant-derived material high in lignocellulose and hemicellulose that decomposes slowly [189].
Mangrove discharge of dissolved carbon contributes nearly 60% of DIC and 27% of DOC export from the world’s tropical rivers to the coastal ocean, based on comparison with the river export data in Huang et al. [192]. Salt marshes and mangrove forests each inhabit only about 0.3% of global coastal ocean area, but, respectively, contribute 17% and 55% for a combined contribution of 72% of air–sea CO2 exchange from the world’s wetlands and estuaries [193]. Salt marshes and mangrove ecosystems, respectively, export 6% and 28% of DIC export and 4% and 13% of DOC + POC export to the world’s coastal ocean [194]. Thus, both wetland ecosystems contribute disproportionately to carbon flow in the global coastal ocean.
As defined in [53], net ecosystem production (NEP) can be derived by subtracting all respiratory losses (ecosystem respiration, RE = RC + RS + RWATER + RMICROALGAE) from all salt marsh/mangrove, benthic algal and plankton gross primary production (GPP). NEP is 54 Tg C a−1 for mangroves and 21 Tg C a−1 for salt marshes (Table 6). Both ecosystems contribute only a small proportion of GPP and RE to the global coastal ocean due to their small global area, but mangroves are more productive in terms of NEP on a per area basis than the other coastal habitats (Table 6). Macroalgae contribute nearly 94% of NEP to total NEP (2217 Tg C a−1), the latter derived by summing the NEP of the global benthic coastal ocean (−165 Tg C a−1) and all the other habitats (2382 Tg C a−1). Seagrass meadows also contribute a larger share to total NEP (4.5%) than either mangroves (2.4%) or salt marshes (1.0%) due to their larger global area. On a per area basis, mangroves produce and respire more carbon than the other coastal habitats. Coral reefs are on average less productive in terms of GPP than their coastal ocean counterparts but have roughly equivalent global NEP to seagrasses. All vegetated ecosystems are net autotrophic (PGPP/RE = 1.09–1.37), with macroalgae being the most autotrophic; the global coastal ocean is net heterotrophic (PGPP/RE = 0.98).
The sum of plant respiration, surface and subsurface soil respiration, and respiration in tidal waterways equates to about 82% of salt marsh and 85% of mangrove GPP (Table 6). The remaining carbon, including that fixed by algae, is stored in vegetation and soil and, to a smaller but vital extent, is probably lost to fisheries, food webs, birds, and other organisms, including humans.
7. Data Refinements and Future Needs
Both carbon budgets reveal some important shortcomings in the databases. For both ecosystems, there is a need for more or greater
- Clarity of their global area, as areal estimates vary greatly;
- Estimates of ecosystem GPP, NPP and R, using eddy covariance technology;
- Estimates of belowground root production;
- Quantification and extrapolation of algal mat production and carbon fixation of nitrogen fixers on tree stems, downed wood and plant debris (litter; leaves);
- Quantification of allochthonous inputs from marine and terrestrial sources, such as adjacent seagrass beds, other estuary producers and advection from offshore;
- Estimates of DIC, DOC and CH4 exchange between these wetlands and adjacent waters;
- Estimates of CO2 and CH4 release from associated tidal creeks and waterways;
- Estimates of benthic microalgal GPP;
- Estimates of soil C stocks and fluxes deeper than 50 cm, especially in salt marshes;
- Reconciling rates of soil respiration at the surface and in subsurface deposits and their linkage;
- Quantification of groundwater export of dissolved carbon in relation to porewater advection of mineralized carbon within deep mangrove and marsh soils;
- Quantification of the fate of roots and their productivity;
- Understanding of CORG differences between within-site and between-site locations (e.g., differences with intertidal position);
- Clarification of links among roots, litter and the soil CORG pool in relation to mineralization rates;
- Clarification of the contributions of litter, dead plants, wood and the soil CORG pool to carbon burial.
These are just some of the high priority shortcomings and needs to construct more accurate and balanced carbon budgets for these two ecosystems.
The impact of climate change will likely have a large impact on ecosystem C fluxes and stocks. For instance, sea-level rise will result in die-off of established plant communities with an increase in export and burial of plant debris; burial rates will concomitantly increase. It has already been observed that the encroachment of mangroves into salt marshes has resulted in an increase in storage of CORG [238,239]. Increases in temperature and atmospheric carbon dioxide concentrations will likely result in increased mangrove and salt marsh productivity and respiration [240,241,242], altering the carbon balance of these ecosystems.
8. Summary and Conclusions
Mangroves and salt marshes are important storage sites for organic carbon and are among the most productive ecosystems on Earth. Mangroves store, on average, twice as much CORG as salt marshes, although marshes have greater rates of CORG burial. Mangroves exhibit greater rates of GPP, aboveground NPP, and canopy respiration with higher PGPP/RC ratios, whereas salt marshes exhibit greater rates of belowground root production. Mangroves have greater rates of subsurface DIC production and, unlike salt marshes, exhibit active microbial diagenesis to a soil depth of 1 m. Salt marshes exhibit greater rates of soil CH4 release and greater export of dissolved CH4, reflecting greater rates of subsurface methanogenesis, as competing sulfate reducers decline in activity below about the 20–50 cm soil horizon. Mangroves release greater amounts of CO2 from tidal waters to the atmosphere and greater amounts of POC, DOC and DIC export to adjacent waters. Mangrove net ecosystem production (628 g C m−2 a−1) is greater than in salt marshes (382 g C m−2 a−1).
Both ecosystems contribute only a small proportion of GPP and RE (ecosystem respiration) to the global coastal ocean due to their small global area, but contribute 72% of the air–sea CO2 exchange of the world’s estuaries, 34% of the DIC export and 17% of DOC + POC export to the world’s coastal ocean. Thus, both wetland ecosystems contribute disproportionately to carbon flow in the global coastal ocean.
Funding
This research received no external funding.
Acknowledgments
I thank two anonymous reviewers and several other researchers for their comments on the preprint of this manuscript.
Conflicts of Interest
The author declares no conflict of interest.
References
- Alongi, D.M. Coastal Ecosystem Processes; CRC Press: Boca Raton, FL, USA, 1998; pp. 43–92. [Google Scholar]
- Tiner, R.W.; Milton, G.R. Estuarine marsh: An overview. In The Wetland Book. II. Distribution, Description and Conservation; Finlayson, C.M., Milton, G.R., Prentice, R.C., Davidson, N.C., Eds.; Springer: Dordrecht, The Netherlands, 2018; pp. 55–72. [Google Scholar]
- Cragg, S.M.; Friess, D.A.; Gillis, L.G.; Trevathan-Tackett, S.M.; Terrett, O.M.; Watts, J.E.M.; Distel, D.L.; Dupree, P. Vascular plants are globally significant contributors to marine carbon fluxes and sinks. Annu. Rev. Mar. Sci. 2020, 12, 469–497. [Google Scholar] [CrossRef] [PubMed] [Green Version]
- Alongi, D.M. Blue Carbon: Coastal Sequestration for Climate Change Mitigation; Springer Briefs in Climate Studies; Springer Science: Cham, Switzerland, 2018. [Google Scholar]
- Johnson, B.J.; Lovelock, C.E.; Herr, D. Climate regulation: Salt marshes and blue carbon. In The Wetland Book. I. Structure, Function, Management, and Methods; Finlayson, C.M., Everard, M., Irvine, K., McInnes, R.J., Middleton, B.A., van Dam, A.A., Davidson, M.C., Eds.; Springer: Dordrecht, The Netherlands, 2018; pp. 1185–1196. [Google Scholar]
- Alongi, D.M. Global significance of mangrove blue carbon in climate change mitigation. Scince 2020, 2, 67. [Google Scholar] [CrossRef]
- Couto, T.D.T.C. Carbon Budget in a Temperate Estuary Salt Marsh. Influence of Temperature Increase in Carbon Sequestration. Ph.D. Thesis, Universidade de Coimbra, Coimbra, Portugal, 2013. [Google Scholar]
- Couto, T.; Duarte, B.; Caçador, I.; Baeta, A.; Marques, J.C. Salt marsh plants carbon storage in a temperate Atlantic estuary illustrated by a stable isotopic analysis-based approach. Ecol. Ind. 2013, 32, 305–311. [Google Scholar] [CrossRef]
- Middelburg, J.J.; Nieuwenhuize, J.; Lubberts, R.K.; van de Plassche, O. Organic carbon isotope systematics of coastal marshes. Estuar. Coast. Shelf Sci. 1997, 45, 681–687. [Google Scholar] [CrossRef]
- Więski, K.; Guo, H.; Craft, C.B.; Pennings, S.C. Ecosystem functions of tidal fresh, brackish, and salt marshes on the Georgia coast. Estuaries Coasts 2010, 33, 161–169. [Google Scholar] [CrossRef]
- Tripathee, R.; Schäfer, K.V.R. Above-and belowground biomass allocation in four dominant salt marsh species of the eastern United States. Wetlands 2014, 35, 21–30. [Google Scholar] [CrossRef]
- Radabaugh, K.R.; Powell, C.E.; Bociu, I.; Clark, B.C.; Moyer, R.P. Plant size metrics and organic carbon content of Florida salt marsh vegetation. Wetl. Ecol. Manag. 2017, 25, 443–455. [Google Scholar] [CrossRef]
- Jones, J.A.; Cherry, J.A.; McKee, K.L. Species and tissue type regulate long-term decomposition of brackish marsh plants grown under elevated CO2 conditions. Estuar. Coast. Shelf Sci. 2016, 169, 38–45. [Google Scholar] [CrossRef]
- Keefe, C.W.; Boynton, W.R. Standing crop of salt marshes surrounding Chincoteague Bay, Maryland-Virginia. Chesap. Sci. 1973, 14, 117–123. [Google Scholar] [CrossRef]
- Benner, R.; Fogel, M.L.; Sprague, E.K. Diagenesis of belowground biomass of Spartina alterniflora in salt-marsh sediments. Limnol. Oceanogr. 1991, 36, 1358–1374. [Google Scholar] [CrossRef]
- Carey, J.C.; Moran, S.B.; Kelly, R.P.; Kolker, A.S.; Fulweiler, R.W. The declining role of organic matter in New England salt marshes. Estuaries Coasts 2017, 40, 626–639. [Google Scholar] [CrossRef]
- DeLaune, R.D.; Buresh, R.J.; Patrick, W.H., Jr. Relationship of soil properties to standing crop biomass of Spartina alterniflora in a Louisiana marsh. Estuar. Coast. Mar. Sci. 1979, 8, 477–487. [Google Scholar] [CrossRef]
- Zhang, G.; Bai, J.; Jia, J.; Wang, X.; Wang, W.; Zhao, Q.; Zhang, S. Soil organic carbon contents and stocks in coastal salt marshes with Spartina alterniflora following an invasion chronosequence in the Yellow River delta, China. Chin. Geogra Sci. 2018, 28, 374–385. [Google Scholar] [CrossRef] [Green Version]
- Schäfer, K.V.R.; Tripathee, R.; Artigas, F.; Morin, T.H.; Bohrer, G. Carbon dioxide fluxes of an urban tidal marsh in the Hudson-Raritan estuary. J. Geophys. Res. Biogeosci. 2014, 119, 2065–2081. [Google Scholar] [CrossRef]
- Santini, N.S.; Lovelock, C.E.; Hua, Q.; Zawadzki, A.; Mazumder, D.; Mercer, T.R.; Muñoz-Rojas, M.; Hardwick, S.A.; Madala, B.S.; Cornwell, W.; et al. Natural and regenerated saltmarshes exhibit similar soil and belowground organic carbon stocks, root production and soil respiration. Ecosystems 2019, 22, 1803–1822. [Google Scholar] [CrossRef]
- DeLaune, R.D.; Pezechki, S.R. The role of soil organic carbon in maintaining surface elevation in rapidly subsiding U.S. Gulf of Mexico coastal marshes. Water Air Soil Pollut. 2003, 3, 167–179. [Google Scholar] [CrossRef]
- Kauffman, J.B.; Bernardino, A.F.; Ferreira, T.O.; Giovannoni, L.R.; de O. Gomes, L.E.; Romero, D.J.; Jimenez, L.C.Z.; Ruiz, F. Carbon stocks of mangroves and salt marshes of the Amazon region, Brazil. Biol. Lett. 2018, 14, 20180208. [Google Scholar] [CrossRef]
- An, S.-U.; Cho, H.; Jung, U.-J.; Kim, B.; Lee, H.; Hyun, J.-H. Invasive Spartina anglica greatly alters the rates and pathways of organic carbon oxidation and associated microbial communities in an intertidal wetland of the Han River estuary, Yellow Sea. Front. Mar. Sci. 2020, 7, 59. [Google Scholar] [CrossRef] [Green Version]
- Saunders, C.J.; Megonigal, J.P.; Reynolds, J.F. Comparison of belowground biomass in C3- and C4-dominated mixed communities in a Chesapeake Bay brackish marsh. Plant Soil 2006, 280, 305–322. [Google Scholar] [CrossRef]
- Yuan, Y.; Li, X.; Jiang, J.; Xue, L.; Craft, C.B. Distribution of organic carbon storage in different salt-marsh plant communities: A case study at the Yangtze estuary. Estuar. Coast. Shelf Sci. 2020, 243, 106900. [Google Scholar] [CrossRef]
- Connor, R.; Chmura, G.L. Dynamics of above- and belowground organic matter in a high latitude macrotidal saltmarsh. Mar. Ecol. Prog. Ser. 2000, 204, 101–110. [Google Scholar] [CrossRef]
- Castillo, J.M.; Rubio-Casal, A.E.; Figueroa, E. Cordgrass biomass in coastal marshes. In Source: Biomass; Momba, M., Bux, F., Eds.; Intechiopen: Sciyo, Croatia, 2010; pp. 1–26. [Google Scholar]
- Doughty, C.L.; Cavanaugh, K.C. Mapping coastal wetland biomass from high resolution unmanned aerial vehicle (UAV) imagery. Remote Sens. 2019, 11, 540. [Google Scholar] [CrossRef] [Green Version]
- Sousa, A.I.; Santos, D.B.; da Silva, E.F.; Sousa, L.P.; Cleary, D.F.R.; Soares, A.M.V.M.; Lillebø, A.I. ‘Blue carbon’ and nutrient stocks of salt marshes at a temperate coastal lagoon (Ria de Aveiro, Portugal). Sci. Rep. 2017, 7, 41225. [Google Scholar] [CrossRef] [PubMed] [Green Version]
- Byrd, K.B.; Ballanti, L.; Thomas, N.; Nguyen, D.; Holmquist, J.R.; Simard, M.; Windham-Myers, L. A remote sensing-based model of tidal marsh aboveground carbon stocks for the conterminous United States. ISPRS J. Photogram. Remote Sens. 2018, 139, 255–271. [Google Scholar] [CrossRef]
- Moore, G.E.; Burdick, D.M.; Peter, C.R.; Keirstead, D.R. Belowground biomass of Phragmites australis in coastal marshes. Northeast. Nat. 2012, 19, 611–626. [Google Scholar] [CrossRef]
- Elsey-Quirk, T.; Unger, V. Geomorphic influences on the contribution of vegetation to soil C accumulation and accretion in Spartina alterniflora marshes. Biogeosciences 2018, 15, 379–397. [Google Scholar] [CrossRef] [Green Version]
- Brown, C.E.; Rajkaran, A. Biomass partitioning in an endemic southern African salt marsh species Salicornia tegetaria (Chenopodiaceae). Afr. J. Aquat. Sci. 2020, 45. [Google Scholar] [CrossRef]
- Chastain, S.G.; Kohfeld, K.; Pellatt, M.G. Carbon stocks and accumulation rates in salt marshes of the Pacific coast of Canada. Biogeosci. Discuss. 2018. [Google Scholar] [CrossRef] [Green Version]
- Elschot, K.; Bakker, J.P.; Temmerman, S.; van de Koppel, J.; Bouma, T.J. Ecosystem engineering by large grazers enhances carbon stocks in a tidal salt marsh. Mar. Ecol. Prog. Ser. 2015, 537, 9–21. [Google Scholar] [CrossRef]
- Kelleway, J.J.; Saintilan, N.; Macreadie, P.I.; Skilbeck, C.G.; Zawadzki, A.; Ralph, P.J. Seventy years of continuous encroachment substantially increases ‘blue carbon’ capacity as mangroves replace intertidal salt marshes. Glob. Chang. Biol. 2016, 22, 1097–1109. [Google Scholar] [CrossRef]
- Schile, L.M.; Kauffman, J.B.; Crooks, S.; Fourqurean, J.W.; Glavan, J.; Megonigal, J.P. Limits on carbon sequestration in arid blue carbon ecosystems. Ecol. Appl. 2017, 27, 859–874. [Google Scholar] [CrossRef] [PubMed]
- Radabaugh, K.R.; Moyer, R.P.; Chappel, A.R.; Powell, C.E.; Bociu, I.; Clark, B.C.; Smoak, J.M. Coastal blue carbon assessment of mangroves, salt marshes, and salt barrens in Tampa Bay, Florida, USA. Estuar. Coasts 2018, 41, 1496–1510. [Google Scholar] [CrossRef]
- Dontis, E.E.; Radabaugh, K.R.; Chappel, A.R.; Russo, C.E.; Moyer, R.P. Carbon storage increases with site age as created salt marshes transition to mangrove forests in Tampa Bay, Florida (USA). Estuar. Coasts 2020. [Google Scholar] [CrossRef]
- Yando, E.S.; Osland, M.J.; Willis, J.M.; Day, R.H.; Krauss, K.W.; Hester, M.W. Salt marsh-mangrove ecotones: Using structural gradients to investigate the effects of woody plant encroachment on plant-soil interactions and ecosystem carbon pools. J. Ecol. 2016, 104, 1020–1031. [Google Scholar] [CrossRef] [Green Version]
- Bulmer, R.H.; Stephenson, F.; Jones, H.F.E.; Townsend, M.; Hillman, J.R.; Schwendenmann, L.; Lundquist, C.J. Blue carbon stocks and cross-habitat subsidies. Front. Mar. Sci. 2020, 7, 380. [Google Scholar] [CrossRef]
- Cartaxana, P.; Catarino, F. Allocation of nitrogen and carbon in an estuarine salt marsh in Portugal. J. Coast. Conserv. 1997, 3, 27–34. [Google Scholar] [CrossRef]
- Chaudhary, D.R.; Rathore, A.P.; Jha, B. Aboveground, belowground biomass and nutrient pool in Salicornia brachiata at coastal area of India: Interactive effects of soil characteristics. Ecol. Res. 2018, 33, 1207–1218. [Google Scholar] [CrossRef]
- Burden, A.; Garbutt, A.; Evans, C.D. Effect of restoration on saltmarsh carbon accumulation in eastern England. Biol. Lett. 2019, 15, 20180773. [Google Scholar] [CrossRef] [Green Version]
- Martinetto, P.; Montemayor, D.I.; Alberti, J.; Costa, C.S.B.; Iribarne, O. Crab bioturbation and herbivory may account for variability in carbon sequestration and stocks in South West Atlantic salt marshes. Front. Mar. Sci. 2016, 3, 122. [Google Scholar] [CrossRef]
- Kulawardhana, R.W.; Feagin, R.A.; Popescu, S.C.; Boutton, T.W.; Yeager, K.M.; Bianchi, T.S. The role of elevation, relative sea-level history, and vegetation transition in determining carbon distribution in Spartina alterniflora dominated salt marshes. Estuar. Coast. Shelf Sci. 2015, 154, 48–57. [Google Scholar] [CrossRef]
- Owers, C.J.; Rogers, K.; Woodroffe, C.D. Spatial variation of above-ground carbon storage in temperate coastal wetlands. Estuar. Coast. Shelf Sci. 2018, 210, 55–67. [Google Scholar] [CrossRef]
- Hamilton, S.E.; Casey, D. Creation of a high spatio-temporal resolution global database of continuous mangrove cover for the 21st century (CGMFC-21). Glob. Ecol. Biogeogr. 2016, 25, 729–738. [Google Scholar] [CrossRef]
- Mcowen, C.J.; Weatherdon, L.V.; Van Bochove, J.-W.; Sullivan, E.; Blyth, S.; Zockler, C.; Stanwell-Smith, D.; Kingston, N.; Martin, C.S.; Spalding, M.; et al. A global map of saltmarshes. Biodivers. Data J. 2017, 5, e11764. [Google Scholar] [CrossRef] [PubMed]
- Kristensen, E.; Connolly, R.M.; Otero, X.L.; Marchand, C.; Ferreira, T.O.; Rivera-Monroy, V.H. Biogeochemical cycles: Global approaches and perspectives. In Mangrove Ecosystems: A Global Perspective; Rivera-Monroy, V.H., Lee, S.Y., Kristensen, E., Twilley, R.R., Eds.; Springer: Cham, Switzerland, 2017; pp. 163–209. [Google Scholar]
- Chmura, G.L.; Anisfeld, S.C.; Cahoon, D.R.; Lynch, J.C. Global carbon sequestration in tidal, saline wetland soils. Glob. Biogeochem. Cycl. 2003, 17. [Google Scholar] [CrossRef]
- Alongi, D.M. The Energetics of Mangrove Forests; Springer: Dordrecht, The Netherlands, 2009. [Google Scholar]
- Twilley, R.R.; Castañeda-Moya, E.; Rivera-Monroy, V.H.; Rovai, A. Productivity and carbon dynamics in mangrove wetlands. In Mangrove Ecosystems: A Global Perspective; Rivera-Monroy, V.H., Lee, S.Y., Kristensen, E., Twilley, R.R., Eds.; Springer: Cham, Switzerland, 2017; pp. 113–162. [Google Scholar]
- Chmura, G.L. Tidal salt marshes. In The Management of Natural Coastal Carbon Sinks; Larroley, D.D., Grimsditch, G., Eds.; IUCN: Gland, Switzerland, 2009; pp. 5–11. [Google Scholar]
- Blum, L.K. Spartina alterniflora root dynamics in a Virginia marsh. Mar. Ecol. Prog. Ser. 1993, 102, 169–178. [Google Scholar] [CrossRef]
- Howes, B.L.; Dacey, J.W.H.; Teal, J.M. Annual carbon mineralization and belowground production of Spartina alterniflora in a New England salt marsh. Ecology 1985, 66, 595–605. [Google Scholar] [CrossRef]
- Roman, C.T.; Daiber, F.C. Aboveground and belowground primary production dynamics of two Delaware Bay tidal marshes. Bull. Torrey Bot. Club 1984, 111, 34–41. [Google Scholar] [CrossRef]
- Feiijtel, T.C.; DeLaune, R.D.; Patrick, W.H., Jr. Carbon flow in coastal Louisiana. Mar. Ecol. Prog. Ser. 1985, 24, 255–260. [Google Scholar] [CrossRef]
- Forbrich, I.; Giblin, A.E. Marsh-atmosphere CO2 exchange in a New England salt marsh. J. Geophys. Res. Biogeosci. 2015, 120, 1825–1838. [Google Scholar] [CrossRef] [Green Version]
- Kathilankal, J.C.; Mozdzer, T.J.; Fuentes, J.D.; D’Odorico, P.; McGlathery, K.J.; Zieman, J.C. Tidal influences on carbon assimilation by a salt marsh. Environ. Res. Lett. 2008, 3, 044010. [Google Scholar] [CrossRef]
- Schubauer, J.P.; Hopkinson, C.S. Above-and belowground emergent macrophyte production and turnover in a coastal marsh ecosystem, Georgia. Limnol. Oceanogr. 1984, 29, 1052–1065. [Google Scholar] [CrossRef]
- Groenendijk, A.M.; Vink-Lievaart, M.A. Primary production and biomass on a Dutch salt marsh: Emphasis on the below-ground component. Vegetatio 1987, 70, 21–27. [Google Scholar]
- Hemminga, M.A.; Huiskes, A.H.L.; Steegstra, M.; van Soelen, J. Assessment of carbon allocation and biomass production in a natural stand of the salt marsh plant Spartina anglica using 13C. Mar. Ecol. Prog. Ser. 1996, 130, 169–178. [Google Scholar] [CrossRef]
- Xi, M.; Zhang, X.; Kong, F.; Li, Y.; Sui, X.; Wang, X. CO2 exchange under different vegetation covers in a coastal wetland of Jiaozhou Bay, China. Ecol. Eng. 2019, 137, 26–33. [Google Scholar] [CrossRef]
- Caffrey, J.M.; Murrell, M.C.; Amacker, K.S.; Harper, J.W.; Philipps, S.; Woodrey, M.S. Seasonal and inter-annual patterns in primary production, respiration, and net ecosystem metabolism in three estuaries in the northeast Gulf of Mexico. Estuaries Coasts 2014, 37, S222–S241. [Google Scholar] [CrossRef] [Green Version]
- Wilson, B.J.; Mortazavi, B.; Kiene, R.P. Spatial and temporal variability in carbon dioxide and methane exchange at three coastal marshes along a salinity gradient in a northern Gulf of Mexico estuary. Biogeochemistry 2015, 123, 329–347. [Google Scholar] [CrossRef]
- Sousa, A.I.; Lillebø, A.I.; Pardal, M.A.; Caçador, I. Productivity and nutrient cycling in salt marshes: Contribution to ecosystem health. Estuar. Coast. Shelf Sci. 2010, 87, 640–646. [Google Scholar] [CrossRef]
- Castillo, J.M.; Leira-Doce, P.; Rubio-Casal, A.E.; Figueroa, E. Spatial and temporal variations in aboveground and belowground biomass of Spartina maritima (small cordgrass) in created and natural marshes. Estuar. Coast. Shelf Sci. 2008, 78, 819–826. [Google Scholar] [CrossRef]
- Abdul-Aziz, O.I.; Ishtiaq, K.S.; Tang, J.; Moseman-Valtierra, S.; Kroeger, K.D.; Gonneea, M.E.; Mora, J.; Morkeski, K. Environmental controls, emergent scaling, and predictions of greenhouse gas (GHG) fluxes in coastal salt marshes. J. Geophys. Res. Biogeosci. 2018, 123, 2234–2256. [Google Scholar] [CrossRef]
- Da Cunha Lana, P.; Guiss, C.; Disarό, S.T. Seasonal variation of biomass and production dynamics for above- and belowground components of a Spartina alterniflora marsh in the euhaline sector of Paranaguá Bay (SE Brazil). Estuar. Coast. Shelf Sci. 1991, 32, 231–241. [Google Scholar] [CrossRef]
- Krauss, K.W.; Holm, G.O., Jr.; Perez, B.C.; McWhorter, D.E.; Cormier, N.; Moss, R.F.; Johnson, D.J.; Neubauer, S.C.; Raynie, R.C. Component greenhouse gas fluxes and radiative balance from two deltaic marshes in Louisiana: Pairing chamber techniques and eddy covariance. J. Geophys. Res. Biogeosci. 2016, 121, 1503–1521. [Google Scholar] [CrossRef] [Green Version]
- Scarton, F.; Day, J.W.; Rismondo, A. Primary production and decomposition of Sarcocornia fruticosa (L.) Scott and Phragmites australis Trin. Ex Steudel in the Po delta, Italy. Estuaries 2002, 25, 325–336. [Google Scholar] [CrossRef]
- Neves, J.P.; Ferreira, L.F.; Simões, M.P.; Gazarini, L.C. Primary production and nutrient content in two salt marsh species, Atriplex portulacoides L. and Limoniastrum monopetalum L., in southern Portugal. Estuaries Coasts 2007, 30, 459–468. [Google Scholar] [CrossRef]
- Lu, W.; Xiao, J.; Liu, F.; Zhang, Y.; Liu, C.; Lin, G. Contrasting ecosystem CO2 fluxes of inland and coastal wetlands: A meta-analysis of eddy covariance data. Glob. Chang. Biol. 2017, 23, 1180–1198. [Google Scholar] [CrossRef] [PubMed]
- Jackson, D.; Long, S.P.; Mason, C.F. Net primary production, decomposition and export of Spartina anglica on a Suffolk salt marsh. J. Ecol. 1986, 74, 647–662. [Google Scholar] [CrossRef]
- Morris, J.T.; Jensen, A. The carbon balance of grazed and non-grazed Spartina anglica saltmarshes at Skallingen, Denmark. J. Ecol. 1998, 86, 229–242. [Google Scholar] [CrossRef]
- Drake, B.G.; Read, M. Carbon dioxide assimilation, photosynthetic efficiency, and respiration of a Chesapeake Bay salt marsh. J. Ecol. 1981, 69, 405–423. [Google Scholar] [CrossRef] [Green Version]
- Costa, C.S.B. Production ecology of Scirpus maritimus in southern Brazil. Cienc. Cult. 1998, 50, 273–280. [Google Scholar]
- Rivera-Monroy, V.H.; Elliton, C.; Narra, S.; Meselhe, E.; Zhao, X.; White, E.; Sasser, C.E.; Visser, J.M.; Meng, X.; Wang, H.; et al. Wetland biomass and productivity in coastal Louisiana: Base line data (1976-2015) and knowledge gaps for the development of spatially explicit models for ecosystem restoration and rehabilitation initiatives. Water 2019, 11, 2054. [Google Scholar] [CrossRef] [Green Version]
- Stagg, C.L.; Schoolmaster, D.R., Jr.; Piazza, S.C.; Snedden, G.; Steyer, G.D.; Fischenich, C.J.; McComas, R.W. A landscape-scale assessment of above-and belowground primary production in coastal wetlands: Implications for climate change-induced community shifts. Estuaries Coasts 2017, 40, 856–879. [Google Scholar] [CrossRef]
- Darby, F.A.; Turner, R.E. Below- and aboveground Spartina alterinflora production in a Louisiana salt marsh. Estuaries Coasts 2008, 31, 223–231. [Google Scholar] [CrossRef]
- Ge, Z.-M.; Guo, H.-Q.; Zhao, B.; Zhang, L.-Q. Plant invasion impacts on the gross and net primary production of the salt marsh on eastern coast of China: Insights from leaf to ecosystem. J. Geophys. Res. Biogeosci. 2015, 120, 169–186. [Google Scholar] [CrossRef]
- Curcό, A.; Ibàñez, C.; Day, J.W.; Prat, N. Net primary production and decomposition of salt marshes of the Ebre delta (Catalonia, Spain). Estuaries 2002, 25, 309–324. [Google Scholar] [CrossRef]
- Van de Broek, M.; Temmerman, S.; Merckx, R.; Govers, G. Controls on soil organic carbon stocks in tidal marshes long an estuarine salinity gradient. Biogeosciences 2016, 13, 6611–6624. [Google Scholar] [CrossRef] [Green Version]
- Gabriel, B.C.; de la Cruz, A.A. Species composition, standing stock, and net primary production of a salt marsh community in Mississippi. Chesap. Sci. 1974, 15, 72–77. [Google Scholar] [CrossRef]
- Tobias, C.; Neubauer, S.C. Salt marsh biogeochemistry —An overview. In Coastal Wetlands: An Integrated Ecosystem Approach; Perillo, G.M.E., Wolanski, E., Cahoon, D.R., Brinson, M.M., Eds.; Elsevier: Amsterdam, The Netherlands, 2009; pp. 445–492. [Google Scholar]
- Selisker, D.M.; Gallagher, J.L.; Burdick, D.M.; Mutz, L.A. The regulation of ecosystem functions by ecotypic variation in the dominant plant: A Spartina alteriflora salt-marsh case study. J. Ecol. 2002, 90, 1–11. [Google Scholar] [CrossRef] [Green Version]
- Van Raalte, C.D.; Valiela, I.; Teal, J.M. Production of epibenthic salt marsh algae: Light and nutrient limitation. Limnol. Oceanogr. 1976, 21, 862–872. [Google Scholar]
- Baas, P.; Hester, M.W.; Joye, S.B. Benthic primary production and nitrogen cycling in Spartina alterniflora marshes: Effect of restoration after acute dieback. Biogeochemistry 2014, 117, 511–524. [Google Scholar] [CrossRef]
- Zedler, J.B. Algal mat productivity: Comparisons in a salt marsh. Estuaries 1980, 3, 122–131. [Google Scholar] [CrossRef]
- Chalmers, A.G.; Wiegert, R.G.; Wolf, P.L. Carbon balance in a salt marsh: Interactions of diffusive export, tidal deposition, and rainfall-caused erosion. Estuar. Coast. Shelf Sci. 1985, 21, 757–771. [Google Scholar] [CrossRef]
- Sullivan, M.J.; Currin, C.A. Community structure and functional dynamics of benthic microalgae in salt marshes. In Concepts and Controversies in Tidal Marsh Ecology; Weinstein, M.P., Kreeger, D.A., Eds.; Kluwer: Dordrecht, The Netherlands, 2000; pp. 81–106. [Google Scholar]
- Miller, W.D.; Neubauer, S.C.; Anderson, I.C. Effects of sea level induced disturbances on high salt marsh metabolism. Estuaries 2001, 24, 357–367. [Google Scholar] [CrossRef]
- Alongi, D.M. Carbon cycling in the world’s mangrove ecosystems revisited: Significance of non-steady state diagenesis and subsurface linkages between the forest floor and the coastal ocean. Forests 2020, 11, 977. [Google Scholar] [CrossRef]
- Burden, A.; Garbutt, R.A.; Evans, C.D.; Jones, D.L.; Cooper, D.M. Carbon sequestration and biogeochemical cycling in a saltmarsh subject to coastal managed realignment. Estuar. Coast. Shelf Sci. 2013, 120, 12–20. [Google Scholar] [CrossRef] [Green Version]
- Al-Haj, A.N.; Fulweiler, R.W. A synthesis of methane emissions from shallow vegetated coastal ecosystems. Glob. Chang. Biol. 2020, 26, 2988–3005. [Google Scholar] [CrossRef]
- Kim, J.; Chaudhary, D.R.; Lee, J.; Byun, C.; Ding, W.; Kwon, B.-O.; Khim, J.S.; Kang, H. Microbial mechanism for enhanced methane emission in deep soil layer of Phragmites-introduced tidal marsh. Environ. Int. 2020, 134, 105251. [Google Scholar] [CrossRef]
- Olsson, L.; Ye, S.; Yu, X.; Wei, M.; Krauss, K.W.; Brix, H. Factors influencing CO2 and CH4 emissions from coastal wetlands in the Liaohe delta, northeast China. Biogeosci. Discuss. 2015, 12, 3469–3503. [Google Scholar] [CrossRef]
- Smith, C.J.; DeLaune, R.D.; Patrick, W.H., Jr. Carbon dioxide emission and carbon accumulation in coastal wetlands. Estuar. Coast. Shelf Sci. 1983, 17, 21–29. [Google Scholar] [CrossRef]
- Wigand, C.; Brennan, P.; Stolt, M.; Holt, M.; Ryba, S. Soil respiration rates in coastal marshes subject to increasing watershed nitrogen loads in southern New England, USA. Wetlands 2009, 29, 952–963. [Google Scholar] [CrossRef]
- Yuan, J.; Ding, W.; Liu, D.; Kang, H.; Freeman, C.; Xiang, J.; Lin, Y. Exotic Spartina alterniflora invasion alters ecosystem-atmosphere exchange of CH4 and N2O and carbon sequestration in a coastal salt marsh in China. Glob. Chang. Biol. 2015, 21, 1567–1580. [Google Scholar] [CrossRef]
- Ye, S.; Krauss, K.W.; Brix, H.; Wei, M.; Olsson, L.; Yu, X.; Ma, X.; Wang, J.; Yuan, H.; Zhao, G.; et al. Inter-annual variability of area-scaled gaseous carbon emissions from wetland soils in the Liaohe delta, China. PLoS ONE 2016, 11, e0160612. [Google Scholar] [CrossRef] [Green Version]
- Li, X.; Zhu, Z.; Yang, L.; Sun, Z. Emissions of biogenic sulfur gases (H2S, CO2) from Phragmites australis coastal marsh in the Yellow River estuary of China. Chin. Geogr. Sci. 2016, 26, 770–778. [Google Scholar] [CrossRef]
- Otani, S.; Endo, T. CO2 flux in tidal flats and salt marshes. In Blue Carbon in Shallow Coastal Ecosystems; Kuwae, T., Hori, M., Eds.; Springer: Singapore, 2019; pp. 223–250. [Google Scholar]
- Gribsholt, B.; Kristensen, E. Benthic metabolism and sulfur cycling along an inundation gradient in a tidal Spartina anglica salt marsh. Limnol. Oceangr. 2003, 48, 2151–2162. [Google Scholar] [CrossRef] [Green Version]
- Gribsholt, B.; Kostka, J.E.; Kristensen, E. Impact of fiddler crabs and plant roots on sediment biogeochemistry in a Georgia saltmarsh. Mar. Ecol. Prog. Ser. 2003, 259, 237–251. [Google Scholar] [CrossRef] [Green Version]
- Hamersley, M.R.; Howes, B.L. Contribution of denitrification to nitrogen, carbon, and oxygen cycling in tidal creek sediments of a New England salt marsh. Mar. Ecol. Prog. Ser. 2003, 262, 55–69. [Google Scholar] [CrossRef] [Green Version]
- Magenheimer, J.F.; Moore, T.R.; Chmura, G.L.; Daoust, R.J. Methane and carbon dioxide flux from a macrotidal salt marsh, Bay of Fundy, New Brunswick. Estuaries 1996, 19, 139–145. [Google Scholar] [CrossRef]
- Hyun, J.-H.; Smith, A.C.; Kostka, J.E. Relative contributions of sulfate-and iron (III) reduction to organic matter mineralization and process controls in contrasting habitats of the Georgia saltmarsh. Appl. Geochem. 2007, 22, 2637–2651. [Google Scholar] [CrossRef]
- Yamochi, S.; Tanaka, T.; Otani, Y.; Endo, T. Effects of light, temperature and ground water level on the CO2 flux of the sediment in the high water temperate seasons at the artificial north salt marsh of Osaka Nanko bird sanctuary, Japan. Ecol. Eng. 2017, 98, 330–338. [Google Scholar] [CrossRef]
- Kostka, J.E.; Gribsholt, B.; Petrie, E.; Dalton, D.; Skelton, H.; Kristensen, K. The rates and pathways of carbon oxidation in bioturbated saltmarsh sediments. Limnol. Oceanogr. 2002, 47, 230–240. [Google Scholar] [CrossRef] [Green Version]
- Caffrey, J.M.; Hollibaugh, J.T.; Bano, N.; Haskins, J. Effects of upwelling on short-term variability in microbial and biogeochemical processes in estuarine sediments from Elkhorn Slough, CA, USA. Aquat. Micro Ecol. 2010, 58, 261–271. [Google Scholar] [CrossRef]
- Wei, S.; Han, G.; Chu, X.; Song, W.; He, W.; Xia, J.; Wu, H. Effect of tidal flooding on ecosystem CO2 and CH4 fluxes in a salt marsh in the Yellow River delta. Estuar. Coast. Shelf Sci. 2020, 232, 106512. [Google Scholar] [CrossRef]
- Morris, J.T.; Whiting, G.J. Emission of gaseous carbon dioxide from salt-marsh sediments and its relation to other carbon losses. Estuaries 1986, 9, 9–19. [Google Scholar] [CrossRef]
- Lewis, D.B.; Brown, J.A.; Jimenez, K.L. Effects of flooding and warming on soil organic matter mineralization in Avicennia germinans mangrove forests and Juncus roemerianus salt marshes. Estuar. Coast. Shelf Sci. 2014, 139, 11–19. [Google Scholar] [CrossRef]
- Tong, C.; Wang, W.-Q.; Zeng, C.-S.; Marrs, R. Methane (CH4) emission from a tidal marsh in the Min River estuary, southeast China. J. Environ. Sci. Health 2010, 45, 506–516. [Google Scholar] [CrossRef] [PubMed]
- Luo, M.; Huang, J.-F.; Zhu, W.-F.; Tong, C. Impacts of increasing salinity and inundation on rates and pathways of organic carbon mineralization in tidal wetlands: A review. Hydrobiologia 2019, 827, 31–49. [Google Scholar] [CrossRef]
- Kostka, J.E.; Roychoudhury, A.; Van Cappellen, P. Rates and controls of anaerobic microbial respiration across spatial and temporal gradients in saltmarsh sediments. Biogeochemistry 2002, 60, 49–76. [Google Scholar] [CrossRef]
- Mok, J.-S.; Cho, H.-Y.; Hyun, J.-H. Rates of anaerobic carbon mineralization and sulfate reduction in association with bioturbation in the intertidal mudflat of Ganghwa, Korea. Sea 2005, 10, 38–46. [Google Scholar]
- Smith, A.C. The Impacts of Macrobenthos on the Rates and Pathways of Organic Matter Mineralization in Two Coastal Marine Ecosystems of the Southeastern United States. Ph.D. Thesis, Florida State University, Tallahassee, FL, USA, 2004. [Google Scholar]
- van de Velde, S.J.; Hidalgo-Martinez, S.; Callebaut, I.; Antler, G.; Rebecca, K.; Leermakers, M.; Meysman, F.J.R. Burrowing fauna mediate alternative stable states in the redox cycling of salt marsh sediments. Geochim. Cosmochim. Acta 2020, 276, 31–49. [Google Scholar] [CrossRef] [Green Version]
- Kim, K.H.; Kim, D. Seasonal and spatial variability of sediment oxygen fluxes in the Beobsan intertidal flat of Taean Bay, mid-western Korean Peninsula. Geosci. J. 2007, 11, 323–329. [Google Scholar] [CrossRef]
- Howes, B.L.; Dacey, J.W.H.; King, G.M. Carbon flow through oxygen and sulfate reduction pathways in salt marsh sediments. Limnol. Oceangr. 1984, 29, 1037–1051. [Google Scholar] [CrossRef]
- Morris, J.T.; Bradley, P.M. Effects of nutrient loading on the carbon balance of coastal wetland sediments. Limnol. Oceanogr. 1999, 44, 699–702. [Google Scholar] [CrossRef] [Green Version]
- Zhong, Q.; Du, Q.; Gong, J.; Zhang, C.; Wang, K. Effects of in situ experimental air warming on the soil respiration in a coastal salt marsh reclaimed for agriculture. Plant Soil 2013, 371, 487–502. [Google Scholar] [CrossRef]
- Simpson, L.T.; Osbourne, T.Z.; Feller, I.C. Wetland soil CO2 efflux along a latitudinal gradient of spatial and temporal complexity. Estuaries Coasts 2019, 42, 45–54. [Google Scholar] [CrossRef]
- Wang, J. Carbon Dioxide and Methane Emissions from a California Salt Marsh. Master’s Thesis, University of California, Santa Barbara, CA, USA, 2018. [Google Scholar]
- Poffenbarger, H.J.; Needelman, B.A.; Megonigal, J.P. Salinity influence on methane emissions from tidal marshes. Wetlands 2011, 31, 831–842. [Google Scholar] [CrossRef]
- Moseman-Valtierra, S.; Abdul-Aziz, O.I.; Tang, J.; Ishtiaq, K.S.; Morkeski, K.; Mora, J.; Quinn, R.K.; Martin, G.M.; Egan, K.; Brannon, E.Q.; et al. Carbon dioxide fluxes reflect plant zonation and belowground biomass in a coastal marsh. Ecosphere 2016, 7, e01560. [Google Scholar] [CrossRef]
- Chmura, G.L.; Kellman, L.; van Ardenne, L.; Guntenspergen, G.R. Greenhouse gas fluxes from salt marshes exposed to chronic nutrient enrichment. PLoS ONE 2016, 11, e0149937. [Google Scholar] [CrossRef] [PubMed]
- Holm, G.O., Jr.; Perez, B.C.; McWhorter, D.E.; Krauss, K.W.; Johnson, D.J.; Raynie, R.C.; Killebrew, C.J. Ecosystem level methane fluxes from tidal freshwater and brackish marshes of the Mississippi River delta: Implications for coastal wetland carbon projects. Wetlands 2016, 36, 401–413. [Google Scholar] [CrossRef]
- Kelley, C.A.; Martens, C.S.; Chanton, J.P. Variations in sedimentary carbon remineralization rates in the White Oak River estuary, North Carolina. Limnol. Oceanogr. 1990, 35, 372–383. [Google Scholar] [CrossRef]
- Xu, X.; Fu, G.; Zou, X.; Ge, C.; Zhao, Z. Diurnal variations of carbon dioxide, methane, and nitrous oxide fluxes from invasive Spartina alterniflora dominated coastal wetland in northern Jiangsu Province. Acta Oceanol. Sin. 2017, 36, 105–113. [Google Scholar] [CrossRef]
- Hu, M.; Ren, H.; Ren, P.; Li, J.; Wilson, B.J.; Tong, C. Response of gaseous carbon emissions to low-level salinity increase in tidal marsh ecosystem of the Min River estuary, southeastern China. J. Environ. Sci. 2017, 52, 210–222. [Google Scholar]
- Hu, M.; Wilson, B.J.; Sun, Z.; Ren, P.; Tong, C. Effects of the addition of nitrogen and sulfate on CH4 and CO2 emissions, soil, and pore water chemistry in a high marsh of the Min River estuary in southeastern China. Sci. Total Environ. 2017, 579, 292–304. [Google Scholar] [CrossRef] [Green Version]
- Song, H.; Liu, X. Anthropogenic effects on fluxes of ecosystem respiration and methane in the Yellow River estuary, China. Wetlands 2016, 36, 113–123. [Google Scholar] [CrossRef]
- Zhang, L.H.; Song, L.P.; Zhang, L.W.; Shao, H.B. Diurnal dynamics of CH4, CO2 and N2O fluxes in the saline-alkaline soils of the Yellow River delta, China. Plant Biosyst. 2015, 149, 797–805. [Google Scholar] [CrossRef]
- Hyun, J.-H.; Mok, J.-S.; Cho, H.-Y.; Kim, S.-H.; Lee, K.S.; Kostka, J.E. Rapid organic matter mineralization coupled to iron cycling in intertidal mud flats of the Han River estuary, Yellow Sea. Biogeochemistry 2009, 92, 231–245. [Google Scholar] [CrossRef]
- Rosentreter, J.A.; Maher, D.T.; Erler, D.V.; Murray, R.H.; Eyre, B.D. Methane emissions partially offset “blue carbon” burial in mangroves. Sci. Adv. 2018, 4, eaao4985. [Google Scholar] [CrossRef] [Green Version]
- Gazeau, F.; Gattuso, J.-P.; Middelburg, J.J.; Brion, N.; Schiettecatte, L.-S.; Frankignoulle, M.; Borges, A.V. Planktonic and whole system metabolism in a nutrient-rich estuary (the Scheldt estuary). Estuaries 2005, 28, 868–883. [Google Scholar] [CrossRef] [Green Version]
- Cai, W.-J.; Pomeroy, L.R.; Moran, M.A.; Wang, Y. Oxygen and carbon dioxide mass balance for the estuarine-intertidal marsh complex of five rivers in the southeastern U.S. Limnol. Oceanogr. 1999, 44, 639–649. [Google Scholar] [CrossRef]
- Geoghegan, E.K.; Caplan, J.S.; Leech, F.N.; Weber, P.E.; Bauer, C.E.; Mozdzer, T.J. Nitrogen enrichment alters carbon fluxes in a New England salt marsh. Ecosyst. Health Sustain. 2018, 4, 277–287. [Google Scholar] [CrossRef] [Green Version]
- Hopkinson, C.S., Jr. Patterns of organic carbon exchange between coastal ecosystems: The mass balance approach in salt marsh ecosystems. In Coastal-Offshore Ecosystem Interactions; Jansson, B.-O., Ed.; Springer: Berlin/Heidelberg, Germany, 1988; pp. 122–154. [Google Scholar]
- Yang, W.-B.; Yuan, C.S.; Tong, C.; Yang, P.; Yang, L.; Huang, B.-Q. Diurnal variation of CO2, CH4, and N2O emission fluxes continuously monitored in-situ in three environmental habitats in a subtropical estuarine wetland. Mar. Pollut. Bull. 2017, 119, 289–298. [Google Scholar] [CrossRef]
- Bartlett, K.B.; Harriss, R.C.; Sebacher, D.I. Methane flux from coastal salt marshes. J. Geophys. Res. 1985, 90, 5710–5720. [Google Scholar] [CrossRef]
- Trifunovic, B.; Vázquez-Lule, A.; Capooci, M.; Seyfferth, A.L.; Moffat, C.; Vargas, R. Carbon dioxide and methane emissions from a temperate salt marsh tidal creek. J. Geophys. Res. Biogeosci. 2020, 125. [Google Scholar] [CrossRef]
- Mayen, J. Spatial and Temporal Variations in pCO2 and Atmospheric CO2 exchanges in a Temperate Salt Marsh System. Master’s Thesis, Université de Pau et des Pays de L’Adour, Pau, France, 2020. [Google Scholar]
- Huertas, I.E.; Flecha, S.; Perez, F.F.; de la Paz, M. Spatio-temporal variability and controls on methane and nitrous oxide in the Guadalquivir estuary, southwestern Europe. Aquat. Sci. 2018, 80, 29. [Google Scholar] [CrossRef] [Green Version]
- Matoušů, A.; Osudar, R.; Šimek, K.; Bussmann, I. Methane distribution and methane oxidation in the water column of the Elbe estuary, Germany. Aquat. Sci. 2017, 79, 443–458. [Google Scholar] [CrossRef]
- Daniel, I.; DeGrandpre, M.; Farías, L. Greenhouse gas emissions from the Tubul-Raqui estuary (central Chile 36°S). Estuar. Coast. Shelf Sci. 2013, 134, 31–44. [Google Scholar] [CrossRef]
- Huertas, I.E.; de la Paz, F.F.; Navarro, G.; Flecha, S. Methane emissions from the salt marshes of Doñana wetlands: Spatio-temporal variability and controlling factors. Front. Ecol. Evol. 2019, 7, 32. [Google Scholar] [CrossRef] [Green Version]
- Oliveira, A.P.; Cabeçadas, G.; Mateus, M.D. Inorganic carbon distribution and CO2 fluxes in a large European estuary (Tagas, Portugal). Sci. Rep. 2017, 7, 7376. [Google Scholar] [CrossRef] [Green Version]
- Maher, D.T.; Call, M.; Santos, I.R.; Sanders, C.J. Beyond burial: Lateral exchange is a significant atmospheric carbon sink in mangrove forests. Biol. Lett. 2018, 14, 20180200. [Google Scholar] [CrossRef] [Green Version]
- Ray, R.; Baum, A.; Rixen, T.; Gleixner, G.; Jana, T.K. Exportation of dissolved (inorganic and organic) and particulate carbon from mangroves and its implication to the carbon budget in the Indian Sundarbans. Sci. Total Environ. 2018, 621, 535–547. [Google Scholar] [CrossRef]
- Call, M.; Sanders, C.J.; Macklin, P.A.; Santos, I.R.; Maher, D.T. Carbon outwelling and emissions from two contrasting mangrove creeks during the monsoon storm season in Palau, Micronesia. Estuar. Coast. Shelf Sci. 2019, 218, 340–348. [Google Scholar] [CrossRef]
- Jennerjahn, T.C.; Ittekkot, V. Relevance of mangroves from the production and deposition of organic matter along tropical continental margins. Naturwissenschaften 2002, 89, 23–30. [Google Scholar] [CrossRef]
- Ray, R.; Thouzeau, G.; Walcker, R.; Vantrepotte, V.; Gleixner, G.; Morvan, S.; Devesa, J.; Michaud, E. Mangrove-derived organic and inorganic carbon exchanges between the Sinnamary estuarine system (French Guiana, South America) and Atlantic Ocean. J. Geophys. Res. Biogeosci. 2020, 125. [Google Scholar] [CrossRef]
- Adame, M.F.; Lovelock, C.E. Carbon and nutrient exchange of mangrove forests with the coastal ocean. Hydrobiologia 2011, 663, 23–50. [Google Scholar] [CrossRef]
- Schielbel, H.N.; Gardner, G.B.; Wang, X.; Peri, F.; Chen, R.F. Seasonal export of dissolved organic matter from a New England salt marsh. J. Coast. Res. 2017, 34, 939–954. [Google Scholar]
- Forja, J.M.; Ortega, T.; Ponce, R.; de la Paz, M.; Rubio, J.A.; Gόmez-Parra, A. Tidal transport of inorganic carbon and nutrients in a coastal salt marsh (Bay of Cádiz, SW Spain). Cienc. Mar. 2003, 29, 469–481. [Google Scholar] [CrossRef] [Green Version]
- Laffaille, P.; Brosse, S.; Feuteun, E.; Baisez, A.; Leeefeuvre, J.-C. Role of fish communities in particulate organic matter fluxes between salt marshes and coastal marine waters in the Mont Saint-Michel bay. Hydrobiologia 1998, 373–374, 121–133. [Google Scholar] [CrossRef] [Green Version]
- Das, A.; Justic, D.; Swenson, E.; Turner, R.E.; Inoue, M.; Park, D. Coastal land loss and hypoxia: The ‘outwelling’ hypothesis revisited. Environ. Res. Lett. 2011, 6, 025001. [Google Scholar] [CrossRef]
- Duarte, B.; Valentin, J.M.; Dias, J.M.; Silva, H.; Marques, J.C.; Caçador, I. Modelling sea level rise (SLR) impacts on salt marsh detrital outwelling C and N exports from an estuarine coastal lagoon to the ocean (Ria de Aveiro, Portugal). Ecol. Modell. 2014, 289, 36–44. [Google Scholar] [CrossRef]
- Raymond, P.A.; Bauer, K.E.; Cole, J.J. Atmospheric CO2 evasion, dissolved inorganic carbon production, and net heterotrophy in the York River estuary. Limnol. Oceanogr. 2000, 45, 1707–1717. [Google Scholar] [CrossRef] [Green Version]
- Cai, W.-J.; Wiebe, W.J.; Wang, Y.; Sheldon, J.E. Intertidal marsh as a source of dissolved inorganic carbon and a sink of nitrate in the Satilla River-estuarine complex in the southeastern U.S. Limnol. Oceanogr. 2000, 45, 1743–1752. [Google Scholar] [CrossRef]
- Cai, W.-J.; Wang, Y. The chemistry, fluxes, and sources of carbon dioxide in the estuarine waters of the Satilla and Altamaha Rivers, Georgia. Limnol. Oceanogr. 1998, 43, 657–668. [Google Scholar] [CrossRef]
- Joesoef, A.; Kirchman, D.L.; Sommerfield, C.K.; Cai, W.-J. Seasonal variability of the inorganic carbon system in a large coastal plain estuary. Biogeosciences 2017, 14, 4949–4963. [Google Scholar] [CrossRef] [Green Version]
- Taylor, D.I.; Allanson, B.R. Organic carbon fluxes between a high marsh and estuary, and the inapplicability of the outwelling hypothesis. Mar. Ecol. Prog. Ser. 1995, 120, 263–270. [Google Scholar] [CrossRef] [Green Version]
- Wang, Z.A.; Cai, W.-J. Carbon dioxide degassing and inorganic carbon export from a marsh-dominated estuary (the Duplin River): A marsh CO2 pump. Limnol. Oceanogr. 2004, 49, 341–354. [Google Scholar] [CrossRef]
- Cai, W.-J.; Wang, Z.A.; Wang, Y. The role of marsh-dominated heterotrophic continental margins in transport of CO2 between the atmosphere, the land-sea interface, and the ocean. Geophys. Res. Lett. 2003, 30, 1849. [Google Scholar] [CrossRef]
- Winter, P.E.D.; Schlacher, T.A.; Baird, D. Carbon flux between an estuary and the ocean: A case for outwelling. Hydrobiologia 1996, 337, 123–132. [Google Scholar] [CrossRef]
- Wang, Z.A.; Kroeger, K.D.; Ganju, N.K.; Gonneea, M.E.; Chu, S.N. Intertidal salt marshes as an important source of inorganic carbon to the coastal ocean. Limnol. Oceanogr. 2016, 61, 1916–1931. [Google Scholar] [CrossRef] [Green Version]
- Cai, W.J. Estuarine and coastal ocean carbon paradox: CO2 sinks or sites of terrestrial carbon incineration? Annu. Rev. Mar. Sci. 2011, 3, 123–145. [Google Scholar] [CrossRef] [Green Version]
- Wang, S.R.; Di Iorio, D.; Cai, W.-J.; Hopkinson, C.S. Inorganic carbon and oxygen dynamics in a marsh-dominated estuary. Limnol. Oceangr. 2017, 63, 47–71. [Google Scholar] [CrossRef] [Green Version]
- Childers, D.L.; Day, J.W., Jr.; McKellar, H.N., Jr. Twenty more years of marsh and estuarine flux studies: Revisiting Nixon (1980). In Concepts and Controversies in Tidal Marsh Ecology; Weinstein, M.P., Kreeger, D.A., Eds.; Kluwer: Dordrecht, The Netherlands, 2000; pp. 391–423. [Google Scholar]
- Gardner, L.R.; Kjerfve, B. Tidal fluxes of nutrients and suspended sediments at the North Inlet-Winyah Bay National Estuarine Research Reserve. Estuar. Coast. Shelf Sci. 2006, 70, 682–692. [Google Scholar] [CrossRef]
- Osburn, C.L.; Mikan, M.P.; Etheridge, J.R.; Burchell, M.R.; Birgand, F. Seasonal variation in the quality of dissolved and particulate organic matter exchanged between a salt marsh and its adjacent estuary. J. Geophys. Res. Biogeosci. 2015, 120, 1430–1449. [Google Scholar] [CrossRef]
- Childers, D.L.; McKellar, H.N.; Dame, R.F.; Sklar, F.H.; Blood, E.R. A dynamics nutrient budget of subsystem interactions in a salt marsh estuary. Estuar. Coast. Shelf Sci. 1993, 36, 105–131. [Google Scholar] [CrossRef]
- Roman, C.T.; Daiber, F.C. Organic carbon flux through a Delaware Bay salt marsh: Tidal exchange, particle size distribution, and storms. Mar. Ecol. Prog. Ser. 1989, 54, 149–156. [Google Scholar] [CrossRef]
- Wolaver, T.G.; Spurrier, J.D. Carbon transport between a euhaline vegetated marsh in South Carolina and the adjacent tidal creek: Contributions via tidal inundation, runoff and seepage. Mar. Ecol. Prog. Ser. 1988, 42, 53–62. [Google Scholar] [CrossRef]
- Dankers, N.; Binsbergen, M.; Zegers, K.; Laane, R.; van der Loeff, M.R. Transportation of water, particulate and dissolved organic and inorganic matter between a salt marsh and the Ems-Dollard estuary, The Netherlands. Estuar. Coast. Shelf Sci. 1984, 19, 143–165. [Google Scholar] [CrossRef]
- Santos, I.R.; Maher, D.T.; Larkin, R.; Webb, J.R.; Sanders, C.J. Carbon outwelling and outgassing vs. burial in an estuarine tidal creek surrounded by mangrove and saltmarsh wetlands. Limnol. Oceanogr. 2019, 64, 996–1013. [Google Scholar] [CrossRef]
- Li, H.; Dai, S.; Ouyang, Z.; Xie, X.; Guo, H.; Gu, C.; Xiao, X.; Ge, Z.; Peng, C.; Zhao, B. Multi-scale temporal variation of methane flux and its controls in a subtropical tidal salt marsh in eastern China. Biogeochemistry 2018, 137, 163–179. [Google Scholar] [CrossRef]
- Sadat-Noori, M.; Maher, D.T.; Santos, I.R. Groundwater discharge as a source of dissolved carbon and greenhouse gases in a subtropical estuary. Estuaries Coasts 2016, 39, 639–656. [Google Scholar] [CrossRef]
- Deborde, J.; Anschutz, P.; Guérin, F.; Poirier, D.; Marty, D.; Boucher, G.; Thouzeau, G.; Canton, M.; Abril, G. Methane sources, sinks and fluxes in a temperate tidal lagoon: The Arcachon lagoon (SW France). Estuar. Coast. Shelf Sci. 2010, 89, 256–266. [Google Scholar] [CrossRef]
- Upstill-Goddard, R.C.; Barnes, J.; Frost, T.; Punshon, S.; Owens, N.J.P. Methane in the southern North Sea: Low-salinity inputs, estuarine removal, and atmospheric flux. Glob. Biogeochem. Cycle 2000, 14, 1205–1217. [Google Scholar] [CrossRef]
- Weston, N.B.; Neubauer, S.C.; Velinsky, D.J.; Vile, M.A. Net ecosystem carbon exchange and the greenhouse gas balance of tidal marshes along an estuarine salinity gradient. Biogeochemistry 2014, 120, 163–189. [Google Scholar] [CrossRef]
- Alongi, D.M. Carbon cycling and storage in mangrove forests. Annu. Rev. Mar. Sci. 2014, 6, 195–219. [Google Scholar] [CrossRef]
- Ouyang, X.; Lee, S.Y.; Connolly, R.M. The role of root decomposition in global mangrove and saltmarsh carbon budgets. Earth Sci. Rev. 2017, 166, 53–63. [Google Scholar] [CrossRef] [Green Version]
- Maher, D.T.; Santos, I.R.; Schulz, K.G.; Call, M.; Jacobsen, G.E.; Sanders, C.J. Blue carbon oxidation revealed by radiogenic and stable isotopes in a mangrove system. Geophys. Res. 2017, 44, 4889–4896. [Google Scholar] [CrossRef]
- Ward, N.D.; Morrison, E.S.; Liu, Y.; Rivas-Ubach, A.; Osborne, T.Z.; Ogram, A.V.; Bianchi, T.S. Marine microbial community responses related to wetland carbon mobilization in the coastal zone. Limnol. Oceangr. Lett. 2019, 4, 25–33. [Google Scholar] [CrossRef] [Green Version]
- Huang, T.-H.; Fu, Y.-H.; Pan, P.Y.; Chen, C.-T.A. Fluvial carbon fluxes in tropical rivers. Curr. Opin. Environ. Sustain. 2012, 4, 162–169. [Google Scholar] [CrossRef] [Green Version]
- Chen, C.-T.-A.; Huang, T.-H.; Chen, Y.-C.; Bai, Y.; He, X.; Kang, Y. Air-sea exchanges of CO2 in the world’s coastal seas. Biogeosciences 2013, 10, 6509–6544. [Google Scholar] [CrossRef] [Green Version]
- Bauer, J.E.; Cai, W.-J.; Raymond, P.A.; Bianchi, T.S.; Hopkinson, C.S.; Regnier, P.A.G. The changing carbon cycle of the coastal ocean. Nature 2013, 504, 61–70. [Google Scholar] [CrossRef]
- McKenzie, L.J.; Nordlund, L.M.; Jones, B.L.; Cullen- Unsworth, L.C.; Roelfsema, C.; Unsworth, R.K.F. The global distribution of seagrass meadows. Environ. Res. Lett. 2020, 15, 074041. [Google Scholar] [CrossRef]
- Krause-Jensen, D.; Duarte, C.M. Substantial role of macroalgae in marine carbon sequestration. Nature Geosci. 2016, 9, 737–742. [Google Scholar] [CrossRef]
- Murrell, M.C.; Caffrey, J.M.; Marcovich, D.T.; Beck, M.W.; Jarvis, B.M.; Hagy, J.D., III. Seasonal oxygen dynamics in a warm temperate estuary: Effects of hydrologic variability on measurements of primary production, respiration, and net metabolism. Estuaries Coasts 2018, 41, 690–707. [Google Scholar] [CrossRef]
- Egea, L.G.; Jiménez-Ramos, R.; Hernández, I.; Brun, F.G. Effect of in situ short-term temperature increase on carbon metabolism and dissolved organic carbon (DOC) fluxes in a community dominated by the seagrass Cymodocea nodosa. PLoS ONE 2019, 14, e0210386. [Google Scholar] [CrossRef] [Green Version]
- Koopmans, D.; Holtappels, M.; Chennu, A.; Weber, M.; de Beer, D. The response of seagrass (Posidonia oceanica) meadow metabolism to CO2 levels and hydrodynamic exchange determined with aquatic eddy covariance. Biogeosci. Discuss. 2018. [Google Scholar] [CrossRef] [Green Version]
- Ganguly, D.; Singh, G.; Ramachandran, P.; Selvam, A.P.; Banderjee, K.; Ramachandran, R. Seagrass metabolism and carbon dynamics in a tropical coastal embayment. Ambio 2017, 46, 667–679. [Google Scholar] [CrossRef] [PubMed]
- Cardini, U.; van Hoytema, N.; Bednarz, V.N.; Al-Rshaidat, M.M.D.; Wild, C. N2 fixation and primary productivity in a Red Sea Halophila stipulacea meadow exposed to seasonality. Limnol. Oceanogr. 2017, 63, 786–798. [Google Scholar] [CrossRef] [Green Version]
- Olivé, I.; Silva, J.; Costa, M.M.; Santos, R. Estimating seagrass community metabolism using benthic chambers: The effect of incubation time. Estuaries Coasts 2016, 39, 138–144. [Google Scholar] [CrossRef]
- Long, M.H.; Berg, P.; McGlathery, K.J.; Zieman, J.C. Sub-tropical seagrass ecosystem metabolism measured by eddy covariance. Mar. Ecol. Prog. Ser. 2015, 529, 75–90. [Google Scholar] [CrossRef]
- Berg, P.; Delgard, M.L.; Polsenaere, P.; McGlathery, K.J.; Doney, S.C.; Berger, A.C. Dynamics of benthic metabolism, O2, and pCO2 in a temperate seagrass meadow. Limnol. Oceanogr. 2019, 64, 2586–2604. [Google Scholar] [CrossRef] [Green Version]
- Koopmans, D.; Holtappels, M.; Chennu, A.; Weber, M.; de Beer, D. High net primary production of Mediterranean seagrass (Posidonia oceanica) meadows determined with aquatic eddy covariance. Front. Mar. Sci. 2020, 7, 118. [Google Scholar] [CrossRef]
- Anton, A.; Baldry, K.; Coker, D.J.; Duarte, C.M. Drivers of the low metabolic rates of seagrass meadows in the Red Sea. Front. Mar. Sci. 2020, 7, 69. [Google Scholar] [CrossRef] [Green Version]
- Burkholz, C.; Duarte, C.M.; Garcias-Bonet, N. Thermal dependence of seagrass ecosystem metabolism in the Red Sea. Mar. Ecol. Prog. Ser. 2019, 614, 79–90. [Google Scholar] [CrossRef] [Green Version]
- Champenois, W.; Borges, A.V. Inter-annual variations over a decade of primary production of the seagrass Posidonia oceanica. Limnol. Oceanogr. 2018, 64, 32–45. [Google Scholar] [CrossRef]
- Long, M.H.; Berg, P.; Falter, J.L. Seagrass metabolism across a productivity gradient using the eddy covariance, Eulerian control volume, and biomass addition techniques. J. Geophys. Res. Oceans 2015, 120, 3624–3639. [Google Scholar] [CrossRef] [Green Version]
- Berger, A.C.; Berg, P.; McGlathery, K.J.; Delgard, M.L. Long-term trends and resilience of seagrass metabolism: A decadal aquatic eddy covariance study. Limnol. Oceanogr. 2020, 65, 1423–1438. [Google Scholar] [CrossRef] [Green Version]
- Ikawa, H.; Oechel, W.C. Temporal variations in air-sea CO2 exchange near large kelp beds near San Diego, California. J. Geophys Res. Oceans 2015, 120, 50–63. [Google Scholar] [CrossRef]
- Towle, D.W.; Pearse, J.S. Production of the giant kelp, Macrocystis, estimated by in situ incorporation of 14C in polyethylene bags. Limnol. Oceanogr. 1973, 18, 155–159. [Google Scholar] [CrossRef]
- Bensoussan, N.; Gattuso, J.-P. Community primary production and calcification in a NW Mediterranean ecosystem dominated by calcareous macroalgae. Mar. Ecol. Prog. Ser. 2007, 334, 37–45. [Google Scholar] [CrossRef] [Green Version]
- Migné, A.; Ouisse, V.; Hubas, C.; Davoult, D. Freshwater seepages and ephemeral macroalgae proliferation in an intertidal bay: II. Effect on benthic biomass and metabolism. Estuar. Coast. Shelf Sci. 2011, 92, 161–168. [Google Scholar] [CrossRef]
- Golléty, C.; Migné, A.; Davoult, D. Benthic metabolism on a sheltered rocky shore: Role of the canopy in the carbon budget. J. Phycol. 2008, 44, 1146–1153. [Google Scholar] [CrossRef]
- Rovelli, L.; Attard, K.M.; Cárdenas, C.A.; Glud, R.N. Benthic primary production and respiration of shallow rocky habitats: A case study from South Bay (Doumer Island, Western Antarctic Peninsula). Polar Biol. 2019, 42, 1459–1474. [Google Scholar] [CrossRef] [Green Version]
- Hubas, C.; Davoult, D. Does seasonal proliferation of Enteromorpha sp. Affect the annual benthic metabolism of a small macrotidal estuary? (Roscoff Aber Bay, France). Estuar. Coast. Shelf Sci. 2006, 70, 287–296. [Google Scholar] [CrossRef]
- Naumann, M.S.; Jantzen, C.; Haas, A.F.; Iglesias-Prieto, R.; Wild, C. Benthic primary production budget of a Caribbean reef lagoon (Puerto Morelos, Mexico). PLoS ONE 2013, 8, e82923. [Google Scholar] [CrossRef]
- Miller, R.J.; Reed, D.C.; Brzezinski, M.A. Partitioning of primary production among giant kelp (Macrocystis pyrifera), understory macroalgae, and phytoplankton on a temperate reef. Limnol. Oceangr. 2011, 56, 119–132. [Google Scholar] [CrossRef]
- Stuhldreier, I.; Sánchez-Noguera, C.; Roth, F.; Cortés, J.; Rixen, T.; Wild, C. Upwelling increases net primary production of corals and reef-wide gross primary production along the Pacific coast of Costa Rica. Front. Mar. Sci. 2015, 2, 113. [Google Scholar] [CrossRef]
- Tait, L.W.; Schiel, D.R. Primary productivity of intertidal macroalgal assemblages: Comparison of laboratory and in situ photorespirometry. Mar. Ecol. Prog. Ser. 2010, 416, 115–125. [Google Scholar] [CrossRef] [Green Version]
- Giordano, J.C.P.; Brush, M.J.; Anderson, I.C. Ecosystem metabolism in shallow coastal lagoons: Patterns and partitioning of planktonic, benthic, and integrated community rates. Mar. Ecol. Prog. Ser. 2012, 458, 21–38. [Google Scholar] [CrossRef] [Green Version]
- Attard, K.M.; Glud, R.N.; McGinnis, D.F.; Rysgaard, S. Seasonal rates of benthic primary production in a Greenland fjord measured by aquatic eddy correlation. Limnol. Oceanogr. 2014, 59, 1555–1569. [Google Scholar] [CrossRef]
- Ruiz-Halpern, S.; Vaquer-Sunyer, R.; Duarte, C.M. Annual benthic metabolism and organic carbon fluxes in a semi-enclosed Mediterranean bay dominated by the macroalgae Caulerpa prolifera. Front. Mar. Sci. 2014, 1, 67. [Google Scholar] [CrossRef] [Green Version]
- Attard, K.M.; Rodil, I.F.; Berg, P.; Norkko, J.; Norkko, A.; Glud, R.N. Seasonal metabolism and carbon export of a key coastal habitat: The perennial canopy-forming macroalga Fucus vesiculosus. Limnol. Oceangr. 2018, 64, 149–164. [Google Scholar] [CrossRef] [Green Version]
- Apostolaki, E.T.; Holmer, M.; Marbà, N.; Karakassis, I. Metabolic imbalance in coastal vegetated (Posidonia oceanica) and unvegetated benthic ecosystems. Ecosystems 2010, 13, 459–471. [Google Scholar] [CrossRef]
- Middelburg, J.J.; Duarte, C.M.; Gattuso, J.-P. Respiration in coastal benthic communities. In Respiration in Aquatic Ecosystems; del Giorgio, P.A., le Williams, P.J., Eds.; Oxford University Press: Oxford, UK, 2005; pp. 202–224. [Google Scholar]
- Jokiel, P.L.; Morrissey, J.I. Influence of size on primary production in the reef coral Pocillopora damicornis and the macroalga Acanthophora spicifera. Mar. Biol. 1986, 91, 15–26. [Google Scholar] [CrossRef]
- Dalsgaard, T. Benthic primary production and nutrient cycling in sediments with benthic microalgae and transient accumulation of macroalgae. Limnol. Oceangr. 2003, 48, 2138–2150. [Google Scholar] [CrossRef]
- Sundbäck, K.; Miles, A.; Hulth, S.; Pihl, L.; Engström, P.; Selander, E.; Svenson, A. Importance of benthic nutrient regeneration during initiation of macroalgal blooms in shallow bays. Mar. Ecol. Prog. Ser. 2003, 246, 115–126. [Google Scholar] [CrossRef]
- Krause-Jensen, D.; McGlathery, K.; Rysgaard, S.; Christensen, P.B. Production within dense mats of the filamentous macroalga Chaetomorpha linum in relation to light and nutrient availability. Mar. Ecol. Prog. Ser. 1996, 134, 207–216. [Google Scholar] [CrossRef] [Green Version]
- Littler, M.M.; Taylor, P.R.; Littler, D.S.; Sims, R.H.; Norris, J.N. The Distribution, Abundance and Primary Productivity of Submerged Macrophytes in a Belize Barrier Reef Mangrove System. Atoll Res. Bull. 1985, 289, 1–22. [Google Scholar] [CrossRef]
- Jackson, G.A. Nutrients and production of giant kelp, Macrocystis pyrifera, off southern California. Limnol. Oceangr. 1977, 22, 979–995. [Google Scholar] [CrossRef]
- Jackson, G.A. Modelling the growth and harvest yield of the giant kelp Macrocystis pyrifera. Mar. Biol. 1987, 95, 611–624. [Google Scholar] [CrossRef]
- Mann, K.H. Ecological energetics of the sea-weed zone in a marine bay in the Atlantic coast of Canada. II. Productivity of the seaweeds. Mar. Biol. 1972, 14, 199–209. [Google Scholar]
- Pedersen, M.F.; Nejrup, L.B.; Fredriksen, S.; Christie, H.; Norderhaug, K.M. Effects of wave exposure on population structure, demography, biomass and productivity of the kelp Laminaria hyperborea. Mar. Ecol. Prog. Ser. 2012, 451, 45–60. [Google Scholar] [CrossRef] [Green Version]
- Cloern, J.E.; Foster, S.Q.; Kleckner, A.E. Phytoplankton primary production in the world’s estuarine-coastal ecosystems. Biogeosciences 2014, 11, 2477–2501. [Google Scholar] [CrossRef] [Green Version]
- Doughty, C.L.; Langley, J.A.; Walker, W.S.; Feller, I.C.; Schaub, R.; Chapman, S.K. Mangrove range expansion rapidly increases coastal wetland carbon storage. Estuaries Coasts 2016, 39, 385–396. [Google Scholar] [CrossRef]
- Vaughn, D.R.; Bianchi, T.S.; Shields, M.R.; Kenney, W.F.; Osborne, T.Z. Increased Organic Carbon Burial in Northern Florida Mangrove-Salt Marsh Transition Zones. Glob. Biogeochem. Cycles 2020, 34, e2019GB006334. [Google Scholar] [CrossRef]
- Short, F.T.; Kosten, S.; Morgan, P.A.; Malone, S.; Moore, G.E. Impacts of climate change on submerged and emergent wetland plants. Aquat. Bot. 2016, 135, 3–17. [Google Scholar] [CrossRef]
- FitzGerald, D.M.; Hughes, Z. Marsh processes and their response to climate change and sea-level rise. Annu. Rev. Earth Planet. Sci. 2019, 47, 481–517. [Google Scholar] [CrossRef] [Green Version]
- Alongi, D.M. The impact of climate change on mangrove forests. Curr. Clim. Chang. Rep. 2015, 1, 30–39. [Google Scholar] [CrossRef]
Figure 1.
Median organic carbon stocks vested in above- and belowground plant biomass and in soils to a depth of 1 m in salt marshes and mangrove forests on a per hectare basis. Mean (±1 standard error) values and references are listed in Table 1.
Figure 1.
Median organic carbon stocks vested in above- and belowground plant biomass and in soils to a depth of 1 m in salt marshes and mangrove forests on a per hectare basis. Mean (±1 standard error) values and references are listed in Table 1.

Figure 2.
Median rates of gross (GPP) and aboveground net (AGNPP) primary production and plant respiration for mangroves (green bars) and salt marshes (blue bars). Vertical line in each box denotes the median (values presented in each box), and the boxes encompass the 25th and 75th percentiles and the outer bars denote the 5th and 95th percentiles. Data from Table 2.

Figure 3.
Mass balance of mean carbon flow through the world’s mangrove forests. Units are Tg C a−1. The budget assumes a global mangrove area of 86,495 km2 [94]. Solid blue arrows depict mean values based on empirical data (see text for explanation and references). Dashed red arrows represent mean values estimated indirectly by difference. The CORG pool (both live and dead roots and other organic matter) in soils to a depth of 1 m is presented in a box in the forest floor with units of Tg CORG. Abbreviations: GPP = gross primary production; NPP = net primary production; RA = algal production at soil surface and aboveground biomass; Rc = canopy respiration; RS = soil respiration at soil surface; RWATER = waterway respiration; POC = particulate organic carbon derived from litter and exported to tidal waters; DIC = dissolved inorganic carbon; DOC = dissolved organic carbon; CH4 = methane; EDOC = exchangeable dissolved organic carbon.

Figure 4.
Mass balance of mean carbon flow through the world’s salt marshes. Units are Tg C a−1. The budget assumes a global salt marsh area of 54,951 km2 [49]. Solid blue arrows depict mean values based on empirical data (see text for explanation and references). Dashed red arrows represent mean values estimated indirectly by difference. The CORG pool (both live and dead roots and other organic matter) in soils to a depth of 1 m is presented in a box in the marsh floor with units of Tg CORG. Abbreviations: GPP = gross primary production; NPP = net primary production; RA = algal production at soil surface and aboveground biomass; Rc = canopy respiration; RS = soil respiration at soil surface; RWATER = waterway respiration; POC = particulate organic carbon derived from litter and exported to tidal waters; DIC = dissolved inorganic carbon; DOC = dissolved organic carbon; CH4 = methane.


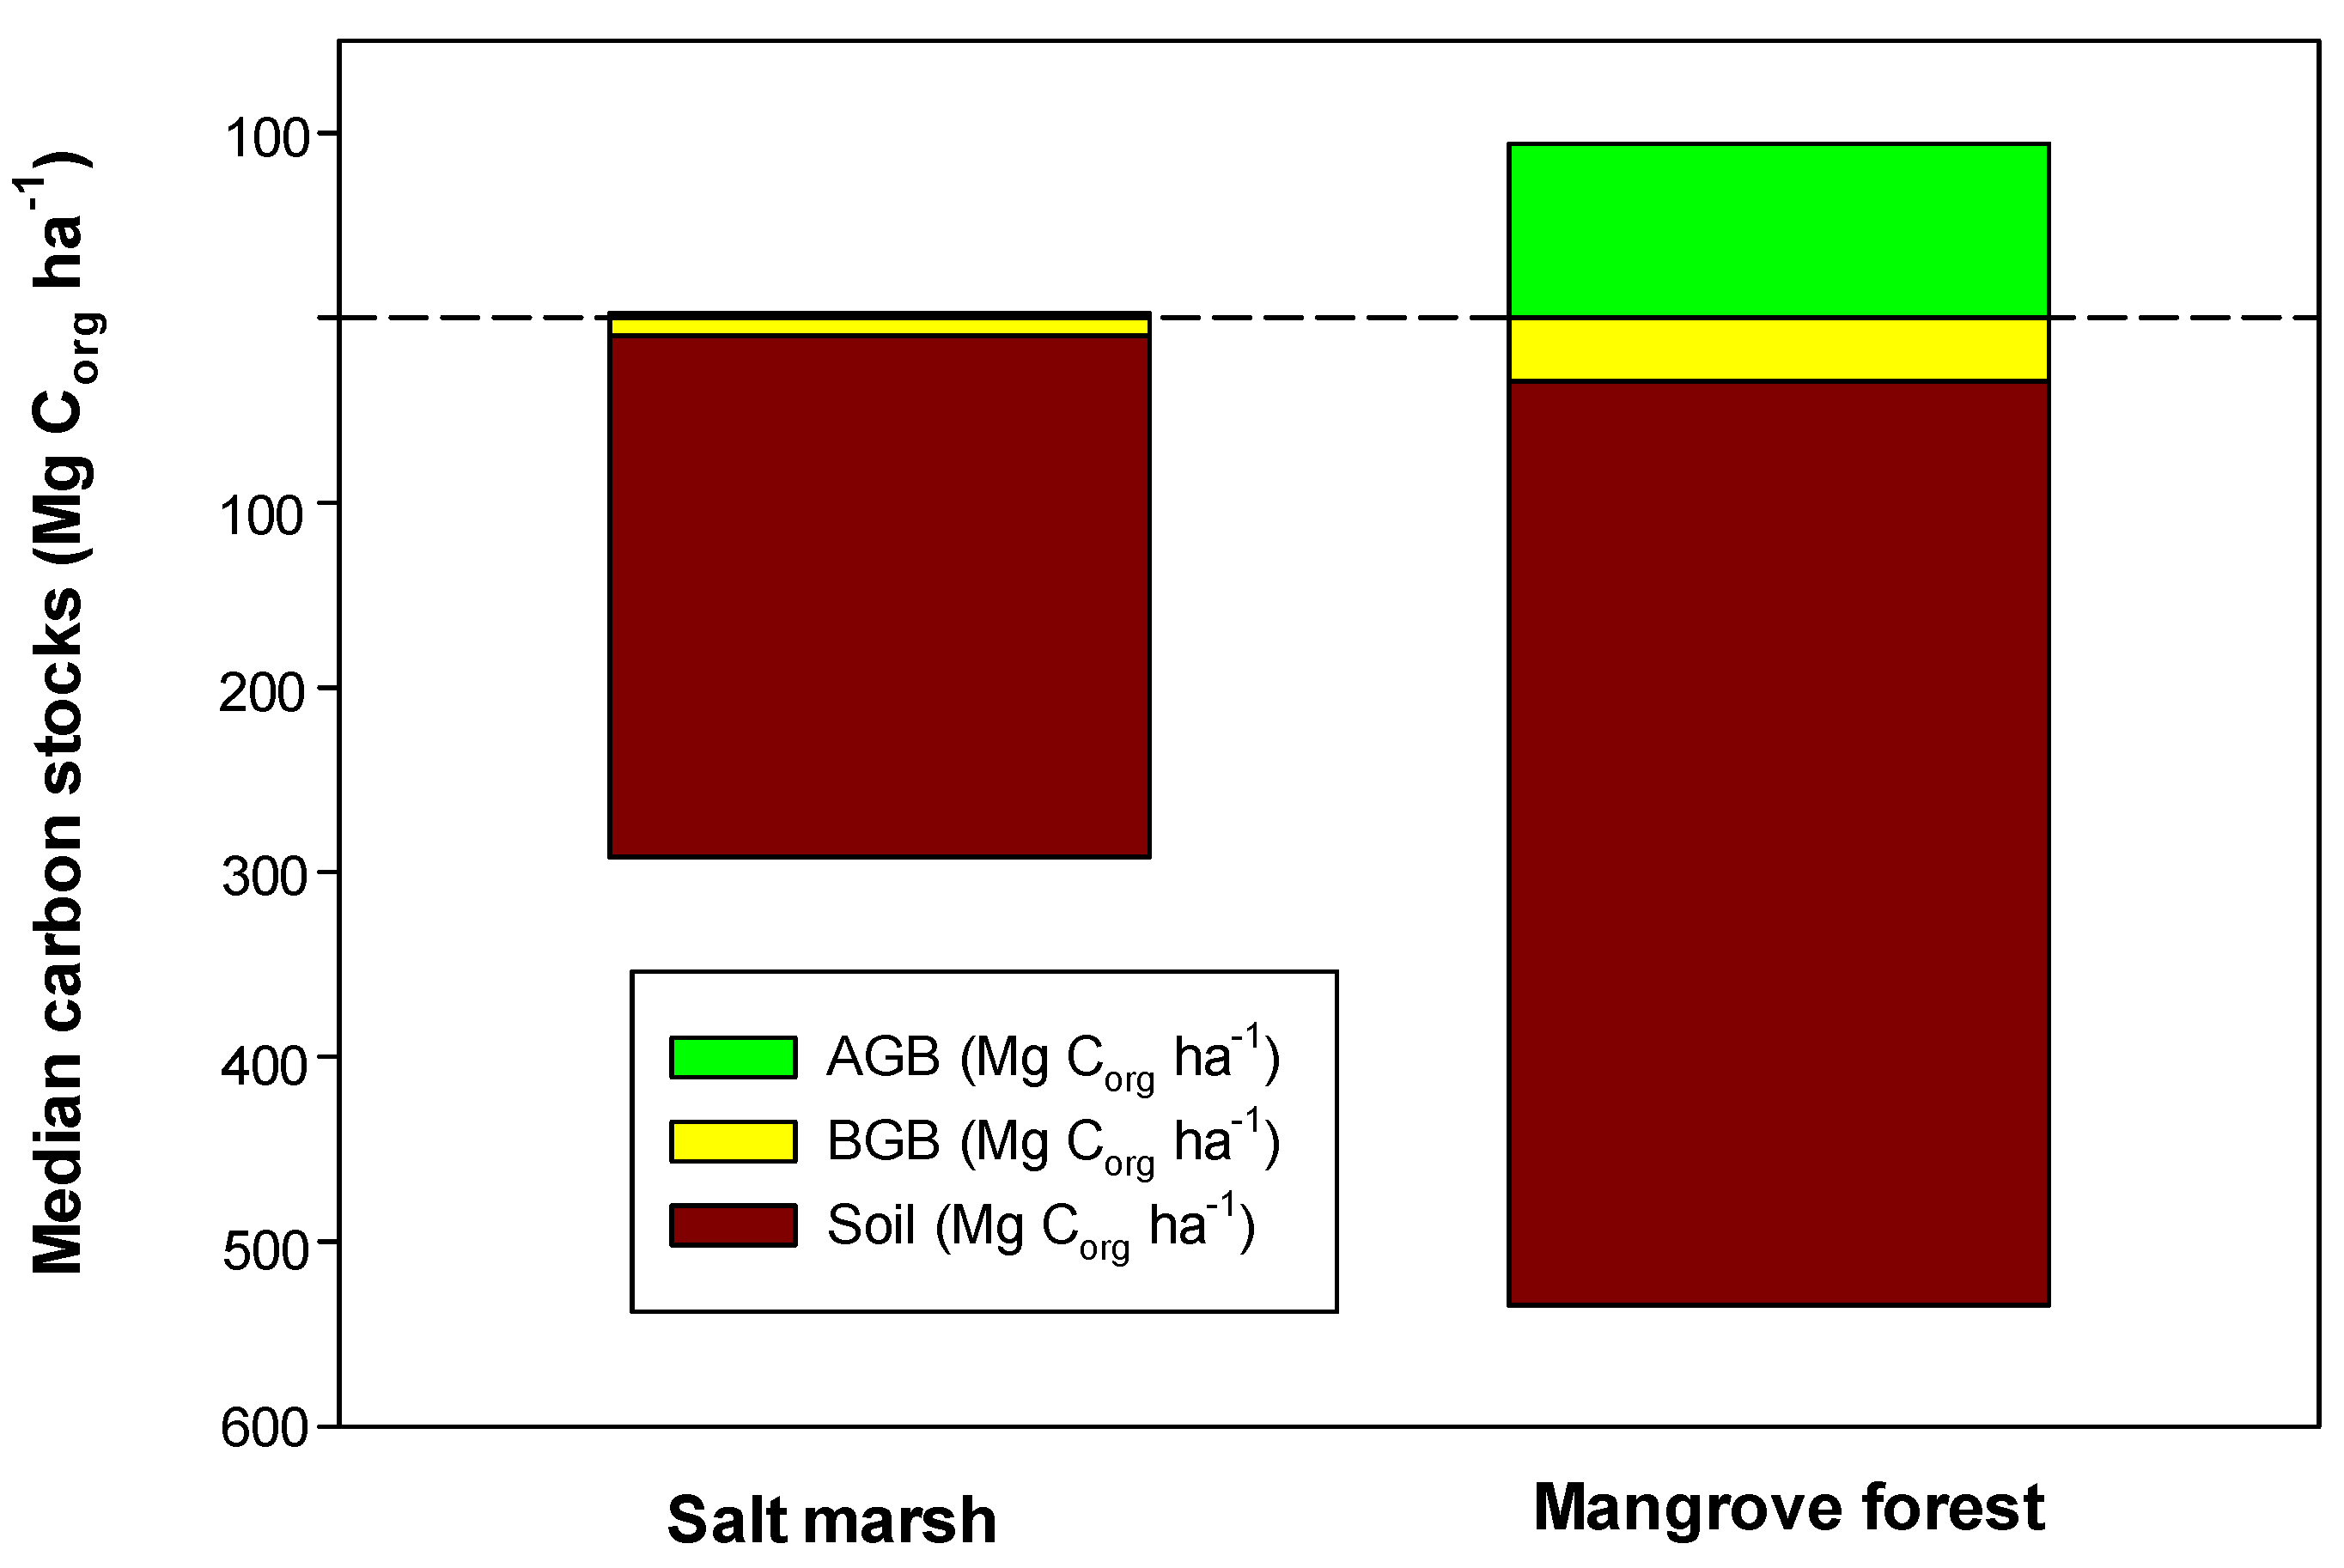
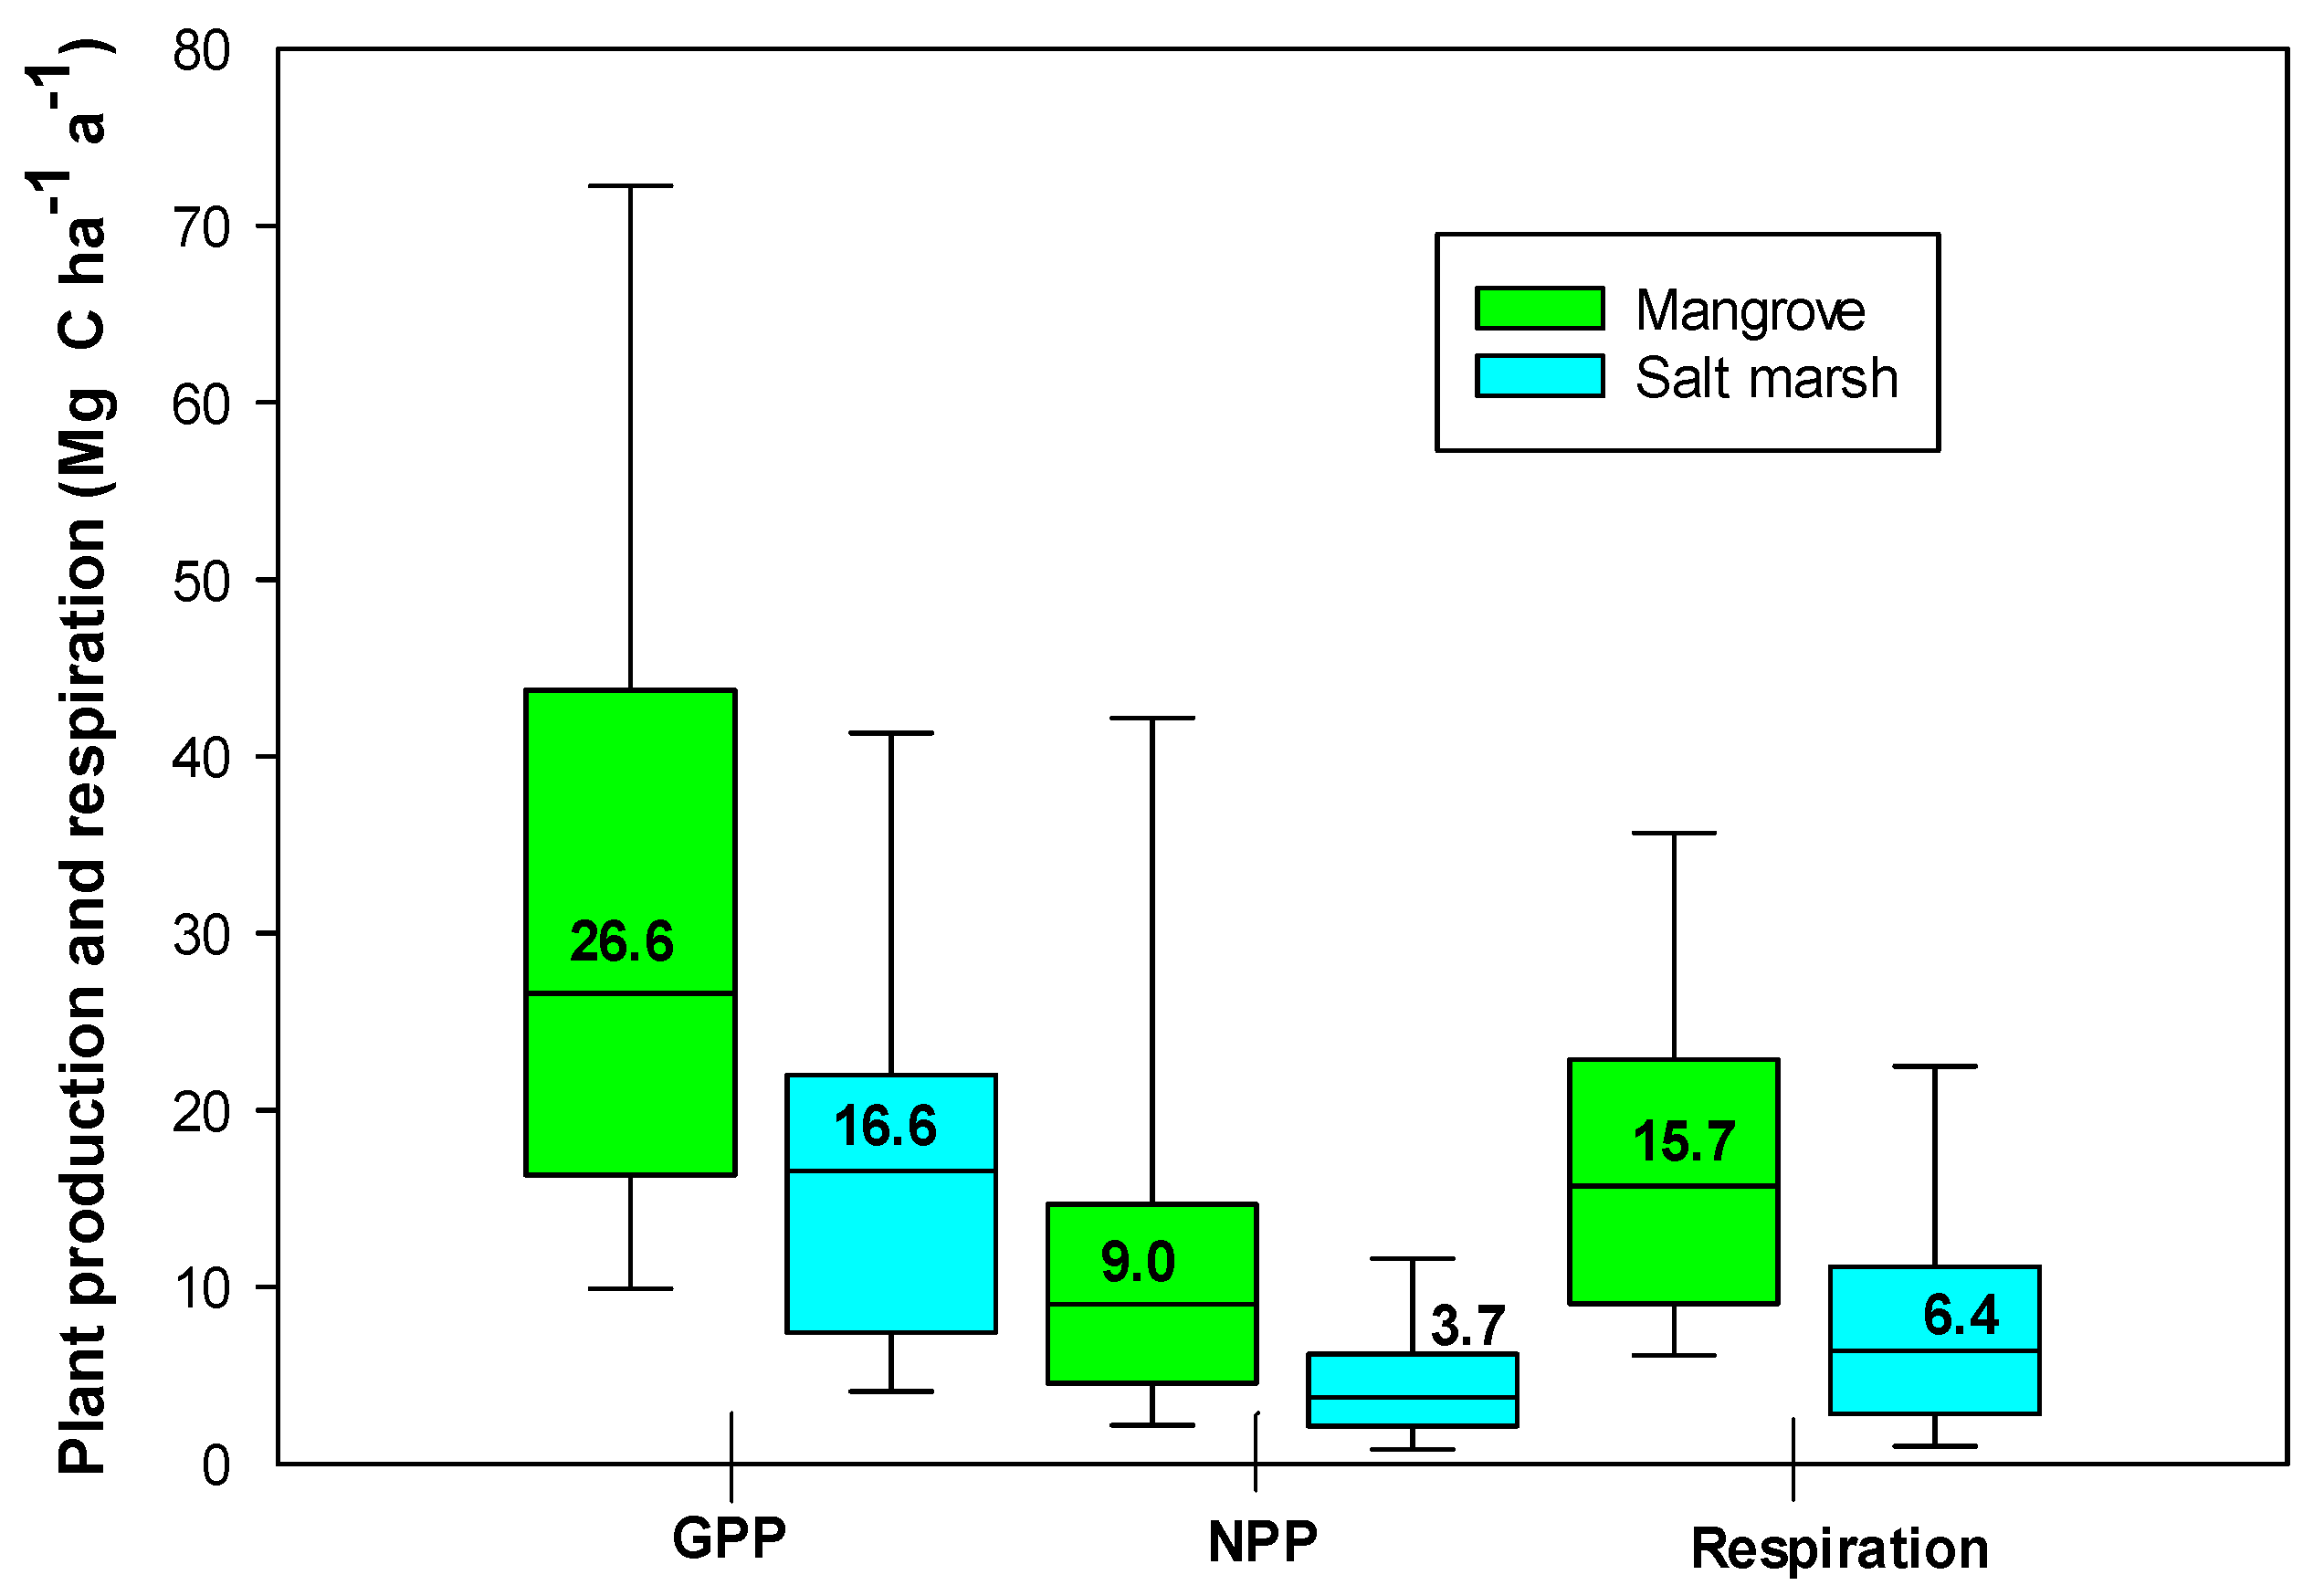
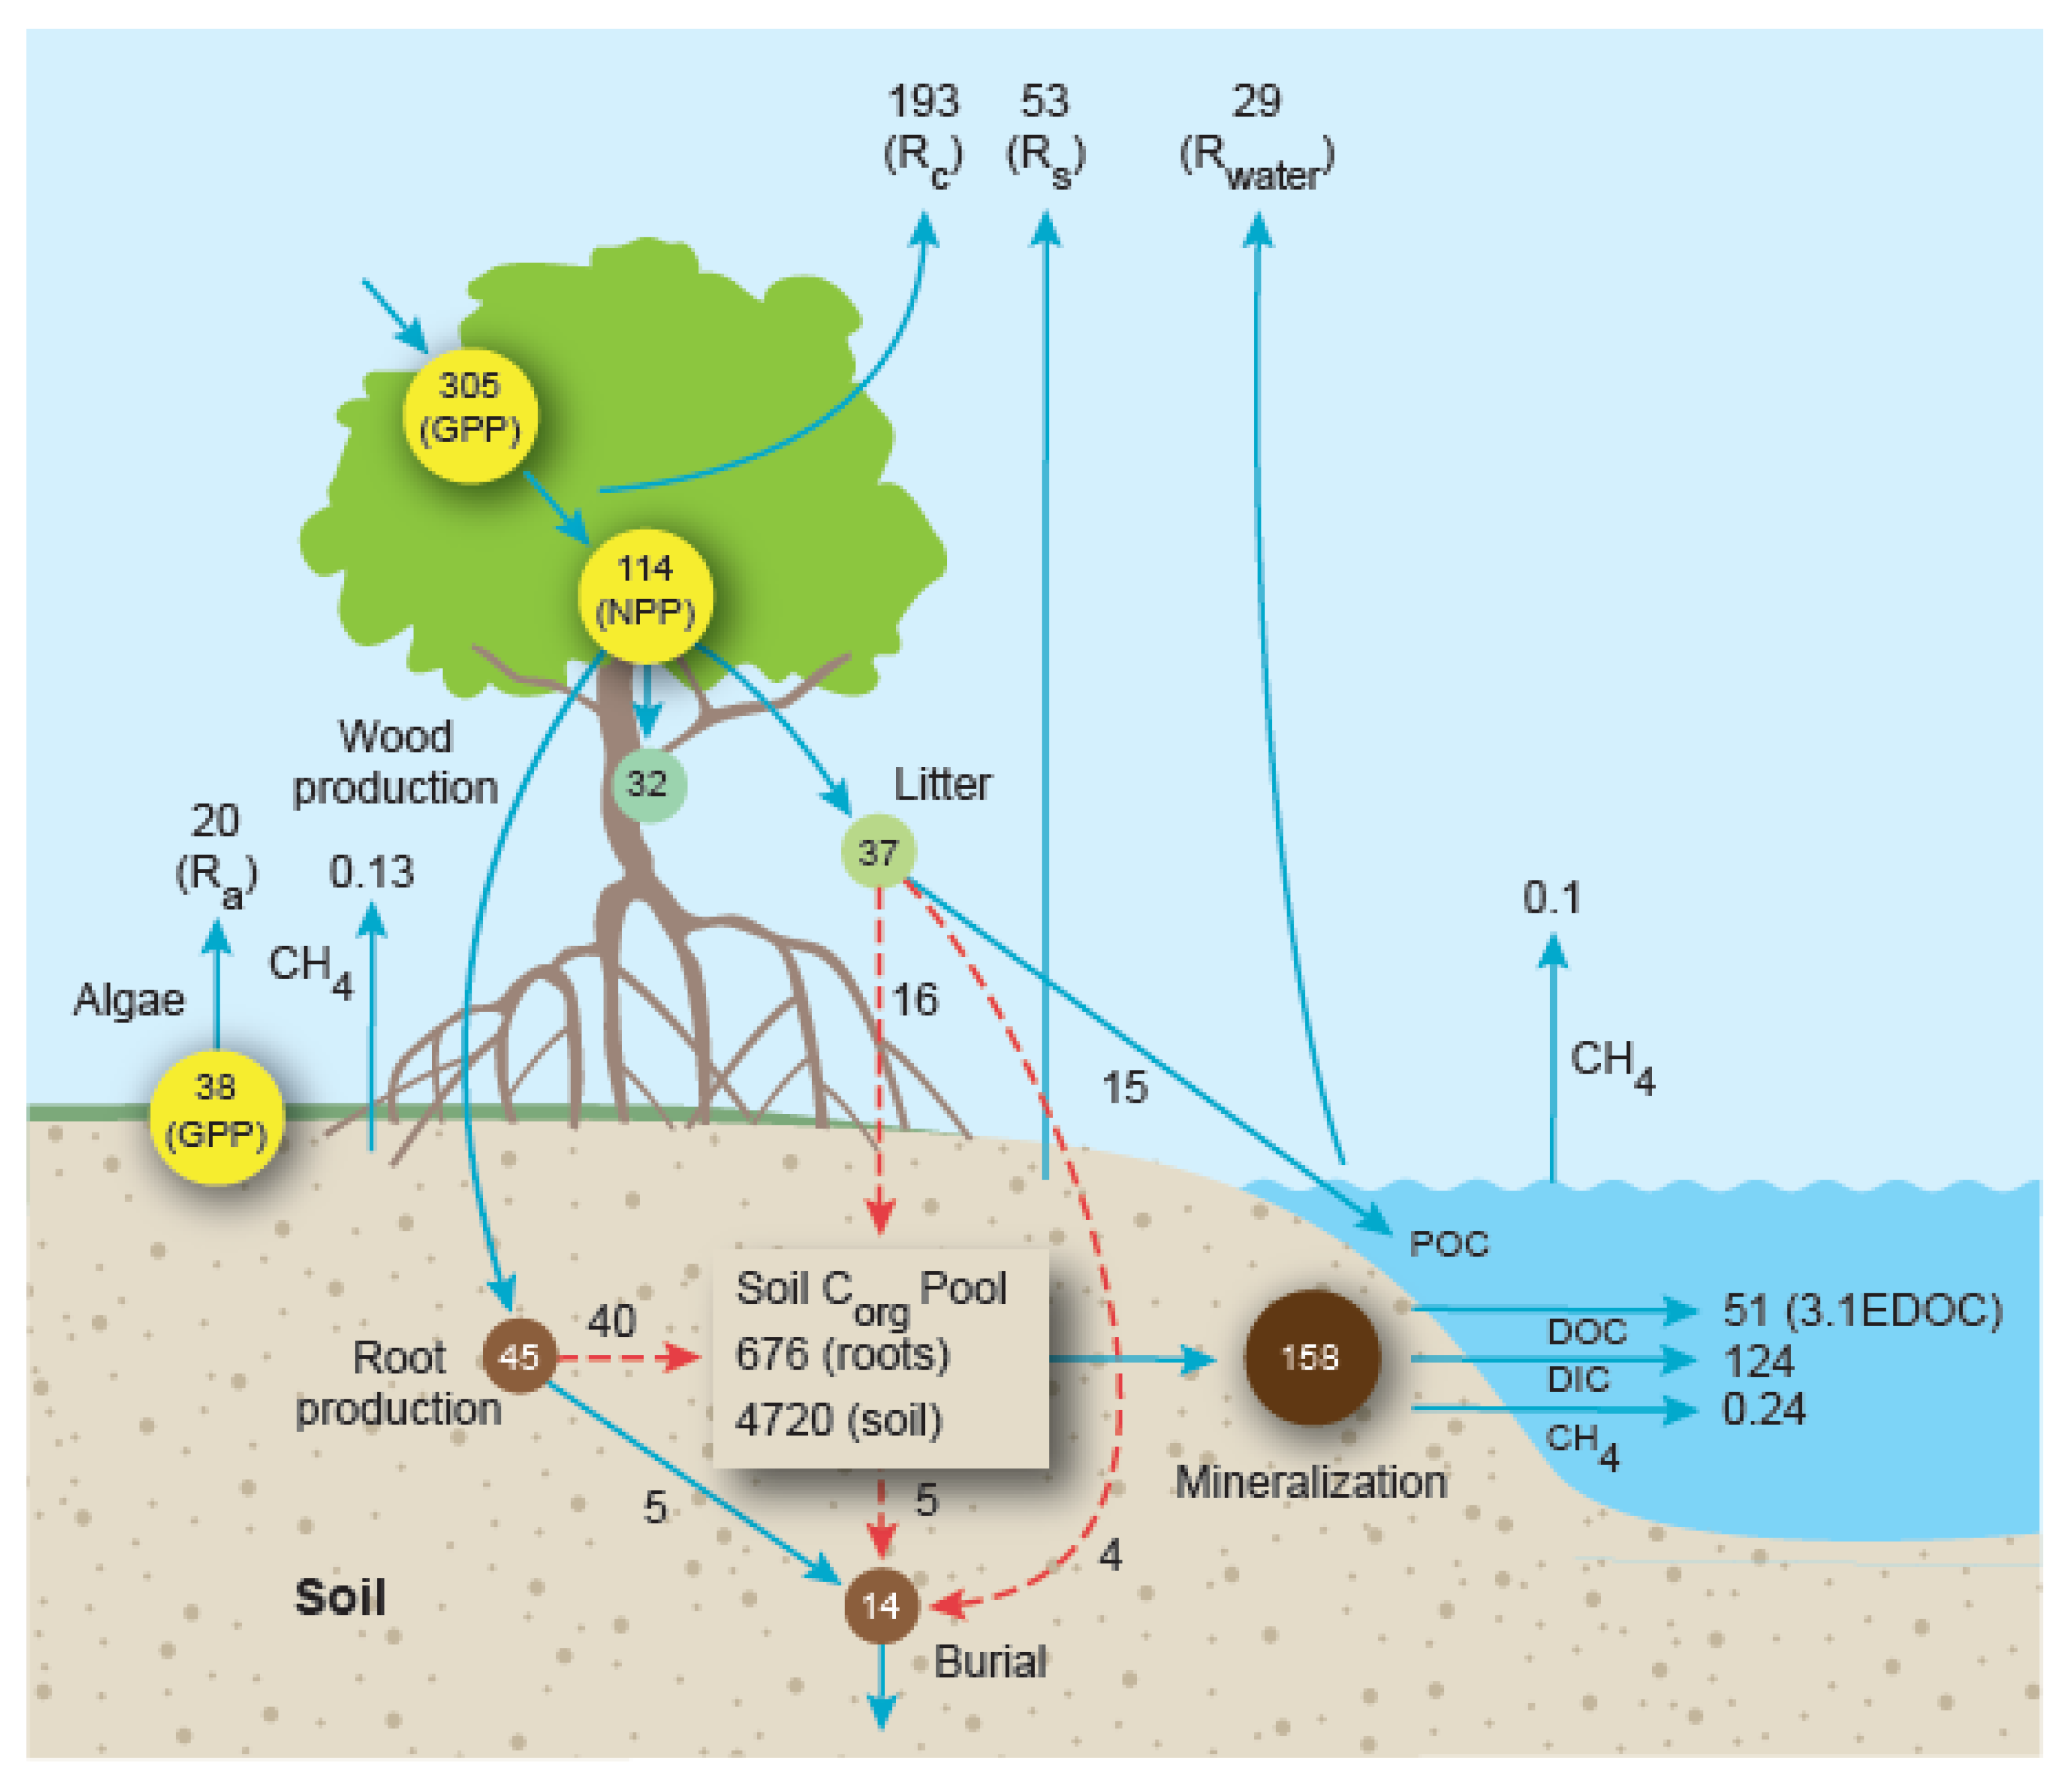
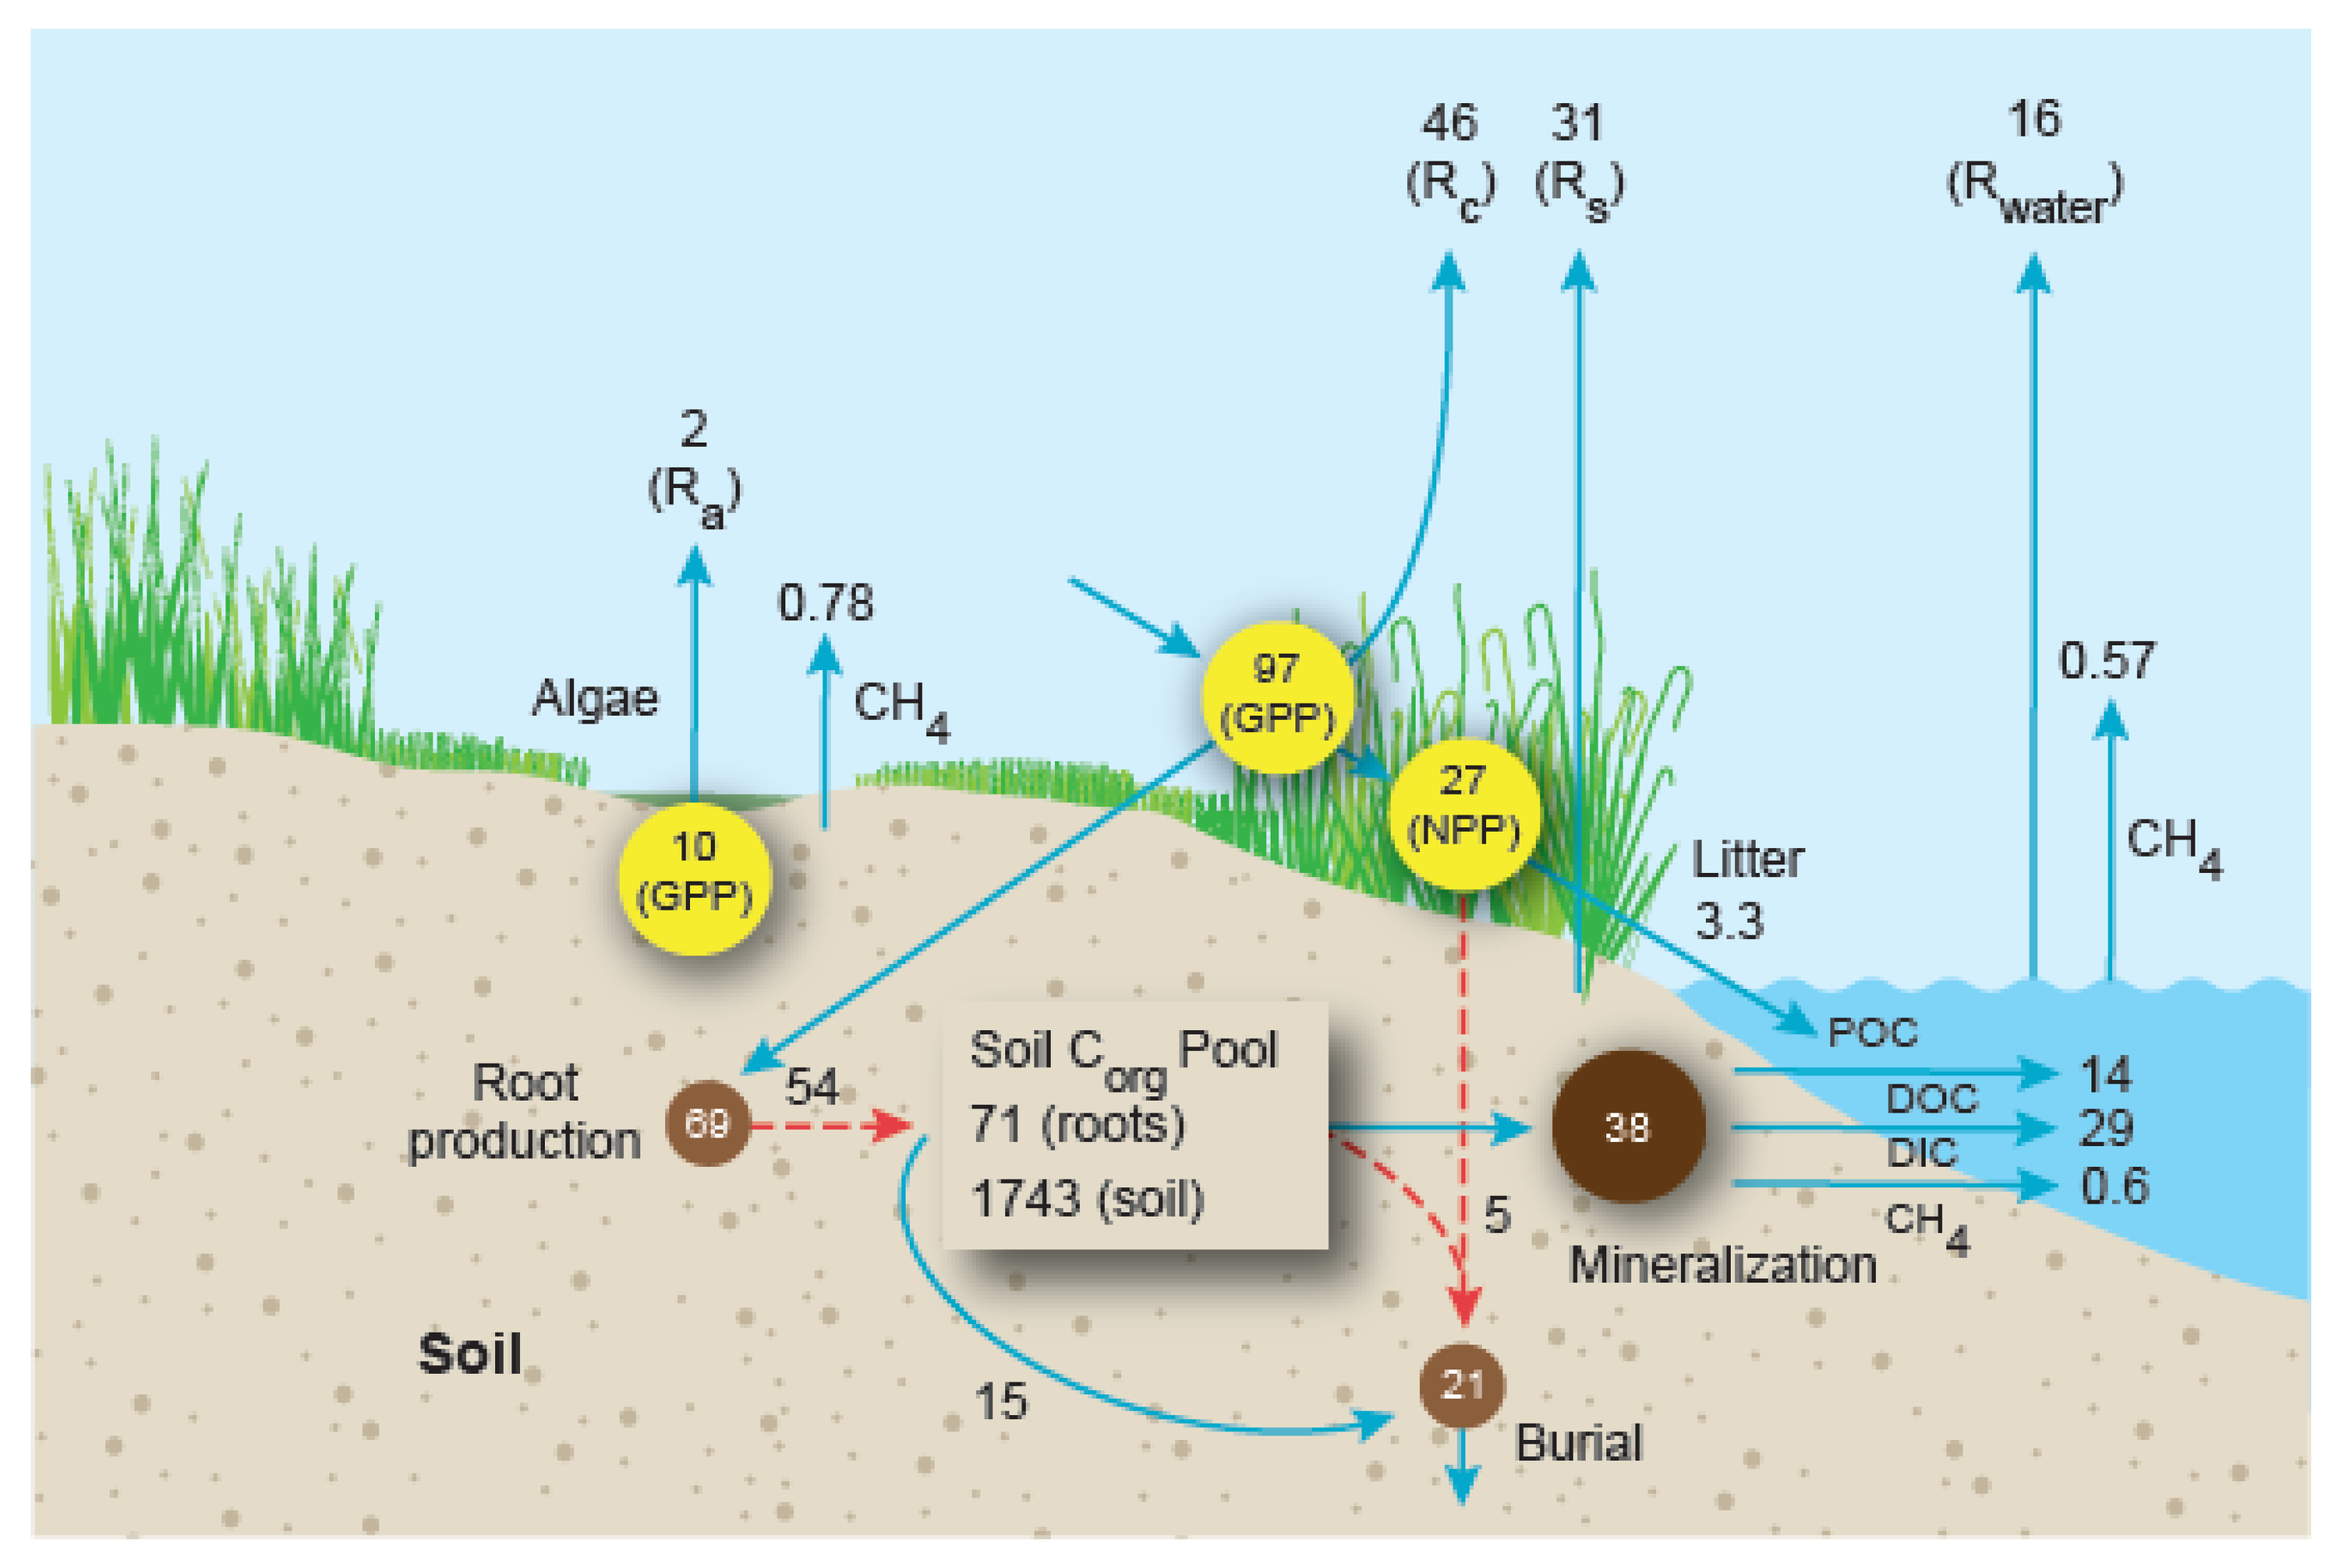
Table 1.
Comparison of mean (±1 standard error, SE) carbon stocks between salt marsh and mangrove ecosystems. Units = Mg CORG ha−1. Median values are in parentheses and in Figure 1. Mangrove data from [6]. Salt marsh g dry weight (DW) biomass was converted to g CORG using percent CORG content in roots + rhizomes (41.5 ± 1.2%) and shoots (38.5 ± 0.7%) of various species [7,8,9,10,11,12,13,14,15]. Salt marsh above- and below ground biomass data (from [16,17,18,19,20,21,22,23,24,25,26,27,28,29,30,31,32,33,34,35,36,37,38,39,40,41,42,43,44,45,46,47] and earlier references within). Global mangrove area (86,495 km2) from [48] and salt marsh global area (54,951 km2) from [49].
| Component | Mangrove Forests | Salt Marshes |
|---|---|---|
| Aboveground biomass (AGB) | 109.3 ± 5.0 (94.1) | 4.3 ± 0.10 (2.4) |
| Belowground biomass (BGB) | 80.9 ± 9.5 (34.2) | 12.9 ± 1.2 (9.6) |
| Soil (0–1 m depth) | 565.4 ± 25.7 (500.5) | 317.2 ± 19.1 (282.2) |
| Total C stock (Mg Corg ha−1) | 738.9 ± 27.9 (702.5) | 334.4 ± 3.5 (294.2) |
| Global area (km2) | 86,495 | 54,951 |
| Global C stock (Pg Corg) | 6.17 | 1.84 |
Table 2.
Comparison of mean (±1SE) GPP and above- and belowground net (NPP) primary production, canopy respiration (RC) and benthic microalgal GPP and NPP between salt marsh and mangrove ecosystems. Units = Mg CORG ha−1 a−1. Median values are in parentheses. Mangrove data from [6,52,53]. Salt marsh g dry weight (DW) production converted to g CORG using percent CORG content in roots + rhizomes (41.5 ± 1.2%) and shoots (38.5 ± 0.7%) of various species (references in Table 1). Salt marsh above- and belowground production data from ([54,55,56,57,58,59,60,61,62,63,64,65,66,67,68,69,70,71,72,73,74,75,76,77,78,79,80,81,82,83,84,85] and earlier references within) and microalgal production data from [86,87,88,89,90,91,92,93].
| Component | Mangrove Forests | Salt Marshes |
|---|---|---|
| GPP | 35.3 ± 6.0 (26.6) | 17.7 ± 1.9 (16.6) |
| Aboveground NPP | 13.2 ± 1.7 (9.0) | 5.0 ± 0.3 (3.7) |
| Belowground NPP | 5.2 ± 4.4 (5.1) | 12.6 ± 1.1 (9.4) |
| RC | 22.3 ± 4.9 (15.7) | 8.4 ± 1.2 (6.4) |
| Microalgal GPP | 4.4 ± 2.2 (3.3) | 1.8 ± 0.8 (1.3) |
| Microalgal NPP | 2.1 ± 0.7 (1.8) | 1.5 ± 0.2 (1.1) |
| PGPP/RC | 1.6 ± 0.1 (1.5) | 1.0 ± 1.3 (1.0) |
Table 3.
Comparison of mean (±1SE) rates of soil respiration, dissolved inorganic carbon (DIC) production (to a depth of 1 m), CH4 release and Corg burial between mangrove and salt marsh ecosystems. Units = Mg C ha−1 a−1. Soil respiration data averages measurements taken at the soil surface during air exposure and tidal inundation and includes both gas (O2 and CO2) and solute (dissolved oxygen (DO) and DIC) measurements together for salt marshes and separately for mangroves. Mangrove oxygen and carbon fluxes are kept separate because of significant differences [94]. Median values are in parentheses. Mangrove data from [94]. Burial rates for both ecosystems from [4]. Salt marsh data from [56,58,76,95,96,97,98,99,100,101,102,103,104,105,106,107,108,109,110,111,112,113,114,115,116,117,118,119,120,121,122,123,124,125,126,127,128,129,130,131,132,133,134,135,136,137,138].
| Component | Mangrove Forests | Salt Marshes |
|---|---|---|
| Soil respiration | 6.13 ± 0.62 (DIC, CO2); 3.88 ± 0.29 (DO, O2) | 5.64 ± 0.63 (3.66) |
| Soil DIC production | 18.27 ± 2.30 (15.5) | 6.92 ± 1.61 (3.8) |
| Soil CH4 release | 0.015 ± 0.006 (0.004) | 0.142 ± 0.02 (0.07) |
| Corg burial | 1.62 ± 0.67 (1.33) | 3.82 ± 0.58 (1.84) |
Table 4.
Comparison of mean (±1SE) rates of water–air CO2 and CH4 emissions between mangrove and salt marsh ecosystems, including open water estuaries containing mangrove and salt marsh habitats. Units = Mg C ha−1 a−1. Median values are in parentheses. Mangrove data from [94,139]. Salt marsh data from [139,140,141,142,143,144,145,146,147,148,149,150,151,152] and references within.
| Component | Mangrove Forests | Salt Marshes |
|---|---|---|
| Water-air CO2 release | 3.35 ± 0.35 (2.19) | 2.981 ± 0.33 (1.55) |
| Water-air CH4 release | 0.0116 ± 0.003 (0.01) | 0.104 ± 0.047 (0.006) |
Table 5.
Comparison of mean (±1SE) rates of particulate organic carbon (POC), dissolved organic carbon (DOC), DIC and CH4 export from mangrove and salt marsh ecosystems to adjacent tidal waters. Units = Mg C ha−1 a−1. Median values are in parentheses. Mangrove data from [52,94,153,154,155,156,157,158]. Salt marsh data from [75,91,140,144,159,160,161,162,163,164,165,166,167,168,169,170,171,172,173,174,175,176,177,178,179,180,181,182,183,184,185,186,187].
| Export Component | Mangrove Forests | Salt Marshes |
|---|---|---|
| POC | 1.73 ± 0.23 (1.76) | 0.60 ± 0.11 (0.31) |
| DOC | 5.90 ± 1.95 (1.43) | 2.55 ± 0.55 (1.33) |
| DIC | 14.34 ± 2.26 (10.82) | 5.28 ± 1.212 (3.995) |
| CH4 | 0.0277 ± 0.0135 (0.026) | 0.109 ± 0.0786 (0.0081) |
Table 6.
Contribution of salt marshes and mangroves to carbon balance in the global coastal ocean compared with other marine ecosystems. Global seagrass area from [195], macroalgae area from [196] and area of other ecosystems from [188], except the global coastal ocean [194], which encompasses estuaries, other wetlands, and continental shelves. Seagrass data [188] updated from [197,198,199,200,201,202,203,204,205,206,207,208,209,210] and macroalgae data from [211,212,213,214,215,216,217,218,219,220,221,222,223,224,225,226,227,228,229,230,231,232,233,234,235,236]. Plankton GPP and R in salt marshes from [237] and in mangroves from [52]. All other data from [188], except global coastal ocean data from [194]. Percentage contributions of salt marsh and mangrove NEP are based on comparison with sum of all ecosystem NEP plus the negative global coastal ocean NEP (= 2217 Tg C a−1). Percentage contributions of salt marsh and mangrove RC and GPP are based on comparison only with global coastal ocean RE and GPP. Abbreviations and units: RE (g C m−2 a−1) = ecosystem respiration (RC + RS+ RWATER + RMICROALGAE); GPP (g C m−2 a−1) = gross primary production; NEP (g C m−2 a−1) = net ecosystem production. Units = area (1010 m2); global RE, global GPP and global NEP (Tg C a−1)
| Ecosystem | Area | RE | Global RE | GPP | Global GPP | Mean PGPP/RE | NEP | Global NEP |
|---|---|---|---|---|---|---|---|---|
| Salt marsh | 5.5 | 1727 | 95 | 2109 | 116 | 1.22 | 382 | 21 |
| Mangrove | 8.6 | 3558 | 306 | 4186 | 360 | 1.18 | 628 | 54 |
| Seagrass | 16.0 | 2133 | 342 | 2752 | 441 | 1.29 | 619 | 99 |
| Macroalgae | 354.0 | 1572 | 5565 | 2159 | 7643 | 1.37 | 587 | 2078 |
| Coral reef | 60.0 | 1572 | 943 | 1720 | 1032 | 1.09 | 148 | 84 |
| Global coastal ocean | 2750 | 1034 | 28,435 | 1028 | 28,270 | 0.98 | −6 | −165 |
| Salt marsh contribution | 0.20% | - | 0.33% | - | 0.47% | - | - | 1.0% |
| Mangrove contribution | 0.31% | - | 1.08% | - | 1.27% | - | - | 2.4% |
© 2020 by the author. Licensee MDPI, Basel, Switzerland. This article is an open access article distributed under the terms and conditions of the Creative Commons Attribution (CC BY) license (http://creativecommons.org/licenses/by/4.0/).
Share and Cite
MDPI and ACS Style
Alongi, D.M. Carbon Balance in Salt Marsh and Mangrove Ecosystems: A Global Synthesis. J. Mar. Sci. Eng. 2020, 8, 767. https://0-doi-org.brum.beds.ac.uk/10.3390/jmse8100767
AMA Style
Alongi DM. Carbon Balance in Salt Marsh and Mangrove Ecosystems: A Global Synthesis. Journal of Marine Science and Engineering. 2020; 8(10):767. https://0-doi-org.brum.beds.ac.uk/10.3390/jmse8100767
Chicago/Turabian StyleAlongi, Daniel M. 2020. "Carbon Balance in Salt Marsh and Mangrove Ecosystems: A Global Synthesis" Journal of Marine Science and Engineering 8, no. 10: 767. https://0-doi-org.brum.beds.ac.uk/10.3390/jmse8100767
Note that from the first issue of 2016, this journal uses article numbers instead of page numbers. See further details here.