
COVID-19 Vaccinations and the Volatility of Energy Companies in International Markets


1
Department of Business Administration, School of Social Sciences, Reykjavik University, Menntavegur 1, 102, 101 Reykjavík, Iceland
2
Department of Banking and Finance, Southampton Business School, Highfield Campus, University of Southampton, Southampton SO17 1BJ, UK
3
Montpellier Business School, 34185 Montpellier, France
4
Department of Investment and Financial Markets, Institute of Finance, Poznan University of Economics and Business, 61-875 Poznan, Poland
*
Author to whom correspondence should be addressed.
J. Risk Financial Manag. 2021, 14(12), 611; https://0-doi-org.brum.beds.ac.uk/10.3390/jrfm14120611
Submission received: 3 November 2021
/
Revised: 9 December 2021
/
Accepted: 10 December 2021
/
Published: 17 December 2021
(This article belongs to the Special Issue The Impact of COVID-19 on Economy, Energy, and Environment)
Abstract
:The COVID-19 pandemic has elevated both the risk and volatility of energy companies. Can mass vaccinations restore stability within this sector? To answer this question, we investigate stock market data from fifty-eight countries from January 2020 to April 2021. We document that vaccination programs assist in decreasing the volatility of energy stocks around the world. The drop in volatility is statistically and economically significant and robust to many considerations. The observed phenomenon survives a broad battery of control variables; it is also independent of the employed regression model or the volatility measurement approach. Moreover, the effect is not driven by the dynamics of the pandemic itself or the associated government interventions. Finally, we find the influence of vaccinations on energy stock volatility to be more pronounced in developed markets rather than in emerging ones. Our findings bear clear practical implications: policy makers around the world should consider the essential role of vaccinations in the energy sector.
1. Introduction
Hardly any other asset class was hit as hard by the COVID-19 pandemic as commodities. Driven by the worries of evaporating demand, commodity prices fell by more than 40 percent during the first quarter of 2020 (as measured with the S&P GSCI Commodity Index). This effect was particularly driven by falling energy prices, which reflected the dramatic disruptions in global transportation and worries about future economic growth. Specifically, the collapse of the demand for crude oil and the swelling of crude oil inventories, coupled with limited access to storage capacity in the U.S., forced oil prices to crash into a negative territory for the first time in history. This was then followed by a similar dramatic move of energy companies’ stock prices. For instance, by March 2020, the MSCI World Energy Index dropped by nearly 60 percent, marking the largest quarterly drop in the index’s history. Although the later cycles of containment and closure policies helped to make up for the losses, the elevated volatility did not immediately disappear. The recent advancement of available vaccines has offered some optimism about the return of long-term stability. Can the vaccination programs help to reduce the volatility of energy stocks structurally? The principal aim of this paper is to answer this question.
Volatility is a key element within financial markets. It is associated with fear, stress, uncertainty, and risks associated with both equity and commodity investments alike. Not astonishingly, it is closely followed by energy producers and consumers, as well as by policymakers and financial investors with exposure to this asset class. It acts as an acid test for market efficiency and impacts the cost of capital. Furthermore, it may impair consumption patterns. Finally, commodity-related volatility can adversely affect economic growth by misallocating resources across countries, industries, and businesses.
Recent finance literature has documented a convincing link between the spread of the pandemic and elevated financial market volatility (Albulescu 2021; Bai et al. 2020; Engelhardt et al. 2021; Lyócsa et al. 2020; Zaremba et al. 2020). This impact may be particularly pronounced in the energy companies that hang on both global transportation and expected economic activity. The volatility may be transmitted through several channels. First, an abrupt drop in the demand for crude oil provoked, in March 2020, a sharp rise in fuel storage rates and lease costs by as much as 50–100%, as traders sought to secure tanks to park unwanted volumes of commodities (Sharafedin et al. 2020). Leasing additional storage facilities at a higher cost can trigger an increase in debt, and, subsequently, financial leverage. Following Schwert (1989), more leveraged firms carry higher risk, resulting in higher stock volatility.
Second, the pandemic radically amplified economic uncertainty (Baker et al. 2020; Caggiano et al. 2020; Sharif et al. 2020); this, in turn, translates into higher volatility (Corradi et al. 2013; Dzielinski 2012; Liu and Zhang 2015; Mei and Guo 2004; Su et al. 2019). Third, the COVID-19 crisis raises the chances of unexpected and novel government policies; these policies could either support economic growth or halt it through containment and closure regulations. While the outcomes of such actions can be either positive or negative, their nature cannot be fully predicted in advance. Consequently, we may observe a dynamic repricing of asset prices (Pastor and Veronesi 2012).
Fourth, the pandemic creates unprecedented demand- and supply-side shocks (del Rio-Chanona et al. 2020), resulting in a sharp contraction of economic activity. Mortality, morbidity due to the pandemic, and the need to care for affected family members can cause a reduced labor supply (McKibbin and Fernando 2021). Government interventions, such as border closures, partial or full curfews, workplace closures, and social distancing measures, lead to a higher supply shock than the direct effects of mortality and morbidity (del Rio-Chanona et al. 2020). Moreover, the disruption of global supply chains also causes supply shocks. Of course, policy responses to slow the spread of COVID-19 also lead to substantial negative demand shocks for many industries, while there is also a positive demand shock from those interventions to some industries. For example, food services and drinking places experience major negative supply and demand shocks, while food and beverage stores have a positive demand shock (Brinca et al. 2021). The energy market experiences a unique combination of demand- and supply-side shocks (Rajput et al. 2021). Those shocks affect energy consumption, disturbing their price stability.
Fifth, financial investors with exposure to both energy stocks and commodities may turn to safe assets during a hostile market environment, triggering even “flight to safety” effects (Baele et al. 2020). This, in turn, may cause further abrupt fund flows and asset repricing. This phenomenon is also associated with news-implied volatility, resulting from the constant flow of policy-related news. Last, a divergence of opinions of energy market participants, both in commodity and equity markets, may affect trading activity (Harris and Raviv 1993; Banerjee 2011) and—indirectly—price stability alike (Foucault et al. 2011).
Notably, all of the processes that are outlined above may be, at least, partly reversed or alleviated by the arrival of the vaccines. Mass vaccination programs help to build herd immunity, minimizing the risk of uncontrolled outbreaks of the pandemic and unexpected infection waves. The influence on the fatalities cannot be underestimated. Therefore, the ultimate consequence of vaccination programs is less economic uncertainty, a decreased risk of unexpected government policy changes, and—eventually—more stability in financial markets. Furthermore, given the extraordinary impact of the pandemic on the commodity demand and supply environment, this effect may be particularly pronounced in commodity markets.
Interestingly, vaccinations may also lead to opposite changes. Importantly, widespread and successful vaccination programs should be accompanied by a global improvement in sentiment among business and—the closely correlated—investors (Jansen and Nahuis 2003; Otoo 1999). Meanwhile, it has been documented that positive sentiment may augment the market volatility by attracting more retail investors and intensifying trading activity (Brown 1999; Kumari and Mahakud 2015; Wang et al. 2006). In times of widespread access to the diverse commodity of exchange-traded funds, this may affect both equity and commodity markets. Hence, the ultimate impact that vaccinations have on the volatility of energy stocks may be ambiguous.
In order to investigate the impact of vaccinations on the volatility of companies from the energy sector, we examine data from fifty-eight stock markets around the world throughout the global COVID-19 pandemic, spanning from January 2020 to April 2021. We use a comprehensive international dataset covering vaccinations, infections, cases, and the associated government policy responses. We employ panel regressions to scrutinize the relationship between various measures of vaccinations and the volatility of the energy sectors around the world.
The principal findings of the study can be summarized as follows. The mass vaccination programs lead to a substantial decrease in the volatility of energy stocks around the world. This drop in volatility is both statistically and economically significant and is robust to many considerations. The observed phenomenon survives a broad battery of control variables; it is also independent of the employed regression model or the volatility measurement approach. Moreover, the effect is not driven by the dynamics of the pandemic itself or the associated government interventions. Furthermore, the stabilizing effect of the vaccines is relatively more pronounced in developed markets than in emerging ones.
Our study adds to three main strands of research. First, we extend the explorations of the interplay between the pandemic and the commodity sector. Earlier studies have focused on the impact of the pandemic itself and the associated government interventions on commodity prices, returns, volatility, and connectedness (Albulescu 2020; Atri et al. 2021; Wang and Su 2021; Norouzi et al. 2021; Iyke 2020; Fu and Shen 2020; González Maiz Jiménez et al. 2021; Hu et al. 2021; Saif-Alyousfi and Saha 2021; Shaikh 2021; Szczygielski et al. 2021; Adekoya and Oliyide 2021; Mensi et al. 2021; Bouri et al. 2020, 2021; Chien et al. 2021; Umar et al. 2021). Comparing these studies, we are the first to scrutinize the influence that vaccinations have on the volatility of energy companies.
Second, we contribute to the discussion on the role of vaccinations in financial markets. Earlier studies demonstrated that the arrival of the vaccines (or even successful trials) had benefited stock prices around the world (Kucher et al. 2021; Chan et al. 2021; Acharya et al. 2020) and helped to stabilize the financial markets (Hong et al. 2021; Demir et al. 2021; Rouatbi et al. 2021). Although the pandemic exerted an unprecedented impact on commodities, to the best of our knowledge, the effect of vaccinations on the volatility of commodity companies has not yet been explored.
Third, our study contributes to a body of research that examines the factors of stock and commodity market volatility, emphasizing its time-varying component (Schwert 1989; Lyócsa and Todorova 2021). Concretely, research within this field shows that stock market volatility follows a countercyclical behavior akin to the variation over time in key macroeconomic variables (Corradi et al. 2013). For instance, Adrian and Rosenberg (2008) and Engle and Rangel (2008) decompose stock market volatility into short -and long-run components; they document that the long-run component is related to the business cycle, whereas the short-run component is driven by the tightness of financial constraints. However, Campbell and Cochrane (1999) assert that the volatility of stock prices cannot be explained by changing expectations of future dividends or interest rates; rather, it is determined by external habit formation. Stock market volatility has also been explored in consumption-based asset pricing models without habit formation, albeit with subjective beliefs about price behavior, such as Adam et al. (2016). The authors find that, in this setting, agents learn adaptively and optimally from past price observations, but small deviations from rational expectations can drive stock price volatility through the ensuing “momentum” and “mean-reversion” effects on stock prices and returns. More generally, aggregate stock market volatility (and the volatility of oil and gas stocks), irrespective of whether it is driven by rational or irrational consumption or investment decisions, is demonstrated to respond negatively to a positive aggregate demand shock (Degiannakis et al. 2014). Since the rollout of vaccines can be thought of as a partial or complete reversal of a large negative aggregate demand shock caused by the COVID-19 pandemic, it should assist policymakers in steering the world economy towards economic recovery. This should also promote growth expectations in the energy sector and should subsequently command a material decline in the volatility of energy stocks.
2. Literature Review
Several recent related studies have explored the impact that the COVID-19 pandemic had on stock returns (Ashraf 2020a; Al-Awadhi et al. 2020; Mazur et al. 2021; Xu 2021), stock market volatility (Zaremba et al. 2020; Baek et al. 2020; Albulescu 2021), and stock market liquidity (Haroon and Rizvi 2020; Zaremba et al. 2021a). In addition to equities, further extensions are performed on other asset classes, such as gold (Mensi et al. 2020; Corbet et al. 2020a), cryptocurrencies (Demir et al. 2020; Conlon et al. 2020), exchange rates (Narayan 2021), bonds (Gubareva 2021; Zaremba et al. 2021b, 2021c), real estate prices (Ling et al. 2020; Milcheva 2021), and oil prices (Albulescu 2020; Atri et al. 2021). Governments impose various policy responses in order to flatten the curve and to stop or limit the transmission of the virus; consequently, these stringency measures affect the financial markets (Ashraf 2020b; Kizys et al. 2021; Baig et al. 2021). While financial markets are severely hit by the pandemic outbreak, the effect is found to be heterogeneous across equity markets. Some firms and equity indices are less affected, and the studies explore which factors can provide immunity at either the firm level (Ramelli and Wagner 2020; Ding et al. 2021; Broadstock et al. 2021; Kaczmarek et al. 2021; Valls Martínez and Martín Cervantes 2021) or the country-level (Erdem 2020; Fernandez-Perez et al. 2021; Zaremba et al. 2021d).
2.1. The Novel Coronavirus, Energy Demand, and Energy Prices
After the outbreak of COVID-19, financial markets have become highly volatile; furthermore, energy prices have dropped considerably. Government interventions, such as domestic travel restrictions and border closures aiming to flatten the curve, immediately impacted the demand for energy resources—especially oil (Atri et al. 2021). A historic crash occurred in April 2020, when the price of oil became negative. In this regard, various research streams have emerged to explore the effects that COVID-19 has had on energy markets (Shaikh 2021).
In this vein, several studies explore how COVID-19 affects energy consumption and prices. Albulescu (2020) and Atri et al. (2021) provide evidence that confirmed COVID-19 cases harm international oil prices. Wang and Su (2021) analyze the asymmetric relationship between COVID-19 and fossil energy (oil, gas, and coal) prices. The volatility of COVID-19 cases affects oil and natural gas prices only in higher quantiles, while no effect is documented for the coal market. Abadie (2021) develops a model to predict the future wholesale electricity and natural gas markets in Spain, which experienced early severe effects of the COVID-19 pandemic outbreak. The author shows that there is a significant difference between expected prices and actual prices in 2020 due to the COVID-19 pandemic. Moreover, the decline in wholesale market prices was particularly high over the May-to-June 2020 period. Likewise, Norouzi et al. (2021) focus on electricity prices in Spain. The number of COVID-19 cases and deaths negatively influences electricity prices. While periods of declining prices have higher volatility, growing price periods tend to experience lower volatility.
Rath and Akram (2020) perform a similar analysis for the spot electricity prices in five Indian regions. There is a uni-directional causality from COVID-19 to the electricity price in the early stages of the pandemic, due to demand- and supply-side shocks. Smith et al. (2021) forecast the fossil fuel consumption dynamics based on different scenarios in the pandemic period. It is predicted that the recovery of the energy consumption of advanced economies will be slow, while a rapid recovery of energy consumption is expected for the emerging economies. A decrease in energy consumption during the pandemic is also documented by Ghiani et al. (2020) for Italy; Iqbal et al. (2021) for Pakistan; and Hartono et al. (2021) for Indonesia.
2.2. COVID-19 and the Stock Returns of Energy Companies
The effect that COVID-19 has on the stock prices of energy companies is extensively studied. Iyke (2020) explores the reaction of U.S. oil and gas firms to COVID-19, proxied by the total number of deaths per million people. It is found that the pandemic can explain 28 percent and 27 percent of the returns and volatility, respectively. Fu and Shen (2020) focus on the performance of China’s energy companies during the pandemic period. It is shown that the pandemic hurts the stock returns of those companies, whereas the energy companies that are without goodwill impairments are immune to the pandemic. Bouri et al. (2020) show that the daily newspaper uncertainty associated with infectious diseases affects oil market volatility.
Hu et al. (2021) examine the impact of various government responses against COVID-19 on the stock prices of thirty energy companies. Government responses, namely the stringency index, containment and health index, and economic support index, negatively impact energy companies’ stock returns. As governments become more stringent, the stock prices of energy companies are likely to decrease. The magnitude of the impact of both the containment and health index is found to be the highest. Likewise, Saif-Alyousfi and Saha (2021) consider the effect of different non-pharmaceutical interventions of governments on 104 energy indices’ returns by controlling for the impact of the pandemic. The impact of various non-pharmaceutical interventions is heterogeneous. For example, workplace closure and domestic travel limitations positively impact global energy returns, while cancellation of public events and public transport closures impose a negative effect.
Shehzad et al. (2021) compare the impact of COVID-19 on oil prices and the Dow Jones index in terms of returns and volatility. The negative impact is higher in magnitude on oil prices compared to the Dow Jones index. While the variance of both peaked at the highest historical levels in the pandemic period, the variance of oil prices tends to be higher than that of the Dow Jones index. Szczygielski et al. (2021) develop a COVID-19-related uncertainty based on Google search trends and explore its effect on global energy indices. All energy indices’ returns are negatively affected by the COVID-19 uncertainty, which also triggers the volatility in most indices. Moreover, energy-exporting countries experience both larger decreases in returns and a higher volatility compared to oil-importing countries.
2.3. Connectedness between Energy Prices and Other Financial Assets during the Pandemic
A strand of this literature explores whether and how COVID-19 drives the connectedness between energy prices and other financial assets. Adekoya and Oliyide (2021) show that the spillover among the commodity and financial markets is higher in the early stages of the pandemic. Stock and oil markets are among the highest givers of shocks, while oil is the net receiver of the shock. Moreover, oil is found to be the highest net transmitter of shocks. Using a similar approach, Mensi et al. (2021) explore the spillovers and connectedness between oil, gold, and sectoral stock returns in China. Unlike Adekoya and Oliyide (2021), oil futures are found to be net receivers of spillovers. Bouri et al. (2021) use a broad class of assets—including crude oil—to explore the return connectedness, focusing on the role of the COVID-19 outbreak. They find that crude oil becomes the main shock transmitter after the pandemic outbreak, supporting Adekoya and Oliyide’s (2021) findings.
According to Chien et al. (2021), there is low co-movement between the oil market and stock market, foreign exchange market, and gold market within the pandemic period. However, Liu et al. (2020) show a negative relationship between oil returns and stock returns in the U.S. Corbet et al. (2020b) analyze the volatility spillovers and co-movements among energy companies; they focus on the period when the West Texas Intermediate (WTI) oil future prices were negative in April 2020. The dynamic correlations between energy-related companies and the WTI spike around the period of April 2020. The conditional correlations between energy-related companies and the WTI increase during the pandemic declaration of the World Health Organization.
Prabheesh et al. (2020) analyze the relationship between oil prices and stock markets within net oil-exporting countries during the pandemic period. They document a positive time-varying dependence between oil returns and stock returns during COVID-19. The pandemic intensifies the positive relationship between oil prices and stock markets. Umar et al. (2021) examine the connectedness between oil shocks and stock markets of major oil-producing countries. While there is a medium connectedness between stock markets and oil shocks, COVID-19 causes a remarkable spike in the connectedness. Maneejuk et al. (2021) follow a different approach and examine the time-varying correlation between COVID-19 shocks and different energy markets, namely natural gas, gas oil, heating oil, coal, and crude oil. It is found that the correlations become stronger after the outbreak of the pandemic. Finally, Jebabli et al. (2021) examine the volatility spillovers between stock and energy markets during the 2008 global financial crisis (GFC) and the recent pandemic. They demonstrate that all stock markets are net transmitters of volatility to energy markets during GFC, but the recent stock market behavior is less unequivocal.
In addition to the aforementioned streams of research, there also exist studies that analyze other energy market COVID-19-related topics. These include pandemic-related oil price risk (Wen et al. 2021), the oil price risk exposure of industries during COVID-19 (Akhtaruzzaman et al. 2020), the time–frequency relationship between COVID-19, oil prices, stock returns, and uncertainty measures (Sharif et al. 2020), oil market efficiency in the pandemic period (Gil-Alana and Monge 2020), bubble detection in oil prices (Gharib et al. 2021), and mitigating effects of short-selling bans (Gurrib et al. 2021).
2.4. Vaccines and Financial Markets
Although there is a vast amount of studies on the COVID-19 pandemic and the related government interventions, how mass vaccination can influence both the financial markets and energy markets is unexplored. Governments devote an enormous effort to supply vaccines and to vaccinate most of the population in order to achieve herd immunity. Rouatbi et al. (2021) explore the role of vaccination in stock market volatility by using data from sixty-six countries. They document a negative impact of vaccination on stock market volatility, even after controlling for both the pandemic itself and the government policy responses. This implies that mass vaccination can help to stabilize the financial markets. Moreover, this healing effect of vaccination on volatility is higher in developed markets than in emerging ones. A similar finding is documented by Demir et al. (2021) for the stock return volatility of global travel and leisure companies.
The reaction of financial and commodity markets to announcements about vaccine development is explored by Kucher et al. (2021). In this regard, the Johnson and Johnson, Moderna, Oxford-AstraZeneca, and Pfizer-BioNTech vaccines (among the approved vaccines in the European Union, United Kingdom, and the United States) are considered. The announcements affect stock returns of vaccine companies, both the U.S. and European stock markets, interest rates, transportation commodities, and commodity currencies. No effect is documented for stock markets in Asia and Australia. Chan et al. (2021) examine the stock market reactions to the human clinical trials of COVID-19 vaccine candidates. After controlling for both the pandemic itself and investor sentiment, they find a positive abnormal return in forty-nine countries on the first day of clinical trials. The stock market reaction becomes more vital for phase I and phase II of the human clinical trials of vaccine candidates. As vaccines progress to the later phases, the stock market impact tends to rise. In an earlier body of research, Donadelli et al. (2017) investigate the investor sentiment effect driven by WHO announcements regarding four dangerous infectious diseases (Ebola, Influenza A, Polio, and SARS) on the stock prices of U.S. pharmaceutical companies. They disentangle a positive (related to investor beliefs of the development of future medicines and vaccines) and negative (fear of dangerous infectious diseases) effects of disease-related news.
Acharya et al. (2020) construct an asset-pricing framework to forecast the value of medicine by developing a novel vaccine progress indicator. If the expected time to vaccine development decreases by a year, it is estimated that the stock market increases by around 8.6 percent. The industries experience notable variation in response to vaccine development. Industries that are more exposed to the COVID-19 pandemic benefit more from a quicker deployment of the vaccine. Hong et al. (2021) develop a model of pandemic risk management that is integrated into an asset-pricing structure. The quick arrival of vaccines lowers the duration of the pandemic and minimizes the impact of shocks. Asset valuations depend strongly on the rate of vaccine arrivals. Finally, Cong Nguyen To et al. (2021) explore the effect of the vaccine initiation rate on global stock market volatility. The vaccine initiation rate lowers the volatility and stabilizes in international stock markets. This impact is found to be stronger for developed markets.
3. Data and Methods
This section summarizes the data and methods that are employed in our study. We begin with a brief outline of our data sources and discuss the econometric model and variables. Finally, we present summary statistics of the data used in our study.
3.1. Data
This study combines index-level stock market information with the data on global vaccinations, infections, and government interventions. The energy companies are represented by Datastream Energy indices, which belong to the family of Datastream Global Equity indices. Datastream indices represent value-weighted portfolios covering the prevailing majority of tradeable stocks in a vast array of individual developed and emerging markets. The Datastream Energy index is based on supersector classification and encompasses oil, gas, and coal produces and firms belonging to associated sectors, such as oil equipment and services or pipelines.
The pandemic-related data come from the COVID-19 Data Hub (2021). The dataset includes information on the numbers of vaccinated people, as well as the quantities of infections, fatalities, and related policy responses. Financial and vaccination data availability provided, our sample covers fifty-eight emerging and developed countries over the period from 1 January 2020 to 30 April 2021. Table 1 displays the list of countries that are covered by our analysis. The study period starts on the first trading day following China’s declaration of several pneumonia cases of an unknown cause in the city of Wuhan. As we will show later in Section 4, our results remain qualitatively similar when considering alternative study periods.
3.2. Econometric Model
To uncover the effects of vaccination programs on the volatility of energy indexes, we built the following econometric model:
where i indicates a country and t denotes a day. In line with previous studies (e.g., Antonakakis and Kizys 2015; Zaremba et al. 2020), stock return volatility (VOL) was measured using the logarithm of absolute daily returns: Log|R|. To assure the validity of our findings, we also considered an alternative volatility measure that is based on the natural logarithm of absolute residuals from the capital asset pricing model (CAPM): Log |RRCAPM|. It is worth noting that the absolute residual return from the CAPM, akin to the idiosyncratic risk in King et al. (1994), has been demonstrated to be significantly priced by investors.
The key dependent variable, VACCINE, refers to one of the following variables: (1) Log (Daily Vaccinations), calculated as the natural logarithmic transformation of one plus the daily number of COVID-19 vaccinations; (2) Daily Vaccinations Per 100,000, which is the ratio of the daily number of COVID-19 vaccinations to the country’s population, all multiplied by 100,000; and (3) Vaccinations Period, which is a 0/1 variable that assumes the value of one starting from the first vaccination day in a given market, or is zero otherwise.
CONTROLS is a set of control variables known to predict stock return volatility. This vector includes a measure of the stringency of governments’ policy responses to the pandemic, Stringency Index, by Hale et al. (2021). It is a score ranging between zero and one hundred, which is based on different government non-pharmaceutical interventions (Zaremba et al. 2020, 2021a). The vector CONTROLS also includes BM and Log (TV), defined as the book-to-market ratio, and the daily trading volume, expressed in U.S. dollars. To control for pandemic-related factors, we also consider the variables Δ Infections to Cases and Δ Deaths to Cases, defined as the ratios of the daily change in the number of COVID-19 infections and deaths, respectively, to the entire number of confirmed COVID-19 cases (in percentage). Model (1) also controls for the potential week-day effect on daily energy index volatility by including week-day dummies (WEEKDAY). ε is the error term.
3.3. Descriptive Statistics
Table 2 summarizes the statistical properties of the variables that are used in our study. We report the numbers of the full sample (Panel A), developed economies (Panel B), and emerging economies (Panel C). Continuous variables are winsorized at the 1 percent tails. Table 2 shows that the mean daily stock market volatility of developed markets (−4.604 for Log|R| and −4.658 for Log|RRCAPM|) is higher than that of emerging markets (−5.079 for Log|R| and −5.037 for Log|RRCAPM|). Moreover, the number of daily vaccinations is low over the sample period, with an average of approximately 71 per 100,000 people and a difference between developed and emerging countries of approximately 37 vaccinations per 100,000 on average. Furthermore, Table 2 shows that government interventions are slightly more stringent in developed countries than in emerging countries, with an average (median) stringency index of 55.363 (61.570).
Table 3 displays pairwise correlation coefficients between the variables that are used in our primary analysis. The correlation coefficient between Log (TV) and Log (MV) is high and equals 0.878. Thus, we do not include these two variables simultaneously as regressors in our regressions. Consequently, our set of explanatory variables is not expected to introduce significant collinearities in our regressions since the correlation coefficients between them are very low.
4. Results
In this section, we analyze the estimated panel-data models. It is organized into three subsections. In Section 4.1, we summarize and examine the main results. In Section 4.2, we document and examine a battery of robustness checks. In Section 4.3, we partition our sample into emerging and developed markets. We summarize the estimated models for emerging market and developed countries separately; we then discuss the main differences between these two country groups.
4.1. Main Results
Our main findings are displayed in Table 4. Our empirical models are estimated using the fixed-effects estimation method. This estimator factors in any unobserved heterogeneity in the volatility measures across countries—albeit not over time. Table 4 consists of six columns. In Columns 1–3, the dependent variable is the natural logarithm of absolute return as a proxy of the industry’s stock volatility. This variable can be considered as a measure of the total risk of investment in the industry’s portfolio of stocks. In Columns 4–6, the dependent variable is the natural logarithm of absolute residuals based on the CAPM. This variable can be thought to represent the unsystematic (idiosyncratic) risk of investment within the industry’s portfolio of stocks.
The key explanatory variable in both Columns 1 and 4 is measured as the natural logarithm of daily vaccinations recorded on a previous trading day. The key explanatory variable in Columns 2 and 5 is the vaccination rate per 100,000 inhabitants, recorded on a previous trading day. In Columns 3 and 6, a third variant of the explanatory variable is the so-called “Vaccination Period.” This dummy variable takes on value one from the day when the country rolls out its vaccination campaign, and it takes value zero otherwise. Results show that the three variants of the vaccination-related explanatory variable have both adverse and significant effects (at the significance level of 1 percent) on the energy sector’s stock volatility.
Specifically, our results indicate that an increase in daily vaccinations by 10 percent leads to a decrease in volatility by 0.179 percent if the volatility measure is computed as the logarithm of absolute return; furthermore, it reduces volatility by 0.097 percent if the volatility measure is obtained from the residual of an asset pricing model. The vaccination rate per 100,000 population members also exerts a negative and significant effect. Concretely, when 1000 in 100,000 inhabitants are inoculated, the volatility declines by 0.3 percent if the volatility measure is computed as the logarithm of absolute return; furthermore, it declines by 0.2 percent if it is calculated from the residual of the CAPM. The third variant of the key explanatory variable, which indicates that vaccinations in the country are underway, negatively influences the two volatility measures. Specifically, volatility is 0.218 percent (0.1541 percent) lower after vaccinations in the country are being rolled out, relative to the pre-vaccination period. It is worth noting that the estimated models incorporate a vector of control variables to minimize the omitted variable bias. Our findings align with previous studies that document the stabilizing effect of mass vaccination on financial markets. For example, Rouatbi et al. (2021) and Cong Nguyen To et al. (2021) show a negative impact of vaccination on the international stock market volatility. Demir et al. (2021) also provide supporting evidence on the negative effect of immunization on the stock return volatility of global travel and leisure companies.
Our research findings can inform individual and institutional investors, who invest in portfolios composed of the energy sector’s stocks, of changes within both the systematic and unsystematic risk of investment. The finding that the energy sector’s volatility declines in response to vaccinations show that financial instruments that originate in this sector become a safer investment vehicle as the global economy recovers from the COVID-19 pandemic. The decrease in stock volatility is positive news for the energy sector, where companies can fund investments at a lower cost of capital.
4.2. Robustness Checks
To validate our baseline research findings, we undertake a range of robustness checks. These robustness checks are depicted in Table 5. This table is sectioned into two panels. In Panel A, we vary the estimation method and some of the explanatory variables. Although our main results rely on the fixed-effects estimation method, we also estimate our panel data models with the random-effects and pooled OLS estimation methods. The choice of an estimation method does not appear to alter the quality of our empirical findings. For instance, if the random-effects estimator is utilized (Columns 4–6), the effect of the logarithm of daily vaccinations is both quantitatively and qualitatively similar for the three variants of the key explanatory variable. The coefficient estimates—obtained with the pooled OLS estimation method (Columns 7–9)—are numerically different, albeit qualitatively similar. It should be emphasized that the previously estimated models feature the day-of-week dummy variables, which capture stock market anomalies. However, the presence of the day-of-week dummies in the model does not appear to drive the relationship between the energy sector’s volatility and vaccinations (Columns 1–3).
In Panel B of Table 5, we incorporate further variants of the dependent variable. While the absolute residual return is based on the classical CAPM, as seen in Table 4, Panel B of Table 5 introduces three further variants of the idiosyncratic risk measure. The first variant is the residual obtained from the Fama and French three-factor asset-pricing model (Fama and French 1993) (FF, Columns 1–3). The second variant is the residual that is generated from the Asness et al. (2013) model (AMP, Columns 4–6). Finally, the third variant is the Carhart (1997) model (CAR, Columns 7–9). It is worth noting that, although the effects of vaccinations on the energy sector’s volatility vary in size, they are qualitatively similar. For instance, when the number of vaccinations grows by 10 percent, the energy sector’s volatility decreases by 1.13 percent, 0.96 percent, and 1.15 percent when the volatility measure is obtained from the residuals of the FF, AMP, and CAR asset pricing model.
We further test the robustness of our baseline findings by incorporating additional control variables, which are informed by existing research. These robustness checks are summarized in Table 6. In Panel A, we incorporate the first set of control variables; this set consists of the natural logarithm of market capitalization (Columns 1–3), the momentum factor (Columns 4–6), the crisis dummy (Columns 7–9), and the U.S. elections indicator (Columns 10–12). These variables are summarized in the notes in Table 6. We find that varying the set of control variables is immaterial for our baseline findings. These robustness checks also show that our key explanatory variables appear to carry different information contents from behavioral factors, the stance of a business cycle, or the political developments within the U.S. The three variants of vaccinations exert both negative and significant effects on the energy sector’s stock volatility.
In Panel C of Table 6, the robustness checks aim to ensure that the vaccination-related variables do not subsume monthly (Columns 1–3) and quarterly (4–6) seasonal effects, which can signal the presence of different types of calendar anomalies (from the day of the week effects) in the stock market. Remarkably, while the response of the energy sector’s stock volatility remains negative and significant, it is now larger.
In Panel D of Table 6, we also summarize an additional empirical exercise to ascertain whether our baseline findings are not driven by the sample period. This robustness exercise shows that, irrespective of the sample period, the energy sector’s stock volatility response remains negative and significant. Hence, in Subpanel D1 (Columns 1–3), the sample period begins on 11 March 2020, when the WHO declared COVID-19 a pandemic; whereas Subpanel D2 (Columns 4–6) displays the estimated models when the start date is set on 6 June 2020, which dates the end of the post-crisis recovery period.
4.3. Developed versus Emerging Market Countries
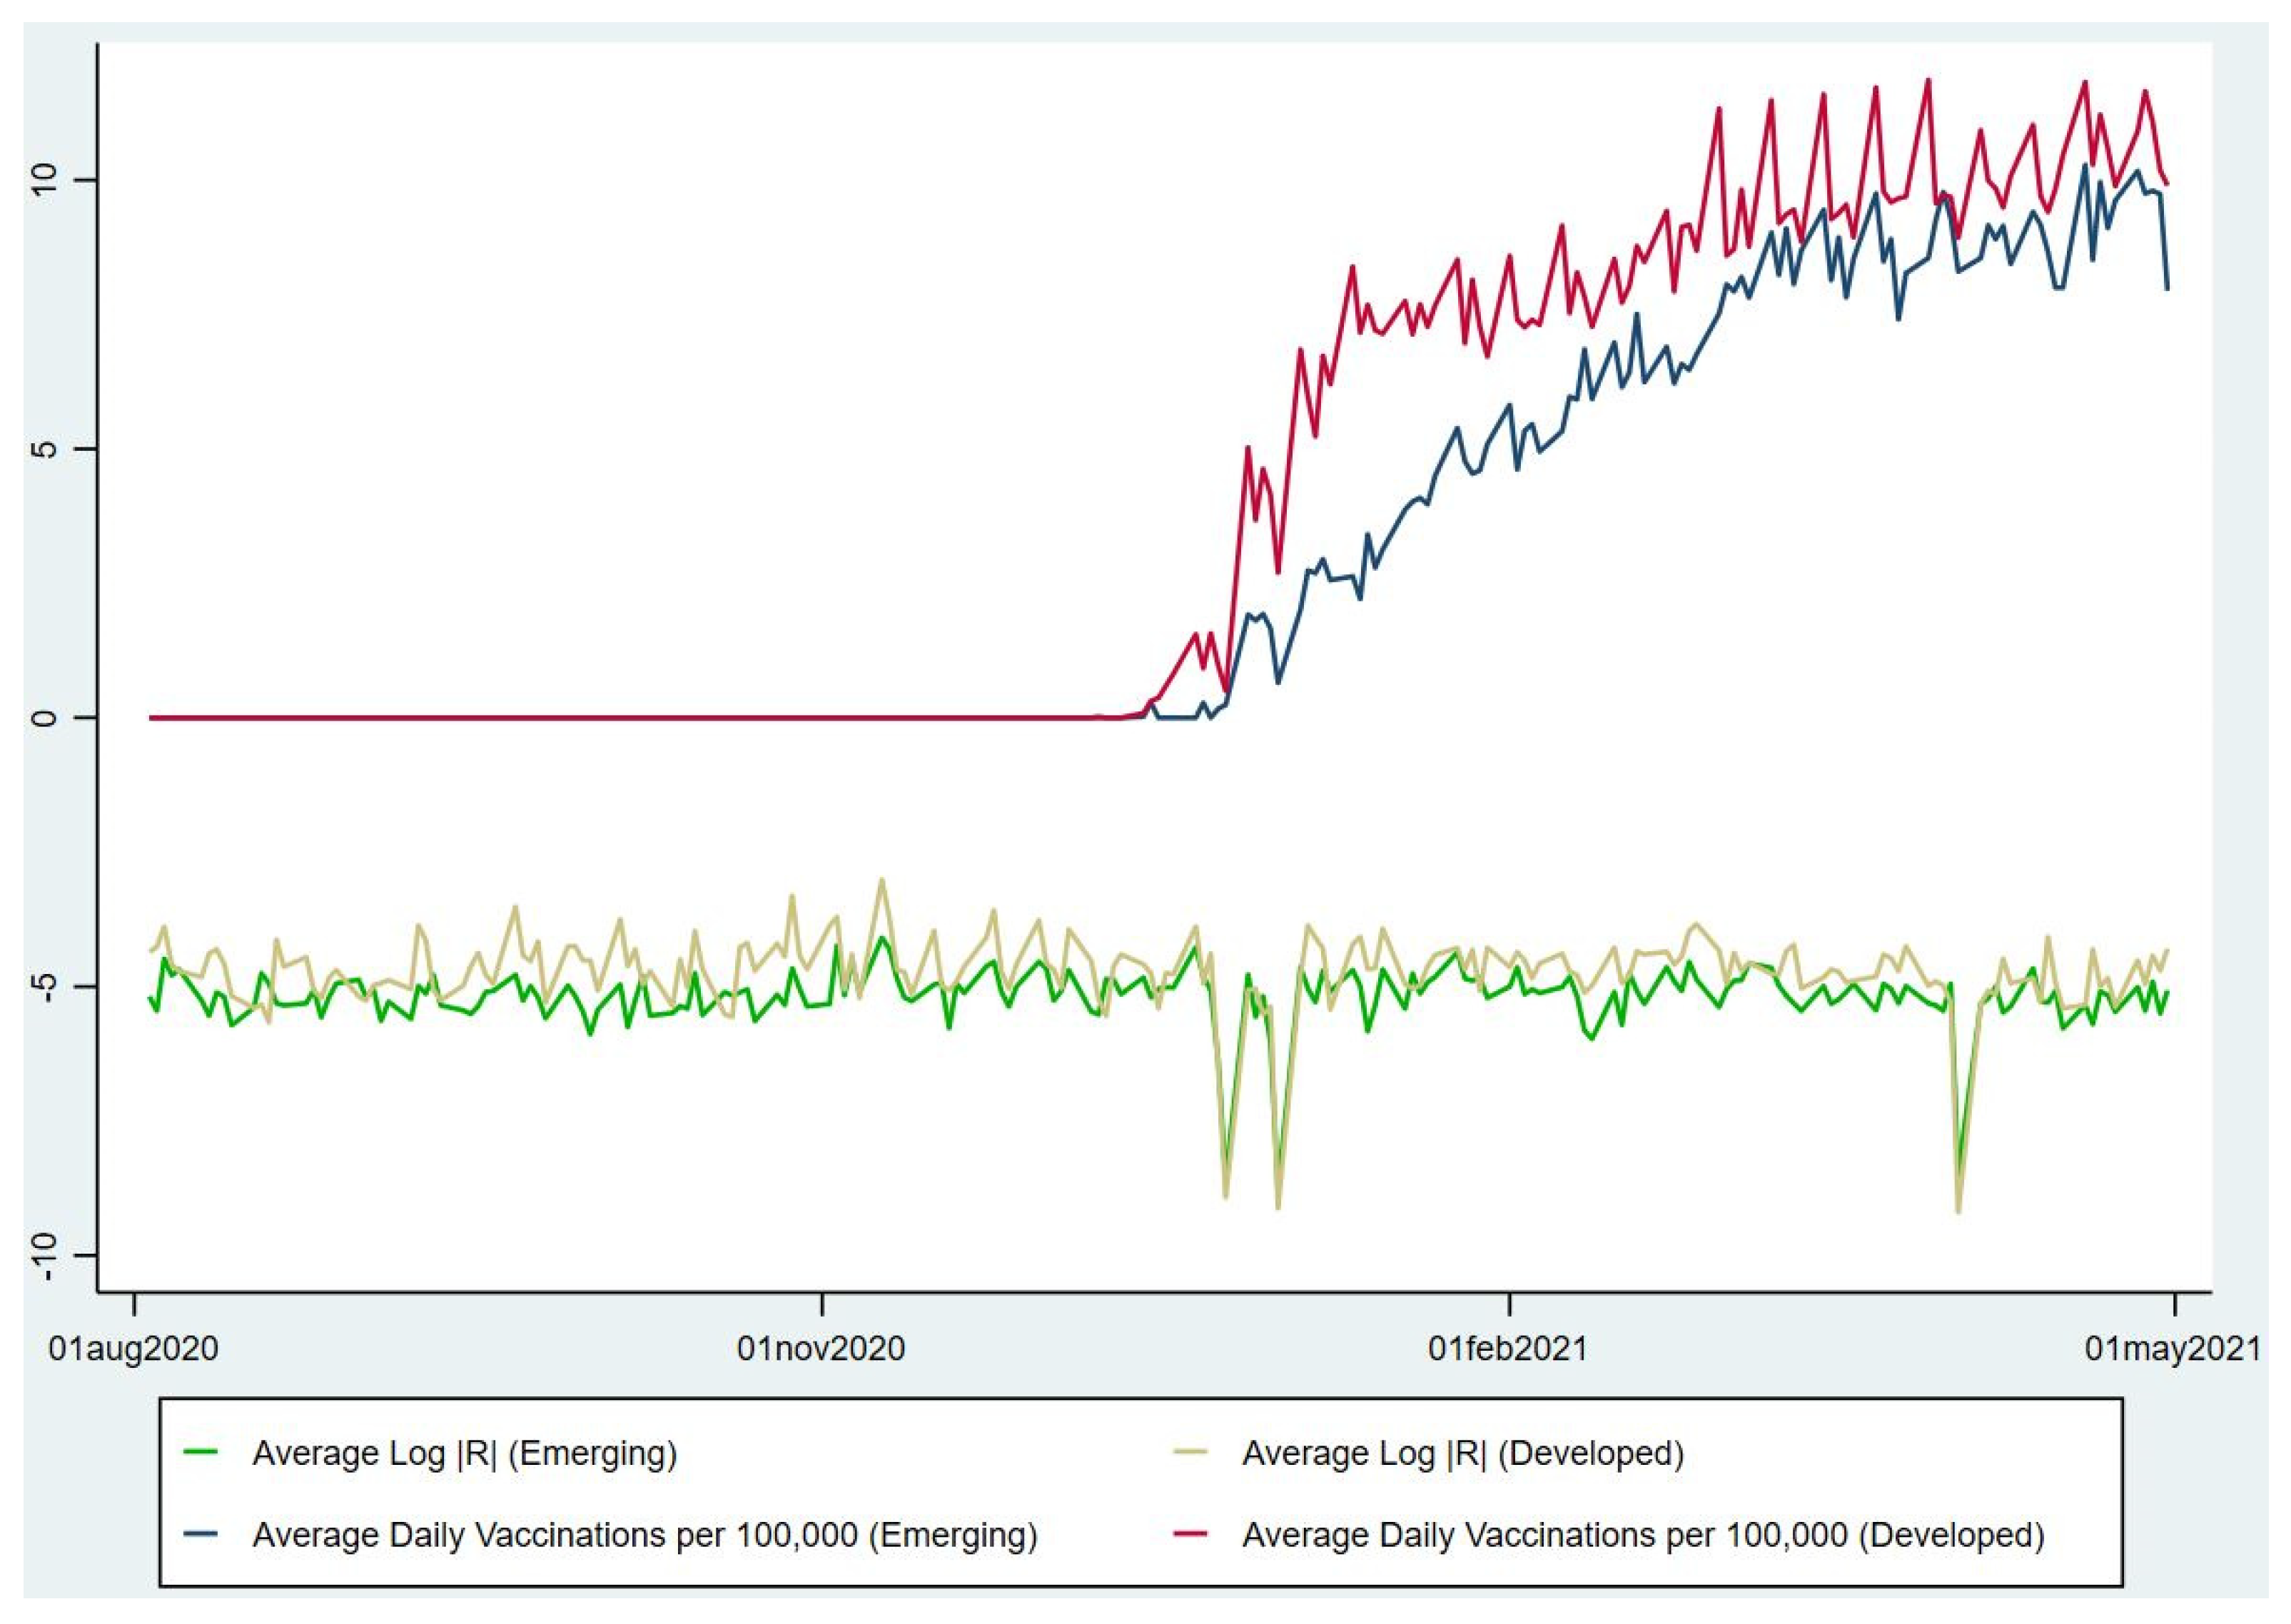
An essential feature of the cross-sectional dimension of our sample is that it comprises both developed and emerging market countries. The differential response of the energy sector’s volatility is multi-faceted, and at least three competing drivers can determine it. First, in the emerging market countries, stock markets are typically less liquid, so news can instigate larger price changes in the energy sector in this group of countries than in the developed countries. As a result, the volatility response to the news is expected to be more sizable in the emerging market, insofar as this effect dominates the volatility effect. Second, in the developed countries, the vaccination rate is higher, the population is vaccinated faster, and vaccinations commence earlier than in the emerging market countries (see Figure 1). Therefore, investors in the energy sector’s stocks in these countries can take a more conservative stance when pricing vaccination-related information.
Third, since the energy sector’s volatility in the emerging market countries is lower, which is apparent from Table 2, the overall volatility response to vaccination-related information is likely to be smaller; even if such an event occurs, it is valued at par by investors in both the developed and emerging market countries. Thus, the second and third drivers imply that the volatility response within the emerging market countries is relatively smaller. Whether the volatility response is larger in either the developed or emerging market countries is ultimately an empirical question. Therefore, we divide our cross-section into the developed and emerging market countries; we then evaluate our panel data models for each group of countries. The results are displayed in Table 7.
The emerging-market models for the three variants of our key explanatory variable are summarized in Columns 1, 3, and 5 for the logarithm of daily vaccinations, the vaccination rate per 100,000 of population, and the Vaccination Period indicator, respectively. In Columns 2, 4, and 6, the estimated models for the developed countries’ subsample are summarized. Results show that the energy sector’s volatility response remains negative and significant in both developed and emerging market countries. However, eyeballing suggests that the volatility effect is more sizable within the developed countries group. This is mainly the case when the Vaccination Period indicator is used as the key explanatory variable. Concretely, in the developed countries, the energy sector’s volatility is 0.3067 percent smaller during the vaccination period than in the preceding period. In the emerging markets, the relative decline is estimated at 0.1643 percent. In the developed countries, the early rollout of vaccinations induced investors to revise their expectations regarding future earnings in the energy sector; this triggered more significant volatility declines in these countries.
5. Conclusions and Policy Implications
The global COVID-19 pandemic and the subsequent government policies exerted an unprecedented impact on energy companies. The development and mass introduction of vaccines in early 2021 brought hopes to revive the global economy and stabilize the markets. However, were they successful? Our study sheds light on this issue by exploring the impact of vaccinations on international energy companies’ volatility.
Using comprehensive data from fifty-eight countries over the period from January 2020 to April 2021, we provide convincing evidence that vaccinations help to stabilize commodity companies’ performance. The beginning and development of vaccination programs mark a substantial decrease in the volatility of firms from the energy sector around the world. The effect is both economically and statistically robust and survives multiple robustness checks and control variables. In particular, the observed phenomenon is not driven by the dynamics of the epidemic itself or the associated government policy responses.
Our findings provide some practical implications for different actors. Investors need to follow the vaccination policies and progress of countries around the globe. The countries vary in terms of vaccinations levels. While some countries already vaccinate most of their populations, some are quite far from this point. Moreover, there is also a need to track the current vaccinations’ effectiveness against the new variants of COVID-19. If there is a decrease in the efficacy of vaccinations, it can imply a decline in the vaccination rates, and a new vaccination program (a booster) could be needed. Investors might need to modify their portfolios based on those developments. They should also consider the different effects of vaccinations in developed and emerging markets. Policymakers around the world should consider the essential role of vaccinations in the energy sector. The decrease in volatility may benefit not only investors and companies but also broader business conditions. A lower volatility of commodities may mitigate the risk of flights to safety and encourage stable economic development. Lowering the cost of capital, which supports economic growth, and smoothing household consumption are just few examples of other advantages
Finally, like any scientific research, this study is not free from limitations that may offer avenues for future research. First, China is not included in our analysis because the required data on daily vaccinations is not available for this country in the COVID-19 Data Hub (2021) database. Second, the study period does not cover the last three months of 2021, over which, two COVID-related events have occurred. First, a new COVID wave has hit many European countries; some of them have seen record numbers of daily infections not reached since December 2020 (e.g., Netherlands, Germany). Second, in Novem-ber 2021, the WHO designated the newly discovered COVID-19 variant B.1.1.529, named Omicron, as a variant of concern. This new variant cast doubt about the effectiveness of many countermeasures against the pandemic, including vaccines. Future studies should explore the effects of these two events on stock market returns and volatility further to understand the role of vaccinations in financial markets.
Future examinations on the topics discussed in this study could also be extended to different sectors. Industries such as tourism or transportation were equally hit during the pandemic, so taking a closer look at their case would be a valuable decision. It could also be interesting to broaden the scope of this research to other energy asset classes, such as bonds of energy companies. Moreover, future studies can compare vaccinations’ impact on both fossil energy and renewable energy prices. Finally, future studies can consider the tail of the distribution in panel analyses by using a quantile-on-quantile approach. The impact of mass vaccination can be different at lower and higher quantiles.
The devastating consequences of the COVID-19 pandemic on the energy sector highlight the need to rebuild the global energy security infrastructure, ensuring the sector’s resiliency to natural and health-related disasters and the sustainability of energy demand and supply (Zweifel and Bonomo 1995; Blum and Legey 2012). This requires international coordination of policy makers and energy regulatory bodies in securing renewable and sustainable energy sources. Importantly, such efforts are unlikely to succeed without both public and private funding. A lower volatility of energy stocks, driven by the rollout of vaccinations, will translate into a lower cost of funding, which will make more energy investment projects profitable and thus more appealing to private investors.
Author Contributions
Conceptualization, E.D., R.K., W.R. and A.Z.; methodology, E.D., R.K., W.R. and A.Z.; formal analysis, W.R., investigation, W.R.; resources, A.Z.; data curation, A.Z. and W.R.; writing—original draft preparation, E.D., R.K., W.R. and A.Z.; writing—review and editing, E.D., R.K., W.R. and A.Z.; visualization, W.R. and A.Z.; funding acquisition, A.Z. All authors have read and agreed to the published version of the manuscript.
Funding
This research received no external funding.
Conflicts of Interest
The authors declare no conflict of interest.
References
- Abadie, Luis M. 2021. Energy market prices in times of COVID-19: The case of electricity and natural gas in Spain. Energies 14: 1632. [Google Scholar] [CrossRef]
- Acharya, Viral V., Timothy Johnson, Suresh Sundaresan, and Steven Zheng. 2020. The Value of a Cure: An Asset Pricing Perspective (No. w28127). Cambridge: National Bureau of Economic Research. [Google Scholar]
- Adam, Klaus, Albert Marcet, and Juan Pablo Nicolini. 2016. Stock market volatility and learning. Journal of Finance 71: 33–82. [Google Scholar] [CrossRef] [Green Version]
- Adekoya, Oluwasegun B., and Johnson A. Oliyide. 2021. How COVID-19 drives connectedness among commodity and financial markets: Evidence from TVP-VAR and causality-in-quantiles techniques. Resources Policy 70: 101898. [Google Scholar] [CrossRef]
- Adrian, Tobias, and Joshua Rosenberg. 2008. Stock returns and volatility: Pricing the short-run and long-run components of market risk. Journal of Finance 63: 2997–3030. [Google Scholar] [CrossRef] [Green Version]
- Akhtaruzzaman, Md, Sabri Boubaker, Mardy Chiah, and Angel Zhong. 2020. COVID-19 and oil price risk exposure. Finance Research Letters 42: 101882. [Google Scholar] [CrossRef]
- Al-Awadhi, Abdullah M., Khaled Alsaifi, Ahmad Al-Awadhi, and Salah Alhammadi. 2020. Death and Contagious infectious diseases: Impact of the COVID-19 virus on stock market returns. Journal of Behavioral and Experimental Finance 27: 100326. [Google Scholar] [CrossRef]
- Albulescu, Claudiu. 2020. Coronavirus and Oil Price Crash: A Note. arXiv arXiv:2003.06184. [Google Scholar]
- Albulescu, Claudiu. 2021. COVID-19 and the United States financial markets’ volatility. Finance Research Letters 38: 101699. [Google Scholar] [CrossRef]
- Antonakakis, Nikolas, and Renatas Kizys. 2015. Dynamic spillovers between commodity and currency markets. International Review of Financial Analysis 41: 303–19. [Google Scholar] [CrossRef] [Green Version]
- Ashraf, Badar Nadeem. 2020a. Stock markets’ reaction to COVID-19: Cases or fatalities? Research in International Business and Finance 54: 101249. [Google Scholar] [CrossRef]
- Ashraf, Badar Nadeem. 2020b. Economic impact of government interventions during the COVID-19 pandemic: International evidence from financial markets. Journal of Behavioral and Experimental Finance 27: 100371. [Google Scholar] [CrossRef]
- Asness, Clifford S., Tobias J. Moskowitz, and Lasse Heje Pedersen. 2013. Value and momentum everywhere. Journal of Finance 68: 929–85. [Google Scholar] [CrossRef] [Green Version]
- Atri, Hanen, Saoussen Kouki, and Mohamed imen Gallali. 2021. The impact of COVID-19 news, panic and media coverage on the oil and gold prices: An ARDL approach. Resources Policy 72: 102061. [Google Scholar] [CrossRef]
- Bae, Kee-Hong, Sadok El Ghoul, Zhaoran (Jason) Gong, and Omrane Guedhami. 2021. Does CSR matter in times of crisis? Evidence from the COVID-19 pandemic. Journal of Corporate Finance 67: 101876. [Google Scholar] [CrossRef]
- Baek, Seungho, Sunil K. Mohanty, and Mina Glambosky. 2020. COVID-19 and stock market volatility: An industry level analysis. Finance Research Letters 37: 101748. [Google Scholar] [CrossRef]
- Baele, Lieven, Geert Bekaert, Koen Inghelbrecht, and Min Wei. 2020. Flights to safety. Review of Financial Studies 33: 689–746. [Google Scholar] [CrossRef]
- Bai, Lan, Yu Wei, Guiwu Wei, Xiafei Li, and Songyun Zhang. 2020. Infectious disease pandemic and permanent volatility of international stock markets: A long-term perspective. Finance Research Letters 40: 101709. [Google Scholar] [CrossRef]
- Baig, Ahmed S., Hassan Anjum Butt, Omair Haroon, and Syed Aun R. Rizvi. 2021. Deaths, panic, lockdowns and US equity markets: The case of COVID-19 pandemic. Finance Research Letters 38: 101701. [Google Scholar] [CrossRef]
- Baker, Scott R., Nicholas Bloom, Steven J. Davis, Kyle Kost, Marco Sammon, and Tasaneeya Viratyosin. 2020. The unprecedented stock market reaction to COVID-19. Review of Asset Pricing Studies 10: 742–58. [Google Scholar] [CrossRef]
- Banerjee, Snehal. 2011. Learning from prices and the dispersion in beliefs. Review of Financial Studies 24: 3025–68. [Google Scholar] [CrossRef]
- Blum, Helcio, and Luiz F. L. Legey. 2012. The challenging economics of energy security: Ensuring energy benefits in support to sustainable development. Energy Economics 34: 1982–89. [Google Scholar] [CrossRef]
- Bouri, Elie, Oguzhan Cepni, David Gabauer, and Rangan Gupta. 2021. Return connectedness across asset classes around the COVID-19 outbreak. International Review of Financial Analysis 73: 101646. [Google Scholar] [CrossRef]
- Bouri, Elie, Riza Demirer, Rangan Gupta, and Christian Pierdzioch. 2020. Infectious diseases, market uncertainty, and oil market volatility. Energies 13: 4090. [Google Scholar] [CrossRef]
- Brinca, Pedro, Joao B. Duarte, and Miguel Faria-e-Castro. 2021. Measuring labor supply and demand shocks during COVID-19. European Economic Review 139: 103901. [Google Scholar] [CrossRef]
- Broadstock, David C., Kalok Chan, Louis T. W. Cheng, and Xiaowei Wang. 2021. The role of ESG performance during times of financial crisis: Evidence from COVID-19 in China. Finance Research Letters 38: 101716. [Google Scholar] [CrossRef]
- Brown, Gregory W. 1999. Volatility, sentiment, and noise traders. Financial Analysts Journal 55: 82–90. [Google Scholar] [CrossRef]
- Caggiano, Giovanni, Efrem Castelnuovo, and Richard Kima. 2020. The global effects of Covid-19-induced uncertainty. Economics Letters 194: 109392. [Google Scholar] [CrossRef] [PubMed]
- Campbell, John Y., and John H. Cochrane. 1999. By force of habit: A consumption-based explanation of aggregate stock market behavior. Journal of Political Economy 107: 205–51. [Google Scholar] [CrossRef]
- Carhart, Mark M. 1997. On persistence in mutual fund performance. Journal of Finance 52: 57–82. [Google Scholar] [CrossRef]
- Chan, Kam Fong, Zhuo Chen, Yuanji Wen, and Tong Xu. 2021. COVID-19 Vaccines and Global Stock Markets. Available online: https://ssrn.com/abstract=3785533 (accessed on 9 December 2021).
- Chien, FengSheng, Muhammad Sadiq, Hafiz Waqas Kamran, Muhammad Atif Nawaz, Muhammed Sajjad Hussain, and Muhammad Raza. 2021. Co-movement of energy prices and stock market return: Environmental wavelet nexus of COVID-19 pandemic from the USA, Europe, and China. Environmental Science and Pollution Research. forthcoming. [Google Scholar] [CrossRef]
- Cong Nguyen To, Bao, Bao Khac Quoc Nguyen, Tam Van Thien Nguyen, and Phuong Thi Minh Nguyen. 2021. Vaccine Initiation Rate and Volatility in the International Stock Market during COVID-19. Available online: https://ssrn.com/abstract=3945810 (accessed on 9 December 2021).
- Conlon, Thomas, Shaen Corbet, and Richard J. McGee. 2020. Are cryptocurrencies a safe haven for equity markets? An international perspective from the COVID-19 pandemic. Research in International Business and Finance 54: 101248. [Google Scholar] [CrossRef]
- Corbet, Shaen, Charles Larkin, and Brian Lucey. 2020a. The contagion effects of the COVID-19 pandemic: Evidence from gold and cryptocurrencies. Finance Research Letters 35: 101554. [Google Scholar] [CrossRef]
- Corbet, Shaen, John W. Goodell, and Samet Günay. 2020b. Co-movements and spillovers of oil and renewable firms under extreme conditions: New evidence from negative WTI prices during COVID-19. Energy Economics 92: 104978. [Google Scholar] [CrossRef] [PubMed]
- Corradi, Valentina, Walter Distaso, and Antonio Mele. 2013. Macroeconomic determinants of stock volatility and volatility premiums. Journal of Monetary Economics 60: 203–20. [Google Scholar] [CrossRef]
- COVID-19 Data Hub. 2021. Available online: https://covid19datahub.io/ (accessed on 5 May 2021).
- Degiannakis, Stavros, George Filis, and Renatas Kizys. 2014. The effects of oil price shocks on stock market volatility: Evidence from European data. Energy Journal 35: 35–56. [Google Scholar] [CrossRef] [Green Version]
- del Rio-Chanona, R. Maria, Penny Mealy, Anton Pichler, Francois Lafond, and J. Doyne Farmer. 2020. Supply and demand shocks in the COVID-19 pandemic: An industry and occupation perspective. Oxford Review of Economic Policy 36: S94–S137. [Google Scholar] [CrossRef]
- Demir, Ender, Mehmet Huseyin Bilgin, Gokhan Karabulut, and Asli Cansin Doker. 2020. The relationship between cryptocurrencies and COVID-19 pandemic. Eurasian Economic Review 10: 349–60. [Google Scholar] [CrossRef]
- Demir, Ender, Renatas Kizys, Wael Rouatbi, and Aadam Zaremba. 2021. Sail Away to the Safe Harbor? COVID-19 Vaccinations and the Volatility of Travel and Leisure Companies. Available online: https://ssrn.com/abstract=3829288 (accessed on 9 December 2021).
- Ding, Wenzhi, Ross Levine, Chen Lin, and Wensi Xie. 2021. Corporate immunity to the COVID-19 pandemic. Journal of Financial Economics 141: 802–30. [Google Scholar] [CrossRef]
- Donadelli, Michael, Renatas Kizys, and Max Riedel. 2017. Dangerous infectious diseases: Bad news for Main Street, good news for Wall Street? Journal of Financial Markets 35: 84–103. [Google Scholar] [CrossRef]
- Dzielinski, Michal. 2012. Measuring economic uncertainty and its impact on the stock market. Finance Research Letters 9: 167–75. [Google Scholar] [CrossRef] [Green Version]
- Engelhardt, Nils, Miguel Krause, Daniel Neukirchen, and Peter N. Posch. 2021. Trust and stock market volatility during the COVID-19 crisis. Finance Research Letters 38: 101873. [Google Scholar] [CrossRef]
- Engle, Robert F., and Jose Gonzalo Rangel. 2008. The spline-GARCH model for low-frequency volatility and its global macroeconomic causes. Review of Financial Studies 21: 1187–222. [Google Scholar] [CrossRef]
- Erdem, Orhan. 2020. Freedom and stock market performance during Covid-19 outbreak. Finance Research Letters 36: 101671. [Google Scholar] [CrossRef] [PubMed]
- Fama, Eugene F., and Kenneth R. French. 1993. Common risk factors in the returns on stocks and bonds. Journal of Financial Economics 33: 3–56. [Google Scholar] [CrossRef]
- Fernandez-Perez, Adrian, Aaron Gilbert, Ivan Indriawan, and Nhut H. Nguyen. 2021. COVID-19 pandemic and stock market response: A culture effect. Journal of Behavioral and Experimental Finance 29: 100454. [Google Scholar] [CrossRef] [PubMed]
- Foucault, Thierry, David Sraer, and David J. Thesmar. 2011. Individual investors and volatility. Journal of Finance 66: 1369–406. [Google Scholar] [CrossRef]
- Fu, Mengyao, and Huayu Shen. 2020. COVID-19 and corporate performance in the energy industry. Energy Research Letters 1: 12967. [Google Scholar] [CrossRef]
- Gharib, Cheima, Salma Mefteh-Wali, and Sami Ben Jabeur. 2021. The bubble contagion effect of COVID-19 outbreak: Evidence from crude oil and gold markets. Finance Research Letters 38: 101703. [Google Scholar] [CrossRef]
- Ghiani, Emilio, Marco Galici, Mario Mureddu, and Fabrizio Pilo. 2020. Impact on electricity consumption and market pricing of energy and ancillary services during pandemic of COVID-19 in Italy. Energies 13: 3357. [Google Scholar] [CrossRef]
- Gil-Alana, Luis A., and Manuel Monge. 2020. Crude oil prices and COVID-19: Persistence of the shock. Energy Research Letters 1: 13200. [Google Scholar] [CrossRef]
- González Maiz Jiménez, Jaimie, Adán Reyes Santiago, and Francisco López-Herrera. 2021. Measuring the asymmetry level around quarterly reports in the Dow Jones, Nasdaq, and Standard & Poor’s: Before and during the COVID-19 pandemic. Investment Analysts Journal 50: 50–59. [Google Scholar]
- Gubareva, Mariya. 2021. The impact of Covid-19 on liquidity of emerging market bonds. Finance Research Letters 41: 101826. [Google Scholar] [CrossRef]
- Gurrib, Ikhlaas, Qian Long Kweh, Davide Contu, and Firuz Kamalov. 2021. COVID-19, short-selling ban and energy stock prices. Energy Research Letters 1: 1–4. [Google Scholar] [CrossRef]
- Hale, Thomas, Noam Angrist, Rafael Goldszmidt, Beatriz Kira, Anna Petherick, Toby Phillips, Samuel Webster, Emily Cameron-Blake, Laura Hallas, Saptarshi Majumdar, and et al. 2021. A global panel database of pandemic policies (Oxford COVID-19 Government Response Tracker). Nature Human Behaviour 5: 529–38. [Google Scholar] [CrossRef] [PubMed]
- Haroon, Omair, and Syed Aun R. Rizvi. 2020. Flatten the curve and stock market liquidity—An inquiry into emerging economies. Emerging Markets Finance and Trade 56: 2151–61. [Google Scholar] [CrossRef]
- Harris, Milton, and Artur Raviv. 1993. Differences of opinion make a horse race. Review of Financial Studies 6: 473–506. [Google Scholar] [CrossRef]
- Hartono, Djoni, Arief Anshory Yusuf, Sasmita Hastri Hastuti, Novani Karina Saputri, and Noor Syaifudin. 2021. Effect of COVID-19 on energy consumption and carbon dioxide emissions in Indonesia. Sustainable Production and Consumption 28: 391–404. [Google Scholar] [CrossRef]
- Hong, Harrison, Neng Wang, and Jinqiang Yang. 2021. Implications of Stochastic Transmission Rates for Managing Pandemic Risks. Review of Financial Studies 34: 5224–65. [Google Scholar] [CrossRef]
- Hu, Haiqin, Di Chen, and Qiang Fu. 2021. Does a government response to COVID-19 hurt the stock price of an energy enterprise? Emerging Markets Finance and Trade. forthcoming. [Google Scholar] [CrossRef]
- Iqbal, Sajid, Ahmad Raza Bilal, Mohammad Nurunnabi, Wasim Iqbal, Yazeed Alfakhri, and Nadeem Iqbal. 2021. It is time to control the worst: Testing COVID-19 outbreak, energy consumption and CO2 emission. Environmental Science and Pollution Research 28: 19008–20. [Google Scholar] [CrossRef]
- Iyke, Bernard Njindan. 2020. COVID-19: The reaction of US oil and gas producers to the pandemic. Energy Research Letters 1: 13912. [Google Scholar] [CrossRef]
- Jansen, W. Jos, and Niek J. Nahuis. 2003. The stock market and consumer confidence: European evidence. Economics Letters 79: 89–98. [Google Scholar] [CrossRef] [Green Version]
- Jebabli, Ikram, Noureddine Kouaissah, and Mohamed Arouri. 2021. Volatility spillovers between stock and energy markets during crises: A comparative assessment between the 2008 global financial crisis and the COVID-19 pandemic crisis. Financial Research Letters. forthcoming. [Google Scholar] [CrossRef]
- Kaczmarek, Tomasz, Katarzyna Perez, Ender Demir, and Adam Zaremba. 2021. How to survive a pandemic: The corporate resiliency of travel and leisure companies to the COVID-19 outbreak. Tourism Management 84: 104281. [Google Scholar] [CrossRef]
- King, Mervyn A., Enrique Sentana, and Sushil Wadhwani. 1994. Volatility and links between national stock markets. Econometrica 62: 901–33. [Google Scholar] [CrossRef]
- Kizys, Renatas, Panagiotis Tzouvanas, and Michael Donadelli. 2021. From COVID-19 herd immunity to investor herding in international stock markets: The role of government and regulatory restrictions. International Review of Financial Analysis 74: 101663. [Google Scholar] [CrossRef]
- Kucher, Oleg, Alexander Kurov, and Marketa Wolfe. 2021. A Shot in the Arm: The Effect of COVID-19 Vaccine News on Financial and Commodity Markets. Available online: https://ssrn.com/abstract=3852364 (accessed on 9 December 2021).
- Kumari, Jyoti, and Jitendra Mahakud. 2015. Does investor sentiment predict the asset volatility? Evidence from emerging stock market India. Journal of Behavioral and Experimental Finance 8: 25–39. [Google Scholar] [CrossRef]
- Ling, David C., Chongyu Wang, and Tingyu Zhou. 2020. A first look at the impact of COVID-19 on commercial real estate prices: Asset-level evidence. Review of Asset Pricing Studies 10: 669–704. [Google Scholar] [CrossRef]
- Liu, Li, and Tao Zhang. 2015. Economic policy uncertainty and stock market volatility. Finance Research Letters 15: 99–105. [Google Scholar] [CrossRef] [Green Version]
- Liu, Lu, En-Ze Wang, and Chien-Chiang Lee. 2020. Impact of the COVID-19 pandemic on the crude oil and stock markets in the US: A time-varying analysis. Energy Research Letters 1: 13154. [Google Scholar] [CrossRef]
- Lyócsa, Štefan, and Neda Todorova. 2021. What drives volatility of the US oil and gas firms? Energy Economics 8: 105367. [Google Scholar] [CrossRef]
- Lyócsa, Štefan, Eduard Baumöhl, Tomáš Výrost, and Peter Molnár. 2020. Fear of the coronavirus and the stock markets. Finance Research Letters 36: 101735. [Google Scholar] [CrossRef]
- Maneejuk, Paravee, Sukrit Thongkairat, and Wilawan Srichaikul. 2021. Time-varying co-movement analysis between COVID-19 shocks and the energy markets using the Markov Switching Dynamic Copula approach. Energy Reports 7: 81–88. [Google Scholar] [CrossRef]
- Mazur, Mieszko, Man Dang, and Miguel Vega. 2021. COVID-19 and the march 2020 stock market crash. Evidence from S&P1500. Finance Research Letters 38: 101690. [Google Scholar]
- McKibbin, Warwick, and Roshen Fernando. 2021. The global macroeconomic impacts of COVID-19: Seven scenarios. Asian Economic Papers 20: 1–30. [Google Scholar] [CrossRef]
- Mei, Jianping, and Limin Guo. 2004. Political uncertainty, financial crisis and market volatility. European Financial Management 10: 639–57. [Google Scholar] [CrossRef]
- Mensi, Walid, Abdel Razzaq Al Rababa’a, Xuan Vinh Vo, and Sang Hoon Kang. 2021. Asymmetric spillover and network connectedness between crude oil, gold, and Chinese sector stock markets. Energy Economics 98: 105262. [Google Scholar] [CrossRef]
- Mensi, Walid, Ahmet Sensoy, Xuan Vinh Vo, and Sang Hoon Kang. 2020. Impact of COVID-19 outbreak on asymmetric multifractality of gold and oil prices. Resources Policy 69: 101829. [Google Scholar] [CrossRef] [PubMed]
- Milcheva, Stanimira. 2021. Volatility and the cross-section of real estate equity returns during Covid-19. Journal of Real Estate Finance and Economics. forthcoming. [Google Scholar] [CrossRef]
- Narayan, Paresh Kumar. 2021. Understanding exchange rate shocks during COVID-19. Finance Research Letters, 102181. [Google Scholar] [CrossRef]
- Norouzi, Nima, Gerardo Z. Zarazua de Rubens, Peter Enevoldsen, and Atefeh Behzadi Forough. 2021. The impact of COVID-19 on the electricity sector in Spain: An econometric approach based on prices. International Journal of Energy Research 45: 6320–32. [Google Scholar] [CrossRef]
- Otoo, Maria Ward. 1999. Consumer Sentiment and the Stock Market. Available online: https://www.federalreserve.gov/Pubs/feds/1999/199960/199960pap.pdf (accessed on 9 December 2021).
- Pastor, Lubos, and Pietro Veronesi. 2012. Uncertainty about government policy and stock prices. Journal of Finance 67: 1219–64. [Google Scholar] [CrossRef]
- Prabheesh, K. P., Bhavesh Garg, and Rakesh Padhan. 2020. Time-varying dependence between stock markets and oil prices during COVID-19: The case of net oil-exporting countries. Economics Bulletin 40: 2408–18. [Google Scholar]
- Rajput, Himadri, Rahil Changotra, Prachi Rajput, Sneha Gautam, Anjani R. K. Gollakota, and Amarpreet Singh Arora. 2021. A shock like no other: Coronavirus rattles commodity markets. Environment, Development and Sustainability 23: 6564–75. [Google Scholar] [CrossRef]
- Ramelli, Stefano, and Alexander F. Wagner. 2020. Feverish stock price reactions to COVID-19. Review of Corporate Finance Studies 9: 622–55. [Google Scholar] [CrossRef]
- Rath, Badri Narayan, and Vaseem Akram. 2020. Does COVID-19 outbreak cause spot electricity price discovery in India? Journal of Public Affairs 21: e2439. [Google Scholar] [CrossRef]
- Rouatbi, Wael, Ender Demir, Renatas Kizys, and Adam Zaremba. 2021. Immunizing markets against the pandemic: COVID-19 vaccinations and stock volatility around the world. International Review of Financial Analysis 77: 101819. [Google Scholar] [CrossRef]
- Saif-Alyousfi, Abdulazeez Y. H., and Asish Saha. 2021. The impact of COVID-19 and non-pharmaceutical interventions on energy returns worldwide. Sustainable Cities and Society 70: 102943. [Google Scholar] [CrossRef]
- Schwert, G. William. 1989. Why does stock market volatility change over time? Journal of Finance 44: 1115–53. [Google Scholar] [CrossRef]
- Shaikh, Imlak. 2021. Impact of COVID-19 pandemic on the energy markets. Economic Change and Restructuring. forthcoming. [Google Scholar] [CrossRef]
- Sharafedin, Bozorgmehr, Shadia Nasrall, and Devika Krishna Kumar. 2020. Global Oil Storage Fills to the Brim Despite Leap in Costs. Reuters. Available online: https://www.reuters.com/article/global-oil-storage-idUSL8N2BH3AM (accessed on 9 December 2021).
- Sharif, Arshian, Chaker Aloui, and Larisa Yarovaya. 2020. COVID-19 pandemic, oil prices, stock market, geopolitical risk and policy uncertainty nexus in the US economy: Fresh evidence from the wavelet-based approach. International Review of Financial Analysis 70: 101496. [Google Scholar] [CrossRef]
- Shehzad, Khurram, Umer Zaman, Xiaoxing Liu, Jarosław Górecki, and Carlo Pugnetti. 2021. Examining the asymmetric impact of COVID-19 pandemic and global financial crisis on Dow Jones and oil price shock. Sustainability 13: 4688. [Google Scholar] [CrossRef]
- Smith, L. Vanessa, Nori Tarui, and Takashi Yamagata. 2021. Assessing the impact of COVID-19 on global fossil fuel consumption and CO2 emissions. Energy Economics 97: 105170. [Google Scholar] [CrossRef]
- Su, Zhi, Tong Fang, and Libo Yin. 2019. Understanding stock market volatility: What is the role of US uncertainty? The North American Journal of Economics and Finance 48: 582–90. [Google Scholar] [CrossRef]
- Szczygielski, Jan Jakub, Janusz Brzeszczyński, Ailie Charteris, and Princess Rutendo Bwanya. 2021. The COVID-19 storm and the energy sector: The impact and role of uncertainty. Energy Economics, 105258. [Google Scholar] [CrossRef]
- Umar, Zaghum, Nader Trabelsi, and Adam Zaremba. 2021. Oil shocks and equity markets: The case of GCC and BRICS economies. Energy Economics 96: 105155. [Google Scholar] [CrossRef]
- Valls Martínez, María del Carmen, and Pedro Antonio Martín Cervantes. 2021. Testing the resilience of CSR stocks during the COVID-19 crisis: A transcontinental analysis. Mathematics 9: e514. [Google Scholar] [CrossRef]
- Wang, Kai-Hua, and Chi-Wei Su. 2021. Asymmetric link between COVID-19 and fossil energy prices. Asian Economics Letters 1: 18742. [Google Scholar] [CrossRef]
- Wang, Yaw-Huei, Aneel Keswani, and Stephen J. Taylor. 2006. The relationships between sentiment, returns and volatility. International Journal of Forecasting 22: 109–23. [Google Scholar] [CrossRef]
- Wen, Jun, Xin-Xin Zhao, and Chun-Ping Chang. 2021. The impact of extreme events on energy price risk. Energy Economics 99: 105308. [Google Scholar] [CrossRef]
- Xu, Libo. 2021. Stock Return and the COVID-19 pandemic: Evidence from Canada and the US. Finance Research Letters 38: 101872. [Google Scholar] [CrossRef]
- Zaremba, Adam, Renatas Kizys, David Y. Aharon, and Ender Demir. 2020. Infected markets: Novel coronavirus, government interventions, and stock return volatility around the globe. Finance Research Letters 35: 101597. [Google Scholar] [CrossRef] [PubMed]
- Zaremba, Adam, David Y. Aharon, Ender Demir, Renatas Kizys, and Dariusz Zawadka. 2021a. COVID-19, government policy responses, and stock market liquidity around the world: A note. Research in International Business and Finance 56: 101359. [Google Scholar] [CrossRef] [PubMed]
- Zaremba, Adam, Renatas Kizys, and David Y. Aharon. 2021b. Volatility in international sovereign bond markets: The role of government policy responses to the COVID-19 pandemic. Finance Research Letters 43: 102011. [Google Scholar] [CrossRef]
- Zaremba, Adam, Renatas Kizys, David Y. Aharon, and Zaghum Umar. 2021c. Term spreads and the COVID-19 pandemic: Evidence from international sovereign bond markets. Finance Research Letters, 102042. [Google Scholar] [CrossRef]
- Zaremba, Adam, Renatas Kizys, Panagiotis Tzouvanas, David Y. Aharon, and Ender Demir. 2021d. The quest for multidimensional financial immunity to the COVID-19 pandemic: Evidence from international stock markets. Journal of International Financial Markets, Institutions and Money 71: 101284. [Google Scholar] [CrossRef]
- Zweifel, Peter, and Susanne Bonomo. 1995. Energy security coping with multiple supply risks. Energy Economics 17: 179–83. [Google Scholar] [CrossRef]
Figure 1.
Vaccination and stock market volatility in developed and emerging markets. Daily averages are computed across the sample countries.
Figure 1.
Vaccination and stock market volatility in developed and emerging markets. Daily averages are computed across the sample countries.


Table 1.
Countries included in the study.
| Developed Markets | Emerging Markets | ||||||||||
|---|---|---|---|---|---|---|---|---|---|---|---|
| 1. | Australia | 12. | Japan | 1. | Argentina | 12. | Jordan | 23. | Poland | 34. | Thailand |
| 2. | Austria | 13. | Netherlands | 2. | Brazil | 13. | Kuwait | 24. | Qatar | 35. | Turkey |
| 3. | Belgium | 14. | New Zealand | 3. | Bulgaria | 14. | Lithuania | 25. | Romania | 36. | UAE |
| 4. | Canada | 15. | Norway | 4. | Chile | 15. | Malaysia | 26. | Russia | 37. | Vietnam |
| 5. | Denmark | 16. | Portugal | 5. | Colombia | 16. | Malta | 27. | Saudi Arabia | ||
| 6. | Finland | 17. | Singapore | 6. | Croatia | 17. | Morocco | 28. | Slovakia | ||
| 7. | France | 18. | Spain | 7. | Cyprus | 18. | Nigeria | 29. | Slovenia | ||
| 8. | Germany | 19. | Sweden | 8. | Greece | 19. | Oman | 30. | South Africa | ||
| 9. | Ireland | 20. | United Kingdom | 9. | Hungary | 20. | Pakistan | 31. | South Korea | ||
| 10. | Israel | 21. | United States | 10. | India | 21. | Peru | 32. | Sri Lanka | ||
| 11. | Italy | 11. | Indonesia | 22. | Philippines | 33. | Taiwan | ||||
Notes: This table displays the list of developed and emerging countries that are included in our study.
Table 2.
Statistical properties of major variables.
| Log |R| | Log |RRCAPM| | Log (Daily Vaccinations) | Daily Vaccinations Per 100,000 | Vaccination Period | Stringency Index | BM | Log (TV) | Log (MV) | Δ Infections to Cases | Δ Deaths to Cases | |
|---|---|---|---|---|---|---|---|---|---|---|---|
| Panel A: Total sample | |||||||||||
| Mean | −4.901 | −4.895 | 1.852 | 71.474 | 0.209 | 55.363 | 0.947 | 8.781 | 8.829 | 0.005 | 0 |
| Standard deviation | 1.501 | 1.339 | 4.121 | 228.178 | 0.407 | 25.792 | 0.718 | 3.694 | 2.368 | 0.060 | 0.001 |
| First quartile | −5.665 | −5.617 | 0 | 0 | 0 | 42.130 | 0.509 | 6.738 | 7.373 | −0.002 | 0 |
| Median | −4.640 | −4.689 | 0 | 0 | 0 | 61.570 | 0.796 | 9.410 | 8.952 | 0 | 0 |
| Third quartile | −3.856 | −3.957 | 0 | 0 | 0 | 75 | 1.158 | 11.653 | 10.448 | 0.003 | 0 |
| Panel B: Developed markets | |||||||||||
| Mean | −4.604 | −4.658 | 2.243 | 94.306 | 0.240 | 54.040 | 0.880 | 10.304 | 9.712 | 0.005 | 0 |
| Standard deviation | 1.355 | 1.213 | 4.481 | 259.021 | 0.427 | 24.456 | 0.817 | 3.277 | 2.233 | 0.059 | 0.001 |
| First quartile | −5.263 | −5.270 | 0 | 0 | 0 | 40.740 | 0.452 | 9.344 | 8.550 | −0.001 | 0 |
| Median | −4.384 | −4.482 | 0 | 0 | 0 | 60.190 | 0.698 | 10.973 | 10.203 | 0 | 0 |
| Third quartile | −3.700 | −3.850 | 0 | 0 | 0 | 71.760 | 1.009 | 12.344 | 11.079 | 0.003 | 0 |
| Panel C: Emerging markets | |||||||||||
| Mean | −5.079 | −5.037 | 1.617 | 57.753 | 0.191 | 56.158 | 0.987 | 7.759 | 8.299 | 0.004 | 0 |
| Standard deviation | 1.555 | 1.390 | 3.870 | 206.250 | 0.393 | 26.532 | 0.648 | 3.606 | 2.287 | 0.061 | 0.001 |
| First quartile | −5.880 | −5.829 | 0 | 0 | 0 | 42.590 | 0.561 | 5.338 | 6.671 | −0.002 | 0 |
| Median | −4.806 | −4.833 | 0 | 0 | 0 | 62.500 | 0.854 | 8.446 | 8.569 | 0 | 0 |
| Third quartile | −3.978 | −4.040 | 0 | 0 | 0 | 76.850 | 1.269 | 10.29 | 9.589 | 0.003 | 0 |
Notes: This table displays the descriptive statistics of the variables used in our regression models. Panel A (Panel B, Panel C) visualizes the descriptive statistics for the full sample (subsample of developed markets, subsample of emerging markets). Variables are organized in columns, and statistics are in rows. The statistics encompass the mean, the standard deviation, and the quartiles. The dependent variable, Log |R| (Log |RRCAPM|), is the natural logarithm of absolute daily returns (the natural logarithm of residuals from the CAPM model). Log (Daily Vaccinations), Daily Vaccinations Per 100,000, and Vaccination Period are the key explanatory variables. Log (Daily Vaccinations) is the natural logarithm of one plus the number of daily COVID-19 vaccinations. Daily Vaccinations per 100,000 is the number of daily COVID-19 vaccinations divided by the country’s population size and multiplied by 100,000. Vaccination Period is a dummy variable that takes on value one for the period starting from the country’s first vaccination day and takes on value zero otherwise. Stringency Index is an index number that varies between 0 and 100. It measures the stringency of daily government response to COVID-19; it is computed using different government non-pharmaceutical interventions. BM denotes the book-to-market ratio. Log (TV) represents the logarithm of the daily trading volume. Log (MV) is the natural logarithm of market capitalization. TV and MV are sourced in U.S. dollars. Δ Infections to Cases is calculated as the daily change in the quantity of COVID-19 infections to the total number of confirmed COVID-19 cases (in %). Δ Deaths to Cases is computed as the daily change in the number of COVID-19 fatalities to the total number of confirmed COVID-19 cases (in %). To minimize measurement errors, all continuous variables are winsorized at both the 1st and 99th percentiles.
Table 3.
Correlation coefficients between the major variables.
| 1. | 2. | 3. | 4. | 5. | 6. | 7. | 8. | 9. | 10. | 11. | |
|---|---|---|---|---|---|---|---|---|---|---|---|
| 1. Log |R| | 1.000 | ||||||||||
| 2. Log |RRCAPM| | 0.714 | 1.000 | |||||||||
| 3. Log (Daily Vaccinations) | −0.002 | 0.003 | 1.000 | ||||||||
| 4. Daily Vacc. Per 100,000 | −0.012 | −0.016 | 0.737 | 1.000 | |||||||
| 5. Vaccination Period | −0.031 | −0.024 | 0.873 | 0.608 | 1.000 | ||||||
| 6. Stringency Index | 0.059 | 0.078 | 0.216 | 0.167 | 0.227 | 1.000 | |||||
| 7. BM | 0.078 | 0.106 | −0.100 | −0.089 | −0.103 | 0.151 | 1.000 | ||||
| 8. Log (TV) | 0.144 | 0.123 | 0.086 | 0.046 | 0.024 | −0.017 | −0.231 | 1.000 | |||
| 9. Log (MV) | 0.104 | 0.091 | 0.132 | 0.069 | 0.070 | −0.021 | −0.236 | 0.878 | 1.000 | ||
| 10. Δ Infections to Cases | 0.030 | 0.031 | −0.029 | −0.013 | −0.039 | −0.061 | 0.006 | 0.018 | 0.007 | 1.000 | |
| 11. Δ Deaths to Cases | 0.010 | 0.020 | −0.016 | −0.006 | −0.022 | 0.015 | 0.015 | 0.016 | 0.007 | 0.348 | 1.000 |
Notes: The table presents the pairwise correlation coefficients among the main variables employed in our baseline regression models. The variables are defined in the notes to Table 2.
Table 4.
Main regressions.
| Dependent Variable: Log |R| | Dependent Variable: Log |RRCAPM| | |||||
|---|---|---|---|---|---|---|
| (1) | (2) | (3) | (4) | (5) | (6) | |
| Log (Daily Vaccinations) t−1 | −0.0179 *** | −0.0097 *** | ||||
| (−4.90) | (−2.79) | |||||
| Daily Vacc. Per 100,000 t−1 | −0.0003 *** | −0.0002 *** | ||||
| (−5.10) | (−3.88) | |||||
| Vaccination Period | −0.2180 *** | −0.1541 *** | ||||
| (−5.46) | (−4.01) | |||||
| Stringency Index t−1 | 0.0022 *** | 0.0018 *** | 0.0024 *** | 0.0028 *** | 0.0027 *** | 0.0031 *** |
| (3.11) | (2.77) | (3.37) | (4.93) | (5.09) | (5.16) | |
| BM t−1 | 0.2782 | 0.3174 | 0.2527 | 0.3423 * | 0.3529 * | 0.3087 * |
| (1.37) | (1.52) | (1.27) | (1.91) | (1.97) | (1.78) | |
| Log (TV) t−1 | 0.1175 *** | 0.1145 *** | 0.1192 *** | 0.1103 *** | 0.1088 *** | 0.1122 *** |
| (4.54) | (4.39) | (4.65) | (5.25) | (5.14) | (5.43) | |
| Δ Infections to Cases t−1 | 1.0440 *** | 1.0398 *** | 1.0368 *** | 1.2015 *** | 1.1969 *** | 1.1950 *** |
| (5.78) | (5.73) | (5.76) | (7.52) | (7.46) | (7.52) | |
| Δ Deaths to Cases t−1 | 2.6445 | 2.2994 | 2.8772 | 8.5283 | 8.1212 | 8.5700 |
| (0.27) | (0.24) | (0.30) | (0.77) | (0.74) | (0.78) | |
| Weekday Dummies | Yes | Yes | Yes | Yes | Yes | Yes |
| Obs. | 17,408 | 17,408 | 17,413 | 17,408 | 17,408 | 17,413 |
| R2 | 0.0194 | 0.0187 | 0.0204 | 0.0221 | 0.0224 | 0.0234 |
| F-value | 29.63 *** | 28.77 *** | 29.61 *** | 30.00 *** | 29.97 *** | 31.80 *** |
Notes: This table summarizes the fixed effects estimates of the relationship between the energy sector’s stock volatility and COVID-19 vaccinations. Baseline regression models are organized in columns, and coefficient estimates are in rows. In these models, two dependent variables are employed: the natural logarithm of absolute daily returns (Log|R|, Columns 1–3) and the natural logarithm of absolute residuals from the CAPM model (Log|RRCAPM|, Columns 4–6). Log (Daily Vaccinations) (Columns 1 and 4), Daily Vaccinations Per 100,000 (Columns 2 and 5), and Vaccination Period (Columns 3 and 6) are the key explanatory variables. The variables are defined in the notes to Table 2. t-statistics, computed based on standard errors clustered at the country level, are in round parentheses beneath the coefficient estimates. Asterisks ***, **, and * denote statistical significance at the 1%, 5%, and 10% levels, respectively.
Table 5.
Robustness tests: modified regressions and alternative variables.
| Panel A: Alternative Regression Frameworks | |||||||||
| Without Weekday Dummies | Random Effects Regressions | Pooled OLS Regressions | |||||||
| (1) | (2) | (3) | (4) | (5) | (6) | (7) | (8) | (9) | |
| Log (Daily Vacc.) t−1 | −0.0180 *** | −0.0178 *** | −0.0134 *** | ||||||
| (−4.90) | (−5.62) | (−2.67) | |||||||
| Daily Vacc. per 100,000 t−1 | −0.0003 *** | −0.0003 *** | −0.0002 ** | ||||||
| (−5.14) | (−5.49) | (−2.10) | |||||||
| Vaccination Period | −0.2190 *** | −0.2153 *** | −0.1914 *** | ||||||
| (−5.47) | (−6.09) | (−3.67) | |||||||
| Control variables | Yes | Yes | Yes | Yes | Yes | Yes | Yes | Yes | Yes |
| Weekday Dummies | No | No | No | Yes | Yes | Yes | Yes | Yes | Yes |
| Obs. | 17,408 | 17,408 | 17,413 | 17,408 | 17,408 | 17,413 | 17,408 | 17,408 | 17,413 |
| R2 | 0.0144 | 0.0136 | 0.0154 | 0.0193 | 0.0186 | 0.0203 | 0.0415 | 0.0410 | 0.0428 |
| F-value (Wald chi2) | 24.39 *** | 27.68 *** | 26.01 *** | (293.07 ***) | (297.96 ***) | (302.37 ***) | 26.12 *** | 25.29 *** | 26.98 *** |
| Panel B: Alternative Dependent Variables | |||||||||
| Dependent Variable: Log |RRFF| | Dependent Variable: Log |RRAMP| | Dependent Variable: Log |RRCAR| | |||||||
| (1) | (2) | (3) | (4) | (5) | (6) | (7) | (8) | (9) | |
| Log (Daily Vacc.) t−1 | −0.0113 *** | −0.0096 ** | −0.0115 *** | ||||||
| (−2.98) | (−2.65) | (−3.08) | |||||||
| Daily Vacc. per 100,000 t−1 | −0.0002 *** | −0.0002 *** | −0.0002 *** | ||||||
| (−4.18) | (−3.67) | (−4.08) | |||||||
| Vaccination Period | −0.1482 *** | −0.1356 *** | −0.1502 *** | ||||||
| (−3.64) | (−3.42) | (−3.76) | |||||||
| Control variables | Yes | Yes | Yes | Yes | Yes | Yes | Yes | Yes | Yes |
| Weekday Dummies | Yes | Yes | Yes | Yes | Yes | Yes | Yes | Yes | Yes |
| Obs. | 17,408 | 17,408 | 17,413 | 17,408 | 17,408 | 17,413 | 17,408 | 17,408 | 17,413 |
| R2 | 0.0199 | 0.0202 | 0.0206 | 0.0203 | 0.0206 | 0.0210 | 0.0192 | 0.0194 | 0.0199 |
| F-value | 22.40 *** | 23.28 *** | 23.70 *** | 22.98 *** | 24.64 *** | 22.79 *** | 24.69 *** | 24.87 *** | 25.33 *** |
Notes: This table summarizes our robustness tests of the relation between the energy sector’s stock volatility and COVID-19 vaccinations. Regression models are organized in columns, and coefficient estimates are in rows. Panel A summarizes the estimated regression models without the week-day dummies (Columns 1–3), the regression models estimated with the random-effects estimator (Columns 4–6), and the regression models estimated with the pooled OLS estimator (Columns 7–9). The dependent variable is the natural logarithm of absolute daily returns (Log |R|). Panel B summarizes nine regression models estimated with the fixed-effects estimator. In Columns 1–3, the dependent variable is the natural logarithm of absolute residuals from the Fama and French (1993) model (Log |RRFF|). In Columns 4–6, the dependent variable is the natural logarithm of absolute residuals from the Asness et al. (2013) model (Log |RRAMP|). In Columns 7–9, the dependent variable is the Carhart (1997) model (Log |RRCAR|) model. Log (Daily Vaccinations) (Columns 1, 4, and 7), Daily Vaccinations Per 100,000 (Columns 2, 5, and 8), and Vaccination Period (Columns 3, 6, and 9) are the key explanatory variables. The variables are defined in the notes to Table 2. t-statistics, computed based on standard errors clustered at the country level, are in round parentheses beneath the coefficient estimates. Asterisks ***, **, and * denote statistical significance at the 1%, 5%, and 10% levels, respectively.
Table 6.
Robustness tests: additional control variables and alternative study periods.
| Panel A: Additional Control Variables: Set 1 | ||||||
| Log (MV) t−1 | Momentum t−1 | |||||
| (1) | (2) | (3) | (4) | (5) | (6) | |
| Log (Daily Vaccinations) t−1 | −0.0119 *** | −0.0132 *** | ||||
| (−3.40) | (−3.06) | |||||
| Daily Vaccinations Per 100,000 t−1 | −0.0002 *** | −0.0002 *** | ||||
| (−3.92) | (−2.98) | |||||
| Vaccination Period | −0.1576 *** | −0.1921 *** | ||||
| (−4.34) | (−3.91) | |||||
| Additional control variable | −0.3234 *** | −0.3284 *** | −0.3194 *** | −0.1069 | −0.1547 ** | −0.0560 |
| (−8.12) | (−7.72) | (−8.44) | (−1.59) | (−2.52) | (−0.77) | |
| Control variables | Yes | Yes | Yes | Yes | Yes | Yes |
| Weekday Dummies | Yes | Yes | Yes | Yes | Yes | Yes |
| Obs. | 17,408 | 17,408 | 17,413 | 17,408 | 17,408 | 17,413 |
| R2 | 0.0312 | 0.0310 | 0.0320 | 0.0197 | 0.0194 | 0.0205 |
| F-value | 24.68 *** | 25.69 *** | 25.44 *** | 27.01 *** | 29.62 *** | 28.10 *** |
| Panel B: Additional Control Variables: Set 2 | ||||||
| Crisis | US Elections | |||||
| (1) | (2) | (3) | (4) | (5) | (6) | |
| Log (Daily Vaccinations) t−1 | −0.0166 *** | −0.0204 *** | ||||
| (−4.76) | (−5.25) | |||||
| Daily Vaccinations Per 100,000 t−1 | −0.0003 *** | −0.0003 *** | ||||
| (−5.15) | (−5.23) | |||||
| Vaccination Period | −0.1984 *** | −0.2436 *** | ||||
| (−5.12) | (−5.79) | |||||
| Additional control variable | 0.8313 *** | 0.8372 *** | 0.8240 *** | −0.1596 *** | −0.1480 *** | −0.1656 *** |
| (15.02) | (15.07) | (15.02) | (−4.09) | (−3.91) | (−4.28) | |
| Control variables | Yes | Yes | Yes | Yes | Yes | Yes |
| Weekday Dummies | Yes | Yes | Yes | Yes | Yes | Yes |
| Obs. | 17,408 | 17,408 | 17,413 | 17,408 | 17,408 | 17,413 |
| R2 | 0.0399 | 0.0395 | 0.0405 | 0.0210 | 0.0200 | 0.0221 |
| F-value | 59.09 *** | 58.68 *** | 56.53 *** | 27.42 *** | 25.32 *** | 27.12 *** |
| Panel C: Additional Control Variables: Set 3 | ||||||
| With Month Dummies | With Quarter Dummies | |||||
| (1) | (2) | (3) | (4) | (5) | (6) | |
| Log (Daily Vaccinations) t−1 | −0.0397 *** | −0.0343 *** | ||||
| (−7.98) | (−7.23) | |||||
| Daily Vaccinations Per 100,000 t−1 | −0.0005 *** | −0.0004 *** | ||||
| (−6.70) | (−6.70) | |||||
| Vaccination Period | −0.5011 *** | −0.4441 *** | ||||
| (−8.99) | (−8.03) | |||||
| Control variables | Yes | Yes | Yes | Yes | Yes | Yes |
| Weekday Dummies | Yes | Yes | Yes | Yes | Yes | Yes |
| Obs. | 17,408 | 17,408 | 17,413 | 17,408 | 17,408 | 17,413 |
| R2 | 0.0433 | 0.0396 | 0.0468 | 0.0298 | 0.0262 | 0.0335 |
| F-value | 36.44 *** | 31.80 *** | 36.99 *** | 40.70 *** | 38.59 *** | 41.37 *** |
| Panel D: Alternative Study Periods | ||||||
| Subpanel D1: Starting from 11 March 2020 (when the WHO Considered the COVID-19 as a Pandemic) | Subpanel D2: Starting from 6 June 2020 (End of the Post-Crisis Recovery Period, Bae et al. 2021) | |||||
| (1) | (2) | (3) | (4) | (5) | (6) | |
| Log (Daily Vaccinations) t−1 | −0.0180 *** | −0.0120 *** | ||||
| (−4.83) | (−4.17) | |||||
| Daily Vaccinations Per 100,000 t−1 | −0.0003 *** | −0.0002 *** | ||||
| (−4.97) | (−4.40) | |||||
| Vaccination Period | −0.2166 *** | −0.1469 *** | ||||
| (−5.40) | (−4.53) | |||||
| Control variables | Yes | Yes | Yes | Yes | Yes | Yes |
| Weekday Dummies | Yes | Yes | Yes | Yes | Yes | Yes |
| Obs. | 14,933 | 14,933 | 14,933 | 13,033 | 13,033 | 13,033 |
| R2 | 0.0197 | 0.0189 | 0.0209 | 0.0117 | 0.0116 | 0.0123 |
| F-value | 27.34 *** | 25.76*** | 27.08 *** | 18.20 *** | 17.13 *** | 18.07 *** |
Notes: This table summarizes our further robustness tests of the relationship between the energy sector’s stock volatility and COVID-19 vaccinations. All regression models are estimated with the fixed-effects estimation method. Models are organized in columns, and coefficient estimates are in rows. The dependent variable is the natural logarithm of absolute daily returns, Log |R|. In Panel A, we incorporate additional control variables. Specifically, Log (MV) is the natural logarithm of market capitalization in U.S. dollars (Columns 1–3). Momentum is defined as the total log return in months t–12 to t–2 (Columns 4–6). In Panel B, we include two other additional controls, namely, Crisis, which is a binary variable that takes value 1 for the COVID-19 crisis period from 18 February 2020 to 20 March 2020 (Bae et al. 2021) (Columns 1–3), and US Elections, which is a dummy variable that takes on value one for the period that starts on 3 November 2020 and ends on 7 January 2021, and takes value zero otherwise (Columns 4–6). In Panel C, the regression models include month (Columns 1–3) and quarter (Columns 4–6) dummies. In Panel D, the estimated regression models vary in terms of sample periods. In Subpanel D1, the sample period begins on 11 March 2020 (when the WHO declares COVID-19 a pandemic) (Columns 1–3). In Subpanel D2, the sample period begins on 6 June 2020 (which marks the post-crisis recovery period, please see Bae et al. 2021) (Columns 4–6). Log (Daily Vaccinations), Daily Vaccinations Per 100,000, and Vaccination Period are the key explanatory variables. The variables are defined in the notes to Table 2. t-statistics, computed based on standard errors clustered at the country level, are in round parentheses beneath the coefficient estimates. Asterisks ***, **, and * denote statistical significance at the 1%, 5%, and 10% levels, respectively.
Table 7.
Vaccinations and volatility: developed vs. emerging markets.
| Emerging | Developed | Emerging | Developed | Emerging | Developed | |
|---|---|---|---|---|---|---|
| (1) | (2) | (3) | (4) | (5) | (6) | |
| Log (Daily Vaccinations) t−1 | −0.0145 *** | −0.0241 *** | ||||
| (−2.99) | (−5.63) | |||||
| Daily Vaccinations Per 100,000 t−1 | −0.0003 *** | −0.0003 *** | ||||
| (−2.91) | (−4.29) | |||||
| Vaccination Period | −0.1643 *** | −0.3067 *** | ||||
| (−3.16) | (−6.67) | |||||
| Stringency Index t−1 | 0.0008 | 0.0038 *** | 0.0005 | 0.0032 *** | 0.0009 | 0.0044 *** |
| (1.12) | (3.98) | (0.80) | (3.55) | (1.22) | (4.76) | |
| BM t−1 | 0.4888 * | 0.1585 | 0.5296 ** | 0.1985 | 0.4713 * | 0.1239 |
| (2.00) | (0.72) | (2.18) | (0.83) | (1.95) | (0.57) | |
| Log (TV) t−1 | 0.0768 ** | 0.2493 *** | 0.0762 ** | 0.2358 *** | 0.0782 ** | 0.2513 *** |
| (2.61) | (4.30) | (2.56) | (4.18) | (2.68) | (4.45) | |
| Δ Infections to Cases t−1 | 1.0746 *** | 0.8912 *** | 1.0726 *** | 0.8889 *** | 1.0660 *** | 0.8930 *** |
| (4.34) | (3.48) | (4.33) | (3.42) | (4.32) | (3.49) | |
| Δ Deaths to Cases t−1 | −5.0478 | 9.0931 | −5.2470 | 8.8714 | −4.9333 | 9.4964 |
| (−0.38) | (0.62) | (−0.40) | (0.61) | (−0.37) | (0.66) | |
| Weekday Dummies | Yes | Yes | Yes | Yes | Yes | Yes |
| Obs. | 10,418 | 6990 | 10,418 | 6990 | 10,422 | 6991 |
| R2 | 0.0164 | 0.0349 | 0.0162 | 0.0327 | 0.0168 | 0.0373 |
| F-value | 20.76 *** | 25.51 *** | 17.66 *** | 19.45 *** | 21.00 *** | 29.14 *** |
Notes: This table summarizes the fixed effects estimates of the relation between the energy sector’s stock volatility and COVID-19 vaccinations for emerging (Columns 1, 3, and 5) and developed (Columns 2, 4, and 6) markets. Baseline regression models are organized in columns, and coefficient estimates are in rows. The dependent variable is the logarithm of absolute daily returns, Log |R|. Log (Daily Vaccinations) (Columns 1 and 2), Daily Vaccinations Per 100,000 (Columns 3 and 4), and Vaccination Period (Columns 5 and 6) are the key explanatory variables. The variables are defined in the notes to Table 2. t-statistics, computed based on standard errors clustered at the country level, are in round parentheses beneath the coefficient estimates. Asterisks ***, **, and * denote statistical significance at the 1%, 5%, and 10% levels, respectively.
Publisher’s Note: MDPI stays neutral with regard to jurisdictional claims in published maps and institutional affiliations. |
© 2021 by the authors. Licensee MDPI, Basel, Switzerland. This article is an open access article distributed under the terms and conditions of the Creative Commons Attribution (CC BY) license (https://creativecommons.org/licenses/by/4.0/).
Share and Cite
MDPI and ACS Style
Demir, E.; Kizys, R.; Rouatbi, W.; Zaremba, A. COVID-19 Vaccinations and the Volatility of Energy Companies in International Markets. J. Risk Financial Manag. 2021, 14, 611. https://0-doi-org.brum.beds.ac.uk/10.3390/jrfm14120611
AMA Style
Demir E, Kizys R, Rouatbi W, Zaremba A. COVID-19 Vaccinations and the Volatility of Energy Companies in International Markets. Journal of Risk and Financial Management. 2021; 14(12):611. https://0-doi-org.brum.beds.ac.uk/10.3390/jrfm14120611
Chicago/Turabian StyleDemir, Ender, Renatas Kizys, Wael Rouatbi, and Adam Zaremba. 2021. "COVID-19 Vaccinations and the Volatility of Energy Companies in International Markets" Journal of Risk and Financial Management 14, no. 12: 611. https://0-doi-org.brum.beds.ac.uk/10.3390/jrfm14120611