
Calculation of Ecological Compensation Standards for Arable Land Based on the Value Flow of Support Services


1
Institute of Geographic Sciences and Natural Resources Research, CAS, Beijing 100101, China
2
University of Chinese Academy of Sciences, Beijing 100049, China
*
Author to whom correspondence should be addressed.
Land 2021, 10(7), 719; https://0-doi-org.brum.beds.ac.uk/10.3390/land10070719
Submission received: 8 June 2021
/
Revised: 3 July 2021
/
Accepted: 5 July 2021
/
Published: 8 July 2021
(This article belongs to the Special Issue Sustainable Rural Development: Strategies, Good Practices, and Opportunities Ⅱ)
Abstract
:Food production is the basis for ensuring human survival. Ecological compensation for arable land is important to ensure the sustainable use of arable land and food production. However, how is it possible to set the standard of ecological compensation and how to achieve it scientifically? In this paper, we take China as the study area and link the ecological compensation of arable land with the production, circulation and consumption of three staple foods. The amount of food is converted into the area of arable land needed to produce that food. After calculating the value of ecosystem services that support food production on arable land, the ecological compensation standard is obtained, and the realization mode between regions is constructed. The results show that: (1) the flow of staple foods in China is mainly from north to south and the value of arable land support services provided by northern provinces is greater than that of southern provinces; (2) the province that needs to pay the most ecological compensation for cultivated land is Guangdong Province, with an amount of ¥16.082 billion RMB, and the province that receives the most compensation is Heilongjiang Province, with an amount of ¥21.547 billion RMB; (3) in order to coordinate the collection and distribution of ecological compensation in each province, it is necessary to establish an ecological compensation fund for arable land in the central government. Protecting the ecological status of arable land and ensuring sustainable food production is in the overall interest of the country.
1. Introduction
Ecosystems not only provide products such as food, medicine and raw materials necessary for human life, but also maintain the life support system that humans rely on for survival and development [1]. The Millennium Ecosystem Assessment (MA) classifies ecosystem services into four categories: provisioning, regulating, supporting and cultural services [2]. Provisioning services are often reflected in economic markets in the form of products, such as food and logs. Regulating services such as climate, water and gas regulation are mostly carried by wind or water flows and are valorized between ecosystem service providers and consumers through horizontal ecological compensation (PES). Cultural services are embodied in the form of attracting tourists [3]. Support services, on the other hand, are missing both in market mechanisms and in the policy framework of PES.
MA defines support services as services that guarantee the virtuous cycle of local ecosystems, such as soil formation, nutrient cycling and biodiversity [2]. Thus, support services are the basis for provisioning, regulating and cultural services [2]. Take the production of grains, vegetables and other foods as an example. Soil formation and maintenance are necessary for food production; nutrient cycling is a source of nutrients in the food growth process, and biodiversity also contributes to the suitability of food production for the environment [4]. In addition to the input of labor and material resources, food production cannot be guaranteed without the support services of arable land. However, under the current market mechanism, the prices of food such as grains and vegetables often only include seeds, fertilizers, pesticides, tools and a small amount of labor costs [5], and do not include the ecosystem service value that supports food production in arable ecosystems. Therefore, behind the flow and consumption of food lies the problem of cross-regional occupation and supply of arable land support services.
Grain is the most important food group. China has a large population and a large demand for grain, while the arable land per capita is small [6]. Under such pressure, higher and higher yield per unit area becomes the only option for food production in China [7]. Thirteen of China’s 34 provinces are major grain-producing regions, and accounted for 76% of national production in 2019 [8]. The shift from subsistence smallholder production to modern agriculture pursuing high yields has resulted in increasing inputs of chemical fertilizers and pesticides. Inevitably, food production began to put pressure and damage on arable ecosystems, and even brought more serious problems of surface pollution [9]. Support services have also been severely compromised as a result. The major food-producing provinces have their own urgent economic development needs and agricultural production tasks, as well as the loss of ecosystem services resulting from the high occupation and output of arable land. Therefore, it is necessary to solve the problem of cross-regional occupation and supply of cultivated land support services through administrative means, while protecting the cultivated land ecosystem.
In relatively developed regions and countries, ecocompensation is often referred to as Payment for Ecosystem/Environment Service (PES), and researchers focus more on ecosystem services that can be traded in the market and are useful to humans [10,11], while in developing countries, where socioeconomic development is relatively backward, the overuse of natural resources by population growth and economic growth is the major cause of ecosystem degradation [12]. Ecological compensation is more concerned with regulating the relationship between stakeholders by economic instruments [13]. It is often linked to regional development in order to improve the effectiveness and sustainability of compensation [14,15]. In recent years, many scholars have carried out extensive research on the basic theories [16], systems [17,18,19], compensation standards [20] and implementation mechanisms of ecological compensation. They have made positive progress in areas such as forests [21,22], grasslands [23,24], wetlands [25,26], watersheds [27,28] and national parks [29]. At present, there are relatively few studies on ecological compensation for cultivated land. While foreign researchers have focused on the policy effects of compensation [30], participation in compensation policies [31] and barriers faced in compensation [32], Chinese researchers have conducted a series of studies around compensation standards. There are two main ideas. One is based on the Contingent Valuation Method (CVM) [33], the other on the ecosystem service value method (ESVM) [34]. Both methods have sound theoretical bases and scientific principles and have been widely recognized by researchers. However, the CVM is based on social surveys, which cannot reflect the compensation mechanism from the perspective of actual supply and consumption of ecosystem services. In the existing ESVM, researchers often consider all four ecosystem services [35], which tends to make the compensation standard higher. For example, the beneficiaries of regulating services are related to the influence range of wind or waterflow, and the value of cultural services is reflected by attracting tourists. The ecological compensation of cultivated land is inseparable from food production. We characterize the cross-regional occupation and supply of cultivated land support services through the production, circulation and consumption of food. Using this as the mechanism of compensation can better solve the problems of compensation subject and object and standard formulation.
Based on this, this paper takes the production, circulation and consumption of three staple food in China as the research object to reveal the cross-regional occupation and supply of arable land support services among provinces, building a bridge between the socio-economic system and the ecological value system. Meanwhile, on the basis of accounting for the value of arable land support services, the ecological compensation standard is obtained. Based on the ecological compensation mechanism, the way to realize the ecological compensation of arable land with the state as the hub and between regions is constructed to protect the cultivated land ecosystem and solve the problem of equitable development between regions.
2. Materials and Methods
2.1. Study Area
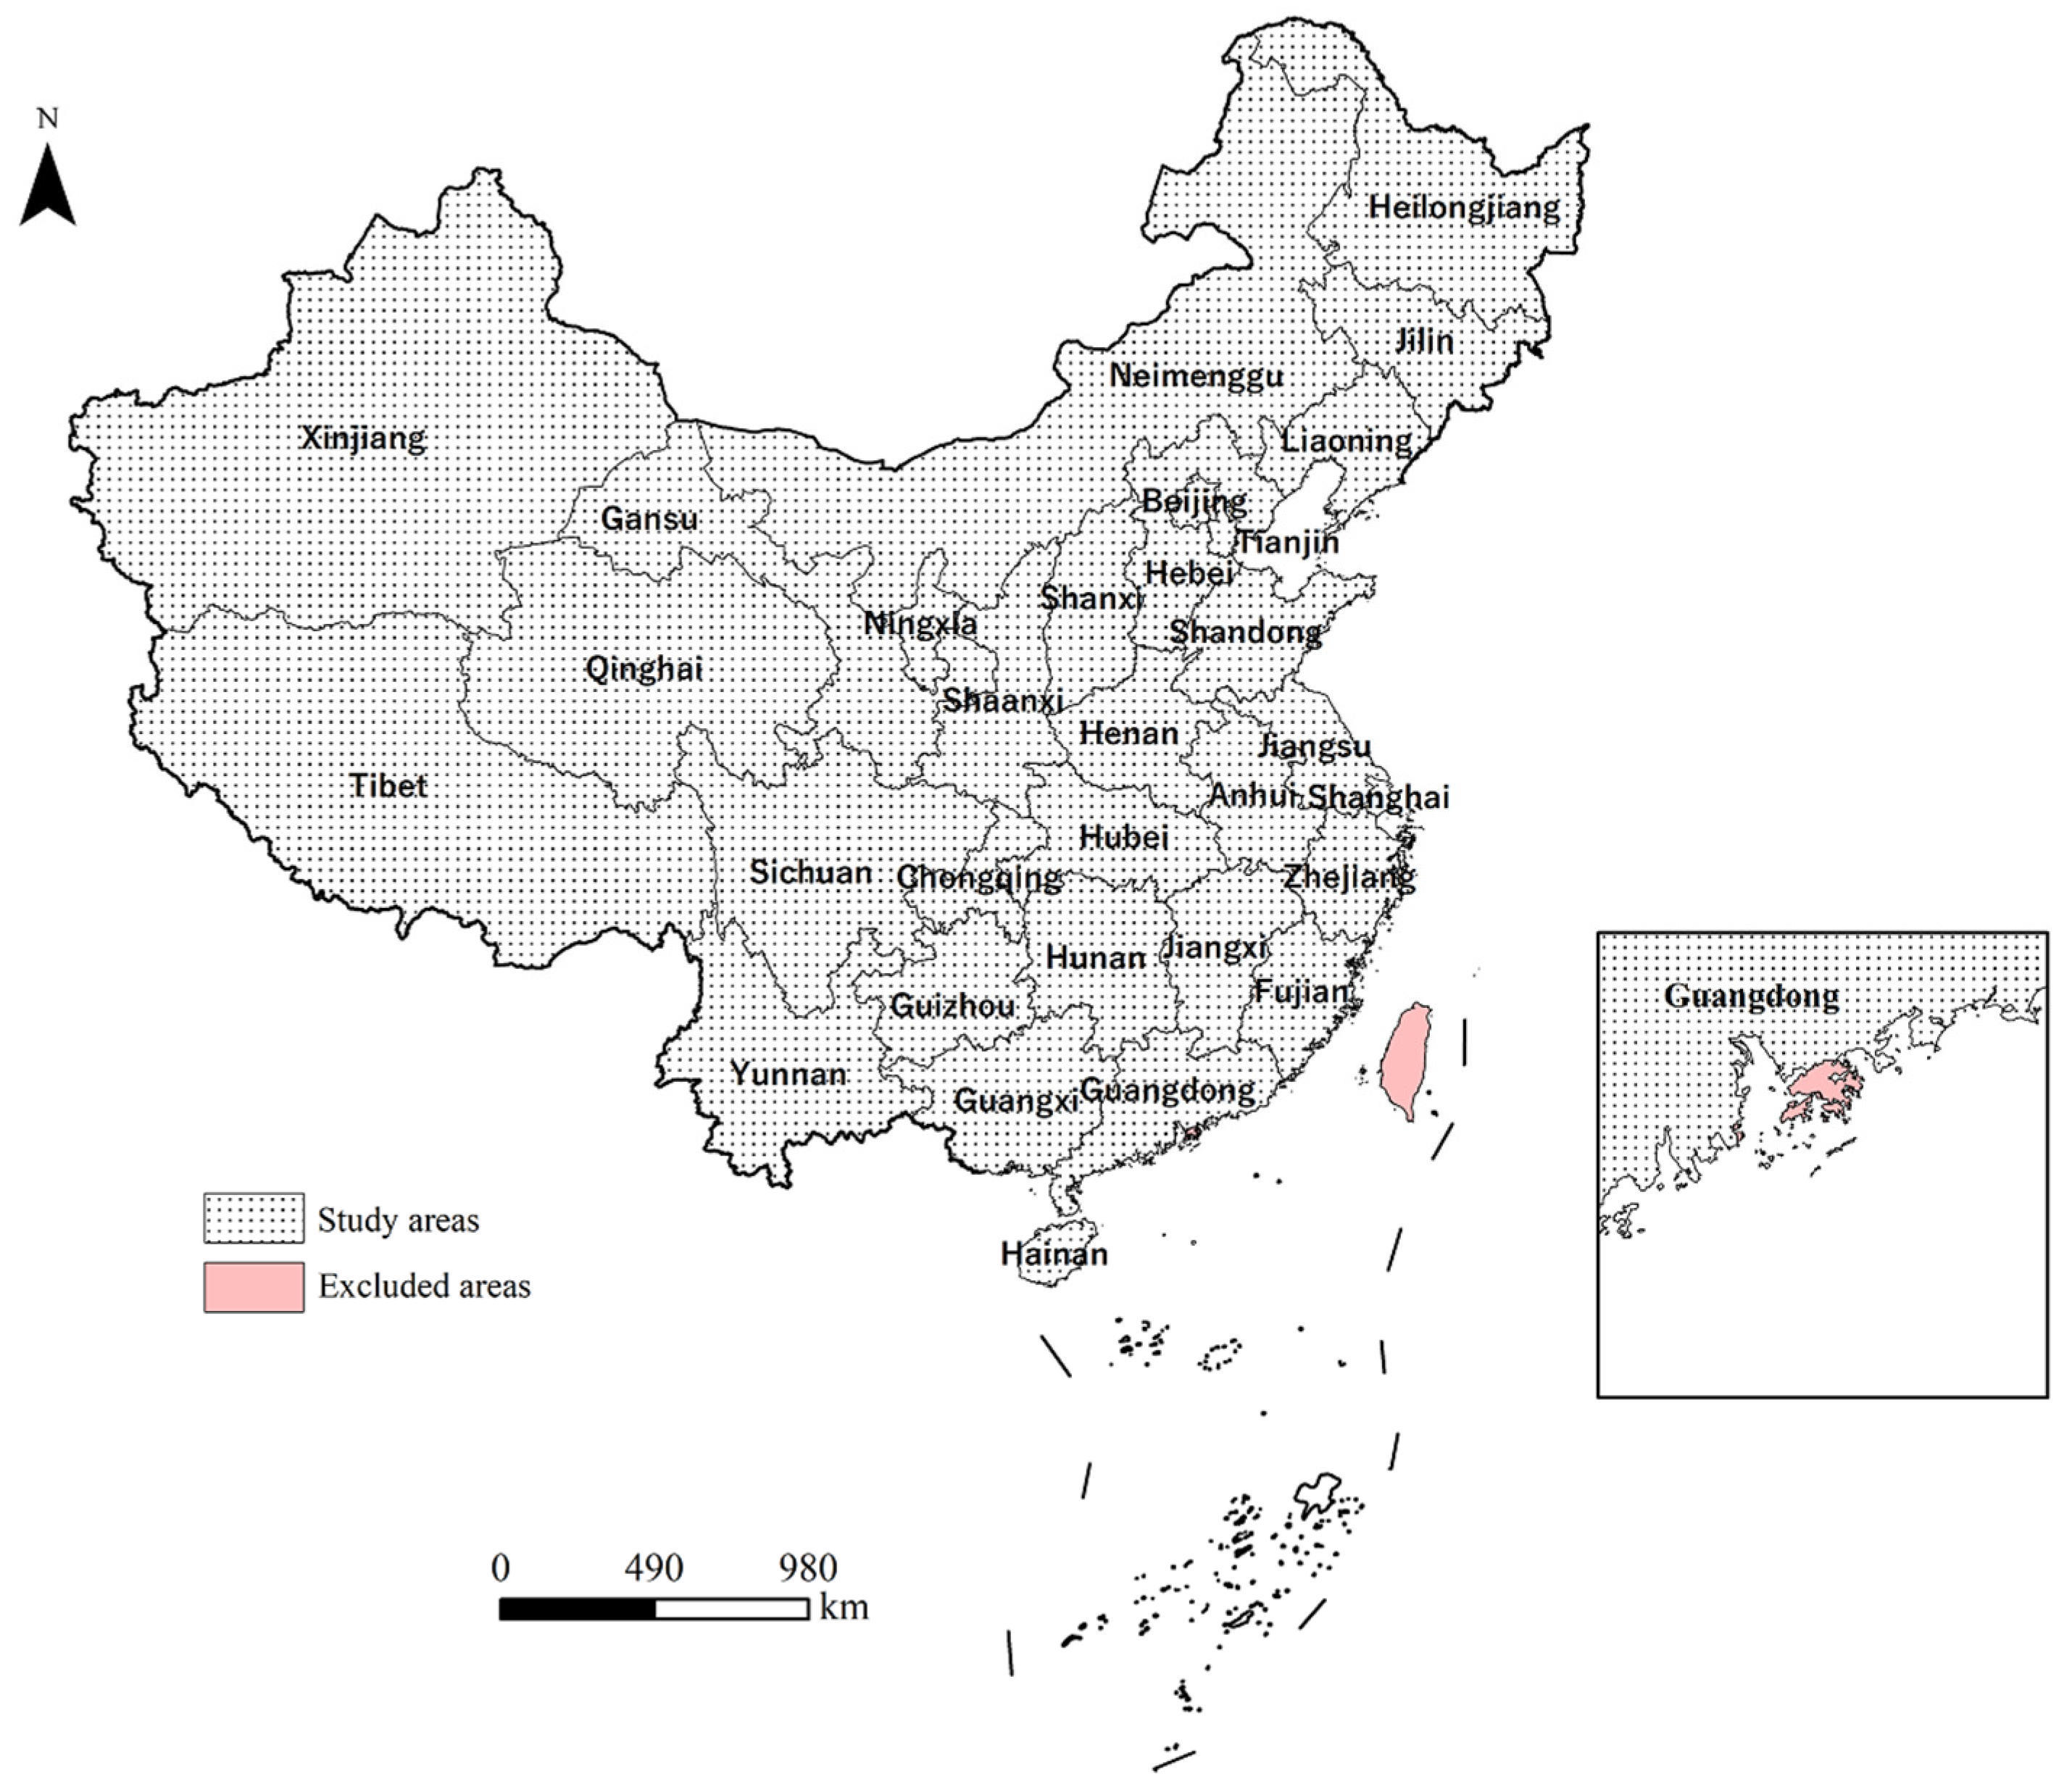
The People’s Republic of China (China) is located at 73°29′–135°2′ E and 3°31′–53°33′ N. It has a land area of about 9.6 million km2 and is governed by 23 provinces, five autonomous regions, four municipalities and two special administrative regions (all referred to as provinces). Due to the limitation of data collection, only 31 provinces are covered in this study, excluding Hong Kong, Macao and Taiwan (Figure 1). China’s terrain is high in the west and low in the east, with rich and diverse geographic landscapes and climate patterns. China is the most populous country in the world, with about 1.39 billion people. Over the past few decades, through hard struggle, China has achieved a historic transformation from not having enough to eat to having enough to eat and having good food on its own. As of 2019, China has about 119 million hectares of arable land, and the total grain output ranks first in the world.
On the other hand, China’s food production at this stage is misaligned with the natural production conditions. Since ancient times, the center of food production in China has been in the south, and the flow pattern of staple foods has been southern grain transported to the north [36]. Compared with the northern regions, the southern regions have more sunlight and more abundant water and have the advantage of agricultural production. However, due to the variability of economic development levels and policies, six of the top eight provinces in China’s grain production in 2019 are located in the northern region. The flow of staple foods has reversed to northern grain transported to the south [37]. As with other ecosystems, there are carrying capacity boundaries for arable land ecosystems. In the north, where light, heat and water resources are relatively poor, this high yield of food production comes at the cost of excessive depletion of soil fertility and damage to cropland ecosystems [38,39,40]. It not only inhibits the function of local arable land ecosystem services, but also is detrimental to the sustainable use of arable land and food production. Therefore, how to construct an effective ecological compensation mechanism for arable land to reduce the damage in the process of food production is important to guarantee both food production and regional equity.
2.2. Methodology
In this study, data on food production and consumption in each province are used to obtain the area of arable land needed to produce the corresponding amount of food. The difference between the area required for production and the area required for consumption is the area of arable land that each province occupies or supplies to other provinces across the region. Then, by calculating the value of arable land support services per unit area, we get the value of ecosystem support services occupied or supplied to other regions by each province, which is also the amount of arable land ecological compensation that each province should pay or receive.
2.2.1. Cross-Regional Occupation and Supply of Cultivated Land Areas
First, since the China Statistical Yearbook contains data on food production, but not on food consumption, we needed to estimate the consumption of food in each province. There are two common macro models. The first model uses data from the China Nutrition Tower and multiplies the daily food intake recommended by experts with the population number to finally obtain the food consumption [41,42]. The drawback of this method is that few people follow the amount of food recommended by the Nutrition Tower. The second model divides food consumption into four categories according to their uses: for eating, for feed, for industry, and for seeds. The four types of food consumption are corrected and estimated by coefficients based on the data available in the statistical yearbook [43,44]. Although the coefficients chosen by the researchers vary, they are generally within a certain range. Thus, this method has a relatively wide application [45,46]. This method was also used in this study.
Second, to convert from food consumption to the area of arable land needed to produce that food, we referred to the ecological footprint model [47]. The ecological footprint was proposed by Wackernagel and Rees [48] and has been developed for more than two decades. It assesses the human impact on ecosystems by measuring the amount of nature that humans use to sustain themselves. For example, assessing a person’s food consumption can be converted into the area of arable land needed to produce that food. Animal consumption, on the other hand, can be converted into the amount of feed needed to raise those animals, and then into the area of arable land needed to produce that feed [48,49,50].
Rice, wheat and maize are the most important types of food produced and consumed in China. Therefore, the compensation standards calculated in this study were obtained based on considering only rice, wheat, and maize. There is a difference in the value of cultivated land support services between dry land and paddy field. Rice is grown in paddy fields and wheat and corn are grown in dryland. Therefore, the annual area of paddy field and dry land to be occupied for food grain, feed grain, industrial grain and seed were calculated separately.
Food grain is the most basic and important way of grain consumption. this paper obtained the food grain consumption of each province in China based on the “per capita consumption of major food items in households by region” in the China Statistical Yearbook. We corrected for consumption using the waste factor and the eating out factor. One study shows that China wastes about 50 billion kg of food per year [51]. According to a study by Xiao [52] in 2002 and referring to China’s current level of economic development, we set the factor of eating out at 12% in 2018. For each province, the annual area of dry land required for food grain () is:
The area of paddy fields () is:
where n = 1 and 2 represent wheat and corn, respectively, Ɛ represents rice, c is the per capita consumption of grains, p is the number of resident population, e is the proportion of consumption of each staple food, h is the proportion of food used for eating out, x represents the grain production per unit area in the province. b is the waste factor, implying the amount of waste corresponding to each kg of food consumed, which can be expressed as:
where W is the total annual food waste in China and C is the total annual food consumption in China.
Feed grain, also known as indirect grain consumption, is the total amount of grain consumed for the production of various livestock products converted from grain, such as meat (including pork, beef and mutton, etc.), milk, eggs and aquatic products. In this paper, considering the actual production situation in China and the international and domestic standards, the feed to meat ratio (FCR) for pork is 4.3:1, for poultry is 2.7:1, for eggs are 2.7:1, for beef and mutton is 2:1, for dairy products is 0.3:1, and for aquatic products is 0.4:1. According to the research of Long [53], feed grain in Chinese feed accounts for about 74% [44,49]. The annual area of dry land to be occupied for feed grain in each province () is:
The area of paddy fields () is:
where m = 1, 2...7 represent pork, poultry, beef, mutton, eggs, milk and aquatic products, respectively, y is the annual production, r represents the feed to meat ratio (FCR), which is the amount of feed consumed by the raised livestock to gain 1 kg of weight, a represents the ratio of various grains in the feed and k is the coefficient of grain in the feed, equal to 0.74 [53].
Industrial grain refers to the collective term for grain used in industries that use grain as the main raw material or auxiliary material. Various products such as liquor, alcohol and monosodium glutamate (MSG) are the main products of industrial grain. Therefore, we choose four industrial products, namely liquor, beer, alcohol and MSG, and estimated them according to the corresponding discounted grain coefficients [52]. Through extensive literature research, we used a grain folding factor of 1:2.3 for white wine, 1:0.172 for beer, 1:3 for alcohol and 1:24 for MSG [52]. The theoretical dryland area () to be occupied annually by industrial grain in each province can be expressed as:
The area of paddy fields () is:
where u = 1, 2, 3, 4 represent white wine, beer, alcohol and MSG respectively, ρ represents the average density of the liquid, s is the coefficient of grain folding and t represents the proportion of each crop in the production of industrial products.
Seed grain use accounts for a relatively small amount of about 1% per year. We extrapolated from the amount of grain used per unit area of seed for different food crops and their sown area. Referring to the study of Yao [44], the sowing rates were estimated according to 75 kg/hm2 for rice, 150 kg/hm2 for wheat and 75 kg/hm2 for maize. For a province, the formula for estimating the area of dry land occupied by seed grain () is:
The area of paddy fields () is:
where, d is the sown area of the grain in the region, and γ is the amount of seed sown per unit area of the grain.
We subtracted the area of arable land required for food consumption from the area of food sown (obtained from the statistical yearbook). If the value was positive, it means that the province supplies arable land resources to other provinces and should receive the compensation amount. Otherwise, the province takes arable land area of other provinces in the process of food consumption and should pay the compensation amount. For dry lands, the area supplied or occupied for each province () can be expressed as:
For paddy fields, the area supplied or occupied () can be expressed as:
where Aλo denotes the sum of sown area of wheat and corn, A(λ,μ) is positive to represent the supplied area and A(λ,μ) is negative to represent the occupied area.
2.2.2. Assessment of the Value of Arable Land Support Services
In addition to the sale price of food, which reflects the supply services of the arable ecosystem, food also contains the value of arable land support services that support its production. Currently, there are three main methods for valuing ecosystem services per unit area: the Contingent Valuation Method (CVM), the functional value assessment (FVA) and the equivalent factor assessment (EFA).
Because our study area covered 31 provinces in China, it was difficult for us to meet the requirements of the CVM with numerous questionnaire surveys [54]. The FVA, on the other hand, often requires different ecological equations and coefficient inputs for different service functions [55]. The calculation process is more complicated, so this method is mostly focused on small-scale study areas.
The third method is the equivalent factor assessment (EFA). The EFA was first proposed by Costanza [56] in Nature. Compared to the FVA, the EFA is more intuitive and easy to use, and is particularly suitable for valuing ecosystem services at large-scales. Based on the Costanza’s valuation system, the Chinese scholar Xie conducted a questionnaire survey of about 700 Chinese professionals with ecological background in 2002 and 2007, respectively, and came up with a new and more suitable unit price system for ecosystem valuation in China [57]. Based on this, the EFA was improved and developed in 2015 by combining statistical information and remote sensing monitoring [58]. As of March 2021, this ecosystem service value equivalent system has accumulated more than 6000 citations in China. Therefore, this study used the results of Xie’s study to select specific parameters related to support services in arable ecosystems for calculation (Table 1).
Based on this, the value of ecosystem support services per unit area for arable land (V) can be expressed as:
where λ and μ represent dry land and paddy field, respectively, i denotes three specific categories of arable land support services, Q is the amount of economic value of one ecosystem service value equivalent factor, which in this paper, refers to the improved research results of Xie 2015, Q takes the value of ¥3406.5 hm−2 [58] and l represents the value equivalent factor of the cultivated land support services per unit area.
2.2.3. Calculation of Ecological Compensation Standard for Arable Land
Based on the above calculation, the area supplied or occupied by each province to other provinces is multiplied with the value of ecosystem support services per unit area of cropland to obtain the standard (Y) that each province should compensate or be compensated. It can be expressed as:
2.3. Data Source
In order to understand the cross-regional occupation and supply of arable land support services behind the production, circulation and consumption of food in China, this study collected production and consumption data of wheat, corn and rice in 31 provinces. We also obtained the model methods and related parameters on the value of cultivated land support services through literature research.
The research data was based on 2018, and the data sources mainly include China Statistical Yearbook, China Agricultural Statistical Yearbook, China Food Industry Yearbook, China Sugar and Wine Yearbook, China Agricultural Products Processing Yearbook, and China Brewing Industry Yearbook. The information obtained includes unit area production of various grain by region, sown area, per capita consumption of major food items in households by region, number of resident population by region, annual production of pork, poultry meat, beef and mutton, eggs, milk and aquatic products by region, and information on annual production of liquor, beer, alcohol and MSG by region.
3. Results
3.1. The Results of Cross-Regional Occupation and Supply of Cultivated Land Areas
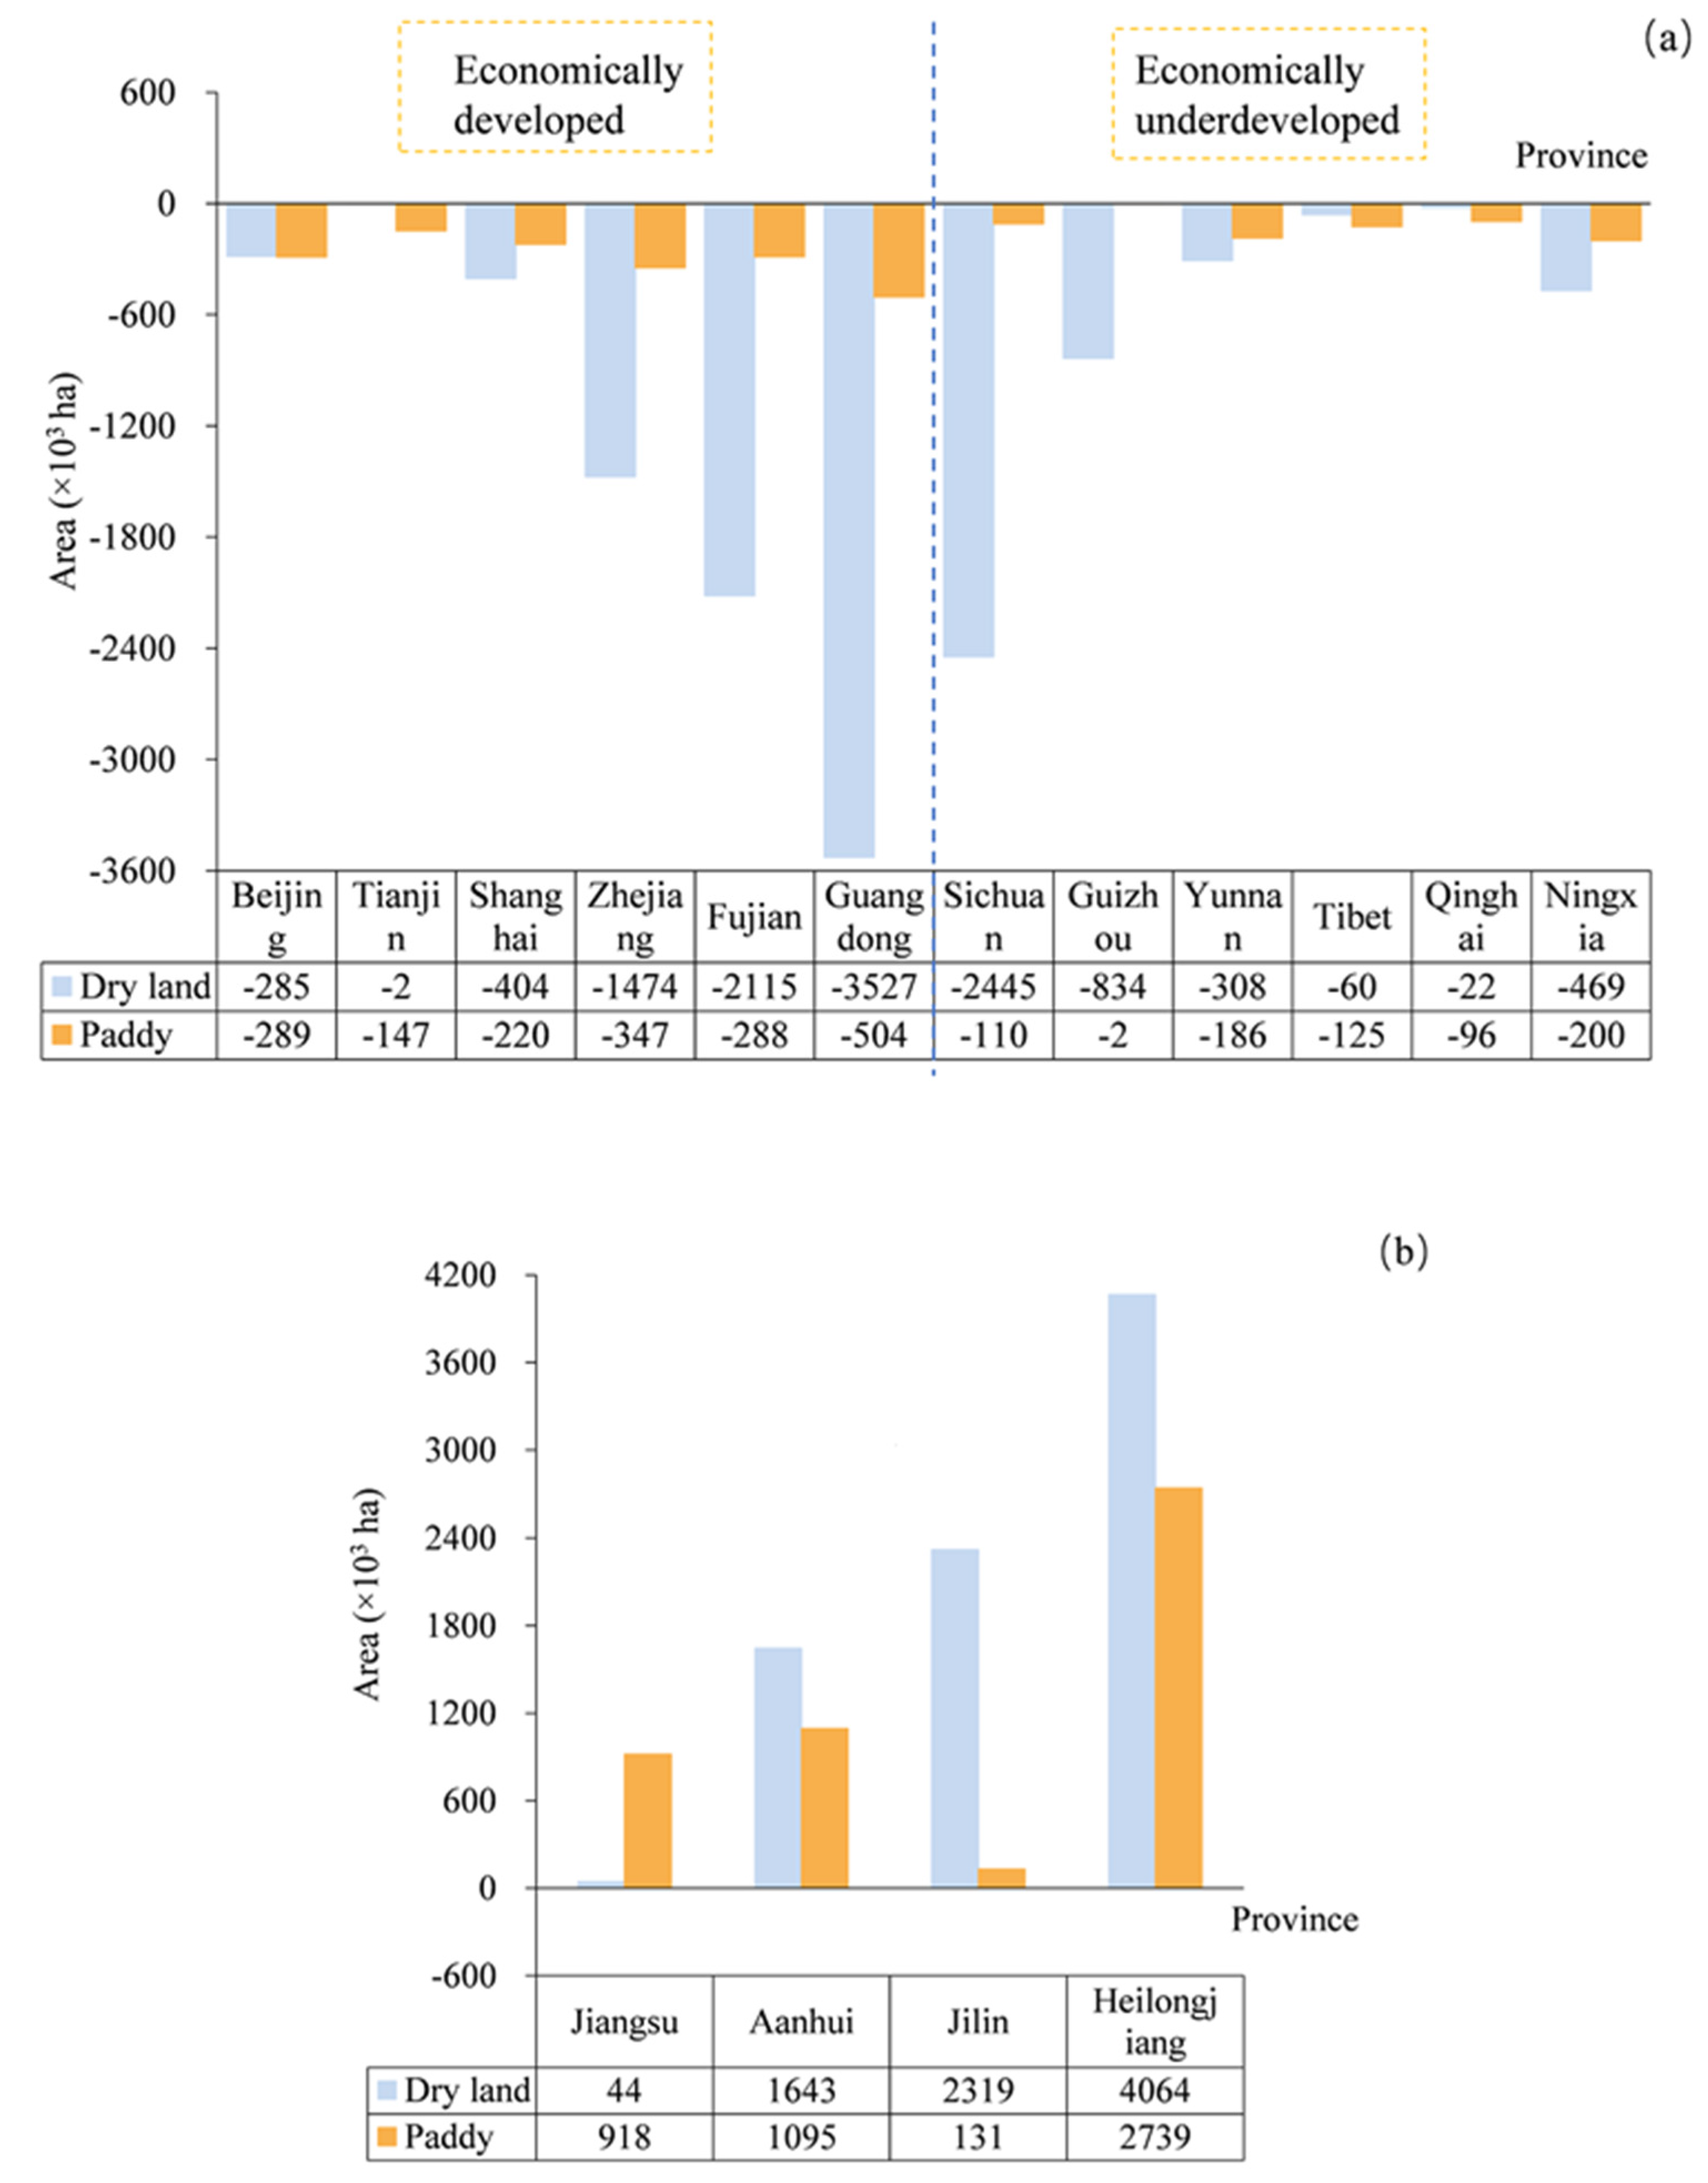
Due to the variability in natural endowments, consumption habits and related industries, the cross-regional occupation and supply of arable land resources in 31 provinces in China have obvious spatial heterogeneity. Guangdong Province has the largest cross-regional occupation areas of arable land with 4.03 × 10⁶ ha. Heilongjiang has the largest supply with 6.8 × 10⁶ ha, followed by Henan Province with 3.1 × 10⁶ ha. The 31 provinces involved in the study can be divided into three groups according to the cross-regional occupation and supply of arable land.
Both dry land and paddy field are negative in the first group (Figure 2a). In other words, neither of their own arable land area can meet the demand, and they occupy the arable land areas of other provinces in the process of food consumption. This includes 12 provinces, including Beijing, Tianjin, Shanghai, Zhejiang, Fujian, Guangdong, Sichuan, Guizhou, Yunnan, Tibet, Qinghai and Ningxia. A more pronounced polarization occurs among them. Provinces such as Beijing, Tianjin, Shanghai, Guangdong, Zhejiang and Fujian are economically developed, attractive to talent and have a large resident population. In the process of economic development, more of its land has been used for the development of secondary and tertiary industries, with a small agricultural population and a low food self-sufficiency rate. Yunnan, Qinghai, Tibet and Ningxia, on the other hand, have relatively low levels of economic development and serious population loss. Some regions are also limited by natural conditions. For example, Tibet is located on the Qinghai-Tibet Plateau with complex topographical conditions. The arable land area is small and has to occupy the land of other provinces across the region.
The second group is provinces with positive values for both dry land and paddy fields (Figure 2b). In other words, their dry land area and paddy field area can not only meet their own needs, but also supply other provinces across the region. There are only four such provinces, namely Jilin, Heilongjiang, Jiangsu and Anhui. They all have strong advantages in agricultural resources and belong to the traditional large agricultural provinces.
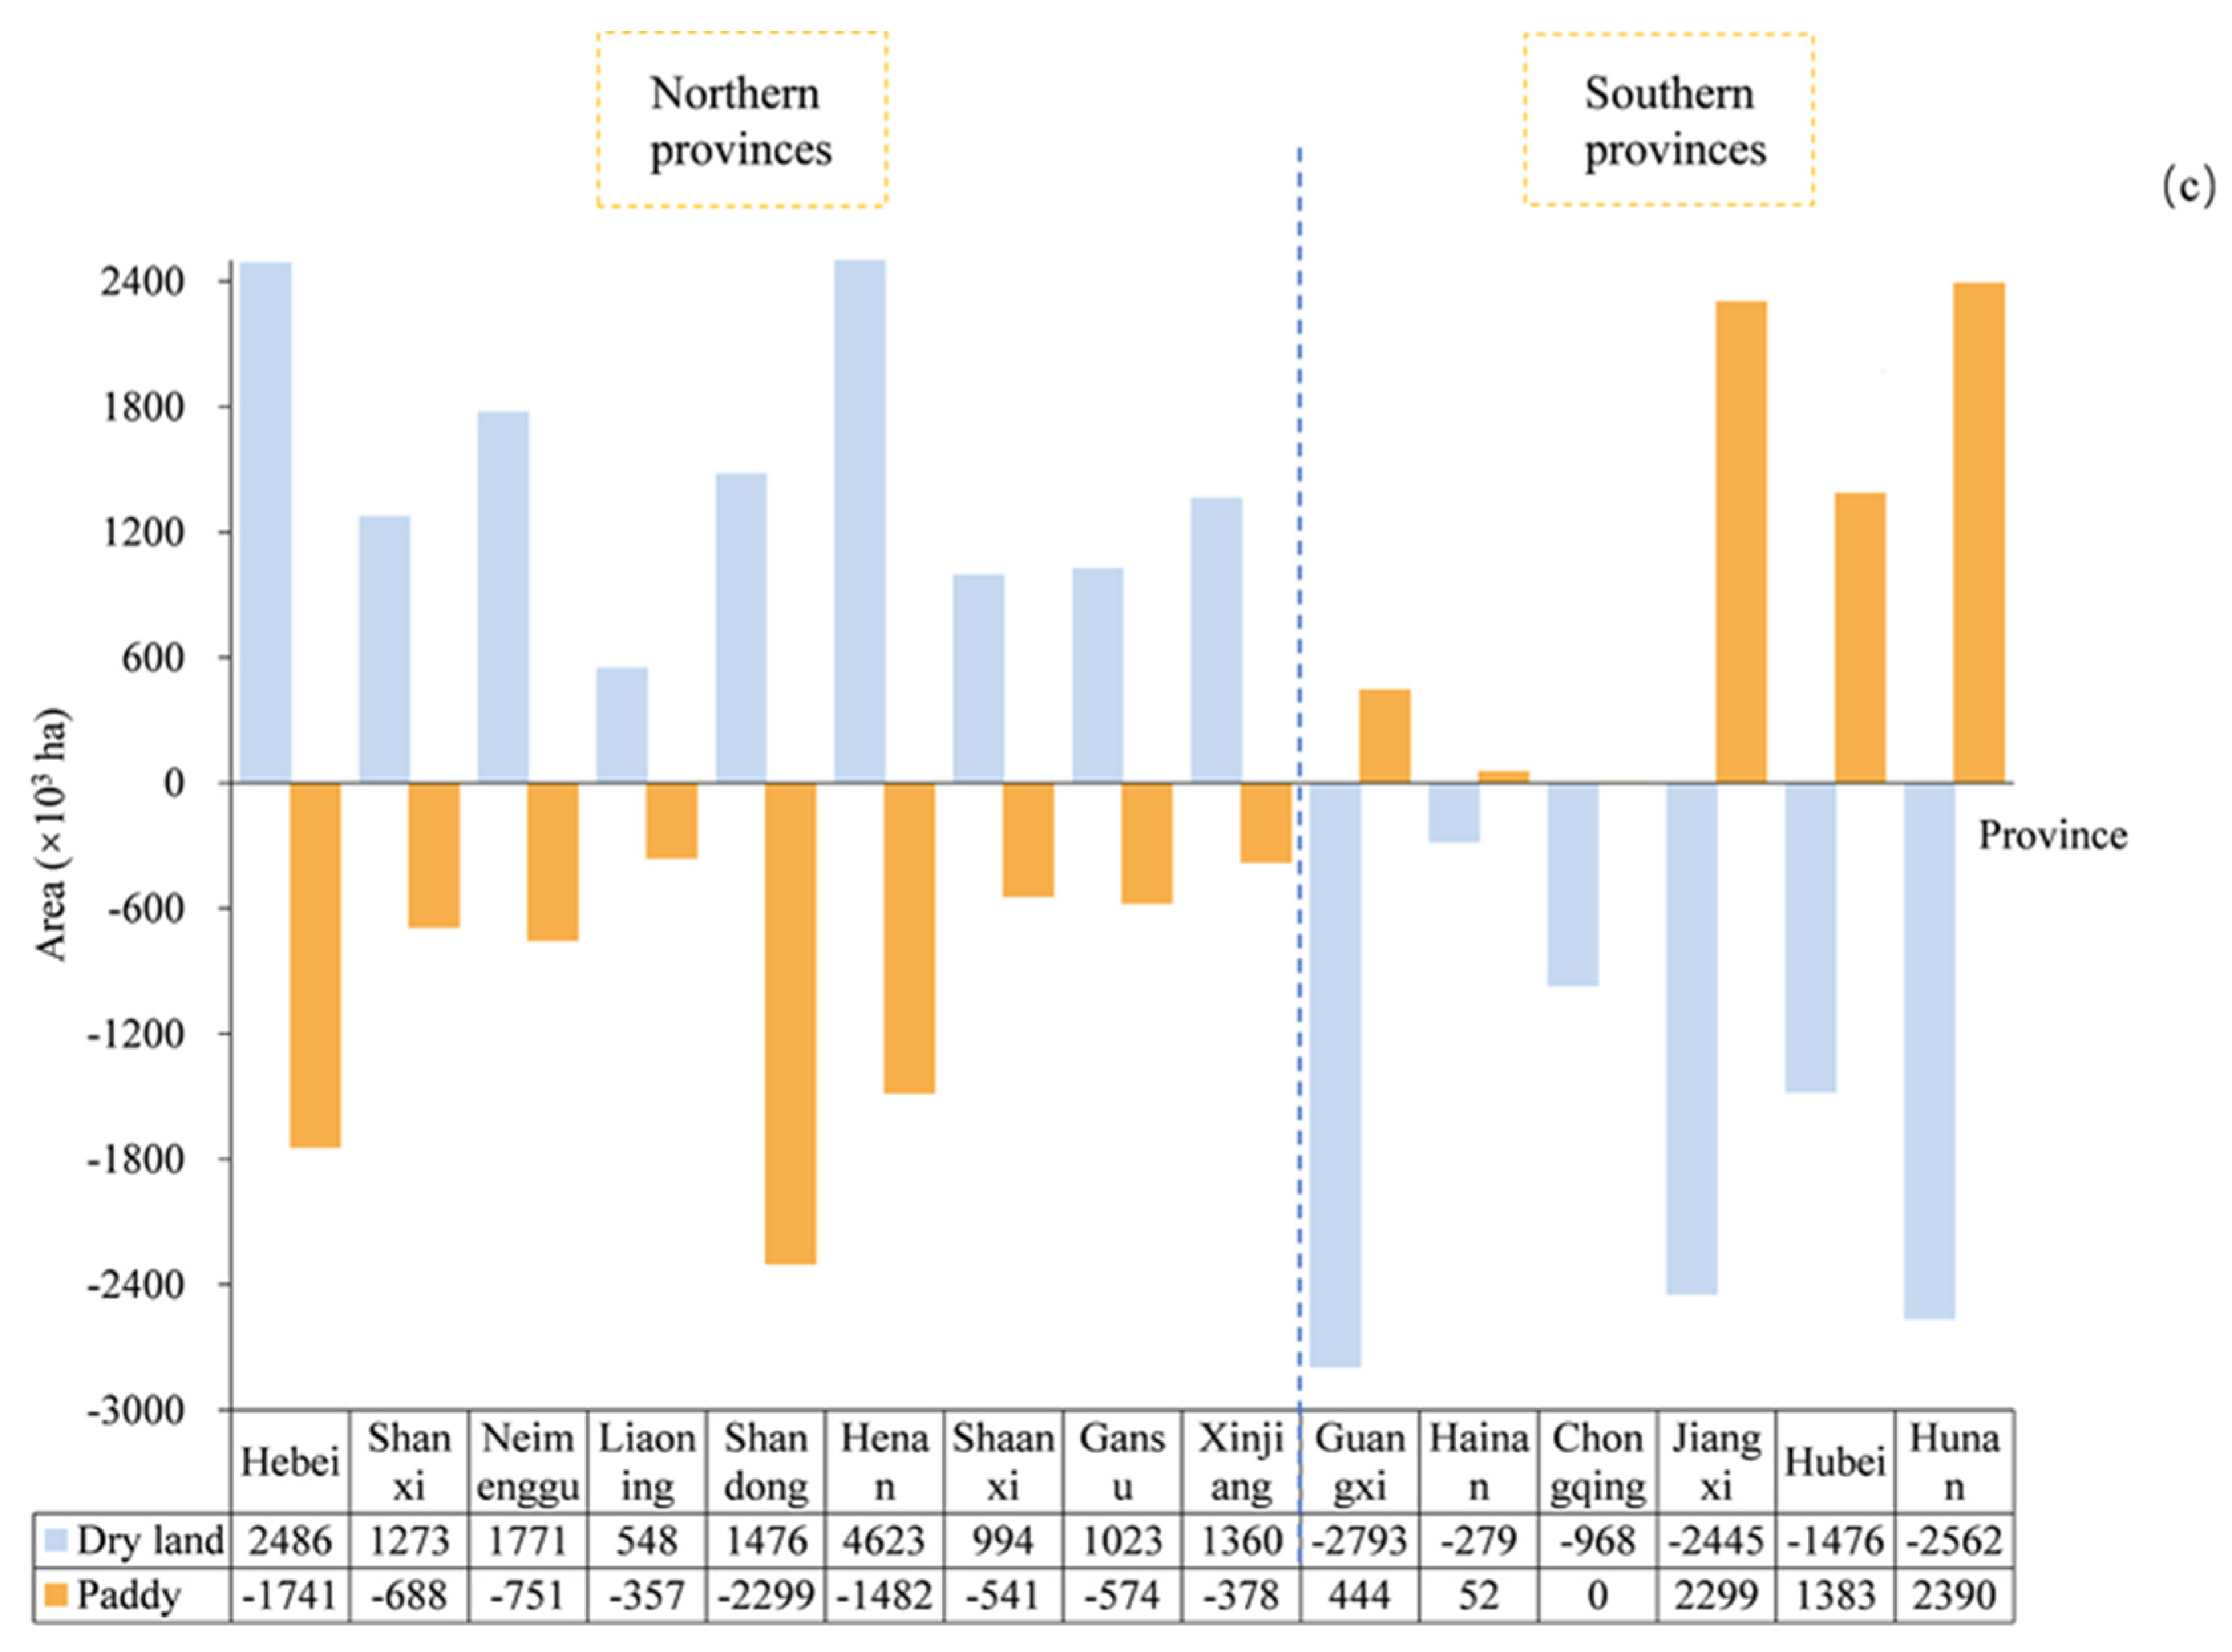
The third group is one positive and one negative for dry land and paddy field (Figure 2c), which means that one type of arable land in the province can satisfy its own demand and the other type of arable land needs to occupy the resources of other provinces. China is divided by the Qinling-Huaihe between the north and the south. There are differences between the South and the North in terms of natural conditions, agricultural production modes, geographical features, and people’s living customs. In the north, the arable land is dryland, and the main crops are wheat and miscellaneous grains; in the south, it is mainly paddy field, and the crop is mainly rice. The results of the study show that the provinces north of the Qinling-Huaihe are self-sufficient in terms of dryland area, while rice consumption is greater than cultivation, requiring cross-regional occupation of paddy resources, for example, Hebei, Shanxi, Neimenggu, Liaoning, Shandong, Henan, Shaanxi, Gansu, and Xinjiang. The provinces in the southern region are just the opposite. Their paddy field area is self-sufficient, while the dry land area needs to be occupied across regions. At the same time, the area of paddy land occupied by the northern provinces is basically smaller than the area of dry land supplied by themselves, while the area of dry land occupied by the southern provinces is greater than the area of paddy field supplied by themselves.
3.2. The Results of Assessment of the Value of Arable Land Support Services
There are large differences in the value of support services between dry lands and paddy fields, especially in soil conservation. Table 1 shows that the soil conservation value of drylands is more than 100 times higher than that of paddy fields, while paddy fields are slightly more valuable than drylands in terms of maintaining nutrient cycling and biodiversity. According to Equation (7), the values of support services for dry land and paddy field are ¥4360.32 hm−2 and ¥1396.67 hm−2, respectively.
The provinces in the first group occupy both paddy field resources and dry land resources in other areas, so they need to pay the compensation amount. The negative values represent the payments. The provinces in the second group supply both paddy field resources and dry land resources to other provinces, so they should collect the corresponding amount of compensation. The positive values represent the collections (Table 2).
As for the provinces in the third group, they need to be discussed separately according to the north and the south (Table 2). Most of the paddy fields occupied by the northern provinces are smaller than the area of drylands supplied out by themselves, and the value of support services in drylands is three times higher than that in paddy fields, so on balance, all northern provinces in the third group are compensated areas. Although the area of paddy field occupied by Shandong Province is slightly larger than the area of dryland it supplies out, it is ultimately calculated that Shandong Province is also a compensated area due to the higher value of dry land support services. The area of dry land occupied by the southern provinces is larger than the area of paddy field supplied out by themselves, and the value of support services for paddy field is lower, so the southern provinces in the third group generally need to pay compensation.
3.3. Accounting for Arable Land Compensation Standard and Its Realization
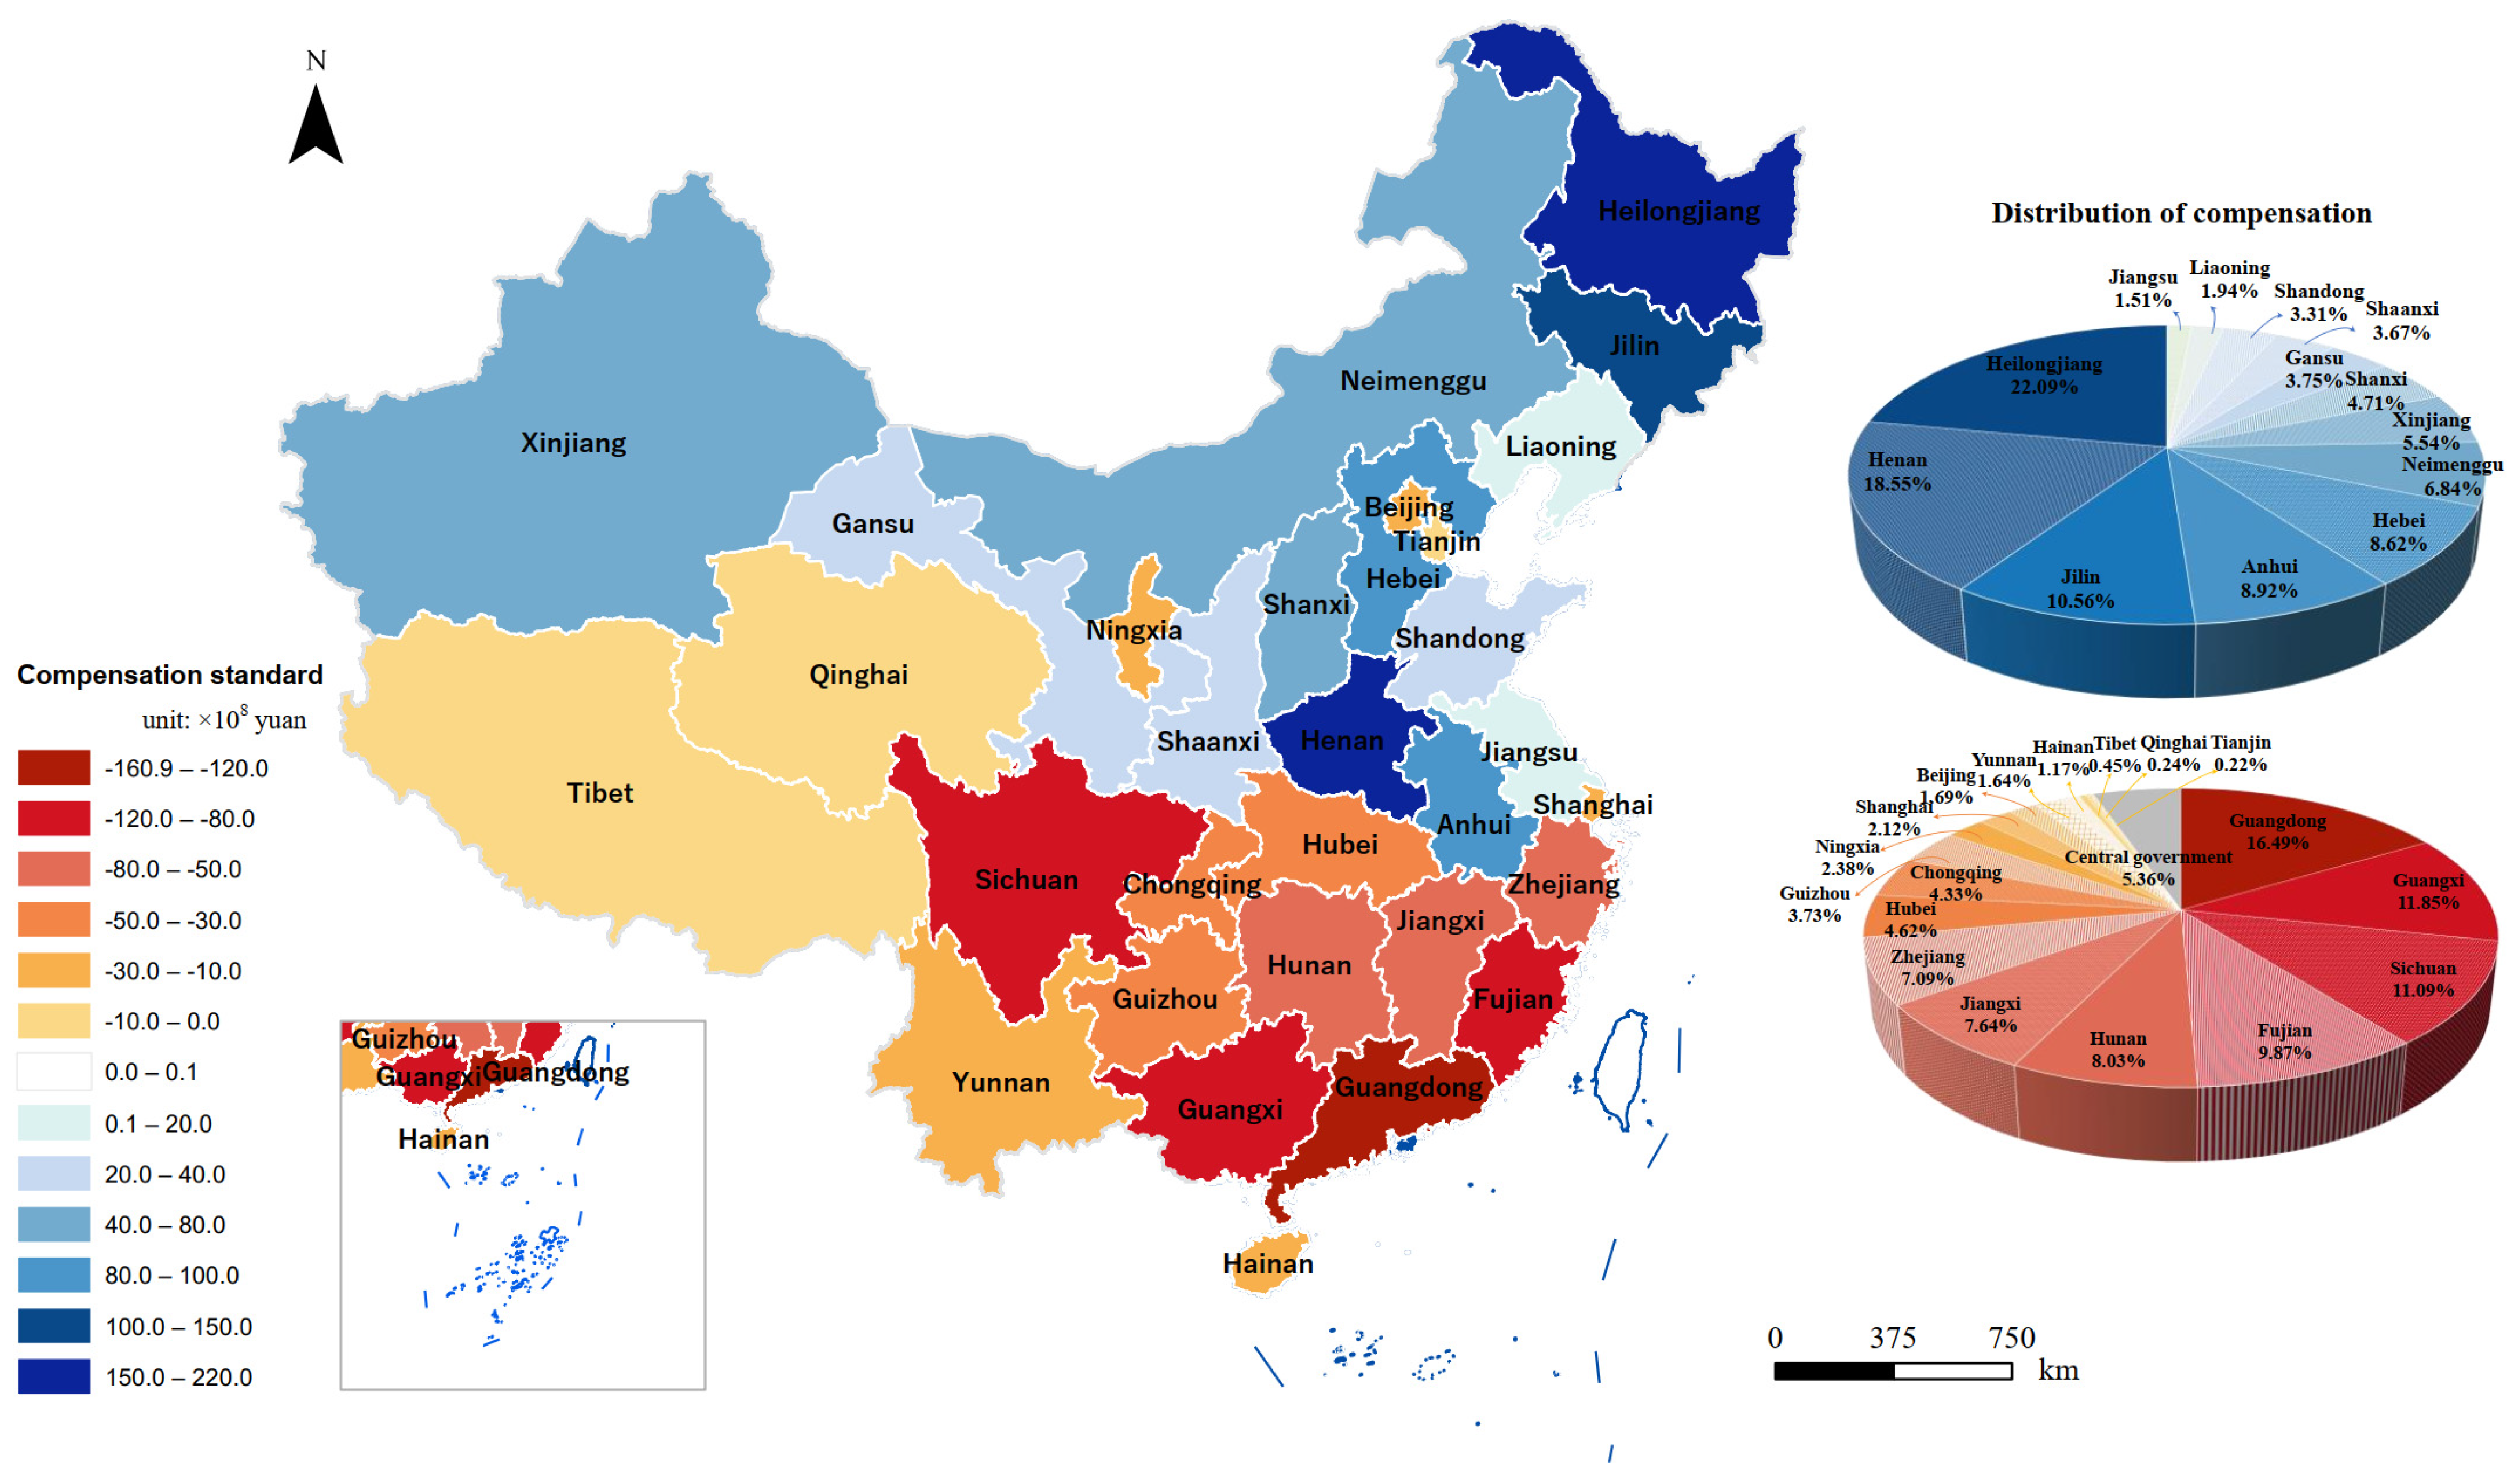
Based on the results of the arable land support service value assessment and formula (8), the amount of compensation that should be paid and received by each province is shown in Figure 3 and Table 2. Guangdong Province occupies the most value of arable land support services from other provinces with a compensation rate of ¥16.082 billion RMB, followed by Guangxi (¥11.558 billion RMB), Sichuan (¥10.815 billion RMB), Fujian (¥9.626 billion RMB), Hunan (¥7.831 billion RMB), Jiangxi (¥7.449 billion RMB) and Zhejiang (¥6.912 billion RMB). Heilongjiang Province supplies the most arable land support services with 21.547 billion compensated, followed by Henan (¥18.089 billion RMB), Jilin (¥10.296 billion RMB), Anhui (¥8.695 billion RMB), Hebei (¥8.408 billion RMB) and Neimenggu (¥6.674 billion RMB). Although the specific data obtained from the calculations are not identical, these findings are similar in general to those of other scholars [34,35,59,60,61]. All studies showed that economically developed provinces such as Beijing, Shanghai, Guangdong, Zhejiang, and Fujian are mostly compensated areas, and large agricultural provinces such as Henan, Heilongjiang, Hebei, Anhui, and Jilin are mostly compensated areas. Looking at China as a whole, most of the southern provinces are areas that pay compensation, and most of the northern provinces are areas that receive compensation.
Because the study area does not include all provinces in China, and because imports and exports also have an impact on food production and consumption, the calculated amounts of compensation paid and received by provinces nationwide do not exactly match. Due to the lack of statistical data on food flows between provinces in China, it is difficult for us to directly construct a horizontal ecological compensation mechanism between provinces. Therefore, we believe that the arable land compensation mechanism embedded behind food production and consumption could be realized by establishing a national arable land ecological compensation fund. The compensation foundation would specify the subject and object of compensation based on the relationship between the annual production and consumption of agricultural products in each province, and use the supply and occupation of arable land support services by each province to other provinces as the basis for setting standards. The compensation standard would be determined through the valorization of arable land support services. The foundation would collect compensation from the provinces that should pay, and distribute the amount of compensation to the provinces that should be compensated. Finally, the central government would contribute funds to fill the gap between the total amount of compensation received and the total amount of compensation paid. In short, through the establishment of a cultivated land ecological compensation fund at the national level, the country would be considered as a whole, ultimately achieve the purpose of protecting the ecological status of cultivated land and providing institutional guarantees for food production.
4. Discussion
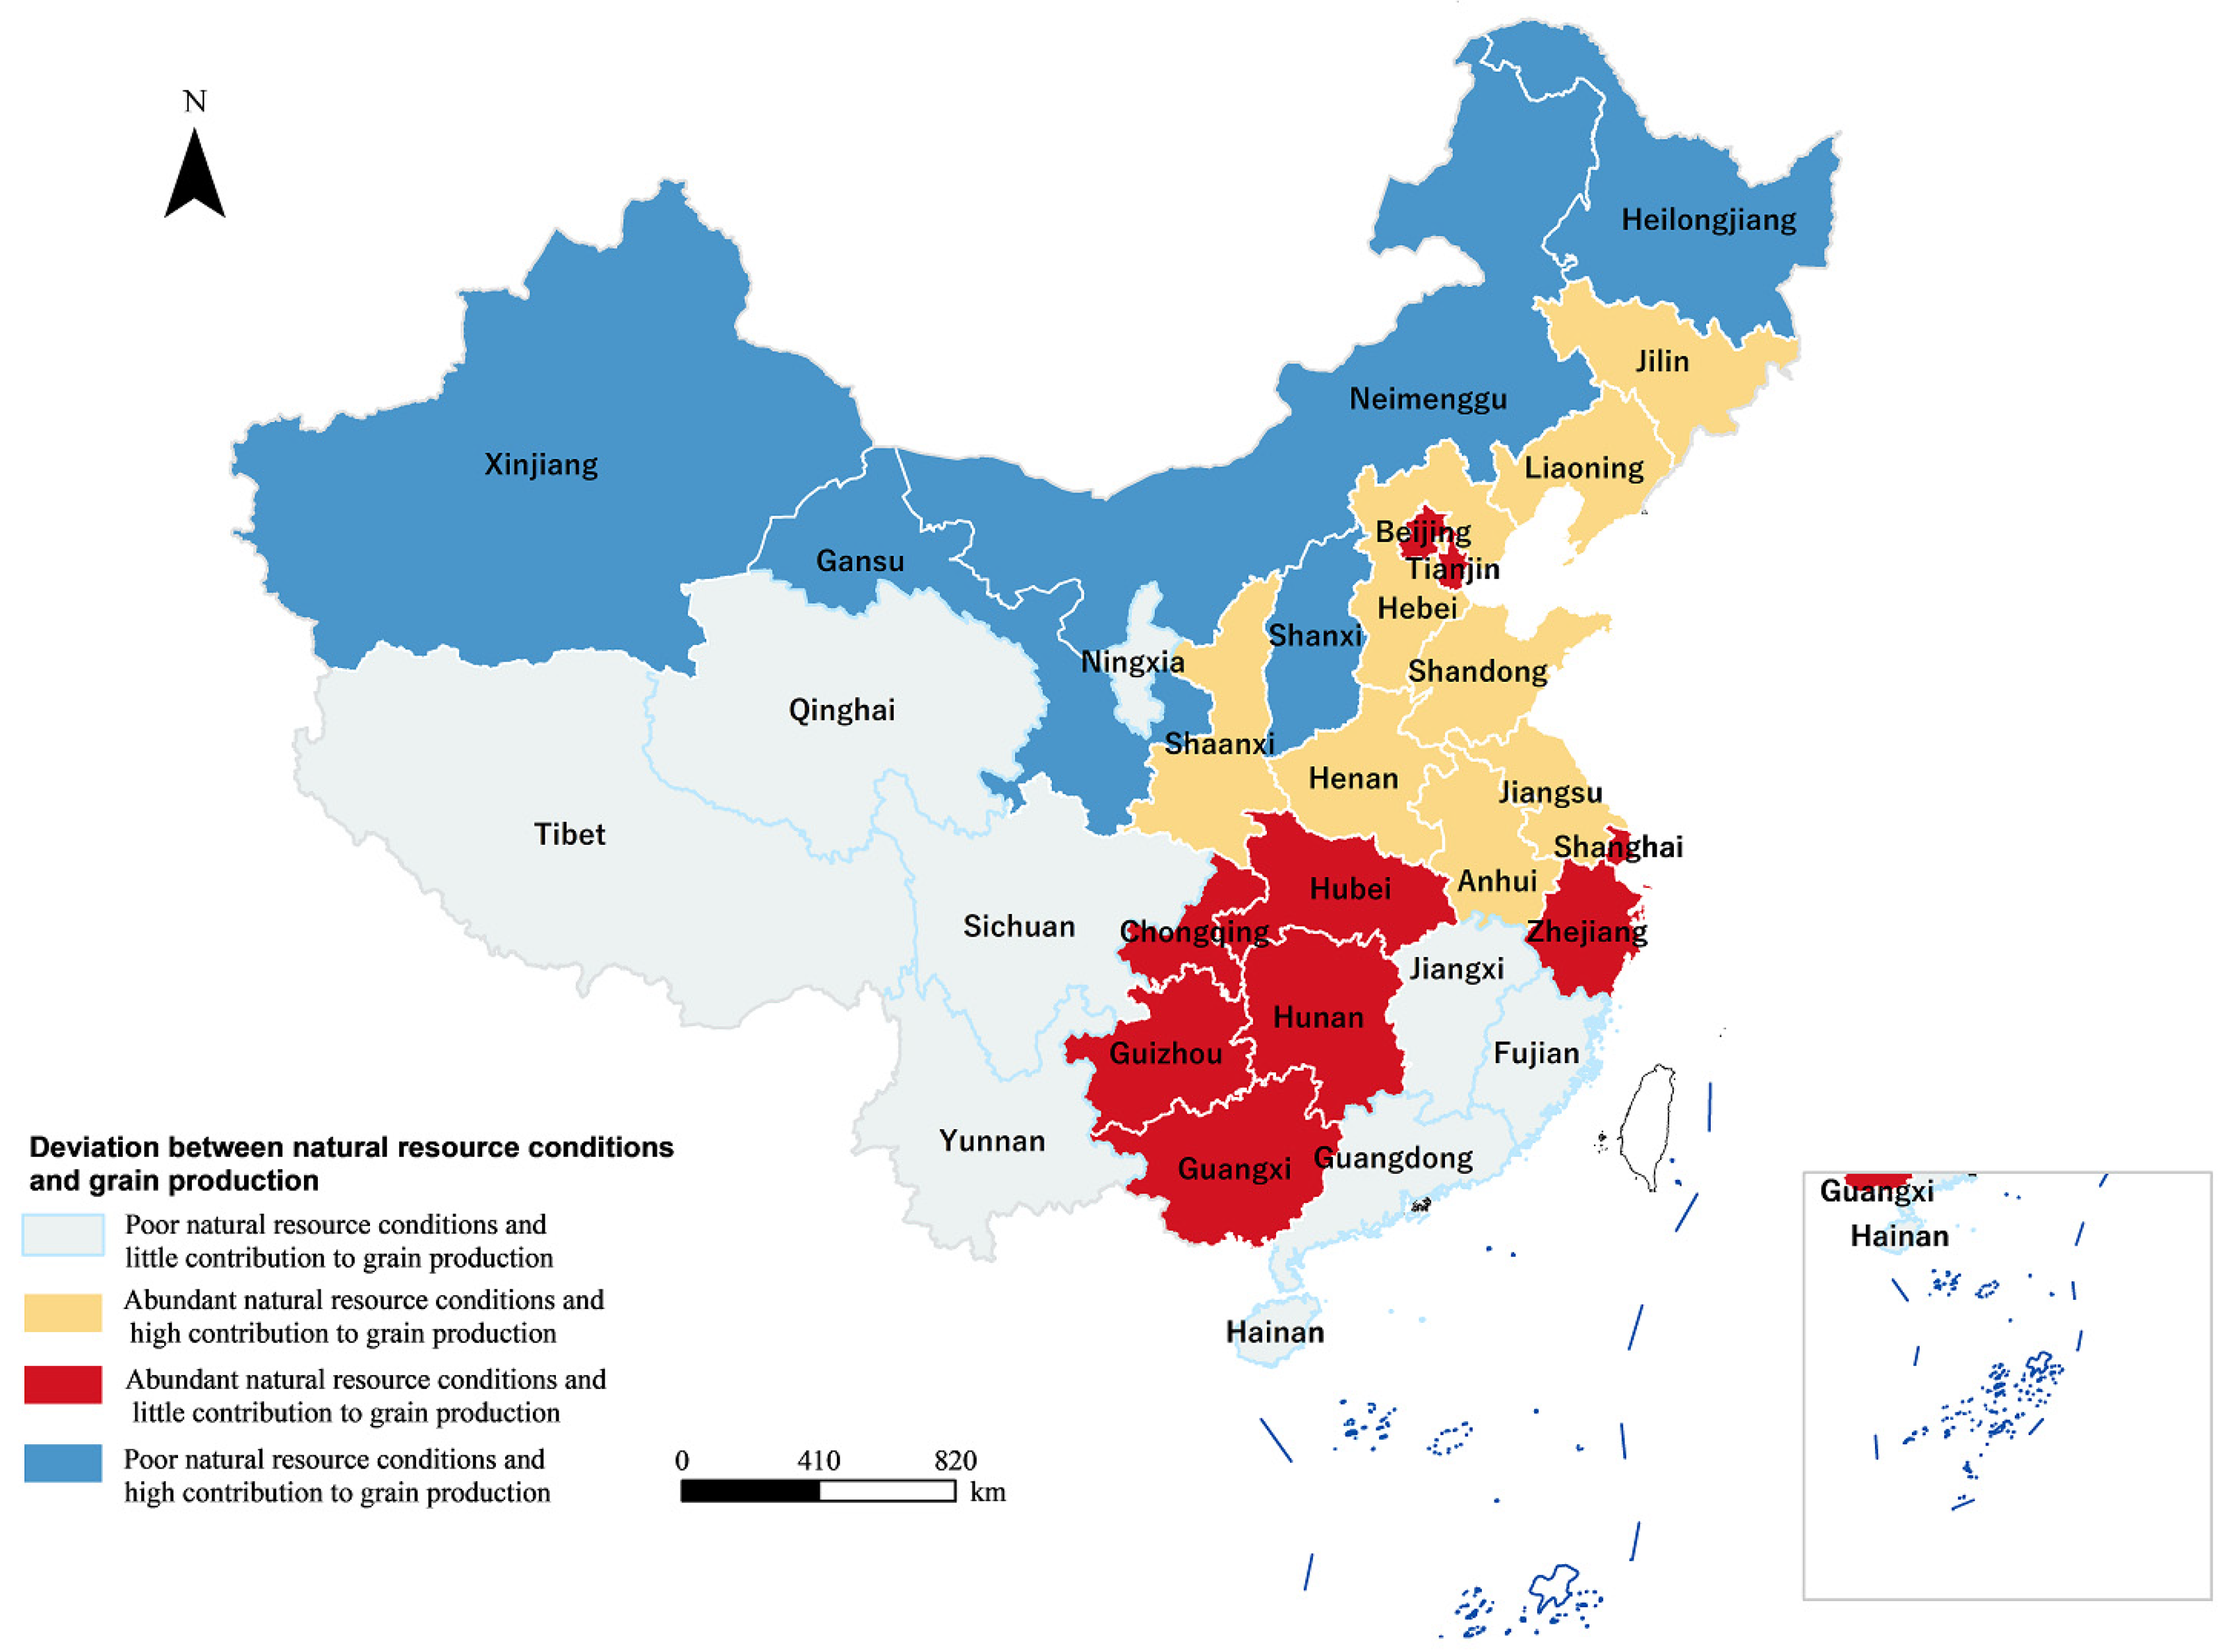
Although modern agriculture has developed towards technology and mechanization, the quality of natural endowments still plays a decisive role in food production and its sustainability. In 2019, Ning conducted a research on the suitable growth areas of China’s main staple foods from the perspective of natural resource endowments [59]. In conjunction with Ning’s study, we show how the current pattern of grain production in China unifies and diverges from the pattern of natural conditions (Figure 4). At this stage, China’s grain production tasks are distributed by province, and many regions have taken on grain production tasks that far exceed their own population needs due to policy, history and variability in economic development levels. However, this high occupancy versus high output production model is not sustainable in terms of natural endowment conditions. Examples include Heilongjiang, Neimenggu, Xinjiang, Shanxi, and Gansu. All of these provinces are located in northern regions with poor light and heat conditions, and their natural endowments rank at the bottom of the country, yet they supply arable land support services to other provinces. Other provinces with superior natural endowments, which should have produced food, have taken up corresponding arable land resources due to economic development or other reasons. This ultimately results in their low self-sufficiency in food production and the need to take arable land support services from other provinces, for example, Beijing, Tianjin, Shanghai, Zhejiang, Chongqing, Hubei, Hunan, Guangxi, and Guizhou. Among these provinces, all of them except Beijing and Tianjin are located in the southern region. It can be seen that the center of food production in China has gradually shifted northward, and northern food transportation to the south has become a significant feature of grain consumption and flow. This has important implications for future research on arable land conservation and its sustainable use, food production and related policies.
The price of organic food is higher than conventional food, and consumers pay for the “organic environment” by purchasing organic food. Agricultural food also contains inputs of the arable ecosystem support services behind them. In the current market mechanism, the ecosystem services behind food cannot be reflected in the circulation price for the time being, thus requiring us to establish an ecological compensation policy for arable land through administrative means. However, as ecological products become more and more valued, the ultimate goal is to reflect the value of ecosystem services in the price of products and to rely on market mechanisms to ensure the equity of regional development and the sustainable production of arable land.
In addition, the ecological compensation standard for arable land in this study only considers the production, circulation and consumption of three staple foods, while other foods such as vegetables, fruits, quinoa and oats also have an impact on the ecological compensation standard for arable land. Therefore, the significance of this study is to provide a way to compensate arable land and formulate compensation standards that couple the socio-economic system and ecological value systems.
5. Conclusions
In order to protect the arable land ecosystem and ensure food production, this study focused on the pattern of food production, circulation and consumption in China. By revealing the occupation or supply of arable land support services by provinces in other provinces, and the value of support services, the ecological compensation standards for cultivated land in each province in 2018 were calculated. A method for ecological compensation for arable land between regions with the country as the hub was also constructed. The main conclusions are as follows:
(1) The pattern of grain flow in China is mainly from the northern provinces to the southern provinces. Southern provinces mainly supply paddy fields, and northern provinces mainly supply dry land, but overall, the supply of arable land support services in northern provinces is greater than that in southern provinces.
(2) According to the ecosystem service value equivalent method, the support service value of dry land and paddy field was calculated to be ¥4360.32 hm−2 and ¥1396.67 hm−2 respectively.
(3) The province that needs to pay the most ecological compensation for arable land is Guangdong, with a compensation amount of ¥16.082 billion RMB, and the province that receives the most ecological compensation for arable land is Heilongjiang, with a compensation amount of ¥21.547 billion RMB. The central government needs to pay compensation amount of ¥5.225 billion RMB.
(4) We recommend the establishment of an ecological compensation fund for arable land at the national level. The fund would coordinate the collection and distribution of compensation between regions. Eventually, the ultimate purpose of protecting the ecological condition of arable land, safeguarding the relevant interests of the main food-producing regions, and providing institutional guarantee for food production in China can be achieved.
The results of this study help to explore the mechanisms for achieving ecological compensation of arable land between regions. By combining the compensation with food production and consumption, the value of arable land support services was used as the basis for compensation, thus outlining a path for future research. We can explore the impact of food production and consumption on ecological compensation of arable land in greater depth in the future. Meanwhile, the results of this study reveal the mismatch of China’s food production pattern (northern food transportation to the south) with natural resource conditions, which provides reference information for China’s food security policy. Subsequent studies may also focus on this point in more aspects.
Author Contributions
Y.B. carried out the experiments and drafted the manuscript. M.L. conceptualized this study, acted as a supervisor and carefully revised the manuscript. L.Y. provided useful suggestions and improved the manuscript. All authors have read and agreed to the published version of the manuscript.
Funding
This work was jointly supported by the Mobility Programme DFG-NSFC (grant M-0342) and the National Natural Science Foundation of China (grant 41801204).
Data Availability Statement
The data presented in this study are available on request from the corresponding author. The data are not publicly available due to privacy concerns.
Acknowledgments
We would like to thank Lei Hu and Yuqing Feng for thoughtful comments on this manuscript.
Conflicts of Interest
The authors declare no conflict of interest.
References
- Costanza, R.; Mageau, M. What is a healthy ecosystem? Aquat. Ecol. 1999, 33, 105–115. [Google Scholar] [CrossRef]
- Alcamo, J. Ecosystems and Human Well-Being: A Framework for Assessment; Alcamo, J., Bennett, E.M., Millennium Ecosys-tem Assessment (Program), Eds.; Island Press: Washington, DC, USA, 2003; ISBN 978-1-55963-402-1. [Google Scholar]
- Daniel, T.C.; Muhar, A.; Arnberger, A.; Aznar, O.; Boyd, J.W.; Chan, K.M.A.; Costanza, R.; Elmqvist, T.; Flint, C.G.; Gobster, P.H.; et al. Contributions of cultural services to the ecosystem services agenda. Proc. Natl. Acad. Sci. USA 2012, 109, 8812–8819. [Google Scholar] [CrossRef] [Green Version]
- Crist, E.; Mora, C.; Engelman, R. The interaction of human population, food production, and biodiversity protection. Science 2017, 356, 260–264. [Google Scholar] [CrossRef] [PubMed]
- Liu, M.; Yang, L.; Min, Q.; Bai, Y. Eco-compensation standards for agricultural water conservation: A case study of the paddy land-to-dry land program in China. Agric. Water Manag. 2018, 204, 192–197. [Google Scholar] [CrossRef]
- Lam, H.-M.; Remais, J.; Fung, M.-C.; Xu, L.; Sun, S.S.-M. Food supply and food safety issues in China. Lancet 2013, 381, 2044–2053. [Google Scholar] [CrossRef] [Green Version]
- Lu, Y.; Song, S.; Wang, R.; Liu, Z.; Meng, J.; Sweetman, A.; Jenkins, A.; Ferrier, R.C.; Li, H.; Luo, W.; et al. Impacts of soil and water pollution on food safety and health risks in China. Environ. Int. 2015, 77, 5–15. [Google Scholar] [CrossRef] [Green Version]
- Chai, K.C.; Zhang, Y.B.; Chang, K.C. National Bureau of Statistics China Statistical Yearbook 2020; China Statistics Press: Beijing, China, 2020; ISBN 978-7-5037-9225-0. [Google Scholar]
- Sun, B.; Zhang, L.; Yang, L.; Zhang, F.; Norse, D.; Zhu, Z. Agricultural Non-Point Source Pollution in China: Causes and Mitigation Measures. Ambio 2012, 41, 370–379. [Google Scholar] [CrossRef] [Green Version]
- Wunder, S. The Efficiency of Payments for Environmental Services in Tropical Conservation. Conserv. Biol. 2007, 21, 48–58. [Google Scholar] [CrossRef]
- Engel, S.; Pagiola, S.; Wunder, S. Designing payments for environmental services in theory and practice: An overview of the issues. Ecol. Econ. 2008, 65, 663–674. [Google Scholar] [CrossRef]
- Cerretelli, S.; Poggio, L.; Gimona, A.; Yakob, G.; Boke, S.; Habte, M.; Coull, M.; Peressotti, A.; Black, H. Spatial assessment of land degradation through key ecosystem services: The role of globally available data. Sci. Total. Environ. 2018, 628–629, 539–555. [Google Scholar] [CrossRef]
- Samii, C.; Lisiecki, M.; Kulkarni, P.; Paler, L.; Chavis, L.; Snilstveit, B.; Vojtkova, M.; Gallagher, E. Effects of Payment for Environmental Services (PES) on Deforestation and Poverty in Low and Middle Income Countries: A Systematic Review. Campbell Syst. Rev. 2014, 10, 1–95. [Google Scholar] [CrossRef] [Green Version]
- Pagiola, S.; Arcenas, A.; Platais, G. Can Payments for Environmental Services Help Reduce Poverty? An Exploration of the Issues and the Evidence to Date from Latin America. World Dev. 2005, 33, 237–253. [Google Scholar] [CrossRef]
- Martin, A.; Kebede, B.; Gross-Camp, N.; He, J.; Inturias, M.; Rodríguez, I. Fair ways to share benefits from community forests? How commodification is associated with reduced preference for equality and poverty alleviation. Environ. Res. Lett. 2019, 14, 064002. [Google Scholar] [CrossRef]
- Gao, X.; Huang, B.; Hou, Y.; Xu, W.; Zheng, H.; Ma, D.; Ouyang, Z. Using Ecosystem Service Flows to Inform Ecological Compensation: Theory & Application. Int. J. Environ. Res. Public Health 2020, 17, 3340. [Google Scholar] [CrossRef]
- Ju, X.; Xue, Y.; Xi, B.; Jin, T.; Xu, Z.; Gao, S. Establishing an Agro-Ecological Compensation Mechanism to Promote Agricultural Green Development in China. J. Resour. Ecol. 2018, 9, 426–433. [Google Scholar] [CrossRef]
- Jiang, S.; Hu, R.; Wu, J. Research on Oil and Gas Ecological Compensation Mechanism. Chem. Technol. Fuels Oils 2019, 55, 85–92. [Google Scholar] [CrossRef]
- Börner, J.; Baylis, K.; Corbera, E.; Ezzine-De-Blas, D.; Honey-Rosés, J.; Persson, U.M.; Wunder, S. The Effectiveness of Payments for Environmental Services. World Dev. 2017, 96, 359–374. [Google Scholar] [CrossRef]
- Wu, Z.; Guo, X.; Lv, C.; Wang, H.; Di, D. Study on the quantification method of water pollution ecological compensation standard based on emergy theory. Ecol. Indic. 2018, 92, 189–194. [Google Scholar] [CrossRef]
- Deng, C.; Zhang, S.; Lu, Y.; Li, Q. Determining the Ecological Compensation Standard Based on Forest Multifunction Evaluation and Financial Net Present Value Analysis: A Case Study in Southwestern Guangxi, China. J. Sustain. For. 2020, 39, 730–749. [Google Scholar] [CrossRef]
- Bernard, F.; De Groot, R.S.; Campos, J.J. Valuation of tropical forest services and mechanisms to finance their conservation and sustainable use: A case study of Tapantí National Park, Costa Rica. For. Policy Econ. 2009, 11, 174–183. [Google Scholar] [CrossRef]
- Hu, Y.; Huang, J.; Hou, L. Impacts of the Grassland Ecological Compensation Policy on Household Livestock Production in China: An Empirical Study in Inner Mongolia. Ecol. Econ. 2019, 161, 248–256. [Google Scholar] [CrossRef]
- Yang, Q.; Nan, Z.; Tang, Z. Influencing factors of the grassland ecological compensation policy to herdsmen’s behavioral response: An empirical study in Hexi corridor. Acta Ecol. Sin. 2021. [Google Scholar] [CrossRef]
- Xiong, K.; Kong, F. The Analysis of Farmers’ Willingness to Accept and Its Influencing Factors for Ecological Compensation of Poyang Lake Wetland. Procedia Eng. 2017, 174, 835–842. [Google Scholar] [CrossRef]
- Spash, C.L.; Urama, K.; Burton, R.; Kenyon, W.; Shannon, P.; Hill, G. Motives behind willingness to pay for improving biodiversity in a water ecosystem: Economics, ethics and social psychology. Ecol. Econ. 2009, 68, 955–964. [Google Scholar] [CrossRef]
- Gao, X.; Shen, J.; He, W.; Sun, F.; Zhang, Z.; Guo, W.; Zhang, X.; Kong, Y. An evolutionary game analysis of governments’ decision-making behaviors and factors influencing watershed ecological compensation in China. J. Environ. Manag. 2019, 251, 109592. [Google Scholar] [CrossRef]
- Liu, M.; Yang, L.; Min, Q. Water-saving irrigation subsidy could increase regional water consumption. J. Clean. Prod. 2019, 213, 283–288. [Google Scholar] [CrossRef]
- Raes, L.; Speelman, S.; Aguirre, N. Farmers’ Preferences for PES Contracts to Adopt Silvopastoral Systems in Southern Ecuador, Revealed Through a Choice Experiment. Environ. Manag. 2017, 60, 200–215. [Google Scholar] [CrossRef]
- Sims, K.; Alix-Garcia, J. Parks versus PES: Evaluating direct and incentive-based land conservation in Mexico. J. Environ. Econ. Manag. 2017, 86, 8–28. [Google Scholar] [CrossRef]
- Izquierdo-Tort, S.; Ortiz-Rosas, F.; Vázquez-Cisneros, P.A. ‘Partial’ participation in Payments for Environmental Services (PES): Land enrolment and forest loss in the Mexican Lacandona Rainforest. Land Use Policy 2019, 87, 103950. [Google Scholar] [CrossRef]
- Johnson, M.K.; Lien, A.M.; Sherman, N.R.; López-Hoffman, L. Barriers to PES programs in Indigenous communities: A lesson in land tenure insecurity from the Hopi Indian reservation. Ecosyst. Serv. 2018, 32, 62–69. [Google Scholar] [CrossRef]
- Niu, H.; Zhang, A. Externality and Its Calculation of Cultivated Land Protection: A Case Study of Jiaozuo City. Resour. Sci. 2009, 31, 1400–1408. [Google Scholar]
- Zhao, Q.; Xu, H.; Guo, N. Quantitative study on cultivated land ecological compensation in the area around Beijing and Tianjin from the perspective of grain security. Chin. J. Eco-Agric. 2017, 25, 1052–1059. [Google Scholar] [CrossRef]
- Jiang, Z. Research on Ecological Compensation of Interprovincial Cultivated Land in China from the Perspective of Virtual Cultivated Land Strategy. Master’s Thesis, Hunan Normal University, Changsha, China, 2020. [Google Scholar]
- Liu, Y.; Wang, J.; Guo, L. The spatial-temporal changes of grain production and arable land in China. Sci. Agric. Sin. 2009, 42, 4269–4274. [Google Scholar]
- Chai, J.; Wang, Z.; Yang, J.; Zhang, L. Analysis for spatial-temporal changes of grain production and farmland resource: Evidence from Hubei Province, central China. J. Clean. Prod. 2019, 207, 474–482. [Google Scholar] [CrossRef]
- Dong, Z.; Yan, Y.; Duan, J.; Fu, X.; Zhou, Q.; Huang, X.; Zhu, X.; Zhao, J. Computing payment for ecosystem services in watersheds: An analysis of the Middle Route Project of South-to-North Water Diversion in China. J. Environ. Sci. 2011, 23, 2005–2012. [Google Scholar] [CrossRef]
- Shahgholi, G.; Abuali, M. Measuring soil compaction and soil behavior under the tractor tire using strain transducer. J. Terramechanics 2015, 59, 19–25. [Google Scholar] [CrossRef]
- Li, Y.; Xiong, W.; Zhang, W.; Wang, C.; Wang, P. Life cycle assessment of water supply alternatives in water-receiving areas of the South-to-North Water Diversion Project in China. Water Res. 2016, 89, 9–19. [Google Scholar] [CrossRef]
- Luo, J. Study on Grain Consumption Based on the Goal of Nutrition. Ph.D. Thesis, Chinese Academy of Agricultural Sciences, Beijing, China, 2008. [Google Scholar]
- Yuan, Y.; Song, J.; Yang, C.; Liu, A. Balanced diets food from the angle of demand forecasting. Chin. J. Agric. Resour. Reg. Plan. 2017, 38, 119–123. [Google Scholar]
- Xue, P.; Zhang, W. Change of grain consumption in Jiangsu Province and its contribution index to China’s grain security. Res. Agric. Mod. 2019, 40, 206–214. [Google Scholar] [CrossRef]
- Yao, C.; Huang, L.; Lv, X. Grain Demand Structure Change in Henan and Its Contribution Rate to China’s Food Security. Res. Agric. Mod. 2014, 35, 163–167. [Google Scholar]
- Xu, S.-W.; Wu, J.-Z.; Song, W.; Li, Z.-Q.; Li, Z.-M.; Kong, F.-T. Spatial-Temporal Changes in Grain Production, Consumption and Driving Mechanism in China. J. Integr. Agric. 2013, 12, 374–385. [Google Scholar] [CrossRef]
- Zhou, D.; Zhang, P.; Sun, H.; Zhong, R.; Huang, Y.; Fang, Y.; Li, Q.; Wang, T. Regional Difference of Grain Pro-duction and Its Consumed Fraction in China. Soils Crops 2017, 6, 161–173. [Google Scholar]
- Wackernagel, M.; Monfreda, C.; Schulz, N.B.; Erb, K.; Haberl, H.; Krausmann, F. Calculating national and global ecological footprint time series: Resolving conceptual challenges. Land Use Policy 2004, 21, 271–278. [Google Scholar] [CrossRef]
- Wackernagel, M.; Onisto, L.; Bello, P.; Linares, A.C.; Falfán, I.S.L.; García, J.M.; Guerrero, A.I.S.; Guerrero, M.G.S. National natural capital accounting with the ecological footprint concept. Ecol. Econ. 1999, 29, 375–390. [Google Scholar] [CrossRef]
- Li, Y.; Filimonau, V.; Wang, L.-E.; Cheng, S. Tourist food consumption and its arable land requirements in a popular tourist destination. Resour. Conserv. Recycl. 2020, 153, 104587. [Google Scholar] [CrossRef]
- Li, Y.; Zhou, B.; Wang, L.-E.; Cheng, S. Effect of tourist flow on province-scale food resource spatial allocation in China. J. Clean. Prod. 2019, 239, 117931. [Google Scholar] [CrossRef]
- Luo, Y.; Li, X.; Huang, D.; Wu, L. The progress and prospects of research on food loss and waste. J. Nat. Resour. 2020, 35, 1030–1042. [Google Scholar]
- Xiao, G. China’s grain supply and demand forecast for the next ten years. Chin. Rural Econ. 2002, 9–14. [Google Scholar]
- Long, G. Grain Distribution in the Opening of a Large Country: Analysis of Grain Prices in China, 1953–1996; China Development Press: Beijing, China, 1999; ISBN 7-80087-329-3. [Google Scholar]
- Davis, R.K. Recreation Planning as an Economic Problem. Nat. Resour. J. 1963, 3, 12. [Google Scholar]
- Li, L.; Wang, X.; Luo, L.; Ji, X.; Zhao, Y.; Zhao, Y.; Bachagha, N. A systematic review on the methods of ecosys-tem services value assessment. Chin. J. Ecol. 2018, 37, 1233–1245. [Google Scholar] [CrossRef]
- Costanza, R.; d’Arge, R.; de Groot, R.; Farber, S.; Grasso, M.; Hannon, B.; Limburg, K.; Naeem, S.; O’Neill, R.V.; Paruelo, J.; et al. The value of the world’s ecosystem services and natural capital. Nature 1997, 387, 253–260. [Google Scholar] [CrossRef]
- Xie, G.; Zhen, L.; Lu, C.; Xiao, Y.; Chen, C. Expert Knowledge Based Valuation Method of Ecosystem Services in China. J. Nat. Resour. 2008, 23, 911–919. [Google Scholar]
- Xie, G.; Zhang, C.; Zhang, L.; Chen, W.; Li, S. Improvement of the evaluation method for ecosystem service value based on per unit area. J. Nat. Resour. 2015, 30, 1243–1254. [Google Scholar]
- Liu, L.; Liu, X.; Yang, J. Research on Cultivated Land Ecological Compensation Standards from the Perspective of Food Security. Study Pract. 2020, 38–47. [Google Scholar] [CrossRef]
- Liang, L.; Gao, P.; Liu, L. The “Two Horizon” inter-regional agro-ecological compensation standard and cross-regional financial transfer mechanism: A study based on virtual cultivated land. Acta Ecol. Sin. 2019, 39, 9281–9294. [Google Scholar]
- Ning, X.; Zhang, L.; Qin, Y.; Liu, K. Temporal-spatial Distribution of Suitable Areas for Major Food Crops in China Over 60 Years. Adv. Earth Sci. 2019, 34, 191–201. [Google Scholar]
Figure 1.
Location of study areas.

Figure 2.
Cross-regional occupation and supply of cultivated land areas between Chinese provinces. (a) The first group, (b) the second group, (c) the third group.
Figure 2.
Cross-regional occupation and supply of cultivated land areas between Chinese provinces. (a) The first group, (b) the second group, (c) the third group.


Figure 3.
Provincial ecocompensation standard for cultivated land of China in 2018.

Figure 4.
The deviation of China’s grain production pattern and natural conditions pattern.


Table 1.
Supporting service value equivalent of arable ecosystem per unit area.
| Arable Ecosystem Classification | Support Services | ||
|---|---|---|---|
| Secondary Classification | Soil Conservation | Nutrient Circulation | Biodiversity |
| Dry Land | 1.03 | 0.12 | 0.13 |
| Paddy Field | 0.01 | 0.19 | 0.21 |
Table 2.
The value of supporting services and ecological compensation standards for cross-regional occupation or supply of cultivated land in China’s provinces in 2018 (billion RMB).
Table 2.
The value of supporting services and ecological compensation standards for cross-regional occupation or supply of cultivated land in China’s provinces in 2018 (billion RMB).
| Province | Dryland | Paddy Field | Compensation Standard | Province | Dryland | Paddy Field | Compensation Standard | ||
|---|---|---|---|---|---|---|---|---|---|
| The First Group | Beijing | −1.243 | −0.403 | −1.646 | The Third Group | Hebei | 10.841 | −2.432 | 8.409 |
| Tianjin | −0.008 | −0.205 | −0.213 | Shanxi | 5.553 | −0.961 | 4.592 | ||
| Shanghai | −1.761 | −0.307 | −2.068 | Neimenggu | 7.723 | −1.049 | 6.674 | ||
| Zhejiang | −6.428 | −0.484 | −6.912 | Liaoning | 2.391 | −0.499 | 1.892 | ||
| Fujian | −9.224 | −0.402 | −9.626 | Shandong | 6.436 | −3.211 | 3.224 | ||
| Guangdong | −15.377 | −0.704 | −16.082 | Henan | 20.159 | −2.07 | 18.089 | ||
| Sichuan | −10.661 | −0.154 | −10.815 | Shaanxi | 4.336 | −0.756 | 3.58 | ||
| Guizhou | −3.639 | −0.003 | −3.641 | Gansu | 4.462 | −0.802 | 3.66 | ||
| Yunnan | −1.342 | −0.26 | −1.602 | Xinjiang | 5.93 | −0.528 | 5.402 | ||
| Tibet | −0.262 | −0.175 | −0.437 | Jiangxi | −10.66 | 3.211 | −7.449 | ||
| Qinghai | −0.096 | −0.134 | −0.231 | Hubei | −6.438 | 1.932 | −4.506 | ||
| Ningxia | −2.044 | −0.28 | −2.324 | Hunan | −11.169 | 3.338 | −7.831 | ||
| The Second Group | Anhui | 7.166 | 1.529 | 8.695 | Chongqing | −4.222 | 0.0002 | −4.222 | |
| Jiangsu | 0.19 | 1.283 | 1.473 | Guangxi | −12.178 | 0.62 | −11.558 | ||
| Heilongjiang | 17.722 | 3.826 | 21.547 | Hainan | −1.218 | 0.072 | −1.146 | ||
| Jilin | 10.114 | 0.182 | 10.296 | Country | −5.225 |
Publisher’s Note: MDPI stays neutral with regard to jurisdictional claims in published maps and institutional affiliations. |
© 2021 by the authors. Licensee MDPI, Basel, Switzerland. This article is an open access article distributed under the terms and conditions of the Creative Commons Attribution (CC BY) license (https://creativecommons.org/licenses/by/4.0/).
Share and Cite
MDPI and ACS Style
Bai, Y.; Liu, M.; Yang, L. Calculation of Ecological Compensation Standards for Arable Land Based on the Value Flow of Support Services. Land 2021, 10, 719. https://0-doi-org.brum.beds.ac.uk/10.3390/land10070719
AMA Style
Bai Y, Liu M, Yang L. Calculation of Ecological Compensation Standards for Arable Land Based on the Value Flow of Support Services. Land. 2021; 10(7):719. https://0-doi-org.brum.beds.ac.uk/10.3390/land10070719
Chicago/Turabian StyleBai, Yunxiao, Moucheng Liu, and Lun Yang. 2021. "Calculation of Ecological Compensation Standards for Arable Land Based on the Value Flow of Support Services" Land 10, no. 7: 719. https://0-doi-org.brum.beds.ac.uk/10.3390/land10070719
Note that from the first issue of 2016, this journal uses article numbers instead of page numbers. See further details here.