
A Land-Use Change Model to Support Land-Use Planning in the Mekong Delta (MEKOLUC)
by
 , ,
, ,
Quang Chi Truong
1 ,
,
Thao Hong Nguyen
2,
Kenichi Tatsumi
3,
Vu Thanh Pham
1 and
Van Pham Dang Tri
1,4,* 1
College of Environment & Natural Resources, Can Tho University, Can Tho 94100, Vietnam
2
Department of Resource and Environmental Management, College of Technology and Economics of Can Tho, Can Tho 94100, Vietnam
3
Division of Environmental and Agricultural Engineering, Institute of Agriculture, Tokyo University of Agriculture and Technology, Tokyo 183-0054, Japan
4
Research Institute for Climate Change, Can Tho University, Can Tho 94100, Vietnam
*
Author to whom correspondence should be addressed.
Land 2022, 11(2), 297; https://0-doi-org.brum.beds.ac.uk/10.3390/land11020297
Submission received: 22 December 2021
/
Revised: 9 February 2022
/
Accepted: 11 February 2022
/
Published: 15 February 2022
Abstract
:Agricultural land-use changes pose challenges for land managers in terms of ensuring the implementation of local land-use plans. This paper aims to build a land-use change model named MEKOLUC (Mekong Delta land-use change) for simulating land-use changes under the impacts of socioeconomic factors (profitability of land-use types, societal impacts on neighborhoods) and environmental factors (soil, salinity, persistence of salinity). The salinity diffusion map was generated using GAMA software and employed Markov cellular automata to depict the spread of salinity under the influence of dike and sluice gate system operations. The land-use decision-making process was based on multi-criteria selection of the main factors, which were land suitability, land convertibility, density of land use in the neighborhood and profitability of land-use patterns. The input data for the case study were historical land-use maps from 2005, 2010 and 2015 of Soc Trang, a coastal province in the Mekong Delta. The model was calibrated using a land-use map from 2010 (with kappa = 0.86) and was verified with land-use maps from 2015 and 2020 with deviations from 0 to 19%. The simulated results showed that shrimp–rice farming areas have been shrinking, even though these are recommended as sustainable farming systems. Inversely, intensive rice crops tended to change to rice–vegetable crops, vegetable crops or perennial fruit trees, which are projected to be well adapted to climate and salinity intrusion by 2030. This case study shows that the developed model is an essential tool for helping land managers and farmers build land-use plans.
1. Introduction
The Mekong Delta of Vietnam comprises 13 provinces, which are located in the lower basin of the Mekong River. This is a major agricultural production area in Vietnam, combining many ecological zones: fresh, salty and brackish water. In this region, the production of rice, fruit and aquatic products takes place; the production in this area accounts for 55.7% of Vietnam’s total rice production and more than 69% of the country’s aquaculture production [1].
The Mekong Delta is expected to be strongly affected by climate change and a rise in sea levels [2]. Therefore, understanding land-use change in order to serve agricultural land-use planning plays an important role in the development of the region. Land-use plans are established every ten years, with a mid-term land-use inventory produced every five years to adjust the plan. However, the land use patterns observed at the end of the planning periods are often very different from those that are planned [3]. One of the main reasons for this is the lack of tools that help planners to predict land-use changes and test land-use solutions under the impact of different driving factors.
Regarding the driving force of land-use changes, researchers have pointed out that farmers decide land-use types for their farmland based on three main groups of factors: social, economic and environmental [4,5]. Previous research has noted that socioeconomic factors are the most important factors for driving land-use change; profit, tax policy and accessibility to capital are the main factors that promote change among farmers [4]. Vu et al. (2013) and Tri et al. (2008) [6,7] found that social factors play important roles in determining land use, particularly in the Mekong Delta, where farmers tend to change their land use according to the trends of neighbors and the similarity between farming systems. Regarding the influence of environmental factors, Briassoulis pointed out that the environment, through land units, has a big impact on land-use change [5]. Land units are made up of the regional climate, landform, geology, soil, hydrology and vegetation types in each study area, which serve as land evaluators with respect to the selection of appropriate land use based on the FAO’s land evaluation [8]. The impact criteria were also synthesized in [9]. Taillandier et al. (2012), and many other authors [10,11], have proposed the development of land-use change as a multi-criteria analysis problem. For each plot on a map, the respective farmer chooses whether to change crops, as assessed at the farm level, according to multiple criteria: financial risk, income projections, workload, and farmer habits. In general, among many factors from previous studies, the main causes of land-use changes are profit, land suitability and policies [4,5,12,13]. Therefore, in order to support the establishment of land-use plans, these driving factors need to be taken into account in multi-criteria decision making in land-use changes.
With respect to modeling land-use changes, although existing models are widely used in urban planning, the landscape of many countries, including the mountainous areas of Vietnam, requires the development of a specific model for large-scale land-use management for the complex hydrological features of these landscapes. Many studies applying GIS [14,15,16] and Markov chains [17] to land-use forecasting have been widely used to describe land-use changes over time. However, the Markov model does not consider the driving factors behind the changes; it only considers the area changes over the years in order to build a transition probability matrix. Thus, Markov is only suitable on the macroscopic level. In addition, when building a transformation probability matrix, one is faced with many difficulties when the data come from different sources; this leads to errors in the simulation. Some results combine Markov and cellular automata to spatially arrange forecasting results [18,19,20,21,22]. Bielecka (2020) [23] summarized the advantages of the cellular automata model, which is one of the simplest spatial modeling methods for land-use change modeling, as it can solve a large-scale area model by increasing the cell size. Cellular automata allows users to perform almost any algorithm from a simple one using Markov chains, GIS spatial analysis modeling or complex evaluations for land-use changes. Bielecka (2020) [23] showed that many modeling programs support cellular automata, such as CLUE, SLEUTH, DINAMICA EGO, IMAGE and MARKOV-CA, which are more frequently used in urban planning and landscape modeling. They have been used in many countries, including the mountainous areas of Vietnam.
In the last few years, many researchers have tried to improve the cellular automata land-use change model and applied new methods to auto-calibrate these models [22,24]. Cellular automata have also been combined with agent-based modeling (ABM, [25]). Individually based models, with simple behavioral models, have even made it possible to model individual land-use change decisions and to simulate their collective effects at higher geographical scales [26,27,28]. These kinds of models have been widely applied to model urban growth and land use and land-cover changes [24,29,30,31]. They have also been applied in natural risk assessment [19] in the highland and mountainous areas of northern Vietnam [32,33], which have different environmental conditions. Truong et al. (2016) and Drogoul et al. (2016) [3,34] showed interest in using a multi-agent model in the Mekong Delta to study land-use change on a small scale at the commune level. This was based on many factors, with a detailed description of the current status of each land plot. However, this level of detail was not effective when it was applied on a larger scale, such as the provincial or regional scale, because of the question of spatial data size. However, cellular automata allowed users to define cell sizes that were appropriate to the scale of the maps. Thus, the cellular automata approach, with multi-criteria analysis for understanding land-use changes influenced by driving factors, was suitable for large-scale areas in the low lands and coastal areas.
The objectives of this study were as follows: (1) to build a simulation model based on cellular automata and multi-criteria analysis approaches that takes into account socioeconomic, salinity intrusion and environmental factors; (2) to use the model to understand future land-use changes as a basis for agricultural land-use planning; (3) to simulate land-use adaptation scenarios when environmental changes cause sea levels to rise.
2. Materials and Methods
2.1. Proposed Model
2.1.1. Overview of the Model
The model was designed based on the cellular automata modeling approach in the GAMA simulation platform [35]. This is a software that provides many powerful tools for large-scale, equation-based cellular automata and agent-based modeling, especially the ability to integrate complex GIS data with an intuitive design interface [36].
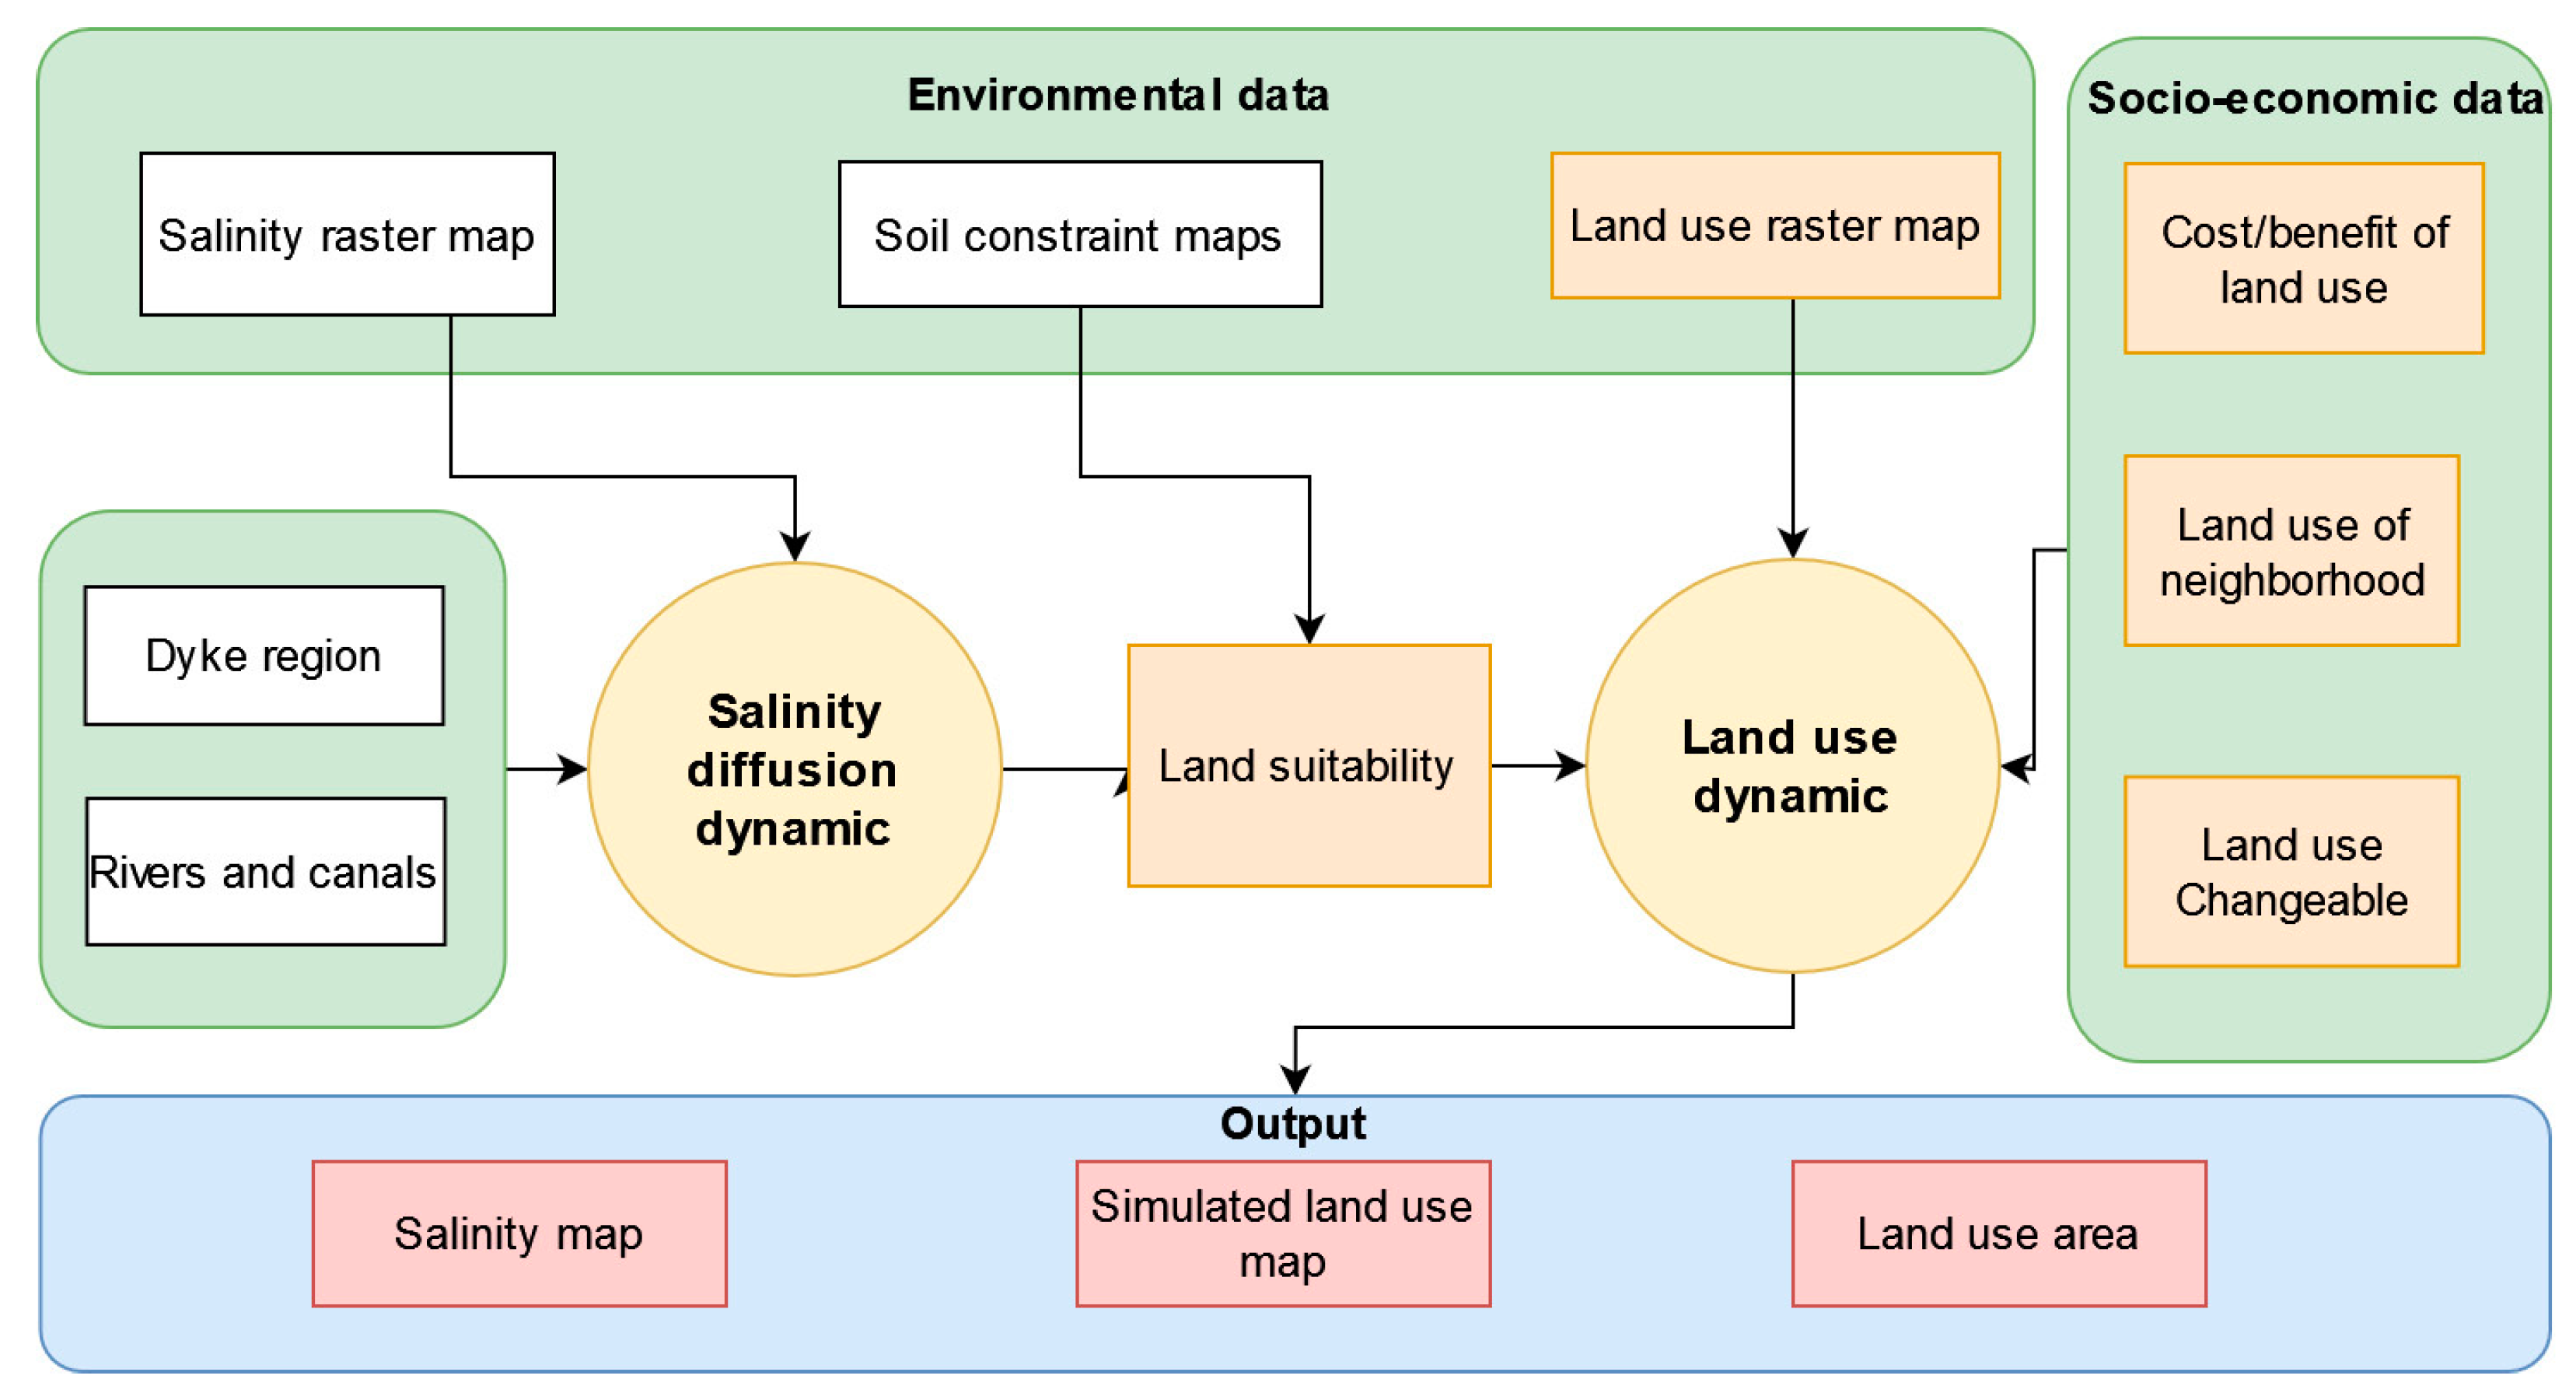
In this work, a new model named MEKOLUC1 (Mekong Delta land-use change) was developed to study land-use changes and assess land-use strategies in order to support land-use planning. The conceptual model of MEKOLUC is shown in Figure 1. The input of the model includes a salinity raster map, dike and sluice gates, the profits of land-use types and the ability to convert between a land-use-type matrix and a land-use raster map. There were two main dynamics in each simulation step (one step was one year): salinity diffusion and land-use decision. The salinity diffusion was based on Markov–cellular automata with the saline neighbor rule, where a cell’s salinity conversion was based on the proportion of neighborhood saline cells and limited by the dike and sluice gate systems. In each step, the salinity diffusion process updated the salinity level of the cells in the salinity layer. The salinity level was then combined with the salinity duration, soil type and acid sulfate type to create a land mapping unit that was used for calculating the land suitability of each land-use type. The second process was used to select the appropriate land-use type for each cell based on the multi-criteria evaluation among the land-use candidates.
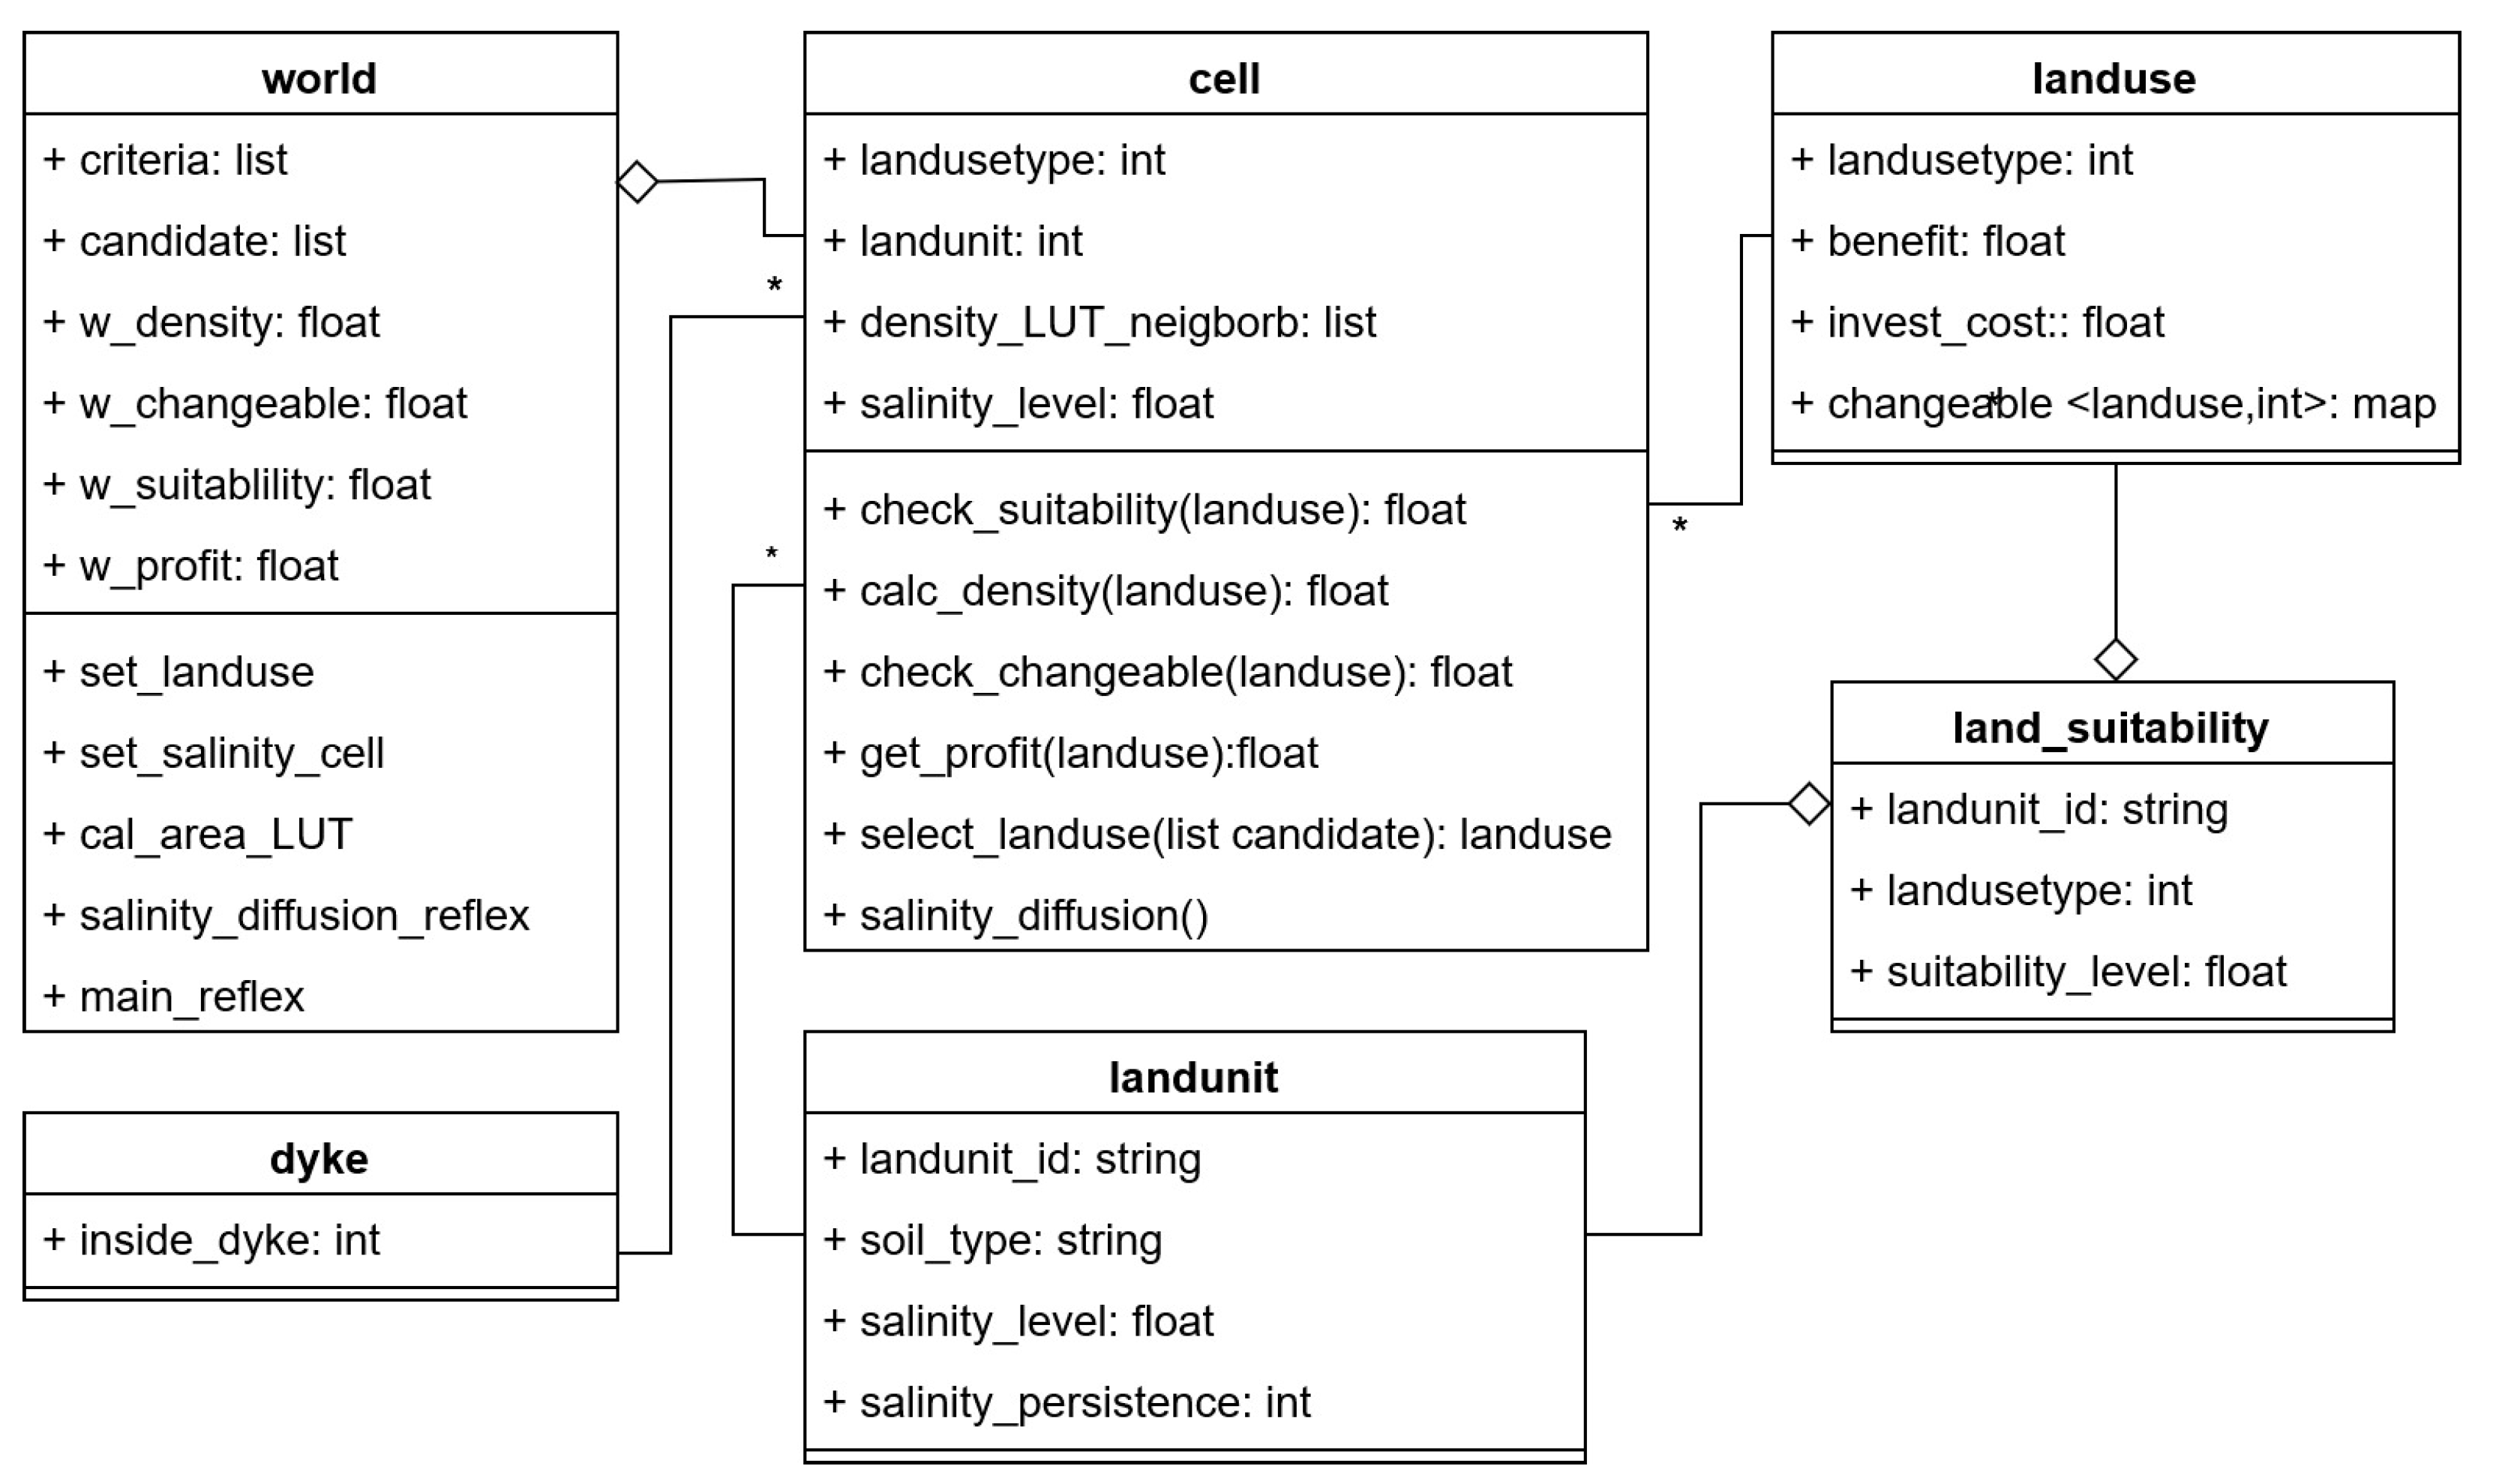
The diagram in Figure 2 shows the main objects in the model: the world, cells, land-use types, dike-protected regions, land units and the land-suitability dataset. The main objects are the cells. Each cell belongs to a land unit. The cells belong to the area inside or outside the dike. The land suitability of the cells is determined by the composition of land-use types and land units. The land unit provides information on soil type, salinity level and time of saline intrusion. Land units are associated with land-use patterns to provide a level of land suitability. Each cell also has a list of neighboring cells. Each land-use type provides the benefit and implementation costs, along with a map that measures how convenient it is to convert from one land use to another.
2.1.2. Multi-Criteria Land-Use Decision
The main land-use types (LUTs) selected are the dominant agricultural land-use types in the Mekong Delta, which include land growing rice, rice–vegetable rotations, vegetables, fruit trees, rice–shrimp rotations and shrimp.
Based on previous studies [6,9,34], the selection of land-use type for each cell is based on multi-criteria decision making. There are four selected criteria affecting land-use change that were taken into account.
• Land suitability: This criterion represents the suitability of the land’s environmental conditions (soil and water) to a particular land use. As environmental conditions change, the adaptation level also changes. Land suitability assessments were carried out in accordance with the FAO soil assessment process (FAO, 1976) [8]. The adaptability of the soil was based on the characteristics of the soil, water, topography and land cover, and was classified into four levels: S1—highly suitable; S2—suitable; S3—slightly suitable; and N—not suitable. The four suitability levels were standardized from 0 (not suitable) to 1 (most suitable).
• Changeable: This criterion measures how convenient it is to convert from the current land use to another (Table 1). In farming systems, the transition from one type to another depends on the conditions in which new farming types can be established. In this study, the ease of conversion was determined based on the similarity between the cultivation types. Convertibility was coded on a Likert scale with five levels (0, 0.25, 0.5, 0.75, 1), where 0 was non-changeable and 1 was easily changeable.
• Density: The density of a LUT candidate in the neighborhood affects the selection of LUT. The higher the percentage is of a LUT candidate in neighboring cells, the greater the influence it has on the selection.
• Profit: The profitability of a LUT is one of the factors that leads to changes. This factor expresses the willingness of farmers to increase their income.
At each simulation step, each cell first evaluated the factors, calculated the convertibility index for each candidate using a weighted mean equation of the four criteria (Equation (1)) and then selected the optimized LUT among the candidates.
where:
• LUTi: current land use of the cell.
• LUTj: candidate land-use type; LUTj is one of the land-use types in the land-use map.
• CD, CLS, CP, CC: the four criteria—namely, density, land suitability, profit and changeability, respectively.
• WD, WLS, WP, WC: weights of criteria CD, CLS, CP, and CC, respectively.
The LUT scale values of neighboring cells were calculated based on the 8-cell Moore topology for each land-use type. For each cell, the value of each land-use type was calculated according to the proportion of the neighboring cell.
2.2. Case Study
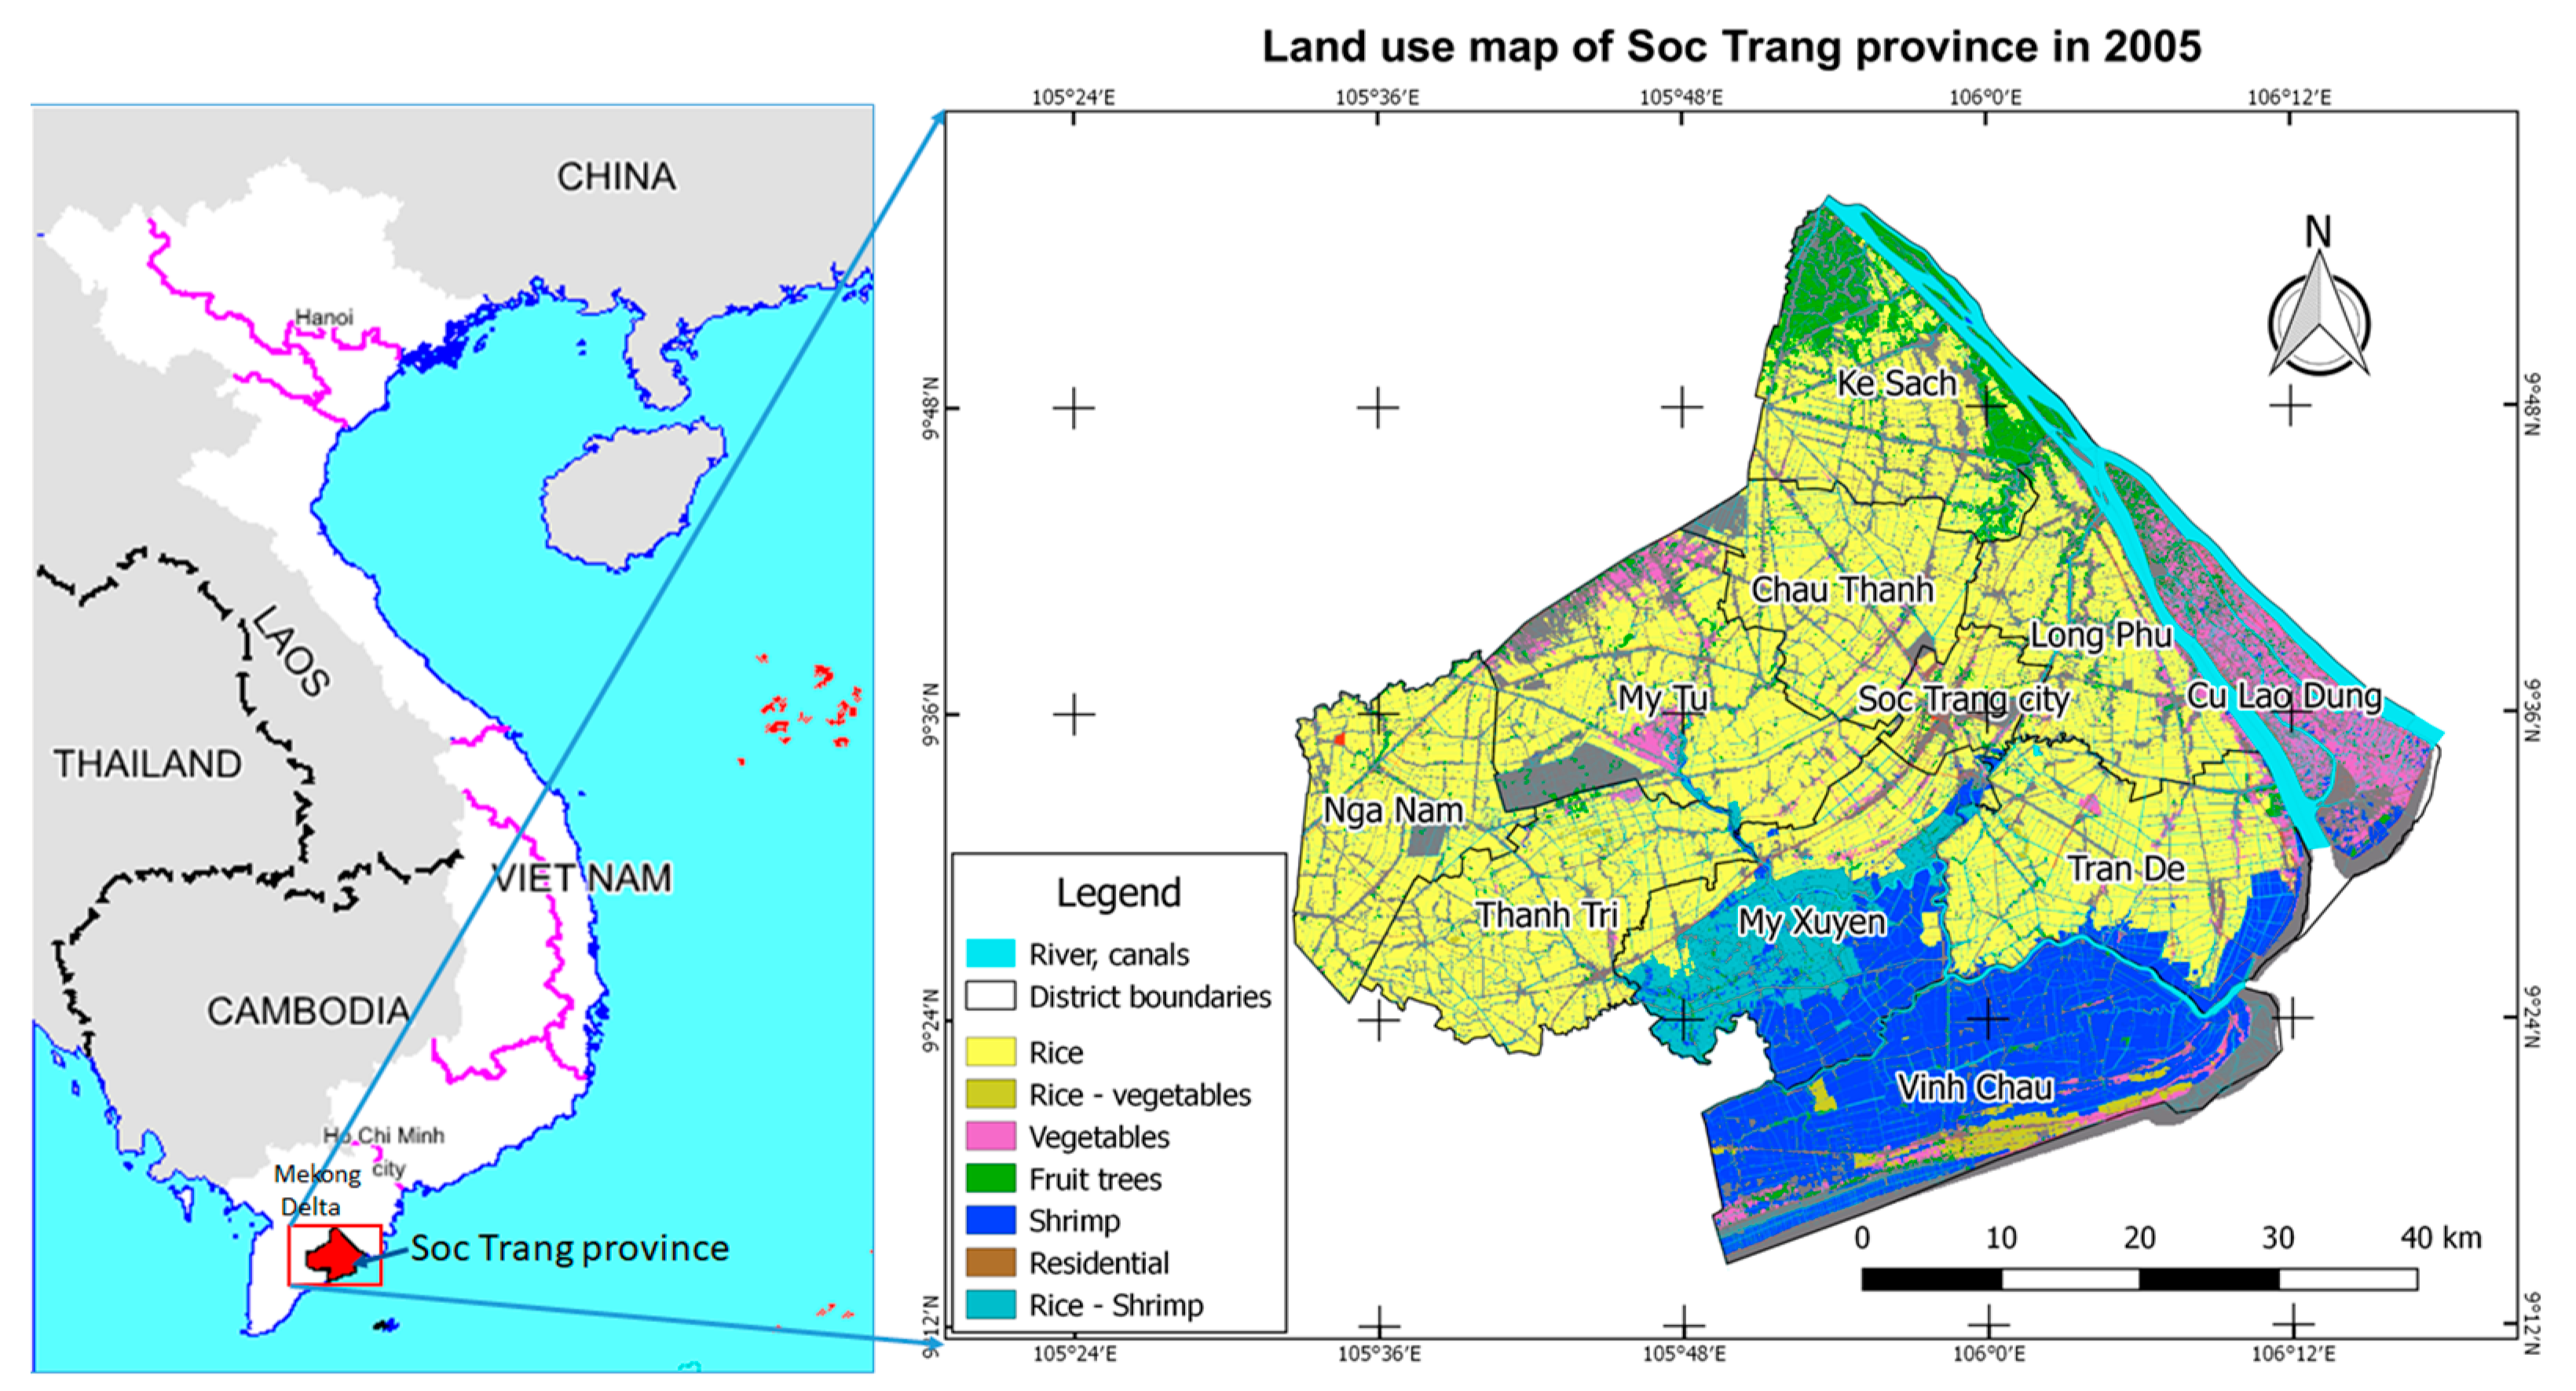
Soc Trang is a coastal province in the Mekong Delta (Figure 3) with an area of 3311.87 km2 and approximately 1.3 million inhabitants. This province is located in the estuary area of the Hau river, a tributary of the Mekong river. The northeast region of the province is bordered by the Hau River and the southeast region is bordered by the sea. This region is also characterized by dike systems that prevent saline intrusion. The province is located in different specific agro-ecological zones of the delta: the fresh water region in the north (composed of the Ke Sach, Chau Thanh and My Tu districts), the coastal region protected by dike systems (composed of Long Phu, Tran De and Cu Lao Dung), the brackish water region (with 6 months of salt water) in the southwest (My Xuyen) and the saline water region in the south (Vinh Chau). With many ecological zones, the main land-use types of the region are very diverse and include rice cultivation, rice–vegetable rotations, rice–shrimp rotations, shrimp, fruit trees, vegetables and mangroves.
Soc Trang is also one of the provinces in the Mekong Delta that has been strongly impacted by saline intrusion and drought caused by extreme weather. In 2016 and 2020, saline water penetrated deeply into the river mouth of the Hau River, causing freshwater areas to become saline and drought in the dike regions, which seriously affected crop cultivation in the dry season of the province [38,39]. These irregular phenomena show that it is necessary to study and project land-use changes in order to support land-use planning towards adapting to environmental changes.
2.3. Socioeconomic and Environmental Data
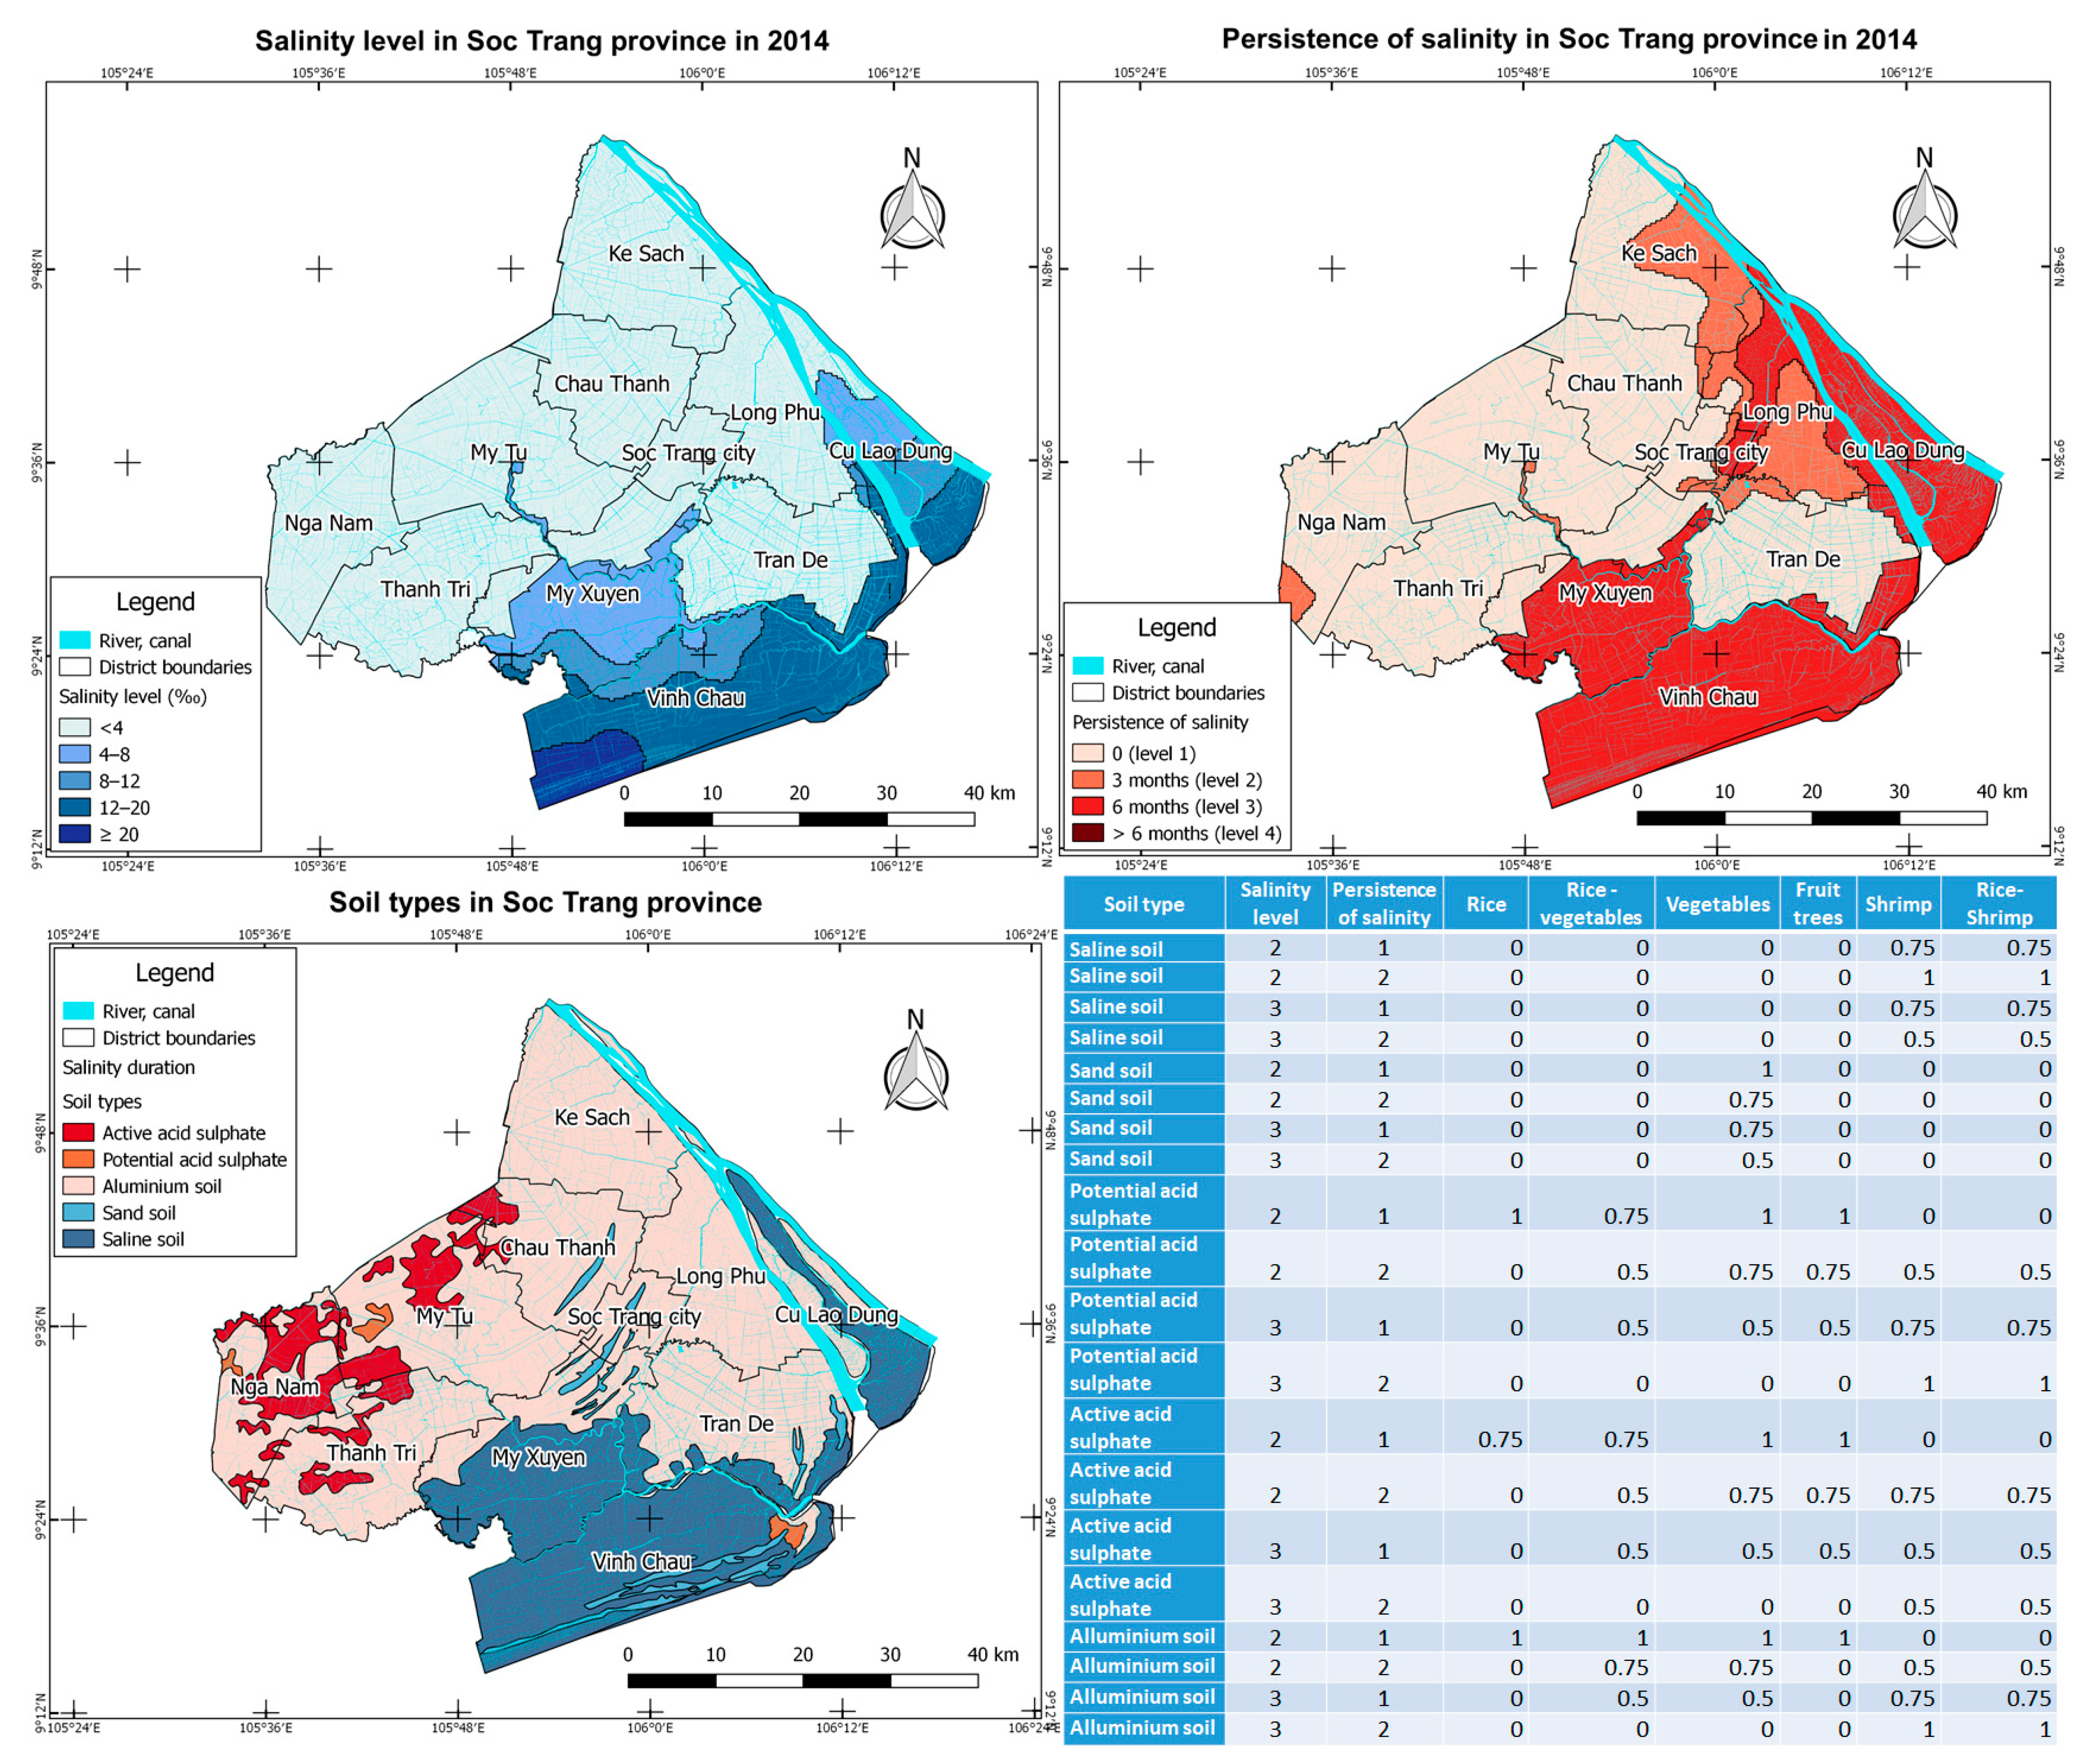
The input data of the model include land-use maps of Soc Trang province in 2005, 2010 and 2015. These maps were collected from the inventory maps created by the Department of Natural Resources and Environment of Soc Trang province in these years. Land-use maps were converted to raster format with 100 × 100 m resolution. The land-use map from 2005 was used to initialize cells, the one from 2010 was used to calibrate the model, and the land-use map from 2015 was used to verify the model. Moreover, the soil map of Soc Trang from 2014, salinity maps from 2005 and 2014 and projected salinity scenarios for 2030 were also collected (Figure 4). The salinity maps from 2005 and 2014 were used for Markov analysis to provide a Markov transition matrix for the salinity diffusion dynamic.
For economic data, profitability of land-use types are collected based on household surveys. These surveys showed that the profit of shrimp was the highest2 (389 million VND/ha), followed by fruit trees (294 million VND/ha), vegetables (180 million VND/ha) and rice–vegetable rotations (64 million VND/ha). Rice gave the lowest profit at 34 million VND/ha.
To study the change in land-use status up to 2030 under the impact of climate change (a rise in sea level), this study uses additional input data for the model from the saline intrusion scenario map due to the sea-level rise (SLR) under normal conditions by 2030 [41].
2.4. Calibration and Validation Methods
We used the genetic algorithm (installed in GAMA) to find the best combination of parameters—i.e., the one that maximizes kappa between the simulated data and the observed data (land use in 2010). Each parameter value could vary from 0.1 to 1, with a step of 0.1.
The fuzzy-kappa [42] action installed in GAMA was used to calculate the precision of the simulation, including the root mean square error (RMSE) value that was used to validate the simulated area with the historical land-use statistic.
where Areasim is the simulated area of each land-use type; Areastatistic is the statistical land-use area; and T is the number of simulated land-use types.
3. Results
3.1. Historical Land-Use Changes
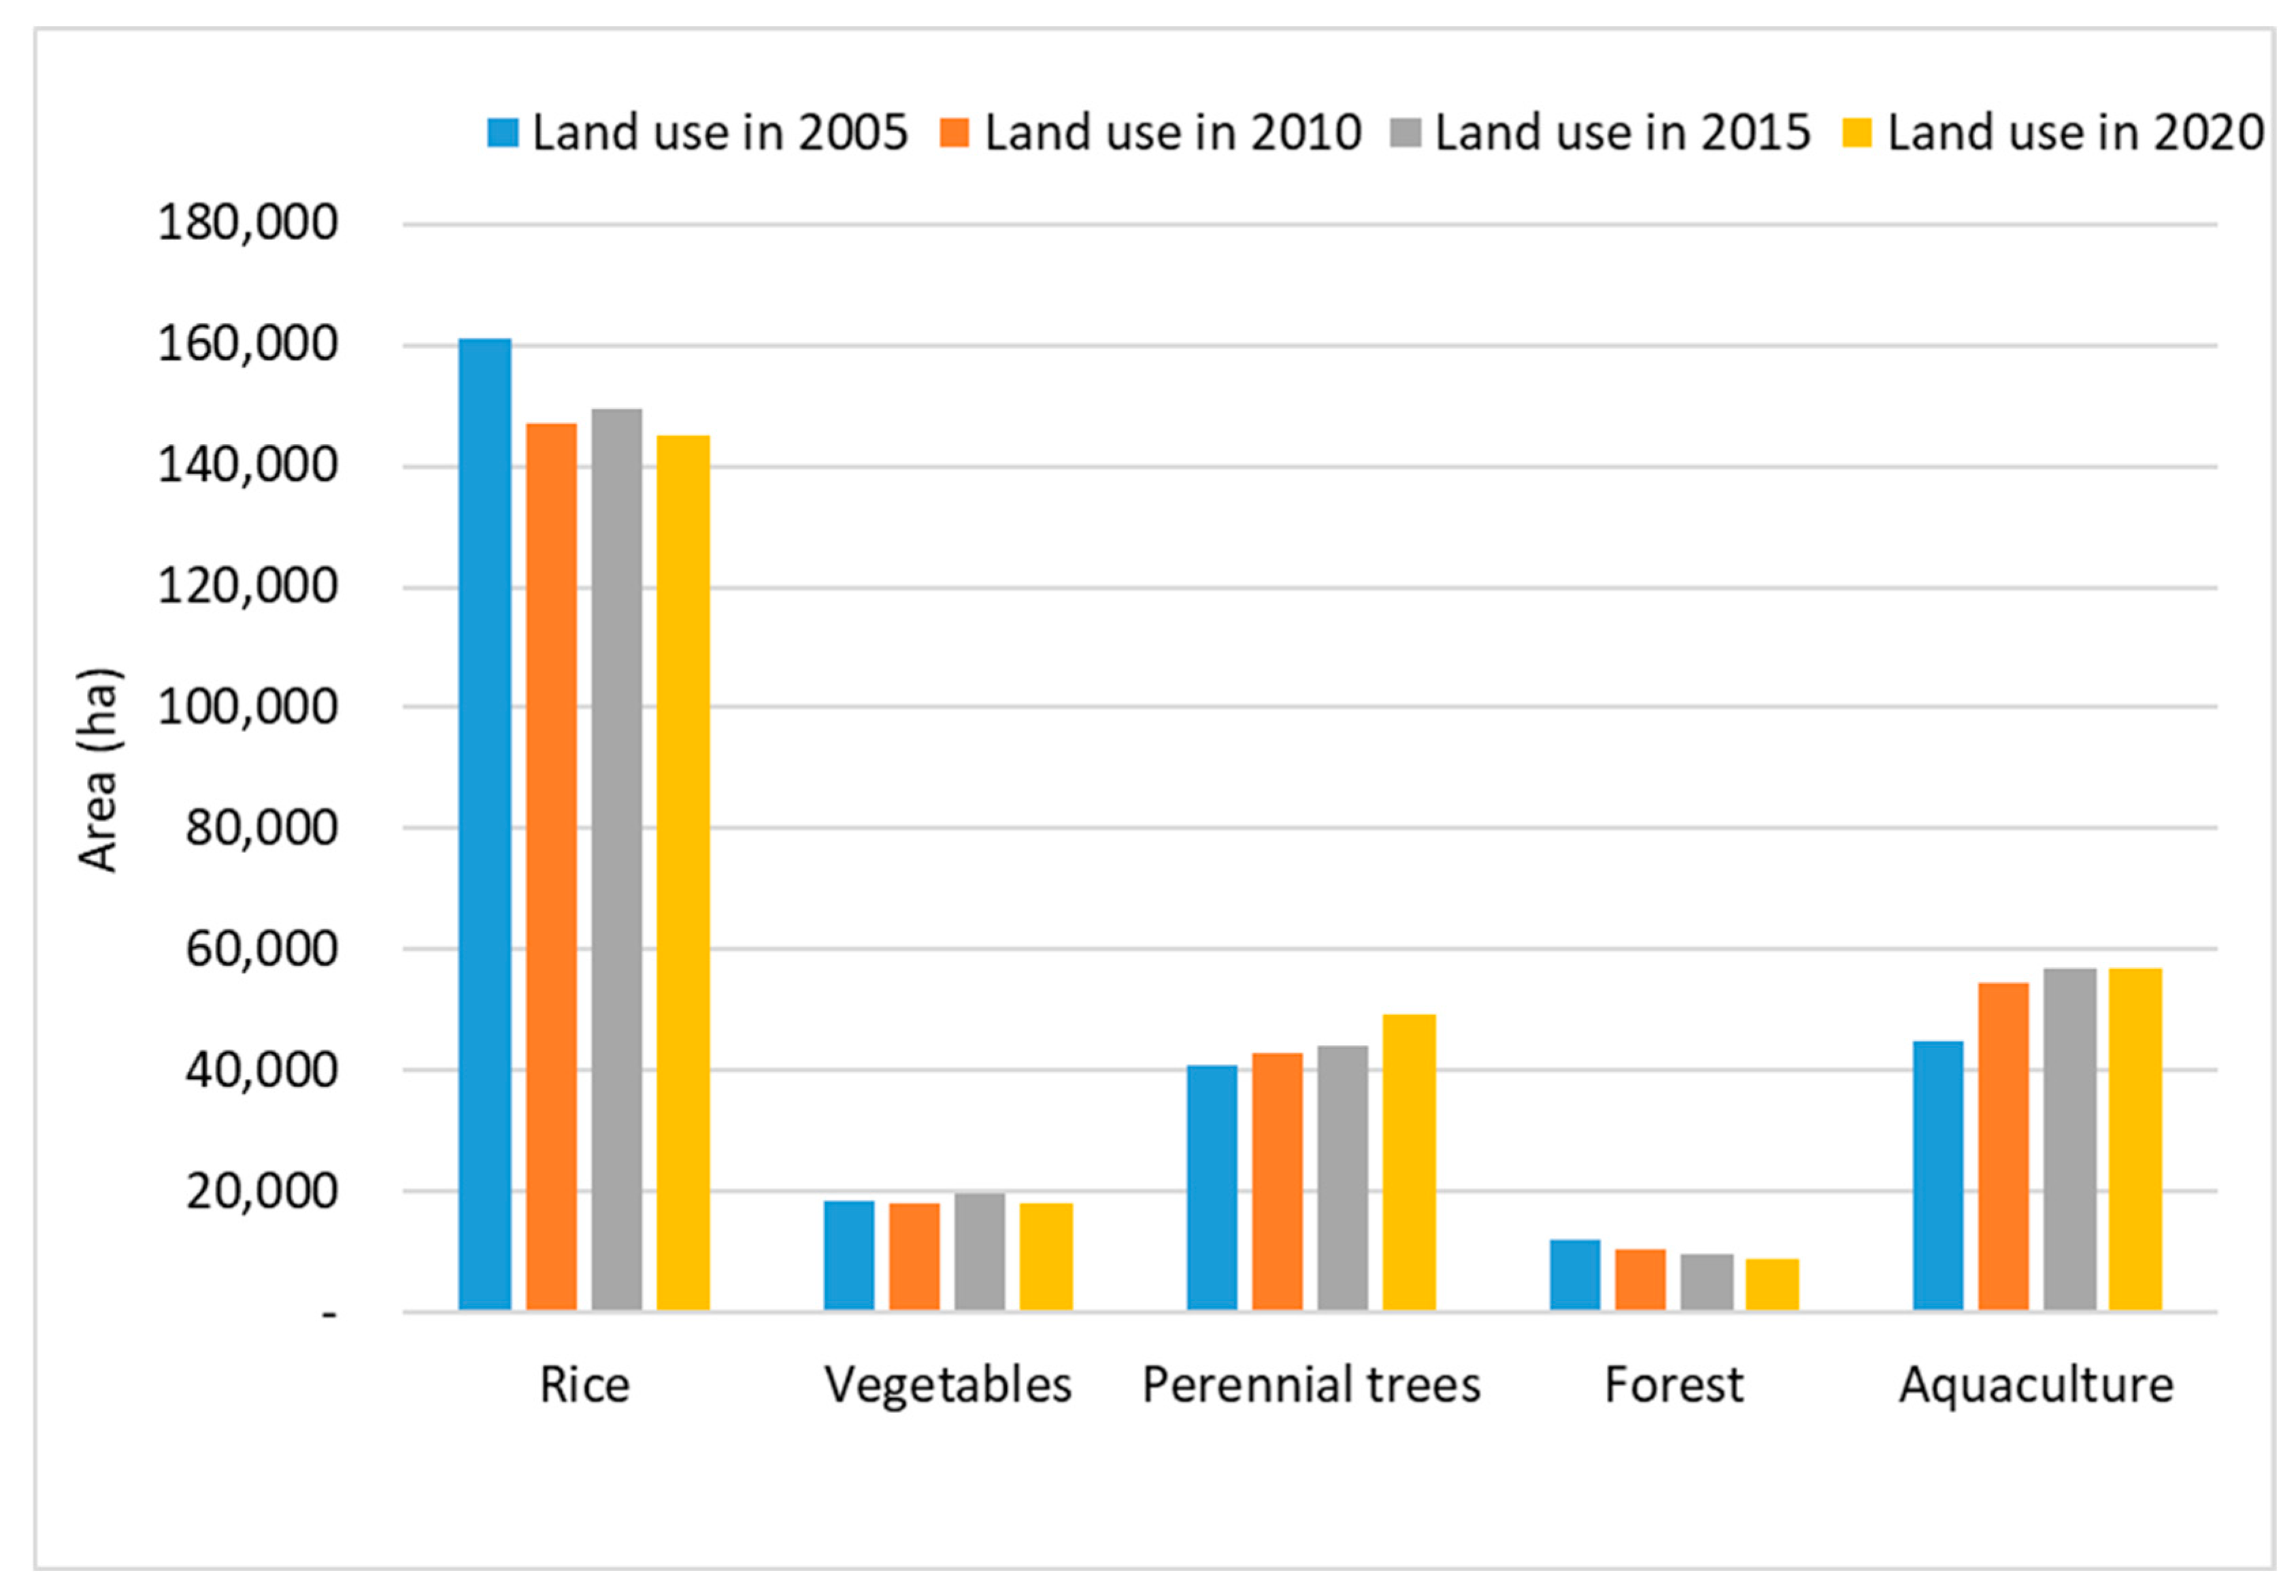
To analyze past transitions between land-use types, the areas of land-use types in the period 2005–2020 were analyzed (Figure 5).
Figure 5 shows the trend of shifting away from rice production (including rice–shrimp rotations) to other land uses. In the first period (2005–2010), the total land area that shifted away from rice production represented more than 13,800 ha. At the same time, the area used for shrimp aquaculture increased from 45,054 ha to 54,519 ha and the area used for vegetables and perennial trees slightly increased. Young et al. (2002) [47] showed that in early 2000 the market price of rice was near or below its production cost, which explained why a huge number of farmers shifted their land use away from rice. In the next period (2010–2015), the area used for the production of rice slightly increased to around 149,000 ha, then decreased again in the period 2015–2020. After the initial increase in 2010, the aquaculture area slightly increased over the next 10 years because the regions inside the dikes were well protected and hence suitable for rice production. In this period of 15 years, the forested area decreased from more than 12,000 ha to 9820 ha.
Historical data have revealed a difficult problem for land managers: while farmers tend to convert their land use to intensive rice production in the dike system or transition from rice–shrimp rotations to shrimp farming in the outer dike areas, the areas outside the dikes were converted to shrimp production, which raised the question of how to build infrastructure plans and land-use strategies for sustainable development.
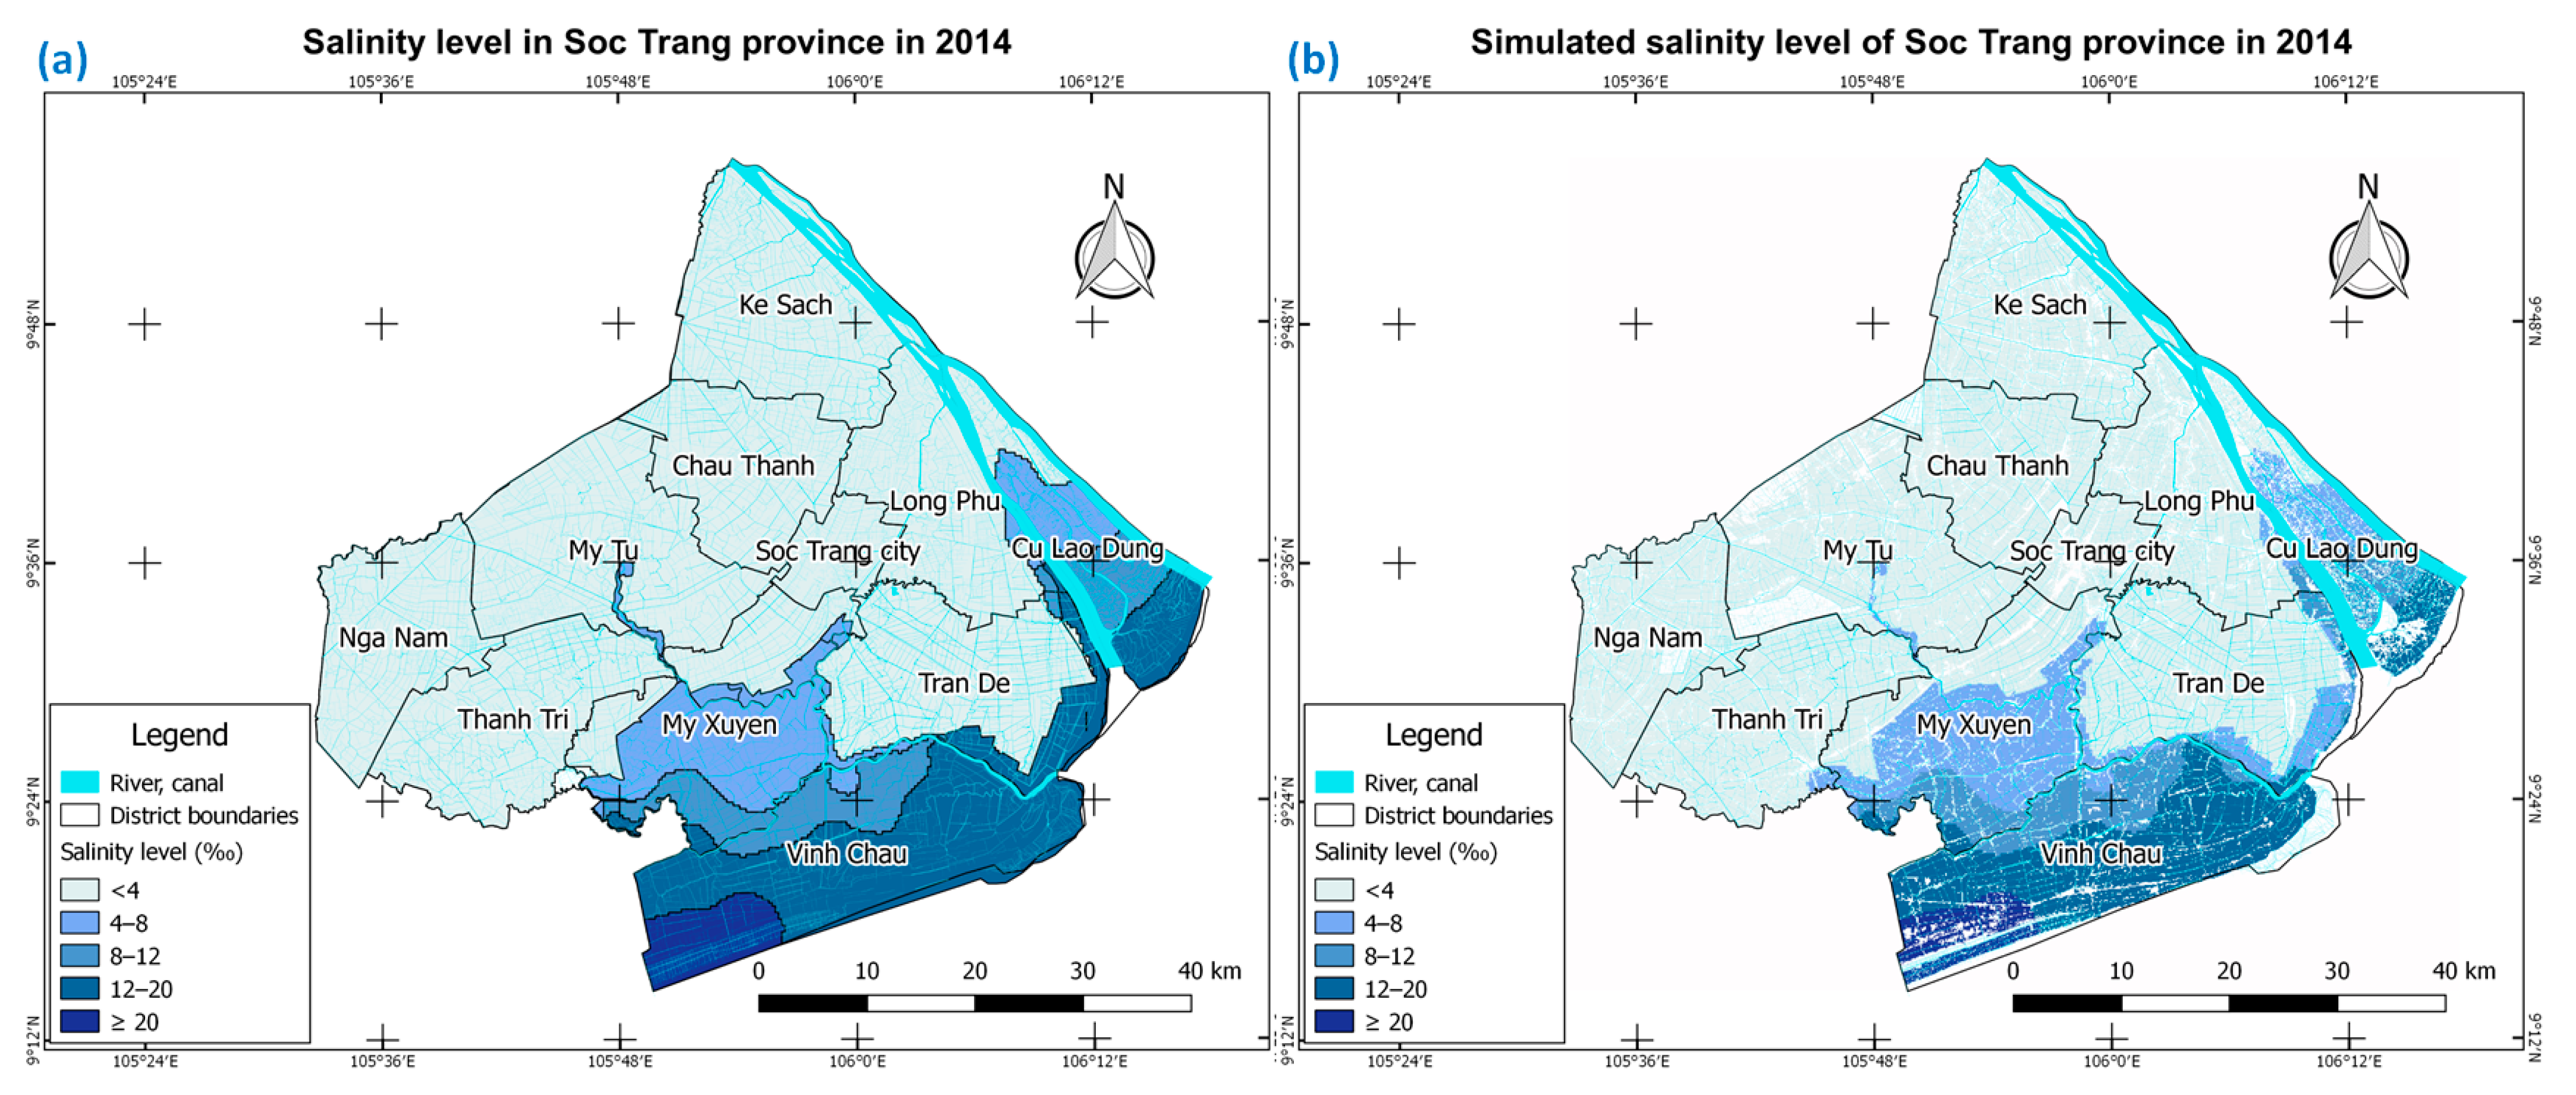
3.2. Salinity Diffusion
Agricultural activities in Soc Trang province are heavily influenced by local policies on the management of dikes and sluice gates, which prevent saline intrusion. The salinity transmission mechanism was built using a Markov chain based on salinity maps from 2005 and 2015, where the salinity data were divided into five levels: <4‰; 4–8‰; 8–12‰; 12–20‰; and greater than 20‰. The mechanism of salinity propagation was constructed according to a Markov–cellular automata for the areas outside the dikes. Figure 6 shows the results of salinity diffusion, where the map on the left shows the simulated results of salinity in 2014 (Figure 6b) compared to the actual salinity map in 2014 (Figure 6a). In the coastal areas of the Tran De district, the salinity changed due to the expanded dike boundary region surrounding the shrimp farming areas. For the rest of the areas, the saline area, at 4-8‰, was opened up to the dike and the 8-12‰ salinity zone did not change during this period. This phenomenon showed that under normal climate conditions, the dikes mainly affected the saline intrusion in this region. Therefore, the dike management policy in the current situation affects the water environment and will affect future land use.
3.3. Calibration and Validation
3.3.1. Calibration
In this case study, the MEKOLUC model was calibrated with a land-use map of Soc Trang province from 2010. The calibration process determined a set of weights (WD, WLS, WP, WC), where the simulated land-use map fitted the observed map from 2010 well. The calibrated results showed that the set of parameters for the criteria were set to 0.6, 0.7, 0.8 and 0.2 according to the weight of land suitability, changeability, density and profitability of the use types. The best kappa coefficient was 0.86.
3.3.2. Validation
The simulated results were then compared to the 2015 and 2020 land-use inventory datasets. Two indicators were taken into account: the difference between the simulated area and the statistical area in 2015 and 2020, and the fuzzy kappa values. Table 2 shows the deviations of the simulated values in 2015 and 2020. The deviation between the two datasets showed small values of 0% to 19% for rice and fruit trees. The RSME values were 2087.16 ha and 2379.54 ha (per total of 240,034 ha) for 2015 and 2020, respectively. Since 2015 and 2020, in the statistics data, rice was not classified in detail (as rice or a rice–shrimp rotation), the rice area in Table 2 includes rice, rice–vegetable rotations and rice–shrimp rotations.
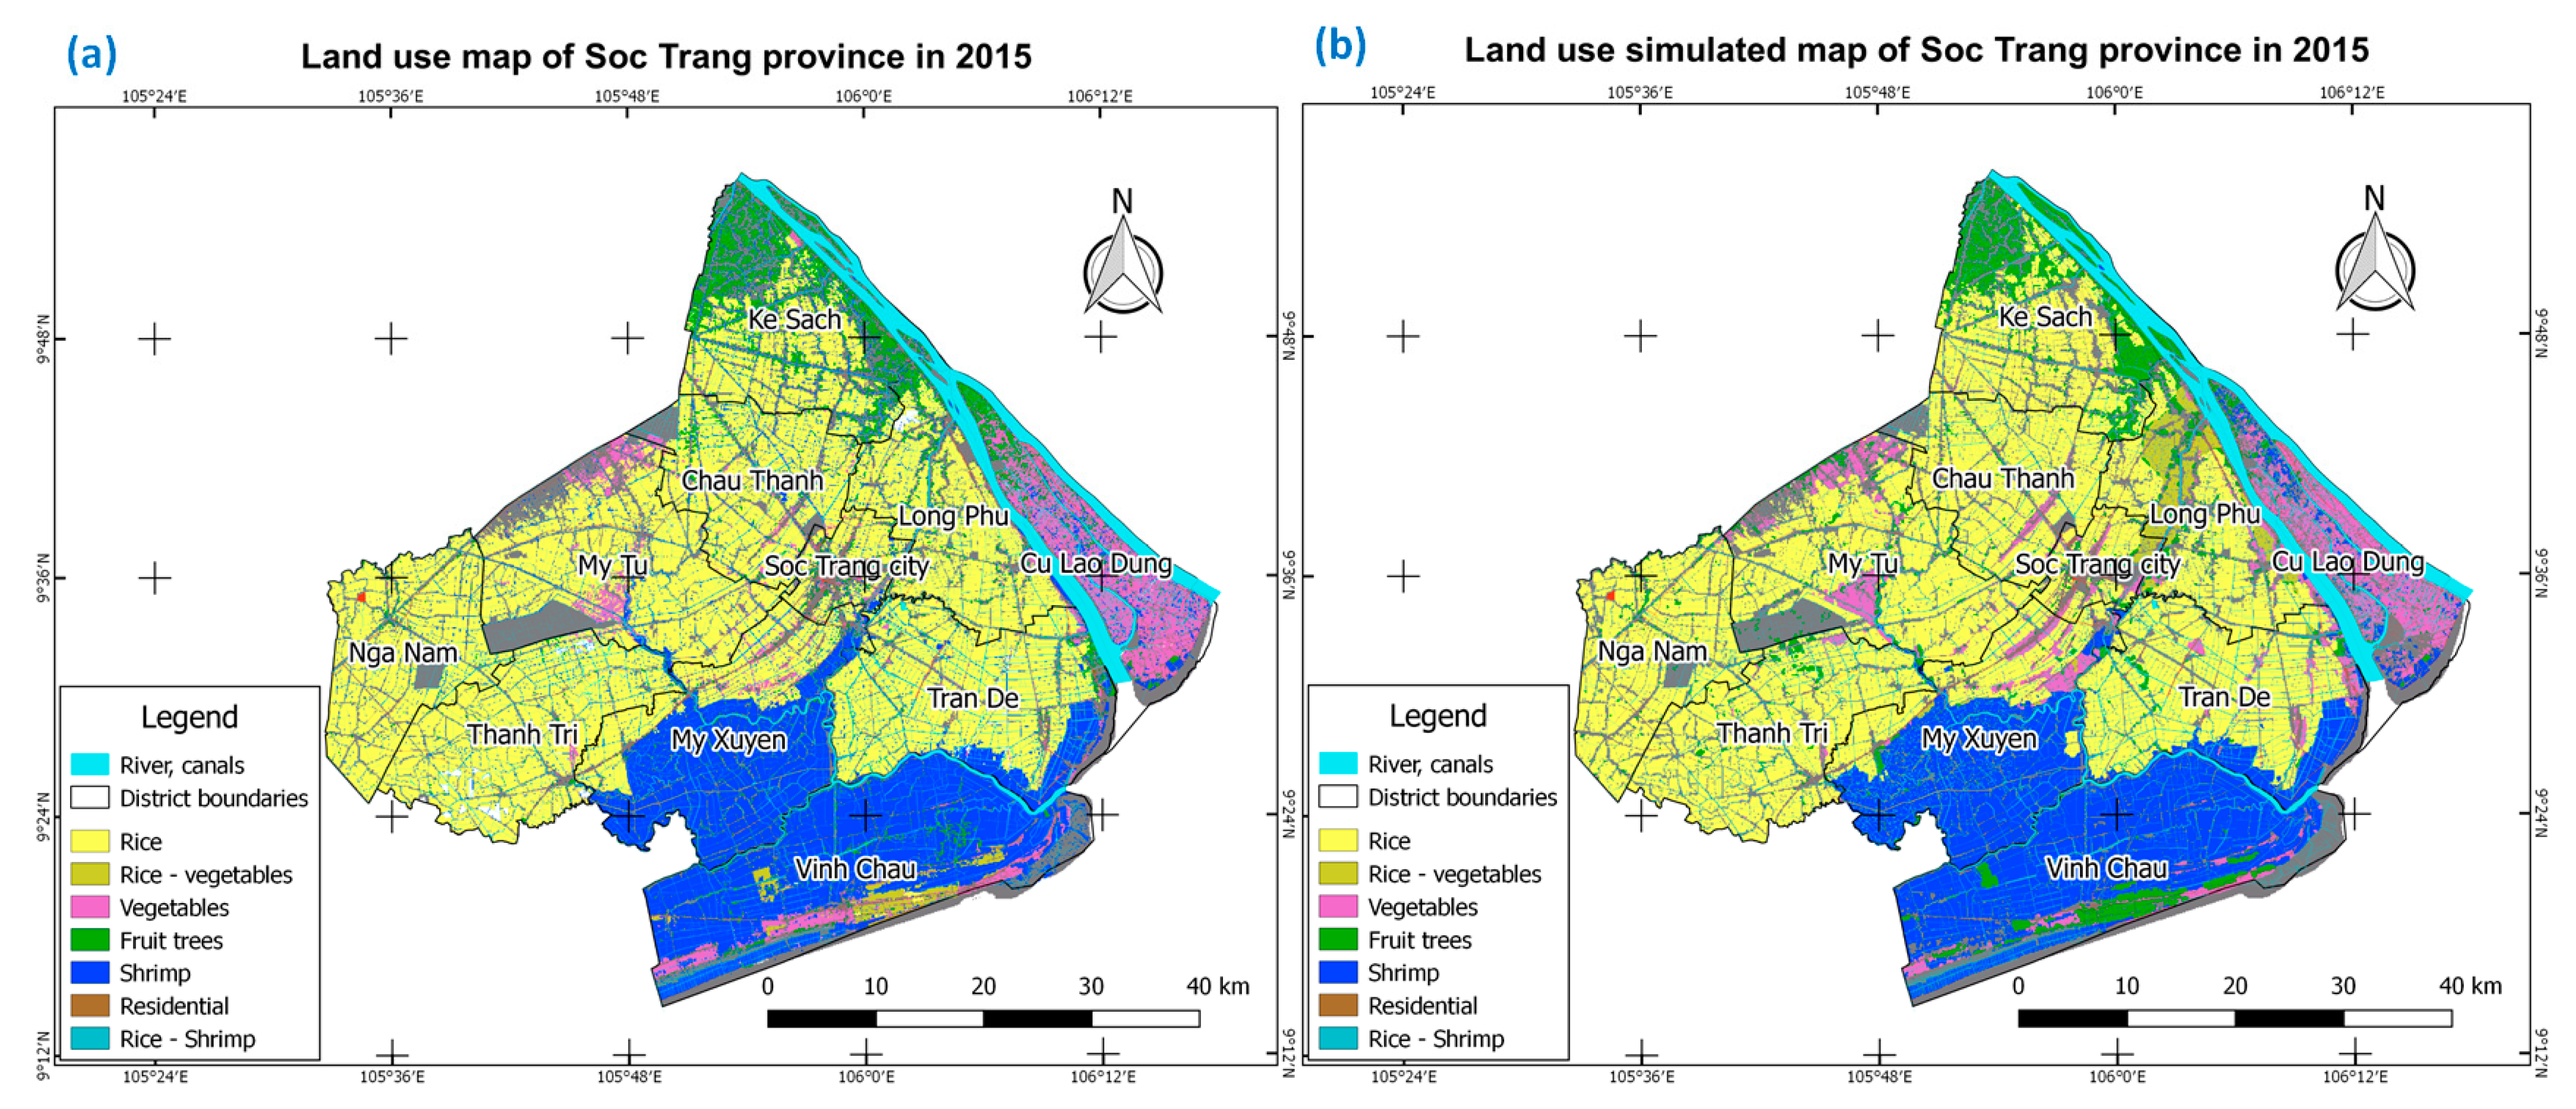
The map in Figure 7 shows a comparison between the simulated land-use map and the observed map of Soc Trang province in 2015. The obtained fuzzy kappa coefficient was 0.88. The simulated map showed that there was a big gap in the estuary area of the Long Phu district. This area was simulated as a rice–vegetable rotation, but in reality it was still a rice field. Nevertheless, the results also showed that the area of rice land decreased and the areas used for the production of vegetables and aquatic products both increased.
3.4. Land Use in 2030 under the Conditions of Climate Change
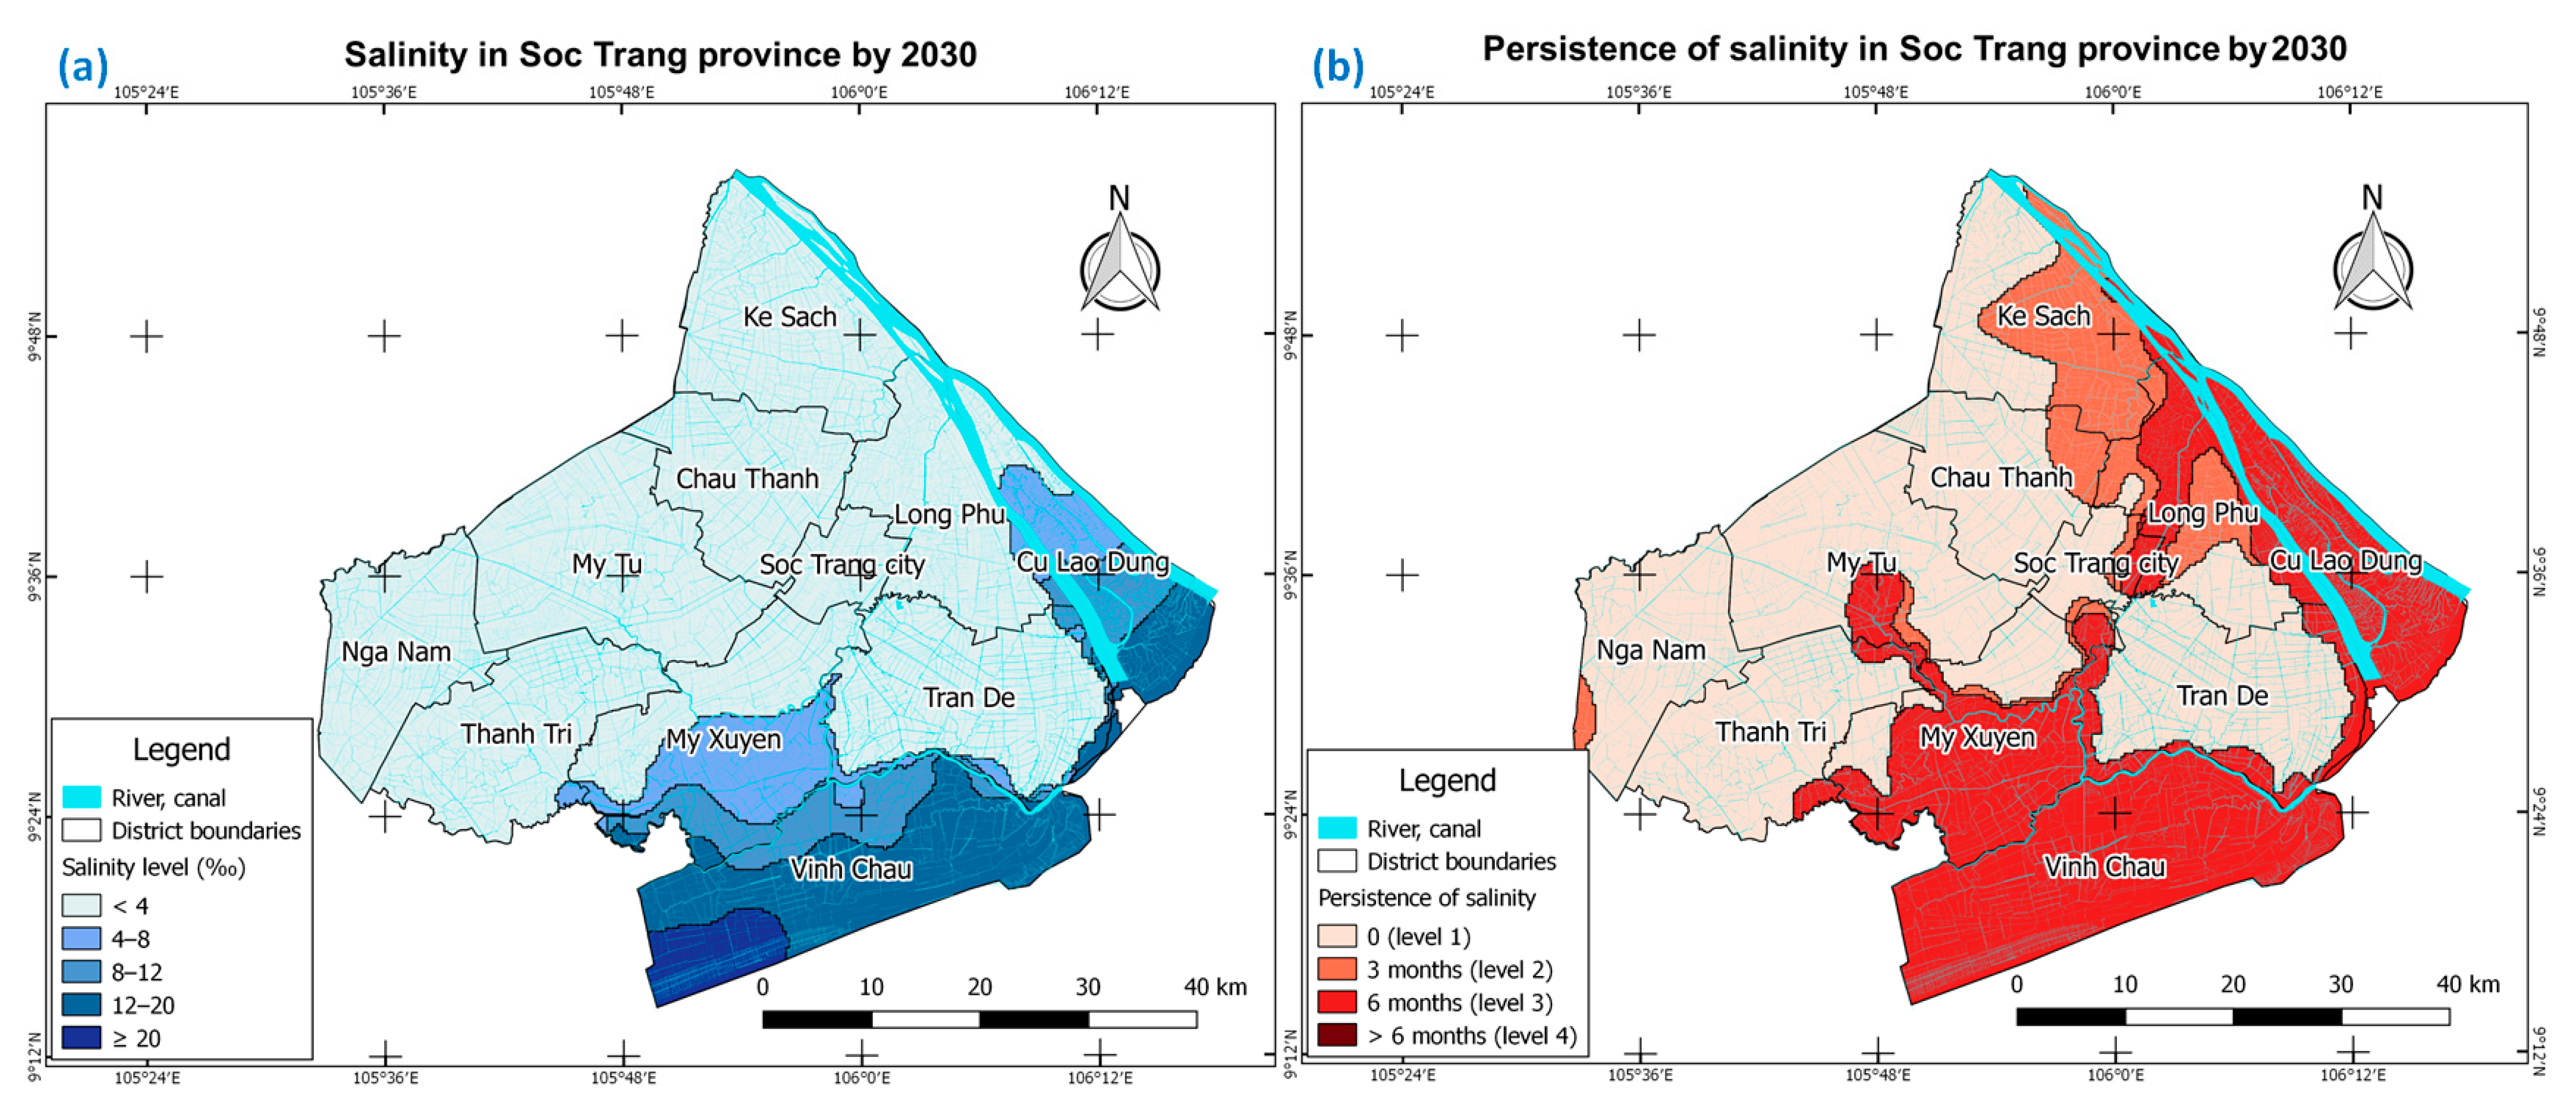
As the model was verified with the observed land-use map, the model was used to estimate land use up until 2030 under the impact of climate change (in the case of a rise in sea level). In this scenario, the predicted saline intrusion (following a rise in sea level) in 2030 was used (Figure 8). In the case of Soc Trang province, it was assumed that the dike system and the level of operation of the dike lines were kept constant.
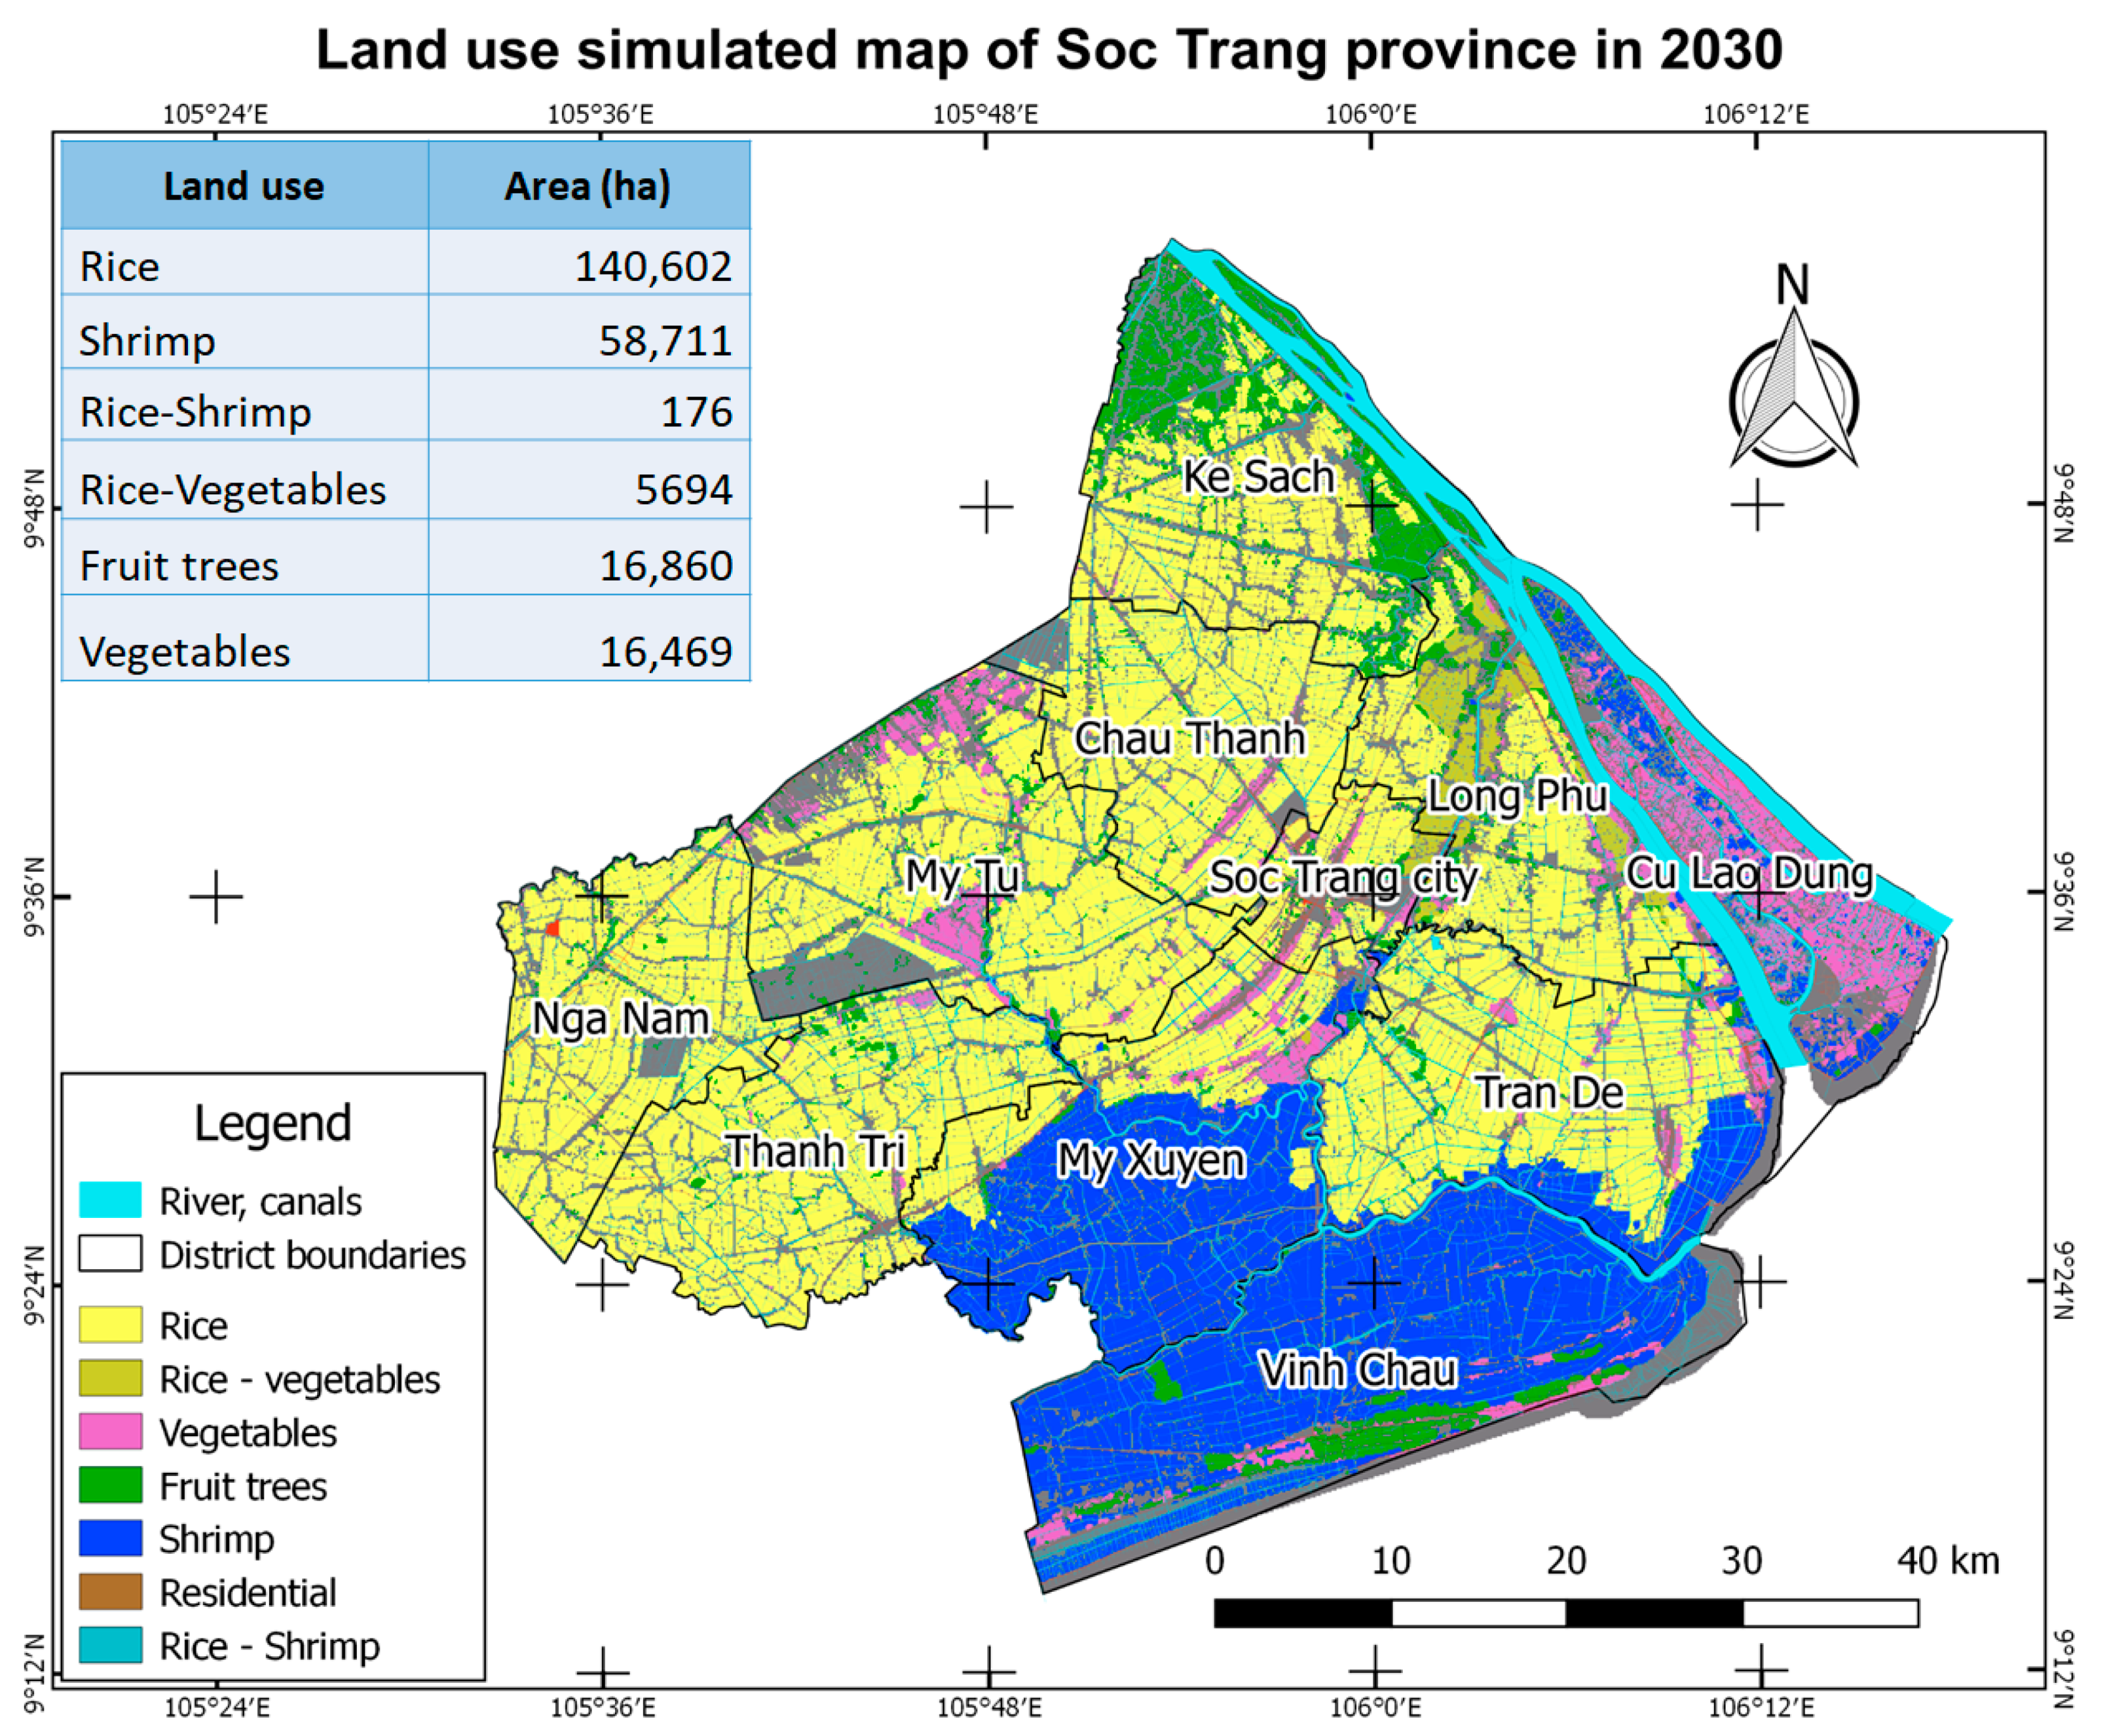
The results of the simulated land-use change up until 2030 are shown in Figure 9. The main trend showed there would be a slow conversion from rice and rice–shrimp rotations to other types. Rice–vegetable rotations, fruit trees and vegetable areas are predicted to increase until 2025, but then in the next 5-year period these land-use types are predicted to decrease. All of the decreasing areas are shown to be shifted to shrimp.
The reason for the slow conversion is the lack of water for irrigation in the dry season. When salinity increases, even saline water is protected by the dike systems, which cause a lack of water for irrigation in the dry season. This situation affects the adaptation of plants. This shows that the government needs to invest in infrastructure to improve irrigation systems, even when the farming system uses less water for irrigation.
4. Discussion
In this section, we discuss the points that arose when using the model throughout the application case.
The advantage of this study is that it developed a model of land-use change that is adapted to the characteristics of the Mekong Delta, which will be affected by saline intrusion on a large scale compared with the highland region [33,48]. The model used cellular automata with a multi-criteria method that has been promoted in many similar studies [18,22], but with a new approach of coupling salinity diffusion with land-use changes. In our study, the multi-criteria assessment took into account the main driving factors of land-use changes, including economic (profitability), social (neighborhood and land use changeability) and environmental (soil, salinity, land suitability) factors. This helps planners to understand the impact of these factors on the lowlands of developing countries. Of these criteria, land suitability is an important criterion for choosing the type of land use where there are salt water intrusion dynamics; in this case, land suitability was re-evaluated during simulation. The multi-criteria assessment process then used these updated environmental data to increase the accuracy of the model.
In terms of accuracy, the model automatically calibrated the weight of the criteria experiment based on the genetic algorithm and batch experiment provided by the GAMA platform. These were convenient and easy to apply because of the existing historical land-use maps, as well as being more precise, compared with using the AHP approach for calculating the weights of the criteria [22,49].
The verification results with the land-use maps of Soc Trang province from 2015 and 2020 showed that the maximum deviation was 19% for fruit trees. The over-estimated area in this case meant that transforming land use to fruit trees was, in reality, slower than expected, and the model was not a good simulation for this type of land-use. There may have been some other factors, such as capital, affecting fruit trees land use.
The simulation results showed that the agricultural land area tended to shrink and be converted to aquaculture. Specifically, the area of rice–shrimp rotations, which is considered to be a form of environmentally sustainable farming [50,51], shrank due to the profit-driven behavior of the people. The model allowed planners to forecast the likelihood that, when environmental factors change, people’s need to increase their income will be increased. The trend of transformation seems inevitable, which requires the government to have solutions for minimizing the damage caused by inexperienced people when converting to a new type of farming, such as investment capital for farmers.
Regarding input data, the land-use data sourced from the land-use map in the case study were based on the results of the land inventory, which is a land management requirement in Vietnam. However, the land-use types could easily be replaced by ones deduced from satellite images in similar application cases. In addition, the system of sluices and dikes, used to prevent salinity, helped to protect the rice growing area. This could be modified to test land-use solutions. Thus, planners could test policies related to environmental data by changing the dike-protection boundaries. As local management policies change, the choice of land use will change according to economic and environmental data.
During the extreme dry season [52,53,54], the source of fresh water on the canals was exhausted, and high temperatures and a lack of precipitation, combined with highly saline water, affected agricultural activities. However, the current model did not assess the risks of transitioning. These points should be explored and, supplemented by the possibility of a model-scale risk assessment during land-use change. Thus, it is necessary to extend the properties of the land cell to add more attributes concerning the capital and the level of farming technique of households to identify the risks involved, as well as quantify the required capital and technical support in the case of land-use conversion.
The model was designed to be completely open with the source code being published, allowing additional research to take place to complete the model.
5. Conclusions
In this study, a new land-use change model named MEKOLUC was proposed based on the coupling of salinity diffusion and land-use dynamics using cellular automata. Land-use decisions for each cell were based on multi-criteria decision making using four criteria: land suitability, land-use convertibility, land-use type in the neighborhood and the profitability of land-use patterns.
The model was applied to Soc Trang province in the Mekong Delta, Vietnam. In the case study, the model was verified using the 2015 and 2020 land-use statistical data of Soc Trang province, with RMSE values of 2087.16 ha and 2379.54 ha, respectively, and the fuzzy kappa value in 2015 was 0.88.
The simulated results of the land-use change scenario in 2030, according to the sea-level rise scenario, showed that the shrimp–rice rotation areas will decrease and aquaculture areas will increase to the maximum available size for the area outside the dike. In the area protected by the dike, people will gradually convert from rice cultivation to vegetable and fruit tree cultivation to adapt to climate change. This scenario is an example of using MEKOLUC to help managers and planners understand the potential for land-use change and test planning solutions to select land-use that will be most suitable for the environmental conditions.
Regarding the criteria, the model was predefined with four basic criteria, which could be improved with additional criteria to improve the precision of the simulation model. Additional criteria, such as the capital capacity and agricultural skills of households in the region, could be added to improve the accuracy of the model. In addition, climatic factors affecting land use were not included; it is therefore necessary to integrate climate factors related to climate change, such as temperature and precipitation, into further studies to account for the dynamic interaction between climate change and land use change. This will help residents and managers understand adaptation plans and test appropriate plans for each study area.
The model was designed for the Mekong Delta, a coastal region; hence, the model can be applied in delta areas with similar conditions. In addition, the model involves fully open-source code that operates on many different operating systems, so it could be extended to be applied to many land-use studies.
Author Contributions
Q.C.T. conceptualized the study, performed the modeling and data analysis and wrote the original draft; T.H.N. and V.T.P. collected the data and reviewed the manuscript; K.T. reviewed the manuscript; V.P.D.T. edited and finalized the paper. All authors have read and agreed to the published version of the manuscript.
Funding
This study was funded in part by the Can Tho University Improvement Project VN14-P6, supported by a Japanese ODA loan.
Institutional Review Board Statement
Not applicable.
Informed Consent Statement
Not applicable.
Data Availability Statement
Data available on request due to restrictions privacy.
Acknowledgments
We would like to thank the E2 project team members at the Department of Land Resources, Can Tho University, for their support during data processing.
Conflicts of Interest
The authors declare no conflict of interest.
| 1 | Source code of the model is available at https://github.com/tcquang/MEKOLUC.git (accessed on 21 December 2021). |
| 2 | 1 USD is 22,737.83 Vietnamese Dong (VND), the rate on 24 October 2021. |
References
- GSO. Statistic Year Book of Vietnam 2020; General Statistics Office of Vietnam: Hanoi, Vietnam, 2021. [Google Scholar]
- Wassmann, R.; Hien, N.X.; Hoanh, C.T.; Tuong, T.P. Sea Level Rise Affecting the Vietnamese Mekong Delta: Water Elevation in the Flood Season and Implications for Rice Production. Clim. Change 2004, 66, 89–107. [Google Scholar] [CrossRef]
- Drogoul, A.; Huynh, N.Q.; Truong, Q.C. Coupling environmental, social and economic models to understand land-use change dynamics in the mekong delta. Front. Environ. Sci. 2016, 4, 19. [Google Scholar] [CrossRef] [Green Version]
- Lambin, E.F.; Turner, B.L.; Geist, H.J.; Agbola, S.B.; Angelsen, A.; Bruce, J.W.; Coomes, O.T.; Dirzo, R.; Fischer, G.; Folke, C.; et al. The causes of land-use and land-cover change: Moving beyond the myths. Glob. Environ. Change 2001, 11, 261–269. [Google Scholar] [CrossRef]
- Briassoulis, H. Factors influencing land-use and land-cover change. In Land Use, Land Cover and Soil Sciences; Verheye, W.H., Ed.; Eolss Publishers Co., Ltd.: Oxford, UK, 2009; Volume 1, pp. 126–146. ISBN 978-1-84826-685-8. [Google Scholar]
- Thanh Vu, P.; Trang Hoang Nhu, N.; Tuan Huy, V.; Quang Tri, L. Determination of socio-economic and environment factors affected to the selection of farming models in the Bac Lieu Province. J. Sci. Can Tho Univ. 2013, 27, 68–75. [Google Scholar]
- Vu, P.T.; Tri, L.Q.; Trung, N.H.; Huy, V.T.; Dat, N.T.; Nuong, L.T. Using multi-criteria decision analysis in agricultural land uses in Bac Lieu Province. J. Sci. Can Tho Univ. 2014, 31, 106–115. (In Vietnamese) [Google Scholar]
- FAO. A Framework for Land Evaluation; Soil Resources, Management and Conservation Service, Ed.; FAO Soils Bulletin; 2 Print; FAO: Rome, Italy, 1981; ISBN 92-5-100111-1. [Google Scholar]
- Herzberg, R.; Pham, T.G.; Kappas, M.; Wyss, D.; Tran, C.T.M. Multi-criteria decision analysis for the land evaluation of potential agricultural land use types in a hilly area of Central Vietnam. Land 2019, 8, 90. [Google Scholar] [CrossRef] [Green Version]
- Schneeberger, N.; Bürgi, M.; Hersperger, A.M.; Ewald, K.C. Driving forces and rates of landscape change as a promising combination for landscape change research—An application on the Northern Fringe of the Swiss Alps. Land Use Policy 2007, 24, 349–361. [Google Scholar] [CrossRef]
- Mahiny, A.S.; Clarke, K.C. Guiding SLEUTH land-use/land-cover change modeling using multicriteria evaluation: Towards dynamic sustainable land-use planning. Environ. Plan. B 2012, 39, 925–944. [Google Scholar] [CrossRef]
- Li, X.; Wang, Y.; Li, J.; Lei, B. Physical and Socioeconomic Driving Forces of Land-Use and Land-Cover Changes: A Case Study of Wuhan City, China. Available online: https://www.hindawi.com/journals/ddns/2016/8061069/ (accessed on 3 April 2020).
- Wu, D.W.; Zhang, X.L.; Mao, H.Y.; Wu, H. Socio-economic driving forces of land-use change in Fuzhou, the Southeastern Coastal Area of China. In Proceedings of the 2008 International Workshop on Earth Observation and Remote Sensing Applications, Beijing, China, 30 June–2 July 2008; pp. 1–11. [Google Scholar]
- Liping, C.; Yujun, S.; Saeed, S. Monitoring and predicting land use and land cover changes using remote sensing and GIS techniques—A case study of a hilly area, Jiangle, China. PLoS ONE 2018, 13, e0200493. [Google Scholar] [CrossRef] [PubMed]
- Joorabian Shooshtari, S.; Silva, T.; Raheli Namin, B.; Shayesteh, K. Land use and cover change assessment and dynamic spatial modeling in the Ghara-Su Basin, Northeastern Iran. J. Indian Soc. Remote Sens. 2020, 48, 81–95. [Google Scholar] [CrossRef]
- Hassan, Z.; Shabbir, R.; Ahmad, S.S.; Malik, A.H.; Aziz, N.; Butt, A.; Erum, S. Dynamics of land use and land cover change (LULCC) using geospatial techniques: A case study of Islamabad Pakistan. SpringerPlus 2016, 5, 812. [Google Scholar] [CrossRef] [Green Version]
- Eastman, J.R.; He, J. A regression-based procedure for markov transition probability estimation in land change modeling. Land 2020, 9, 407. [Google Scholar] [CrossRef]
- Palmate, S.S.; Pandey, A.; Mishra, S.K. Modelling spatiotemporal land dynamics for a trans-boundary river basin using integrated cellular automata and markov chain approach. Appl. Geogr. 2017, 82, 11–23. [Google Scholar] [CrossRef]
- Nath, B.; Wang, Z.; Ge, Y.; Islam, K.; Singh, R.P.; Niu, Z. Land use and land cover change modeling and future potential landscape risk assessment using Markov-CA model and analytical hierarchy process. ISPRS Int. J. Geo-Inf. 2020, 9, 134. [Google Scholar] [CrossRef] [Green Version]
- Zhu, J.; Sun, Y.; Song, S.; Yang, J.; Ding, H. Cellular automata for simulating land-use change with a constrained irregular space representation: A case study in Nanjing City, China. Environ. Plan. B Urban Anal. City Sci. 2020, 48, 1841–1859. [Google Scholar] [CrossRef]
- Navarro Cerrillo, R.M.; Palacios Rodríguez, G.; Clavero Rumbao, I.; Lara, M.Á.; Bonet, F.J.; Mesas-Carrascosa, F.-J. Modeling major rural land-use changes using the GIS-based cellular automata metronamica model: The case of Andalusia (Southern Spain). ISPRS Int. J. Geo-Inf. 2020, 9, 458. [Google Scholar] [CrossRef]
- Sfa, F.E.; Nemiche, M.; Rayd, H. A generic macroscopic cellular automata model for land use change: The case of the Drâa Valley. Ecol. Complex. 2020, 43, 100851. [Google Scholar] [CrossRef]
- Noszczyk, T. A review of approaches to land use changes modeling. Hum. Ecol. Risk Assess. Int. J. 2019, 25, 1377–1405. [Google Scholar] [CrossRef]
- Pan, X.; Wang, Z.; Huang, M.; Liu, Z. Improving an urban cellular automata model based on auto-calibrated and trend-adjusted neighborhood. Land 2021, 10, 688. [Google Scholar] [CrossRef]
- Gilbert, G.N. Agent-Based Models; Sage: London, UK, 2008. [Google Scholar]
- Parker, D.C.; Manson, S.M.; Janssen, M.A.; Hoffman, M.J.; Deadman, P. Multi-agent systems for the simulation of land-use and land-cover change: A review. Ann. Assoc. Am. Geogr. 2003, 93, 316–340. [Google Scholar] [CrossRef] [Green Version]
- Valbuena, D.; Verburg, P.H.; Bregt, A.K.; Ligtenberg, A. An agent-based approach to model land-use change at a regional scale. Landsc. Ecol. 2010, 25, 185–199. [Google Scholar] [CrossRef] [Green Version]
- Bakker, M.M.; Alam, S.J.; van Dijk, J.; Rounsevell, M.D.A. Land-use change arising from rural land exchange: An agent-based simulation model. Landsc. Ecol. 2015, 30, 273–286. [Google Scholar] [CrossRef] [Green Version]
- Taillandier, P.; Banos, A.; Drogoul, A.; Gaudou, B.; Marilleau, N.; Truong, Q.C. Simulating urban growth with raster and vector models: A case study for the city of Can Tho, Vietnam. In Autonomous Agents and Multiagent Systems; Osman, N., Sierra, C., Eds.; Lecture Notes in Computer Science; Springer International Publishing: Cham, Switzerland, 2016; Volume 10003, pp. 154–171. ISBN 978-3-319-46839-6. [Google Scholar]
- Feng, Y.; Qi, Y. Modeling patterns of land use in Chinese cities using an integrated cellular automata model. ISPRS Int. J. Geo-Inf. 2018, 7, 403. [Google Scholar] [CrossRef] [Green Version]
- Wang, C.; Lei, S.; Elmore, A.J.; Jia, D.; Mu, S. Integrating temporal evolution with cellular automata for simulating land cover change. Remote Sens. 2019, 11, 301. [Google Scholar] [CrossRef] [Green Version]
- Castella, J.C.; Trung, T.N.; Boissau, S. Participatory simulation of land-use changes in the Northern Mountains of Vietnam: The combined use of an agent-based model, a role-playing game, and a geographic information system. Ecol. Soc. 2005, 10, 27. [Google Scholar] [CrossRef] [Green Version]
- Le, Q.B.; Park, S.J.; Vlek, P.L.G. Land use dynamic simulator (LUDAS): A multi-agent system model for simulating spatio-temporal dynamics of coupled human–landscape system: 2. Scenario-based application for impact assessment of land-use policies. Ecol. Inform. 2010, 5, 203–221. [Google Scholar] [CrossRef]
- Truong, Q.C.; Taillandier, P.; Gaudou, B.; Vo, M.Q.; Nguyen, T.H.; Drogoul, A. Exploring agent architectures for farmer behavior in land-use change. A case study in coastal area of the Vietnamese Mekong delta. In Multi-Agent Based Simulation XVI; Gaudou, B., Sichman, J.S., Eds.; Lecture Notes in Computer Science; Springer International Publishing: Cham, Switzerland, 2016; Volume 9568, pp. 146–158. ISBN 978-3-319-31446-4. [Google Scholar]
- Taillandier, P.; Gaudou, B.; Grignard, A.; Huynh, Q.-N.; Marilleau, N.; Caillou, P.; Philippon, D.; Drogoul, A. Building, composing and experimenting complex spatial models with the GAMA platform. Geoinformatica 2019, 23, 299–322. [Google Scholar] [CrossRef] [Green Version]
- Taillandier, P. GAMAGraM: Graphical modeling with the GAMA platform. In Proceedings of the 4th International Conference on Complex Systems and Applications, Le Havre, France, 1 June 2014. [Google Scholar]
- Soc Trang DONRE. Land-Use Inventory of Soc Trang Province in 2005; Department of Natural Resources and Environment of Soc Trang Province: Soc Trang, Vietnam, 2005; Volume 2005. [Google Scholar]
- Quang, T.C.; Nghi, H.Q.; Minh, V.Q. Simulation of rice area changes under the impacts of drought and salinity intrusion—A case study in Soc Trang province. J. Sci. Can Tho Univ. 2017, 2017, 144–158. [Google Scholar] [CrossRef]
- Pham, V.N.; Nguyen, H.T.; Nguyen, T.N.D.; Huynh, T.D.; Nguyen, T.H.D.; Ngo, T.D.T. Impact of saline intrusion on rice cultivation and adaptation options of local farmers in Long Phu District, Soc Trang Province. Sci. Technol. J. Agric. Rural. Dev. 2021, 2, 175–181. [Google Scholar]
- Department of Land Resources. CTU the Soil Map of the Mekong Delta in 2014; Department of Land Resources, College of Environment and Naturual Resources, Can Tho University: Can Tho, Vietnam, 2014. [Google Scholar]
- Hien, N.X.; Tho, T.Q.; Khoi, N.; Ngoc, N.V.; Dong, T.; Phong, N.D.; MInh, V.Q.; Mi, N.T.H.; Diem, P.K.; Wassmann, R.; et al. Climate Change Affecting Land Use in the Mekong Delta: Adaptation of Rice-Based Cropping Systems (CLUES), SMCN/2009/021 Theme 1: Location-Specific Impact and Vulnerability Assessment. 2016; unpublished. [Google Scholar]
- Van Vliet, J.; Hagen-Zanker, A.; Hurkens, J.; van Delden, H. A fuzzy set approach to assess the predictive accuracy of land use simulations. Ecol. Model. 2013, 261–262, 32–42. [Google Scholar] [CrossRef]
- Soc Trang Statistic Office. Statistic Year Book of Soc Trang Province 2005; Statistical Publishing House: Soc Trang, Vietnam, 2005. [Google Scholar]
- Soc Trang Statistic Office. Statistic Year Book of Soc Trang Province 2010; Statistical publishing House: Soc Trang, Vietnam, 2010. [Google Scholar]
- Soc Trang Statistic Office. Statistic Year Book of Soc Trang Province 2015; Statistical publishing House: Soc Trang, Vietnam, 2015. [Google Scholar]
- Soc Trang Statistic Office. Statistic Year Book of Soc Trang Province 2020; Statistical publishing House: Soc Trang, Vietnam, 2020. [Google Scholar]
- Young, K.B.; Wailes, E.J.; Cramer, G.L.; Khiem, N.T. Vietnam’s Rice Economy: Developments and Prospects; Arkansas Agricultural Experiment Station: Fayetteville, AR, USA, 2002. [Google Scholar]
- Handavu, F.; Chirwa, P.W.C.; Syampungani, S. Socio-Economic Factors Influencing Land-Use and Land-Cover Changes in the Miombo Woodlands of the Copperbelt Province in Zambia. For. Policy Econ. 2019, 100, 75–94. [Google Scholar] [CrossRef] [Green Version]
- Ozah, A.P.; Adesina, F.A.; Dami, A. A deterministic cellular automata model for simulating rural land use dynamics: A case study of Lake Chad Basin. In Proceedings of the Core Spatial Databases—Updating, Maintenance and Services—From Theory to Practice, Haifa, Israel, 15–17 March 2010; ISPRS: Haifa, Israel, 2010; Volume XXXVIII-4-8-2/W9, pp. 75–81. [Google Scholar]
- Bong, B.B.; Bo, N.V.; Son, N.H.; Tung, L.T.; Tu, T.Q.; Toan, T.Q.; Yen, B.T.; Trung, N.D.; Labios, R.V.; Sebastian, L.S. Adaptation Options for Rice-Based Cropping Systems in Climate Risk-Prone Provinces in the Mekong River Delta: An Assessment Report; CGIAR Research Program on Climate Change, Agriculture and Food Security (CCAFS): Wageningen, The Netherlands, 2018. [Google Scholar]
- Loc, H.H.; Thi Hong Diep, N.; Can, N.T.; Irvine, K.N.; Shimizu, Y. Integrated evaluation of ecosystem services in prawn-rice rotational crops, Vietnam. Ecosyst. Serv. 2017, 26, 377–387. [Google Scholar] [CrossRef]
- Lee, S.K.; Dang, T.A. Extreme rainfall trends over the mekong delta under the impacts of climate change. Int. J. Clim. Change Strateg. Manag. 2020, 12, 639–652. [Google Scholar] [CrossRef]
- Korres, N.E.; Norsworthy, J.K.; Burgos, N.R.; Oosterhuis, D.M. Temperature and drought impacts on rice production: An agronomic perspective regarding short- and long-term adaptation measures. Water Resour. Rural. Dev. 2017, 9, 12–27. [Google Scholar] [CrossRef]
- Quang, C.N.X.; Hoa, H.V.; Giang, N.N.H.; Hoa, N.T. Assessment of meteorological drought in the vietnamese mekong delta in period 1985–2018. IOP Conf. Ser. Earth Environ. Sci. 2021, 652, 012020. [Google Scholar] [CrossRef]
Figure 1.
Conceptual model of MEKOLUC.

Figure 2.
Object diagram of MEKOLUC. * means many in one-to-many relationship, one object in an entity can be associated with one or more objects in another entity.
Figure 2.
Object diagram of MEKOLUC. * means many in one-to-many relationship, one object in an entity can be associated with one or more objects in another entity.

Figure 3.
Case study in Soc Trang Province with a land-use map from 2005. (Source: DONRE of Soc Trang, 2005 [37]).
Figure 3.
Case study in Soc Trang Province with a land-use map from 2005. (Source: DONRE of Soc Trang, 2005 [37]).

Figure 4.
Input layers for land-suitability evaluation. (Source: Department of Land Resources, 2014 [40]).
Figure 4.
Input layers for land-suitability evaluation. (Source: Department of Land Resources, 2014 [40]).

Figure 5.
Land use in Soc Trang province in 2005–2020. (Source: Generated from statistical data [43,44,45,46]).

Figure 6.
Salinity diffusion in Soc Trang province. (a) Salinity map in 2014; (b) Simulated salinity in 2014.
Figure 6.
Salinity diffusion in Soc Trang province. (a) Salinity map in 2014; (b) Simulated salinity in 2014.

Figure 7.
Simulated land-use map that was verified with a land-use map from 2015. (a) Land-use map in 2015; (b) Simulated land-use map in 2015.
Figure 7.
Simulated land-use map that was verified with a land-use map from 2015. (a) Land-use map in 2015; (b) Simulated land-use map in 2015.

Figure 8.
Saline instruction scenario. (a) Salinity map in 2030; (b) Persistence of salinity in 2030. (Source: Generated from DRAGON Institute, 2016 [41]).
Figure 8.
Saline instruction scenario. (a) Salinity map in 2030; (b) Persistence of salinity in 2030. (Source: Generated from DRAGON Institute, 2016 [41]).

Figure 9.
Simulated land-use map for 2030.


Table 1.
Difficulty ratings for changing between different land-use types.
| Land-Use Type | Rice | Rice–Vegetable | Vegetables | Shrimp | Fruit Trees | Rice–Shrimp |
|---|---|---|---|---|---|---|
| Rice | 1 | 1 | 0.75 | 0 | 0.5 | 0 |
| Rice–vegetable | 1 | 1 | 0.5 | 0 | 0.75 | 0 |
| Vegetables | 0 | 0.5 | 1 | 0 | 0.5 | 0 |
| Shrimp | 0 | 0 | 0 | 1 | 0 | 0.5 |
| Fruit trees | 0 | 0 | 0 | 0.25 | 1 | 0 |
| Rice–shrimp | 0 | 0 | 0 | 0.75 | 0 | 1 |
Note: 0—not able to change; 1—easy to change.
Table 2.
Comparison of land use simulated with the observed data in 2015 and 2020.
| Land-Use Types | 2015 | 2020 | ||||
|---|---|---|---|---|---|---|
| Observed Area (ha) | Simulated Area (ha) | Deviation | Observed Area (ha) | Simulated Area (ha) | Deviation | |
| Rice (including rice–shrimp) | 149,425 | 149,388 | 0.00 | 145,069 | 140,740 | 0.00 |
| Shrimp | 56,842 | 55,742 | 0.02 | 57,151 | 57,228 | 0.02 |
| Vegetables | 19,714 | 16,681 | 0.15 | 18,138 | 16,654 | 0.15 |
| Fruit trees | 14,053 | 16,701 | −0.19 | 15,600 | 16,904 | −0.08 |
Publisher’s Note: MDPI stays neutral with regard to jurisdictional claims in published maps and institutional affiliations. |
© 2022 by the authors. Licensee MDPI, Basel, Switzerland. This article is an open access article distributed under the terms and conditions of the Creative Commons Attribution (CC BY) license (https://creativecommons.org/licenses/by/4.0/).
Share and Cite
MDPI and ACS Style
Truong, Q.C.; Nguyen, T.H.; Tatsumi, K.; Pham, V.T.; Tri, V.P.D. A Land-Use Change Model to Support Land-Use Planning in the Mekong Delta (MEKOLUC). Land 2022, 11, 297. https://0-doi-org.brum.beds.ac.uk/10.3390/land11020297
AMA Style
Truong QC, Nguyen TH, Tatsumi K, Pham VT, Tri VPD. A Land-Use Change Model to Support Land-Use Planning in the Mekong Delta (MEKOLUC). Land. 2022; 11(2):297. https://0-doi-org.brum.beds.ac.uk/10.3390/land11020297
Chicago/Turabian StyleTruong, Quang Chi, Thao Hong Nguyen, Kenichi Tatsumi, Vu Thanh Pham, and Van Pham Dang Tri. 2022. "A Land-Use Change Model to Support Land-Use Planning in the Mekong Delta (MEKOLUC)" Land 11, no. 2: 297. https://0-doi-org.brum.beds.ac.uk/10.3390/land11020297
Note that from the first issue of 2016, this journal uses article numbers instead of page numbers. See further details here.