Article

Long-Time-Series Evolution and Ecological Effects of Coastline Length in Coastal Zone: A Case Study of the Circum-Bohai Coastal Zone, China

1
School of Resource and Environmental Sciences, Wuhan University, Wuhan 430079, China
2
Key Laboratory of Regional Sustainable Development Modeling, Institute of Geographic Sciences and Natural Resources Research, Chinese Academy of Sciences, Beijing 100101, China
3
State Key Laboratory of Resources and Environment Information System, Institute of Geographic Sciences and Natural Resources Research, Chinese Academy of Sciences, Beijing 100101, China
4
College of Resources and Environment, University of Chinese Academy of Sciences, Beijing 100049, China
*
Author to whom correspondence should be addressed.
These authors contributed equally to this work.
Submission received: 30 June 2022 / Revised: 30 July 2022 / Accepted: 5 August 2022 / Published: 11 August 2022
(This article belongs to the Special Issue Protection, Management and Restoration of Coastal Ecosystems)

Abstract

:
Under the joint influence of climate change and human production and living activities on land and sea, the morphology and use function of the coastline have undergone notable changes, triggering more significant environmental and ecological effects. In this paper, we quantified the evolution characteristics of the coastline over the past 30 years and measured the possible environmental pollution and ecological degradation by means of spatiotemporal coupling analysis in terms of spatial form and land-use function. The Chinese Bohai Rim region was taken as an example, and the Google Earth Engine was applied to achieve a long time series of interannually continuous land use function classification of the coastal zone. The study shows that: (1) from 1987–2020, the coastline of Bohai Rim showed an overall trend of seaward expansion, with the length of the coastline increasing by 15.6%, most significantly from 2003 to 2011; (2) the proportion of construction function coastline increased from 14.66% to 42.8%, while the proportion of cropland coastline decreased from 52.01% to 18.16% during 2000–2020, with the natural ecological coastline decreasing in the early stage and recovering in the later stage, thus becoming more stable overall; (3) 82.73% of coastal districts and counties showed a linear correlation between changes in coastline function and water quality level, and 77.8% showed a consistent degree of change of coastline function and loss of ecological land, indicating that changes in the coastline have triggered significant problems in terms of environmental pollution and ecological degradation. With the exception of localized areas such as the Yellow River Delta, where coastline change is somewhat more significantly influenced by environmental climate change, most other coastline changes are primarily due to human land-based development; therefore, coastal policy constraints bring obvious mitigation.

1. Introduction

Coastlines have undergone significant and increasingly dramatic changes over a long period of time because of the combined effects of global climate change, regional environmental change, and human activities on land and sea. Long-term changes in coastlines have had a significant impact on global and regional ecology and attracted attention around the world. With the accumulation of long-time-series satellite data and the emergence of platforms like Google Earth Engine, it has become possible to use remote sensing technology to achieve high- spatial-temporal-scale and high-density coastline change monitoring.
Coastline change monitoring studies have mainly focused on the morphological changes and land-use function of coastline, together with the possible ecological, environmental, and socio-economic effects of coastline change. As for morphological change studies, they have primarily been concerned with the dynamic extraction of the coastlines and the measurement of coastal zone change. Coastline extraction studies are very extensive, and can be divided into artificial visual interpretation extraction [1], semi-automatic supervised classification extraction [2], and automated algorithmic extraction based on thresholding, edge detection, or object segmentation [3,4,5]. Coastline change measurement methods mainly include the baseline method [6], the area method [7], the dynamic segmentation method [8,9], the change polygon method [10], and the iteration of nonlinear buffers method [11]. There are studies based on coastline extraction and coastline change measurement methods [12], quantifying the morphological changes of China’s mainland coastline in the past decades, with more than 68% showing seaward expansion [13], and the rates of expansion appeared slowly first and fast afterwards [14,15], in which the coastline around the Bohai sea has showed the greatest change along China’s coastline [16]. For the land-use function of the coastline, there is currently no uniform classification of coastline types from the perspective of function classification, with various studies classifying coastline types according to the differing needs of different research. Commonly, coastlines are classified into natural coastlines (silty coastlines, biological coastlines, gravelly coastlines, bedrock coastlines, estuarine coastlines, etc.) and artificial coastlines (construction dikes, breeding dikes, farmland dikes, dock dikes, etc.). The dramatic transformation from natural to artificial coastlines and the spatial and temporal characteristics reflect the degree of integrated use of coastline, leading to the impact of human activities on coastlines and coastal ecosystems [17,18]. Studies on the environmental and ecological effects of coastline change have mainly been focused on ecosystem services, habitat environmental changes, and disasters in the coastal zone. Human activities and erosion [19] have altered the spatial patterns and land-use functions of the coastline, causing great changes in the structure and value of coastal ecosystem [18,20]. Coastal engineering and land reclamation have caused radical changes in coastline spatial patterns [21], triggering changes in sedimentation conditions, hydrodynamic conditions, and other natural factors [22,23,24,25,26], leading to a decrease in seawater exchange capacity, as well as pollutant dispersion capacity [27], seriously disturbing the environment and coastal natural ecosystem [27,28].Changes in coastline functions such as urbanization, tourism development, land reclamation, and expansion of aquaculture ponds occupy natural resources such as coastal wetlands [29,30], alter the boundary conditions of storm surges [22], and bring about terrestrial pollutants such as industrial wastewater and municipal sewage [31], leading to a decline in the coastline Ecosystem Service Value (ESV) [32], loss of biological habitat, severe erosion of the coastline, beach, subaqueous slope of coast [22,33], and water pollution.
It can be seen that the study of coastline change in the coastal zone and the analysis of its effects have attracted extensive attention and have made great progress. However, the detection of coastline changes is concerned more with changes in spatial morphology, and less with changes in land-use function on a largely spatial-temporal scale; in particular, there is a lack of the simultaneous consideration of changes in different functions, such as production, life, and ecology of the coastal zone. Meanwhile, most studies nowadays actually focus on changes in waterfront use functions because of the extreme instability of coastlines, whereas it is the stable land-use function changes that are more valuable in coastline planning and management, but methods for performing the measurement of stable function changes are seldom given attention. Last but not least, most studies on the spatial effects of coastline change are single dimension, such as ecosystem change and environmental pollution, with few operating in an integrated manner, and even fewer focusing on annual changes over long periods.
As the largest bay in China, the circum-Bohai coastal zone is an estuary of the Yellow River, the Hai River, and other major Chinese rivers, and is the most densely populated and economically concentrated region in the north of China. Due to the combined effects of climate change, natural environmental changes, and human exploitation activities, the coastline around Bohai Sea has undergone drastic changes. Therefore, we take the circum-Bohai coastal zone of China as an example to dynamically monitor the changes in the spatial patterns and land-use functions of the long-time-series coastline. The Google Earth Engine (GEE) platform and long-time-series remote sensing imagery are applied to map the long-time-series function classification of the coastline. We accordingly analyzed the types of human activities and coastline change, the mechanisms of environmental changes in the coastal zone, and the damage to the coastal ecosystem caused by land reclamation and construction land expansion, coupling with water quality and the degree of ecological land degradation. We aimed at clarifying the impact of the expansion of human production and living activities on the environment and ecosystem of the circum-Bohai coastal zone on the basis of the changes in spatial patterns and land-use functions of the coastline, and providing some suggestions as to sustainable integrated coastal zone management and the rational protection and development of the coastal zone.

2. Study Area and Data
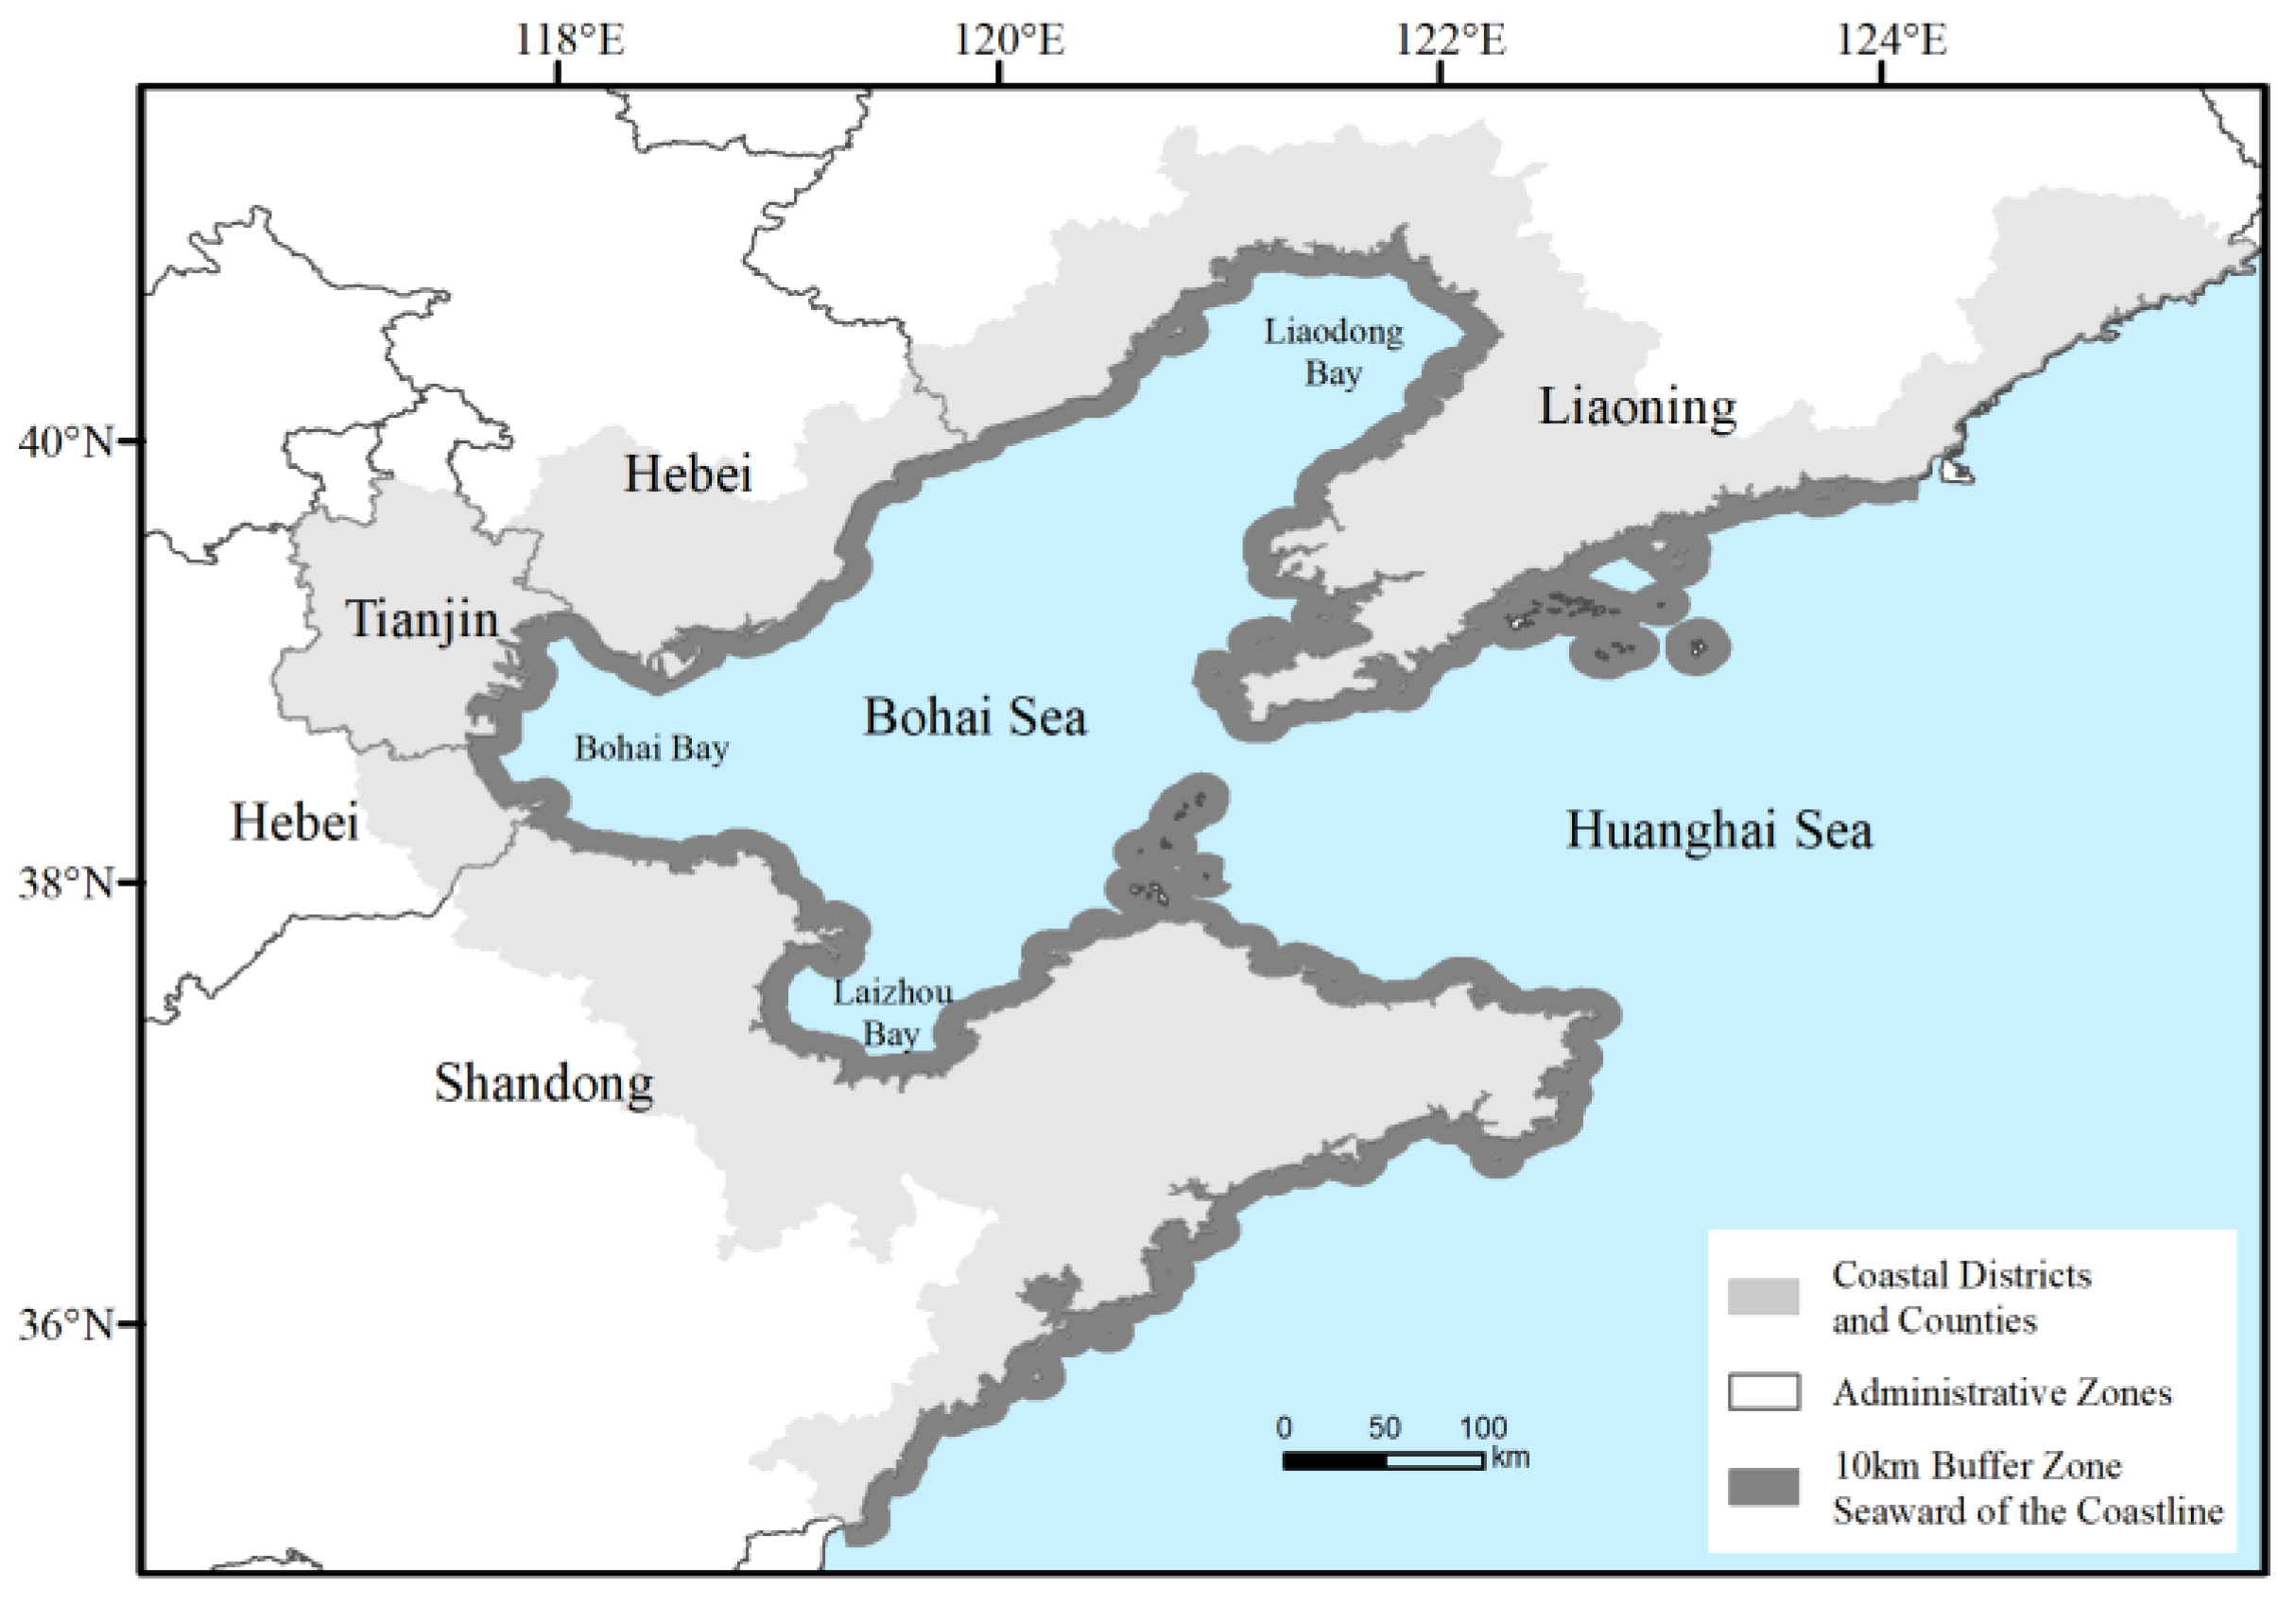
2.1. Study Area

The circum-Bohai coastal zone is located in the northeast of China, from Panshan County in Liaoning Province in the north to Rizhao City in Shandong Province in the south (35°5′~41 °27′ N, 116°42′~125°41′ E), with a C-shaped coastline, the total length of which is about 6,050 km, accounting for one-third of the national coastline. There are three bays along the coast of the Bohai Sea, including Liaodong Bay in the north, which is the highest-latitude bay in China, Bohai Bay in the west, and Laizhou Bay in the south. The topography of the seabed slopes from the north coast and both sides to the center, with the water depth on the east side being greater than that on the west side and flat terrain in the middle of the bay. The rivers along the Bohai Bay contain a large amount of sand, and the mudflats are vast and heavily silted up with the discharge from the Yellow River, the Hai River, the Ji Canal, and the Luan River. Laizhou Bay is the largest bay in Shandong Province, and is known as one of the three major bays of the Bohai Sea, along with Liaodong Bay and Bohai Bay. The water surface is wide open, and the underwater terrain is gentle, with most water depths within 10 m.
The Bohai Rim region, centered on Beijing and Tianjin, is an important economic zone in eastern China with a relatively concentrated population. It has now become the “engine” of economic development in northern China, and has been hailed by economists as the third “growth pole” of the Chinese economy after the Pearl River Delta and the Yangtze River Delta. With the rapid development of the economy and urbanization, the Bohai Rim faces a rapidly growing population density, high concentration of industry, and frequent coastal development activities [34]. At the same time, sedimentation, and erosion of the estuary of many rivers combined with the impact of human activities have caused significant changes in the spatial and temporal patterns of land use in the Bohai Rim, which has resulted in unprecedented pressure on the coastal ecological environment.
We select the circum-Bohai coastal zone as the study area, involving Shandong, Hebei, and Liaoning provinces as well as Tianjin municipality, covering seventeen coastal cities with a total of sixty-eight coastal districts and counties, and determine the boundary of the zone, with the land area bordering the district and county administrative divisions and the sea boundary being 10 km seaward of the land boundary as a buffer zone (Figure 1).

2.2. Multi-Source Data Sets and Pre-Processing
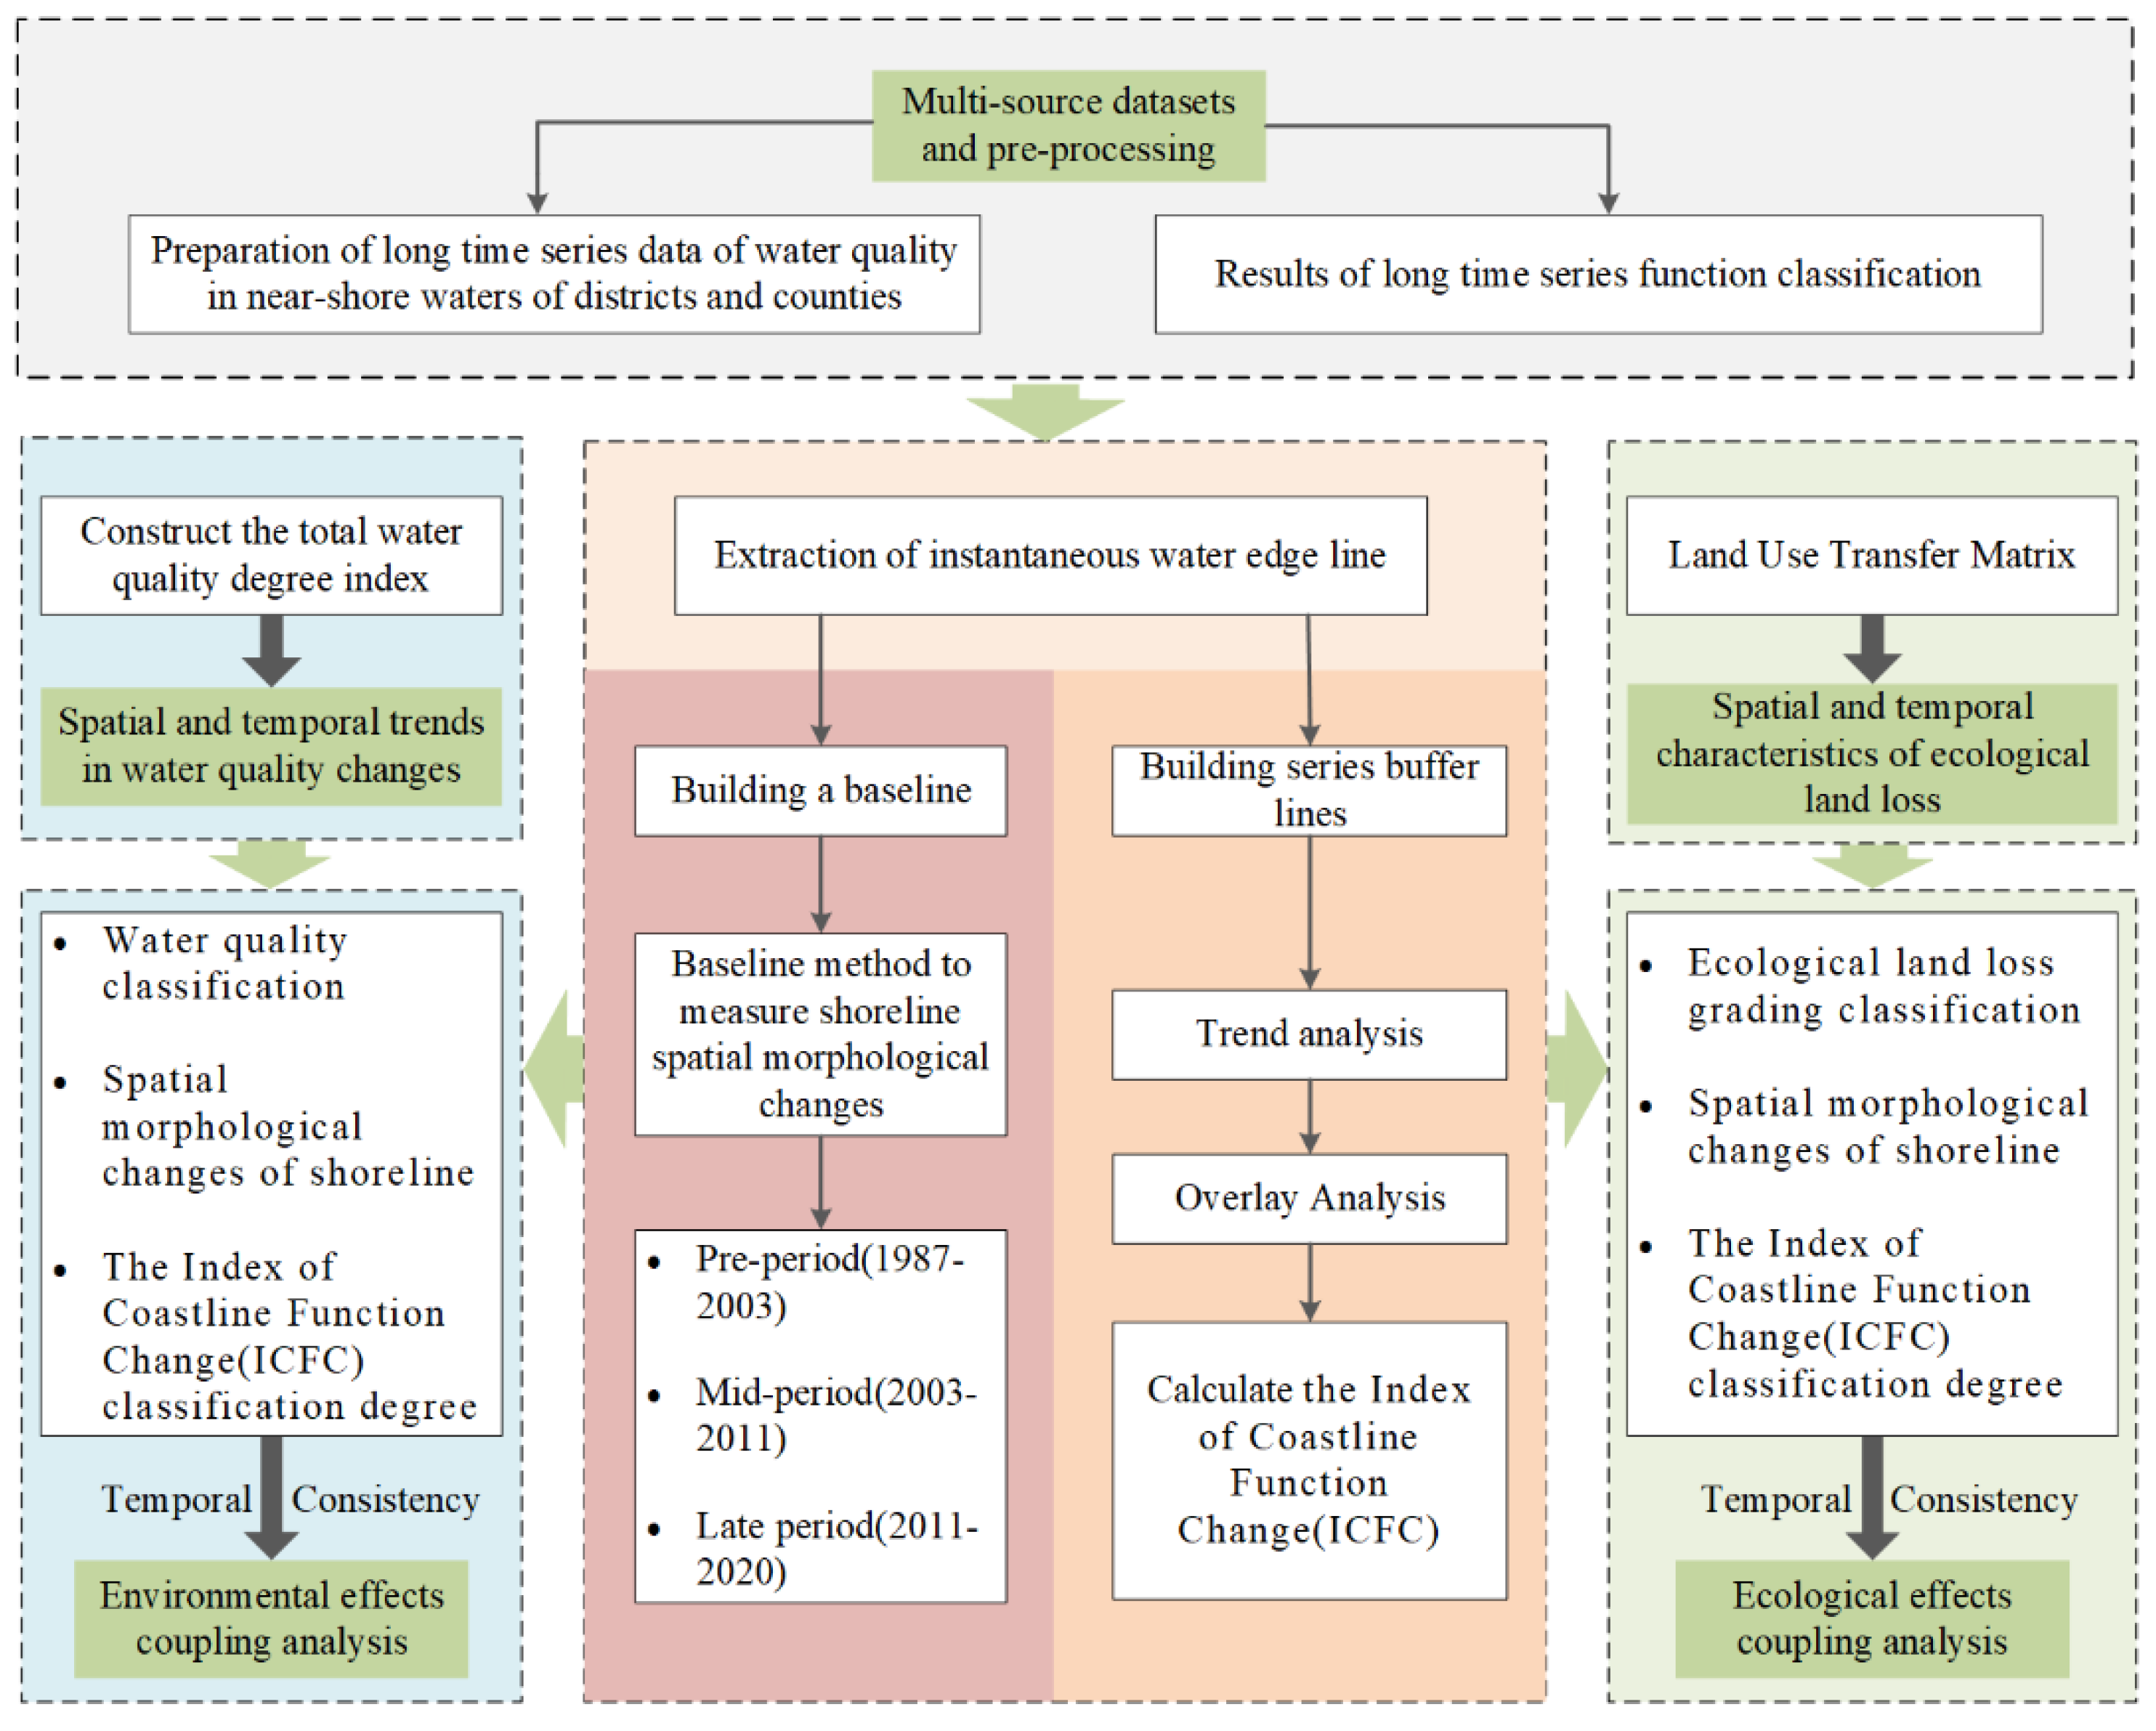
In this paper, satellite images of Landsat Thematic Mapper (TM), Enhanced Thematic Mapper Plus (ETM+), and Operational Land Imager (OLI) with cloudiness below 10% from June to October, lasting 32 years from 1987 to 2020, were selected on the GEE platform using a pixel-based mosaic approach. Other auxiliary data were used for classification as well, including Visible Infrared Imaging Radiometer Suite (VIIRS), nighttime light data (Nighttime Day/Night Band Composites Version 1), digital elevation data (Shuttle Radar Topography Mission, SRTM), spectral indices such as Normalized Difference Vegetation Index (NDVI) and Normalized Difference Building Index (NDBI), and multiple water indices such as Normalized Difference Water Index (NDWI) and Modified Normalized Difference Water Index (MNDWI). In addition, the Big Data on Urban Points of Interest and the remotely sensed land-use coverage products produced by the Resource and Environment Data Center of the Chinese Academy of Sciences at five-year intervals for cross-validation and to provide additional prior knowledge.
A great deal of sample point data was collected and processed. For each year, sample points for each type of feature in the previous year were selected at first, using high-resolution images or urban points of interest. The sample points where the feature class had changed were modified until the sample points were selected for all years. Every year, 1300 high-quality sample points, evenly distributed throughout the entire study area, were selected, of which 80% were used as training samples and 20% as validation sample points. In addition, data relating to changes in coastal water quality and ecosystems were collected to evaluate the possible environmental and ecological effects of coastline change. Among them, the water quality data of the near-shore areas and counties in the circum-Bohai coastal zone were taken from the “Distribution of Water Quality Classes in Near-Shore Marine Areas” in the “Environmental Quality Bulletin of China’s Nearshore Marine Areas” and “The Environmental Status Bulletin of China’s Marine Ecology” (https://www.mee.gov.cn/hjzl/sthjzk/jagb/, (accessed on 16 February 2022)). In this bulletin, the selection of water quality monitoring sites was dynamic from year to year, but the sample sites were basically derived from state-controlled breakpoints and state-controlled monitoring sites. In addition, the criteria for classifying water quality ratings were adopted from the Chinese Seawater Quality Standard (GB 3097-1997).

3. Methodology

In this study, we have proposed a method for detecting long-time-series changes in coastline functions and performing analysis of their eco-environmental effects, which mainly includes: (1) long-time-series land-use function classification based on the GEE platform; (2) a method for detecting long-time-series coastline changes in terms of both spatial morphology and land-use function; (3) an analysis method for analyzing the eco-environmental effects caused by long-time-series coastline changes and spatially coupling changes in water quality environment, ecosystem, and coastline (Figure 2).

3.1. Long-Time-Series Coastal Zone Land-Use Function Classification

Nine landcover classes, including impervious surface, cropland, forest, grassland, inland fresh waters, coastal aquaculture ponds, seawater, tidal flats, and unused land, were employed in this study. Associated classification processes included: (1) the initial classification of cropland, impervious surface, water bodies, forest, grassland, and unused land using the random forest algorithm with the GEE platform; (2) the further subdivision of waters into natural seawater, natural internal water, and aquaculture ponds (and salt fields) using the spatial morphology method.
To obtain better classification results, sample point distribution optimization, feature vector extraction, and optimal window size optimization were performed with satellite images every year. First, the random function in the GEE was applied to perform several randomized distribution tests on the sample points distribution, and the results with the highest accuracy were taken as the optimal sample point distribution, with the highest multi-year average maximum accuracy difference being up to 5.32%. Then, the characteristic variable index (NDVI, NDBI, NDWI, MNDWI) for each pixel in all images was calculated based on night VIIRS data and SRTM data. In addition, different combinations of texture features provided by GEE were involved in the classification, as the window size has a significant effect on the extraction of texture features; thus, the window size 1–9 for each texture feature was dynamically set in order to select the most accurate texture and window combination scheme.
In this paper, with the aim of classifying the basic functions of human production, life and ecology, the land use functions were refined. For example, water bodies were further separated into inland waters and seawater; land waters were subdivided into natural water bodies, aquaculture ponds, and salt fields on the basis of the generally adopted primary classifications of crop land, grassland, forest, water bodies, impermeable surface, and unused land in the terrestrial system, with reference to the way previous scholars have classified land use in coastal zones [35], combined with the dominant human activities and the analysis of the main causes of unsustainability in the coastal zone area around the Bohai Sea. This classification helped to reveal the coastline development and protection methods with respect to human activities, which in turn helped to focus on the analysis of environmental and ecological problems that generate unsustainability through functional classification. Specifically, water bodies were firstly separated into inland waters and marine waters using the method of Chen et al. [36] as well as the scanline seed filling algorithm. Then, natural water and coastal aquaculture ponds were separated based on the difference in morphological features between coastal aquaculture and land-based natural water bodies (rivers, ditches, and reservoirs); in this process, three morphological features—centerline length (Li), aspect ratio (Ri), and convex packet (Convi)—were selected, and separation was conducted based on whether these feature values reached the threshold or not.

3.2. Long-Time-Series Coastline Change Detection

After the automatic extraction of the long-time-series coastline, we quantified temporal and spatial changes in the long-time-series coastline with respect to morphology and function by detecting changes in coastline morphology and analyzing changes in the coastline use function.

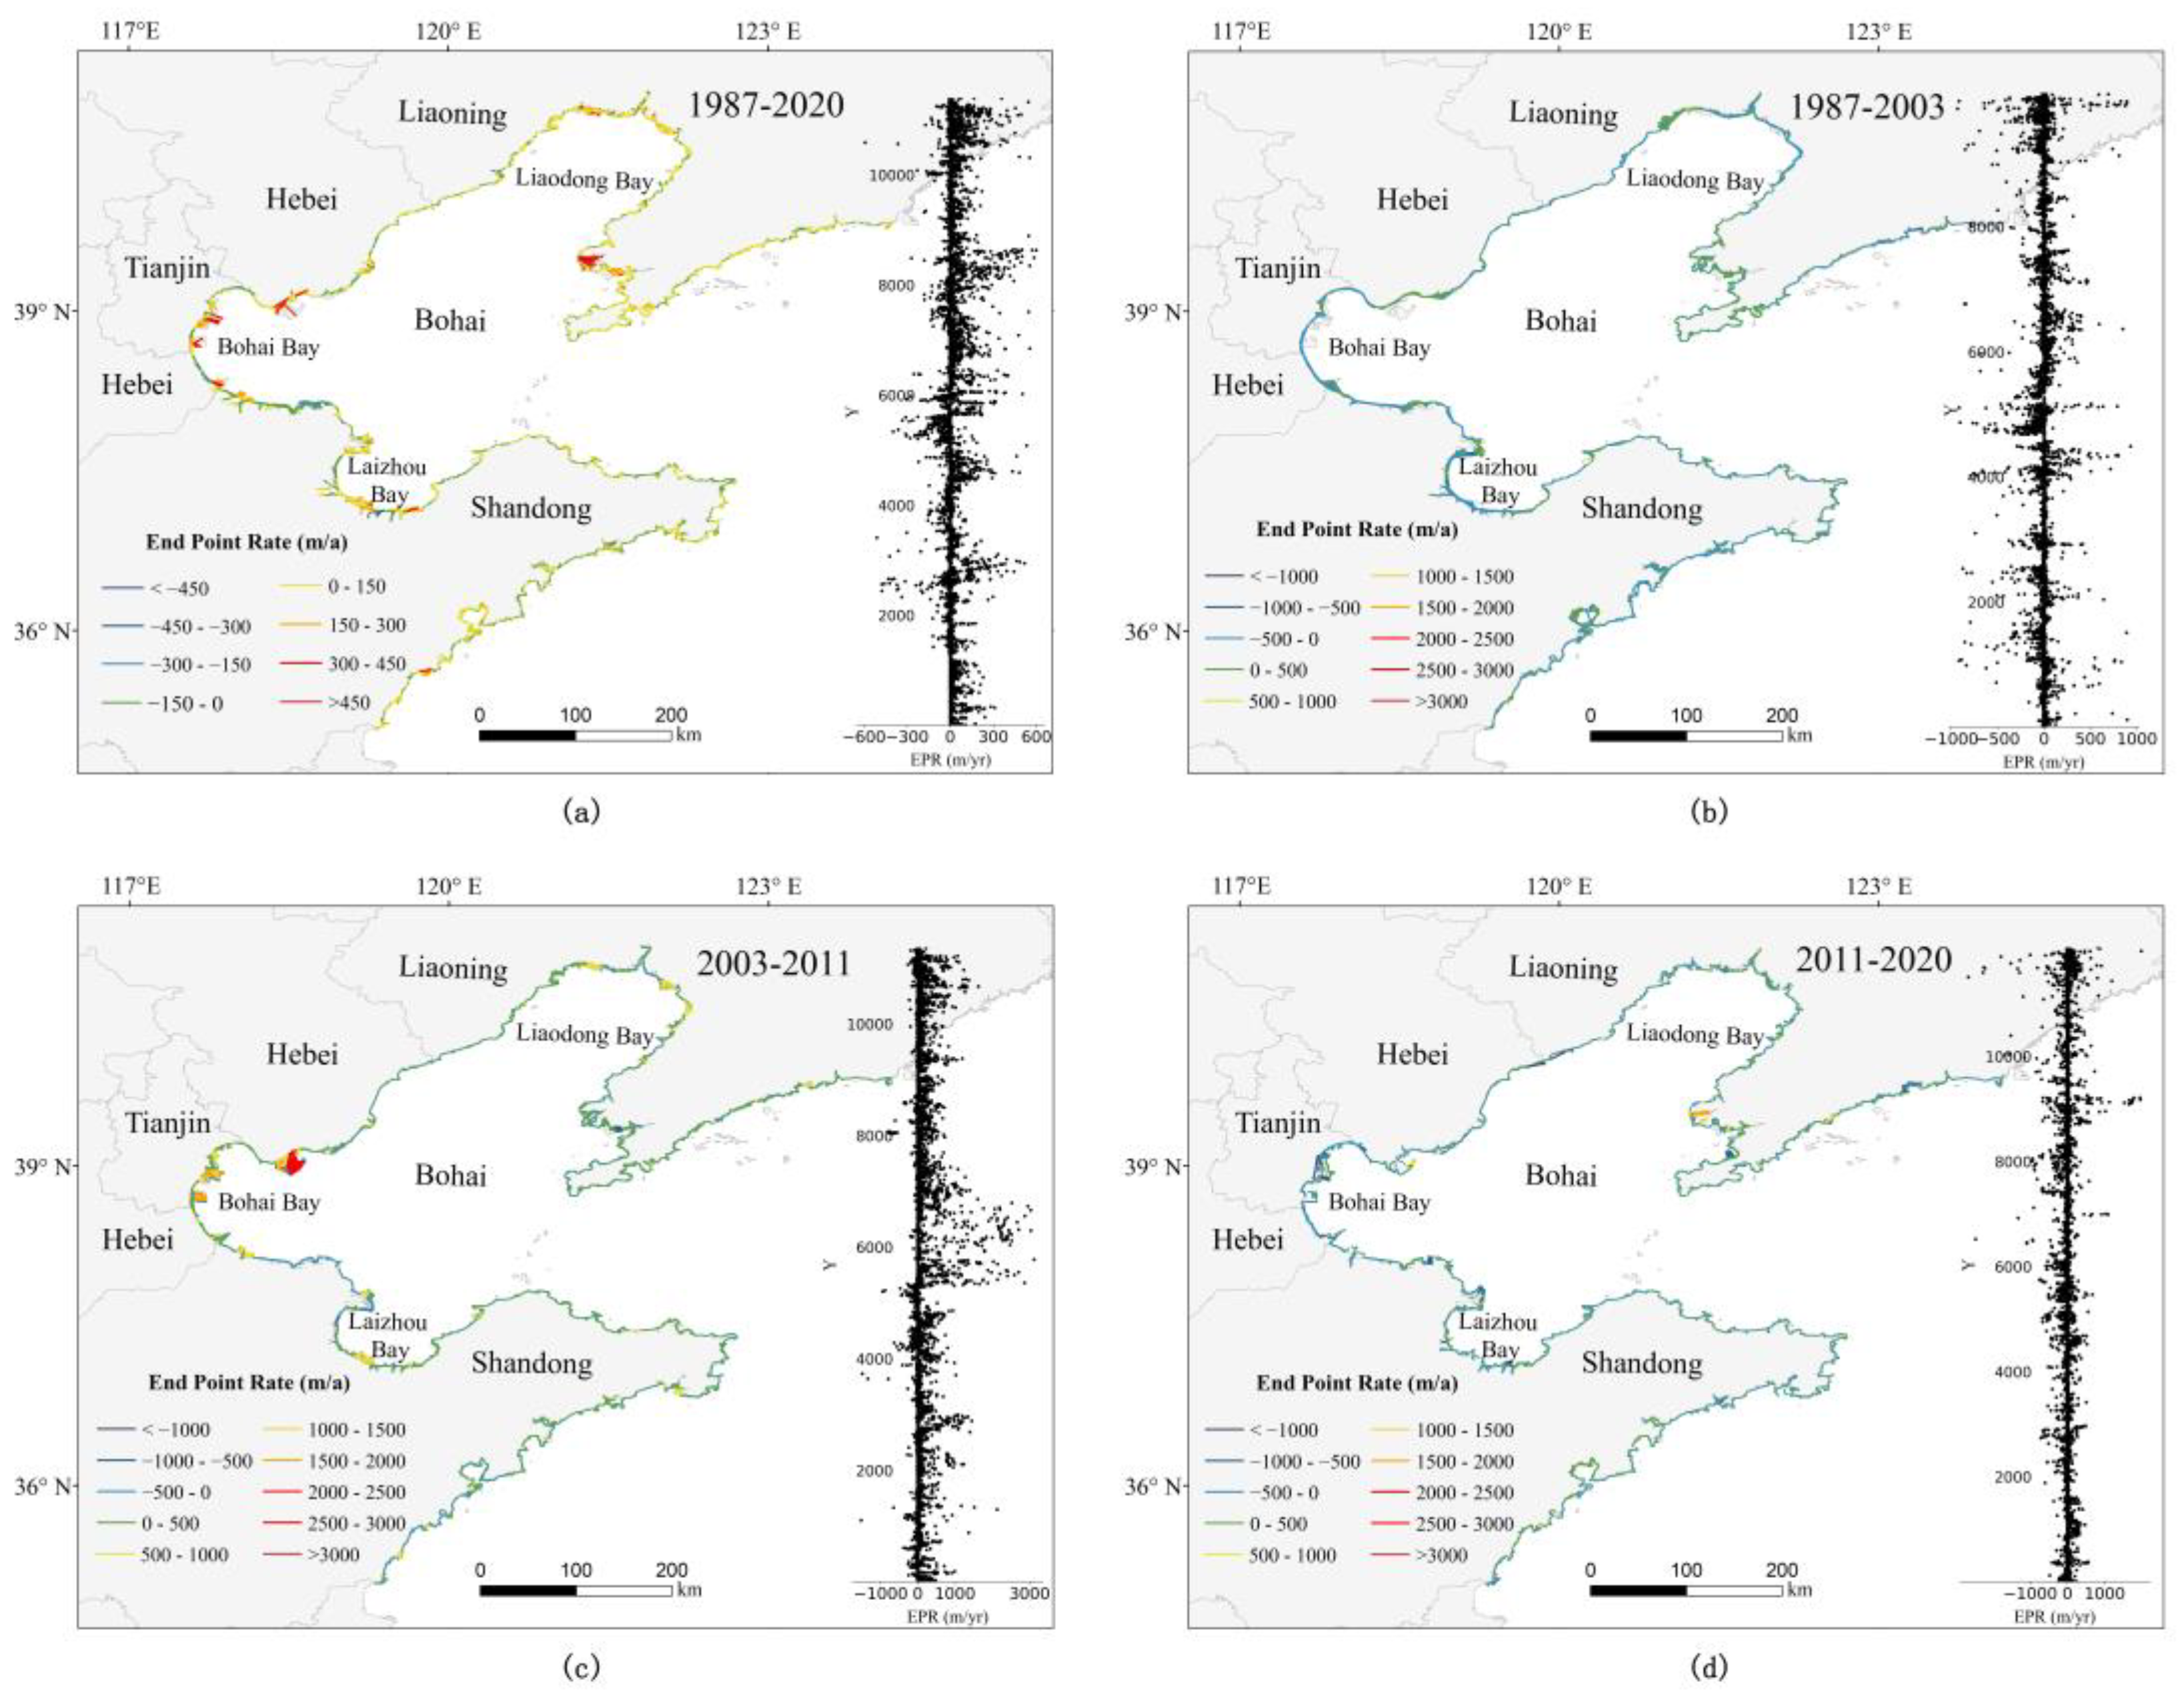
3.2.1. Detection of Coastline Morphological Changes

Based on the results of the long-time-series coastal zone land-use function classification, the seawater was separated from the classified images on the basis of its attribute values, and its boundaries were traced. These boundaries were stored as lines and chosen to indicate the instantaneous water edge line where the land and seawater were divided. To make the automatically extracted water edges smoother, peak smoothing (tolerance set to 100 m) was used to remove the jaggedness and make the results closer to the real coastline, and a total of 32 coastlines were obtained during 1987–2020. Since morphological changes of the coastline usually manifest as both land-to-sea expansion (sedimentation or human activities) and seawater encroachment on land, a combination of the sea–land area method and baseline method was utilized for the detection of morphological changes to the coastline.
When using the coastline as a benchmark, the sea–land area method enables quick access to trends in coastline morphology by comparing the interannual coastlines S l a n d (the area located on the land side) and S s e a (the area located on the ocean side):
S c = S l a n d ( i + 1 ) S l a n d ( i ) ,
{ S c > 0 Rececde S c < 0 Expand ,
where S l a n d ( i ) represents the area located on the land side in the year i . Taking the Bohai Sea coastal zone region as the benchmark, it was found that S c for 1987–2020 mostly fluctuates between −100 and 100 before 2003 and after 2011, and is greater than 0 during 2003–2011; and the S l a n d increases at an average rate of 211 km2, showing good temporal divergence characteristics. Therefore, the coastline during 1987–2020 is divided into three time periods, namely, 1987–2003, referred to as the pre-period, 2003–2011, referred to as the mid-period, and 2011-2020, referred to as the late period in this study.
To study the spatial divergence of coastline morphological changes, the baseline method was used. This is the classical method for characterizing the spatial changes of coastlines, and it uses the image processing techniques of the Digital Coastline Analysis System (DSAS), which allows the calculation of coastline displacements based on transects.
End Point Rate (EPR) was used to quantitatively characterize the morphological changes in coastlines, calculated as follows [37]:
E P R m ( i , j ) = D m j D m i T ,
where E P R is the change rate of the coastline on the m t h baseline between year i and j , D m i and D m j are the distances from the intersection of the coastline on the m t h vertical line to the baseline in i and j , respectively, and T is the time interval between i and j . If E P R is positive, it indicates that the coastline is expanding towards the ocean, otherwise, it indicates that the coastline is eroding, and the larger the absolute value, the greater the expansion or erosion.
Based on the pre-period (1987–2003), mid-period (2003–2011), and late period (2011–2020) coastlines, the baseline was taken at a distance of 30 m (raster resolution size) seaward, and the lengths of the corresponding baselines were 5434.2 km, 6094.7 km, and 6307.9 km. Thousands of transects were generated at 500 m intervals on each baseline, and the coastline change distance was calculated based on the intersection of each transect with the coastline.

3.2.2. Analysis of Changes in Coastline Functions

Due to the fact that the vicinity of the water–land boundary is often mudflats and unused land, there will be a large error when compared with the real situation due to the instability of the coastline when the coastline is used to directly characterize the coastline function. Therefore, to measure the changes in coastline function in a stable fashion, we used the function of the land-side buffer line with a radius of R of the coastline to characterize the function of this coastline. The buffer line is roughly parallel to the real coastline and is closer to the human activity area, allowing a more accurate measurement of human-induced changes. To discuss the optimal radius R, we first generated land-side buffer lines with gradually increasing buffer radius (R1, R2, R3, …, Rn) of the long-time-series coastlines, and separately overlaid them with classification images to identify the functions of buffer lines, called function-lines. The first-order differential trendiness test was then performed for the length of each function type on the function-line every year.
F k = { L k i L i L k j L j } ( i = j + 1 ) ,
where L k i and L k j represent the length of this function type on the function-lines with buffer radius R i and R j , respectively; L i and L j represent the total length of the function-line with buffer radius R i and R j , respectively. A smaller F k indicates more stable coastline use functions within the buffer radius. In this study, a total of 640 lines was obtained after overlay analysis, with a length of 11 coastline function types on each function-line, with the 1987–2020 coastlines serving as the base, and increasing the buffer radius by 50 m to a maximum value of 1000 m. The results of the first-order differential trendiness test showed that the proportion of various coastline functions to the total was relatively stable when the buffer radius was within the range 400–900 m and F k was vibrating between (−0.0075, 0.0075); therefore, a function-line of 650 m was taken for the characterization of the function type of the coastline.
Then, the Index of Coastline Function Change (ICFC), which indicates the degree of interconversion of various coastline functional use types within a given time frame in the study area, was used to obtain the integrated dynamic change of the coastline function; the larger the value of this index, the stronger the change of coastline use function and the more significantly influenced by human activities, and such changes are as [38]:
I C F C t = ( i = 1 n Δ C F i j 2 i = 1 n C F i ) × 1 T × 100 % ,
where T is the study period (year), C F i is the initial length of the coastline function type, Δ C F i j is the absolute value of the transformed length, and n is the number of coastline functions classified. With coastal districts and counties as the basic units, year-to-year function change rates were calculated for 68 districts and counties, with a total of 1269 ICFC being identified in this study. To more intuitively measure the differences in coastline function change between districts and counties, and to be able to perform inter-year comparisons, 1269 ICFC were further graded according to Table 1:

3.3. Evaluation of Environmental and Ecological Effects Caused by Coastline Changes

Water quality is one of the most important indicators of the quality of the seawater environment, and can be used to characterize the environmental effects of coastline changes, while land use changes have been proven to be related to land degradation, ecological vulnerability, and biodiversity loss [39]. Therefore, the extent of ecological land loss resulting from changes in coastline land use type can be used to characterize ecological effects.
In this study, consistency calculations were performed to characterize the relationship between changes in coastline function and water pollution, and between changes in coastline function and ecological degradation.
In order to characterize the water pollution, a new indicator W Q (Total Water Quality Class) was created to express the combined water quality of the region, with the following formula:
W Q n = W n i ,
where W Q n is the total water quality class; W n i is year-by-year water quality.
The W Q is then graded (five levels in total) to obtain the WQC (Water Quality Class Composite) based on the natural interruption point grading method.
The degree of ecological land loss is indicated by the size of the area converted from ecological land (grassland, forest, inland freshwater, mudflats, and seawater) into productive and living land (cropland, coastal aquaculture ponds, impervious surface, and unused land), which can be divided into five levels, with level 0 corresponding to a negative conversion area (i.e., the restoration of ecological land), and levels 1 to 4 corresponding to low to high proportions of conversion area (i.e., with gradually increasing degree of ecological land degradation). The loss of ecological land was evaluated on the basis of the proportions of ecological land lost that was transformed into productive and living land within the land use transition matrix of the 10 km seaward buffer [40]. Then, the spatial and temporal effects of loss of ecological land due to long-time-series coastline changes were analyzed by overlaying the degree of ecological land loss and the rate of coastline migration in each district and county.
To investigate the degree of spatial coupling of multiple long-time-series data, this study constructs a method for calculating spatiotemporal consistency. At first, the time series and study area involved in the study are respectively divided into multiple time units and study units, and then grade the long-time-series data in equal amounts according to the study area and study units respectively and that the same kind of data in different time units follow the same grading. Then, the sum of rank gap of the long-time-series data that are to be studied is calculated in pairs in each time unit and the corresponding study unit to get a new long-time-series data and which is normalized to obtain a new long-time-series data. Finally, the percentage is calculated and the resulting value is used to characterize the consistency by judging the resulting and counting the number of A n i < 0.5 .
a n i = | D 1 i D 2 i | ,
A n i = ( a n i min a n i ) ( max a n i min a n i ) × 100 % ,
{ C n i = 1   , A n i < 0.5 C n i = 0   , A n i 0.5 ,
M = n = 1 N C n i N × 100 % ,
where a n i is the rank gap sum for each study unit; n denotes the serial number; i indicates the time unit serial number; D 1 and D 2 denote the two long-time-series data levels respectively; A n i is the standardized result; C n i is the result of a standardized grade difference determination; M indicates the consistency of coastline function with water pollution or ecological degradation (%).
In this study, consistency calculations were performed to characterize the relationship between changes in coastline function and water pollution and ecological degradation. First, the coastline function index, ecological land loss area, and water quality level in the study area were graded according to a time unit of one year: the coastline function index from 2000 to 2020 was divided into five levels, with 0.05, 0.1, 0.15, and 0.2 being the breakpoints, while the ecological land loss area of the marine part of Bohai Sea coastal zone was divided into five levels, with 0 km2, 1 km2, 10 km2, and 20 km2 being the breakpoints. According to the National Coastal Water Quality Category Distribution diagram in the Environmental Quality Bulletin of China’s Coastal Waters, the water quality was divided into five levels. Then, the correlation of coastline function with water pollution and ecological degradation was calculated separately in order to characterize the spatial coupling of coastline function and environmental and ecological effects.

4. Results and Discussion

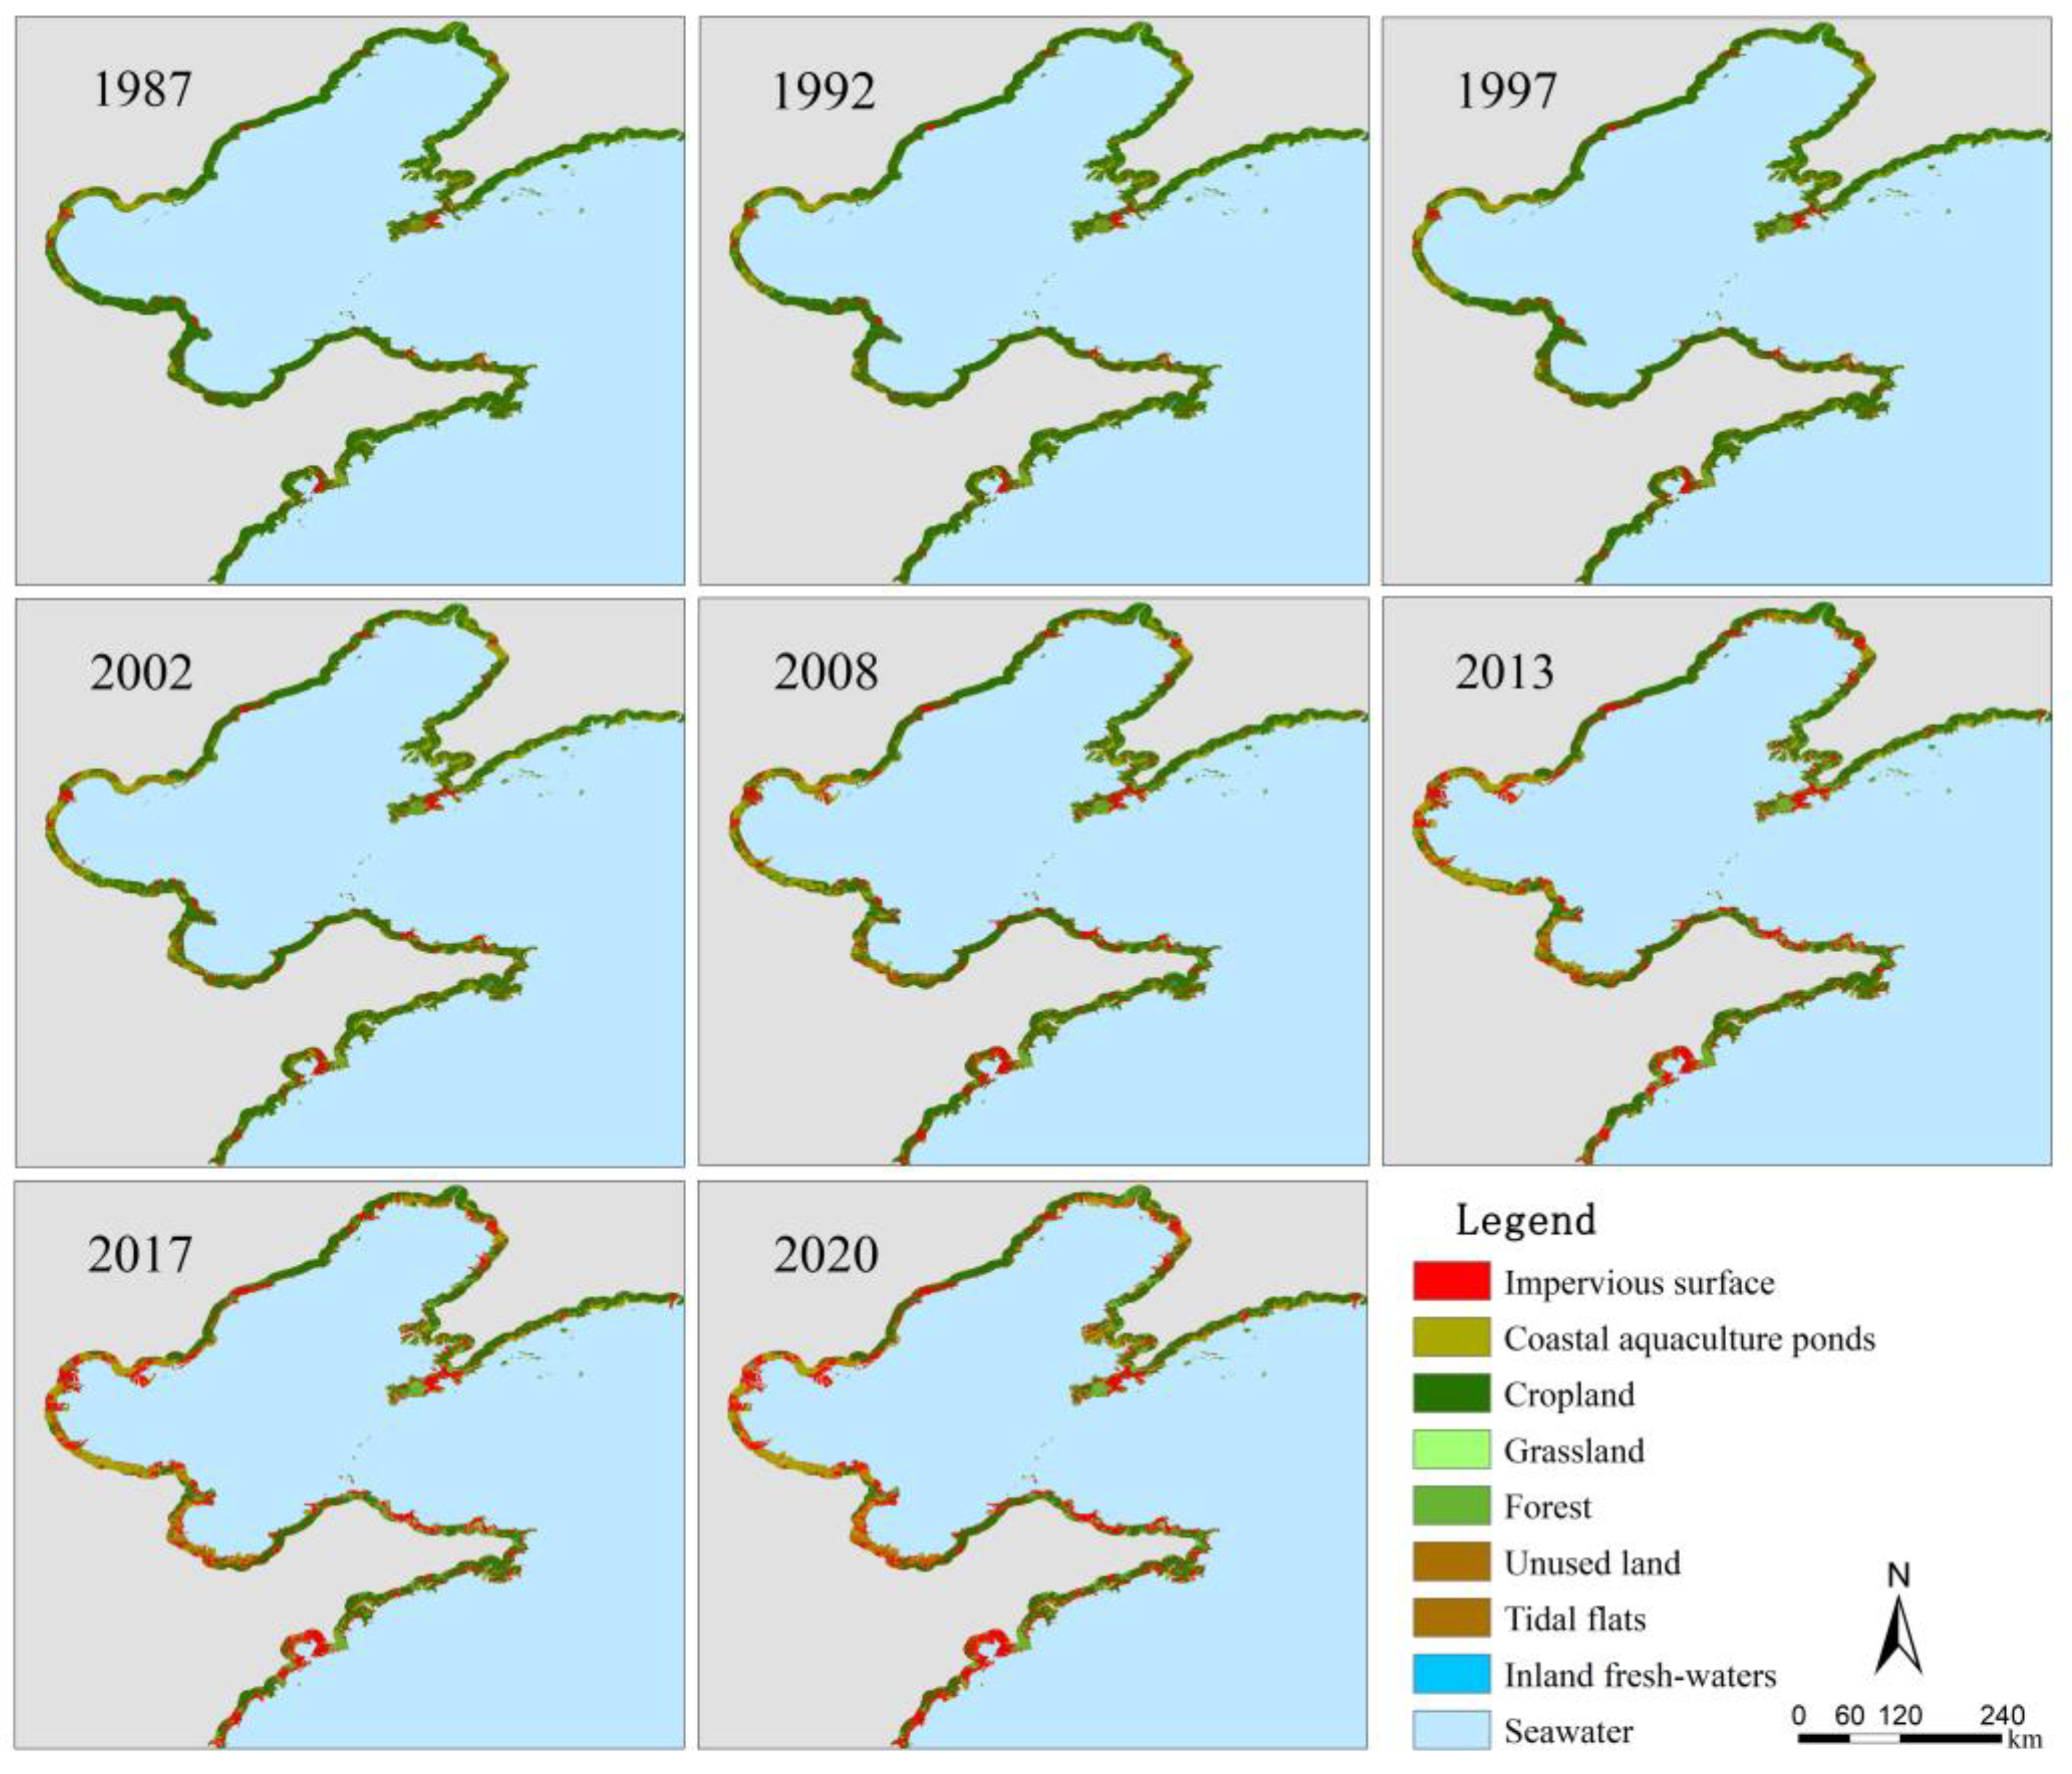
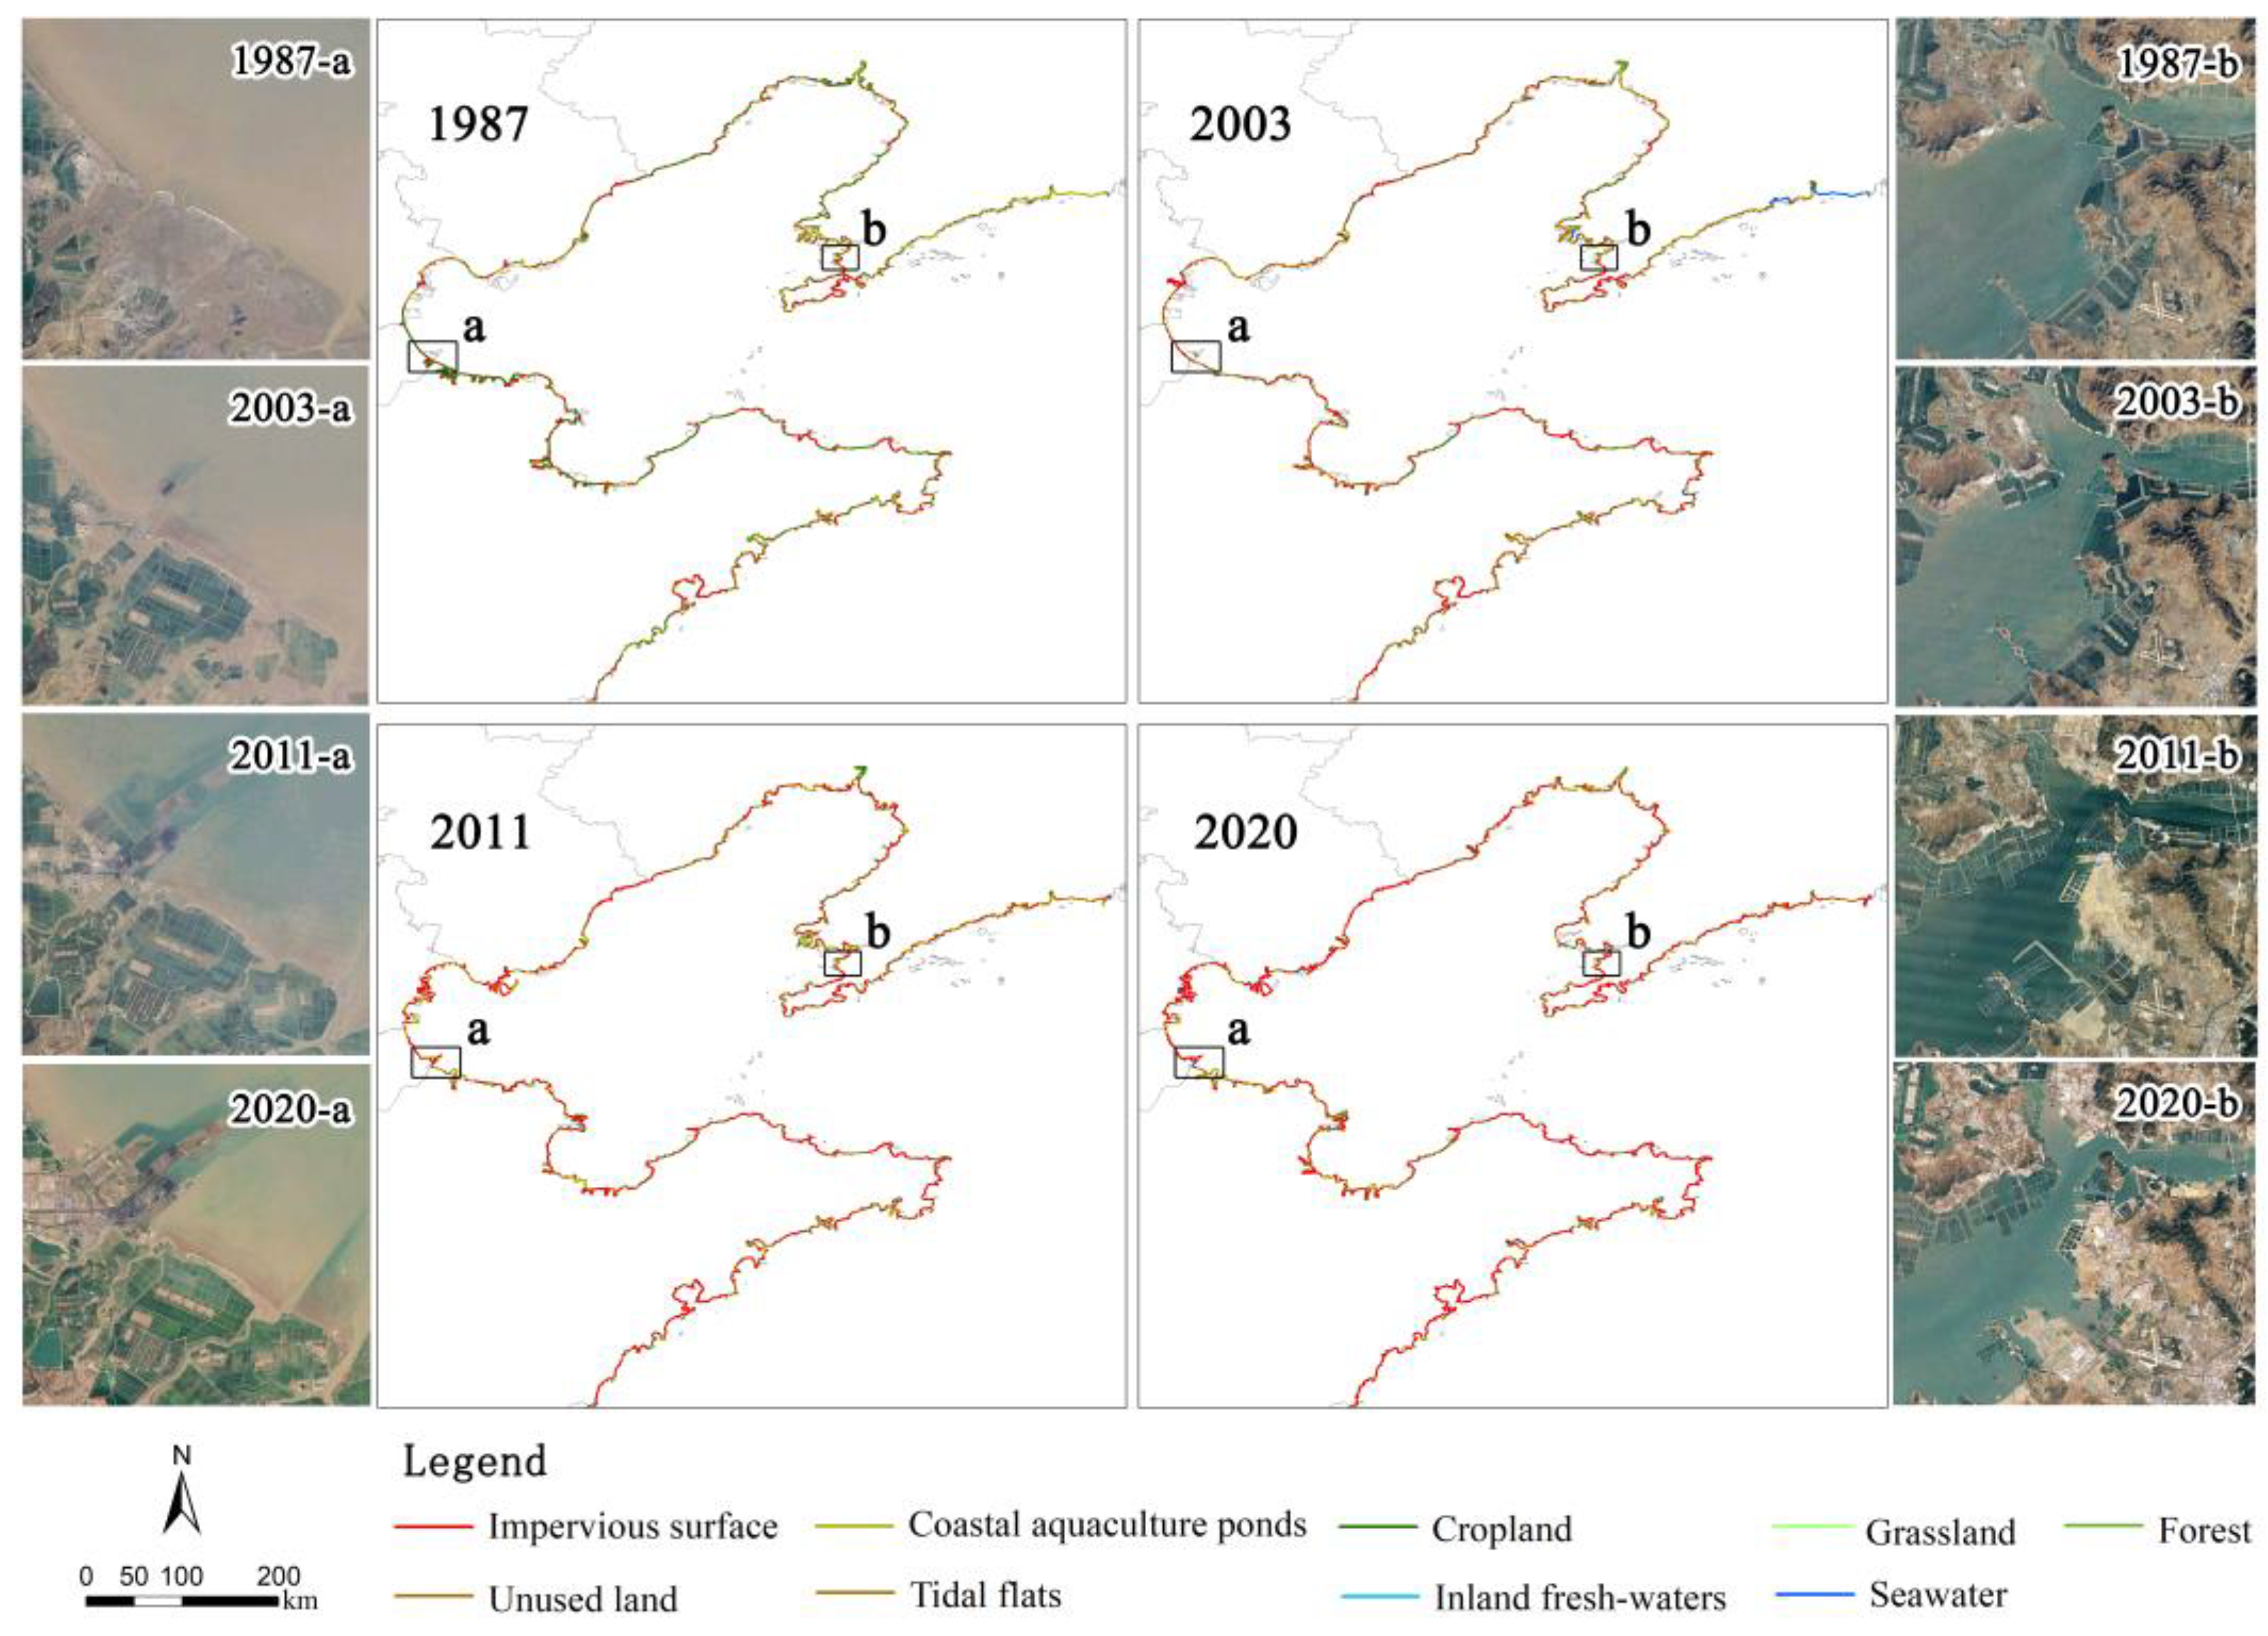
4.1. Long-Time-Series Coastline Function Identification and Change Analysis

Between 1987 and 2020, the land use within the 10 km buffer zone of the study area coastline changed dramatically, including an 89.3% decrease in cropland, a 3.88-fold increase in impervious surface, and a 45% increase in ecological land use. As shown in Figure 3, the changes in land use type in the circum-Bohai coastal zone can roughly be divided into two stages. From 1987 to 2002, the land use types in the circum-Bohai coastal zone were dominated by ecological land and cropland, with no significant changes, while between 2002 and 2020, the area of construction land increased by 194%, the area of cropland decreased by 34.17%, and the percentage of seawater area decreased by 3.31%. Among these phenomena, the spatial occupation of other land use types by construction land is mainly shown by the decrease in the amount of cropland in Bohai Bay, Laizhou Bay and Jiaozhou Bay in Shandong Province, and the encroachment of seawater in the northern part of Bohai Bay.
The length of the coastline in the circum-Bohai coastal zone increased by 15.6% between 1987 and 2020. A total of 65% of the coastline shows a trend of expansion from land to sea, concentrated in the northern coast of Liaodong Bay, Bohai Bay, and Laizhou Bay in the circum-Bohai coastal zone. The distributions of spatial morphological changes of the coastline in Bohai Rim in the whole period, and in the three phases pre-period (1987–2003), mid-period (2003–2011), and late period (2011–2020) are shown in Figure 4. The redder the line in the map, the greater the coastline expansion. The scatter plot alongside further shows the specific values of the End Point Rate of transects. It can be seen that the changes are not significant in the pre-period, with change rates mostly in the range −500~500 m/a, while the coastline expansion is relatively obvious in the mid-period, and is mainly concentrated in Liaodong Bay, Bohai Bay, and Laizhou Bay. The coastline expansion becomes slower in the late period, showing a gradual recovery. From 1987 to 2020, the development of coastline in the circum-Bohai coastal zone gradually increased in intensity, showing a general trend of expansion from land to sea.
When overlaying the transect lines generated by the baseline method from 1987 to 2020 with the classified images, the results showed that 43% of the expanded coastline represented construction land and 24% represented aquaculture ponds. This implies that the expansion of the coastline around the Bohai sea over the las 30 years has mainly been caused by aquaculture and land reclamation. Land reclamation activities are more prominent in Bohai Bay, where the Caofeidian Industrial Zone in Hebei has been engaged in large-scale land reclamation since 2005 (380 km2 was built by 2019), which is much higher than its planned area, and the land built was mainly for port, city, and other construction sites. Another place of serious seaward expansion in Bohai Bay is the Binhai New Area in Tianjin, with a total reclamation area of nearly 25 km2. The aquaculture and salt field construction activities are more active in Laizhou Bay, where scallop aquaculture, and fish and shrimp aquaculture have developed rapidly in the last 30 years, and are in the industrial farming stage, forming a belt of aquaculture facilities, which is the main reason for the seaward expansion of Laizhou Bay. The reclamation activities in Liaodong Bay are located in the northern part of the bay and Wafangdian City, Liaoning Province, and although the coastline expansion is relatively weak, it still cannot be ignored.
The coastlines are shown with their various function types in Figure 5, whereby coastlines of construction land grew the most significantly due to human activities, with its share increasing from 14.66% to 42.8%, especially after 2003, when the increase rate accelerated significantly, with an average growth rate of 70.6km/a. In contrast, ecological coastline is relatively stable and changes slowly, with a growth rate of 8.63 km/a. During 2000–2020, the coastline with the food production function type (cropland and aquaculture) decreased significantly, with the total length decreasing from 2626.9 km to 1958 km, and the average annual decrease being 33.445 km. The proportion of cropland also decreased from 52.01% in 2000 to 18.16% in 2020 due to a large amount of cropland being used for urban development and construction, resulting in the conversion of coastline with the cropland function to coastline with the impervious surface function. In summary, under the drastic influence of human activity and coastline development, the length and proportion of function types of coastlines in the Bohai Rim change dynamically, and the rapid urbanization of the coast leads to the continuous growth of construction land. According to the trend of year-on-year change with respect to length, it is presumed that the length and proportion of the function types of coastline in the Bohai Rim will continue to change.

4.2. Environmental and Ecological Effects of Temporal Changes in Coastline

To understand the environmental and ecological effects of coastline changes, we analyzed the water quality and ecological land use changes in 68 districts and counties along the coast of the Bohai Sea Rim.

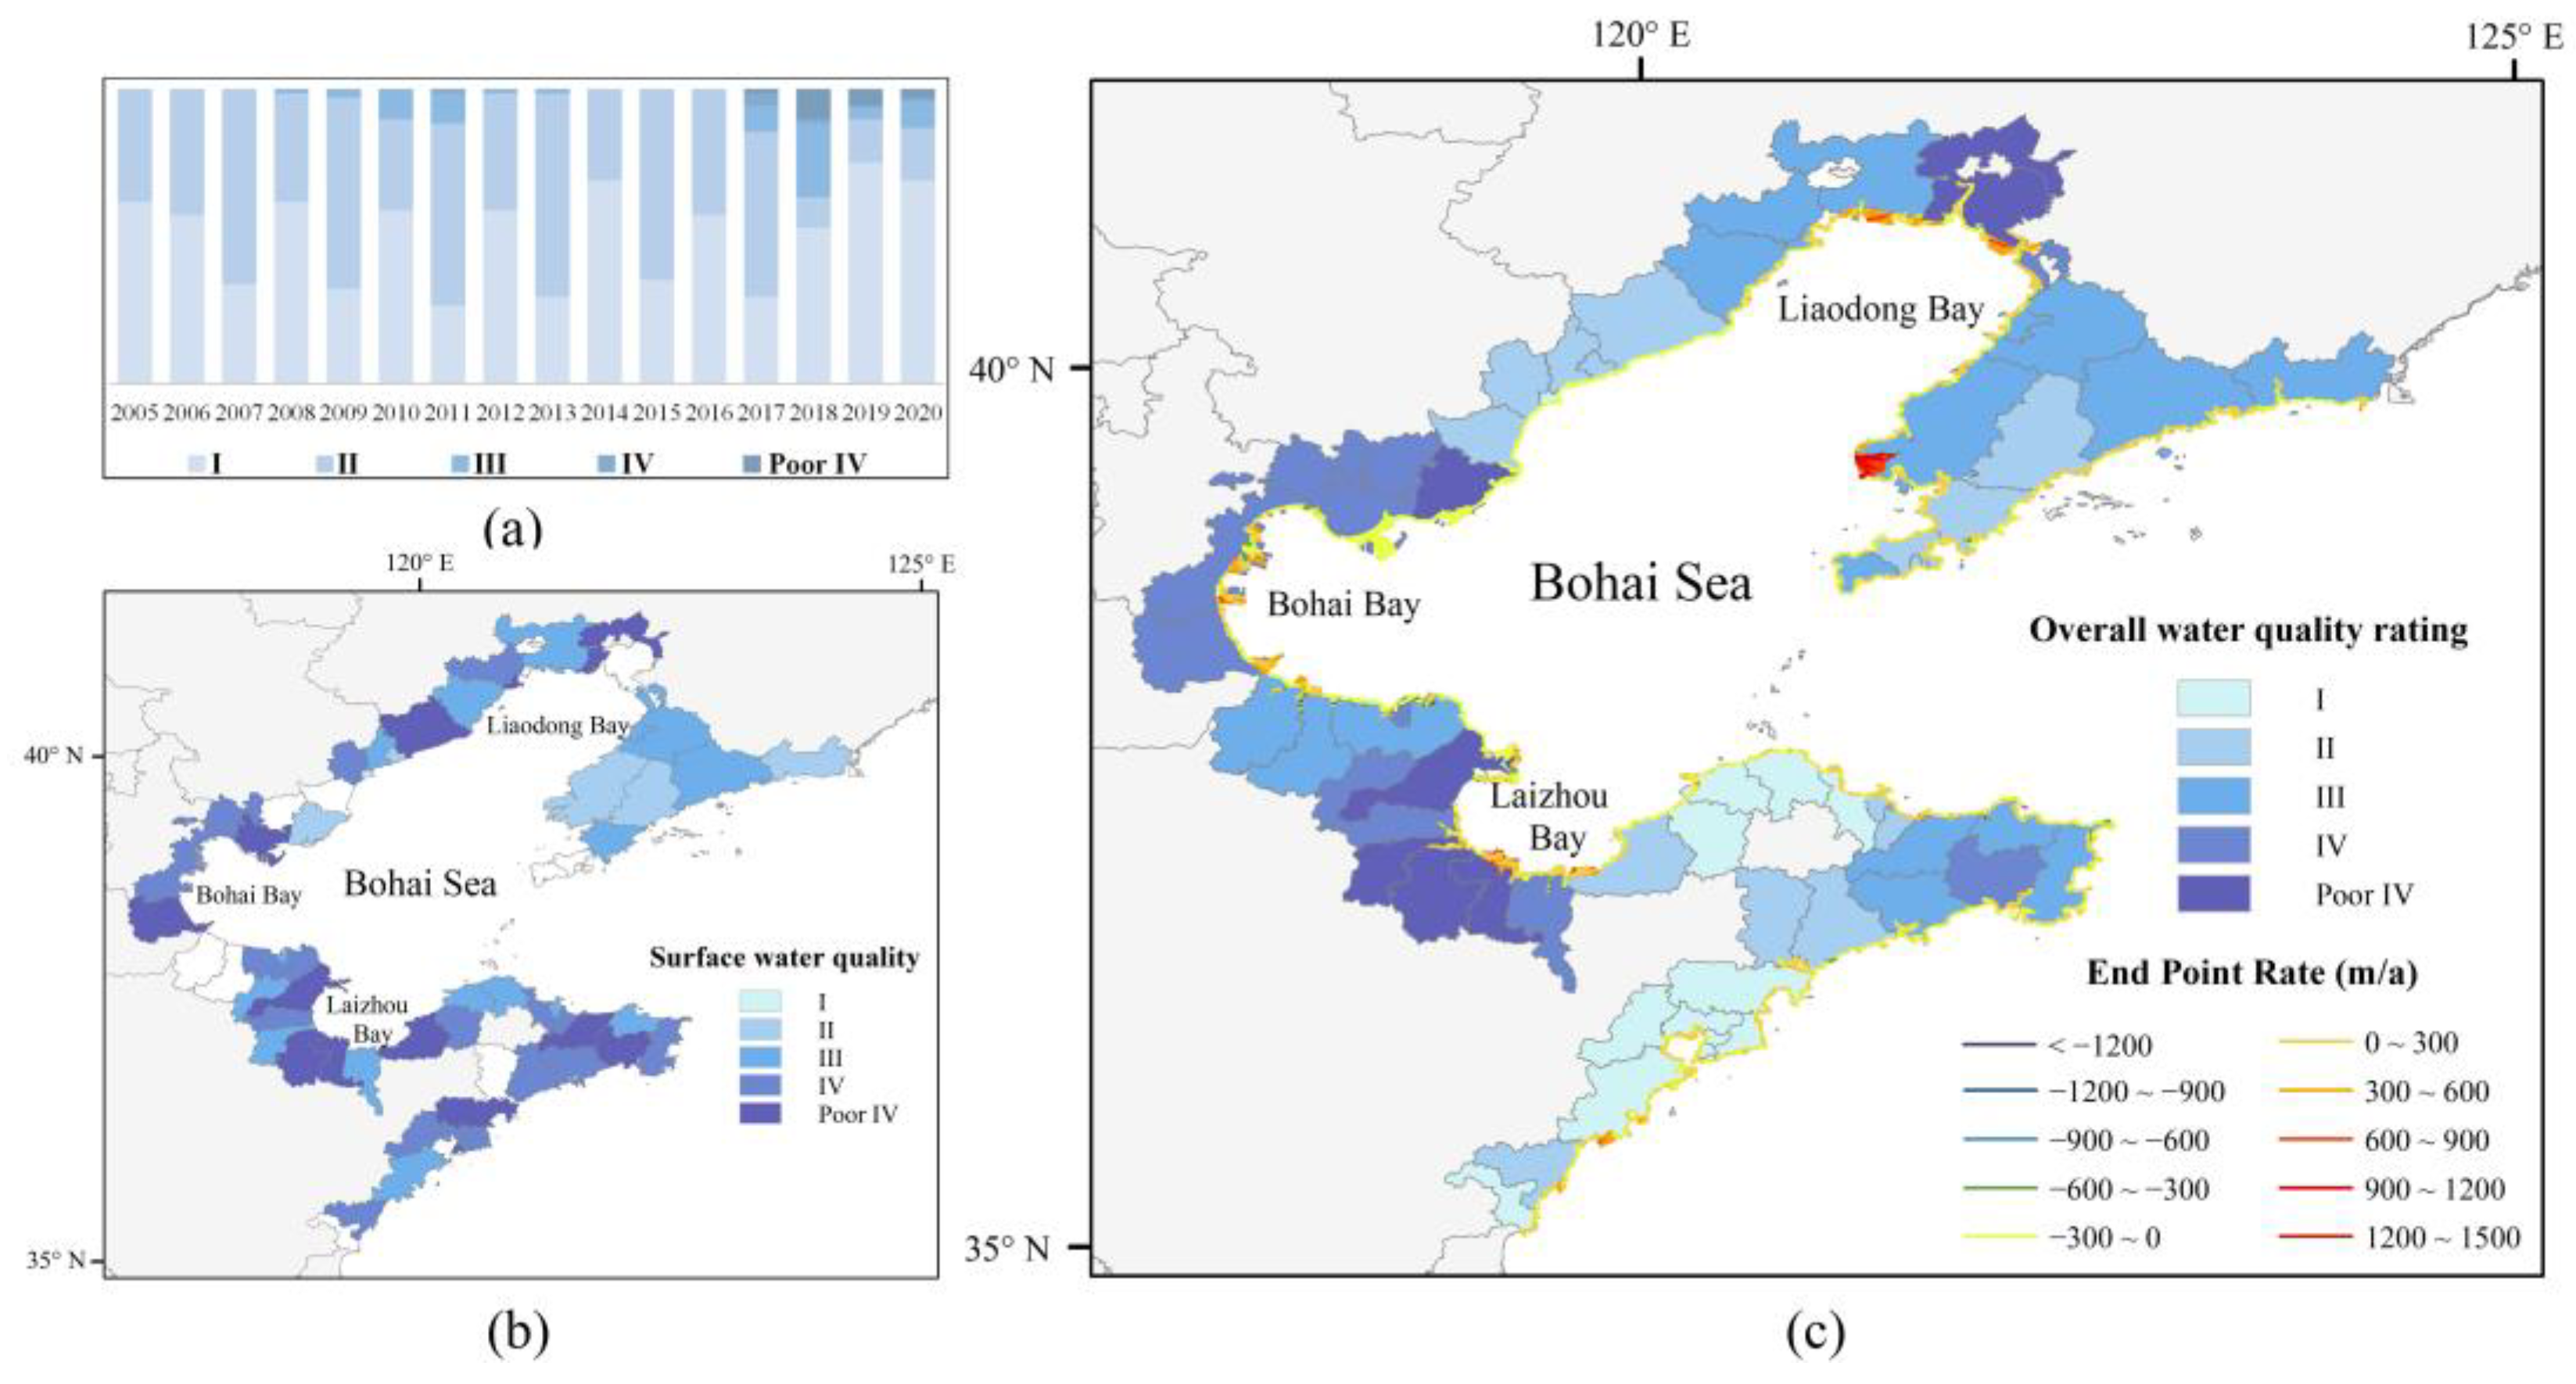
4.2.1. Long Time Series of Environmental Effects

Combined with the water quality of the near-shore waters of coastal districts and counties for the past 15 years (Figure 6), it can be found that the water quality of surface water and near-shore are basically matched, which are poorer and more seriously polluted in the areas near Liaodong Bay, Bohai Bay, and Laizhou Bay. Among them, it is clear from Figure 5a that 2010 and 2017 were points of abrupt change with respect to water quality, and the proportion of the area with water quality degradation of level 3 or above increased to different degrees compared with the previous year, with the pollution of the seawater in near-shore areas becoming serious. Water quality in 2018 was the worst, with 36.76% of districts and counties having a water quality degradation rating of level 3 or above.
In the comparison of the year-by-year coastline function change index and the water quality grade from 2005 to 2020, it was found that 82.73% of the coastal districts and counties in the Bohai Sea Rim showed a linear correlation between the coastline function index and the water quality grade, indicating that the more obvious the change in coastline function is, the more serious the water pollution will be. Figure 6c shows the coupling between the changes in coastline migration rate and water quality, revealing that the higher the absolute value of the coastline migration rate class, the higher the corresponding water quality class. It means that the faster the rate, the more serious the water pollution, regardless of whether the coastline is migrating inwards or outwards. Overall, there is good spatial coupling between coastline changes and water quality; thus, anthropogenic coastline development is an important cause of water quality deterioration in the Bohai Sea Rim.

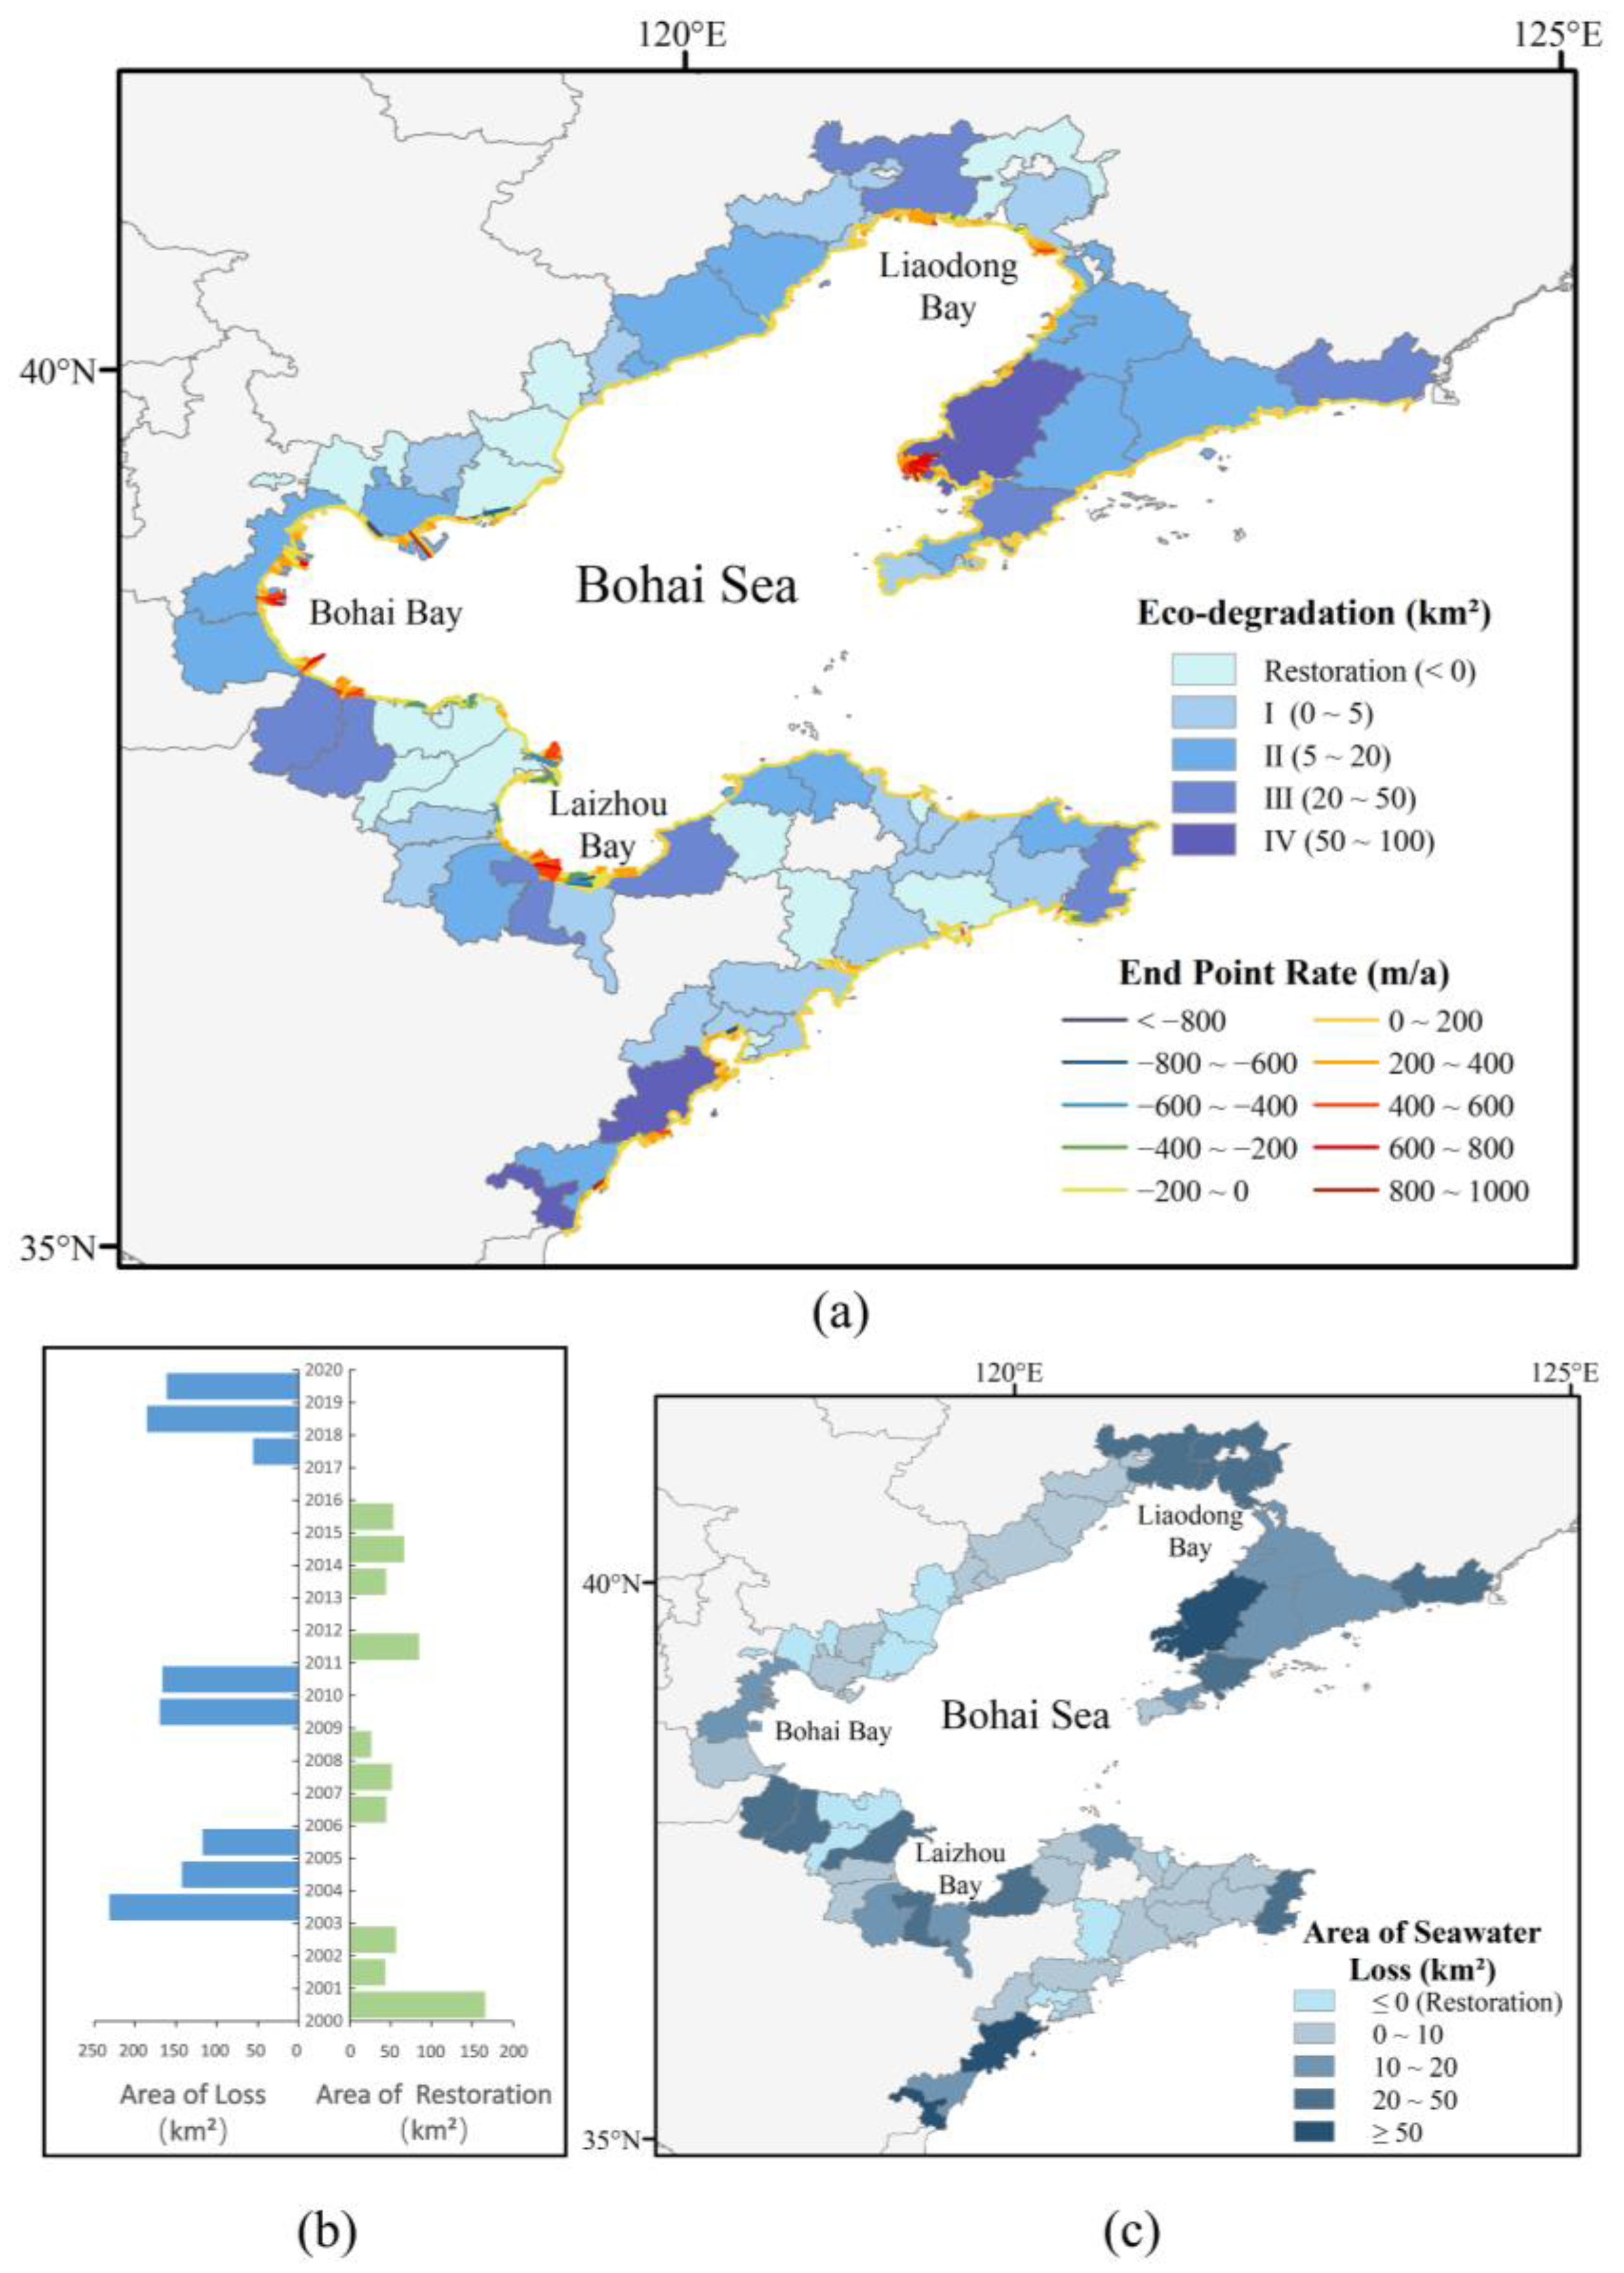
4.2.2. Long Time Series of Ecological Effects

In terms of the annual total loss of ecological land, the overall changes show cyclical fluctuations. Three periods of ecological land degradation in 2003–2006, 2009–2011, and 2017–2020 were preceded and followed by periods of ecological land restoration or without significant changes in 2000–2003, 2006–2009, and 2011–2017, respectively (Figure 7b). The reasons for these cyclical changes are related to anthropogenic shoreline development and policy controls. In particular, in the three degradation periods, 2003 is the point at which the growth rate of the coastline functions of the impervious surface increased; 2010 and 2017 are the catastrophe points of water quality level, indicating increased human coastal activity; and 2011 was the start of the 12th Five-Year Plan, and there is a longer recovery period under the guidance of the marine economic development plan.
From 2000 to 2020, ecological land degradation mainly occurred in Liaodong Bay, Laizhou Bay, and in the middle of Bohai Bay, among which Wafangdian City in Liaoning Province, located in Liaodong Bay, reached level 4 degradation; ecological land in both northern and southern Bohai Bay was restored (Figure 7a). From the figure, the coastline migration rate and coastline function index are spatially coupled with the degradation of ecological lands in the marine part of Bohai Sea coastal zone. For most areas, a larger coastline landward migration rate corresponds to a less degraded or restored ecological land but to a higher degree of ecological degradation with a larger rate of coastline seaward migration; however, there are a few areas in which a larger coastline seaward migration rate corresponds to the restoration of ecological land, such as in Kenli District, Dongying City, Shandong Province (Figure 7a). In addition, by calculating the consistency between the coastline function index and the degree of ecological land loss each year, we found that 77.8% of coastal districts and counties had a consistent coastline function index rating and degree of ecological land loss per year, indicating that the coastline function index and ecological land loss are coupled in terms of their spatial distribution. As shown in Figure 7c, the loss of seawater ecological land, in particular, refers to a reduction in the amount of ecological land that is of the seawater type, and a negative number indicates that seawater ecological land has been recovered.

5. Discussion

Over the past three decades, the overall coastline around the Bohai sea has undergone dramatic changes [41]. The consistently high economic growth has led to the expansion of construction land [42], as well as large-scale reclamation activities, coastal projects such as sea enclosures, and reclamation for the purposes of port expansion, construction land, and aquaculture, which are important reasons for expanding the coastline [32,43], while natural factors are secondary reasons [44]. The morphological changes and functional use type changes of the circum-Bohai coastal zone show strong temporal and spatial differentiation. Spatially, Bohai Bay, the Yellow River Delta, the south coast of Laizhou Bay, and the north coast of Liaodong Bay exhibit the most drastic changes in the circum-Bohai coastal zone [29]. Since the beginning of the 21st century, a number of national coastal economic zones, including the Tianjin Binhai New Area, the Liaoning Coastal Economic Zone, the Shandong Peninsula Blue Economic Zone, and the Yellow River Delta Efficient Ecological Economic Zone around the Bohai Sea, have been implemented one after another, and the population density in coastal areas has increased, leading to the expansion of coastlines and the demand to expand land from the sea in order to relieve land pressure [45,46]. Temporally, the expansion of urbanization is obvious. The coastal migration shows the expansion towards the sea following 2003, while the expansion gradually became slower after 2011 [47]. The overall trend is slow–rapid–slow. In 2002, China adopted the Law of the People’s Republic of China on the Administration of Sea Area Use, and with the support of national policies, land reclamation and economic development of the circum-Bohai coastal zone has been rapid. Prior to 2012, the State Oceanic Administration issued Several Opinions on Establishing the Bohai Sea Marine Ecological Redline System, proposing the strengthening of environmental protection in the Bohai Sea, and maintaining marine ecological security in the Bohai Sea, in order to ensure the sustainable social and economic development of the Bohai Sea region. In terms of function, the coastline has been sharply converted from cropland into construction land [48]. This is because construction land, in a general sense, can bring greater economic benefits [49]. Few stable coastline functional use types have been analyzed in previous studies due to the extreme instability of coastlines. The functions of the coastlines in this study were quantified using a series of landside buffer lines along the coastline, on the basis of which the functional use type of the buffer line (with a buffer radius of 400–900 m) that best represents the coastline function was selected as the representation of the coastline, so as to study stable coastline functional change and provide support for coastline planning and management.
Analyzing the environmental effects of coastline changes in the circum-Bohai coastal zone, it can be observed that when the water is seriously polluted in a given year, the water quality is generally good in the following year. This paper argues that this phenomenon occurs because the water pollution attracts the attention of the government, and water quality control will be conducted in the following year, thus bringing water quality up to a great level. In addition, changes in water quality are closely linked to policies enacted by the state [50], e.g., Several Opinions on Establishing the Bohai Sea Marine Ecological Redline System, which proposes strengthening environmental protection in the Bohai Sea area. Overall, the water quality improved from 2011 to 2012. Specifically, in 2011, there were eight districts and counties with water quality of level 3 or above; in 2012, there was only one district and county with water quality of level 3. Similarly, following the implementation of the Action Plan for the Comprehensive Management of the Bohai Sea on 30 November 2018, the twenty-four districts and counties with water quality of level 3 or above in 2018 were reduced to only six in 2019. The conversion of coastal mudflats and wetlands to other uses causes pollution of marine and inland waters in Bohai Bay [51]. Untreated industrial wastewater, domestic wastewater discharge, and oil spills cause the pollution of near-shore waters in Laizhou Bay [52], while the Caofeidian port area in Bohai Bay is the key port of "northern coal transportation to the south" in China, and the seawater in its waters is polluted by petroleum. The discharge of aquaculture wastewater, domestic sewage, and livestock wastewater in Laizhou Bay results in the presence of antibiotics and heavy metals in the seawater, resulting in environmental pollution [53]. Changes in the coastline of Bohai Bay weaken the exchange capacity and self-purification capacity of the water body, making water pollution intensify [27]. Bohai Bay reclamation leads to increased changes in the topography of the estuary, and the retreat of the coastline leads to dune ridges. The recession of the coastline leads to the deterioration of natural coastal defenses, thus exacerbating disasters such as storm surges [54]. It can be seen that the carrying capacity of resources and the environment can be improved by increasing ecological resilience (ecosystem resilience is the ecosystem’s inherent ability to absorb various disturbances and reorganize while undergoing state changes in order to maintain critical functions [55]) of coastal areas, such as implementing spatial planning of coastal resources, controlling pollutant emissions, and establishing an eco-redline, thus promoting regional sustainable development.
Human activities have greatly influenced changes in land use type as well as coastline patterns and functions in the circum-Bohai coastal zone. When analyzing the ecological effects of coastline changes between the years 2000 and 2020, it was observed that the main type of ecological land degradation in the sea part of the circum-Bohai coastal zone was seawater, except for the period 2017–2018, when it was mudflats. The reclamation activities in the coastal area, mainly farming and construction, have led to large-scale degradation of the seawater ecological land [32,56]. Reclamation projects, construction land expansion, port construction, and near-shore aquaculture in the circum-Bohai coastal zone have come to occupy a large amount of ecological land, including coastal wetlands and near-shore seawater. The Bohai Sea is the most concentrated region of port reclamation in the world, with 2300 km2 in 13 ports being reclaimed between the years 2002 and 2018, reducing the sea area by 3% [46]. The Caofeidian Industrial Zone in Hebei, located in Bohai Bay, has reclaimed an area of 380 km² in the last 15 years, which is far more than the planned area, while the total reclaimed area of the Tianjin Binhai New Area is nearly 25 km².The expansion of cities and towns, ports, industrial parks and other construction sites has impeded the exchange of material and energy between land and sea, leading to a reduction in coastal wetlands in Bohai Bay and a large reduction in the pioneer species Suaeda salsa [57], as well as loss of biological habitats such as waterbirds in Bohai Bay [58,59]. The coastal ecosystem has been severely disturbed [56,60]. Laizhou Bay is located in Shandong Province, with developed fisheries. The industrial aquaculture zone formed along the coastline dominates the seaward expansion of the west coast of Laizhou Bay, and has changed the boundary conditions for storm surges, enhancing the ocean dynamics near the coastline and increasing the rate of coastline landward migration by causing the erosion and recession of the east coast of Laizhou Bay [22]. A series of policies for the protection of the Yellow River estuary has led to a great restoration of seawater ecological land in Dongying, despite the serious degradation in the neighboring areas of Binzhou and Weifang (Figure 7c). It follows that the restoration of ecological land requires the regulation of human activities [61]. In cases where the coastline needs to be or has been developed, the legal systems regulating coastal reclamation should be improved and strengthened, while the scale and speed of land reclamation should be scientifically planned and controlled [29,62]. Taking the protection of ecological environment of the waters and mudflats as the fundamental guideline, sea and land should be integrated, and the development of fisheries, the transportation industry and other marine industries should be reasonably laid out. In areas with severe coastline loss, artificial coastal restoration projects are needed to help reduce the ecological burden of the circum-Bohai coastal zone. In areas that have not been intensively exploited, the natural conservation role of coastal ecosystem for coastline [63] should be used, and ecosystem-based management and strategies [64] should be implemented in accordance with local conditions. Improving hte recovery of ecological land requires cooperation between relevant policies and the establishment of nature reserves.

6. Conclusions

This study determined land-use function classification on the basis of long-time-series remote sensing images of the coastal zone of the Bohai Rim based on GEE, measured the spatial morphological changes and development and protection functions of the coastline, and analyzed the environmental and ecological effects caused by long-time-series coastline changes by means of coupling analysis with seawater pollution and ecological degradation of the coastal region in the past 20 years. The main findings of this study can be concluded as follows:
The changes in coastline morphology and functional type in the circum-Bohai coastal zone showsignificant temporal and spatial divergence between 1987 and 2020. The length of the coastline increased by 15.6% over those three decades, and the overall trend is the expansion of the coastline into the sea, concentrated in Bohai Bay, the Yellow River Delta, Laizhou Bay and the northern coast of Liaodong Bay, with human land reclamation and polder farming being the main sources of expansion, and natural factors exerting less influence. Temporally, the large-scale seaward expansion of the coastline around Bohai Sea started in 2003, and since then, polder farming and port construction became more active. Since 2011, the seaward expansion has slowed down. The changes in coastline function from 2000 to 2020 (decreased in the early stage and recovered in the later stage) showed that the rapid urban construction in the coastal area brought obvious interconversion between cropland (a decrease from 52.01% to 18.16%, at a rate of 33.4 km/a) and construction land (which increased from 14.66% to 42.8%, with an annual rate of 70.6 km/a). This is consistent with the pattern of land use in China’s economic and social development over the last 30 years.
Ecological land loss in the circum-Bohai coastal zone shows cyclical fluctuations, and water pollution is dynamic, and these related to governmental policy and human activities such as coastline development. Coastline change is significantly coupled with ecological land loss and change in water quality rating on a spatial basis, and the rate of coastline migration to the sea is positively correlated with the degree of ecological land loss and change in water quality rating. A linear correlation between changes in coastline function and water quality, and between changes in coastline function and loss of ecological land was present in 82.73% and 77.8% of coastal counties, respectively. Through the analysis of coastline morphology and functional changes, it can be found that the main cause of ecological degradation in the circum-Bohai coastal zone is the loss of coastal wetlands and near-shore seawater caused by sea-farming and land reclamation, which disturb the coastal ecosystem. The main cause of environmental pollution in the circum-Bohai coastal zone is land use change occurring as part of the development process of urban industrialization and urbanization, as well as the pollution of near-shore seawater caused by untreated industrial sewage, domestic wastewater, aquaculture wastewater discharge, and oil leakage.
To mitigate the negative environmental and ecological effects of coastline changes, existing reclamation activities should be controlled, new reclamation projects should be strictly examined and prohibited from occupying the natural coastline, and management strategies for natural restoration should be implemented as the main focus, with artificial restoration acting as a supplement. Meanwhile, we should carry out coastline restoration projects responding to the different types and degrees of coastline development by implementing coordination between sea and land, so as to ensure the development of natural coastline inventory. In addition, the spatial planning of coastal resources should be performed scientifically, and the decrease in biological resources and biodiversity brought about by the occupation of biological habitats due to reclamation should be compensated by means of stocking and releasing. It is extremely important to draw the eco-redline of the Bohai Sea, carry out marine eco-environment protection projects, and plan and build key ecological function areas, nature reserves, and other important ecological spaces in the Bohai Bay. In order to achieve this, human activities should be regulated, and a Bohai Sea pollution management system should be established to undertake integrated land and sea management. For developed coastal zone areas, it is necessary to control the discharge of untreated industrial sewage into the sea, such as aquaculture wastewater and domestic sewage from roots, and to comprehensively improve the water quality in the offshore area, so as to improve the proportion of water with good quality in the near-shore waters of the Bohai Sea. To achieve the overall optimization of the Bohai Sea environment and promote ecologically healthy breeding, it is necessary to strictly prohibit the use of nationally banned pesticides, improve the carrying capacity of resources and the environment, and achieve the sustainable development of the coastal zone.

Author Contributions

Conceptualization, Y.J. and Y.W.; methodology, S.T. and Y.W.; software, S.T., L.S. and S.W.; validation, Y.J. and Y.W.; investigation, S.T., L.S. and S.W.; writing—original draft preparation, S.T., L.S., S.W., J.L., Y.W. and Y.J.; writing—review and editing, S.T., L.S., S.W., Y.W., J.L. and Y.J.; supervision, Y.J.; project administration, Y.J. and Y.W.; funding acquisition, Y.J. and Y.W. All authors have read and agreed to the published version of the manuscript.

Funding

This research was funded by the National Natural Science Foundation of China (No. 42001131, 42001306).

Institutional Review Board Statement

Not applicable.

Informed Consent Statement

Not applicable.

Data Availability Statement

Not applicable.

Acknowledgments

We appreciate the critical and constructive comments and suggestions from the reviewers that helped improve the quality of this manuscript.

Conflicts of Interest

The authors declare no conflict of interest.

References

  1. Gens, R. Remote sensing of coastlines: Detection, extraction and monitoring. Int. J. Remote Sens. 2010, 31, 1819–1836. [Google Scholar] [CrossRef]
  2. Boak, E.; Turner, I. Shoreline Definition and Detection: A Review. J. Remote Sens. 2005, 21, 688–703. [Google Scholar] [CrossRef]
  3. Liu, H.; Jezek, K.C. Automated extraction of coastline from satellite imagery by integrating Canny edge detection and locally adaptive thresholding methods. Int. J. Remote Sens. 2004, 25, 937–958. [Google Scholar] [CrossRef]
  4. Ryu, J.H.; Won, J.S.; Min, K.D. Waterline extraction from Landsat TM data in a tidal flat—A case study in Gomso Bay, Korea. Remote Sens. Environ. 2002, 83, 442–456. [Google Scholar] [CrossRef]
  5. Zhang, T.; Yang, X.; Hu, S.; Su, F. Extraction of Coastline in Aquaculture Coast from Multispectral Remote Sensing Images: Object-Based Region Growing Integrating Edge Detection. Remote Sens. 2013, 5, 4470–4487. [Google Scholar] [CrossRef]
  6. Thieler, E.R.; Himmelstoss, E.A.; Zichichi, J.L.; Ergul, A. The Digital Shoreline Analysis System (DSAS) Version 4.0—An ArcGIS Extension for Calculating Shoreline Change; 2008–1278; U. S. Geological Survey: Reston, VA, USA, 2009.
  7. Ali, T.A. New Methods for Positional Quality Assessment and Change Analysis of Shoreline Features; The Ohio State University: Columbus, OH, USA, 2003; Available online: https://0-www-proquest-com.brum.beds.ac.uk/dissertations-theses/new-methods-positional-quality-assessment-change/docview/305319941/se-2 (accessed on 25 July 2021).
  8. Li, R.; Liu, J.-K.; Felus, Y. Spatial Modeling and Analysis for Shoreline Change Detection and Coastal Erosion Monitoring. Mar. Geod. 2001, 24, 1–12. [Google Scholar] [CrossRef]
  9. Liu, J.-K. Developing Geographic Information System Applications In Analysis of Responses to Lake Erie Shoreline Changes. 2000. Available online: https://citeseerx.ist.psu.edu/viewdoc/download?doi=10.1.1.25.6469&rep=rep1&type=pdf (accessed on 25 July 2021).
  10. Smith, M.; Cromley, R. Measuring Historical Coastal Change using GIS and the Change Polygon Approach. T. GIS 2012, 16, 3–15. [Google Scholar] [CrossRef]
  11. Heo, J.; Kim, J.H.; Kim, J.W. A new methodology for measuring coastline recession using buffering and non-linear least squares estimation. Int. J. Geogr. Inf. Sci. 2009, 23, 1165–1177. [Google Scholar] [CrossRef]
  12. Bishop-Taylor, R.; Nanson, R.; Sagar, S.; Lymburner, L. Mapping Australia’s dynamic coastline at mean sea level using three decades of Landsat imagery. Remote Sens. Environ. 2021, 267, 112734. [Google Scholar] [CrossRef]
  13. Hou, X.Y.; Wu, T.; Hou, W.; Chen, Q.; Wang, Y.D.; Yu, L.J. Characteristics of coastline changes in mainland China since the early 1940s. Sci. China Earth. Sci. 2016, 59, 1791–1802. [Google Scholar] [CrossRef]
  14. Fu, Y.; Guo, Q.Z.; Wu, X.X.; Fang, H.; Pan, Y.Y. Analysis and Prediction of Changes in Coastline Morphology in the Bohai Sea, China, Using Remote Sensing. Sustainability 2017, 9, 900. [Google Scholar] [CrossRef]
  15. Yan, X.L.; Hu, Y.M.; Chang, Y.; Zhang, D.H.; Liu, M.; Guo, J.T.; Ren, B.H. Monitoring Wetland Changes both Outside and Inside Reclamation Areas for Coastal Management of the Northern Liaodong Bay, China. Wetlands 2017, 37, 885–897. [Google Scholar] [CrossRef]
  16. Tian, H.Z.; Xu, K.; Goes, J.I.; Liu, Q.P.; Gomes, H.D.; Yang, M.M. Shoreline Changes Along the Coast of Mainland China-Time to Pause and Reflect? ISPRS Int. J. Geoinf. 2020, 9, 572. [Google Scholar] [CrossRef]
  17. Sui, L.; Wang, J.; Yang, X.; Wang, Z. Spatial-temporal characteristics of coastline changes in Indonesia from 1990 to 2018. Sustainability 2020, 12, 3242. [Google Scholar] [CrossRef]
  18. Yan, F.Q.; Wang, X.G.; Su, F.Z. Ecosystem service changes in response to mainland coastline movements in China: Process, pattern, and trade-off. Ecol. Indic. 2020, 116, 106337. [Google Scholar] [CrossRef]
  19. Bushra, N.; Bin Mostafiz, R.; Rohli, R.V.; Friedland, C.J.; Rahim, M.A. Technical and Social Approaches to Study Shoreline Change of Kuakata, Bangladesh. Front. Mar. Sci. 2021, 8, 730984. [Google Scholar] [CrossRef]
  20. Murray, N.J.; Phinn, S.R.; DeWitt, M.; Ferrari, R.; Johnston, R.; Lyons, M.B.; Clinton, N.; Thau, D.; Fuller, R.A. The global distribution and trajectory of tidal flats. Nature 2019, 565, 222–225. [Google Scholar] [CrossRef]
  21. Luijendijk, A.P.; Kras, E.; Dagalaki, V.; Morelissen, R.; Hoteit, I.; Ranasinghe, R. Regime Shifts in Future Shoreline Dynamics of Saudi Arabia. Front. Mar. Sci. 2022, 8, 798657. [Google Scholar] [CrossRef]
  22. Wang, Q.; Zhong, S.Y.; Li, X.Y.; Zhan, C.; Wang, X.; Liu, P. Supratidal Land Use Change and Its Morphodynamic Effects along the Eastern Coast of Laizhou Bay during the Recent 50 Years. J. Coast. Res. 2016, 74, 83–94. [Google Scholar] [CrossRef]
  23. Xiao, X.B.; Li, Y.H.; Shu, F.F.; Wang, L.; He, J.; Zou, X.C.; Chi, W.Q.; Lin, Y.T.; Zheng, B.X. Coupling Relationship of Human Activity and Geographical Environment in Stage-Specific Development of Urban Coastal Zone: A Case Study of Quanzhou Bay, China (1954–2020). Front. Mar. Sci. 2022, 8. [Google Scholar] [CrossRef]
  24. Xu, Y.D.; Gao, H.W.; Wei, X.; Zhu, J.L. The Effects of Reclamation Activity and Yellow River Runoff on Coastline and Area of the Laizhou Bay, China. J. Ocean Univ. China 2021, 20, 729–739. [Google Scholar] [CrossRef]
  25. Zhang, Y.; Liu, Y.; Zhang, X.; Huang, H.; Qin, K.; Bai, Z.; Zhou, X. Correlation Analysis between Land-Use/Cover Change and Coastal Subsidence in the Yellow River Delta, China: Reviewing the Past and Prospecting the Future. Remote Sens. 2021, 13, 4563. [Google Scholar] [CrossRef]
  26. Zhu, L.H.; Hu, R.J.; Zhu, H.J.; Jiang, S.H.; Xu, Y.C.; Wang, N. Modeling studies of tidal dynamics and the associated responses to coastline changes in the Bohai Sea, China. Ocean Dyn. 2018, 68, 1625–1648. [Google Scholar] [CrossRef]
  27. Jia, H.; Shen, Y.M.; Su, M.R.; Yu, C.X. Numerical simulation of hydrodynamic and water quality effects of shoreline changes in Bohai Bay. Front. Earth Sci. 2018, 12, 625–639. [Google Scholar] [CrossRef]
  28. Sun, Z.P.; Niu, X.J. Variation Tendency of Coastline under Natural and Anthropogenic Disturbance around the Abandoned Yellow River Delta in 1984–2019. Remote Sens. 2021, 13, 3391. [Google Scholar] [CrossRef]
  29. Ding, X.S.; Shan, X.J.; Chen, Y.L.; Jin, X.S.; Muhammed, F.R. Dynamics of shoreline and land reclamation from 1985 to 2015 in the Bohai Sea, China. J. Geogr. Sci. 2019, 29, 2031–2046. [Google Scholar] [CrossRef]
  30. Xu, C.Y.; Zhou, C.Y.; Ma, K.; Wang, P.; Yue, X.H. Response of Water Environment to Land Reclamation in Jiaozhou Bay, China Over the Last 150 Years. Front. Mar. Sci. 2021, 8, 750288. [Google Scholar] [CrossRef]
  31. Yu, J.; Zhou, D.; Yu, M.; Yang, J.; Li, Y.; Guan, B.; Wang, X.; Zhan, C.; Wang, Z.; Qu, F. Environmental threats induced heavy ecological burdens on the coastal zone of the Bohai Sea, China. Sci. Total Environ. 2021, 765, 142694. [Google Scholar] [CrossRef]
  32. Wang, X.; Yan, F.; Su, F. Changes in coastline and coastal reclamation in the three most developed areas of China, 1980–2018. Ocean Coast. Manag. 2021, 204, 105542. [Google Scholar] [CrossRef]
  33. Smith, K.E.L.; Terrano, J.F.; Pitchford, J.L.; Archer, M.J. Coastal Wetland Shoreline Change Monitoring: A Comparison of Shorelines from High-Resolution WorldView Satellite Imagery, Aerial Imagery, and Field Surveys. Remote Sens. 2021, 13, 3030. [Google Scholar] [CrossRef]
  34. Guo, L.; Wang, D.; Qiu, J.; Wang, L.; Liu, Y. Spatio-temporal patterns of land use change along the Bohai Rim in China during 1985–2005. J. Geogr. Sci. 2009, 19, 568. [Google Scholar] [CrossRef]
  35. Liu, Y.B.; Hou, X.Y.; Li, X.W.; Song, B.Y.; Wang, C. Assessing and predicting changes in ecosystem service values based on land use/cover change in the Bohai Rim coastal zone. Ecol. Indic. 2020, 111, 106004. [Google Scholar] [CrossRef]
  36. Chen, D.; Wang, Y.F.; Shen, Z.Y.; Liao, J.F.; Chen, J.Z.; Sun, S.B. Long Time-Series Mapping and Change Detection of Coastal Zone Land Use Based on Google Earth Engine and Multi-Source Data Fusion. Remote Sens. 2022, 14, 1. [Google Scholar] [CrossRef]
  37. Crowell, M.; Honeycutt, M.; Hatheway, D. Coastal Erosion Hazards Study: Phase One Mapping. J. Coast. Res. 1999, 10–20. Available online: http://0-www-jstor-org.brum.beds.ac.uk/stable/25736180 (accessed on 25 July 2021).
  38. Li, X.; Hou, X.; Di, X.; Su, H. Effects of Land Use Change on Imbalance in Ecosystem Services:A Case Study of Laizhou Bay Coastal Zone. Sci. Geol. Sin. 2016, 36, 1197–1204. Available online: http://geoscien.neigae.ac.cn/EN/Y2016/V36/I8/1197 (accessed on 25 July 2021).
  39. Bhattachan, A.; Emanuel, R.E.; Ardón, M.; Bernhardt, E.S.; Anderson, S.M.; Stillwagon, M.G.; Ury, E.A.; BenDor, T.K.; Wright, J.P. Evaluating the effects of land-use change and future climate change on vulnerability of coastal landscapes to saltwater intrusion. Elem. Sci. Anthrop. 2018, 6, 62. [Google Scholar] [CrossRef]
  40. Zhang, B.; Zhang, Q.; Feng, C.; Feng, Q.; Zhang, S. Understanding Land Use and Land Cover Dynamics from 1976 to 2014 in Yellow River Delta. Land 2017, 6, 20. [Google Scholar] [CrossRef]
  41. Xu, N.; Gao, Z.Q.; Ning, J.C. Analysis of the characteristics and causes of coastline variation in the Bohai Rim (1980–2010). Environ. Earth Sci. 2016, 75, 719. [Google Scholar] [CrossRef]
  42. Fan, J.; Wang, Q.; Wang, Y.F.; Chen, D.; Zhou, K. Assessment of coastal development policy based on simulating a sustainable land-use scenario for Liaoning Coastal Zone in China. Land Degrad Dev. 2018, 29, 2390–2402. [Google Scholar] [CrossRef]
  43. Meng, W.Q.; Hu, B.B.; He, M.X.; Liu, B.Q.; Mo, X.Q.; Li, H.Y.; Wang, Z.L.; Zhang, Y. Temporal-spatial variations and driving factors analysis of coastal reclamation in China. Estuar. Coast. Shelf Sci. 2017, 191, 39–49. [Google Scholar] [CrossRef]
  44. Yasir, M.; Sheng, H.; Fan, H.; Nazir, S.; Niang, A.J.; Salauddin, M.; Khan, S. Automatic Coastline Extraction and Changes Analysis Using Remote Sensing and GIS Technology. IEEE Access 2020, 8, 180156–180170. [Google Scholar] [CrossRef]
  45. Liu, W.L.; Zhang, L.B.; Zhu, J.H. Prediction and Analysis of Land-Use and Land-Cover Change in Liaoning Coastal Economic Zone, China. In Applied Mechanics and Materials; Trans Tech Publications Ltd.: Zurich, Switzerland, 2011; Volume 71, pp. 4430–4434. [Google Scholar]
  46. Zhu, G.R.; Xie, Z.L.; Xu, H.L.; Liang, M.X.; Cheng, J.X.; Gao, Y.J.; Zhang, L.G. Land reclamation pattern and environmental regulation guidelines for port clusters in the Bohai Sea, China. PLoS ONE 2021, 16, e0259516. [Google Scholar] [CrossRef] [PubMed]
  47. Zhu, L.H.; Wu, J.Z.; Xu, Z.Q.; Xu, Y.C.; Lin, J.; Hu, R.J. Coastline movement and change along the Bohai Sea from 1987 to 2012. J. Appl. Remote Sens. 2014, 8, 083585. [Google Scholar] [CrossRef]
  48. Ding, Z.; Su, F.Z.; Zhang, J.J.; Zhang, Y.; Luo, S.C.; Tang, X.G. Clustering Coastal Land Use Sequence Patterns along the Sea-Land Direction: A Case Study in the Coastal Zone of Bohai Bay and the Yellow River Delta, China. Remote Sens. 2019, 11, 2024. [Google Scholar] [CrossRef]
  49. Li, Z.Y.; Luan, W.X.; Zhang, Z.C.; Su, M. Relationship between urban construction land expansion and population/economic growth in Liaoning Province, China. Land Use Policy 2020, 99, 105022. [Google Scholar] [CrossRef]
  50. Shen, M.H.; Yang, Y.L. The Water Pollution Policy Regime Shift and Boundary Pollution: Evidence from the Change of Water Pollution Levels in China. Sustainability 2017, 9, 1469. [Google Scholar] [CrossRef]
  51. Zhu, G.; Xie, Z.; Xie, H.; Li, T.; Gu, X.; Xu, X. Land-sea integration of environmental regulation of land use/land cover change—A case study of Bohai Bay, China. Ocean Coast. Manag. 2018, 151, 109–117. [Google Scholar] [CrossRef]
  52. Wang, L.; Lee, F.S.C.; Wang, X.R.; Yin, Y.F.; Li, J.R. Chemical characteristics and source implications of petroleum hydrocarbon contaminants in the sediments near major drainage outfalls along the coastal of Laizhou Bay, Bohai Sea, China. Environ. Monit. Assess. 2007, 125, 229–237. [Google Scholar] [CrossRef]
  53. Han, Q.F.; Song, C.; Sun, X.; Zhao, S.; Wang, S.G. Spatiotemporal distribution, source apportionment and combined pollution of antibiotics in natural waters adjacent to mariculture areas in the Laizhou Bay, Bohai Sea. Chemosphere 2021, 279, 130381. [Google Scholar] [CrossRef]
  54. Ding, Y.M.; Wei, H. Modeling the impact of land reclamation on storm surges in Bohai Sea, China. Nat. Hazards 2017, 85, 559–573. [Google Scholar] [CrossRef]
  55. Sasaki, T.; Furukawa, T.; Iwasaki, Y.; Seto, M.; Mori, A.S. Perspectives for ecosystem management based on ecosystem resilience and ecological thresholds against multiple and stochastic disturbances. Ecol. Indic. 2015, 57, 395–408. [Google Scholar] [CrossRef]
  56. Wang, W.; Liu, H.I.; Li, Y.Q.; Su, J.L. Development and management of land reclamation in China. Ocean Coast. Manag. 2014, 102, 415–425. [Google Scholar] [CrossRef]
  57. Yin, H.Y.; Hu, Y.M.; Liu, M.; Li, C.L.; Chang, Y. Evolutions of 30-Year Spatio-Temporal Distribution and Influencing Factors of Suaeda salsa in Bohai Bay, China. Remote Sens. 2022, 14, 138. [Google Scholar] [CrossRef]
  58. Chang, M.X.; Li, P.; Li, Z.H.; Wang, H.J. Mapping Tidal Flats of the Bohai and Yellow Seas Using Time Series Sentinel-2 Images and Google Earth Engine. Remote Sens. 2022, 14, 1789. [Google Scholar] [CrossRef]
  59. Ma, T.T.; Li, X.W.; Bai, J.H.; Cui, B.S. Habitat modification in relation to coastal reclamation and its impacts on waterbirds along China’s coast. Glob. Ecol. Conserv. 2019, 17, e00585. [Google Scholar] [CrossRef]
  60. Zhai, T.L.; Wang, J.; Fang, Y.; Qin, Y.; Huang, L.Y.; Chen, Y. Assessing ecological risks caused by human activities in rapid urbanization coastal areas: Towards an integrated approach to determining key areas of terrestrial—Oceanic ecosystems preservation and restoration. Sci. Total Environ. 2020, 708, 135153. [Google Scholar] [CrossRef] [PubMed]
  61. Xu, X.G.; Li, X.; Chen, M.C.; Li, X.Y.; Duan, X.F.; Zhu, G.R.; Feng, Z.; Ma, Z.G. Land-ocean-human interactions in intensively developing coastal zone: Demonstration of case studies. Ocean Coast. Manag. 2016, 133, 28–36. [Google Scholar] [CrossRef]
  62. Chen, W.G.; Wang, D.C.; Huang, Y.; Chen, L.D.; Zhang, L.H.; Wei, X.W.; Sang, M.Q.; Wang, F.C.; Liu, J.Y.; Hu, B.X. Monitoring and analysis of coastal reclamation from 1995–2015 in Tianjin Binhai New Area, China. Sci. Rep. 2017, 7, 3850. [Google Scholar] [CrossRef]
  63. Cai, H.L.; Li, C.M.; Luan, X.K.; Ai, B.; Yan, L.Y.; Wen, Z. Analysis of the spatiotemporal evolution of the coastline of Jiaozhou Bay and its driving factors. Ocean Coast. Manag. 2022, 226, 106246. [Google Scholar] [CrossRef]
  64. Guo, Z.L.; Zhang, M.Y. The conservation efficacy of coastal wetlands in China based on landscape development and stress. Ocean Coast. Manag. 2019, 175, 70–78. [Google Scholar] [CrossRef]
Figure 1. Overview map of the study area.
Land 11 01291 g001
Figure 2. Technology flowchart of long-time-series land-use function classification, coastline changes detection, and eco-environmental effect evaluation.
Land 11 01291 g002
Figure 3. Results of long-time-series coastal zone function classification.
Land 11 01291 g003
Figure 4. (a) Distribution of changes in coastline morphology in the circum-Bohai coastal zone during 1987–2020; (b) distribution of changes in coastline morphology in the circum-Bohai coastal zone during 1987–2003; (c) distribution of changes in coastline morphology in the circum-Bohai coastal zone during 2003–2011; (d) distribution of changes in coastline morphology in the circum-Bohai coastal zone during 2011–2020.
Land 11 01291 g004
Figure 5. Distribution of changes in coastline function in the circum-Bohai coastal zone and comparison of land use change.
Land 11 01291 g005
Figure 6. Environmental effects of long-time-series changes in the coastline: (a) overall water quality changes; (b) surface water quality classes in coastal districts and counties; (c) coupling coastline migration rates with changes in water quality.
Land 11 01291 g006
Figure 7. Ecological effects of coastline changes in the Bohai Sea coastal zone (2000–2020): (a) coupling of coastline migration rate and ecological land loss; (b) changes in total ecological losses; (c) loss of seawater ecological land.
Land 11 01291 g007
Table 1. ICFC classification degree.
DegreeIIIIIIIVV
ICFC<0.050.05–0.10.1–0.150.15–0.2>0.2
Publisher’s Note: MDPI stays neutral with regard to jurisdictional claims in published maps and institutional affiliations.

