Article

Assessing Changes in Ecosystem Service Values over 1985–2050 in Response to Land Use and Land Cover Dynamics in Abaya-Chamo Basin, Southern Ethiopia

by
Ashebir Woldeyohannes
1,*,
Marc Cotter
1,
Wubneshe Dessalegn Biru
2 and
Girma Kelboro
3
1
Management of Crop Water Stress in the Tropics and Subtropics (490g), Institute of Agricultural Sciences in the Tropics (Hans-Ruthenberg-Institute) (490), University of Hohenheim, 70599 Stuttgart, Germany
2
Rural Development Theory and Policy (490a), Institute of Agricultural Sciences in the Tropics (Hans-Ruthenberg-Institute) (490), University of Hohenheim, 70599 Stuttgart, Germany
3
Center for Development Research (ZEF), University of Bonn, 53113 Bonn, Germany
*
Author to whom correspondence should be addressed.
Submission received: 23 December 2019 / Revised: 20 January 2020 / Accepted: 21 January 2020 / Published: 27 January 2020
(This article belongs to the Special Issue Exploring the Relationships between Land Use and Ecosystem Services)

Abstract

:
This study evaluated the effect of Land Use and Land Cover (LULC) dynamics on the value of ecosystem services in Abaya-Chamo basin over 1985–2050. The main objectives of the study were to estimate the value of ecosystem services of Abaya-Chamo basin using local and global ecosystem service value coefficients, assess how it changes over time, and develop tools to inform policy and public decision-making to protect lands and waters in the region. The study utilized observed (1985 and 2010) and predicted (2030 and 2050) LULC datasets and ecosystem service value coefficients obtained from publications in peer-reviewed scientific journals. The results indicated that the total ecosystem service value of Abaya-Chamo basin was 12.13 billion USD in 1985 and 12.45 billion USD in 2010. The value is predicted to increase to 12.47 billion USD by the year 2050, which is 2.84% (344.5 million USD) higher than the total value of ecosystem services of the basin in 1985. Although the total ecosystem service value of the basin showed a slight increase over the study period, it was observed that the total value of services obtained from natural ecosystems is expected to decline by 36.24% between 1985 and 2050. The losses of services obtained from natural ecosystems, such as water regulation and erosion control, are major concern as the consequence has already been reported in the basin in the form of reduced water quality and productivity of the lakes due to an increased soil erosion and sediment transport in the basin. Therefore, special attention should be given to the rehabilitation of degraded ecosystems and the protection of remaining natural vegetation and water bodies to enhance natural capital and ecosystem services in the basin. A large-scale dissemination of eco-agricultural land use practices, which provide multiple ecosystem services (such as agroforestry and heterogeneous agricultural areas) in the basin, needs to be considered in the future.

1. Introduction

Ecosystem services (ESS) represent direct or indirect benefits human beings can derive from ecosystem functions that are essential for their survival, livelihoods, and wellbeing [1,2,3]. The direct benefits include provisioning, regulating, and cultural services which affect human well-being in the short term, whereas the indirect benefits include supporting services which affect human well-being in the long term through sustaining the production of the other services [1,3]. The capacity of ecosystems to continuously provide these services depend on natural and human-induced driving factors that can cause a change in the ecosystems [3,4,5]. During the last few decades, human activities have substantially altered, destroyed, or transformed natural ecosystems in many regions in the world [6,7,8,9,10,11]. Despite worldwide conservation efforts, areas covered by native grasslands, forests, and wetlands are continuously replaced by croplands, tree plantations, and urban areas, and only a few landscapes remain relatively undisturbed globally [12,13,14]. Such changes can have a large impact on status of the world’s ecosystems and the services they can provide [13,15,16,17,18]. For instance, the conversion of forest or grassland into farmland can increase the provision of food production at the expense of land capacity for carbon sequestration, indicating ecological degradation [18]. The changes can also significantly reduce the value of ESS over time by replacing high value per ha biomes with that of low value per ha biomes [12,16]. Costanza et al. [12] reported the reduction of the global value of ESS by 4.3–20.2 trillion USD per year over the period of 1997–2011 due to Land Use and Land Cover (LULC) change. However, this change is not felt uniformly in all areas; rather, it varies from region to region and fluctuates over time, either increases or decreases, depending on the direction and intensity of ecosystem changes, as well as local socio-ecological context, of a particular region. For example, Arowolo et al. [19] reported an increase in the total value of ESS in Nigeria between 2000 and 2010, whereas Song and Deng [20] reported a decrease in the total value of ESS in China between 1988 and 2008. Therefore, measuring changes in the value of ESS in response to LULC change in the local context is very crucial to influence land use planning and decision-making in favor of the conservation of ecosystems and their services [21,22,23,24].
In the past few decades, rapid population growth and rising demand for food in Ethiopia have led to a considerable expansion of cropland at the expense of forest, shrubland/woodlands and grasslands in various part of the country [25,26,27,28,29,30,31]. More than 23 million ha of forest and shrubland/woodlands were cleared since the second half of the twentieth century to make way for agricultural production in the country [32]. More recent case studies from different parts of Ethiopia have indicated that the conversion of natural ecosystems to settlement and cultivated land is continuing at an increasing trend [28,29,30,33,34]. This trend is expected to continue in the future as rapid population growth and declining average farm size per capita in the country further drive the expansion of cultivated land into areas covered by forest, shrubland, grassland, and wetland [35]. According to the Food and Agriculture Organization of the United Nations (FAO) [36], for example, the forest cover of Ethiopia decreased from 30% to 11% just in twenty years (between 1990 and 2010), mainly due to the expansion of cultivated land in the country. The conversion of grassland to cultivated land and settlement areas are also reported throughout the country [25,37]. Such changes have considerably impacted the provision of ESS and biodiversity conservation efforts in the country. For example, Kindu et al. [21] reported the loss of ESS in Munessa-Shashemene landscape of the Ethiopian highlands valued between 19.3 million USD to 45.9 million USD in the four decades between 1973 and 2012. Gashaw et al. [38] also reported the reduction of the value of ESS in Andassa watershed in the Upper Blue Nile basin from 26.83 million USD in 1985 to 22.58 million USD in 2000, due to LULC change. Similarly, Tolessa et al. [39] reported a loss of the value of ESS in the central highlands of Ethiopia from 1973 to 2015, mainly due to forest cover change in the area. On the contrary, there are also case studies indicating the expansion of open grassland, reforestation and natural forest regrowth in some parts of the country as a result of the combined government, community, and non-governmental organizations (NGOs) interventions [26,40].
There is a growing worldwide concern on how to reduce the harmful effects LULC change on the natural ecosystems and the services they are providing. A lot of efforts have been made by research communities all over the world to better understand, model, value, and manage ESS [12]. In this regard, valuation of ESS is very successful in raising awareness and influencing policy and decision-making by providing an easily comprehensible measure about the true value of ESS to make ecosystems and biodiversity conservation justifications and priorities [1,17,23,41,42]. It has also enabled more efficient land use planning, provided guidance to payments for ecosystem services, and stimulated subsequent research and applications [12,43,44,45]. Despite a significant number of studies on LULC change and driving forces in Ethiopia, efforts to quantitatively assess the impact of LULC change on a wide range of ESS are seldom attempted in the country. A few recent studies, by Kindu et al. [21], Tolessa et al. [39,46], and Gashaw [38], are mainly concentrated in the central highlands of the country.
Assessing the effects of LULC change on the values of ESS requires aggregate values over larger spatial and temporal scales, and multiple approaches are available in literature to do so [12]. These include basic benefit (value) transfer method (BTM), expert modified value transfer, statistical value transfer, and spatially explicit functional modeling [12,47]. Despite uncertainties and limitations surrounding BTM and the ensuing criticism [48], the method has been widely used in several studies due to its ability to facilitate faster assessment in areas where site-specific valuation information is absent or when there are time and budget constraints to complete original valuation studies for a large number of ESS over a large area [12,21,47]. BTM involves obtaining unit value coefficients and other information for service types of current study in question from the analysis of a single study or groups of studies that have been previously carried out in other, similar settings [1,47]. The BTA is seen as a suitable method for assessing LULC impact studies for countries in Africa, where primary valuation information is scarce and rapid LULC change has significant impacts on ecosystem and biodiversity. This is also true for our study region, Abaya-Chamo Basin (ACB), where rapid expansion of agricultural and irrigation activities in the landscape altered the capacity of the basins’ ecosystem to deliver a wide range of services. In the years between 1985 and 2010, for example, 32.8% of ACB’s landscape replaced by cropland and the remaining natural vegetation has become more fragmented and formed small and isolated patches, indicating environmental degradation. Both arable land and shrubland were the dominant LULC classes that account for almost half of the landscape of the basin in 1985. However, the situation has changed, and arable land solely dominated the landscape and became a major LULC type of the basin in 2010. These changes have affected the basin’s ecosystem functions and flow of services, both of which affect the livelihood of the people living in the basin [30]. Despite being regionally significant, research in the ACB so far has been focused mainly on the area of biodiversity, LULC change, and water management. Understanding the impacts of LULC change on ESS and its implication for human wellbeing in the basin have not been explored. In this study, we quantified and valued the changes in ESS in response to LULC change in the rapidly changing landscape of ACB to raise awareness and improved decision-making for better management of the basin. We also compared the local and global ecosystem service value coefficients and assessed how the coefficients influence the total ecosystem service values (ESVs) of the basin. Thus, we first assess the impact LULC changes on the value of ESS in the basin between 1985 and 2010 and then predict the trend until 2050.

2. Materials and Methods
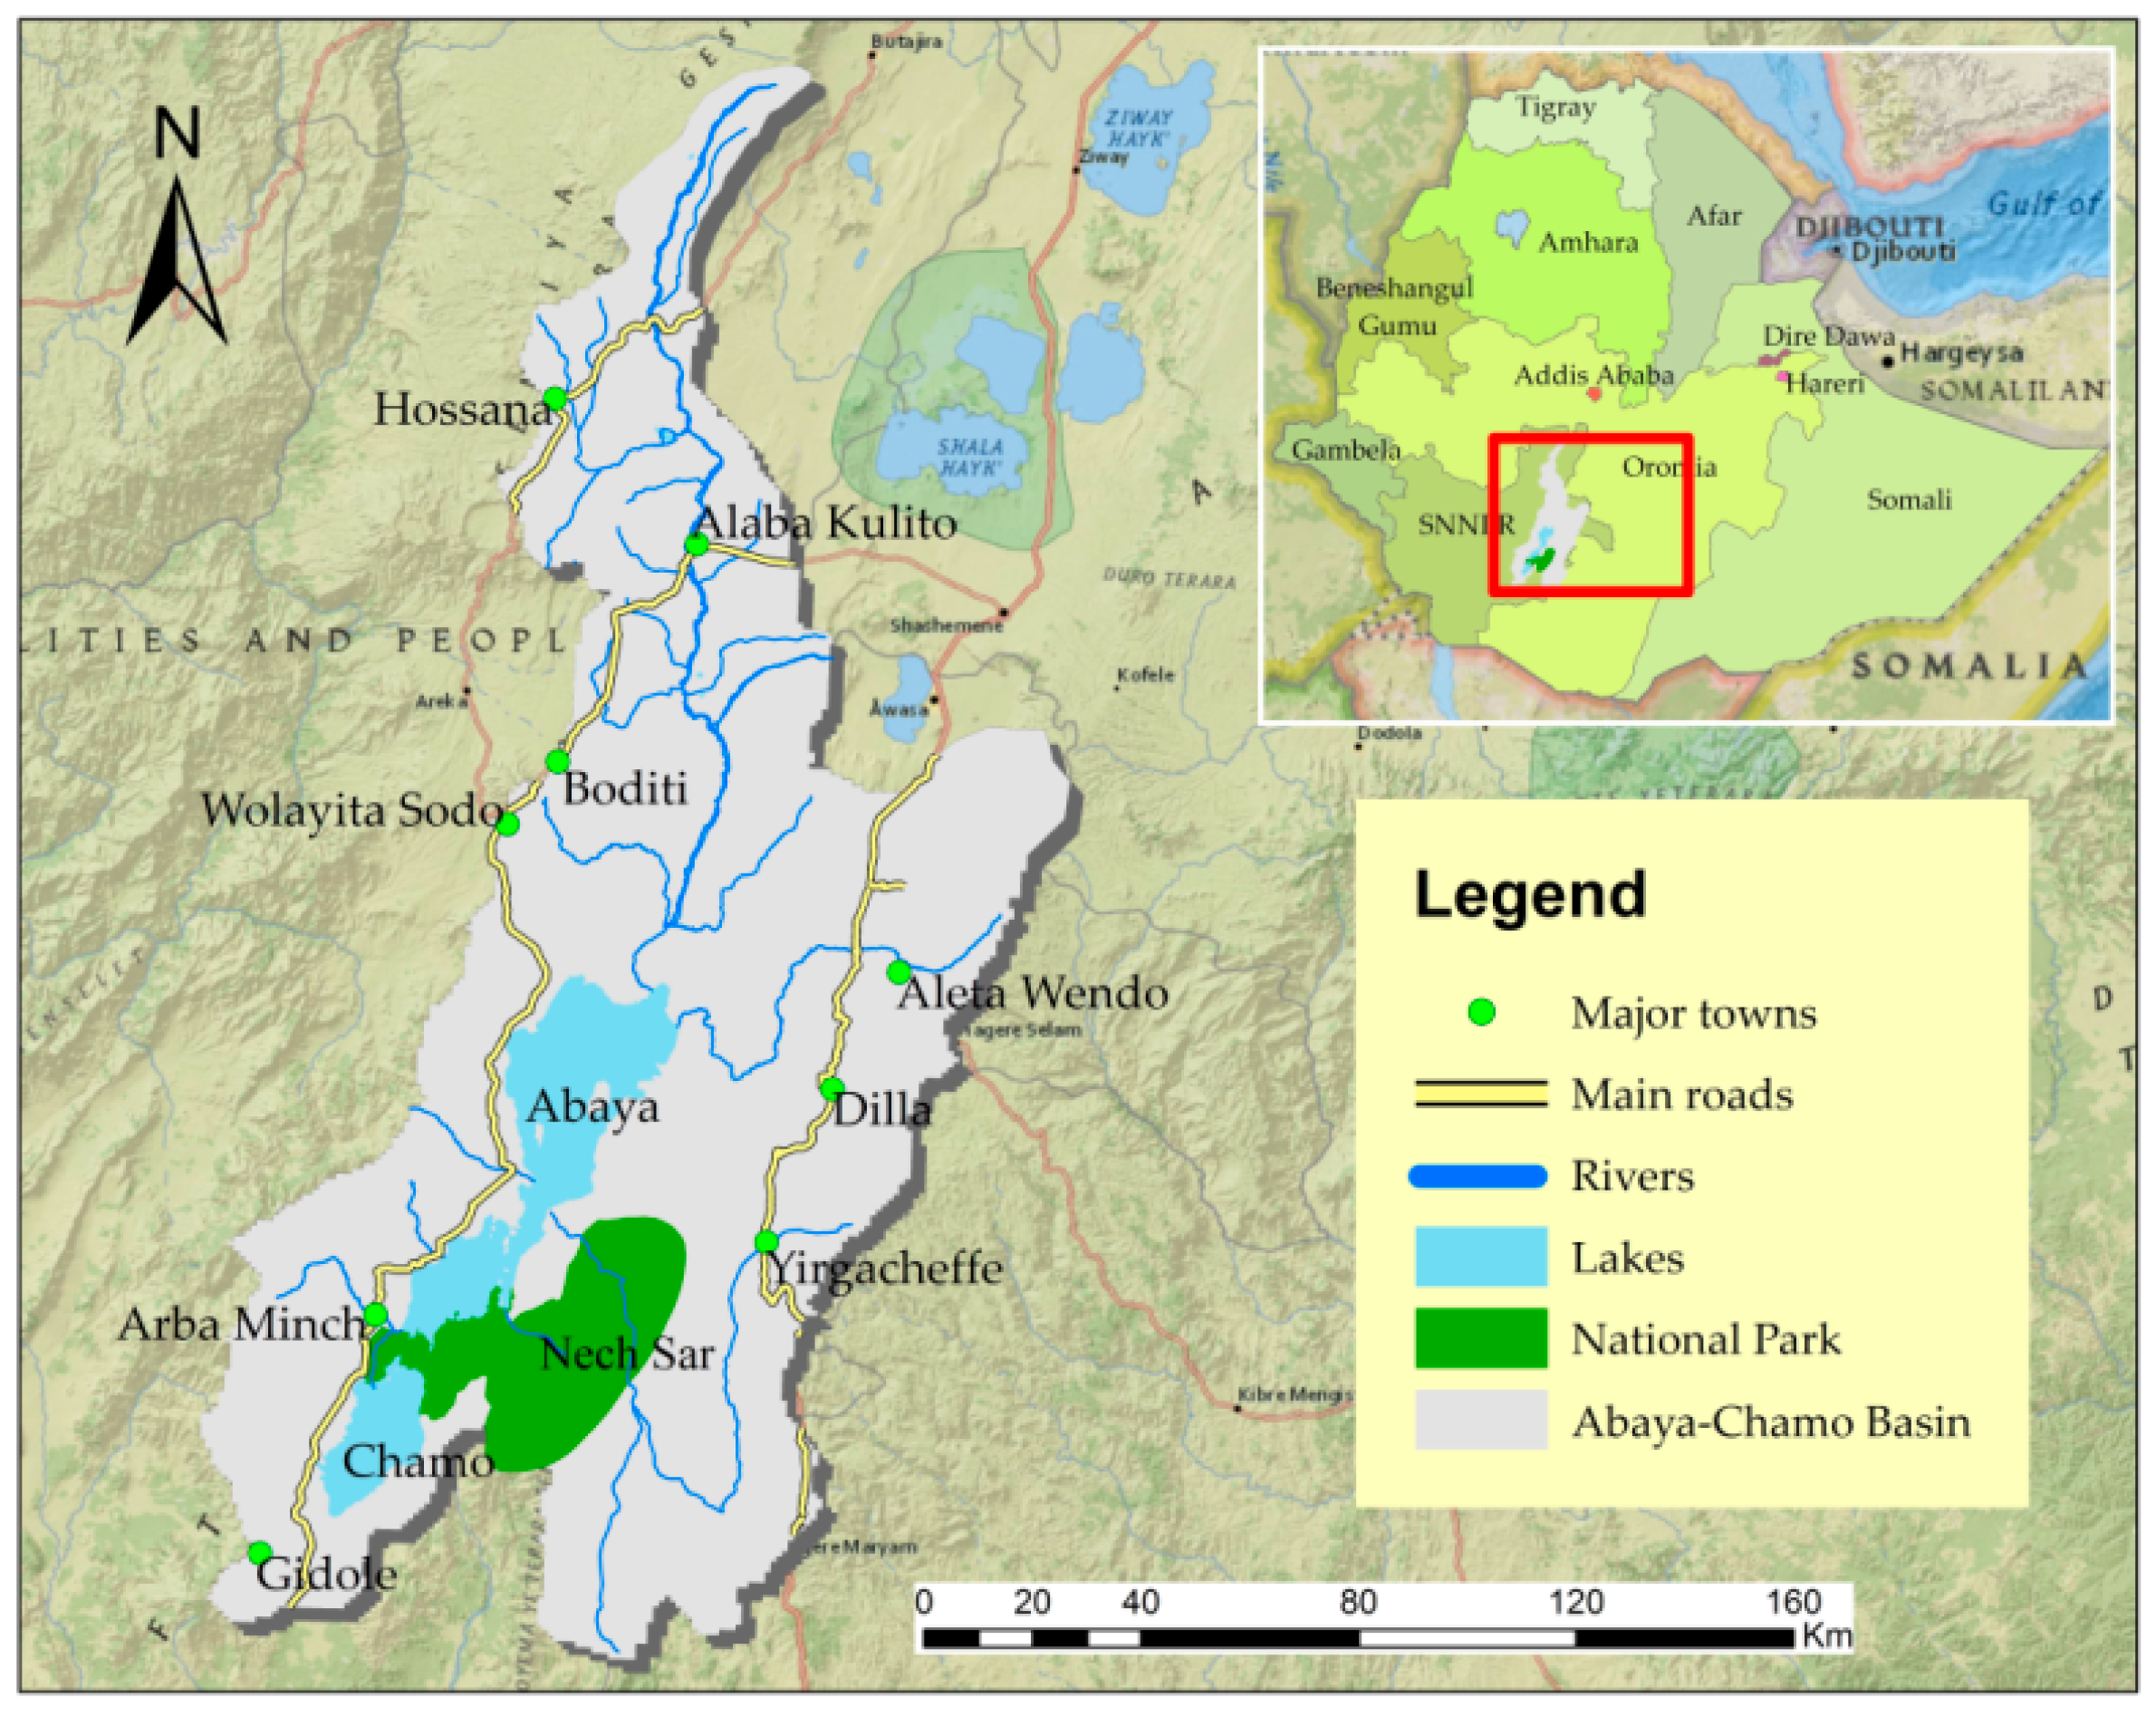
2.1. Study Area

The study was conducted in ACB in Southern Ethiopia. The basin covers the southern section of the Main Ethiopian Rift (MER) and adjacent highlands predominantly found in the Southern Nations, Nationalities, and Peoples’ (SNNP) Region and, to a lesser extent, in the Oromia Region. The basin is geographically located between 5° to 8° N and 37° to 38.5° E and covers a surface area of about 18,600 square km, including freshwater bodies. ACB is characterized by big vertical differences over short distances, which ranges from 1082 m above sea level (m.a.s.l.) near the lakeshore in the rift floor to above 3500 m.a.s.l. in the basaltic highlands bordering the rift to east and west [49,50]. ACB is mainly dominated by a humid climate in the highlands and a hot semi-arid tropical climate in the lowlands with mean annual rainfall and temperature ranging from 665 mm to 1240 mm and 8.8 °C to 31.2 °C, respectively. The climate is further characterized by a bimodal rainfall pattern with peaks from end-March to mid-Jun and from mid-September to late-November [51,52]. The high altitude area of the basin receives higher precipitation as compared to the lower altitude areas located in the rift floor [53]. As a result, savannah and deciduous woody vegetation cover types are the most dominant land cover types in the lower altitude parts of the basin, whereas tropical mountain rainforests are the most dominant cover type in the high altitude parts of the basin [54].
The basin encompasses one national park (Nech Sar National Park), two big low-lying lakes (Lake Abaya and Lake Chamo) and three other crater lakes, numerous rivers and seasonal streams which drain into the lakes (Figure 1). The lakes are used for transportation, fishery, and tourism, whereas the rivers and their tributaries are extensively used for drinking water provision and irrigation of agricultural lands in the lowland areas. Smallholder mixed farming is the dominant agricultural practice in the basin with Enset-coffee agroforestry and cereal farming being the most common agricultural land use types. There are also large commercial and state farms in the lowland areas of the basin.
The basin is home for more than 10 ethnic groups of the country and based on the 2007–2037 population projection for Ethiopia, more than 5 million people will inhabit the basin by 2020 [55].

2.2. Data Sources

The datasets required for this study were obtained from various sources. The observed (1985 and 2010) LULC dataset used in this study were obtained from Woldeyohannes et al. [30], whereas the simulated LULC dataset was created using statistical inference method and Cellular Automata (CA) allocation approaches. As it is briefly indicated in Woldeyohannes et al. [30], the observed dataset was generated from Landsat imageries by employing a pixel-based supervised image classification method. Post-classification refinement was applied to enhance the classification accuracy of the final LULC maps. The datasets included statistics of nine LULC types for the years 1985 and 2010 with a spatial resolution of 30 m and overall accuracies of 85.58% and 87.73%, respectively. The LULC nomenclature was adopted from the expanded CORINE (the Coordination of Information on the Environment) land cover classification with some modification to capture the local characteristics. Details regarding the methodology and results of the study can be found in Woldeyohannes et al. [30].

2.3. LULC Simulation

We used both statistical inference method and a Cellular Automata (CA) allocation approaches implemented in DINAMICA EGO software (hereafter DINAMICA) version 4.0.11 [56] to simulate the LULC of ACB for 2030 and 2050. DINAMICA uses a statistical inference method to estimate the probability of conversion among LULC categories under a set of explanatory variables and observations of past LULC change, while the spatial patterns of the change of LULC categories are produced by CA rule. The rule is composed of CA transition functions called the expander and the patcher, which are designed to expand previously formed patches and determine the best locations to generate new patches using a seeding algorithm, respectively [56,57]. The likelihood that each individual cell changes from one LULC to another under the impacts of natural and socio-economic factors is determined by transition probability. The probability is determined by employing the Weights of Evidence method, which is a statistical inference method (Bayesian method) traditionally used in geological applications [56]. The method estimates the transition potential of each LULC types based on a set of explanatory variables. We considered the following initial explanatory variables based on the previous studies in the area [30,58] and those commonly used in similar studies conducted elsewhere to calculate Weights of Evidence coefficient: (1) population density; (2) distance from urban areas; (3) distance from the main roads; (4) distance from a water source; (5) slope; (6) elevation; (7) park boundary; (8) average rainfall of the area; and (9) distance to agricultural area. The CA approach in DINAMICA allows users to set or edit parameters to control mean patch size and patch size variance that govern the specific transition of LULC classes, thereby, it can be converted from purely automatic to trends-driven approach [59]. The model also provides tools for model validation. Detail descriptions of the software and the processes can be found in DINAMICA guidebook [56,60].
As a freeware modeling platform for environmental modeling, DINAMICA has been applied in a variety of studies, including agricultural expansion and deforestation at different scales in the tropics [61,62,63,64,65], urban growth and dynamics [57,66], and biodiversity and ecosystem service studies [59,67,68,69].
DINAMICA requires the creation of one model that can be divided into a series of distinct steps, which can be grouped in to calibration, run and validation phases. The model calibration was carried out using Woldeyohannes et al.’s [30] LULC maps from 1985 and 2010, as well as physiographic, environmental, and socio-economic drivers that change and influence the spatial patterns of LULC in the basin. We assumed the continuation of exogenous factors driving LULC change in the basin during the 25-year period (1985 to 2010) into the future. We also assumed that the national park boundary will remain the same, and the current restriction of human settlement and agricultural activates inside the park will continue in the future. Although modeling future LULC dynamics under a set of climatic and socio-economic scenarios is a common trend in most recent scientific researches which explore alternative land management strategies, we did not consider a scenario-based analysis in this study due to the absence of socio-economic scenarios that were developed by stakeholders for the basin.
We evaluated the performance of the model by comparing the simulated LULC map with that of observed LULC map of the year 2010 using fuzzy similarity test implemented in DINAMICA. Fuzzy similarity test calculate the accuracy of each pixel by comparing it value within a neighborhood context [70]. We run the fuzzy similarity test using a constant decay function by varying window sizes starting from 1 × 1 pixel to 19 × 19 pixels, with an increment of two. The validation result indicated that the simulation has reached a similarity fitness value of 43.2% when it was tested in 1 × 1 window size and 91.3% when the test window size was expanded to 19 × 19 pixels. The accuracy of the model reached more than 80% at window size 7 × 7 pixels. After calibration and validation of the model, the simulation was run for the year 2030 and 2050 using the 2010 LULC map of the study area as the initial year, keeping the parameters obtained during the calibration the same.

2.4. Assignment of Ecosystem Service Values

The changes in ESV in the basin between 1985 and 2050 were determined using the observed and predicted LULC data of the study basin and BTM-based unit value coefficient (in 2007 USD ha−1 year−1) of the equivalent biomes obtained from Costanza et al. [12]. Locally adapted value coefficients [21] were also used for comparison purpose. Costanza et al. [1] first proposed a global model to assess the economic value of 17 ESS for 16 biomes. Taking the advantage of several new studies published in peer-reviewed scientific journals after 1997, Costanza et al. [12] updated their previous unit value estimates in 2014. The updates have complete estimates of the unit values of ESS per ha for many ecosystem service types as well as new service values for previously unrecognized services as a result of better understanding of the multiple services provided by ecosystems. As it is indicated in Table 1, our LULC categories are not perfectly aligned with the reference biomes. Therefore, we made an adjustment by associating all the 9 LULC types of our study area with that of the 16 biomes identified by Costanza et al. [12] to get the nearest equivalent biome to be used as a proxy, and then coefficients were assigned accordingly. We assumed that they provide similar ESS with the LULC in our context at the local scale. Many similar studies also used the same approach to determine the value of ESS in their respective study regions [12,19,21,39]. In our case, cropland biome was used as a proxy for arable land and heterogeneous agricultural areas; tropical forest for forests, shrubland, and coffee agroforestry; grassland/rangeland for natural grassland; lakes/rivers for inland waters; swamps/floodplains for inland wetlands; and urban for built-up areas (Table 1 and Table 2).
Coffee agroforestry (also called Enset-coffee) is a highly multifunctional cropping system, mainly dominated by Enset (Ensete ventricosum), Coffee (Coffea arabica), and fruit trees, such as Mango (Mangifera indica) and Avocado (Persea americana), in the middle story and Cordia africana (locally called Wanza), Millettia ferruginea (locally called Berebera), Albizia gummifera (locally called Sessa or Lebbek), and other broad leaved trees in the upper story. The lower story is often occupied by annual crops, such as roots and tubers, spices, and herbs. The coffee agroforestry system in the study area is managed organically and provides a significantly higher food production service than the equivalent forest biome [71]. Similarly, heterogeneous agricultural area represented by annual crops mixed with permanent crops and some woody vegetation usually eucalyptus trees used as woodlot and farm boundary planting. This land use type is assumed to provide more diverse ESS (for example, greenhouse gases regulation, erosion control) than the represented cropland biome. In our study basin, built-up areas were less urbanized and contain less impervious surfaces and aggregated buildings than the representative urban biome. Thus, built-up areas are expected to provide better ESS, such as erosion control and nutrient cycling, than the representative urban biome. Shrubland in our study area represented by bush or shrub-dominated land, often with scattered trees and lower range grasses. Though shrubland has less canopy cover than tropical forest biome, on a local scale, the shrubland ecosystem provides ESS similar to those described in Costanza et al. [1].
Kindu et al. [21] adapted the global ESV coefficients of Costanza et al. [1] for the Ethiopian condition through information obtained mainly from expert knowledge and the Economics of Ecosystems and Biodiversity (TEEB) valuation database. Unlike Costanza et al. [12], Kindu et al. [21] considered values only from tropical areas to determine per unit value coefficients for ESS provided by each LULC types. Based on the descriptions provided in Kindu et al. [21], in this study, coefficients were assigned to similar or nearest equivalent LULC categories (Table 1 and Table 2). In the absence of similar or nearest equivalent land cover, our own estimate was used (Table 1 and Table 2).
Apart from the apparent difference in spatial scale between Costanza et al. [12] and Kindu et al.’s [21] studies, there are also some differences on the type and number of functions and flow of services they considered under each ecosystems for the evaluation purposes. For example, Kindu et al. [21] considered only three types of ESS provided by cropland ecosystem to estimate its total service value, whereas Costanza et al. [12] considered eleven types of services provided by cropland ecosystem to estimate its total service value (Table 2). Kindu et al. [21] also assigned default value zero for the ecosystem service value of urban/settlement due to lack of relevant data, whereas Costanza et al. [12] assigned an economic value for it by considering three kind of services provided by the urban/settlement ecosystem (Table 2).

2.5. Estimation of Ecosystem Service Values

Taking the assessment model proposed by Costanza et al. [1] as a basis, estimation of ESV of LULC type “ k ” ( ESV K ) at the reference year “ t ” was carried out by multiplying the area of each LULC type at the reference year “t” by its corresponding value coefficients ( VC k ) as follows:
ESV kt = ( A kt × VC k )
where: A k is in ha and VC k is in 2007 USD ha−1 year−1
The total ESV of the basin for a reference year “t” ( ESV Tt ) was calculated by summing the ESV of each LULC categories as follows:
ESV Tt = Σ ( ESV kt )
The change in ESV over time was assessed using the formula:
Percentage ESV change = ESV t 2 ESV t 1 ESV t 1 × 100
In addition to this, the impact of LULC change on the value of individual ecosystem service type “ f ” ( ESV f ) was estimated to find out the most affected ecosystems services in the base.
ESV f = k ( A k × VC kf )

3. Results

3.1. The Observed and Projected LULC Changes in ACB

The spatial distributions of the observed and projected LULC patterns of ACB and their changes are presented in Table 3 and Figure 2. As it was reported by Woldeyohannes [30], the landscape of ACB has changed significantly during the past 25 years between 1985 and 2010. The basin was mainly characterized by a rapid expansion of arable land at the expanse of shrubland and natural grassland during the first period of 1985–2010. Arable land and shrubland represented the dominant LULC types, which covers 23.4% and 23.3% of the total area of the basin in 1985, respectively. However, the situation was changed through time as arable land increased substantially in the landscape and became the most dominant LULC type covering a higher proportion (37% of the total area) than shrubland in 2010. From 1985 to 2010, built-up areas increased at a much higher rate than any other LULC classes, though covering a smaller proportion of the total area of the basin. Shrubland and natural grassland were the two LULC types which showed the largest and rapid spatial reduction in the basin between 1985 and 2010. Inland wetlands also increased, whereas inland waters, forests, and coffee agroforestry remained unchanged in the same period (Table 3 and Figure 2).
The LULC pattern of the basin presented a certain spatial heterogeneity between 1985 and 2010: agriculture was the dominated land use type in the highland, whereas inland water bodies (mainly the lakes) and natural vegetation land cover types concentrated mainly in the lowlands (Figure 2a,b). Heterogeneous agricultural areas dominated the northern and western areas of the basin, whereas coffee agroforestry primarily dominated the eastern highlands of the basin (Figure 2a,b). Arable land widely distributed across the entire basins covering from highland to lowland areas. Forest, shrubland, natural grassland, and inland wetlands covered the lowland areas of the central and southern part of the basin, and as a result, most LULC changes that took place between 1985 and 2010 mainly concentrated in these parts of the basin.
The simulation result also indicates a substantial LULC change in the basin by the year 2050 with rapid growths in arable land and built-up areas and the losses of forests, shrubland and natural grassland (Table 3 and Figure 2c,d). If the current and historical trend of LULC changes in the basin persists into the future, arable land is predicted to account 44.5% of the basin by the year 2030 and 49.1% by the year 2050, whereas forest, shrubland, and natural grassland are projected to reduce to 0.24%, 11.5%, and 6.55% in 2050 from 2.78%, 23.4%, and 16.7% in 1985, respectively (Table 3). Given the current distribution of non-agricultural areas in the basin, the future trend of arable land expansion will likely to be along the direction of lowlands and mountainous areas of the basin (mainly outside the Nech Sar National Park) by replacing the remaining forest, shrubland, and natural grassland areas. Though it covers a much smaller proportion in the basin, built-up areas are also projected to have a large increase in the future.

3.2. Estimated Changes in the Total Ecosystem Service Values

We used the observed and simulated LULC of ACB and global unit value coefficients published by Costanza et al. [12] to estimate the total ESV of the basin and its change over time (Table 4). Based on global unit value coefficients, the total ESV of the basin was estimated at 12.13 billion USD in 1985, and 12.45 billion USD in 2010 (Table 4). The value is predicted to further increase to 12.47 billion USD in 2050, which is about 2.83% higher than the total value of ESS in 1985. The ESV of arable land was the highest among all LULC categories of the basin, which makes up 20.45% and 31.69% of the total ESV of the basin in 1985 and 2010, respectively. The contribution of arable land to the total ESVs of the basin is projected to further increase to 38.19% in 2030 and 41.95% in 2050. At the beginning of the study period (1985), the ESV of shrubland was comparable with that of arable land, which was 2.41 billion USD (19.87% of the total ESV) (Table 4). However, its value reduced rapidly to 1.71 billion USD (13.78% of the total ESV) in 2010 and is projected to reduce further to 1.43 billion USD (11.53% of the total ESV) in 2030 and 1.18 billion USD (9.48% of the total ESV) in 2050 (Table 4). Similarly, the value of forests, heterogeneous agricultural areas, and natural grassland are projected to dwindle in 2050, in order of 0.20%, 8.97%, and 4.19% from 2.36%, 11.56%, and 11.01% in 1985 (Table 4). Inland waters and coffee agroforestry also accounted for the largest part of the total ESV of the basin that were 14.7% and 13.77% in 1985 and 14.41% and 13.36% in 2010. Their contributions to the total ESV of the basin are expected to remain more or less similar in the future. Inland wetland and built-up areas shared a small proportion of the total ESV, and their contributions are projected to remain the same in the future.
Although the total ESVs of ACB is expected to increase from1985–2050, the aggregate value of services obtained from the natural ecosystems (inland waters, forests, shrubland, natural grassland, and inland wetlands) are expected to decrease by 36.24% (from 6.57 billion USD per year to 4.19 billion USD per year) in the same period. In the first period between 1985 and 2010, the value of ESS obtained from the natural ecosystems reduced by 14.44% and is projected to further reduce by 15.10% and 6.70% in the second (2010–2030) and third (2030–2050) periods, respectively. The losses in ESVs were mainly due to the reduction of services obtained from shrubland and natural grassland in the basin, followed by decline services provided by inland waters, forests, and inland wetlands. In contrast, the aggregate value of ESS obtained from artificial ecosystems (arable land, heterogeneous agricultural areas, coffee agroforestry and built-up areas) is expected to increase by 49.04% (from 5.56 billion to 8.29 billion USD per year) between 1985 and 2050, with 22.90%, 17.55%, and 8.60% increases in the first, second, and third periods, respectively. It was found out that the rapid expansion of arable land in the basin is a major contributor to the changes in ESVs over the study period.
We also compared the total ESVs of the basin based on global unit value coefficients [12] and locally modified unit value coefficients [21], the result of which is presented in Figure 3. In contrast to global unit value coefficients, the use of locally modified unit value coefficients resulted in a substantial reduction of the total ESVs of the basin over the study period. Based on locally modified unit value coefficients, the ESV of the basin were estimated at 3.06 billion USD in 1985 and 2.93 billion USD in 2010. The value is projected to further decline to 2.75 billion USD by the year 2050, resulting in overall net loss of 0.34 billion USD (11.18%) of ESS between 1985 and 2050. This estimate is about 4–5 times less than (depending on the reference years) than the estimate obtained by the use of global unit value coefficients. We also observed a considerable variability in the contributions of different LULC types to the total ESVs of the basin in different reference years (Table S1). For example, inland water ecosystem is estimated to provide more than 50% of the total ESVs of the basin throughout the study period when we used Kindu’s et al. [21] locally modified ESV coefficients, despite its size, which covers less than 7.5% of the basin (Table S1). Kindu et al. [21] assigned a default estimate of zero to the ESS provided by built-up/settlement areas, for which Costanza et al. [12] attached economic values. However, in our case, built-up/settlement areas covered a relatively small portion of the total land area in the basin, and the value of ESS provided by them was not big enough to create a difference in the outcome of our estimation.

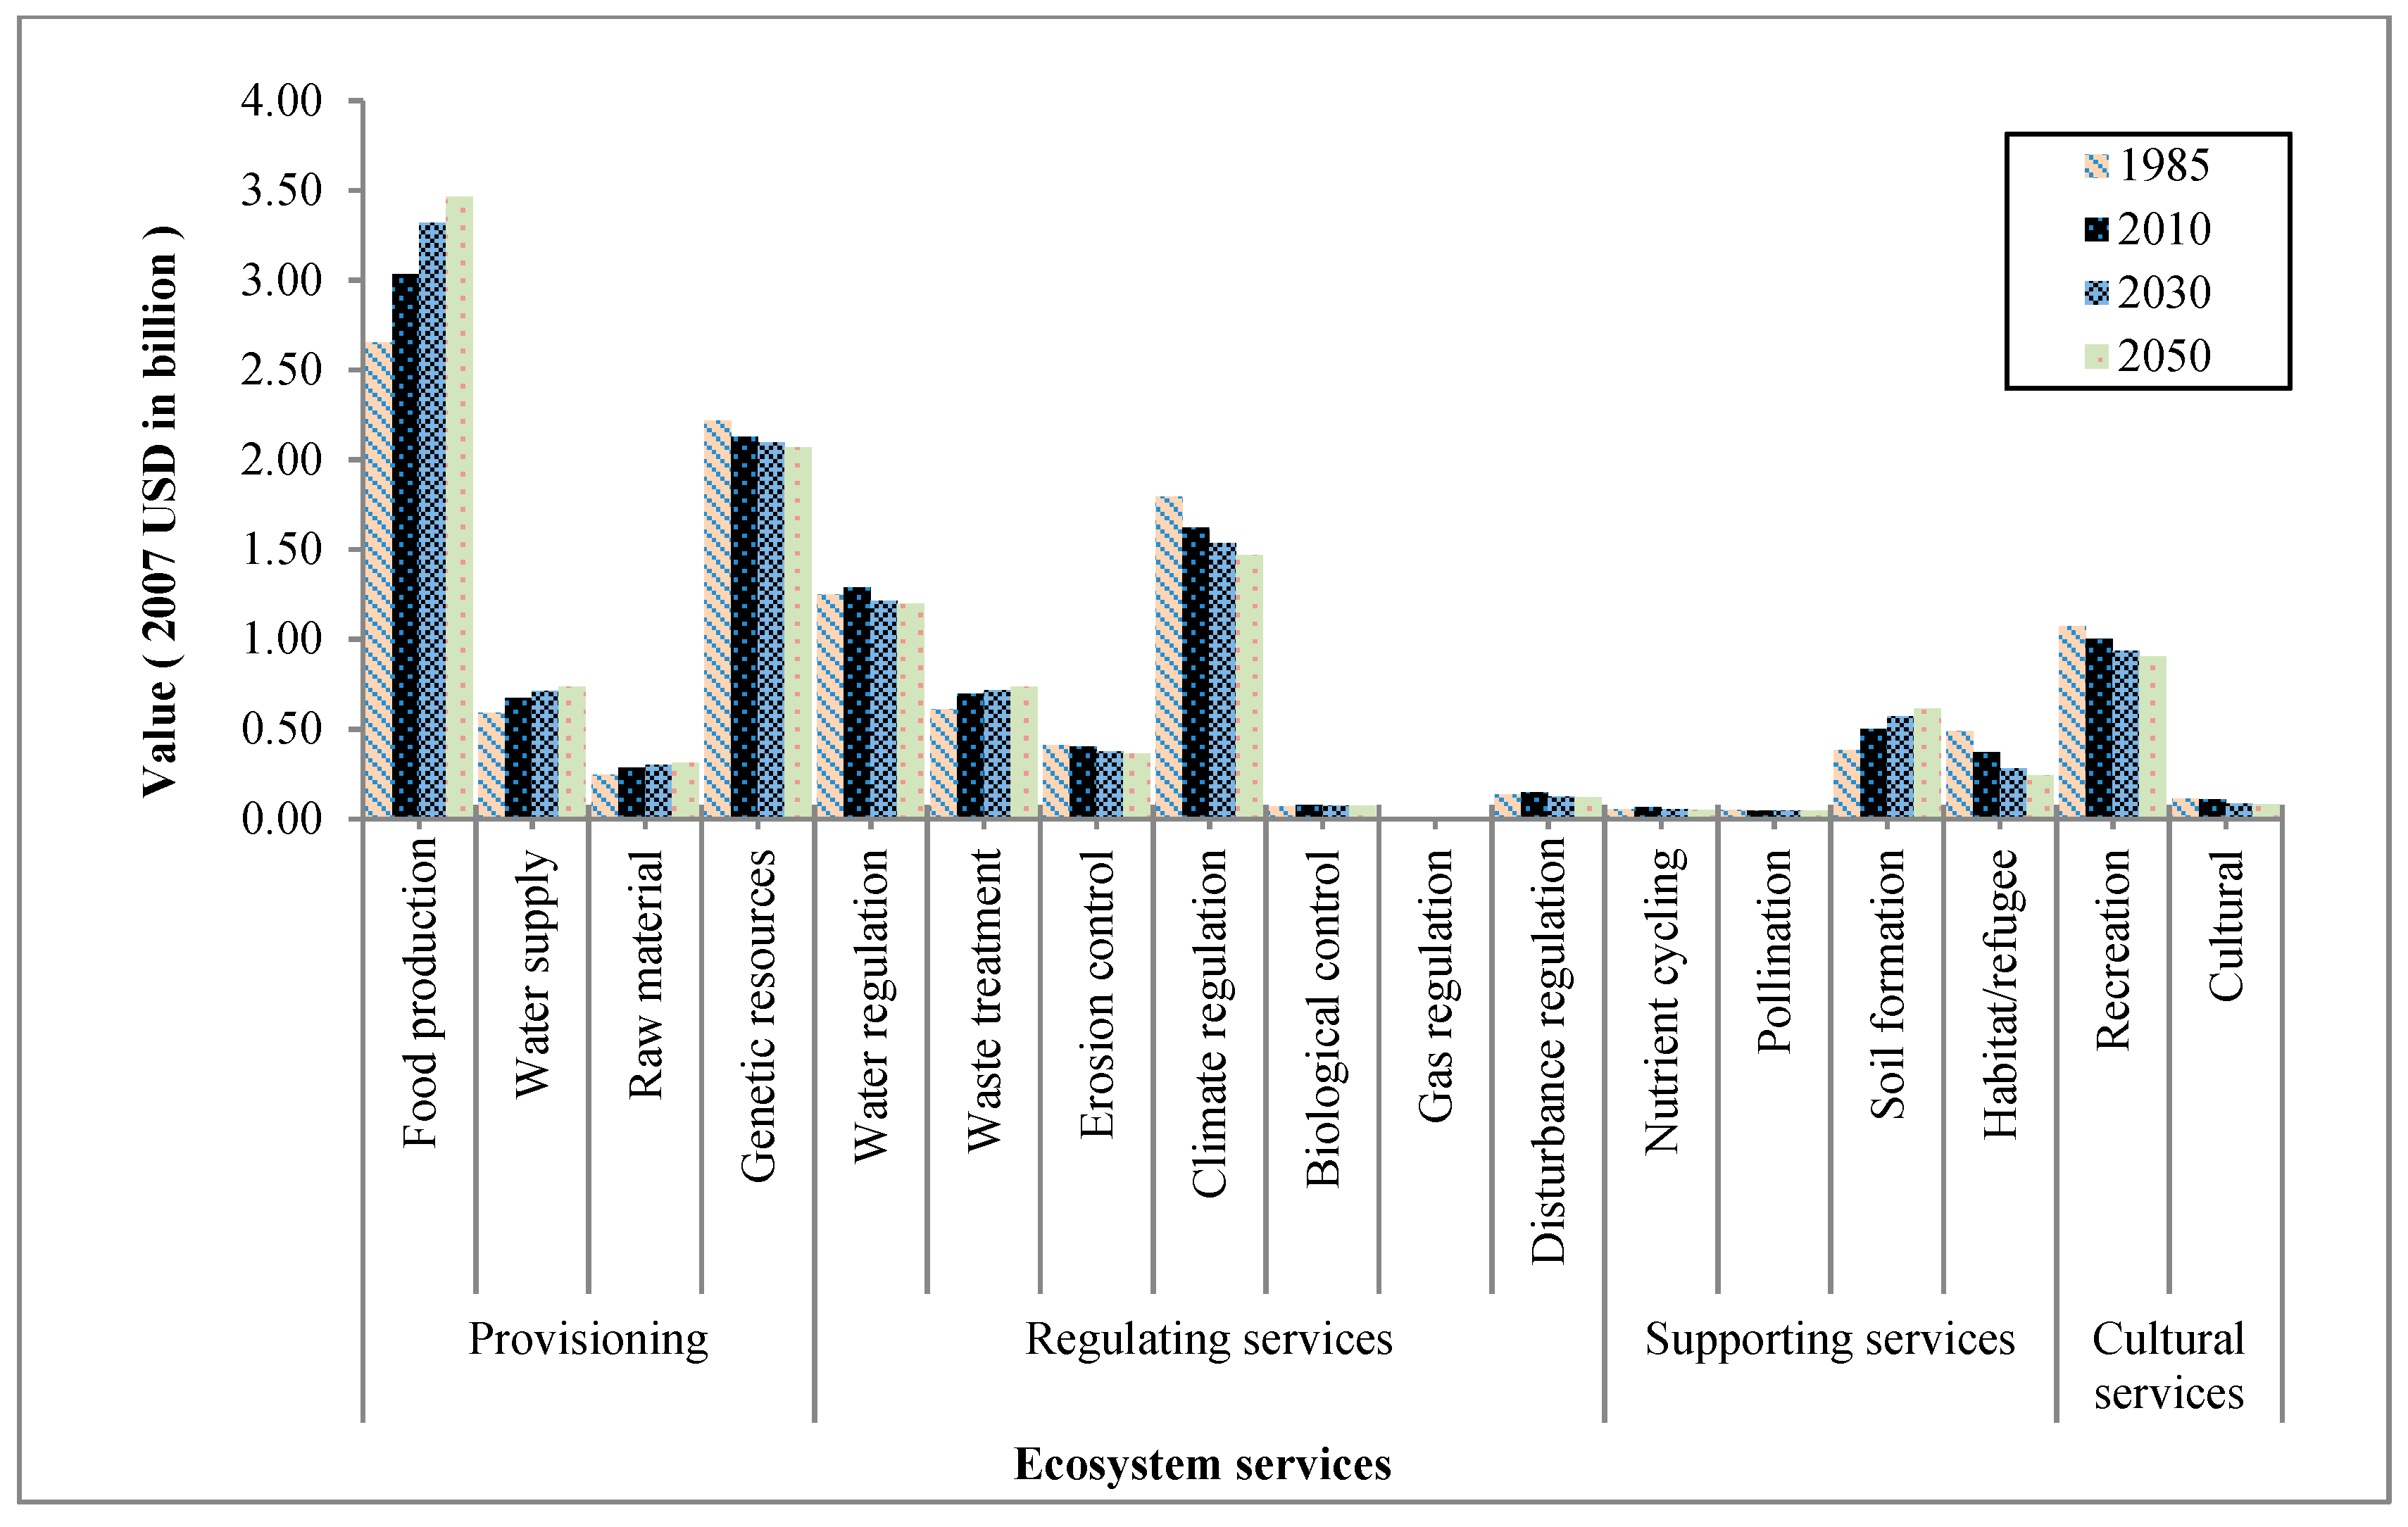
3.3. Impact of LULC Changes on the Value of Individual Ecosystem Service

The impact of LULC change on the value of individual ESS is presented in Figure 4. The ESS of food production and genetic resources were the two most highly valued services in the basin followed by climate regulation, water regulation, and recreation ESS in decreasing order (Figure 4). The aggregate ESV of food production and genetic resources alone accounted for 40.1% (4.86 billion USD) in 1985 and 41.4% (5.15 billion USD) of the total ESV of the basin in 2010 (Figure 4). Their shares in the total ESVs are projected to increase to 43.5% (5.41 billion USD) by the year 2030 and 44.3 (5.53 billion USD) by the year 2050. In general, the aggregate values of these five services contributed to more than 70% of the total ESVs of the basin in all the study years. We also observed varying gains and losses across the study periods for the different ESS measured. The value of food production service is projected to follow an upward trend, whereas as the value of climate regulation, water regulation, and recreation services are expected follow a downward trend between 1985 and 2050 (Figure 4). Likewise, the value of raw material, water treatment, biological control, disturbance regulation, and soil formation services is expected to show increasing trends, whereas the value of genetic resources, erosion control, nutrient cycling, pollination, habitat/refugia, and cultural services are expected to show a decreasing trend (Figure 4).

4. Discussion

The expansion of agricultural land at the expense of natural vegetation, such as forest, shrubland and grassland, was the most common reported LULC change in Ethiopia [21,25,26,27,29,30,37,72]. This change affected the country’s ecosystems structure and function and altered the kind of services citizens derived from the ecosystems and their values. In this study, we analyzed the past (1985–2010) and modeled the future (2030–2050) LULC dynamics of ACB and the subsequent effects on ecosystem service values in the basin. Based on the observed and projected changes of LULC and the global ecosystem service value coefficients obtained from Costanza et al. [12], the total ESV of ACB is projected to increase by 2.84% (344.5 million USD) between 1985 and 2050. The change in ESV was mainly caused by the increased service value (mainly food production) of a rapidly expanded arable land, which offset the losses of service values incurred by the reduction of natural vegetation in the basin. This is not consistent with the findings previously reported in Ethiopia which indicate a decrease in the total value of ESS in the country despite a rapid expansion of cultivated land at the expense of natural ecosystems and inland water bodies [21,38,39,73]. Several reasons could be attributed to this difference. The use of different value coefficients from different sources to estimate the ESV is one of the most important factors that contribute to the difference in the findings among the studies. All previous studies in Ethiopia [38,39] used value coefficients obtained either from Costanza et al. [1] or Kindu et al. [21], both of which are criticized for underestimation of values of some ESS [20,39,74]. For example, both Costanza et al. [1] and Kindu et al. [21] estimated the service value of cropland biome based on pollination, biological control, and food production services. However, arable land and heterogeneous agricultural areas, represented by cropland biome in this study, are complex systems and produce multiple services other than the three service types listed above. Both Costanza et al. [1] and Kindu et al. [21] also assigned a default value zero for services obtained from urban/settlement due to lack of relevant data, whereas Costanza et al. [12] assigned an economic value for it. As it is reported by Costanza et al. [12], the emergence of several new studies after 1997 with complete estimates of ESS per ha, the addition of new service values for previously unrecognized services as a result of better understanding of the multiple services provided by ecosystems and changes in value of ESS per ha through time have significantly increased per hectare value of some services in 2014 estimate.
We also assessed ESV of the basin using locally adapted unit value coefficients [21] in order to make a comparison with the total ESV of the basin reported here. The result of this comparison shows that the use of locally adapted unit value coefficients significantly reduced the total ESV of the basin. A similar observation was also reported by Song and Deng (2017) [20] in China. They reported a significantly higher increase in the total ESV of China when unit value coefficients from Costanza et al. [12] were used instead of Costanza et al. [1] or local value coefficients developed for China. This may be attributed to scale of valuation (global vs. local), which has a strong influence on the values attached to ESS by stakeholders. Some ESS has a higher value at a local scale than global scale, and vice versa. In addition to this, Costanza et al. [1] and Kindu et al. [21] estimated the service value of some ecosystems, such as cropland and settlement, based on fewer service types than Costanza et al. [12] due to lack of relevant information and, therefore, undervalued. Considering the role of ACB in the national economy as one of the main source of food and cash crops, such as coffee, a tourist destination, as well as maintaining aquatic and terrestrial biodiversity among other benefits, we believe that the use of value coefficients from Kindu et al. [21] certainly underestimated the current real service value of ACB’s ecosystems. On the other hand, Costanza et al. [12] value coefficients are global scale and significant divergence can occur at the local level as some values seem overestimated. This may create doubt to integrate the assessment results of ESV into policy and decision-making process at different levels. In this regard, the results of our study should be taken as a rough estimation and the limitations of this study need to be taken into account when the results are being used for a decision that consider the basin as a whole. Despite their difference, however, the ESV estimates based on Kindu et al. [21] and Costanza et al. [12] coefficients indicated the reduction of the services value of natural ecosystems in the basin over the study period. Thus, both coefficients can be used to justify the need for urgent environmental protection policy and action that focus on the prevention of further conversion of natural vegetation in the basin. Detail studies need to be planned in the future for more elaborate and realistic unit value coefficients that reflects the local conditions in order to provide guidance for a decision that requires a high precision, such as payments for ecosystem services.
Although the total ESV of ACB increased over the study period, the losses of services obtained from the natural ecosystems in the basin require particular attention. The expansion of arable land is expected to increase the value of food production, raw material, water treatment, biological control, disturbance regulation, and soil formation in the basin. On the contrary, agricultural expansion at the expense of inland waters, forests, shrubland, natural grassland, and inland wetlands are expected to reduce the value of climate regulation, water regulation, genetic resources, erosion control, nutrient cycling, pollination, habitat/refugia, recreation, and cultural services by 36.2% (2.38 billion USD). The reduction of shrubland and natural grassland alone is projected to account for more than 85% (2.04 billion USD) of the ESS loss in the basin. This result is consistent with the findings reported in various studies in Ethiopia and elsewhere, which indicates the existence of typical trade-offs among multiple ESS provided by natural ecosystems (such as such as genetic resource, climate regulation, and habitat/refugia) and artificial ecosystems (such as food production and raw material) [21,38,75,76,77]. Variation of ESV over time, ranging from substantial decline in the values of genetic resource, climate regulation, nutrient cycling, erosion control, pollination, and habitat/refugia services to moderate increase in the values of food production, raw material, and recreation services due to the impacts of agricultural expansion and urbanization is reported by Arowolo et al. [19], Gashaw et al. [38], Kindu et al. [21], and Wang et al. [77] in their respective study areas.
Particular attention should be paid to the losses of services obtained from natural ecosystems, such as water regulation and erosion control, as the consequences have already been felt in the basin in the form of increased soil erosion and surface runoff, which led to a high sediment deposition in the lakes found in the rift floor [30,51]. This has affected the water quality of the lakes and causing a significant reduction in their fish stocks [78,79]. Rapid reduction of the abundance (local extinction in some case) of multipurpose indigenous trees, medicinal plants, and wild animals previously common in the basin [30] are also other consequences of the reduction of habitat/refugia and genetic resource ecosystem services in the basin which require urgent action. With the continuous decrease in genetic resource, erosion control, nutrient cycling, and pollination services in the basin, some of the constraints of coffee, fruit, and cereal productions will become worsened and may increase the vulnerability of the basin’s agriculture to climate change in a long-term. Therefore, actions to enhance natural capital and ESS in the basin are urgently needed.

5. Limitations of the Study

The datasets used in this study were obtained from various sources and the primary limitation of this study is associated with quality and resolution of the data. The observed LULC dataset used in this study were generally having high accuracy and local scale. However, uncertainties in simulated changes of LULC are almost unavoidable due to continuous changes in the economic, social, and political environment. Additionally, climatic change is expected to impact the basin’s terrestrial and aquatic ecosystem substantially. How the interaction of future climate change and land-use change will drives a complex pattern of inter-related environmental changes in the basin and affects the ecosystem remains poorly understood. Understanding these sources of uncertainties in land cover projection is crucial when using this study for policy and decision-making processes.
The corresponding equivalent biomes and the associated unit value coefficients adopted from Costanza et al. [12] are another shortcoming of this study. Costanza et al. [12] biomes and the associated unit value coefficients are in global scale and significant divergence can occur when we applied them at the local scale, as some values seem overestimated. In future attempts to value ESS of the basin, the global unit value coefficients need to be adjusted in such a way that it can apply to the basin more directly. Despite its limitations, however, the study highlights the value of ESS in ACB and set the stage for stakeholders and decision-makers to consider ecosystem health of the basin when designing alternative land management options and projects which improve livelihoods of the local population in the basin.

6. Conclusions

This study investigated the effect of LULC change on the value of ecosystem service in ACB from 1985–2050 using the datasets derived from remote sensing imageries, modeling outputs, and publications in peer-reviewed scientific journals. The results indicate that over the period 1985–2010, the area under natural vegetation has reduced, whereas the area under cultivation has increased in the basin. The trend is predicted to continue in the future at an increasing rate with a slight reduction in inland waters, heterogeneous agricultural areas, and inland wetlands. Based on our estimates using global unit value coefficients, LULC change between 1985 and 2050 expected to increase the total ESV of the basin by 344.5 million USD (2.84%), due to an increased service value (mainly food production) of rapidly expanded arable land in the basin. We observed that the values of ecosystem service obtained from the natural ecosystems are expected to decline throughout the study period (1985–2050). The service value of climate regulation, water regulation, genetic resource, erosion control, nutrient cycling, pollination, habitat/refugia, recreation, and cultural services consistently decreased in the study period, which indicates deteriorated environmental quality of the basin. Although agriculture is vital for the wellbeing of the local population, as well as mainstay of the economy, as an important source of cash (e.g., coffee and fruit) and raw materials (e.g., cotton), its negative impacts on natural ecosystems and the associated services need to be addressed urgently. In particular, the reduction of water regulation and erosion control services is a major concern, as the consequence has already been reported in the basin in the form of reduced water quality and productivity of the lakes due to an increased sediment transport in the basin. In light of this, an integrated watershed management approach which incorporates social perceptions driving land management decisions, better family planning, and improved farming system needs to be implemented at the base to deal with the continuing expansion of cultivated land in the basin. Special attention should also be given to the rehabilitation of degraded lands and protecting the remaining natural vegetation and water bodies to enhance natural capital and ecosystem services in the basin. In this regard, a large-scale dissemination of eco-agricultural land use practices, which provide multiple ecosystem services (such as agroforestry and heterogeneous agricultural areas) in the basin, needs to be considered in the future.

Supplementary Materials

The following are available online at https://0-www-mdpi-com.brum.beds.ac.uk/2073-445X/9/2/37/s1, Table S1: Effect of LULC change on the total value of ecosystem services of ACB from 1985–2050 based on Kindu’s et al. (2016) local unit value coefficient.

Author Contributions

A.W. and M.C. conceived and designed the study; A.W. and W.D.B. designed the methodology and literature review; A.W. analyzed the data and wrote the paper; G.K., M.C. and W.D.B. took part in paper writing; M.C., G.K. and W.D.B. critically reviewed the paper and provided comments on the contents and structure of the paper. All authors have read and agree to the published version of the manuscript.

Funding

This research received partial funding from STUBE Baden-Württemberg (A Student Program for students from Africa, Asia and Latin America) and Deutsche Forschungsgemeinschaft DFG (grant number 404870679 “Assessing Ecosystem Services and Functions in rural environments with emphasis on trade-offs and tipping points in their provisioning”.

Acknowledgments

This study was partly financed by STUBE Baden-Württemberg (A Student Program for students from Africa, Asia and Latin America) and Deutsche Forschungsgemeinschaft DFG (grant number 404870679 “Assessing Ecosystem Services and Functions in rural environments with emphasis on trade-offs and tipping points in their provisioning”). We are also grateful to the University of Hohenheim for the provision of software and computer facilities needed for this study.

Conflicts of Interest

The authors declare no conflict of interest.

References

  1. Costanza, R.; Arge, R.; DeGroot, R.; Farberk, S.; Grasso, M.; Hannon, B.; Limburg, K.; Naeem, S.; Neill, R.V.O.; Paruelo, J.; et al. The value of the world’s ecosystem services and natural capital. Nature 1997, 387, 253–260. [Google Scholar] [CrossRef]
  2. The Economics of Ecosystems and Biodiversity (TEEB) Mainstreaming the Economics of Nature: A Synthesis of the Approach, Conclusions and Recommendations of TEEB; Progress Press: Valletta, Malta, 2010.
  3. Millennium Ecosystem Assessment (MEA). Millennium Ecosystem Assessment, 2005. Ecosystems and Human Well-being: Synthesis; Island Press: Washington, DC, USA, 2005; ISBN 1597260401. [Google Scholar]
  4. Styers, D.M.; Chappelka, A.H.; Marzen, L.J.; Somers, G.L. Developing a land-cover classification to select indicators of forest ecosystem health in a rapidly urbanizing landscape. Landsc. Urban Plan. 2010, 94, 158–165. [Google Scholar] [CrossRef]
  5. Nelson, G.C.; Bennett, E.; Berhe, A.A.; Cassman, K.; DeFries, R.; Dietz, T.; Dobermann, A.; Dobson, A.; Janetos, A.; Levy, M.; et al. Anthropogenic Drivers of Ecosystem Change: An Overview. Ecol. Soc. 2006, 11, 29. [Google Scholar] [CrossRef]
  6. Burkhard, B.; Crossman, N.; Nedkov, S.; Petz, K.; Alkemade, R. Mapping and modelling ecosystem services for science, policy and practice. Ecosyst. Serv. 2013, 4, 1–3. [Google Scholar] [CrossRef]
  7. Helfenstein, J.; Kienast, F. Ecosystem service state and trends at the regional to national level: A rapid assessment. Ecol. Indic. 2014, 36, 11–18. [Google Scholar] [CrossRef]
  8. Mendoza-González, G.; Martínez, M.L.; Lithgow, D.; Pérez-Maqueo, O.; Simonin, P. Land use change and its effects on the value of ecosystem services along the coast of the Gulf of Mexico. Ecol. Econ. 2012, 82, 23–32. [Google Scholar] [CrossRef]
  9. Brink, A.B.; Eva, H.D. Monitoring 25 years of land cover change dynamics in Africa: A sample based remote sensing approach. Appl. Geogr. 2009, 29, 501–512. [Google Scholar] [CrossRef]
  10. Giri, C.; Long, J. Land Cover Characterization and Mapping of South America for the Year 2010 Using Landsat 30 m Satellite Data. Remote Sens. 2014, 6, 9494–9510. [Google Scholar] [CrossRef] [Green Version]
  11. Zabel, F.; Delzeit, R.; Schneider, J.M.; Seppelt, R.; Mauser, W.; Václavík, T. Global impacts of future cropland expansion and intensification on agricultural markets and biodiversity. Nat. Commun. 2019, 10, 2844. [Google Scholar] [CrossRef] [Green Version]
  12. Costanza, R.; de Groot, R.; Sutton, P.; van der Ploeg, S.; Anderson, S.J.; Kubiszewski, I.; Farber, S.; Turner, R.K. Changes in the global value of ecosystem services. Glob. Environ. Chang. 2014, 26, 152–158. [Google Scholar] [CrossRef]
  13. Lawler, J.J.; Lewis, D.J.; Nelson, E.; Plantinga, A.J.; Polasky, S.; Withey, J.C.; Helmers, D.P.; Martinuzzi, S.; Pennington, D.; Radeloff, V.C. Projected land-use change impacts on ecosystem services in the United States. Proc. Natl. Acad. Sci. USA 2014, 111, 7492–7497. [Google Scholar] [CrossRef] [PubMed] [Green Version]
  14. Kubiszewski, I.; Costanza, R.; Anderson, S.; Sutton, P. The future value of ecosystem services: Global scenarios and national implications. Ecosyst. Serv. 2017, 26, 289–301. [Google Scholar] [CrossRef]
  15. Fiquepron, J.; Garcia, S.; Stenger, A. Land use impact on water quality: Valuing forest services in terms of the water supply sector. J. Environ. Manag. 2013, 126, 113–121. [Google Scholar] [CrossRef]
  16. Polasky, S.; Nelson, E.; Pennington, D.; Johnson, K.A. The impact of land-use change on ecosystem services, biodiversity and returns to landowners: A case study in the state of Minnesota. Environ. Resour. Econ. 2011, 48, 219–242. [Google Scholar] [CrossRef]
  17. De Groot, R.; Brander, L.; van der Ploeg, S.; Costanza, R.; Bernard, F.; Braat, L.; Christie, M.; Crossman, N.; Ghermandi, A.; Hein, L.; et al. Global estimates of the value of ecosystems and their services in monetary units. Ecosyst. Serv. 2012, 1, 50–61. [Google Scholar] [CrossRef]
  18. West, P.C.; Gibbs, H.K.; Monfreda, C.; Wagner, J.; Barford, C.C.; Carpenter, S.R.; Foley, J.A. Trading carbon for food: Global comparison of carbon stocks vs. crop yields on agricultural land. Proc. Natl. Acad. Sci. USA 2010, 107, 19645–19648. [Google Scholar] [CrossRef] [Green Version]
  19. Arowolo, A.O.; Deng, X.; Olatunji, O.A.; Obayelu, A.E. Assessing changes in the value of ecosystem services in response to land-use/land-cover dynamics in Nigeria. Sci. Total Environ. 2018, 636, 597–609. [Google Scholar] [CrossRef]
  20. Song, W.; Deng, X. Land-use/land-cover change and ecosystem service provision in China. Sci. Total Environ. 2017, 576, 705–719. [Google Scholar] [CrossRef]
  21. Kindu, M.; Schneider, T.; Teketay, D.; Knoke, T. Changes of ecosystem service values in response to land use/land cover dynamics in Munessa-Shashemene landscape of the Ethiopian highlands. Sci. Total Environ. 2016, 547, 137–147. [Google Scholar] [CrossRef]
  22. Förster, J.; Barkmann, J.; Fricke, R.; Hotes, S.; Kleyer, M.; Kobbe, S.; Kübler, D.; Rumbaur, C.; Siegmund-Schultze, M.; Seppelt, R.; et al. Assessing ecosystem services for informing land-use decisions: A problem-oriented approach. Ecol. Soc. 2015, 20, 31. [Google Scholar] [CrossRef] [Green Version]
  23. Thellmann, K.; Golbon, R.; Cotter, M.; Cadisch, G.; Asch, F. Assessing Hydrological Ecosystem Services in a Rubber-Dominated Watershed under Scenarios of Land Use and Climate Change. Forests 2019, 10, 176. [Google Scholar] [CrossRef] [Green Version]
  24. Cotter, M.; Berkhoff, K.; Gibreel, T.; Ghorbani, A.; Golbon, R.; Nuppenau, E.A.; Sauerborn, J. Designing a sustainable land use scenario based on a combination of ecological assessments and economic optimization. Ecol. Indic. 2014, 36, 779–787. [Google Scholar] [CrossRef]
  25. Ariti, A.T.; van Vliet, J.; Verburg, P.H. Land-use and land-cover changes in the Central Rift Valley of Ethiopia: Assessment of perception and adaptation of stakeholders. Appl. Geogr. 2015, 65, 28–37. [Google Scholar] [CrossRef]
  26. Bewket, W.; Abebe, S. Land-use and land-cover change and its environmental implications in a tropical highland watershed, Ethiopia. Int. J. Environ. Stud. 2013, 70, 126–139. [Google Scholar] [CrossRef]
  27. Garedew, E.; Sandewall, M.; Söderberg, U.; Campbell, B.M. Land-use and land-cover dynamics in the central rift valley of ethiopia. Environ. Manag. 2009, 44, 683–694. [Google Scholar] [CrossRef]
  28. Gashaw, T.; Tulu, T.; Argaw, M.; Worqlul, A.W. Evaluation and prediction of land use/land cover changes in the Andassa watershed, Blue Nile Basin, Ethiopia. Environ. Syst. Res. 2017, 6, 17. [Google Scholar] [CrossRef] [Green Version]
  29. Minta, M.; Kibret, K.; Thorne, P.; Nigussie, T.; Nigatu, L. Land use and land cover dynamics in Dendi-Jeldu hilly-mountainous areas in the central Ethiopian highlands. Geoderma 2018, 314, 27–36. [Google Scholar] [CrossRef]
  30. Woldeyohannes, A.; Cotter, M.; Kelboro, G.; Dessalegn, W. Land Use and Land Cover Changes and Their Effects on the Landscape of Abaya-Chamo Basin, Southern Ethiopia. Land 2018, 7, 2. [Google Scholar] [CrossRef] [Green Version]
  31. Zeleke, G.; Hurni, H. Implications of Land Use and Land Cover Dynamics for Mountain Resource Degradation in the Northwestern Ethiopian Highlands. Mt. Res. Dev. 2001, 21, 184–191. [Google Scholar] [CrossRef] [Green Version]
  32. Ethiopian Forestry Action Program (EFAP). Ethiopian Forestry Action Program: The Challenge for Development; Ministry of National Resources Development and Environmental Protection: Addis Abeba, Ethiopia, 1993. [Google Scholar]
  33. Birhane, E.; Ashfare, H.; Fenta, A.A.; Hishe, H.; Gebremedhin, M.A.; Wahed, H.G.; Solomon, N. Land use land cover changes along topographic gradients in Hugumburda national forest priority area, Northern Ethiopia. Remote Sens. Appl. Soc. Environ. 2019, 13, 61–68. [Google Scholar] [CrossRef]
  34. Mekasha, A.; Gerard, B.; Tesfaye, K.; Nigatu, L.; Duncan, A.J. Inter-connection between land use/land cover change and herders’/farmers’ livestock feed resource management strategies: A case study from three Ethiopian eco-environments. Agric. Ecosyst. Environ. 2014, 188, 150–162. [Google Scholar] [CrossRef] [Green Version]
  35. Gibbs, H.K.; Ruesch, A.S.; Achard, F.; Clayton, M.K.; Holmgren, P.; Ramankutty, N.; Foley, J.A. Tropical forests were the primary sources of new agricultural land in the 1980s and 1990s. Proc. Natl. Acad. Sci. USA 2010, 107, 16732–16737. [Google Scholar] [CrossRef] [PubMed] [Green Version]
  36. Food and Agriculture Organization of the United Nations (FAO). Global Forest Resources Assessment 2010 Country Report Ethiopia; FAO: Rome, Italy, 2010. [Google Scholar]
  37. Tsegaye, D.; Moe, S.R.; Vedeld, P.; Aynekulu, E. Land-use/cover dynamics in Northern Afar rangelands, Ethiopia. Agric. Ecosyst. Environ. 2010, 139, 174–180. [Google Scholar] [CrossRef]
  38. Gashaw, T.; Tulu, T.; Argaw, M.; Worqlul, A.W.; Tolessa, T.; Kindu, M. Estimating the impacts of land use/land cover changes on Ecosystem Service Values: The case of the Andassa watershed in the Upper Blue Nile basin of Ethiopia. Ecosyst. Serv. 2018, 31, 219–228. [Google Scholar] [CrossRef]
  39. Tolessa, T.; Senbeta, F.; Kidane, M. The impact of land use/land cover change on ecosystem services in the central highlands of Ethiopia. Ecosyst. Serv. 2017, 23, 47–54. [Google Scholar] [CrossRef]
  40. Nyssen, J.; Simegn, G.; Taha, N. An upland farming system under transformation: Proximate causes of land use change in Bela-Welleh catchment (Wag, Northern Ethiopian Highlands). Soil Tillage Res. 2009, 103, 231–238. [Google Scholar] [CrossRef]
  41. Qin, K.; Li, J.; Liu, J.; Yan, L.; Huang, H. Setting conservation priorities based on ecosystem services—A case study of the Guanzhong-Tianshui Economic Region. Sci. Total Environ. 2019, 650, 3062–3074. [Google Scholar] [CrossRef]
  42. Pandeya, B.; Buytaert, W.; Zulkafli, Z.; Karpouzoglou, T.; Mao, F.; Hannah, D.M. A comparative analysis of ecosystem services valuation approaches for application at the local scale and in data scarce regions. Ecosyst. Serv. 2016, 22, 250–259. [Google Scholar] [CrossRef] [Green Version]
  43. Farley, J.; Costanza, R. Payments for ecosystem services: From local to global. Ecol. Econ. 2010, 69, 2060–2068. [Google Scholar] [CrossRef]
  44. Farley, J. The role of prices in conserving critical natural capital. Conserv. Biol. 2008, 22, 1399–1408. [Google Scholar] [CrossRef]
  45. Alarcon, G.G.; de Freitas, L.A.D.S.; da Fountoura, G.O.; de Macedo, C.X.; Ribeiro, D.C. The challenges of implementing a legal framework for Payment for Ecosystem Services in Santa Catarina, Brazil. Nat. Conserv. 2016, 14, 132–136. [Google Scholar] [CrossRef] [Green Version]
  46. Tolessa, T.; Senbeta, F.; Abebe, T. Land use/land cover analysis and ecosystem services valuation in the central highlands of Ethiopia. For. Trees Livelihoods 2016, 26, 111–123. [Google Scholar] [CrossRef]
  47. Kubiszewski, I.; Costanza, R.; Dorji, L.; Thoennes, P.; Tshering, K. An initial estimate of the value of ecosystem services in Bhutan. Ecosyst. Serv. 2013, 3, e11–e21. [Google Scholar] [CrossRef]
  48. Johnston, R.J.; Rosenberger, R.S. Methods, Trends and Controversies in Contemporary Benefit Transfer. J. Econ. Surv. 2009, 24, 479–510. [Google Scholar] [CrossRef]
  49. Ebinger, C.J.; Yemane, T.; Woldegabriel, G.; Aronson, J.L.; Walter, R.C. Late Eocene-Recent volcanism and faulting in the southern main Ethiopian rift. J. Geol. Soc. Lond. 1993, 150, 99–108. [Google Scholar] [CrossRef] [Green Version]
  50. Billi, P. (Ed.) Landscapes and Landforms of Ethiopia; World Geomorphological Landscapes; Springer: Dordrecht, The Netherlands, 2015; ISBN 978-94-017-8025-4. [Google Scholar]
  51. Assefa, E.; Bork, H.-R. Deforestation and forest management in Southern Ethiopia: Investigations in the Chencha and Arbaminch areas. Environ. Manag. 2014, 53, 284–299. [Google Scholar] [CrossRef]
  52. Wagesho, N. Catchment dynamics and its impact on runoff generation: Coupling watershed modelling and statistical analysis to detect catchment responses. Int. J. Water Resour. Environ. Eng. 2014, 6, 73–87. [Google Scholar] [CrossRef]
  53. Schutt, B.; Thiemann, S. Kulfo River, South Ethiopia as a regulator of lake level changes in the Lake Abaya-Lake Chamo system. Zbl. Geol. Paläont 2006, 1, 129–143. [Google Scholar]
  54. Getahun, A. Agricultural systems in Ethiopia. Agric. Syst. 1978, 3, 281–293. [Google Scholar] [CrossRef]
  55. Central Statistics Agency (CSA). Population Projection for Ethiopia 2007–2037. The 2012 Inter-Censual Population Survey; CSA: Addis Ababa, Ethiopia, 2013. [Google Scholar]
  56. Soares-Filho, B.S.; Rodrigues, H.; Costa, W. Modeling Environmental Dynamics with Dinamica EGO: Guidebook. Available online: https://www.csr.ufmg.br/dinamica/dokuwiki/doku.php?id=tutorial:start (accessed on 5 May 2019).
  57. Berberoğlu, S.; Akın, A.; Clarke, K.C. Cellular automata modeling approaches to forecast urban growth for adana, Turkey: A comparative approach. Landsc. Urban Plan. 2016, 153, 11–27. [Google Scholar] [CrossRef]
  58. Assefa, E.; Bork, H. Dynamics and driving forces of agricultural landscapes in Southern Ethiopia: A case study of the Chencha and Arbaminch areas. J. Land Use Sci. 2016, 11, 278–293. [Google Scholar] [CrossRef]
  59. Pérez-Vega, A.; Mas, J.-F.; Ligmann-Zielinska, A. Comparing two approaches to land use/cover change modeling and their implications for the assessment of biodiversity loss in a deciduous tropical forest. Environ. Model. Softw. 2012, 29, 11–23. [Google Scholar] [CrossRef]
  60. Soares-Filho, B.; Rodrigues, H.; Follador, M. A hybrid analytical-heuristic method for calibrating land-use change models. Environ. Model. Softw. 2013, 43, 80–87. [Google Scholar] [CrossRef]
  61. Stan, K.; Sanchez-Azofeifa, A. Deforestation and secondary growth in Costa Rica along the path of development. Reg. Environ. Chang. 2019, 19, 587–597. [Google Scholar] [CrossRef]
  62. Stan, K.; Sanchez-Azofeifa, A.; Espírito-Santo, M.; Portillo-Quintero, C. Simulating Deforestation in Minas Gerais, Brazil, under Changing Government Policies and Socioeconomic Conditions. PLoS ONE 2015, 10, e0137911. [Google Scholar] [CrossRef] [PubMed]
  63. Ramos, C.J.P.; de Alencastro Graça, P.M.L.; Fearnside, P.M. Deforestation Dynamics on an Amazonian Peri-Urban Frontier: Simulating the Influence of the Rio Negro Bridge in Manaus, Brazil. Environ. Manag. 2018, 62, 1134–1149. [Google Scholar] [CrossRef] [PubMed]
  64. Elz, I.; Tansey, K.; Page, S.; Trivedi, M. Modelling Deforestation and Land Cover Transitions of Tropical Peatlands in Sumatra, Indonesia Using Remote Sensed Land Cover Data Sets. Land 2015, 4, 670–687. [Google Scholar] [CrossRef] [Green Version]
  65. Leija-Loredo, E.G.; Pavón, N.P. The northernmost tropical rain forest of the Americas: Endangered by agriculture expansion. Trop. Ecol. 2017, 58, 641–652. [Google Scholar]
  66. Ahmed, S.; Bramley, G. How will Dhaka grow spatially in future? -Modelling its urban growth with a near-future planning scenario perspective. Int. J. Sustain. Built Environ. 2015, 4, 359–377. [Google Scholar] [CrossRef] [Green Version]
  67. Malek, Ž.; Zumpano, V.; Hussin, H. Forest management and future changes to ecosystem services in the Romanian Carpathians. Environ. Dev. Sustain. 2018, 20, 1275–1291. [Google Scholar] [CrossRef] [Green Version]
  68. Leija-Loredo, E.G.; Pavón, N.P.; Sánchez-González, A.; Rodriguez-Laguna, R.; Ángeles-Pérez, G. Land cover change and carbon stores in a tropical montane cloud forest in the Sierra Madre Oriental, Mexico. J. Mt. Sci. 2018, 15, 2136–2147. [Google Scholar] [CrossRef]
  69. Wang, L.; Young, S.S.; Wang, W.; Ren, G.; Xiao, W.; Long, Y.; Li, J.; Zhu, J. Conservation priorities of forest ecosystems with evaluations of connectivity and future threats: Implications in the Eastern Himalaya of China. Biol. Conserv. 2016, 195, 128–135. [Google Scholar] [CrossRef]
  70. Hagen, A. Fuzzy set approach to assessing similarity of categorical maps. Int. J. Geogr. Inf. Sci. 2003, 17, 235–249. [Google Scholar] [CrossRef] [Green Version]
  71. Jose, S. Agroforestry for ecosystem services and environmental benefits: An overview. Agrofor. Syst. 2009, 76, 1–10. [Google Scholar] [CrossRef]
  72. Reid, R.S.; Kruska, R.L.; Muthui, N.; Taye, A.; Wotton, S.; Wilson, C.J.; Mulatu, W. Land-use and land-cover dynamics in response to changes in climatic, biological and socio-political forces: The case of southwestern Ethiopia. Landsc. Ecol. 2000, 15, 339–355. [Google Scholar] [CrossRef]
  73. Kindu, M.; Schneider, T.; Döllerer, M.; Teketay, D.; Knoke, T. Scenario modelling of land use/land cover changes in Munessa-Shashemene landscape of the Ethiopian highlands. Sci. Total Environ. 2018, 622–623, 534–546. [Google Scholar] [CrossRef]
  74. Pendleton, L.H.; Thébaud, O.; Mongruel, R.C.; Levrel, H. Has the value of global marine and coastal ecosystem services changed? Mar. Policy 2016, 64, 156–158. [Google Scholar] [CrossRef] [Green Version]
  75. Bennett, E.M.; Peterson, G.D.; Gordon, L.J. Understanding relationships among multiple ecosystem services. Ecol. Lett. 2009, 12, 1394–1404. [Google Scholar] [CrossRef]
  76. Lant, C.L.; Ruhl, J.B.; Kraft, S.E. The Tragedy of Ecosystem Services. Bioscience 2008, 58, 969–974. [Google Scholar] [CrossRef] [Green Version]
  77. Wang, S.; Wu, B.; Yang, P. Assessing the changes in land use and ecosystem services in an oasis agricultural region of Yanqi Basin, Northwest China. Environ. Monit. Assess. 2014, 186, 8343–8357. [Google Scholar] [CrossRef]
  78. Gebre-Mariam, Z. The effects of wet and dry seasons on concentrations of solutes and phytoplankton biomass in seven Ethiopian rift-valley lakes. Limnologica 2002, 179, 169–179. [Google Scholar]
  79. Schütt, B.; Wenclawiak, B. Off-site effects of soil erosion in the environment of Lake Abaya, South Ethiopia. DIE ERDE-J. Geogr. Soc. Berl. 2010, 141, 217–233. [Google Scholar]
Figure 1. Map of the study area.
Land 09 00037 g001
Figure 2. Observed LULC in the ACB in 1985 (a) and 2010 (b) and simulated LULC for 2030 (c) and 2050 (d).
Land 09 00037 g002aLand 09 00037 g002b
Figure 3. Total ESVs of ACB based on Costanza et al. [12] (A) and Kindu et al. [21] (B) unit value coefficients.
Land 09 00037 g003
Figure 4. Effects of LULC change on the value of individual ecosystem services in ACB.
Land 09 00037 g004
Table 1. LULC categories in ACB, the corresponding equivalent biomes, and ESV coefficients obtained from Costanza et al. [12] (A) and Kindu et al. [21] (B).
LULC CategoriesDescriptionEquivalent BiomeTotal Ecosystem Service Coefficient (2007 USD ha−1 year−1)
ABAB
Inland watersWatercourses like rivers and streams, and water bodies, like lakes and pondsLakes/riversWater12,51211,182.83
ForestsAll type of forests and woodlandTropical forestNatural forests53811361.63
ShrublandBush or shrub-dominated land with isolated trees always with a lower range of grassTropical forestWoodlands53811361.63
Arable landRegularly ploughed land for growing rain-fed and/or irrigated crops with some border treesCroplandCroplands5568311.27
Heterogeneous
Agricultural areas
Annual crops mixed with permanent crops and some woody vegetation usually eucalyptus treesCroplandCroplands5568311.27
Coffee agroforestryCoffee plantations with mixed shade trees, Enset, Khat, and fruit treesTropical forestWoodlands53811576.30
Natural grasslandA grassland with low productivity often situated in plains, rough ground, or rocky areasGrassland/rangelandGrasslands4166404.69
Inland wetlandsnon-forested areas seasonally or permanently waterloggedSwamps/floodplains-25,6812775.60 *
Built-up areasContinuous and discontinuous impervious layers and aggregated buildings of all kindsUrbanSettlement66610
* own estimate.
Table 2. Costanza et al. [12] (A) and Kindu et al. [21] (B) ESV coefficients (2007 USD ha−1 year−1) of the equivalent biomes for the LULC categories in ACB.
Inland WatersForestsShrublandArable LandHeterogeneous
Agricultural
Areas
Coffee Agroforestry **Natural GrasslandInland Wetlands ***Built-up Areas
ProvisioningAB *
Food production10656.5820044.1620044.162323258.832323258.83200258.831192162.08614180.2
Water supply18082921.462711.042711.044004002711.0460408275
Raw material8470.71128470.712192198470.7154539209
Genetic resources151756.58151756.5810421042151756.5812149968.4
Regulating services
Water regulation75147514.188.2888.2888.2834.145606741.916
aste treatment918595.47120187.68120187.68397397120187.6875120.06301533
Erosion control337338.1337338.1107107337338.14440.02260781.3
Climate regulation2044307.742044307.744114112044307.7440488199.3905
Biological control11113333.123333.12113131.74948
Gas regulation1218.87841218.881218.8899.6667.4
Disturbance regulation666.9666.9666.92986
Supporting services
Nutrient cycling3254.4723254.473254.471713102.5
Pollination3010.03263010.032219.322219.323010.03263534.5
Soil formation1413.81413.85325321413.821.3843.5
Habitat/refugia3923.8743923.873923.87412142455687.4
Cultural services
Recreation216695.228676.6248676.6282828676.624261.104221120.75740
Cultural22.7622.7622.76167199266
Total12,51211,182.8353811361.6353811361.635568311.275568311.2753811576.304166404.69256812775.666610.00
* adjusted for 2007 value using Consumer Price Index (CPI) conv. ** considered as equivalent to cropland ecosystem in the delivery of food production and shrubland ecosystem in the delivery of other services. *** own estimate.
Table 3. Observed (1985 and 2010) and projected (2030 and 2050) LULC and their changes in the ACB.
LULC CategoriesAbsolute Area Cover (km2)Change
1985%2010%2030%2050%1985–20102010–20302030–20501985–2050
Inland waters1432.47.481434.17.491384.767.231367.27.141.7−49.34−17.56−65.2
Forests531.62.78522.52.7394.510.4946.90.24−9.1−427.99−47.61−484.7
Shrubland4478.923.43188.216.72664.7813.92198.7711.5−1290.7−523.42−466.01−2280.13
Arable land445423.37088.6378529.4844.59397.9649.12634.61440.88868.484943.96
Heterogeneous
agricultural areas
2519.113.22162.111.32096.2210.92010.410.5−357−65.88−85.82−508.7
Coffee agroforestry2226.311.62216.811.62481.6132529.2613.2−9.5264.847.66302.96
Natural grassland3205.716.72143.811.21555.838.131253.246.55−1061.9−587.97−302.59−1952.46
Inland wetlands291.21.52365.51.91297.81.56291.651.5274.3−67.7−6.150.45
Built-up areas7.50.04250.1341.620.2251.220.2717.516.629.643.72
Table 4. Effect of LULC change on the total value of ecosystem services of ACB from 1985–2050 based on Costanza et al.’s [12] global unit value coefficient.
LULC CategoriesTotal Ecosystem Service Value (2007 USD in Million Year−1)
1985201020302050Change
Value%Value%Value%Value%1985–20102010–20302030–20501985–2050
Inland waters1792.2214.781794.3514.411732.6113.931710.6413.712.13−61.74−21.97−81.58
Forests286.052.36281.162.2650.860.4125.240.20−4.89−230.3−25.62−260.81
Shrubland2410.1019.871715.5713.781433.9211.531183.169.48−694.53−281.65−250.76−1226.94
Arable land2479.9920.453946.9331.694749.2138.195232.7841.951466.94802.28483.572752.79
Heterogeneous agricultural areas1402.6311.561203.869.671167.189.381119.398.97−198.77−36.68−47.79−283.24
Coffee agroforestry1670.6213.771663.4913.361862.1914.971897.9615.21−7.13198.735.77227.34
Natural grassland1335.4911.01893.117.17648.165.21522.104.19−442.38−244.95−126.06−813.39
Inland wetlands747.836.17938.647.54764.786.15748.996.00190.81−173.86−15.791.16
Built-up areas4.990.0416.650.1327.720.2234.120.2711.6611.076.429.13
Total12,129.8712,453.7512,436.6312,474.37

