
Physical-Chemical Characterization of Different Carbon-Based Sorbents for Environmental Applications

 , , , , , , , and
Abstract
:1. Introduction
- Slow pyrolysis, which is characterized by low heating rates, relatively low temperatures (300–400 °C), and long residence times [41]. This pyrolysis technique is mostly used to produce high quantities of biochar (yields of about 30%).
- Fast pyrolysis, which is characterized by high thermal gradients (≈100 °C/s), high temperatures (400–700 °C), and very short residence times (seconds) [42]. This pyrolysis technique is used to obtain high bio-oil yields (over 50%).
- Conventional pyrolysis, characterized by moderate heating rates (≈20 °C/s) and equally moderate reaction temperatures (less than 600 °C), with residence times ranging from 10 s to 10 min [43]. This type of pyrolysis gives rise to comparable quantities of char, gas, and liquid.
2. Materials and Methods
2.1. Activated Carbon and Biochar
2.2. Chemicals and Reagents
2.3. Physical Characterization
2.3.1. Particle Size Distribution
2.3.2. Density, Bulk Density, and Specific Weight
2.3.3. Specific Surface Area, Pore Volume, and Average Pore Size
2.3.4. Moisture Content, Volatile Matter, Ash Content, and Fixed Carbon
2.3.5. Conductivity
2.3.6. Raman Spectroscopy
2.3.7. Scanning Electron Microscopy and Energy-Dispersive X-ray Spectroscopy
2.3.8. X-ray Diffraction
2.4. Chemical Characterization
2.4.1. Elemental Analysis
2.4.2. pH Analysis
2.4.3. Boehm Analysis
2.4.4. Cation and Anion Exchange Capacity
2.4.5. Methylene Blue and Iodine Index
3. Results and Discussion
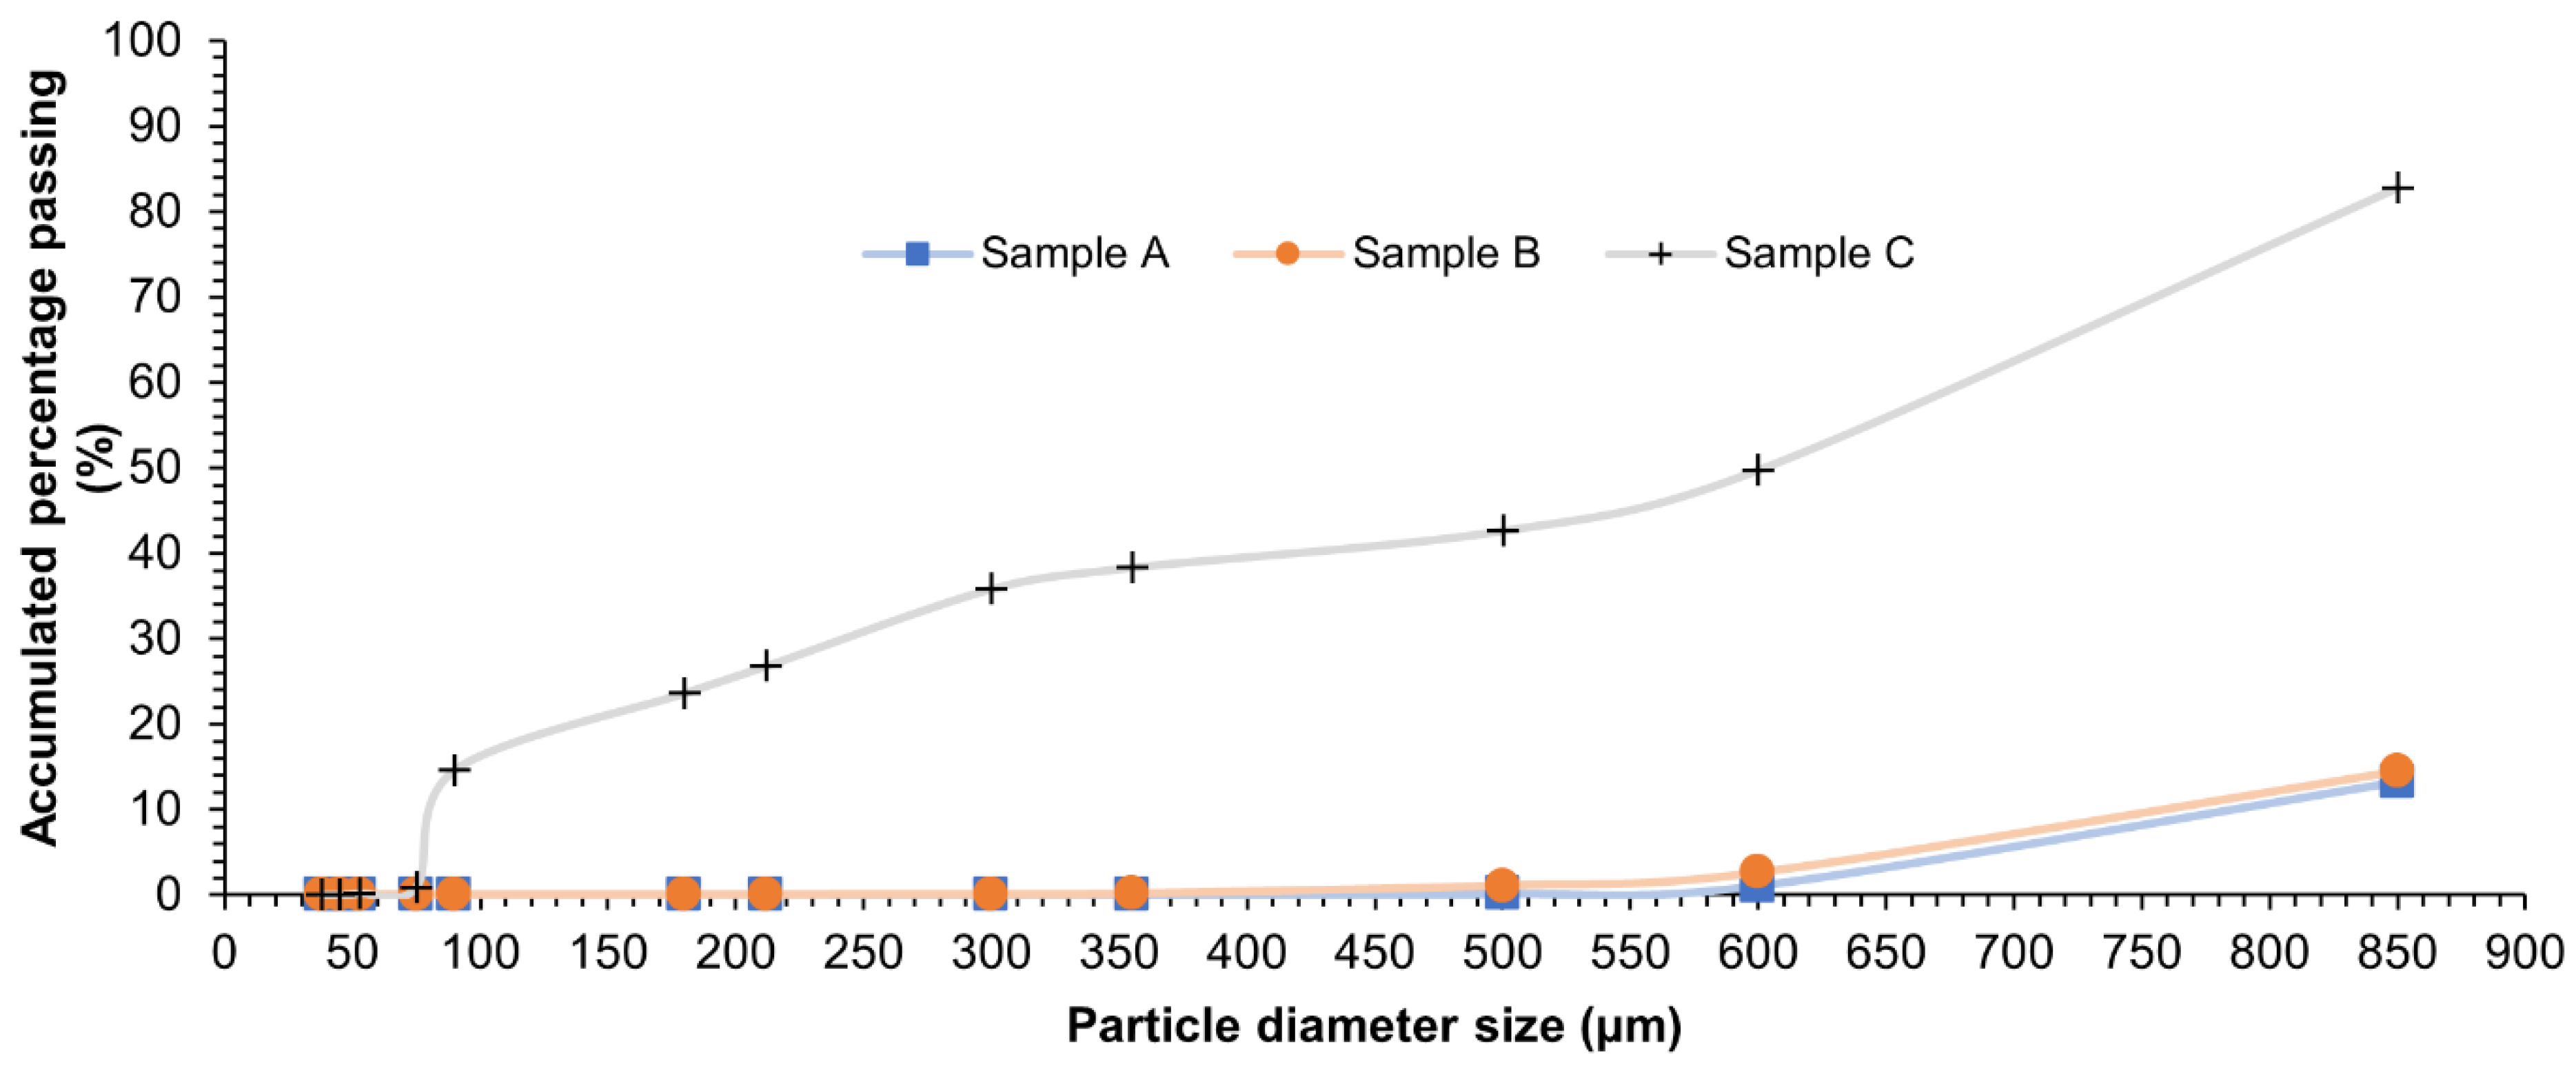
3.1. Particle Size Distribution
3.2. Density, Bulk Density, and Specific Weight
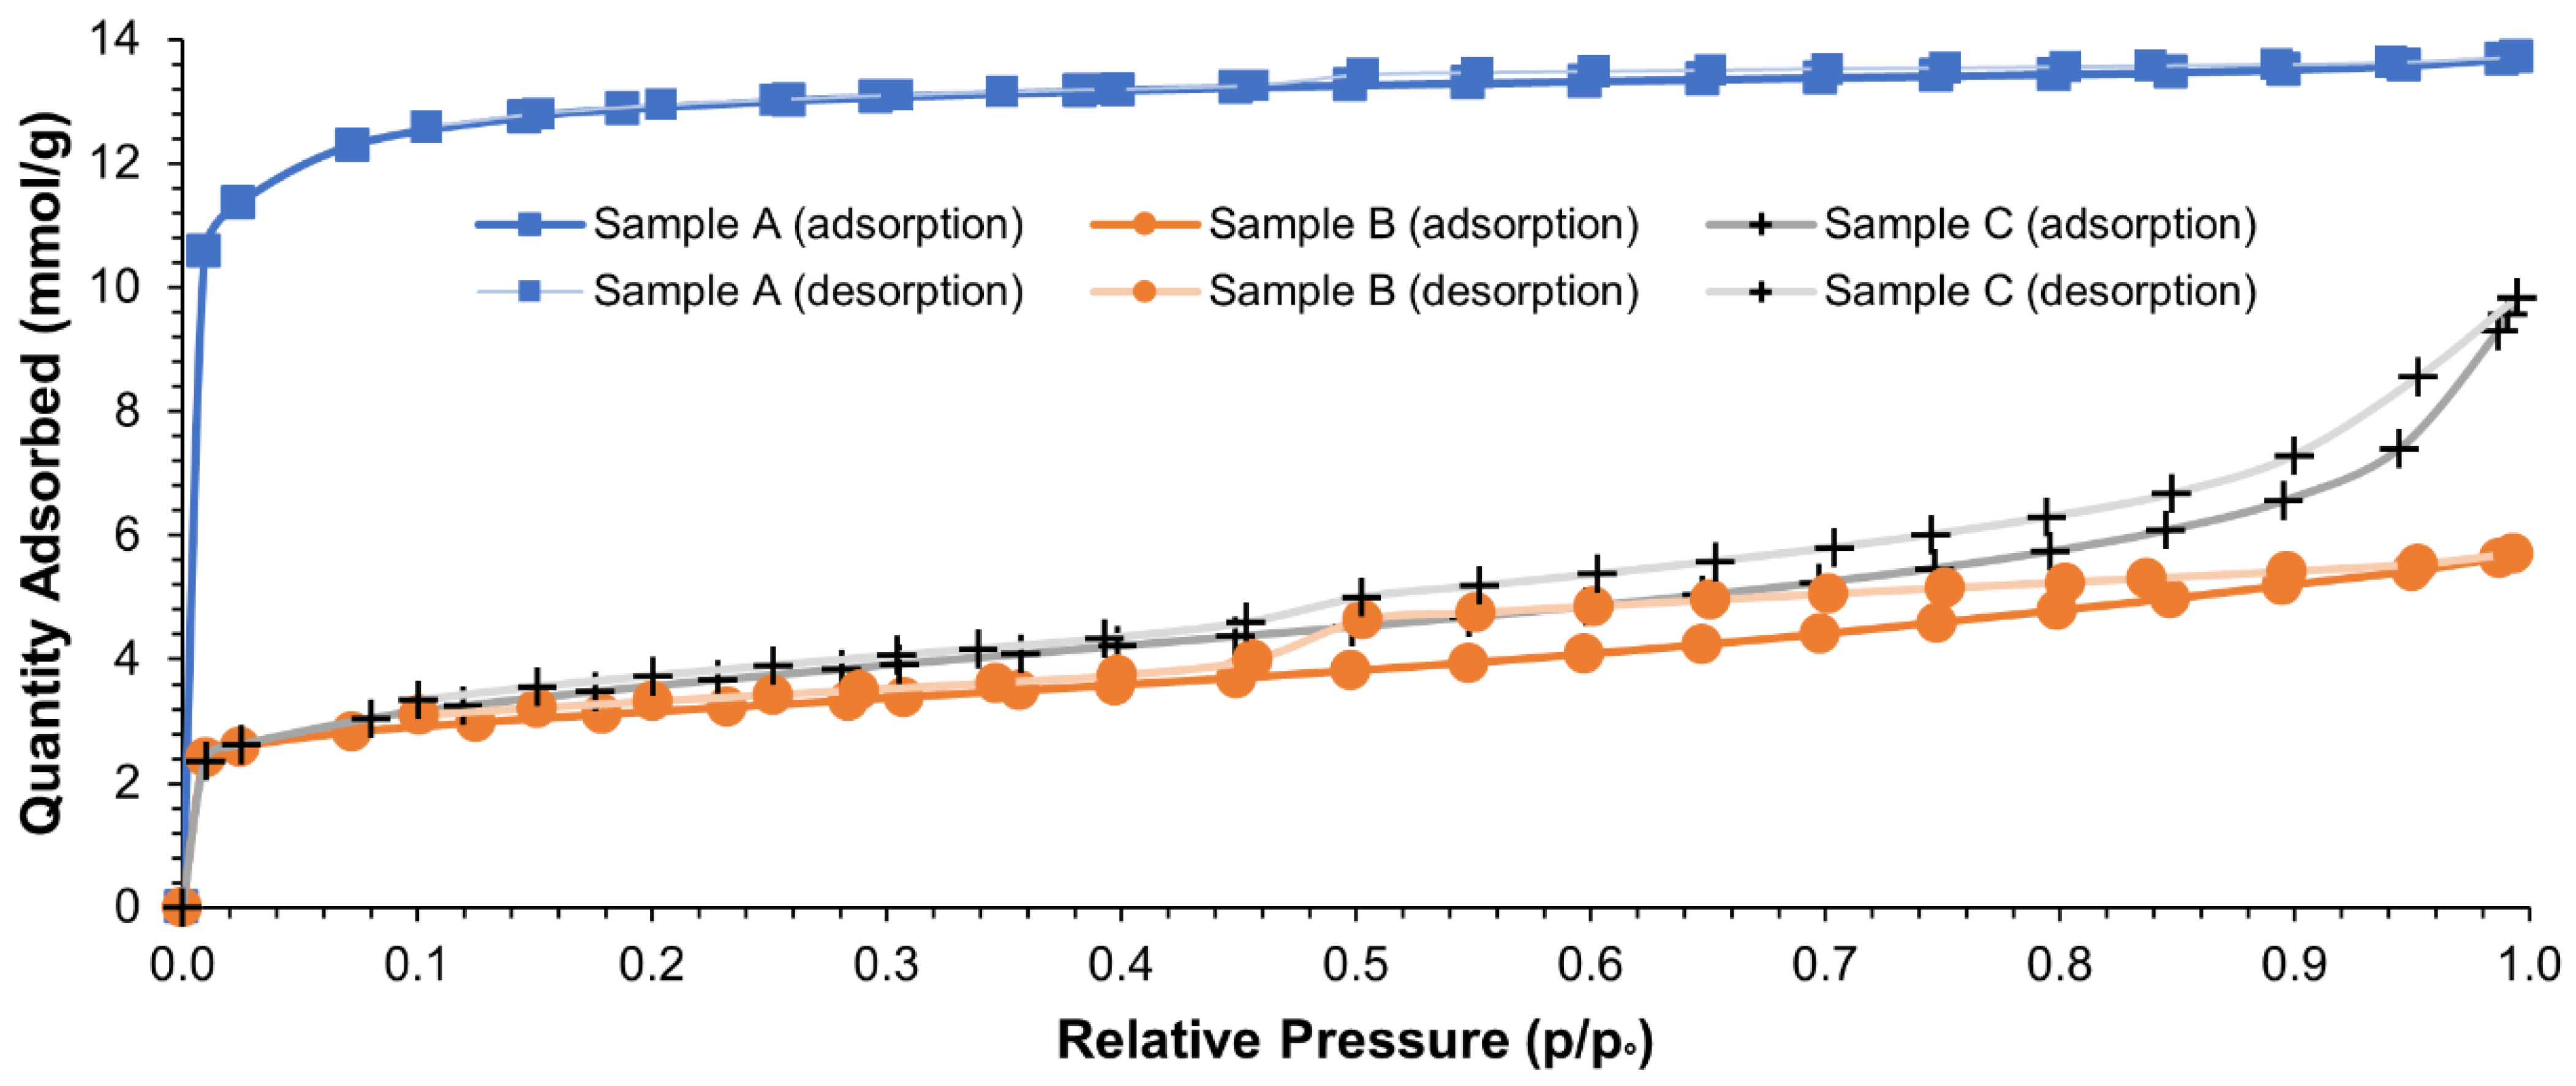
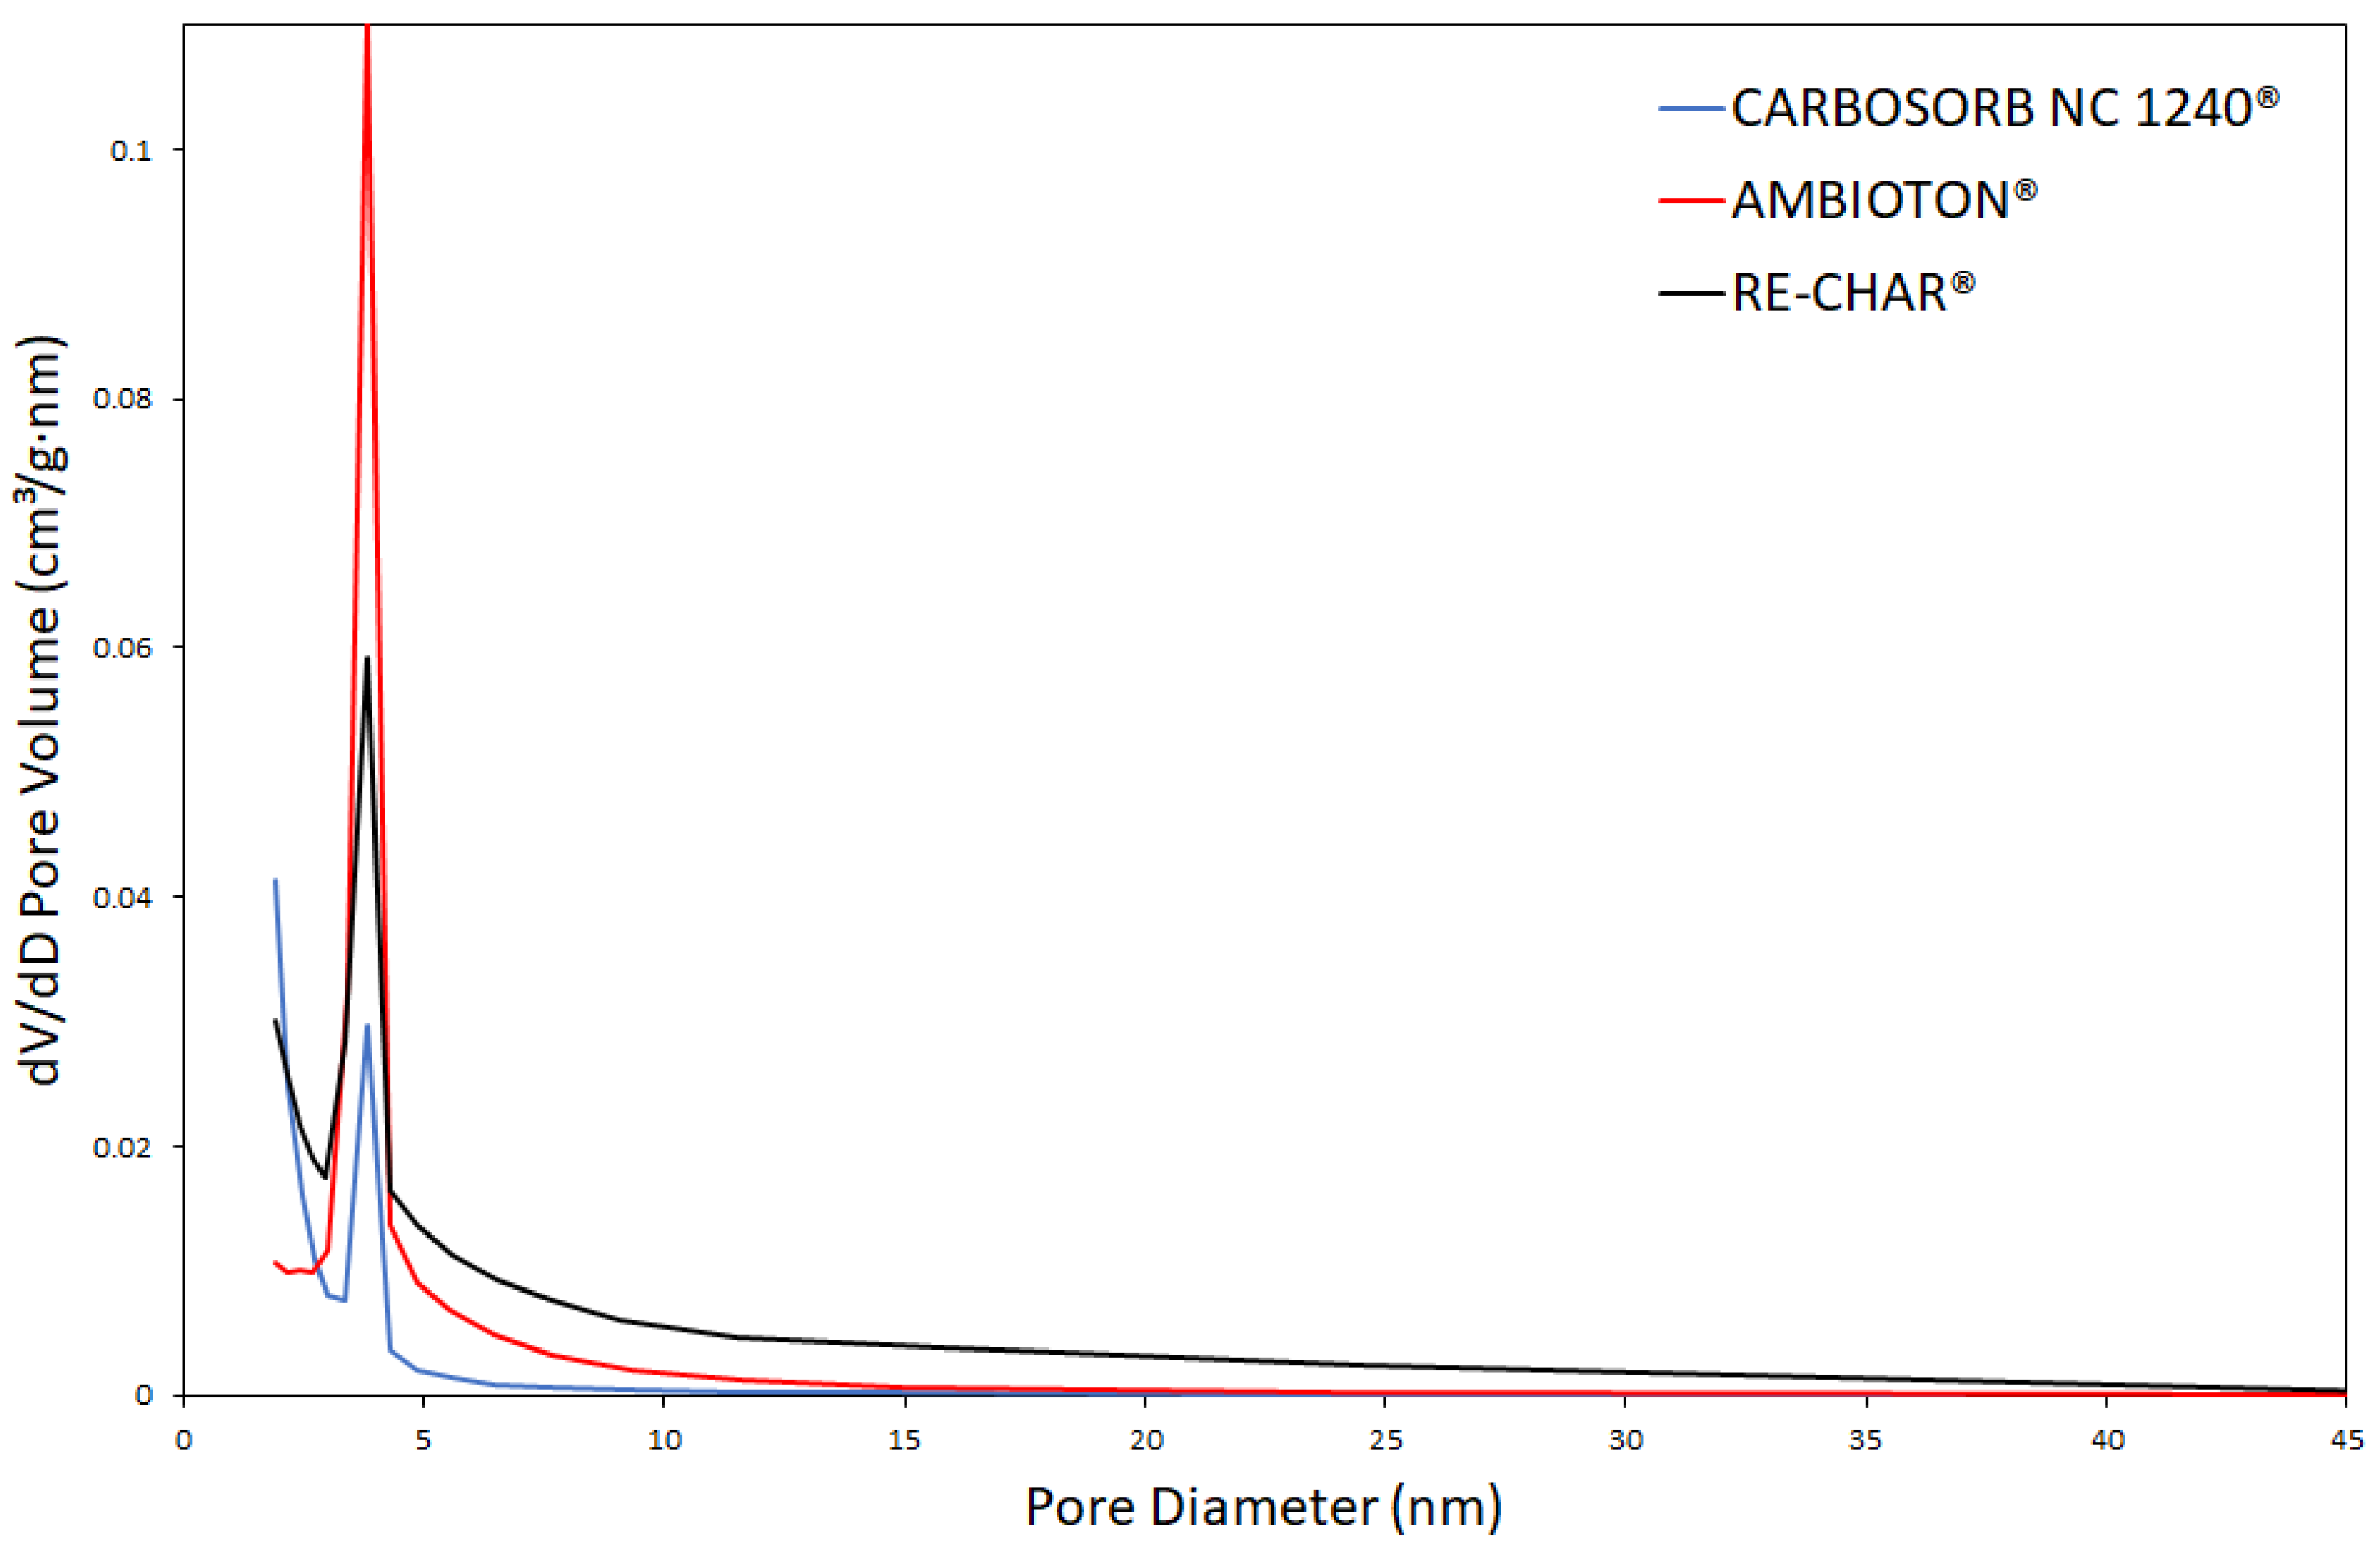
3.3. Specific Surface Area, Pore Volume, and Average Pore Size
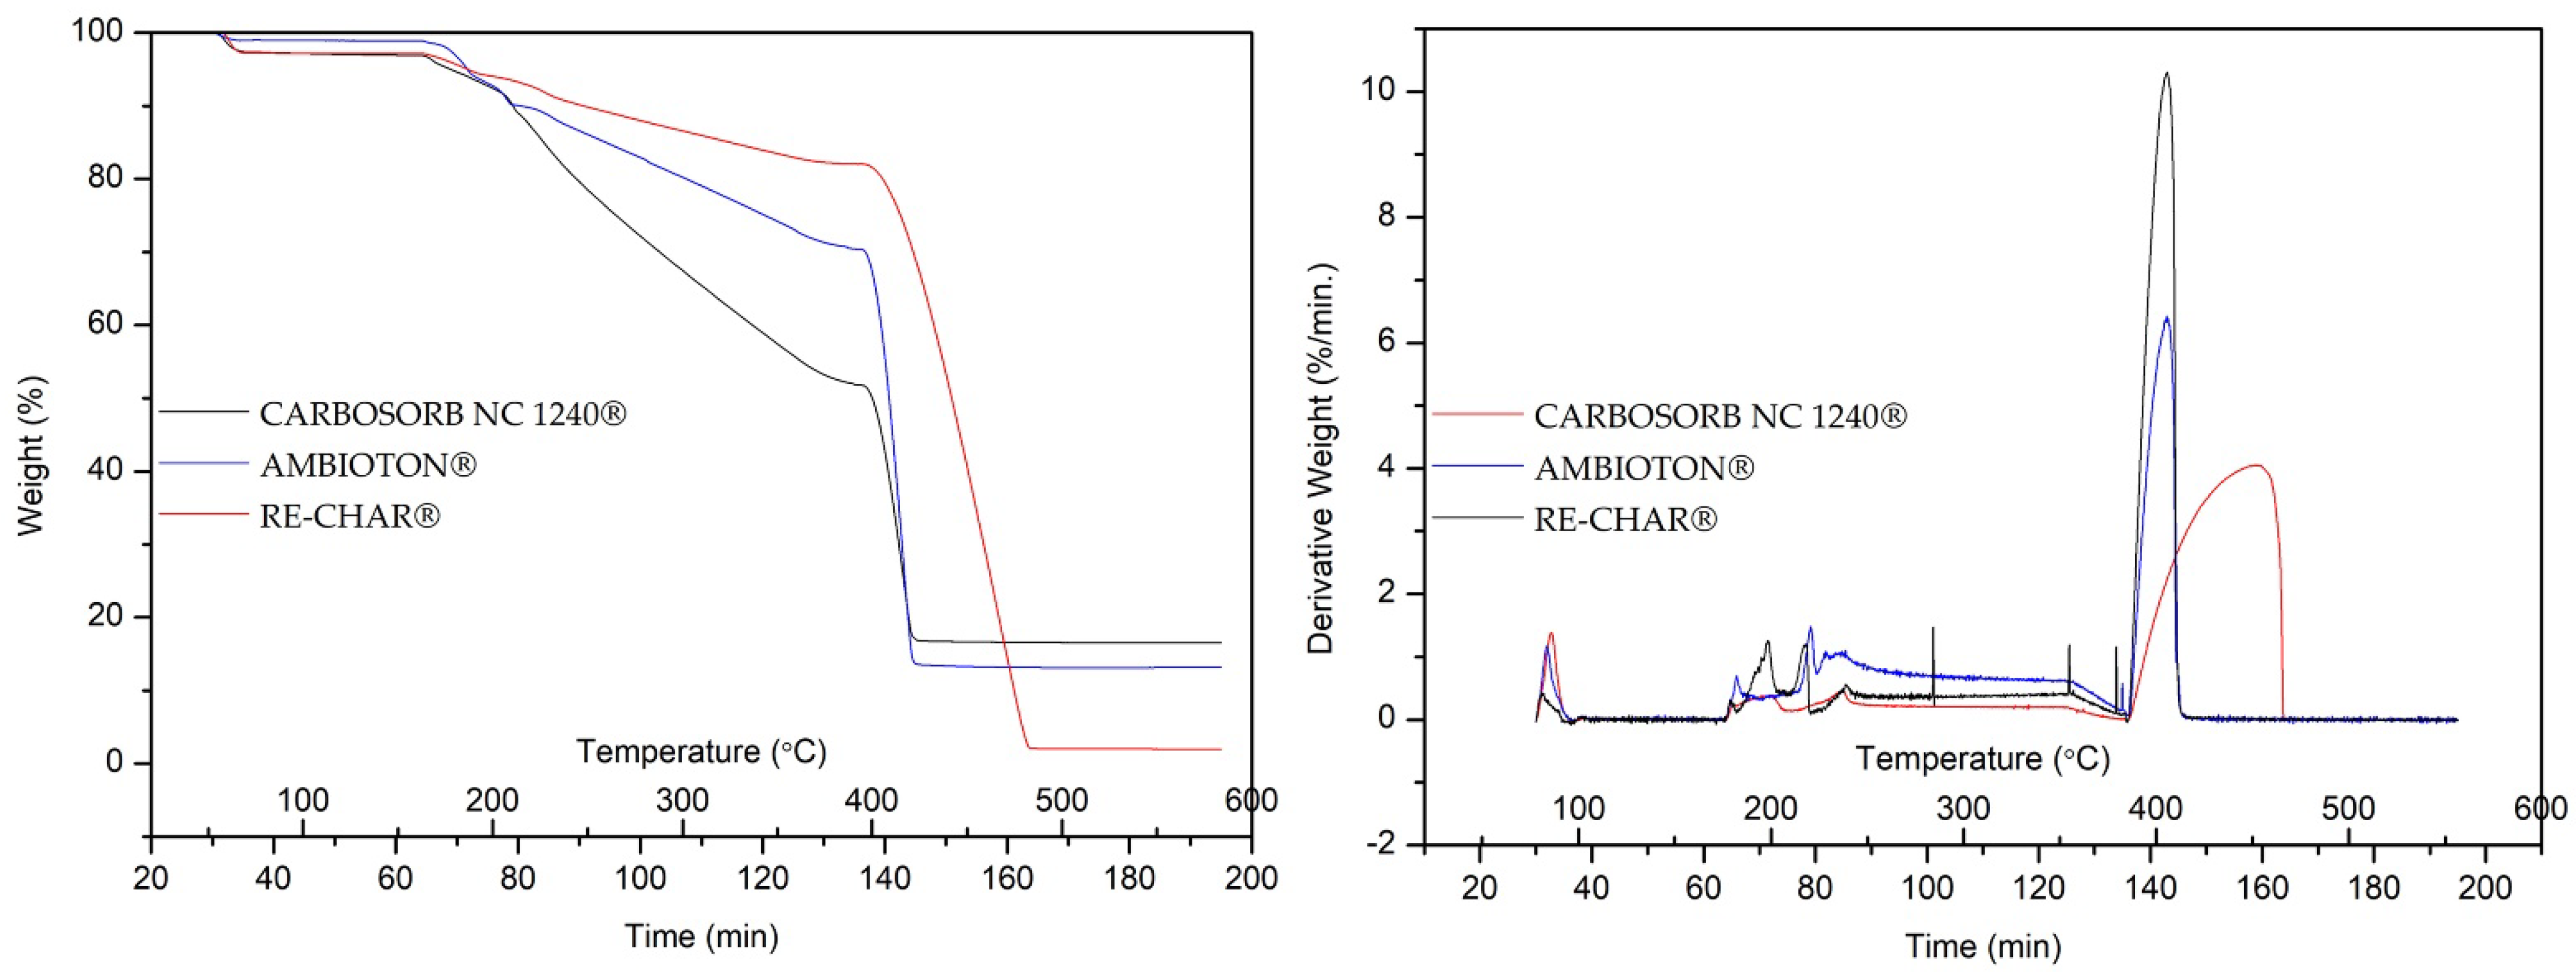
3.4. Moisture Content, Volatile Matter, Ash Content, and Fixed Carbon
3.5. Conductivity
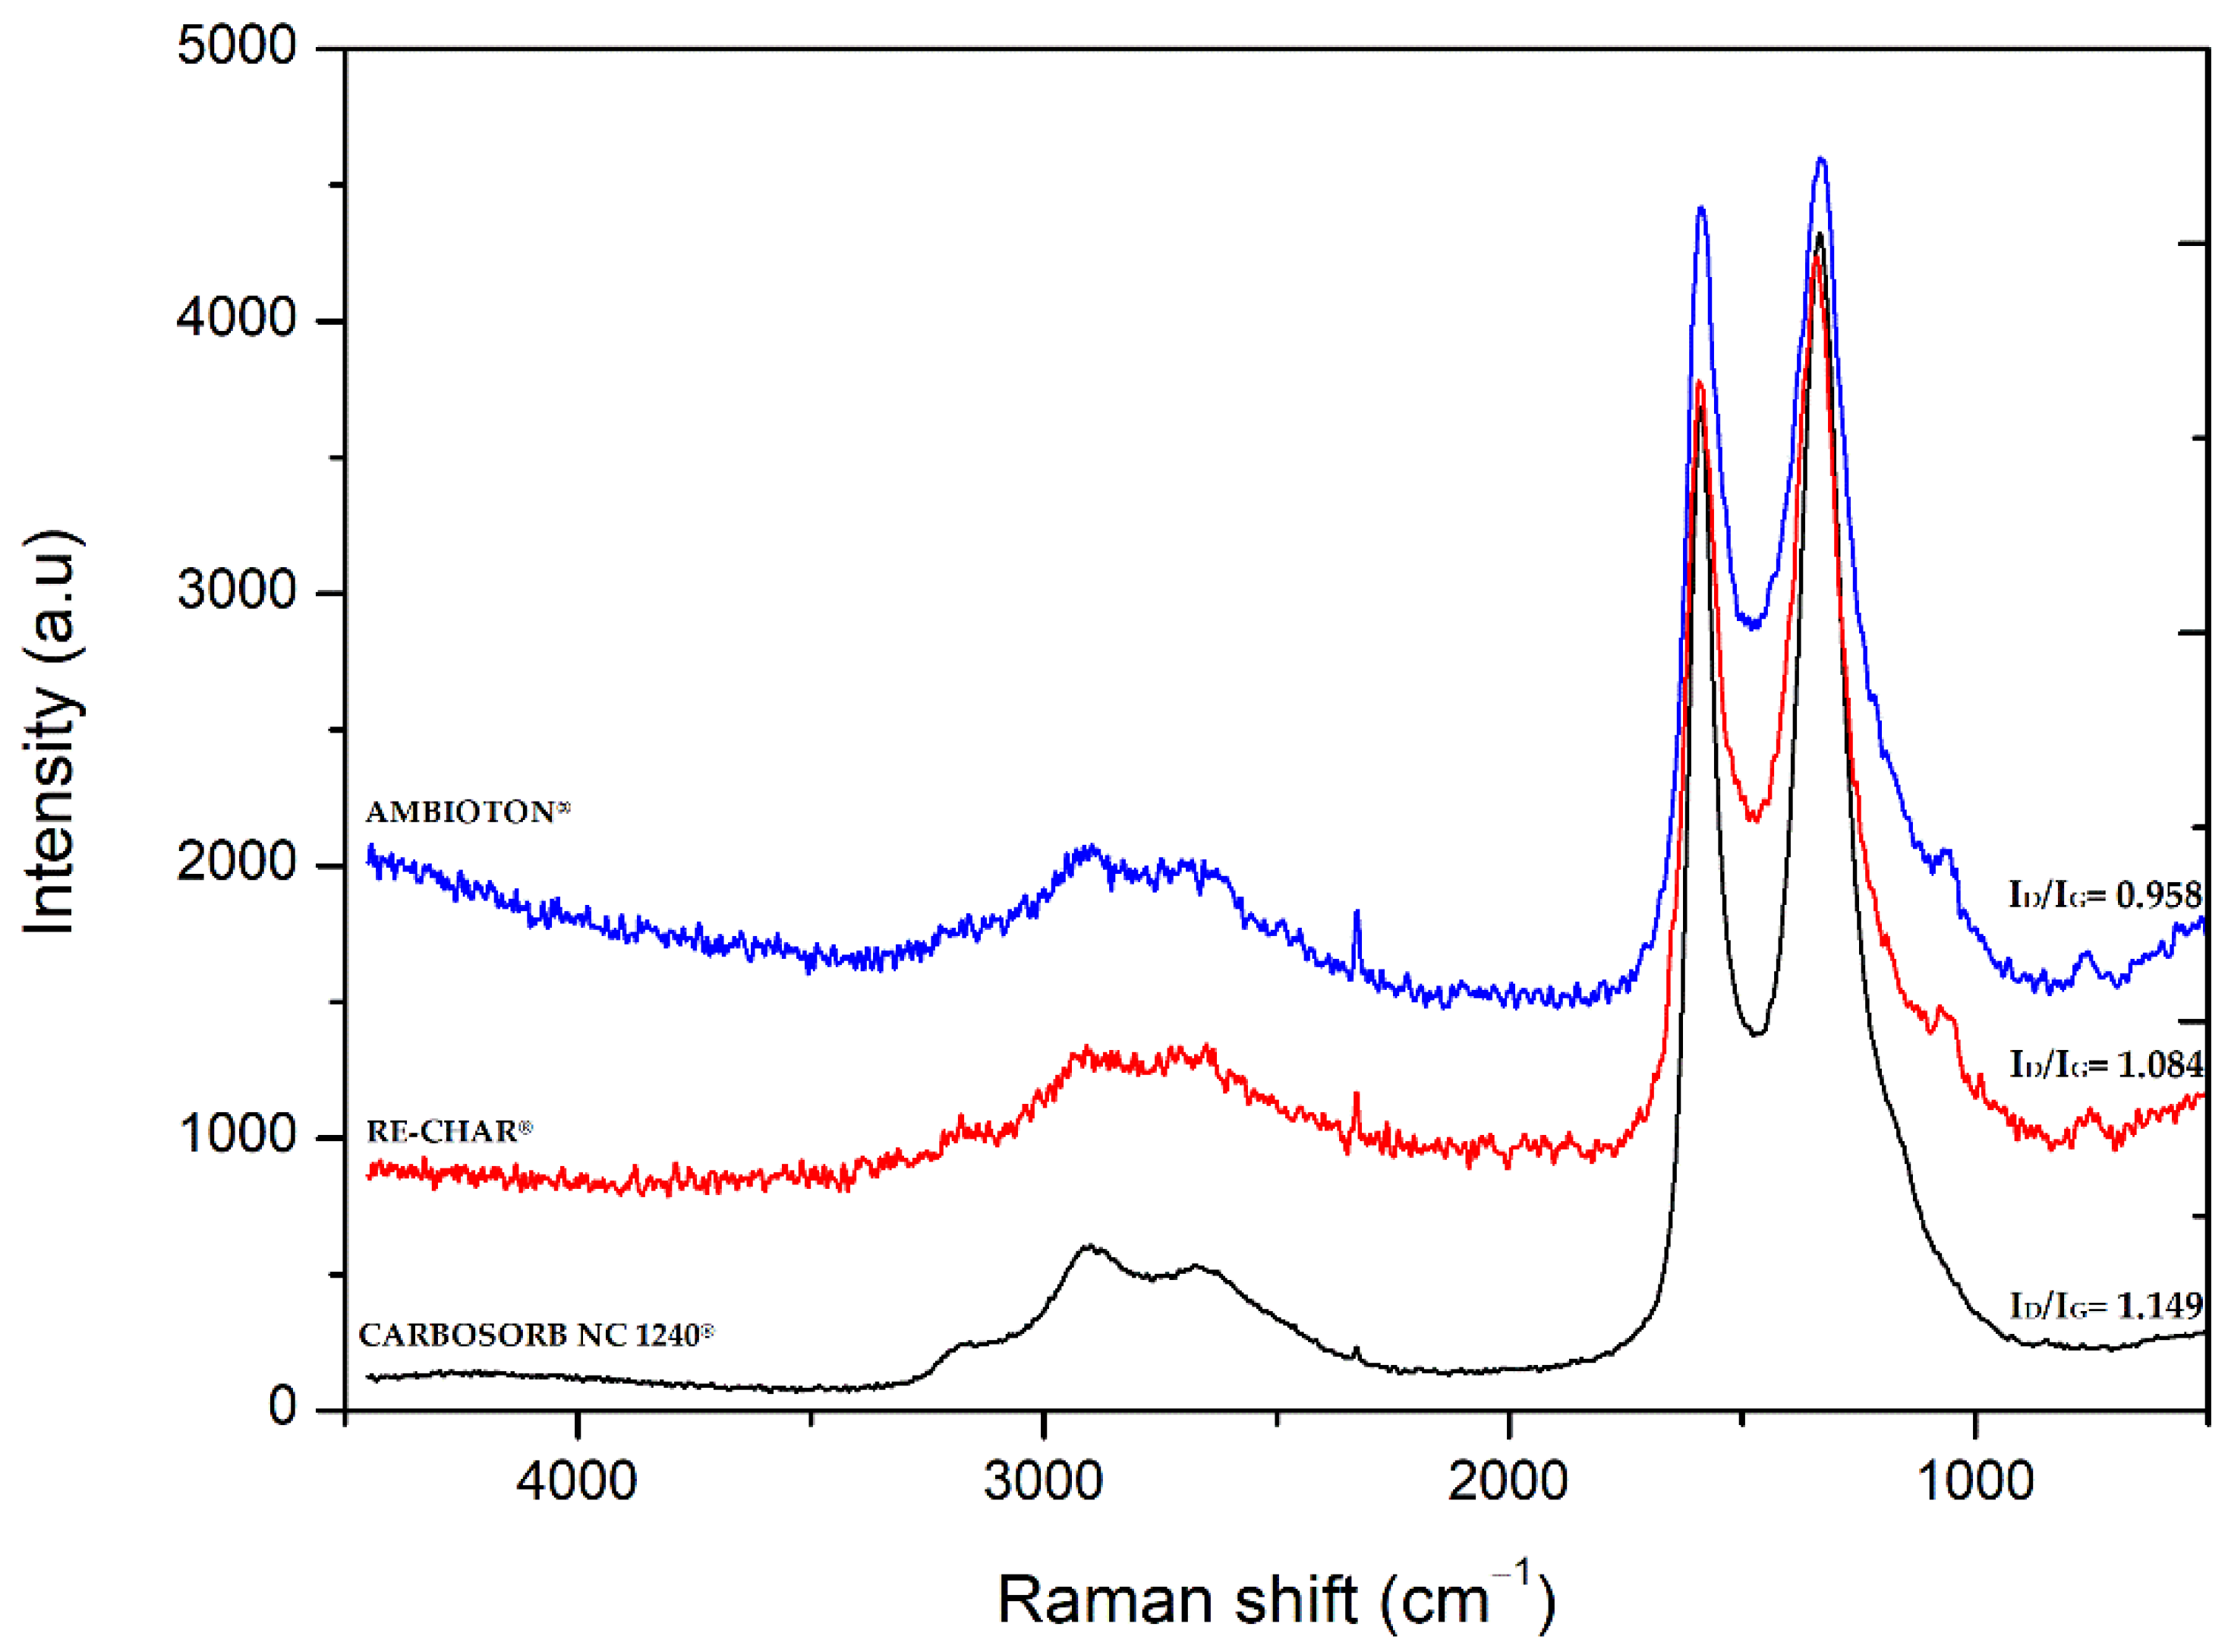
3.6. Raman Spectroscopy
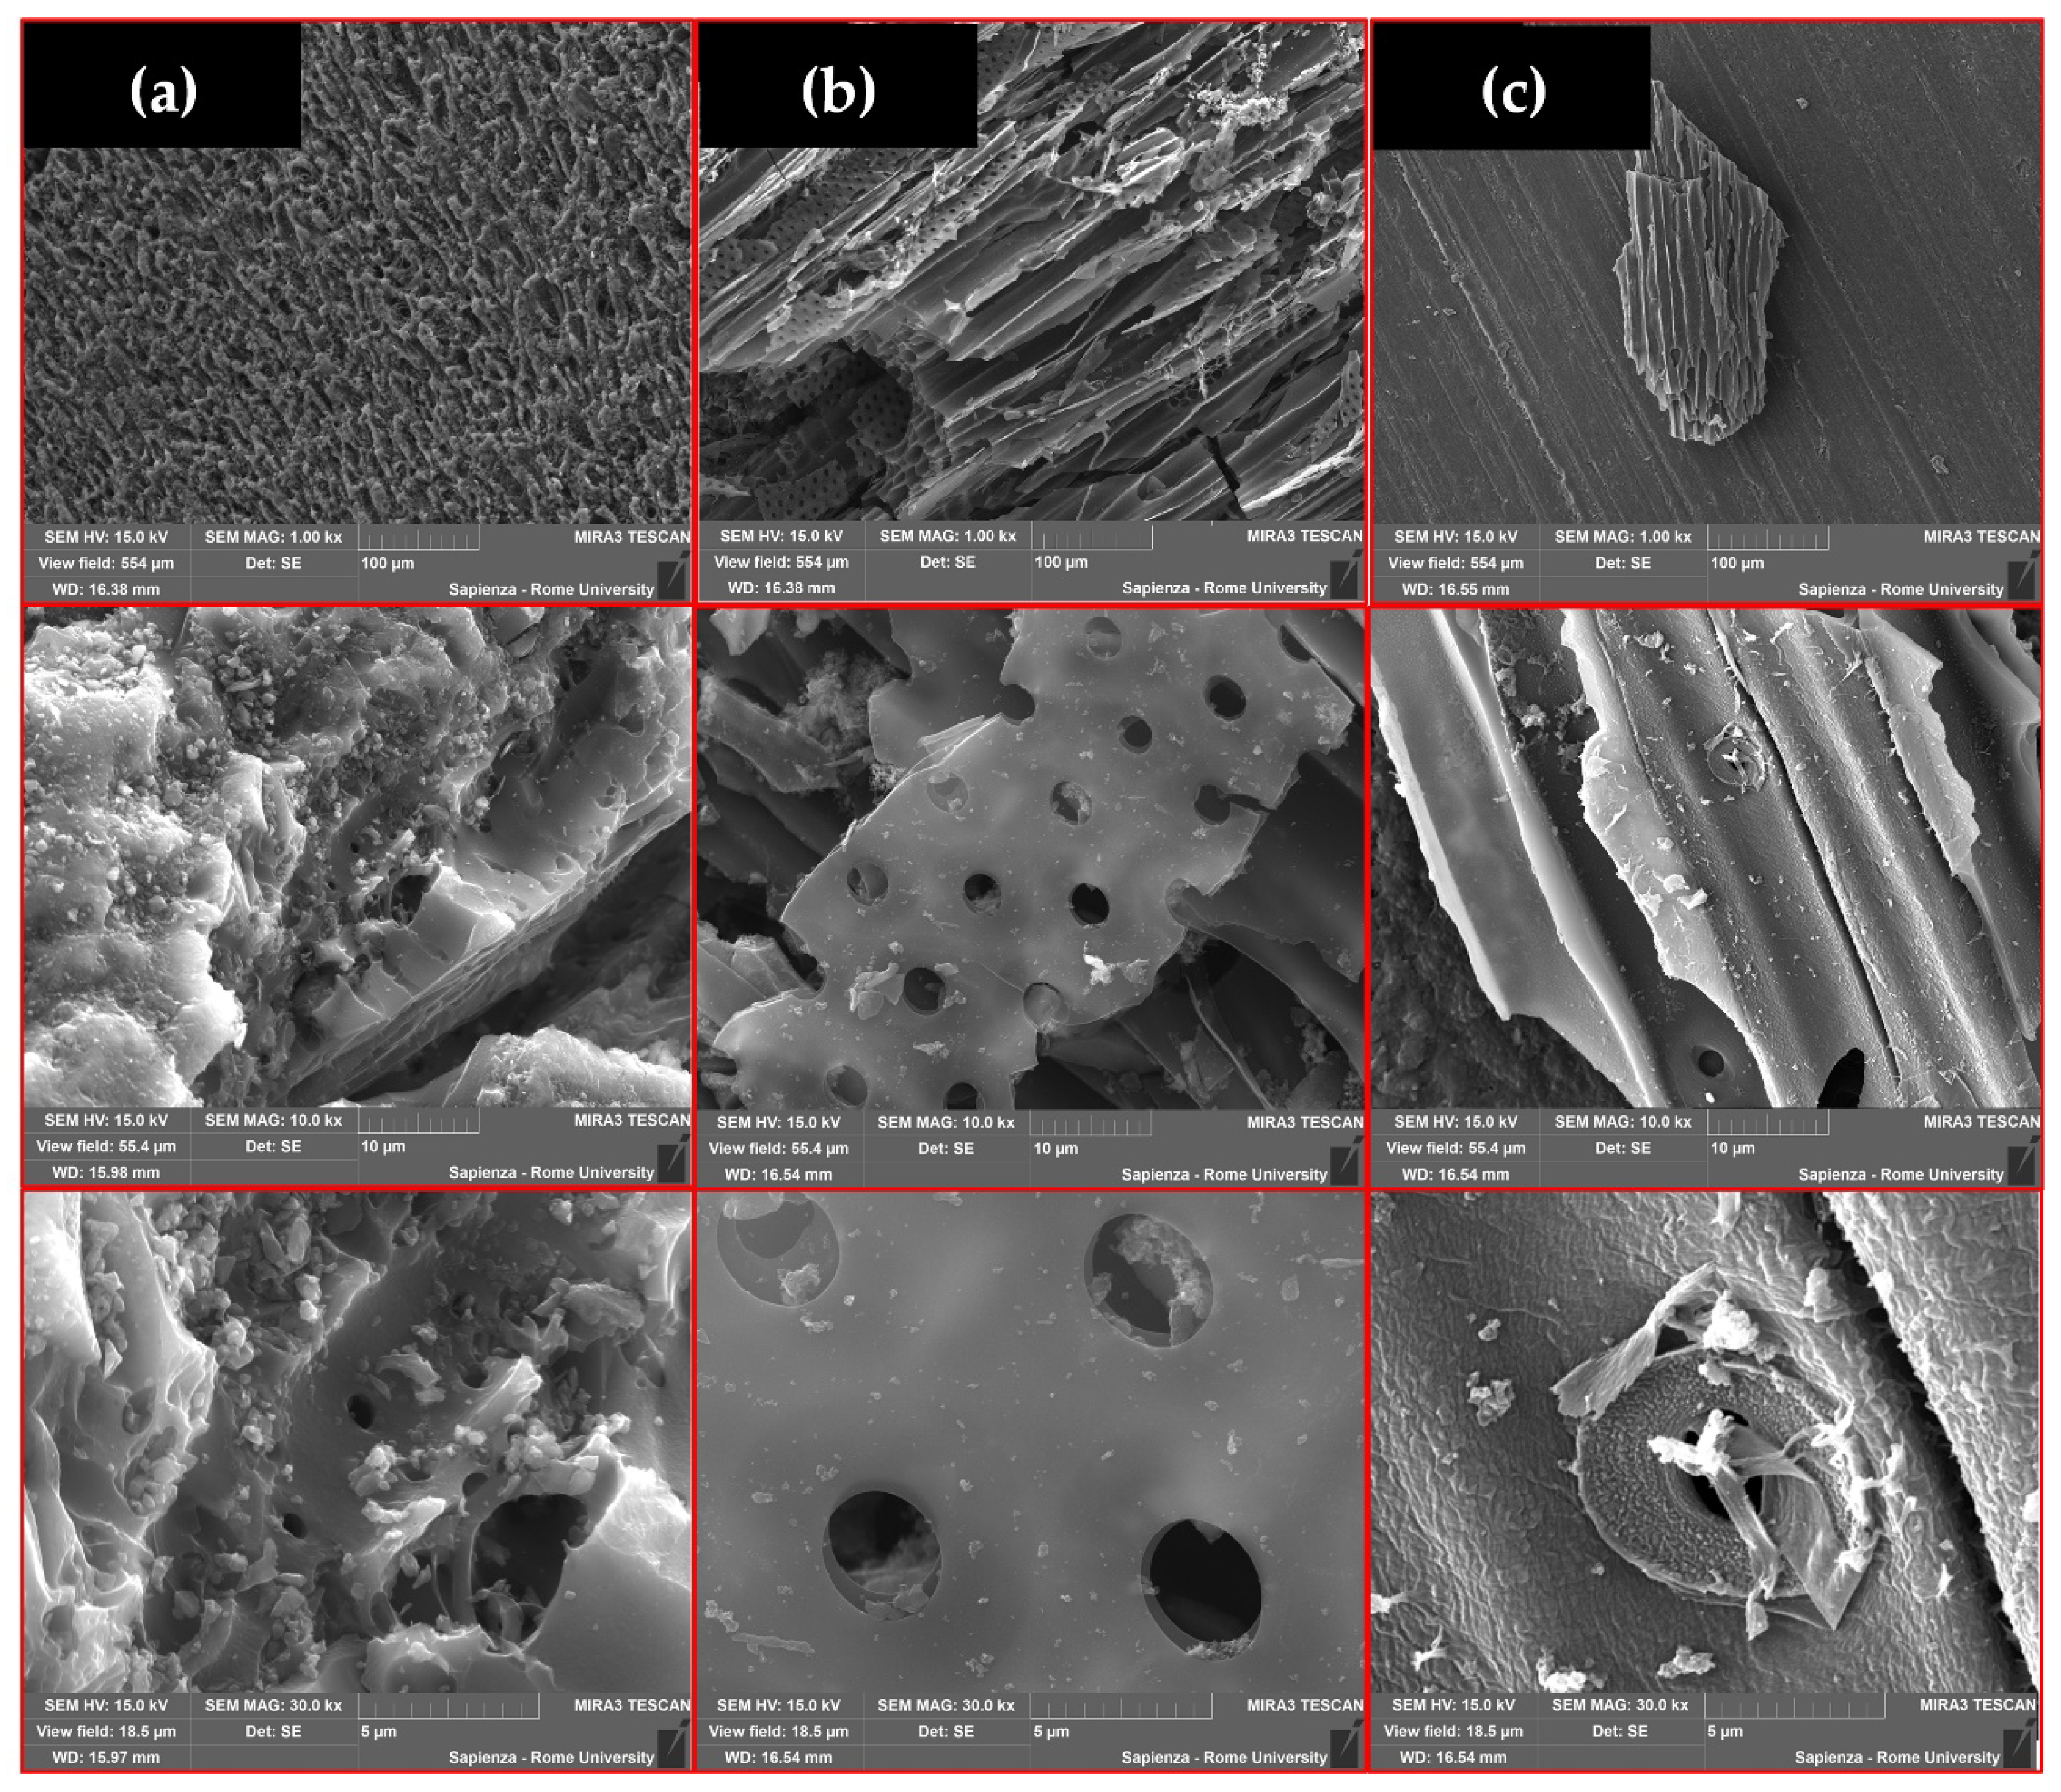
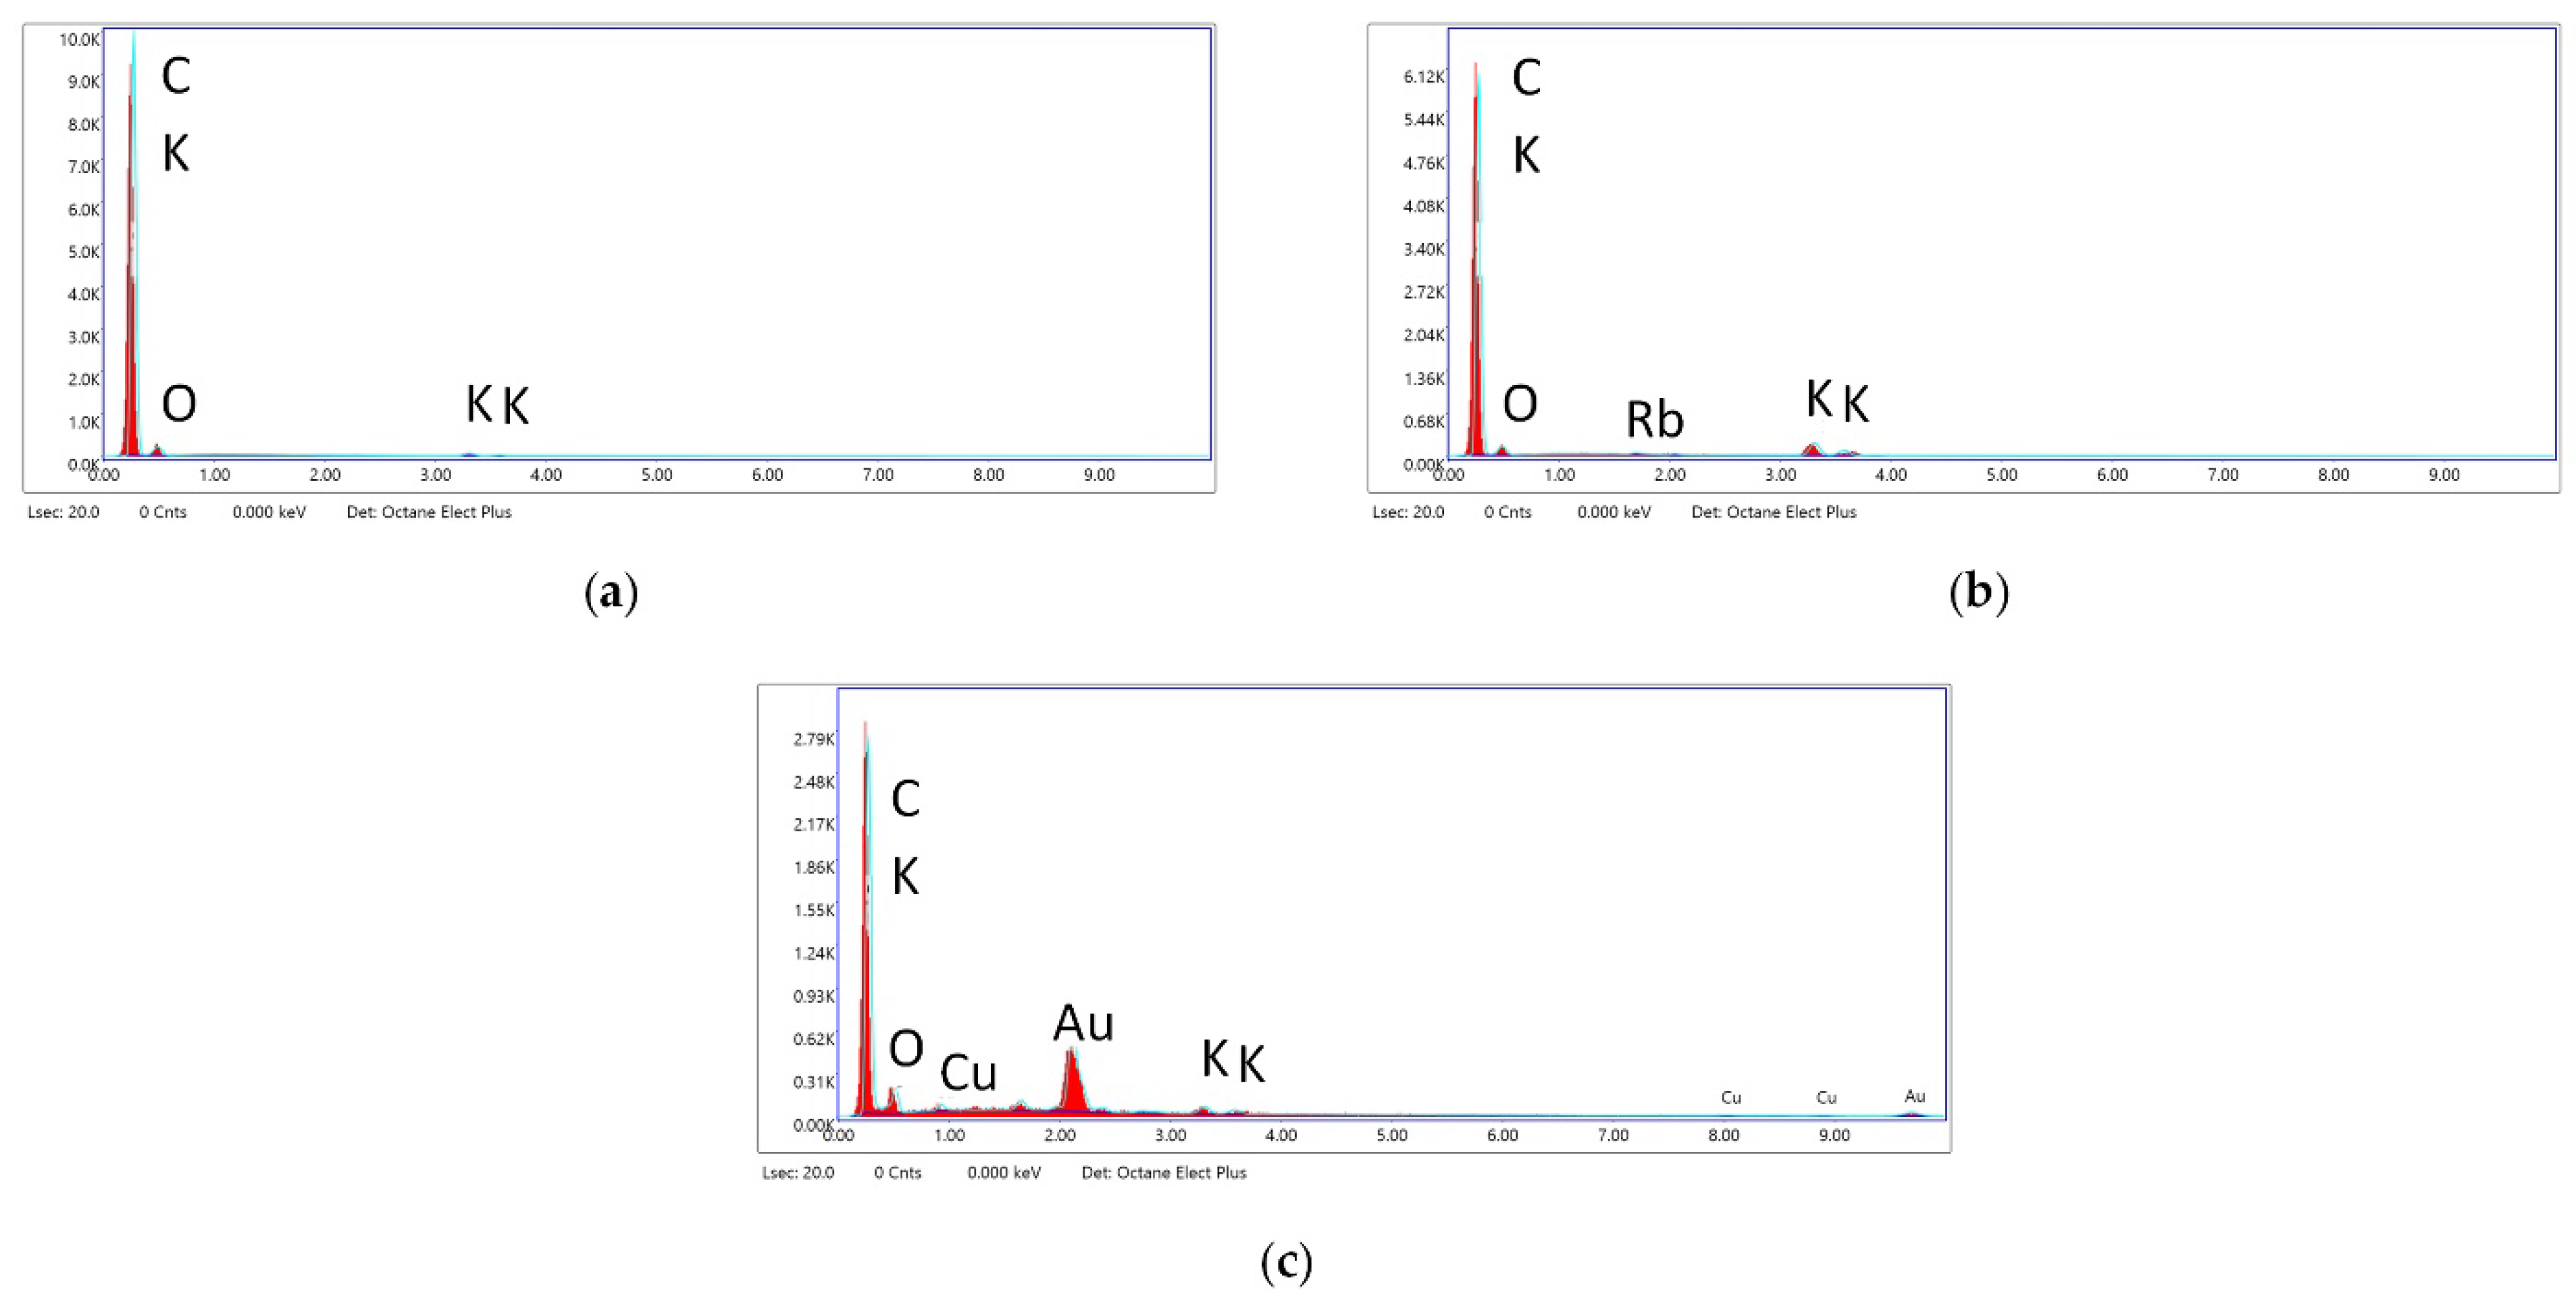
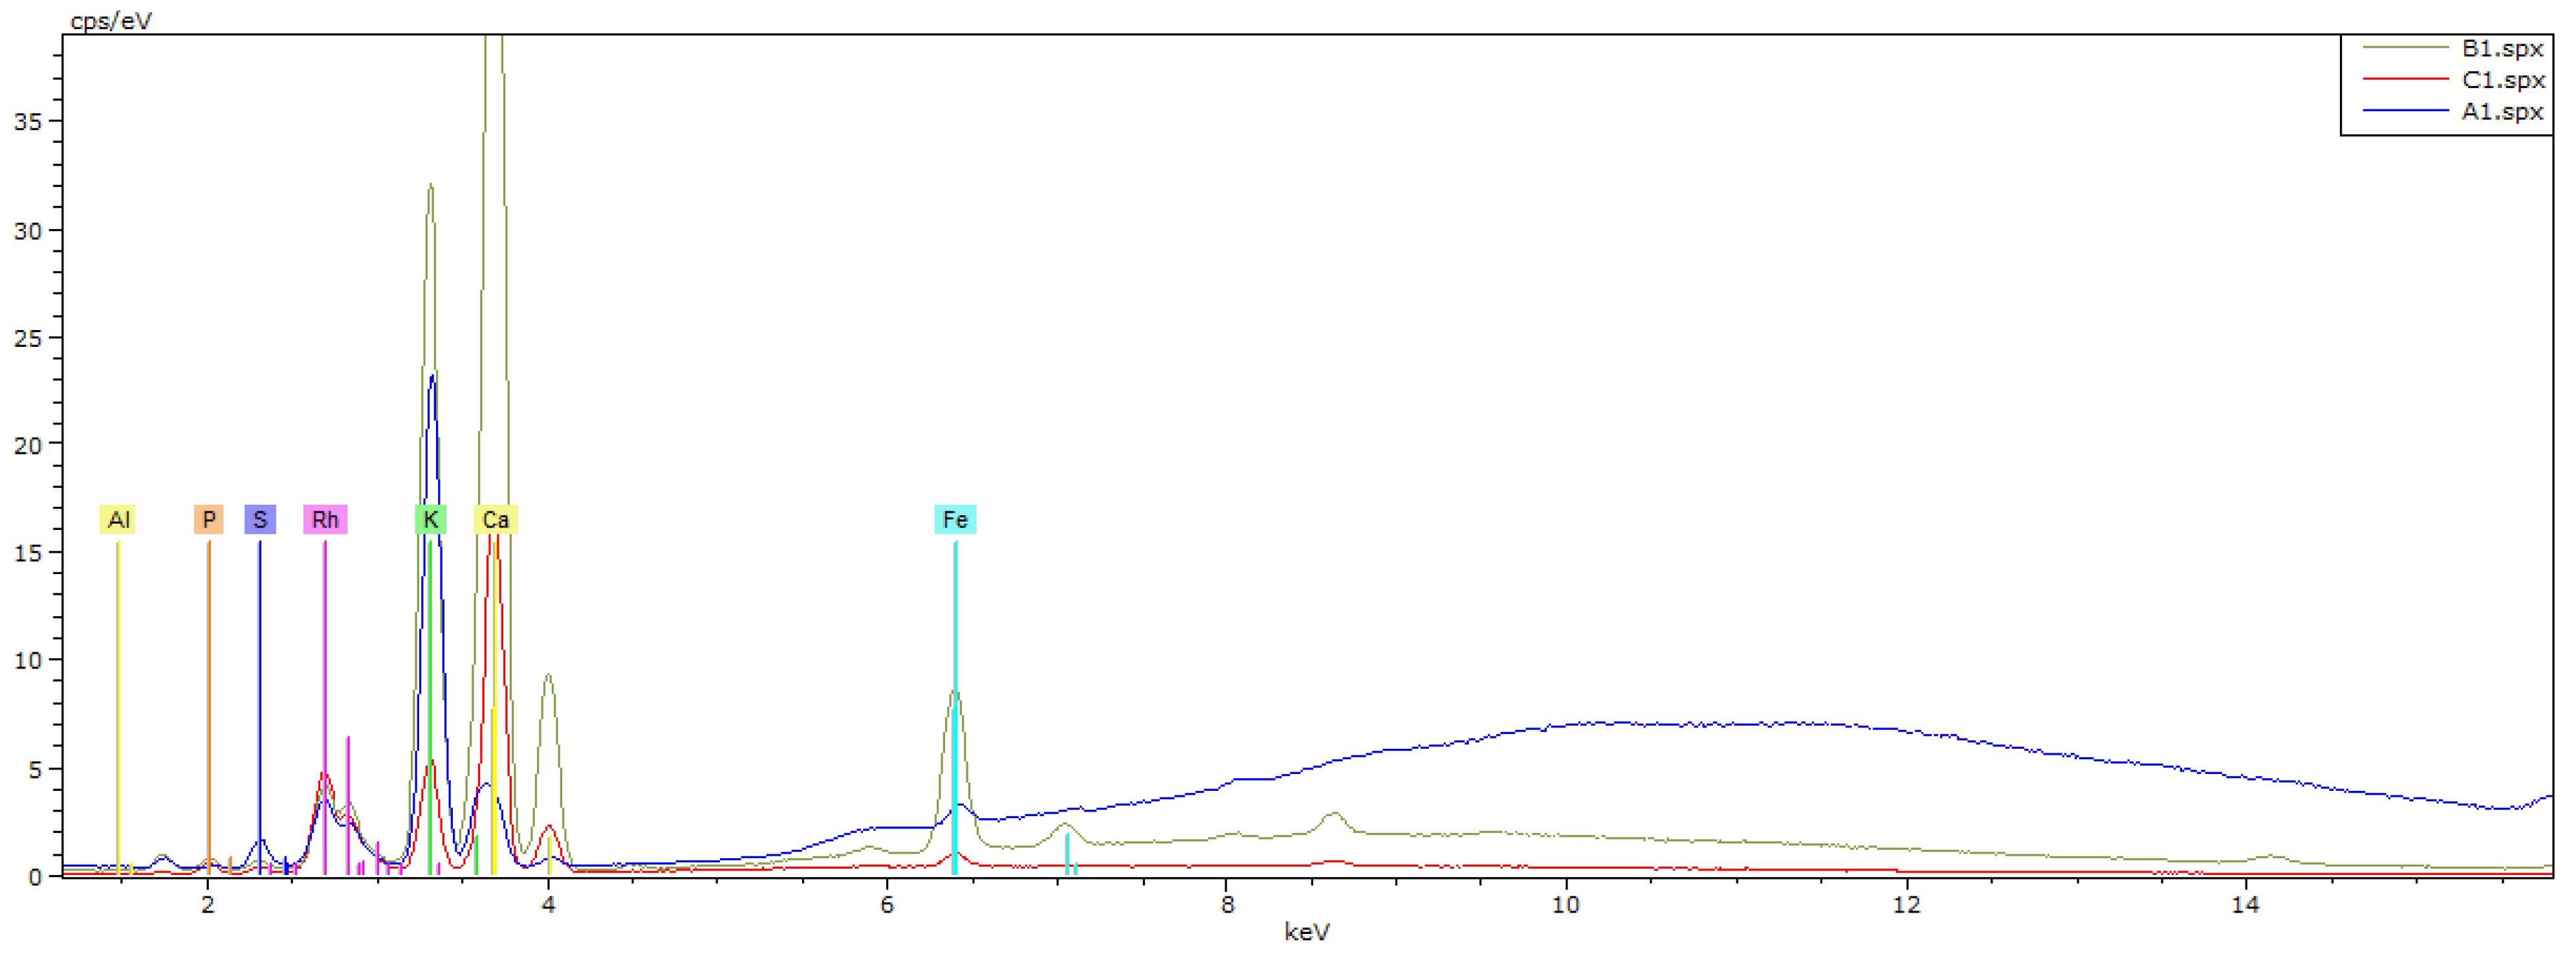
3.7. Scanning Electron Microscopy and Energy-Dispersive X-ray Spectroscopy
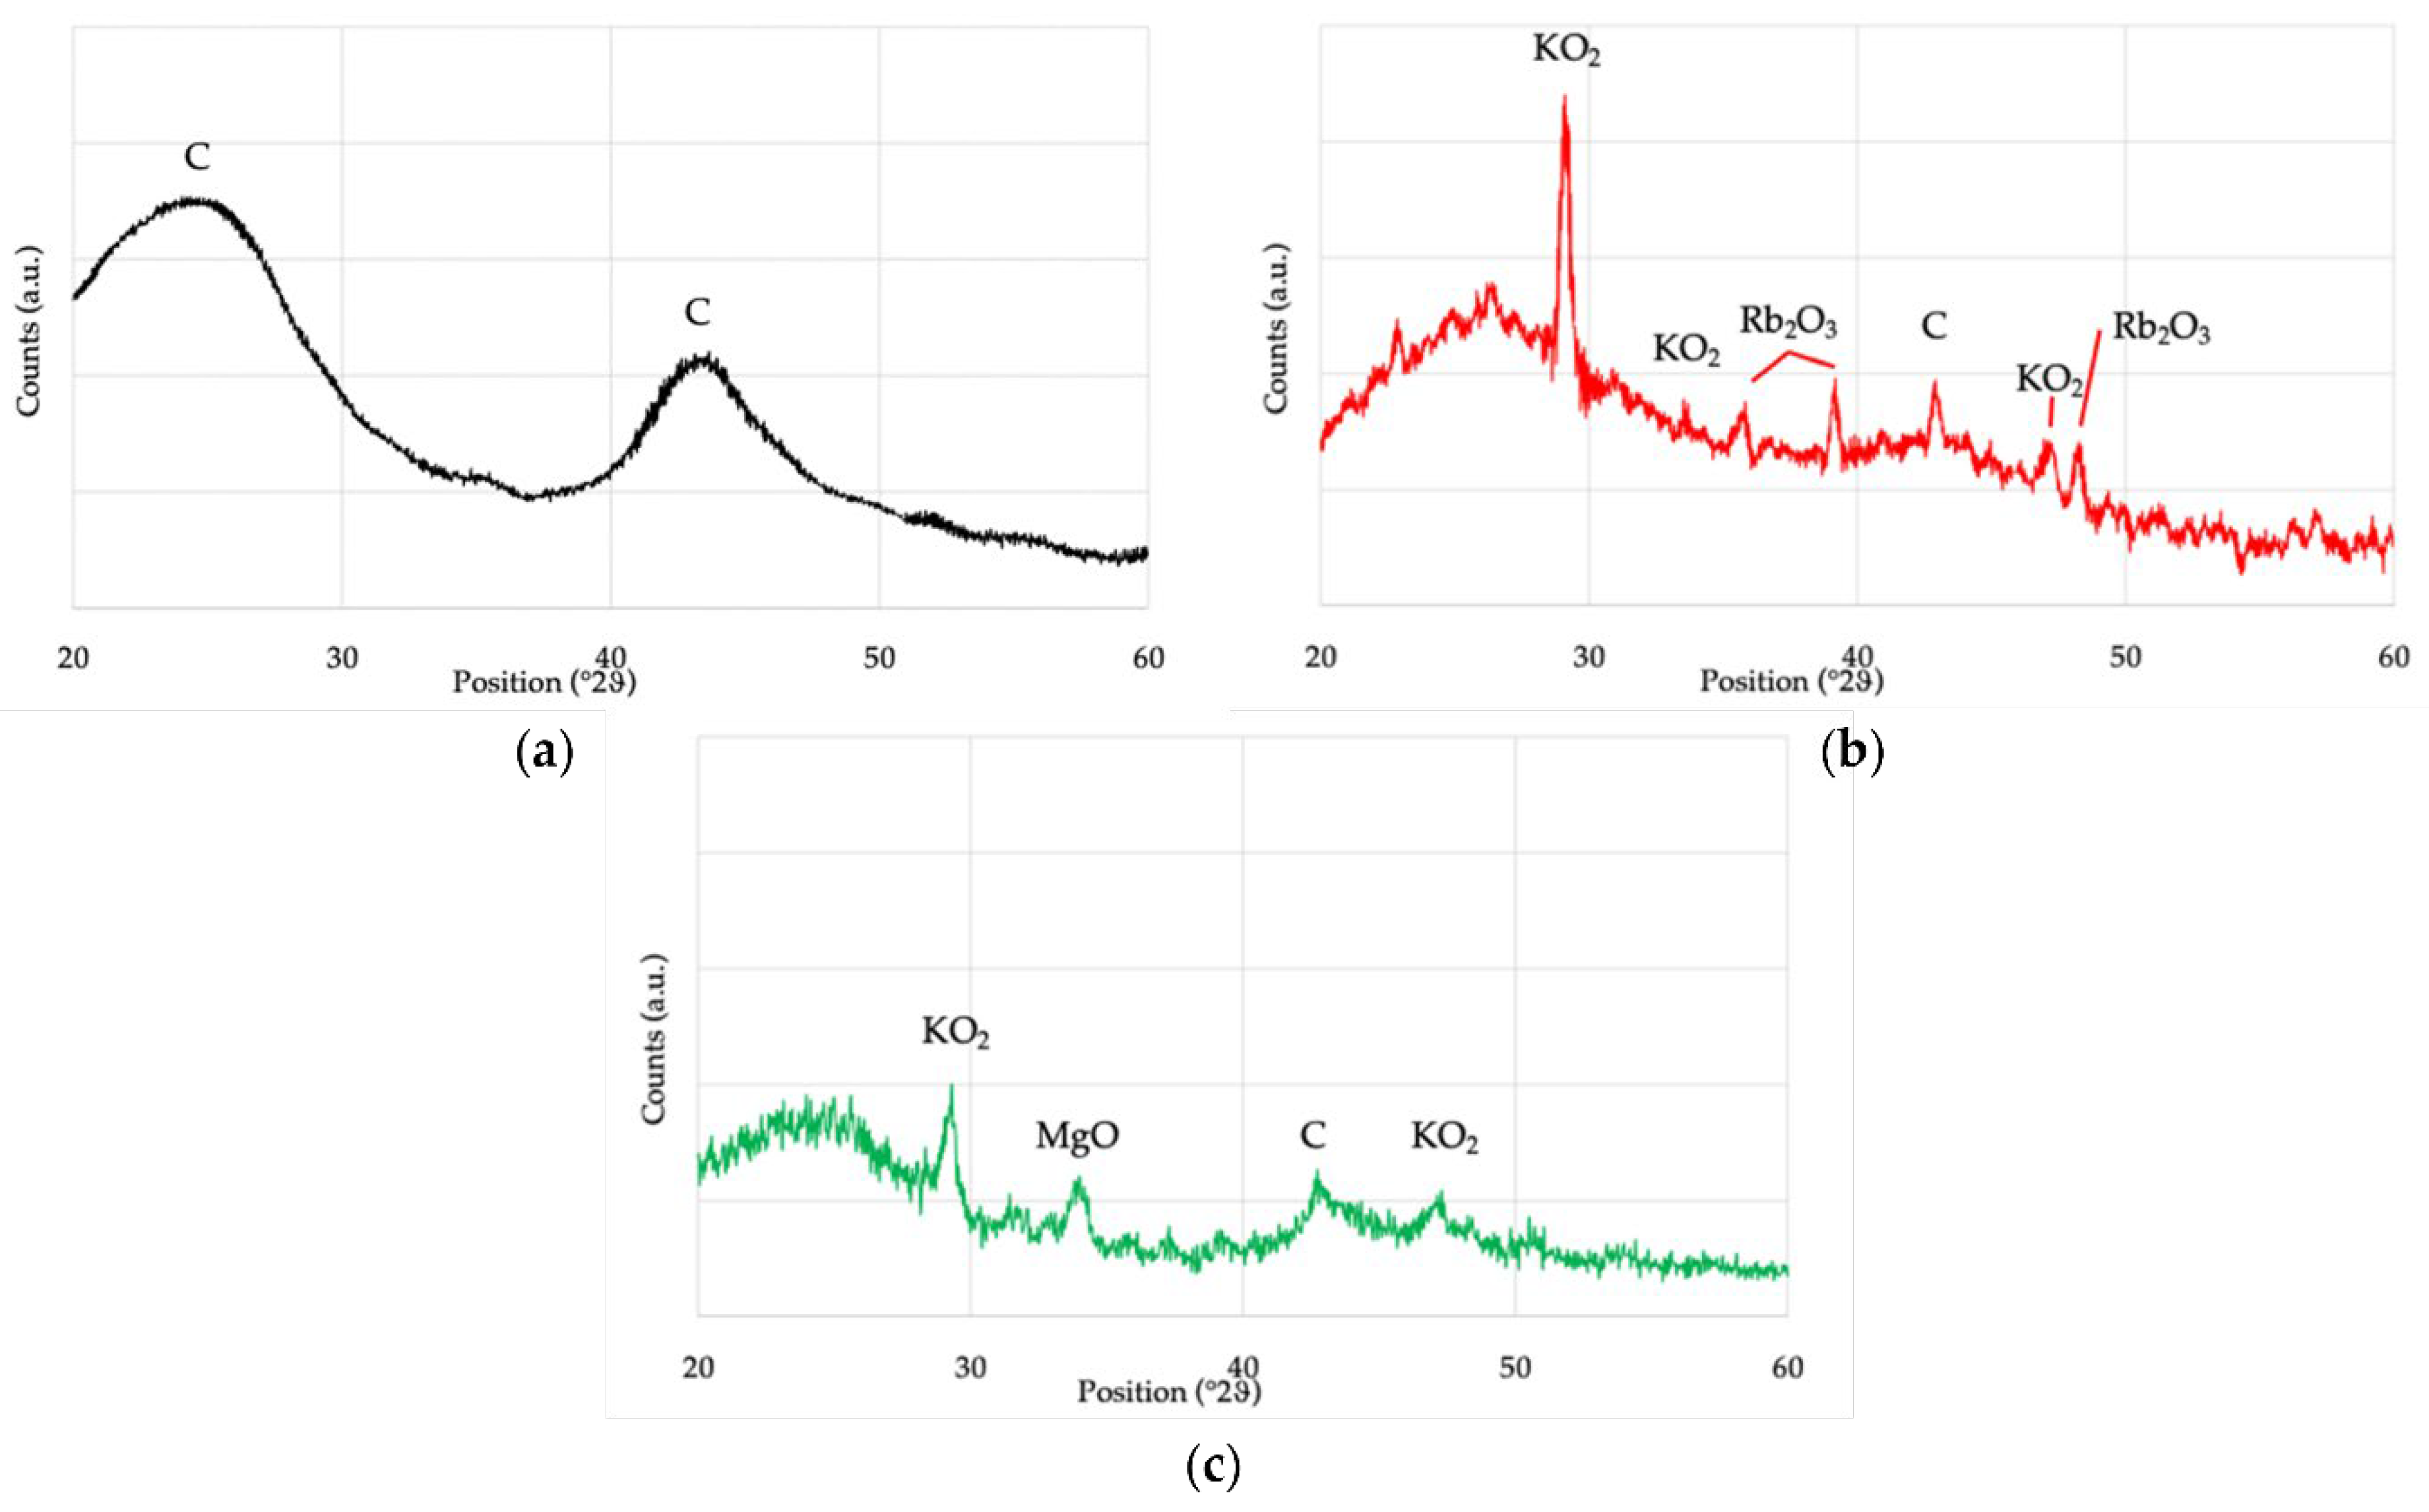
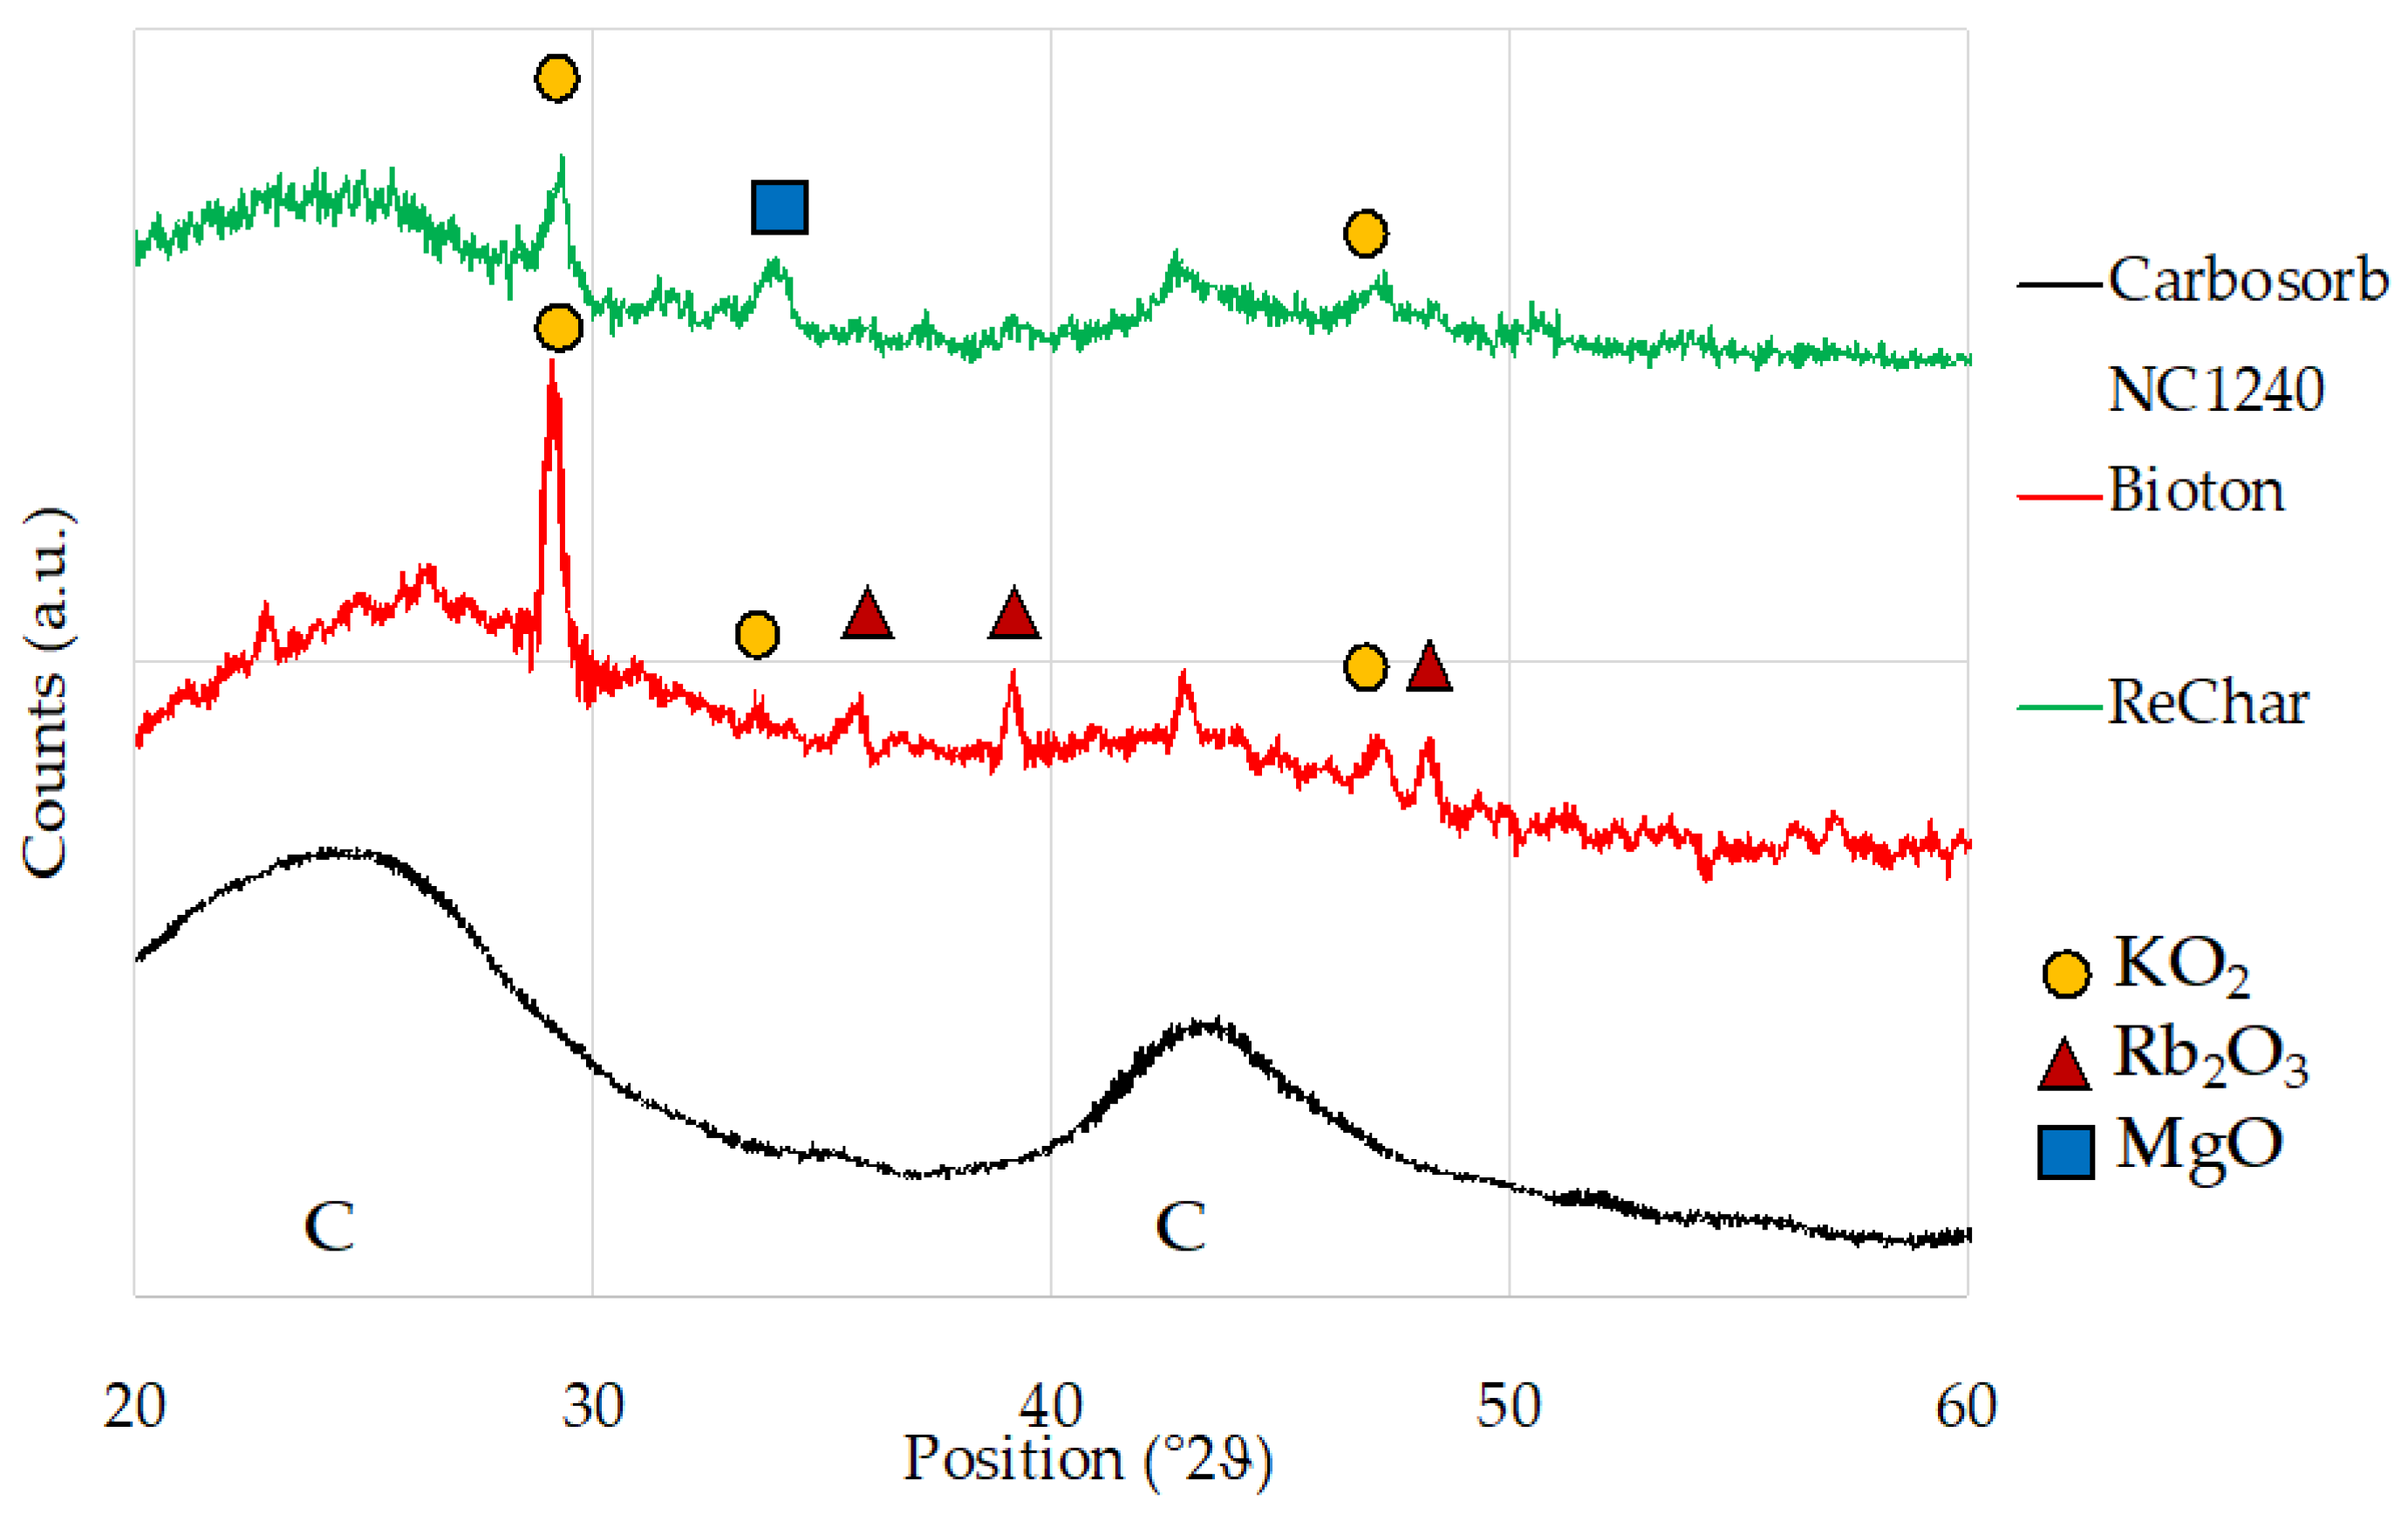
3.8. X-ray Diffraction
3.9. Elemental Analysis
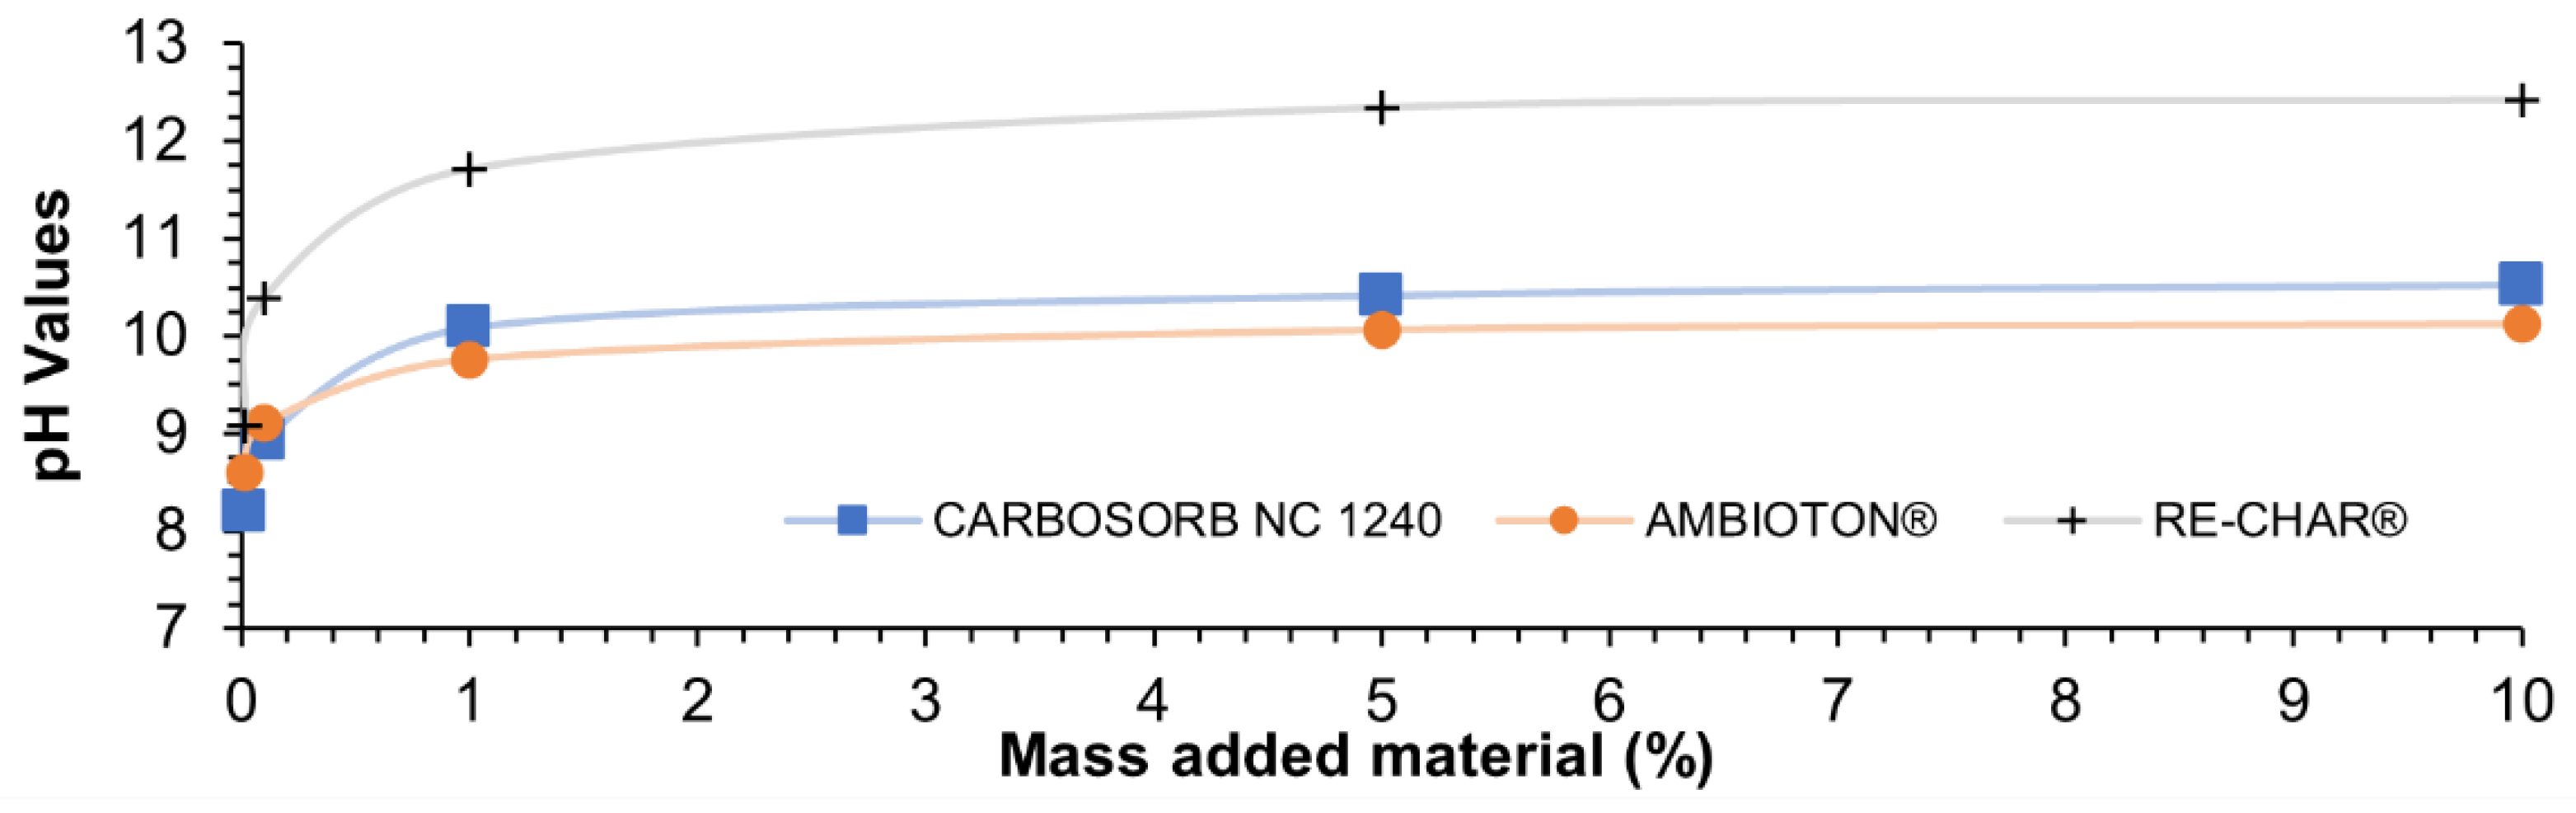
3.10. pH Analysis
3.11. Boehm Analysis
3.12. Cation and Anion Exchange Capacity
3.13. Methylene Blue and Iodine Index
4. Conclusions
Author Contributions
Funding
Institutional Review Board Statement
Informed Consent Statement
Data Availability Statement
Acknowledgments
Conflicts of Interest
Abbreviations
| Abbreviation | Meaning |
| A | Ash content (%) |
| AC | Activated carbon |
| AEC | Anion exchange capacity (cmol(+)/kg) |
| BC | Biochar |
| BET | Brunauer–Emmett–Teller |
| BJH | Barrett–Joyner–Halenda |
| C | BET isotherm constant (-) |
| CEC | Cation exchange capacity (cmol(+)/kg) |
| d | Average pore size (Å) |
| EDS | Energy-dispersive X-ray spectroscopy |
| EDTA | Ethylenediaminetetraacetic acid |
| FC | Fixed carbon (%) |
| G | Conductivity (S or Ω−1) |
| g | Constant of acceleration of gravity (9.81 m/s2) |
| IV | Iodine index (g/kg) |
| LOD | Limit of detection |
| m1 | Mass of the sample (g) |
| m2 | Mass of the sample at ≈105 °C (g) |
| m3 | Mass of the sample at ≈600 °C (g) |
| m4 | Residual mass of the sample after combustion (g) |
| M | Moisture content (%) |
| MB | Methylene blue dye |
| MBI | Methylene blue index (g/kg) |
| N | Avogadro’s number = 6.022 × 10²³ (molecules/mol) |
| p/p0 | Relative pressure (-) |
| pH | Potential of hydrogen (-) |
| pHPZC | Point of zero charge (-) |
| PSD | Particle size distribution (%) |
| r | True pore radius |
| rK | Kelvin pore radius |
| R | Universal gas constant = 8.314 (J/(mol °K)) |
| s | Cross-sectional area of adsorbed gas molecule (m2) |
| SBET | Specific surface area (m2/g) |
| SEM | Scanning electron microscopy |
| t | Adsorbed layer thickness on the pore wall |
| T | Temperature (°C or °K) |
| TGA | Thermogravimetric analysis |
| v | Multilayer adsorbed gas volume (cm3) |
| vm | Monolayer absorbed gas volume (cm3) |
| V | Molar volume of adsorbed gas |
| VL | Molar volume of the liquid (cm3/mol) |
| VT | Pore volume (cm3/g) |
| VM | Volatile matter (%) |
| VOCs | Volatile organic compounds |
| XRD | X-ray diffraction analysis |
| XRF | X-ray fluorescence analysis |
| γ | Estimated specific weight (N/m3) |
| γL | Surface tension of the liquid (N/m) |
| θ | Contact angle (°) |
| ρ | Estimated density (kg/m3) |
| ρb | Apparent or bulk density (kg/m3) |
| λ0 | Wavelength (nm) |
| τ | Thickness of the single adsorption layer (nm) |
References
- Mancini, V.; Verdone, N.; Trinca, A.; Vilardi, G. Economic, environmental and exergy analysis of the decarbonisation of cement production cycle. Energy Convers. Manag. 2022, 260, 115577. [Google Scholar] [CrossRef]
- Rispoli, A.L.; Iaquaniello, G.; Salladini, A.; Verdone, N.; Pepe, M.R.; Borgogna, A.; Vilardi, G. Simultaneous decarbonisation of steel and Oil&Gas industry by MSW gasification: Economic and environmental analysis. Energy Convers. Manag. 2021, 245, 114577. [Google Scholar] [CrossRef]
- Rispoli, A.L.; Rispoli, G.; Verdone, N.; Salladini, A.; Agostini, E.; Boccacci, M.; Parisi, M.P.; Mazzarotta, B.; Vilardi, G. The electrification of conventional industrial processes: The use of mechanical vapor compression in an EtOH–water distillation tower. Energies 2021, 14, 7267. [Google Scholar] [CrossRef]
- European Commission Circular Economy Action Plan. Available online: https://environment.ec.europa.eu/strategy/circular-economy-action-plan_en (accessed on 3 October 2022).
- Viotti, P.; Tatti, F.; Rossi, A.; Luciano, A.; Marzeddu, S.; Mancini, G.; Boni, M.R. An Eco-Balanced and Integrated Approach for a More-Sustainable MSW Management. Waste Biomass Valoriz. 2020, 11, 5139–5150. [Google Scholar] [CrossRef]
- Arena, N.; Lee, J.; Clift, R. Life Cycle Assessment of activated carbon production from coconut shells. J. Clean. Prod. 2016, 125, 68–77. [Google Scholar] [CrossRef] [Green Version]
- Golab, A.N.; Peterson, M.A.; Indraratna, B. Selection of permeable reactive barrier materials for treating acidic groundwater in acid sulphate soil terrains based on laboratory column tests. Environ. Earth Sci. 2009, 59, 241–254. [Google Scholar] [CrossRef]
- Mak, M.S.H.; Lo, I.M.C. Environmental life cycle assessment of permeable reactive barriers: Effects of construction methods, reactive materials and groundwater constituents. Environ. Sci. Technol. 2011, 45, 10148–10154. [Google Scholar] [CrossRef] [PubMed]
- Liu, Y.; Mou, H.; Chen, L.; Mirza, Z.A.; Liu, L. Cr(VI)-contaminated groundwater remediation with simulated permeable reactive barrier (PRB) filled with natural pyrite as reactive material: Environmental factors and effectiveness. J. Hazard. Mater. 2015, 298, 83–90. [Google Scholar] [CrossRef] [PubMed]
- Guerra, F.; Attia, M.; Whitehead, D.; Alexis, F. Nanotechnology for Environmental Remediation: Materials and Applications. Molecules 2018, 23, 1760. [Google Scholar] [CrossRef] [PubMed] [Green Version]
- Barchiesi, M.; Chiavola, A.; Di Marcantonio, C.; Boni, M.R. Presence and fate of microplastics in the water sources: Focus on the role of wastewater and drinking water treatment plants. J. Water Process Eng. 2020, 101787. [Google Scholar] [CrossRef]
- Di Marcantonio, C.; Chiavola, A.; Dossi, S.; Cecchini, G.; Leoni, S.; Frugis, A.; Spizzirri, M.; Boni, M.R. Occurrence, seasonal variations and removal of Organic Micropollutants in 76 Wastewater Treatment Plants. Process Saf. Environ. Prot. 2020, 141, 61–72. [Google Scholar] [CrossRef]
- Chiavola, A.; Tedesco, P.; Boni, M.R. Fate of selected drugs in the wastewater treatment plants (WWTPs) for domestic sewage. Environ. Sci. Pollut. Res. 2019, 26, 1113–1123. [Google Scholar] [CrossRef] [PubMed] [Green Version]
- Nattassha, R.; Handayati, Y.; Simatupang, T.M.; Siallagan, M. Understanding circular economy implementation in the agri-food supply chain: The case of an Indonesian organic fertiliser producer. Agric. Food Secur. 2020, 9, 10. [Google Scholar] [CrossRef]
- Rispoli, A.L.; Verdone, N.; Vilardi, G. Green fuel production by coupling plastic waste oxy-combustion and PtG technologies: Economic, energy, exergy and CO2-cycle analysis. Fuel Process. Technol. 2021, 221, 106922. [Google Scholar] [CrossRef]
- Heyes, G.; Sharmina, M.; Mendoza, J.M.F.; Gallego-Schmid, A.; Azapagic, A. Developing and implementing circular economy business models in service-oriented technology companies. J. Clean. Prod. 2018, 177, 621–632. [Google Scholar] [CrossRef]
- Singh, J.; Ordoñez, I. Resource recovery from post-consumer waste: Important lessons for the upcoming circular economy. J. Clean. Prod. 2016, 134, 342–353. [Google Scholar] [CrossRef]
- Hersh, B.; Mirkouei, A. Life Cycle Assessment of Pyrolysis-Derived Biochar From Organic Wastes and Advanced Feedstocks. In Proceedings of the International Design Engineering Technical Conferences and Computers and Information in Engineering Conference, Anaheim, CA, USA, 18–21 August 2019; Volume 4. [Google Scholar] [CrossRef]
- McDevitt, J.E.; Langer, E.R.; Leckie, A.C. Community Engagement and Environmental Life Cycle Assessment of Kaikōura’s Biosolid Reuse Options. Sustainability 2013, 5, 242–255. [Google Scholar] [CrossRef] [Green Version]
- Hjaila, K.; Baccar, R.; Sarrà, M.; Gasol, C.M.; Blánquez, P. Environmental impact associated with activated carbon preparation from olive-waste cake via life cycle assessment. J. Environ. Manag. 2013, 130, 242–247. [Google Scholar] [CrossRef]
- Lefebvre, D.; Williams, A.; Kirk, G.J.D.; Meersmans, J.; Sohi, S.; Goglio, P.; Smith, P. An anticipatory life cycle assessment of the use of biochar from sugarcane residues as a greenhouse gas removal technology. J. Clean. Prod. 2021, 312, 127764. [Google Scholar] [CrossRef]
- Saad, E.M.; Elshaarawy, R.F.; Mahmoud, S.A.; El-Moselhy, K.M. New Ulva lactuca Algae Based Chitosan Bio-composites for Bioremediation of Cd(II) Ions. J. Bioresour. Bioprod. 2021, 6, 223–242. [Google Scholar] [CrossRef]
- Jjagwe, J.; Olupot, P.W.; Menya, E.; Kalibbala, H.M. Synthesis and Application of Granular Activated Carbon from Biomass Waste Materials for Water Treatment: A Review. J. Bioresour. Bioprod. 2021, 6, 292–322. [Google Scholar] [CrossRef]
- Berbel, J.; Posadillo, A. Review and Analysis of Alternatives for the Valorisation of Agro-Industrial Olive Oil By-Products. Sustainability 2018, 10, 237. [Google Scholar] [CrossRef] [Green Version]
- Lawania, K.; Sarker, P.; Biswas, W. Global Warming Implications of the Use of By-Products and Recycled Materials in Western Australia’s Housing Sector. Materials 2015, 8, 6909–6925. [Google Scholar] [CrossRef] [Green Version]
- Campos, D.A.; Gómez-García, R.; Vilas-Boas, A.A.; Madureira, A.R.; Pintado, M.M. Management of Fruit Industrial By-Products—A Case Study on Circular Economy Approach. Molecules 2020, 25, 320. [Google Scholar] [CrossRef] [PubMed] [Green Version]
- Marocco, A.; Dell’Agli, G.; Sannino, F.; Esposito, S.; Bonelli, B.; Allia, P.; Tiberto, P.; Barrera, G.; Pansini, M. Removal of Agrochemicals from Waters by Adsorption: A Critical Comparison among Humic-Like Substances, Zeolites, Porous Oxides, and Magnetic Nanocomposites. Processes 2020, 8, 141. [Google Scholar] [CrossRef] [Green Version]
- Januszewicz, K.; Kazimierski, P.; Klein, M.; Kardaś, D.; Łuczak, J. Activated carbon produced by pyrolysis of waste wood and straw for potential wastewater adsorption. Materials 2020, 13, 2047. [Google Scholar] [CrossRef] [PubMed]
- Yan, B.; Zheng, J.; Feng, L.; Du, C.; Jian, S.; Yang, W.; Wu, Y.A.; Jiang, S.; He, S.; Chen, W. Wood-derived biochar as thick electrodes for high-rate performance supercapacitors. Biochar 2022, 4, 50. [Google Scholar] [CrossRef]
- Liu, Y.; Zhao, X.; Li, J.; Ma, D.; Han, R. Characterization of bio-char from pyrolysis of wheat straw and its evaluation on methylene blue adsorption. Desalin. Water Treat. 2012, 46, 115–123. [Google Scholar] [CrossRef]
- Gu, H.; Bergman, R.; Anderson, N.; Alanya-Rosenbaum, S. Life cycle assessment of activated carbon from woody biomass. Wood Fiber Sci. 2018, 50, 229–243. [Google Scholar] [CrossRef]
- Qu, X.; Fu, H.; Mao, J.; Ran, Y.; Zhang, D.; Zhu, D. Chemical and structural properties of dissolved black carbon released from biochars. Carbon 2016, 96, 759–767. [Google Scholar] [CrossRef]
- Chen, X.; Chen, G.; Chen, L.; Chen, Y.; Lehmann, J.; McBride, M.B.; Hay, A.G. Adsorption of copper and zinc by biochars produced from pyrolysis of hardwood and corn straw in aqueous solution. Bioresour. Technol. 2011, 102, 8877–8884. [Google Scholar] [CrossRef] [PubMed]
- Gaskin, J.W.; Steiner, C.; Harris, K.; Das, K.C.; Bibens, B. Effect of Low-Temperature Pyrolysis Conditions on Biochar for Agricultural Use. Trans. ASABE 2008, 51, 2061–2069. [Google Scholar] [CrossRef]
- Tomczyk, A.; Sokołowska, Z.; Boguta, P. Biochar physicochemical properties: Pyrolysis temperature and feedstock kind effects. Rev. Environ. Sci. Bio/Technol. 2020, 19, 191–215. [Google Scholar] [CrossRef] [Green Version]
- Boni, M.R.; Chiavola, A.; Antonucci, A.; Di Mattia, E.; Marzeddu, S. A novel treatment for Cd-contaminated solution through adsorption on beech charcoal: The effect of bioactivation. Desalin. Water Treat. 2018, 127, 104–110. [Google Scholar] [CrossRef]
- Deng, J.; Li, X.; Liu, Y.; Zeng, G.; Liang, J.; Song, B.; Wei, X. Alginate-modified biochar derived from Ca(II)-impregnated biomass: Excellent anti-interference ability for Pb(II) removal. Ecotoxicol. Environ. Saf. 2018, 165, 211–218. [Google Scholar] [CrossRef]
- Kan, T.; Strezov, V.; Evans, T.J. Lignocellulosic biomass pyrolysis: A review of product properties and effects of pyrolysis parameters. Renew. Sustain. Energy Rev. 2016, 57, 126–1140. [Google Scholar] [CrossRef]
- Yao, Z.; You, S.; Ge, T.; Wang, C.H. Biomass gasification for syngas and biochar co-production: Energy application and economic evaluation. Appl. Energy 2018, 209, 43–55. [Google Scholar] [CrossRef] [Green Version]
- Özçimen, D.; Karaosmanoǧlu, F. Production and characterization of bio-oil and biochar from rapeseed cake. Renew. Energy 2004, 29, 779–787. [Google Scholar] [CrossRef]
- Kloss, S.; Zehetner, F.; Dellantonio, A.; Hamid, R.; Ottner, F.; Liedtke, V.; Schwanninger, M.; Gerzabek, M.H.; Soja, G. Characterization of Slow Pyrolysis Biochars: Effects of Feedstocks and Pyrolysis Temperature on Biochar Properties. J. Environ. Qual. 2012, 41, 990–1000. [Google Scholar] [CrossRef]
- Brewer, C.E.; Schmidt-Rohr, K.; Satrio, J.A.; Brown, R.C. Characterization of biochar from fast pyrolysis and gasification systems. Environ. Prog. Sustain. Energy 2009, 28, 386–396. [Google Scholar] [CrossRef]
- Wu, C.; Budarin, V.L.; Gronnow, M.J.; De Bruyn, M.; Onwudili, J.A.; Clark, J.H.; Williams, P.T. Conventional and microwave-assisted pyrolysis of biomass under different heating rates. J. Anal. Appl. Pyrolysis 2014, 107, 276–283. [Google Scholar] [CrossRef]
- Lehmann, J.; Joseph, S. Biochar for Environmental Management, 2nd ed.; Lehmann, J., Joseph, S., Eds.; Routledge: London, UK, 2015; ISBN 9781844076581. [Google Scholar]
- Yuan, P.; Wang, J.; Pan, Y.; Shen, B.; Wu, C. Review of biochar for the management of contaminated soil: Preparation, application and prospect. Sci. Total Environ. 2019, 659, 473–490. [Google Scholar] [CrossRef] [PubMed]
- Fellet, G.; Marmiroli, M.; Marchiol, L. Elements uptake by metal accumulator species grown on mine tailings amended with three types of biochar. Sci. Total Environ. 2014, 468–469, 598–608. [Google Scholar] [CrossRef] [PubMed]
- Bolognesi, S.; Bernardi, G.; Callegari, A.; Dondi, D.; Capodaglio, A.G. Biochar production from sewage sludge and microalgae mixtures: Properties, sustainability and possible role in circular economy. Biomass Convers. Biorefinery 2019, 11, 289–299. [Google Scholar] [CrossRef]
- Zabaniotou, A.; Rovas, D.; Libutti, A.; Monteleone, M. Boosting circular economy and closing the loop in agriculture: Case study of a small-scale pyrolysis-biochar based system integrated in an olive farm in symbiosis with an olive mill. Environ. Dev. 2015, 14, 22–36. [Google Scholar] [CrossRef]
- Jindo, K.; Audette, Y.; Higashikawa, F.S.; Silva, C.A.; Akashi, K.; Mastrolonardo, G.; Sánchez-Monedero, M.A.; Mondini, C. Role of biochar in promoting circular economy in the agriculture sector. Part 1: A review of the biochar roles in soil N, P and K cycles. Chem. Biol. Technol. Agric. 2020, 7, 15. [Google Scholar] [CrossRef]
- Ma, X.; Yang, H.; Yu, L.; Chen, Y.; Li, Y. Preparation, Surface and Pore Structure of High Surface Area Activated Carbon Fibers from Bamboo by Steam Activation. Materials 2014, 7, 4431–4441. [Google Scholar] [CrossRef]
- Liu, X.Y.; Huang, M.; Ma, H.L.; Zhang, Z.Q.; Gao, J.M.; Zhu, Y.L.; Han, X.J.; Guo, X.Y. Preparation of a carbon-based solid acid catalyst by sulfonating activated carbon in a chemical reduction process. Molecules 2010, 15, 7188–7196. [Google Scholar] [CrossRef] [PubMed] [Green Version]
- Park, J.; Lee, G.; Hwang, S.; Kim, J.; Hong, B.; Kim, H.; Kim, S. The Effects of Methane Storage Capacity Using Upgraded Activated Carbon by KOH. Appl. Sci. 2018, 8, 1596. [Google Scholar] [CrossRef]
- Chiang, Y.-C.; Yeh, C.-Y.; Weng, C.-H. Carbon Dioxide Adsorption on Porous and Functionalized Activated Carbon Fibers. Appl. Sci. 2019, 9, 1977. [Google Scholar] [CrossRef] [Green Version]
- Mianowski, A.; Owczarek, M.; Marecka, A. Surface area of activated carbon determined by the iodine adsorption number. Energy Sources Part A Recover. Util. Environ. Eff. 2007, 29, 839–850. [Google Scholar] [CrossRef]
- Yahya, M.A.; Al-Qodah, Z.; Ngah, C.W.Z. Agricultural bio-waste materials as potential sustainable precursors used for activated carbon production: A review. Renew. Sustain. Energy Rev. 2015, 46, 218–235. [Google Scholar] [CrossRef]
- Marques, S.C.R.; Marcuzzo, J.M.; Baldan, M.R.; Mestre, A.S.; Carvalho, A.P. Pharmaceuticals removal by activated carbons: Role of morphology on cyclic thermal regeneration. Chem. Eng. J. 2017, 321, 233–244. [Google Scholar] [CrossRef]
- Vo, A.T.; Nguyen, V.P.; Ouakouak, A.; Nieva, A.; Doma, B.T.; Tran, H.N.; Chao, H.-P. Efficient Removal of Cr(VI) from Water by Biochar and Activated Carbon Prepared through Hydrothermal Carbonization and Pyrolysis: Adsorption-Coupled Reduction Mechanism. Water 2019, 11, 1164. [Google Scholar] [CrossRef] [Green Version]
- Paethanom, A.; Yoshikawa, K. Influence of Pyrolysis Temperature on Rice Husk Char Characteristics and Its Tar Adsorption Capability. Energies 2012, 5, 4941–4951. [Google Scholar] [CrossRef] [Green Version]
- Hubbard, W.G. Wood bioenergy. In Bioenergy; Dahiya, A., Ed.; Elsevier: Amsterdam, The Netherlands, 2020; pp. 69–87. ISBN 9780128154977. [Google Scholar]
- Lee, J.; Choi, Y.C. Pore Structure Characteristics of Foam Composite with Active Carbon. Materials 2020, 13, 4038. [Google Scholar] [CrossRef] [PubMed]
- Chiang, Y.-C.; Hsu, W.-L.; Lin, S.-Y.; Juang, R.-S. Enhanced CO2 Adsorption on Activated Carbon Fibers Grafted with Nitrogen-Doped Carbon Nanotubes. Materials 2017, 10, 511. [Google Scholar] [CrossRef] [PubMed] [Green Version]
- Hagemann, N.; Spokas, K.; Schmidt, H.-P.; Kägi, R.; Böhler, M.; Bucheli, T. Activated Carbon, Biochar and Charcoal: Linkages and Synergies across Pyrogenic Carbon’s ABCs. Water 2018, 10, 182. [Google Scholar] [CrossRef] [Green Version]
- Ghouma, I.; Jeguirim, M.; Sager, U.; Limousy, L.; Bennici, S.; Däuber, E.; Asbach, C.; Ligotski, R.; Schmidt, F.; Ouederni, A. The Potential of Activated Carbon Made of Agro-Industrial Residues in NOx Immissions Abatement. Energies 2017, 10, 1508. [Google Scholar] [CrossRef]
- Veksha, A.; Uddin, A.; Sasaoka, E.; Kato, Y. Adsorption and desorption behavior of benzene on activated carbons from different precursors in dry and humid conditions. J. Chem. Eng. Jpn. 2012, 45, 387–394. [Google Scholar] [CrossRef]
- Danish, M.; Ahmad, T. A review on utilization of wood biomass as a sustainable precursor for activated carbon production and application. Renew. Sustain. Energy Rev. 2018, 87, 1–21. [Google Scholar] [CrossRef]
- Lewoyehu, M. Comprehensive review on synthesis and application of activated carbon from agricultural residues for the remediation of venomous pollutants in wastewater. J. Anal. Appl. Pyrolysis 2021, 159, 105279. [Google Scholar] [CrossRef]
- Azari, A.; Nabizadeh, R.; Nasseri, S.; Mahvi, A.H.; Mesdaghinia, A.R. Comprehensive systematic review and meta-analysis of dyes adsorption by carbon-based adsorbent materials: Classification and analysis of last decade studies. Chemosphere 2020, 250, 126238. [Google Scholar] [CrossRef] [PubMed]
- Viglašová, E.; Galamboš, M.; Danková, Z.; Krivosudský, L.; Lengauer, C.L.; Hood-Nowotny, R.; Soja, G.; Rompel, A.; Matík, M.; Briančin, J. Production, characterization and adsorption studies of bamboo-based biochar/montmorillonite composite for nitrate removal. Waste Manag. 2018, 79, 385–394. [Google Scholar] [CrossRef]
- Yefremova, S.; Terlikbayeva, A.; Zharmenov, A.; Kablanbekov, A.; Bunchuk, L.; Kushakova, L.; Shumskiy, V.; Sukharnikov, Y.; Yermishin, S. Coke-Based Carbon Sorbent: Results of Gold Extraction in Laboratory and Pilot Tests. Minerals 2020, 10, 508. [Google Scholar] [CrossRef]
- Ying, A.; Evans, S.F.; Tsouris, C.; Parans Paranthaman, M. Magnetic sorbent for the removal of selenium(IV) from simulated industrial wastewaters: Determination of column kinetic parameters. Water 2020, 12, 1234. [Google Scholar] [CrossRef]
- Galeotti, F.; Maccari, F.; Fachini, A.; Volpi, N. Chemical Composition and Antioxidant Activity of Propolis Prepared in Different Forms and in Different Solvents Useful for Finished Products. Foods 2018, 7, 41. [Google Scholar] [CrossRef] [Green Version]
- Chiavola, A.; Stoller, M.; Di Palma, L.; Boni, M.R.; Di Palma, L.; Petrucci, E.; Stoller, M.; Chiavola, A.; Di Palma, L.; Boni, M.R. Magnetic core nanoparticles coated by titania and alumina for water and wastewater remediation from metal contaminants. Chem. Eng. Trans. 2017, 60, 205–210. [Google Scholar] [CrossRef]
- Boni, M.R.; Sbaffoni, S. Chemical Oxidation by Sodium Persulphate for the Treatment of Contaminated Groundwater. Laboratory Tests. Chem. Eng. Trans. 2012, 28, 157–162. [Google Scholar] [CrossRef]
- Hájková, P. Kaolinite Claystone-Based Geopolymer Materials: Effect of Chemical Composition and Curing Conditions. Minerals 2018, 8, 444. [Google Scholar] [CrossRef] [Green Version]
- Boni, M.R.; Chiavola, A.; Marzeddu, S. Application of Biochar to the Remediation of Pb-Contaminated Solutions. Sustainability 2018, 10, 4440. [Google Scholar] [CrossRef] [Green Version]
- Boni, M.R.; Marzeddu, S.; Tatti, F.; Raboni, M.; Mancini, G.; Luciano, A.; Viotti, P. Experimental and Numerical Study of Biochar Fixed Bed Column for the Adsorption of Arsenic from Aqueous Solutions. Water 2021, 13, 915. [Google Scholar] [CrossRef]
- Marzeddu, S.; Cappelli, A.; Ambrosio, A.; Décima, M.A.; Viotti, P.; Boni, M.R. A Life Cycle Assessment of an Energy-Biochar Chain Involving a Gasification Plant in Italy. Land 2021, 10, 1256. [Google Scholar] [CrossRef]
- Boni, M.R.; Chiavola, A.; Marzeddu, S. Remediation of Lead-Contaminated Water by Virgin Coniferous Wood Biochar Adsorbent: Batch and Column Application. Water Air Soil Pollut. 2020, 231, 171. [Google Scholar] [CrossRef]
- Chiavola, A.; Marzeddu, S.; Boni, M.R. Remediation of Water Contaminated by Pb(II) Using Virgin Coniferous Wood Biochar as Adsorbent. In Frontiers in Water-Energy-Nexus—Nature-Based Solutions, Advanced Technologies and Best Practices for Environmental Sustainability. Advances in Science, Technology & Innovation (IEREK Interdisciplinary Series for Sustainable Development); Naddeo, V., Balakrishnan, M., Choo, K.-H., Eds.; Springer: Cham, Switzerland; Salerno, Italy, 2020; pp. 363–366. ISBN 978-3-030-13067-1. [Google Scholar]
- ASTM Standards. ASTM D2854-09(2019); Standard Test Method for Apparent Density of Activated Carbon. ASTM Volume 15.01: Refractories, Activated Carbon; Advanced Ceramics; ASTM International: West Conshohocken, PA, USA, 2019; p. 3.
- CEFIC. Test Methods for Activated Carbon; European Chemical Industry Council: Brussels, Belgium, 1986. [Google Scholar]
- Décima, M.A.; Marzeddu, S.; Barchiesi, M.; Di Marcantonio, C.; Chiavola, A.; Boni, M.R.; Di Marcantonio, C.; Chiavola, A.; Boni, M.R. A Review on the Removal of Carbamazepine from Aqueous Solution by Using Activated Carbon and Biochar. Sustainability 2021, 13, 11760. [Google Scholar] [CrossRef]
- Zhao, J.; Xu, H.; Tang, D.; Mathews, J.P.; Li, S.; Tao, S. A comparative evaluation of coal specific surface area by CO2 and N2 adsorption and its influence on CH4 adsorption capacity at different pore sizes. Fuel 2016, 183, 420–431. [Google Scholar] [CrossRef]
- Bardestani, R.; Patience, G.S.; Kaliaguine, S. Experimental methods in chemical engineering: Specific surface area and pore size distribution measurements—BET, BJH, and DFT. Can. J. Chem. Eng. 2019, 97, 2781–2791. [Google Scholar] [CrossRef]
- Ravikovitch, P.I.; Vishnyakov, A.; Russo, R.; Neimark, A.V. Unified approach to pore size characterization of microporous carbonaceous materials from N2, Ar, and CO2 adsorption isotherms. Langmuir 2000, 16, 2311–2320. [Google Scholar] [CrossRef]
- Bao, L.; Gao, P.; Peng, S. Analysis Method of Pore Size Distribution of Porous Materials. Mater. Sci. 2020, 10, 95–103. [Google Scholar] [CrossRef]
- Choma, J.; Jaroniec, M.; Kloske, M. Improved Pore-Size Analysis of Carbonaceous Adsorbents. Adsorpt. Sci. Technol. 2002, 20, 307–315. [Google Scholar] [CrossRef]
- Dollimore, D.; Heal, G. Pore-size distribution in typical adsorbent systems. J. Colloid Interface Sci. 1970, 33, 508–519. [Google Scholar] [CrossRef]
- Zhang, Y.; Lam, F.L.-Y.; Yan, Z.-F.; Hu, X. Review of Kelvin’s Equation and Its Modification in Characterization of Mesoporous Materials. Chin. J. Chem. Phys. 2006, 19, 102–108. [Google Scholar] [CrossRef]
- International Organization for Standardization (ISO). ISO 15901-2:2022; Pore Size Distribution and Porosity of Solid Materials by Mercury Porosimetry and Gas Adsorption—Part 2: Analysis of Nanopores by Gas Adsorption. International Organization for Standardization (ISO): Geneva, Switzerland. Available online: https://www.iso.org/standard/67586.html (accessed on 11 June 2022).
- Malucelli, L.C.; Silvestre, G.F.; Carneiro, J.; Vasconcelos, E.C.; Guiotoku, M.; Maia, C.M.B.F.; Carvalho Filho, M.A.S. Biochar higher heating value estimative using thermogravimetric analysis. J. Therm. Anal. Calorim. 2020, 139, 2215–2220. [Google Scholar] [CrossRef]
- Nasr, O.; Jiang, J.-R.; Chuang, W.-S.; Lee, S.-W.; Chen, C.-Y. Ag Nanoparticle-Decorated Cu2S Nanosheets for Surface Enhanced Raman Spectroscopy Detection and Photocatalytic Applications. Nanomaterials 2021, 11, 2508. [Google Scholar] [CrossRef] [PubMed]
- Dutta, S.; Sharma, R.K. Sustainable Magnetically Retrievable Nanoadsorbents for Selective Removal of Heavy Metal Ions From Different Charged Wastewaters. In Separation Science and Technology (New York); Elsevier Inc.: Amsterdam, The Netherlands, 2019; Volume 11, pp. 371–416. [Google Scholar]
- AlDayyat, E.A.; Saidan, M.N.; Al-Hamamre, Z.; Al-Addous, M.; Alkasrawi, M. Pyrolysis of Solid Waste for Bio-Oil and Char Production in Refugees’ Camp: A Case Study. Energies 2021, 14, 3861. [Google Scholar] [CrossRef]
- Vilardi, G.; Verdone, N. Exergy analysis of municipal solid waste incineration processes: The use of O2-enriched air and the oxy-combustion process. Energy 2022, 239, 122147. [Google Scholar] [CrossRef]
- Murmura, M.A.; Vilardi, G. Energy and exergy analysis of the zinc/zinc oxide thermochemical cycle for hydrogen production and fuel cell power generation. Energy Convers. Manag. 2021, 247, 114761. [Google Scholar] [CrossRef]
- Aranda, P.R.; Colombo, L.; Perino, E.; De Vito, I.E.; Raba, J. Solid-phase preconcentration and determination of mercury(II) using activated carbon in drinking water by X-ray fluorescence spectrometry. X-Ray Spectrom. 2013, 42, 100–104. [Google Scholar] [CrossRef]
- Yankovych, H.; Melnyk, I.; Václavíková, M. Understanding of mechanisms of organohalogens removal onto mesoporous granular activated carbon with acid-base properties. Microporous Mesoporous Mater. 2021, 317, 110974. [Google Scholar] [CrossRef]
- Wystalska, K.; Kwarciak-Kozłowska, A. The Effect of Biodegradable Waste Pyrolysis Temperatures on Selected Biochar Properties. Materials 2021, 14, 1644. [Google Scholar] [CrossRef]
- Boehm, H.P. Surface oxides on carbon and their analysis: A critical assessment. Carbon 2002, 40, 145–149. [Google Scholar] [CrossRef]
- Kim, Y.S.; Yang, S.J.; Lim, H.J.; Kim, T.; Lee, K.; Park, C.R. Effects of carbon dioxide and acidic carbon compounds on the analysis of Boehm titration curves. Carbon 2012, 50, 1510–1516. [Google Scholar] [CrossRef]
- Ren, H.; Cunha, E.; Sun, Q.; Li, Z.; Kinloch, I.A.; Young, R.J.; Fan, Z. Surface functionality analysis by Boehm titration of graphene nanoplatelets functionalized via a solvent-free cycloaddition reaction. Nanoscale Adv. 2019, 1, 1432–1441. [Google Scholar] [CrossRef] [PubMed] [Green Version]
- Qian, Q.; Machida, M.; Tatsumoto, H. Textural and surface chemical characteristics of activated carbons prepared from cattle manure compost. Waste Manag. 2008, 28, 1064–1071. [Google Scholar] [CrossRef]
- Lawrinenko, M.; Laird, D.A. Anion exchange capacity of biochar. Green Chem. 2015, 17, 4628–4636. [Google Scholar] [CrossRef] [Green Version]
- Funk, J.E.; Dinger, D.R. Methylene Blue Index. In Predictive Process Control of Crowded Particulate Suspensions; Springer: Boston, MA, USA, 1994; pp. 669–689. ISBN 978-1-4615-3118-0. [Google Scholar]
- Jo, S.-E.; Choi, J.-W.; Choi, S.-J. Synthesis of Silver-Impregnated Magnetite Mesoporous Silica Composites for Removing Iodide in Aqueous Solution. Toxics 2021, 9, 175. [Google Scholar] [CrossRef] [PubMed]
- Gamal Mohamed, M.; Tsai, M.-Y.; Wang, C.-F.; Huang, C.-F.; Danko, M.; Dai, L.; Chen, T.; Kuo, S.-W. Multifunctional Polyhedral Oligomeric Silsesquioxane (POSS) Based Hybrid Porous Materials for CO2 Uptake and Iodine Adsorption. Polymers 2021, 13, 221. [Google Scholar] [CrossRef]
- Lu, K.; Yang, X.; Shen, J.; Robinson, B.; Huang, H.; Liu, D.; Bolan, N.; Pei, J.; Wang, H. Effect of bamboo and rice straw biochars on the bioavailability of Cd, Cu, Pb and Zn to Sedum plumbizincicola. Agric. Ecosyst. Environ. 2014, 191, 124–132. [Google Scholar] [CrossRef]
- Wang, Q.; Laurenti, R.; Holmberg, S. A novel hybrid methodology to evaluate sustainable retrofitting inexisting Swedish residential buildings. Sustain. Cities Soc. 2015, 16, 24–38. [Google Scholar] [CrossRef]
- Ha, S.-H.; Younis, S.A.; Vikrant, K.; Szulejko, J.E.; Kim, K.-H. Evidence of the dominant role of particle size in controlling the dynamic adsorption breakthrough behavior of gaseous benzene in a microporous carbon bed system. Chem. Eng. J. 2022, 427, 130977. [Google Scholar] [CrossRef]
- Ali, R.M.; Hamad, H.A.; Hussein, M.M.; Malash, G.F. Potential of using green adsorbent of heavy metal removal from aqueous solutions: Adsorption kinetics, isotherm, thermodynamic, mechanism and economic analysis. Ecol. Eng. 2016, 91, 317–332. [Google Scholar] [CrossRef]
- Qambrani, N.A.; Rahman, M.M.; Won, S.; Shim, S.; Ra, C. Biochar properties and eco-friendly applications for climate change mitigation, waste management, and wastewater treatment: A review. Renew. Sustain. Energy Rev. 2017, 79, 255–273. [Google Scholar] [CrossRef]
- Yang, C.; Liu, J.; Lu, S. Pyrolysis temperature affects pore characteristics of rice straw and canola stalk biochars and biochar-amended soils. Geoderma 2021, 397, 115097. [Google Scholar] [CrossRef]
- Pituello, C.; Francioso, O.; Simonetti, G.; Pisi, A.; Torreggiani, A.; Berti, A.; Morari, F. Characterization of chemical–physical, structural and morphological properties of biochars from biowastes produced at different temperatures. J. Soils Sediments 2015, 15, 792–804. [Google Scholar] [CrossRef]
- Li, D.; Zhou, J.; Wang, Y.; Tian, Y.; Wei, L.; Zhang, Z.; Qiao, Y.; Li, J. Effects of activation temperature on densities and volumetric CO2 adsorption performance of alkali-activated carbons. Fuel 2019, 238, 232–239. [Google Scholar] [CrossRef]
- Singh, A.P.; Singh, A.P.; Purakayastha, T.J. Characterization of biochar and their influence on microbial activities and potassium availability in an acid soil. Arch. Agron. Soil Sci. 2019, 65, 1302–1315. [Google Scholar] [CrossRef]
- Yargicoglu, E.N.; Yamini, B.; Reddy, K.R.; Spokas, K.; Sadasivam, B.Y.; Reddy, K.R.; Spokas, K.; Yamini, B.; Reddy, K.R.; Spokas, K.; et al. Physical and chemical characterization of waste wood derived biochars. Waste Manag. 2015, 36, 256–268. [Google Scholar] [CrossRef] [PubMed]
- Hattori, Y.; Kaneko, K.; Ohba, T. Adsorption Properties. In Comprehensive Inorganic Chemistry II; Elsevier: Amsterdam, The Netherlands, 2013; Volume 5, pp. 25–44. ISBN 9780080965291. [Google Scholar]
- Yu, Z.; Peldszus, S.; Huck, P.M. Adsorption characteristics of selected pharmaceuticals and an endocrine disrupting compound—Naproxen, carbamazepine and nonylphenol—On activated carbon. Water Res. 2008, 42, 2873–2882. [Google Scholar] [CrossRef] [PubMed]
- Naghdi, M.; Taheran, M.; Pulicharla, R.; Rouissi, T.; Brar, S.K.; Verma, M.; Surampalli, R.Y. Pine-wood derived nanobiochar for removal of carbamazepine from aqueous media: Adsorption behavior and influential parameters. Arab. J. Chem. 2019, 12, 5292–5301. [Google Scholar] [CrossRef]
- Chen, J.; Zhang, D.; Zhang, H.; Ghosh, S.; Pan, B. Fast and slow adsorption of carbamazepine on biochar as affected by carbon structure and mineral composition. Sci. Total Environ. 2017, 579, 598–605. [Google Scholar] [CrossRef] [PubMed]
- Nimmo, J.R. Porosity and Pore-Size Distribution. Encycl. Soils Environ. 2004, 4, 295–303. [Google Scholar] [CrossRef]
- Alsabry, A.; Backiel-Brzozowska, B.; Nikitsin, V.I. Dependencies for Determining the Thermal Conductivity of Moist Capillary-Porous Materials. Energies 2020, 13, 3211. [Google Scholar] [CrossRef]
- Sampath, U.; Ching, Y.; Chuah, C.; Sabariah, J.; Lin, P.-C. Fabrication of Porous Materials from Natural/Synthetic Biopolymers and Their Composites. Materials 2016, 9, 991. [Google Scholar] [CrossRef] [PubMed] [Green Version]
- Rahman, M.; Muttakin, M.; Pal, A.; Shafiullah, A.Z.; Saha, B.B. A Statistical Approach to Determine Optimal Models for IUPAC-Classified Adsorption Isotherms. Energies 2019, 12, 4565. [Google Scholar] [CrossRef] [Green Version]
- You, S.; Ok, Y.S.; Chen, S.S.; Tsang, D.C.W.; Kwon, E.E.; Lee, J.; Wang, C.H. A critical review on sustainable biochar system through gasification: Energy and environmental applications. Bioresour. Technol. 2017, 246, 242–253. [Google Scholar] [CrossRef] [PubMed] [Green Version]
- Inyang, M.I.; Gao, B.; Yao, Y.; Xue, Y.; Zimmerman, A.; Mosa, A.; Pullammanappallil, P.; Ok, Y.S.; Cao, X. A review of biochar as a low-cost adsorbent for aqueous heavy metal removal. Crit. Rev. Environ. Sci. Technol. 2016, 46, 406–433. [Google Scholar] [CrossRef]
- Yang, Z.; Chen, J. Preparation, characterization and adsorption performance of reed biochar. Chem. Eng. Trans. 2017, 62, 1243–1248. [Google Scholar] [CrossRef]
- McLauglin, H. Characterizing biochars: Attributes, indicators, and at-home tests. In The Biochar Revolution: Transforming Agriculture & Environment; Taylor, P., Ed.; NuLife Publishing: Sandy, UT, USA, 2010; pp. 89–111. ISBN 9781921630415. [Google Scholar]
- Tag, A.T.; Duman, G.; Ucar, S.; Yanik, J. Effects of feedstock type and pyrolysis temperature on potential applications of biochar. J. Anal. Appl. Pyrolysis 2016, 120, 200–206. [Google Scholar] [CrossRef]
- Zheng, J.; Yan, B.; Feng, L.; Zhang, Q.; Zhang, C.; Yang, W.; Han, J.; Jiang, S.; He, S. Potassium citrate assisted synthesis of hierarchical porous carbon materials for high performance supercapacitors. Diam. Relat. Mater. 2022, 128, 109247. [Google Scholar] [CrossRef]
- Guerrero, M.; Ruiz, M.P.; Millera, Á.; Alzueta, M.U.; Bilbao, R. Characterization of Biomass Chars Formed under Different Devolatilization Conditions: Differences between Rice Husk and Eucalyptus. Energy Fuels 2008, 22, 1275–1284. [Google Scholar] [CrossRef]
- Ahmed, M.B.; Zhou, J.L.; Ngo, H.H.; Guo, W.; Johir, M.A.H.; Sornalingam, K. Single and competitive sorption properties and mechanism of functionalized biochar for removing sulfonamide antibiotics from water. Chem. Eng. J. 2017, 311, 348–358. [Google Scholar] [CrossRef]
- Xu, J.; Liu, J.; Ling, P.; Zhang, X.; Xu, K.; He, L.; Wang, Y.; Su, S.; Hu, S.; Xiang, J. Raman spectroscopy of biochar from the pyrolysis of three typical Chinese biomasses: A novel method for rapidly evaluating the biochar property. Energy 2020, 202, 117644. [Google Scholar] [CrossRef]
- Tosco, V.; Vitiello, F.; Furlani, M.; Gatto, M.L.; Monterubbianesi, R.; Giuliani, A.; Orsini, G.; Putignano, A. Microleakage Analysis of Different Bulk-Filling Techniques for Class II Restorations: µ-CT, SEM and EDS Evaluations. Materials 2020, 14, 31. [Google Scholar] [CrossRef] [PubMed]
- Raclavská, H.; Corsaro, A.; Juchelková, D.; Sassmanová, V.; Frantík, J. Effect of temperature on the enrichment and volatility of 18 elements during pyrolysis of biomass, coal, and tires. Fuel Process. Technol. 2015, 131, 330–337. [Google Scholar] [CrossRef]
- Huang, Y.; Yin, X.; Wu, C.; Wang, C.; Xie, J.; Zhou, Z.; Ma, L.; Li, H. Effects of metal catalysts on CO2 gasification reactivity of biomass char. Biotechnol. Adv. 2009, 27, 568–572. [Google Scholar] [CrossRef]
- Chen, T.; Liu, R.; Scott, N.R. Characterization of energy carriers obtained from the pyrolysis of white ash, switchgrass and corn stover—Biochar, syngas and bio-oil. Fuel Process. Technol. 2016, 142, 124–134. [Google Scholar] [CrossRef]
- Nielsen, L.; Biggs, M.J.; Skinner, W.; Bandosz, T.J. The effects of activated carbon surface features on the reactive adsorption of carbamazepine and sulfamethoxazole. Carbon 2014, 80, 419–432. [Google Scholar] [CrossRef] [Green Version]
- Sarswat, A.; Mohan, D. Sustainable development of coconut shell activated carbon (CSAC) & a magnetic coconut shell activated carbon (MCSAC) for phenol (2-nitrophenol) removal. RSC Adv. 2016, 6, 85390–85410. [Google Scholar] [CrossRef]
- Basu, P. Biomass Gasification and Pyrolysis; Elsevier: Amsterdam, The Netherlands, 2010; ISBN 9780123749888. [Google Scholar]
- Chu, G.; Zhao, J.; Liu, Y.; Lang, D.; Wu, M.; Pan, B.; Steinberg, C.E.W. The relative importance of different carbon structures in biochars to carbamazepine and bisphenol A sorption. J. Hazard. Mater. 2019, 373, 106–114. [Google Scholar] [CrossRef]
- Kookana, R.S.; Sarmah, A.K.; Van Zwieten, L.; Krull, E.; Singh, B. Biochar Application to Soil: Agronomic and Environmental Benefits and Unintended Consequences, 1st ed.; Elsevier Inc.: Amsterdam, The Netherlands, 2011; Volume 112, ISBN 9780123855381. [Google Scholar]
- Tang, J.; Zhu, W.; Kookana, R.; Katayama, A. Characteristics of biochar and its application in remediation of contaminated soil. J. Biosci. Bioeng. 2013, 116, 653–659. [Google Scholar] [CrossRef]
- Zhao, B.; O’Connor, D.; Zhang, J.; Peng, T.; Shen, Z.; Tsang, D.C.W.W.; Hou, D.; Connor, D.O.; Zhang, J.; Peng, T.; et al. Effect of pyrolysis temperature, heating rate, and residence time on rapeseed stem derived biochar. J. Clean. Prod. 2018, 174, 977–987. [Google Scholar] [CrossRef]
- Wang, J.; Wang, S. Preparation, modification and environmental application of biochar: A review. J. Clean. Prod. 2019, 227, 1002–1022. [Google Scholar] [CrossRef]
- Torrellas, S.Á.; García Lovera, R.; Escalona, N.; Sepúlveda, C.; Sotelo, J.L.; García, J. Chemical-activated carbons from peach stones for the adsorption of emerging contaminants in aqueous solutions. Chem. Eng. J. 2015, 279, 788–798. [Google Scholar] [CrossRef]
- Karoui, S.; Ben Arfi, R.; Mougin, K.; Ghorbal, A.; Assadi, A.A.; Amrane, A. Synthesis of novel biocomposite powder for simultaneous removal of hazardous ciprofloxacin and methylene blue: Central composite design, kinetic and isotherm studies using Brouers-Sotolongo family models. J. Hazard. Mater. 2020, 387, 121675. [Google Scholar] [CrossRef]
- Divband Hafshejani, L.; Hooshmand, A.; Naseri, A.A.; Mohammadi, A.S.; Abbasi, F.; Bhatnagar, A. Removal of nitrate from aqueous solution by modified sugarcane bagasse biochar. Ecol. Eng. 2016, 95, 101–111. [Google Scholar] [CrossRef]
- Moreno-Castilla, C. Adsorption of organic molecules from aqueous solutions on carbon materials. Carbon 2004, 42, 83–94. [Google Scholar] [CrossRef] [Green Version]
- To, M.H.; Hadi, P.; Hui, C.W.; Lin, C.S.K.; McKay, G. Mechanistic study of atenolol, acebutolol and carbamazepine adsorption on waste biomass derived activated carbon. J. Mol. Liq. 2017, 241, 386–398. [Google Scholar] [CrossRef]
- Sumalinog, D.A.G.; Capareda, S.C.; de Luna, M.D.G. Evaluation of the effectiveness and mechanisms of acetaminophen and methylene blue dye adsorption on activated biochar derived from municipal solid wastes. J. Environ. Manag. 2018, 210, 255–262. [Google Scholar] [CrossRef]
- Schönherr, J.; Buchheim, J.; Scholz, P.; Adelhelm, P. Boehm Titration Revisited (Part I): Practical Aspects for Achieving a High Precision in Quantifying Oxygen-Containing Surface Groups on Carbon Materials. C 2018, 4, 21. [Google Scholar] [CrossRef]
- Suliman, W.; Harsh, J.B.; Abu-Lail, N.I.; Fortuna, A.M.; Dallmeyer, I.; Garcia-Perez, M. Influence of feedstock source and pyrolysis temperature on biochar bulk and surface properties. Biomass Bioenergy 2016, 84, 37–48. [Google Scholar] [CrossRef]
- Tsechansky, L.; Graber, E.R. Methodological limitations to determining acidic groups at biochar surfaces via the Boehm titration. Carbon 2014, 66, 730–733. [Google Scholar] [CrossRef]
- Dehouli, H.; Chedeville, O.; Cagnon, B.; Caqueret, V.; Porte, C. Influences of pH, temperature and activated carbon properties on the interaction ozone/activated carbon for a wastewater treatment process. Desalination 2010, 254, 12–16. [Google Scholar] [CrossRef]
- Allwar, A. Characteristics of Pore Structures and Surface Chemistry of Activated Carbons by Physisorption, Ftir And Boehm Methods. IOSR J. Appl. Chem. 2012, 2, 9–15. [Google Scholar] [CrossRef]
- Del Bubba, M.; Anichini, B.; Bakari, Z.; Bruzzoniti, M.C.; Camisa, R.; Caprini, C.; Checchini, L.; Fibbi, D.; El Ghadraoui, A.; Liguori, F.; et al. Physicochemical properties and sorption capacities of sawdust-based biochars and commercial activated carbons towards ethoxylated alkylphenols and their phenolic metabolites in effluent wastewater from a textile district. Sci. Total Environ. 2020, 708, 135217. [Google Scholar] [CrossRef]
- Shrestha, L.; Thapa, M.; Shrestha, R.; Maji, S.; Pradhananga, R.; Ariga, K. Rice Husk-Derived High Surface Area Nanoporous Carbon Materials with Excellent Iodine and Methylene Blue Adsorption Properties. C 2019, 5, 10. [Google Scholar] [CrossRef]


| ρ (kg/m3) | ρb (kg/m3) | γ (N/m3) | |
|---|---|---|---|
| CARBOSORB NC 1240® | 2048.0 | 512 ± 4.1 | 20,082.69 |
| AMBIOTON® | 1136.0 | 284 ± 3.4 | 11,139.62 |
| RE-CHAR® | 528.0 | 132 ± 2.0 | 5177.57 |
| SSA (m2/g) | VT (cm3/g) | Vmicro (cm3/g) | SSAmicro (m2/g) | d (Å) | |
|---|---|---|---|---|---|
| CARBOSORB NC 1240® | 1126.64 ± 12.44 | 0.057 ± 0.004 | 0.398 | 1014.97 | 32 ± 0.60 |
| AMBIOTON® | 256.23 ± 9.44 | 0.128 ± 0.009 | 0.058 | 138.45 | 47 ± 1.50 |
| RE-CHAR® | 280.25 ± 7.12 | 0.28 ± 0.012 | 0.036 | 79.37 | 69 ± 1.10 |
| M (%) | VM (%) | A (%) | FC (%) | |
|---|---|---|---|---|
| CARBOSORB NC 1240® | 3.48 ± 0.20 | 3.22 ± 0.44 | 2.45 ± 0.44 | 90.85 ± 0.44 |
| AMBIOTON® | 3.18 ± 0.11 | 5.91 ± 0.34 | 6.57 ± 0.34 | 84.34 ± 0.34 |
| RE-CHAR® | 0.98 ± 0.10 | 6.63 ± 0.04 | 11.55 ± 0.44 | 80.84 ± 0.44 |
| G (S or Ω−1) | |
|---|---|
| CARBOSORB NC 1240® | 31.3 ± 0.4 × 10⁻⁶ |
| AMBIOTON® | 47.1 ± 0.6 × 10⁻⁶ |
| RE-CHAR® | 132.3 ± 1.7 × 10⁻⁶ |
| D Band (cm−1) | G Band (cm−1) | ID/IG 1 | |
|---|---|---|---|
| CARBOSORB NC 1240® | 1334 | 1590 | 1.149 |
| AMBIOTON® | 1334 | 1590 | 0.958 |
| RE-CHAR® | 1341 | 1595 | 1.084 |
| C | O | K | Rb | |
|---|---|---|---|---|
| CARBOSORB NC 1240® | 95.13 | 3.43 | 1.45 | <LOD |
| AMBIOTON® | 88.19 | 2.88 | 8.28 | 0.65 |
| RE-CHAR® | 59.00 | 6.69 | 1.94 | <LOD |
| Elements (%) | CARBOSORB NC 1240® | AMBIOTON® | RE-CHAR® |
|---|---|---|---|
| C | 92.6 ± 0.10 | 77.65 ± 14.1 | 84.5 ± 0.10 |
| H | 0.35 ± 0.02 | 0.9 ± 0.10 | 0.85 ± 0.04 |
| N | 0.05 ± 0.004 | 0.07 ± 0.01 | 0.15 ± 0.02 |
| O | 2.67 ± 0.21 | 1.10 ± 0.12 | 9.99 ± 1.05 |
| P | 0.32 ± 0.19 | 0.65 ± 0.19 | 1.79 ± 0.59 |
| K | 1.45 ± 0.13 | 4.57 ± 1.03 | 1.40 ± 0.11 |
| S | 1.88 ± 0.39 | 0.20 ± 0.02 | 0.32 ± 0.02 |
| Ca | <LOD (0.5) | <LOD (0.5) | <LOD (0.5) |
| Mg | <LOD (0.5) | 1.03 ± 0.03 | <LOD (0.5) |
| O/C | 0.029 | 0.014 | 0.118 |
| H/C | 0.004 | 0.012 | 0.010 |
| pH (1%) | pHPZC | |
|---|---|---|
| CARBOSORB NC 1240® | 10.09 ± 0.10 | 10.5 ± 0.05 |
| AMBIOTON® | 9.76 ± 0.10 | 10.1 ± 0.04 |
| RE-CHAR® | 11.71 ± 0.10 | 12.4 ± 0.10 |
| Materials | OH− | Acid | Lactone | Carboxyl | Reference |
|---|---|---|---|---|---|
| DFW Biochars | 0.10 | 0.20 | 0.07 | 0.06 | [154] |
| DF Biochars | 0.09 | 0.06 | 0.06 | 0.01 | |
| HP Biochars | 0.08 | 0.08 | 0.06 | 0.03 | |
| EUC-450 | 0.23 ± 0.011 | 0.63 ± 0.004 | 0.17 ± 0.0120 | 0.23 ± 0.003 | [155] |
| EUC-600 | 0.09 ± 0.017 | 0.32 ± 0.006 | 0.10 ± 0.0016 | 0.14 ± 0.003 | |
| Pica 150 | 0.64 | 2.51 | 0.75 | 0.87 | [156] |
| Picaflo | 0.27 | 1.34 | 0.51 | 0.51 | |
| KN | 0.27 | 0.78 | 0.09 | 0.42 | [157] |
| CARBOSORB NC 1240® | 0.41 ± 0.03 | 1.19 ± 0.09 | 0.450 ± 0.030 | 0.80 ± 0.05 | This study |
| AMBIOTON® | 0.40 ± 0.02 | 0.98 ± 0.06 | 0.434 ± 0.012 | 0.29 ± 0.03 | |
| RE-CHAR® | 0.44 ± 0.05 | 1.31 ± 0.09 | <0.001 | 0.29 ± 0.02 |
| CEC (cmol(+)/kg) | AEC (cmol(+)/kg) | |
|---|---|---|
| CARBOSORB NC 1240® | 75.0 ± 1.20 | 18.40 ± 0.87 |
| AMBIOTON® | 58.75 ± 1.40 | 13.02 ± 0.11 |
| RE-CHAR® | 12.50 ± 0.80 | 5.30 ± 0.45 |
| MBI (g/kg) | IV (g/kg) | |
|---|---|---|
| CARBOSORB NC 1240® | 30.18 ± 1.4 | 1044 ± 22.1 |
| AMBIOTON® | 35.04 ± 2.7 | 211 ± 8.9 |
| RE-CHAR® | 25.56 ± 3.4 | 202 ± 12.4 |
Publisher’s Note: MDPI stays neutral with regard to jurisdictional claims in published maps and institutional affiliations. |
© 2022 by the authors. Licensee MDPI, Basel, Switzerland. This article is an open access article distributed under the terms and conditions of the Creative Commons Attribution (CC BY) license (https://creativecommons.org/licenses/by/4.0/).
Share and Cite
Marzeddu, S.; Décima, M.A.; Camilli, L.; Bracciale, M.P.; Genova, V.; Paglia, L.; Marra, F.; Damizia, M.; Stoller, M.; Chiavola, A.; et al. Physical-Chemical Characterization of Different Carbon-Based Sorbents for Environmental Applications. Materials 2022, 15, 7162. https://0-doi-org.brum.beds.ac.uk/10.3390/ma15207162
Marzeddu S, Décima MA, Camilli L, Bracciale MP, Genova V, Paglia L, Marra F, Damizia M, Stoller M, Chiavola A, et al. Physical-Chemical Characterization of Different Carbon-Based Sorbents for Environmental Applications. Materials. 2022; 15(20):7162. https://0-doi-org.brum.beds.ac.uk/10.3390/ma15207162
Chicago/Turabian StyleMarzeddu, Simone, María Alejandra Décima, Luca Camilli, Maria Paola Bracciale, Virgilio Genova, Laura Paglia, Francesco Marra, Martina Damizia, Marco Stoller, Agostina Chiavola, and et al. 2022. "Physical-Chemical Characterization of Different Carbon-Based Sorbents for Environmental Applications" Materials 15, no. 20: 7162. https://0-doi-org.brum.beds.ac.uk/10.3390/ma15207162