
Subtyping Hyperchloremia among Hospitalized Patients by Machine Learning Consensus Clustering

 , , , , , , and
Abstract
:1. Introduction
2. Materials and Methods
2.1. Patient Population
2.2. Data Collection
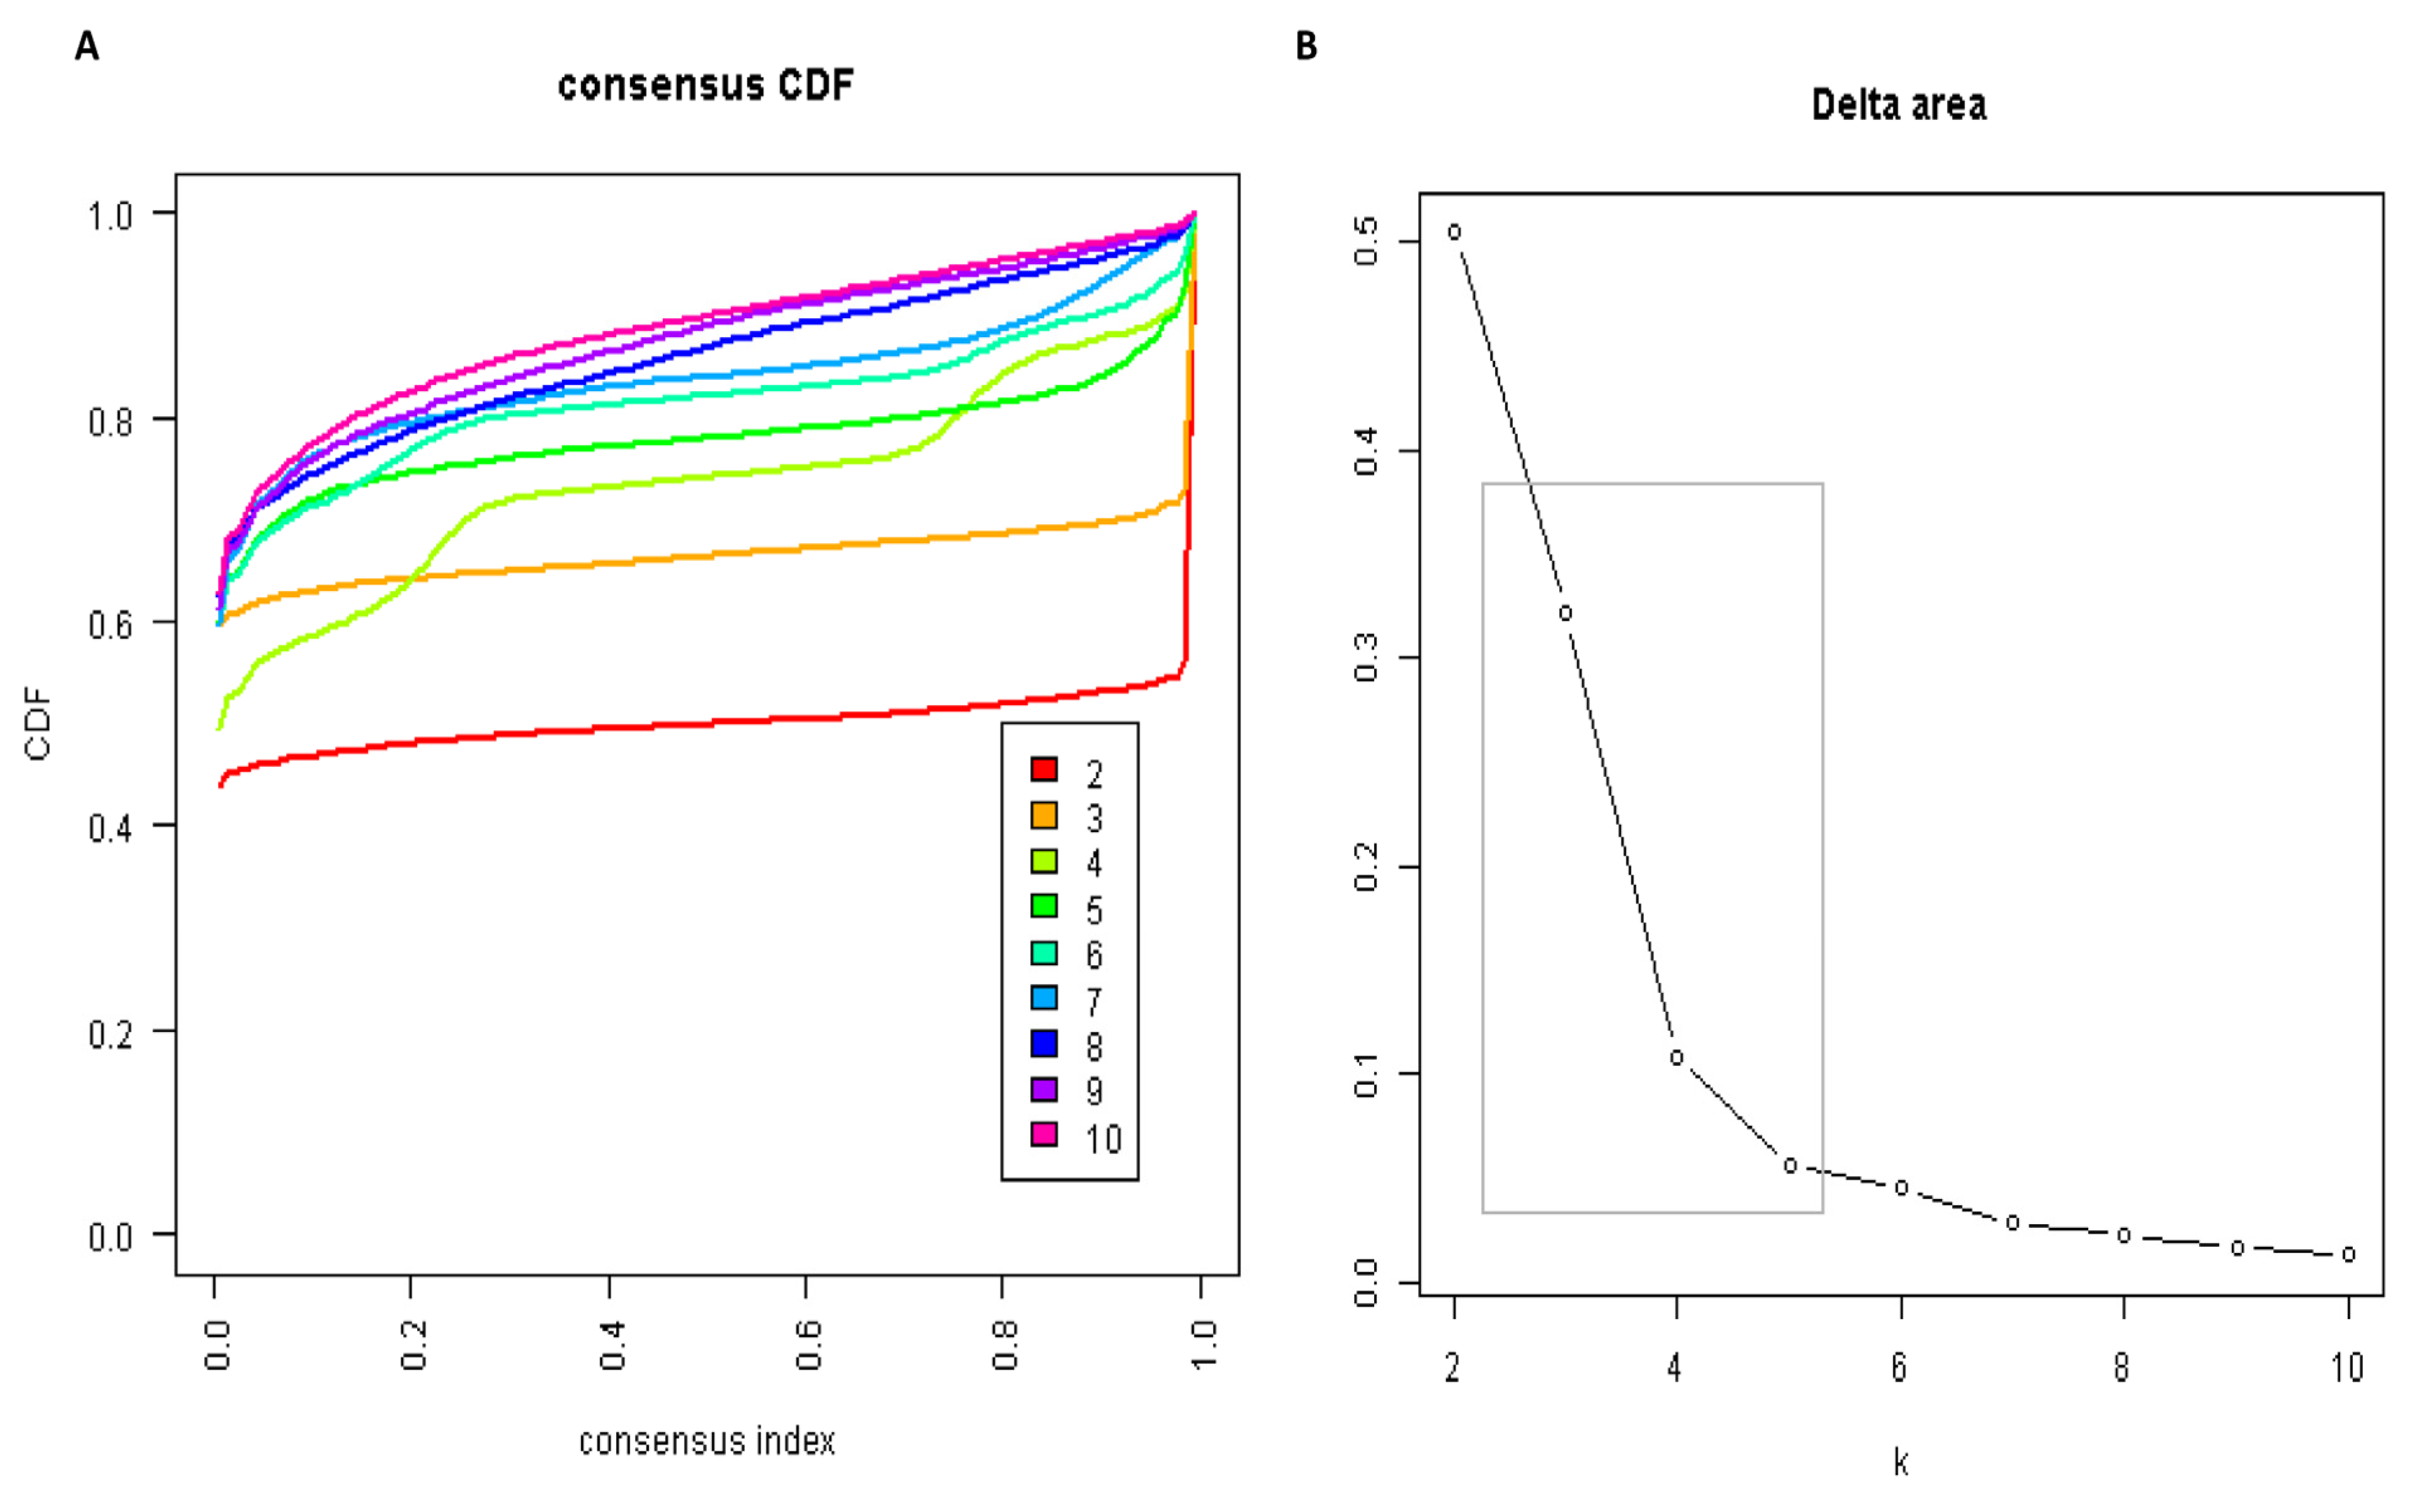
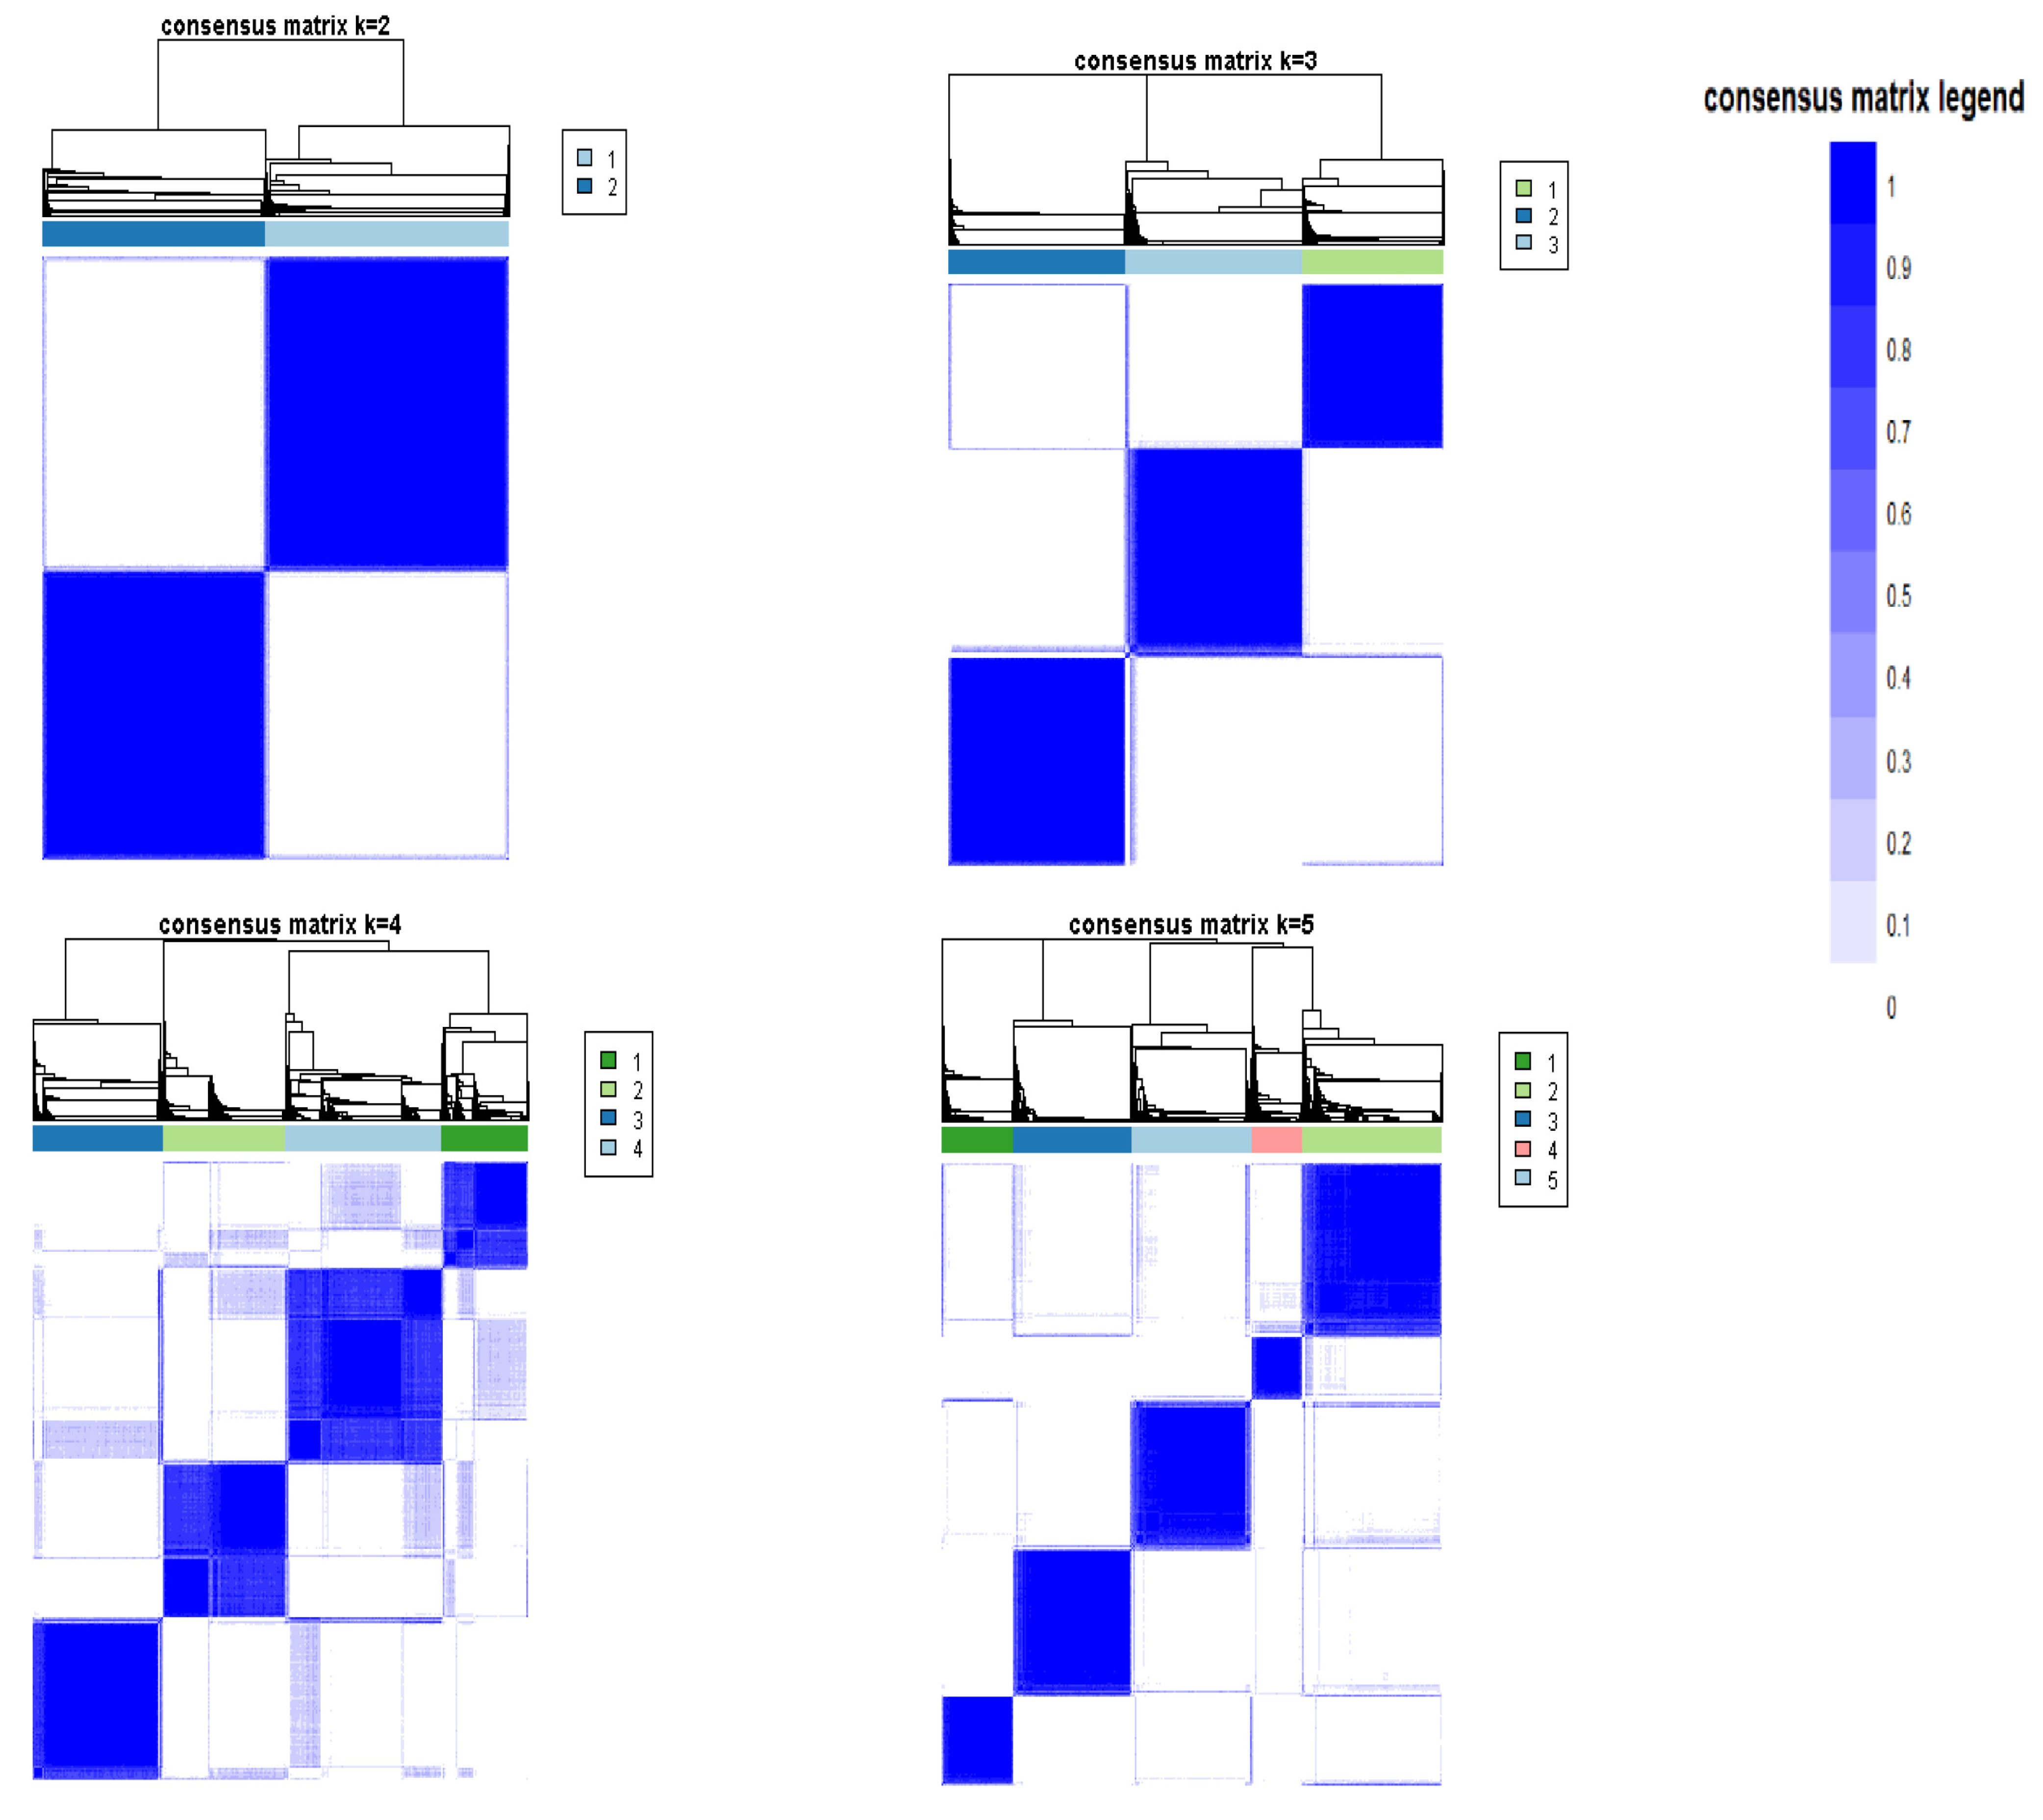
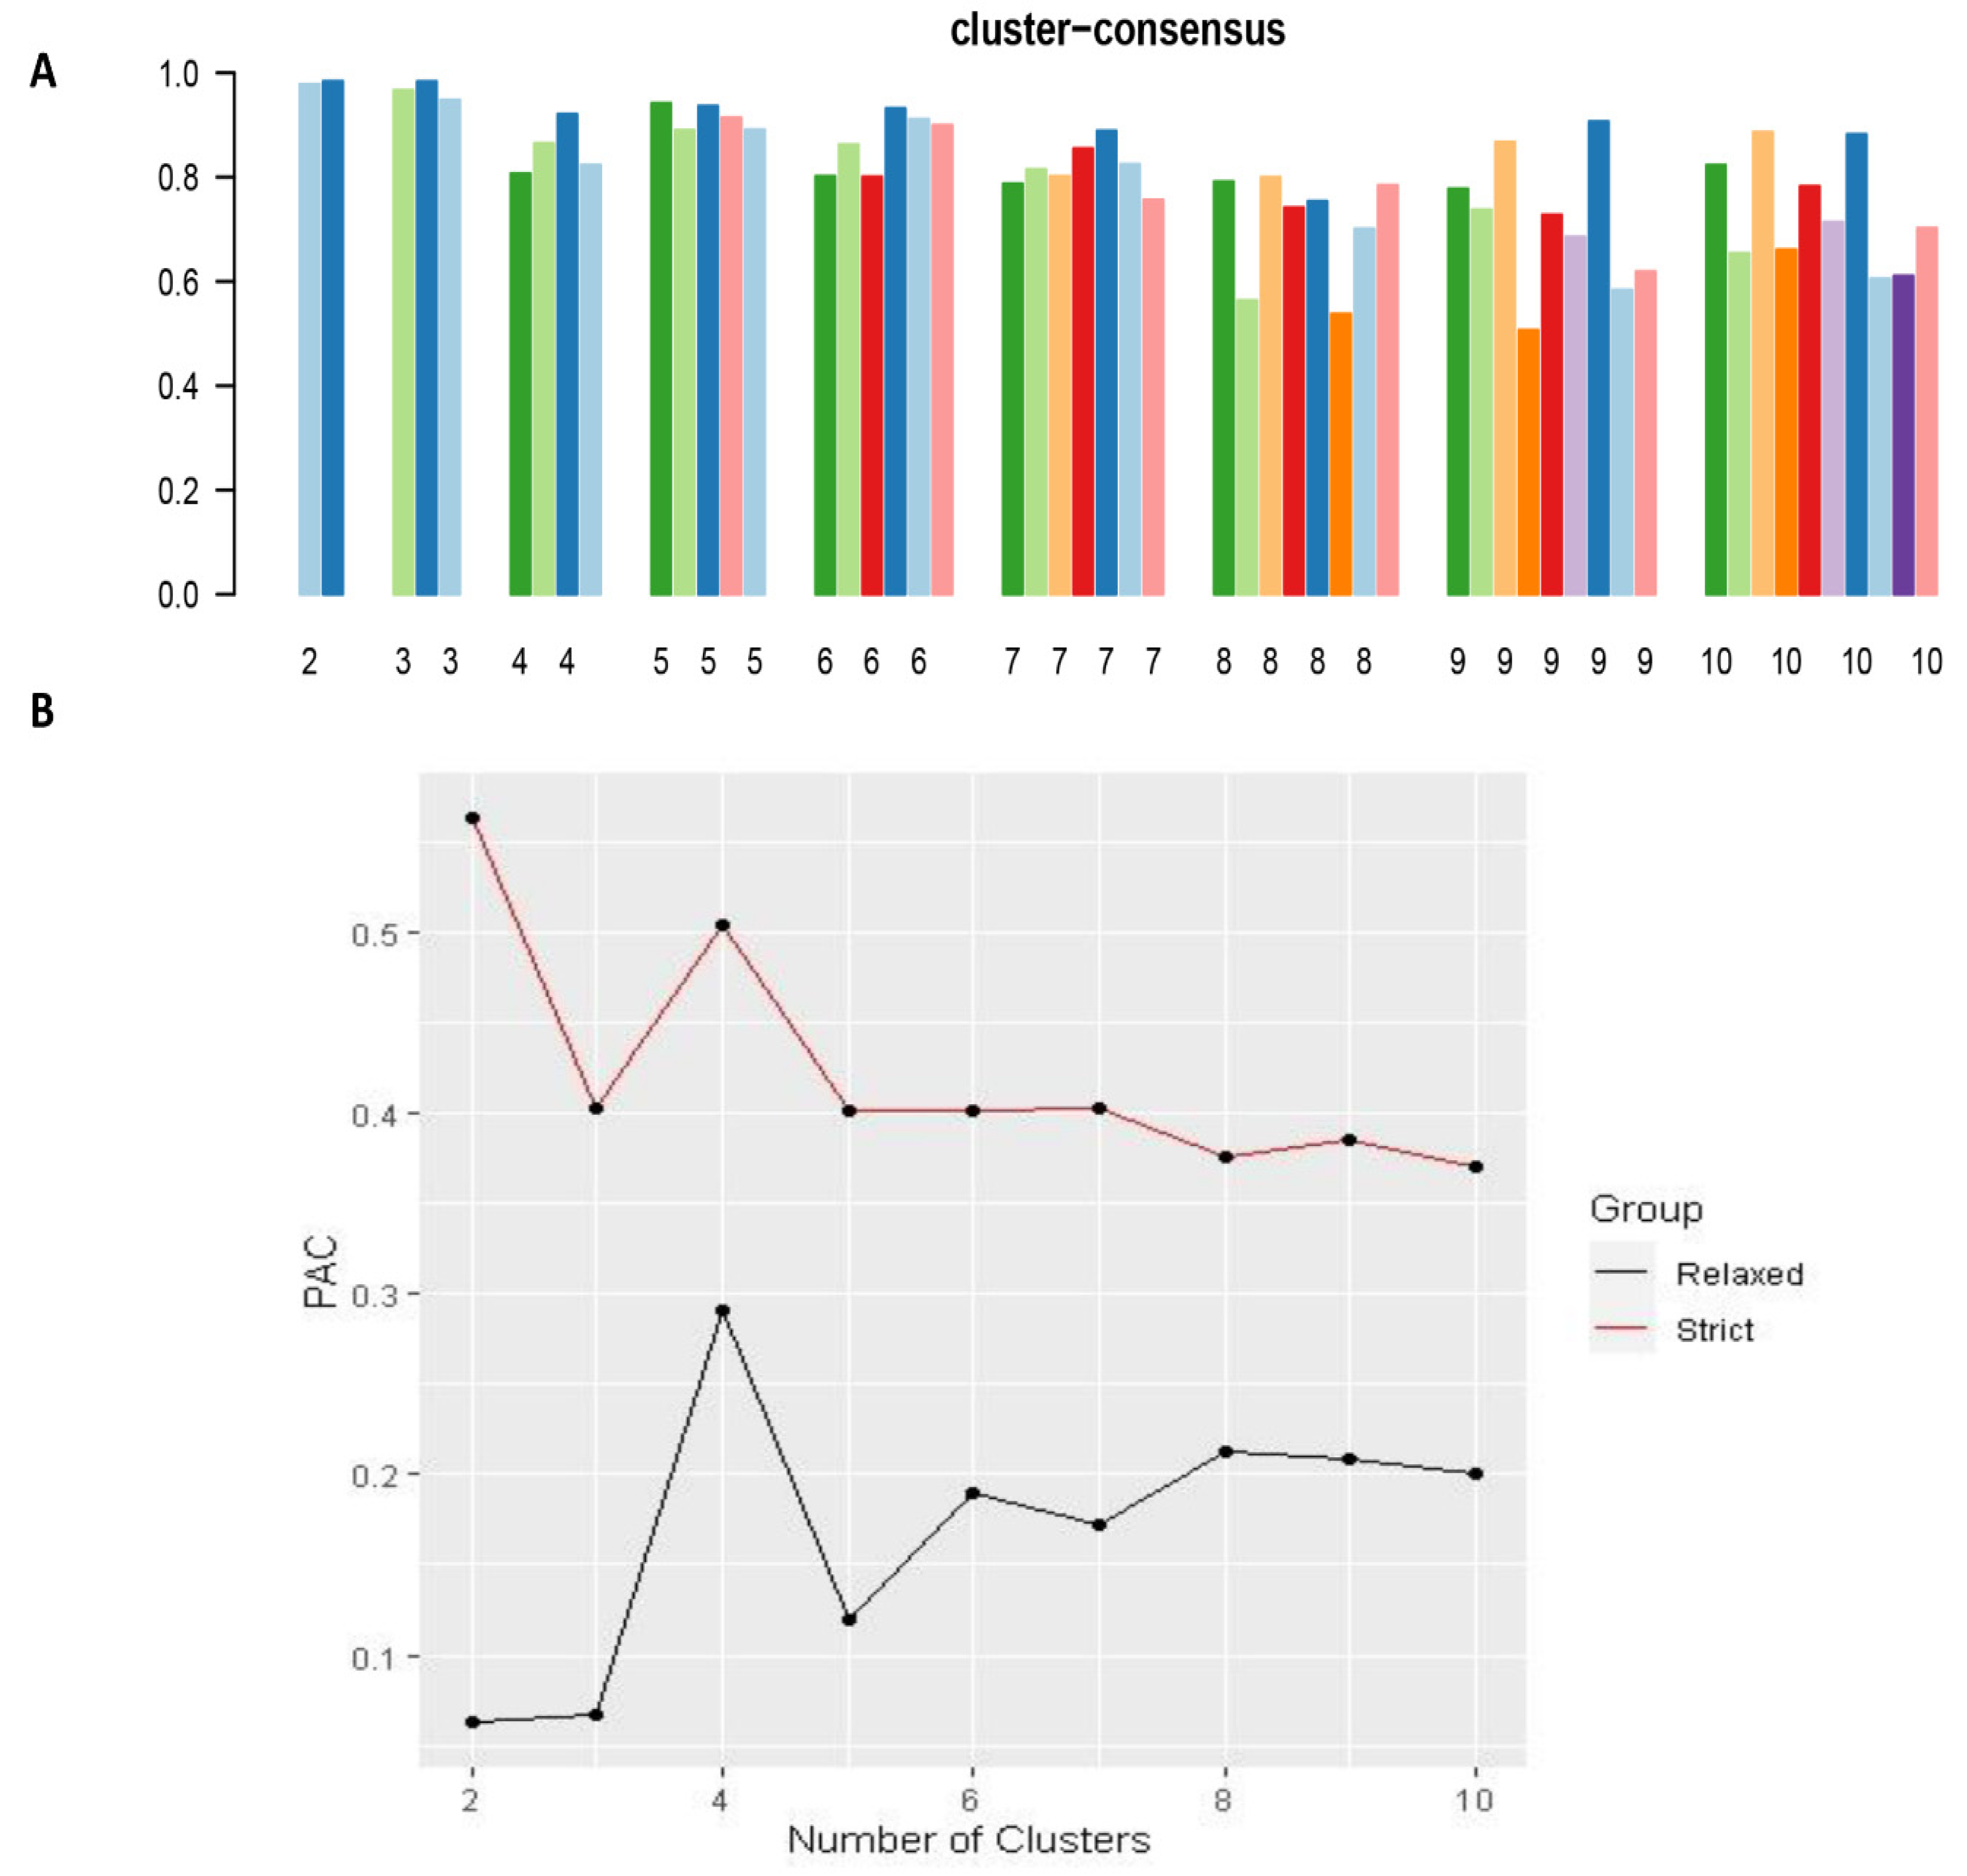
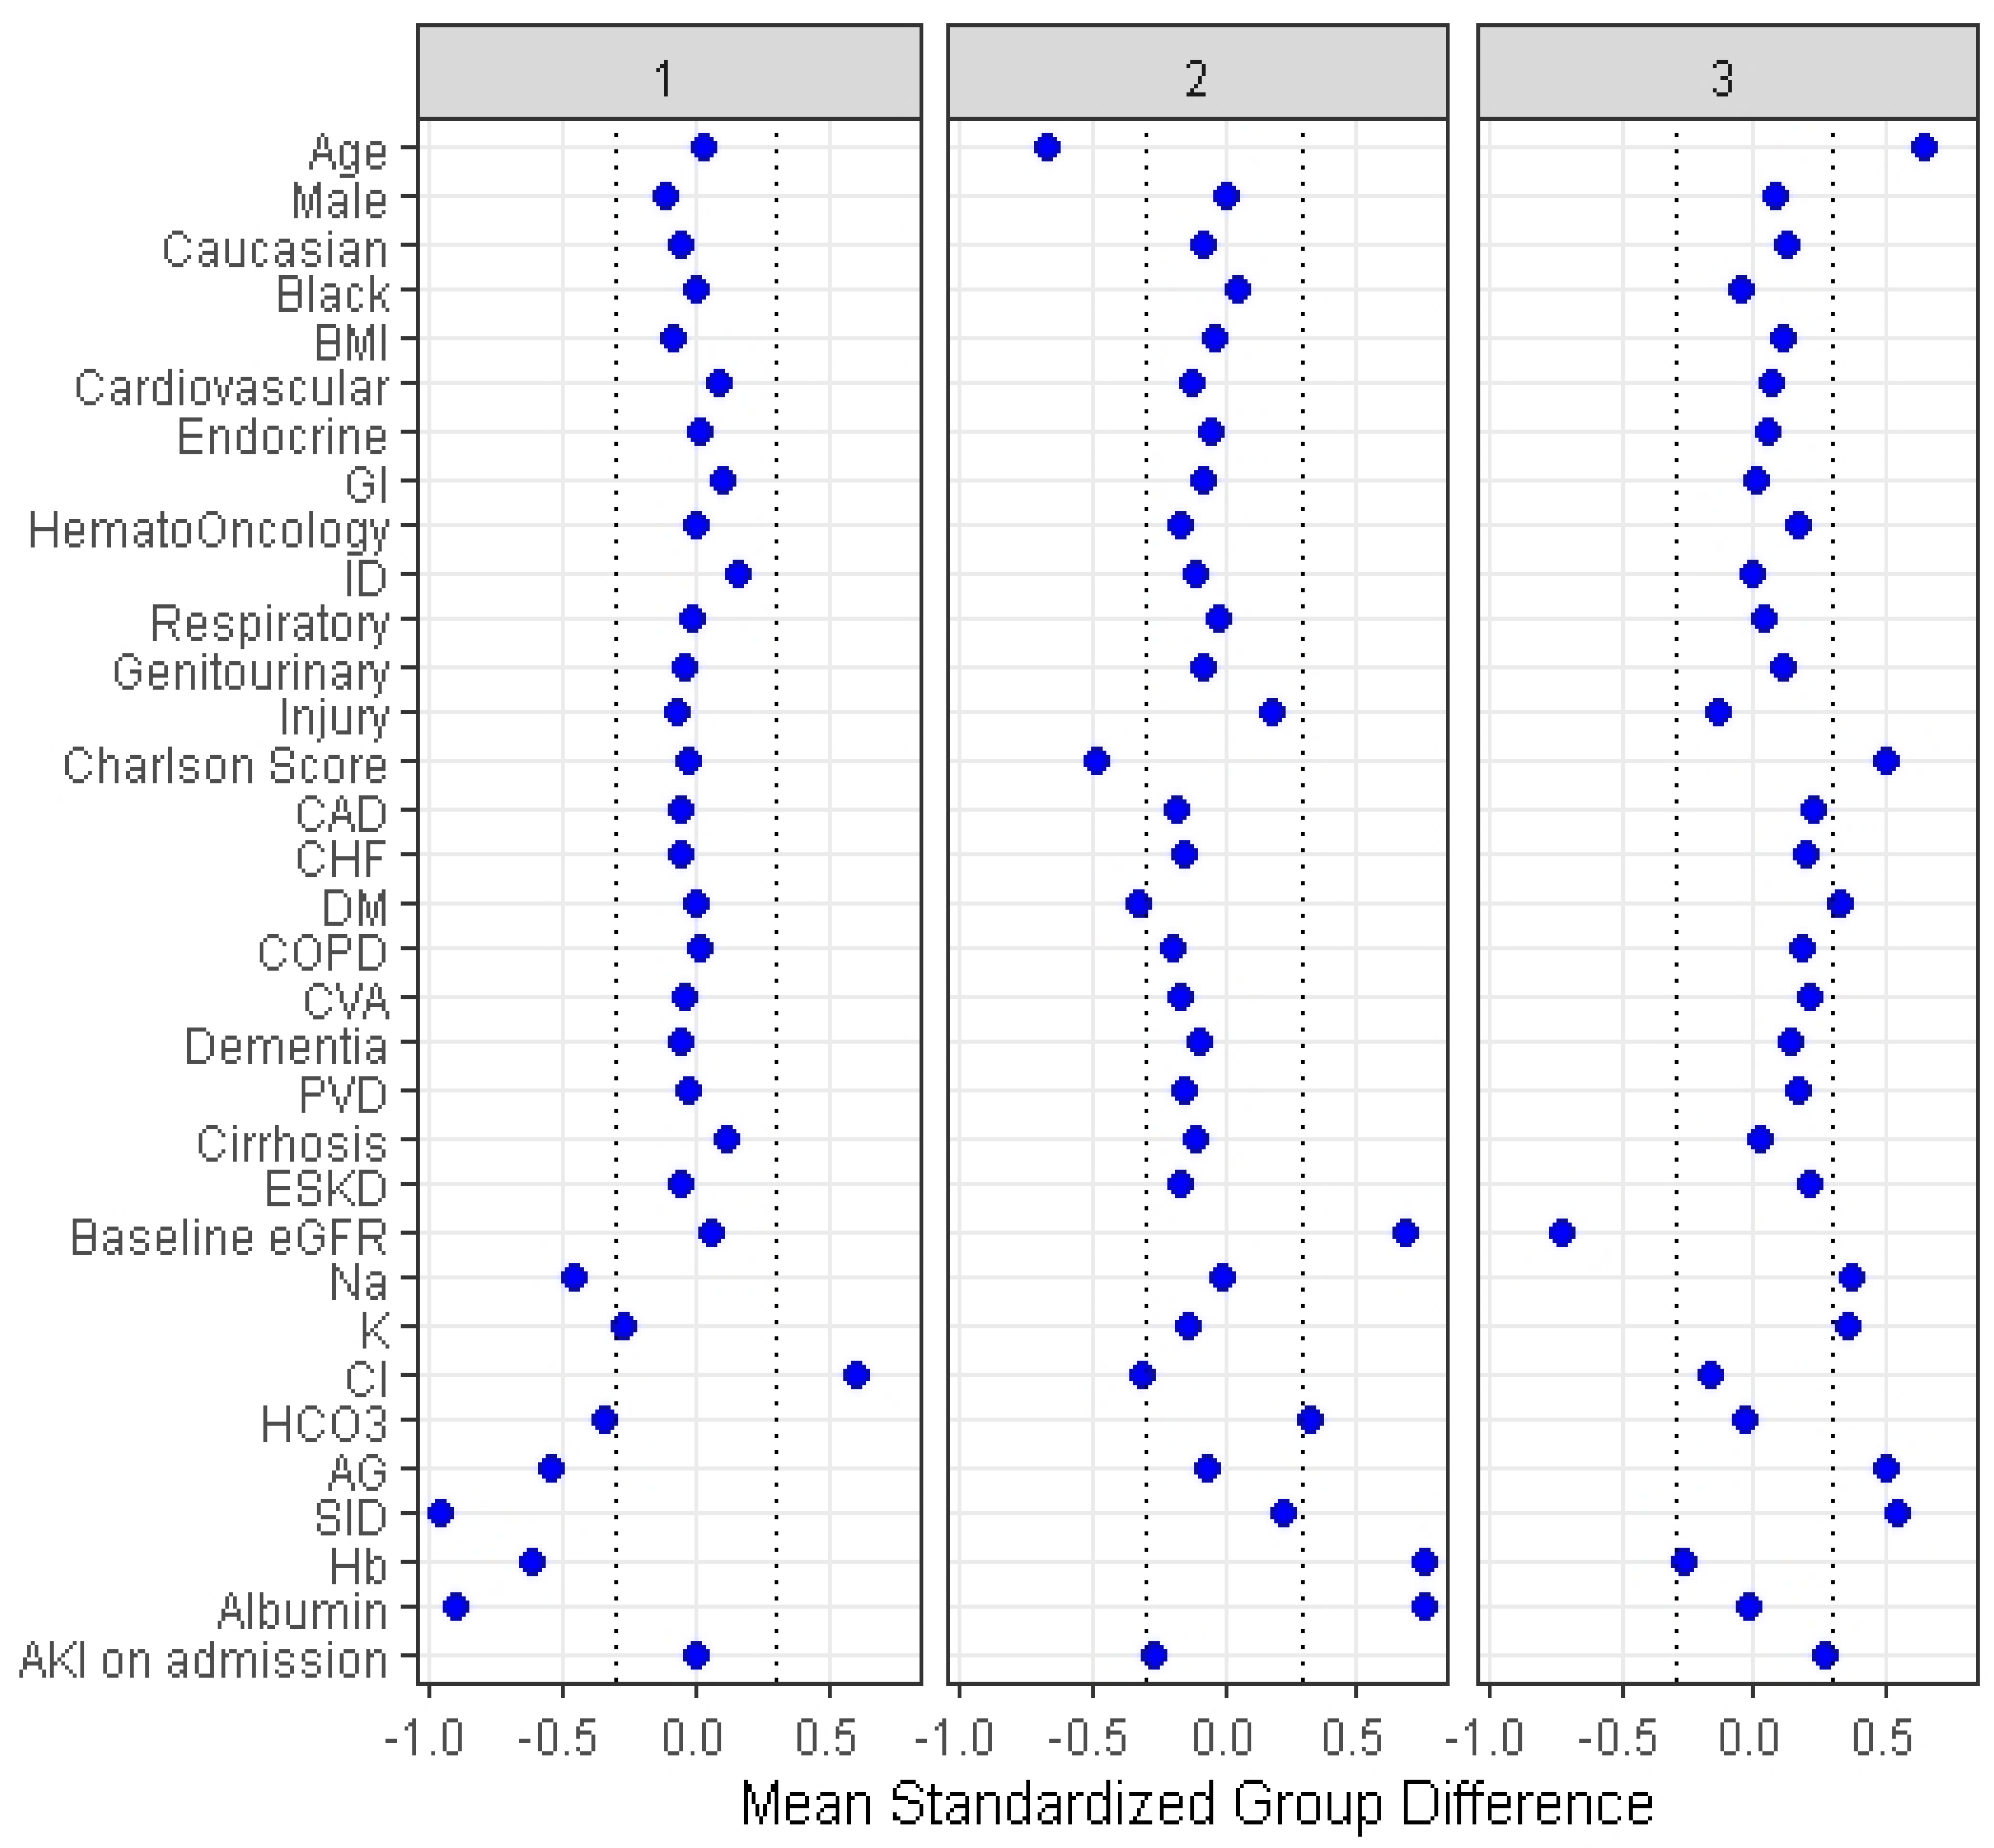
2.3. Clustering Analysis
2.4. Statistical Analysis
3. Results
4. Discussion
5. Conclusions
Supplementary Materials
Author Contributions
Funding
Institutional Review Board Statement
Informed Consent Statement
Data Availability Statement
Conflicts of Interest
References
- Bandak, G.; Kashani, K.B. Chloride in intensive care units: A key electrolyte. F1000Res. 2017, 6, 1930. [Google Scholar] [CrossRef]
- Thongprayoon, C.; Cheungpasitporn, W.; Cheng, Z.; Qian, Q. Chloride alterations in hospitalized patients: Prevalence and outcome significance. PLoS ONE 2017, 12, e0174430. [Google Scholar] [CrossRef]
- Thongprayoon, C.; Cheungpasitporn, W.; Hansrivijit, P.; Thirunavukkarasu, S.; Chewcharat, A.; Medaura, J.; Mao, M.; Kashani, K. Association of serum chloride level alterations with in-hospital mortality. Postgrad. Med. J. 2020, 96, 731–736. [Google Scholar] [CrossRef]
- Wilcox, C.S. Regulation of Renal Blood Flow by Plasma Chloride. J. Clin. Investig. 1983, 71, 726–735. [Google Scholar] [CrossRef]
- Hansen, P.B.; Jensen, B.L.; Skøtt, O. Chloride Regulates Afferent Arteriolar Contraction in Response to Depolarization. Hypertension 1998, 32, 1066–1070. [Google Scholar] [CrossRef] [Green Version]
- Shah, S.K.; Uray, K.; Stewart, R.H.; Laine, G.A.; Cox, C.S. Resuscitation-Induced Intestinal Edema and Related Dysfunction: State of the Science. J. Surg. Res. 2011, 166, 120–130. [Google Scholar] [CrossRef] [Green Version]
- Boniatti, M.M.; Cardoso, P.R.; Castilho, R.K.; Vieira, S.R. Is hyperchloremia associated with mortality in critically ill patients? A prospective cohort study. J. Crit. Care 2011, 26, 175–179. [Google Scholar] [CrossRef] [PubMed]
- Neyra, J.A.; Canepa-Escaro, F.; Li, X.; Manllo, J.; Adams-Huet, B.; Yee, J.; Yessayan, L. Association of Hyperchloremia With Hospital Mortality in Critically Ill Septic Patients. Crit. Care Med. 2015, 43, 1938–1944. [Google Scholar] [CrossRef]
- Bouchard, J.; Soroko, S.B.; Chertow, G.M.; Himmelfarb, J.; Ikizler, T.; Paganini, E.P.; Mehta, R.L. Fluid accumulation, survival and recovery of kidney function in critically ill patients with acute kidney injury. Kidney Int. 2009, 76, 422–427. [Google Scholar] [CrossRef] [PubMed] [Green Version]
- Nagami, G.T. Hyperchloremia—Why and how. Nefrologia 2016, 36, 347–353. [Google Scholar] [CrossRef] [PubMed] [Green Version]
- Welt, L.G.; Seldin, D.W.; Nelson, W.P.; German, W.J.; Peters, J.P. Role of the central nervous system in metabolism of electrolytes and water. AMA Arch. Intern. Med. 1952, 90, 355–378. [Google Scholar] [CrossRef]
- Yunos, N.M.; Bellomo, R.; Hegarty, C.; Story, D.; Ho, L.; Bailey, M. Association Between a Chloride-Liberal vs Chloride-Restrictive Intravenous Fluid Administration Strategy and Kidney Injury in Critically Ill Adults. JAMA 2012, 308, 1566–1572. [Google Scholar] [CrossRef] [PubMed] [Green Version]
- Young, P.; Bailey, M.; Beasley, R.; Henderson, S.; Mackle, D.; McArthur, C.; McGuinness, S.; Mehrtens, J.; Myburgh, J.; Psirides, A.; et al. Effect of a Buffered Crystalloid Solution vs Saline on Acute Kidney Injury Among Patients in the Intensive Care Unit:: The SPLIT Randomized Clinical Trial. JAMA 2015, 314, 1701–1710. [Google Scholar] [CrossRef] [PubMed]
- Patel, N.; Baker, S.M.; Walters, R.W.; Kaja, A.; Kandasamy, V.; Abuzaid, A.; Modrykamien, A.M. Serum hyperchloremia as a risk factor for acute kidney injury in patients with ST-segment elevation myocardial infarction undergoing percutaneous coronary intervention. Bayl. Univ. Med Cent. Proc. 2016, 29, 7–11. [Google Scholar] [CrossRef] [PubMed] [Green Version]
- Suetrong, B.; Pisitsak, C.; Boyd, J.H.; Russell, J.A.; Walley, K.R. Hyperchloremia and moderate increase in serum chloride are associated with acute kidney injury in severe sepsis and septic shock patients. Crit. Care 2016, 20, 315. [Google Scholar] [CrossRef] [Green Version]
- Shao, M.; Li, G.; Sarvottam, K.; Wang, S.; Thongprayoon, C.; Dong, Y.; Gajic, O.; Kashani, K. Dyschloremia Is a Risk Factor for the Development of Acute Kidney Injury in Critically Ill Patients. PLoS ONE 2016, 11, e0160322. [Google Scholar] [CrossRef]
- Zhang, Z.; Xu, X.; Fan, H.; Li, D.; Deng, H. Higher serum chloride concentrations are associated with acute kidney injury in unselected critically ill patients. BMC Nephrol. 2013, 14, 235. [Google Scholar] [CrossRef] [Green Version]
- Van Regenmortel, N.; Verbrugghe, W.; Van den Wyngaert, T.; Jorens, P.G. Impact of chloride and strong ion difference on ICU and hospital mortality in a mixed intensive care population. Ann. Intensive Care 2016, 6, 91. [Google Scholar] [CrossRef] [Green Version]
- McCluskey, S.A.; Karkouti, K.; Wijeysundera, D.; Minkovich, L.; Tait, G.; Beattie, W.S. Hyperchloremia after noncardiac surgery is independently associated with increased morbidity and mortality: A propensity-matched cohort study. Anesth Analg. 2013, 117, 412–421. [Google Scholar] [CrossRef] [PubMed] [Green Version]
- Lee, J.Y.; Hong, T.H.; Lee, K.W.; Jung, M.J.; Gil Lee, J.; Lee, S.H. Hyperchloremia is associated with 30-day mortality in major trauma patients: A retrospective observational study. Scand. J. Trauma Resusc. Emerg. Med. 2016, 24, 11. [Google Scholar] [CrossRef] [Green Version]
- Canepa-Escaro, F.; Neyra, J.A. Is dyschloremia a marker of critical illness or euchloremia an interventional target to improve outcomes? Ann. Transl. Med. 2019, 7 (Suppl. 8), S264. [Google Scholar] [CrossRef] [PubMed]
- Plant, D.; Barton, A. Machine learning in precision medicine: Lessons to learn. Nat. Rev. Rheumatol. 2021, 17, 5–6. [Google Scholar] [CrossRef] [PubMed]
- Tao, W.; Concepcion, A.N.; Vianen, M.; Marijnissen, A.C.A.; Lafeber, F.P.G.J.; Radstake, T.R.D.J.; Pandit, A. Multiomics and Machine Learning Accurately Predict Clinical Response to Adalimumab and Etanercept Therapy in Patients With Rheumatoid Arthritis. Arthritis Rheumatol. 2021, 73, 212–222. [Google Scholar] [CrossRef] [PubMed]
- Chang, Y.; Park, H.; Yang, H.-J.; Lee, S.; Lee, K.-Y.; Kim, T.S.; Jung, J.; Shin, J.-M. Cancer Drug Response Profile scan (CDRscan): A Deep Learning Model That Predicts Drug Effectiveness from Cancer Genomic Signature. Sci. Rep. 2018, 8, 8857. [Google Scholar] [CrossRef]
- Adam, G.; Rampášek, L.; Safikhani, Z.; Smirnov, P.; Haibe-Kains, B.; Goldenberg, A. Machine learning approaches to drug response prediction: Challenges and recent progress. npj Precis. Oncol. 2020, 4, 1–10. [Google Scholar] [CrossRef]
- Thongprayoon, C.; Kattah, A.G.; A Mao, M.; Keddis, M.T.; Pattharanitima, P.; Vallabhajosyula, S.; Nissaisorakarn, V.; Erickson, S.B.; Dillon, J.J.; Garovic, V.D.; et al. Distinct Phenotypes of Hospitalized Patients with Hyperkalemia by Machine Learning Consensus Clustering and Associated Mortality Risks. QJM Int. J. Med. 2021. [Google Scholar] [CrossRef]
- Thongprayoon, C.; Kaewput, W.; Kovvuru, K.; Hansrivijit, P.; Kanduri, S.R.; Bathini, T.; Chewcharat, A.; Leeaphorn, N.; Gonzalez-Suarez, M.L.; Cheungpasitporn, W. Promises of Big Data and Artificial Intelligence in Nephrology and Transplantation. J. Clin. Med. 2020, 9, 1107. [Google Scholar] [CrossRef] [PubMed] [Green Version]
- Thongprayoon, C.; Hansrivijit, P.; Bathini, T.; Vallabhajosyula, S.; Mekraksakit, P.; Kaewput, W.; Cheungpasitporn, W. Predicting Acute Kidney Injury after Cardiac Surgery by Machine Learning Approaches. J. Clin. Med. 2020, 9, 1767. [Google Scholar] [CrossRef]
- Thongprayoon, C.; Kaewput, W.; Choudhury, A.; Hansrivijit, P.; Mao, M.; Cheungpasitporn, W. Is It Time for Machine Learning Algorithms to Predict the Risk of Kidney Failure in Patients with Chronic Kidney Disease? J. Clin. Med. 2021, 10, 1121. [Google Scholar] [CrossRef]
- Jelovsek, J.E.; Gantz, M.G.; Lukacz, E.S.; Zyczynski, H.M.; Sridhar, A.; Kery, C.; Chew, R.; Harvie, H.S.; Dunivan, G.; Schaffer, J.; et al. Subgroups of failure after surgery for pelvic organ prolapse and associations with quality of life outcomes: A longitudinal cluster analysis. Am. J. Obstet. Gynecol. 2021. [Google Scholar] [CrossRef]
- Forte, J.C.; Yeshmagambetova, G.; van der Grinten, M.L.; Hiemstra, B.; Kaufmann, T.; Eck, R.J.; Keus, F.; Epema, A.H.; Wiering, M.A.; van der Horst, I.C.C. Identifying and characterizing high-risk clusters in a heterogeneous ICU population with deep embedded clustering. Sci. Rep. 2021, 11, 12109. [Google Scholar] [CrossRef] [PubMed]
- Lin, P.-I.; Moni, M.A.; Gau, S.S.-F.; Eapen, V. Identifying Subgroups of Patients With Autism by Gene Expression Profiles Using Machine Learning Algorithms. Front. Psychiatry 2021, 12. [Google Scholar] [CrossRef]
- Monti, S.; Tamayo, P.; Mesirov, J.; Golub, T. Consensus Clustering: A Resampling-Based Method for Class Discovery and Visualization of Gene Expression Microarray Data. Mach. Learn. 2003, 52, 91–118. [Google Scholar] [CrossRef]
- Wilkerson, M.D.; Hayes, D.N. ConsensusClusterPlus: A class discovery tool with confidence assessments and item tracking. Bioinformatics 2010, 26, 1572–1573. [Google Scholar] [CrossRef] [PubMed] [Green Version]
- Șenbabaoğlu, Y.; Michailidis, G.; Li, J.Z. Critical limitations of consensus clustering in class discovery. Sci. Rep. 2014, 4, 06207. [Google Scholar] [CrossRef] [PubMed] [Green Version]
- Soriano, J.R. Renal Tubular Acidosis: The Clinical Entity. J. Am. Soc. Nephrol. 2002, 13, 2160–2170. [Google Scholar] [CrossRef] [PubMed] [Green Version]


| Patient Characteristics | Overall (n = 11,394) | Cluster 1 (n = 3237) | Cluster 2 (n = 4059) | Cluster 3 (n = 4098) | p-Value |
|---|---|---|---|---|---|
| Age (years) | 60.8 (17.9) | 61.3 (15.9) | 48.9 (16.5) | 72.3 (12.3) | <0.001 |
| Male sex | 5706 (50) | 1446 (45) | 2047 (50) | 2213 (54) | <0.001 |
| Race | <0.001 | ||||
| - White | 10,528 (92) | 2944 (91) | 3668 (90) | 3916 (96) | |
| - Black | 191 (2) | 56 (2) | 94 (2) | 41 (1) | |
| - Others | 675 (6) | 237 (7) | 297 (7) | 141 (3) | |
| BMI (kg/m2) | 29.0 (6.8) | 28.4 (6.6) | 28.7 (6.7) | 29.7 (6.9) | <0.001 |
| Principal diagnosis | <0.001 | ||||
| - Cardiovascular | 3750 (33) | 1192 (37) | 1094 (27) | 1464 (36) | |
| - Endocrine/metabolic | 195 (2) | 61 (2) | 40 (1) | 94 (2) | |
| - Gastrointestinal | 974 (9) | 367 (11) | 253 (6) | 354 (9) | |
| - Genitourinary | 403 (4) | 93 (3) | 84 (2) | 226 (6) | |
| - Hematology/oncology | 1233 (11) | 348 (11) | 234 (6) | 651 (16) | |
| - Infectious disease | 379 (3) | 198 (6) | 54 (1) | 127 (3) | |
| - Respiratory | 243 (2) | 92 (2) | 72 (2) | 109 (3) | |
| - Injury/poisoning | 1933 (17) | 467 (14) | 970 (24) | 496 (12) | |
| - Other | 2284 (20) | 449 (14) | 1258 (31) | 577 (14) | |
| Charlson Comorbidity Score | 1.6 (2.2) | 1.6 (2.0) | 0.5 (1.0) | 2.7 (2.6) | <0.001 |
| Comorbidities | |||||
| - Coronary artery disease | 859 (8) | 193 (6) | 117 (3) | 549 (13) | <0.001 |
| - Congestive heart failure | 785 (7) | 178 (6) | 122 (3) | 485 (12) | <0.001 |
| - Peripheral vascular disease | 374 (3) | 92 (3) | 25 (1) | 257 (6) | <0.001 |
| - Dementia | 169 (1) | 29 (1) | 13 (0) | 127 (3) | <0.001 |
| - Stroke | 858 (8) | 203 (6) | 125 (3) | 530 (13) | <0.001 |
| - COPD | 807 (7) | 244 (8) | 85 (2) | 478 (12) | <0.001 |
| - Diabetes mellitus | 2040 (18) | 586 (18) | 220 (5) | 1234 (30) | <0.001 |
| - Cirrhosis | 347 (3) | 164 (5) | 47 (1) | 136 (3) | <0.001 |
| - End-stage kidney disease | 378 (3) | 77 (2) | 11 (0) | 290 (7) | <0.001 |
| Laboratory test | |||||
| - eGFR (mL/min/1.73 m2) | 74 (24) | 75 (21) | 91 (18) | 56 (20) | <0.001 |
| - Sodium (mEq/L) | 141 (3) | 139 (3) | 141 (3) | 142 (3) | <0.001 |
| - Potassium (mEq/L) | 4.2 (0.6) | 4.0 (0.6) | 4.1 (0.4) | 4.4 (0.7) | <0.001 |
| - Chloride (mEq/L) | 110 (3) | 112 (4) | 109 (2) | 110 (2) | <0.001 |
| - Bicarbonate (mEq/L) | 23 (3) | 22 (4) | 24 (3) | 23 (4) | <0.001 |
| - Anion gap | 8 (4) | 6 (4) | 8 (3) | 10 (3) | <0.001 |
| - Strong ion difference | 34.8 (3.4) | 31.5 (3.0) | 35.6 (2.5) | 36.7 (2.6) | <0.001 |
| - Hemoglobin (g/dL) | 11.5 (2.2) | 10.2 (1.9) | 13.2 (1.6) | 10.9 (1.9) | <0.001 |
| - Albumin (g/dL) | 3.5 (0.4) | 3.1 (0.3) | 3.8 (0.3) | 3.5 (0.3) | <0.001 |
| Acute kidney injury | 1542 (14) | 434 (13) | 170 (4) | 938 (23) | <0.001 |
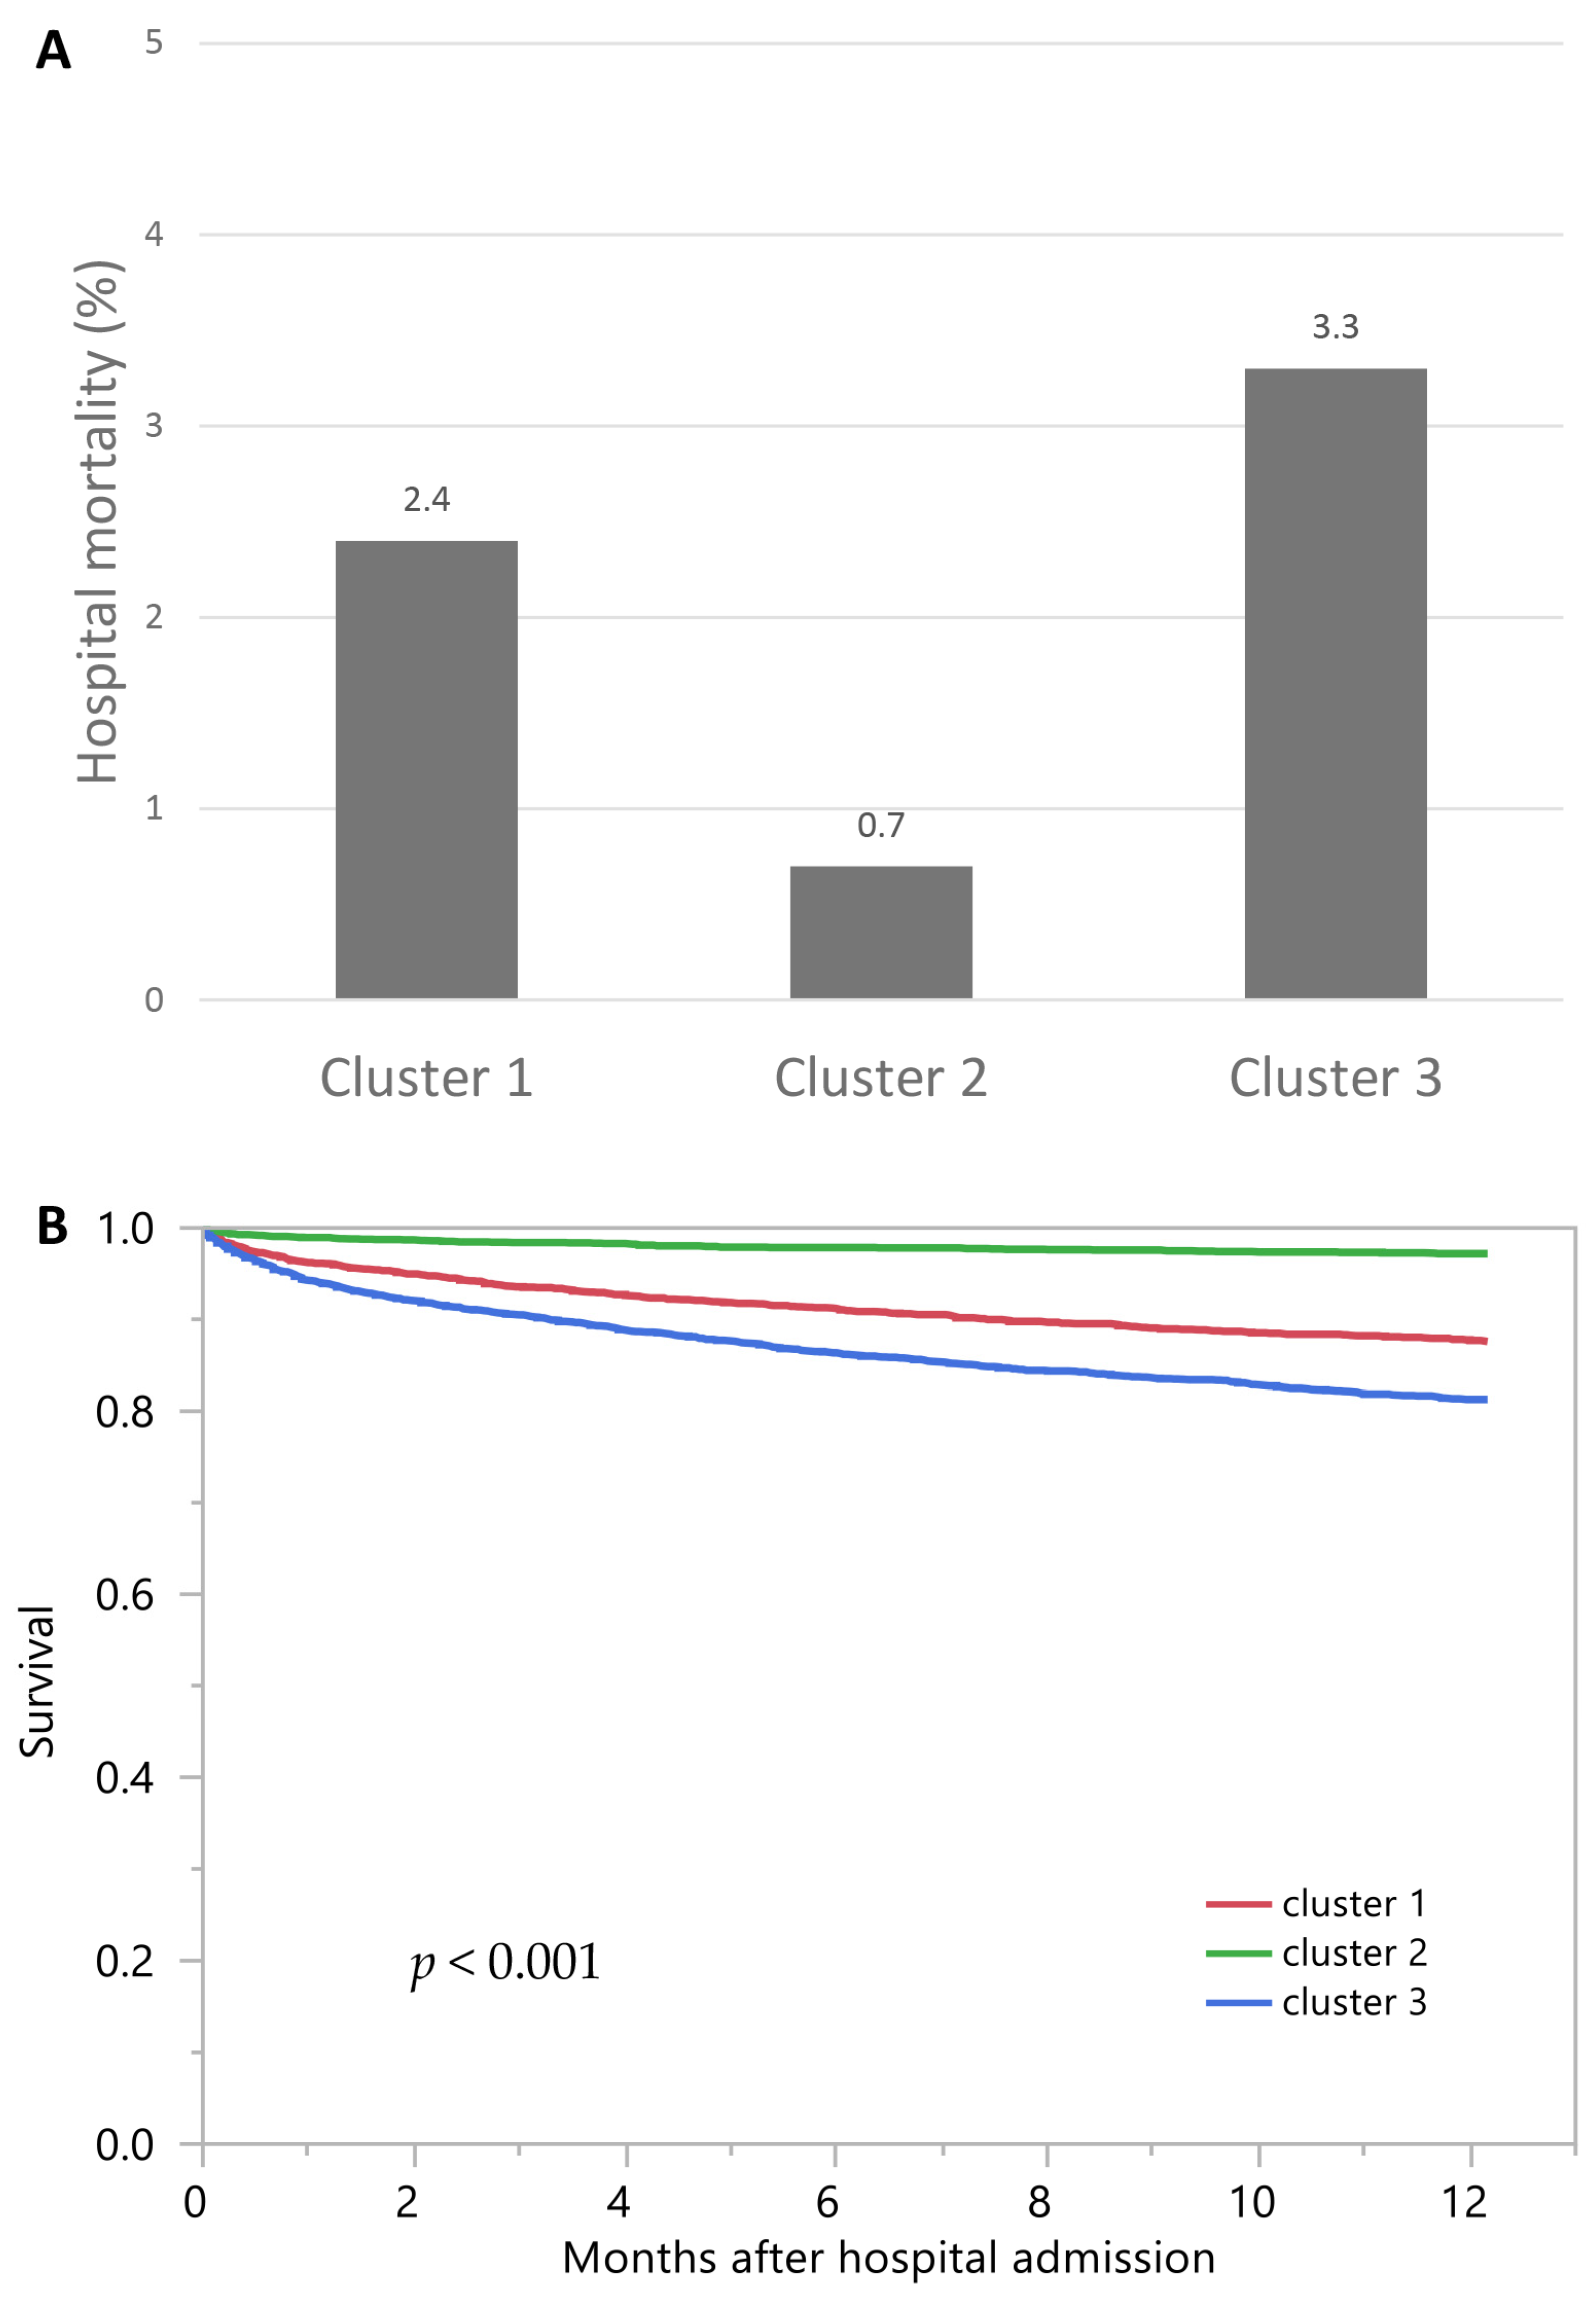
| Hospital Mortality | OR (95% CI) | 1-Year Mortality | HR (95% CI) | |
|---|---|---|---|---|
| Cluster 1 | 2.4% | 3.60 (2.33–5.56) | 12.5% | 4.49 (3.53–5.70) |
| Cluster 2 | 0.7% | 1 (ref) | 2.8% | 1 (ref) |
| Cluster 3 | 3.3% | 4.83 (3.21–7.28) | 18.8% | 6.96 (5.56–8.72) |
Publisher’s Note: MDPI stays neutral with regard to jurisdictional claims in published maps and institutional affiliations. |
© 2021 by the authors. Licensee MDPI, Basel, Switzerland. This article is an open access article distributed under the terms and conditions of the Creative Commons Attribution (CC BY) license (https://creativecommons.org/licenses/by/4.0/).
Share and Cite
Thongprayoon, C.; Nissaisorakarn, V.; Pattharanitima, P.; Mao, M.A.; Kattah, A.G.; Keddis, M.T.; Dumancas, C.Y.; Vallabhajosyula, S.; Petnak, T.; Erickson, S.B.; et al. Subtyping Hyperchloremia among Hospitalized Patients by Machine Learning Consensus Clustering. Medicina 2021, 57, 903. https://0-doi-org.brum.beds.ac.uk/10.3390/medicina57090903
Thongprayoon C, Nissaisorakarn V, Pattharanitima P, Mao MA, Kattah AG, Keddis MT, Dumancas CY, Vallabhajosyula S, Petnak T, Erickson SB, et al. Subtyping Hyperchloremia among Hospitalized Patients by Machine Learning Consensus Clustering. Medicina. 2021; 57(9):903. https://0-doi-org.brum.beds.ac.uk/10.3390/medicina57090903
Chicago/Turabian StyleThongprayoon, Charat, Voravech Nissaisorakarn, Pattharawin Pattharanitima, Michael A. Mao, Andrea G. Kattah, Mira T. Keddis, Carissa Y. Dumancas, Saraschandra Vallabhajosyula, Tananchai Petnak, Stephen B. Erickson, and et al. 2021. "Subtyping Hyperchloremia among Hospitalized Patients by Machine Learning Consensus Clustering" Medicina 57, no. 9: 903. https://0-doi-org.brum.beds.ac.uk/10.3390/medicina57090903