
Autophagy Deficiency by Atg4B Loss Leads to Metabolomic Alterations in Mice

 ,
,  , and
, and 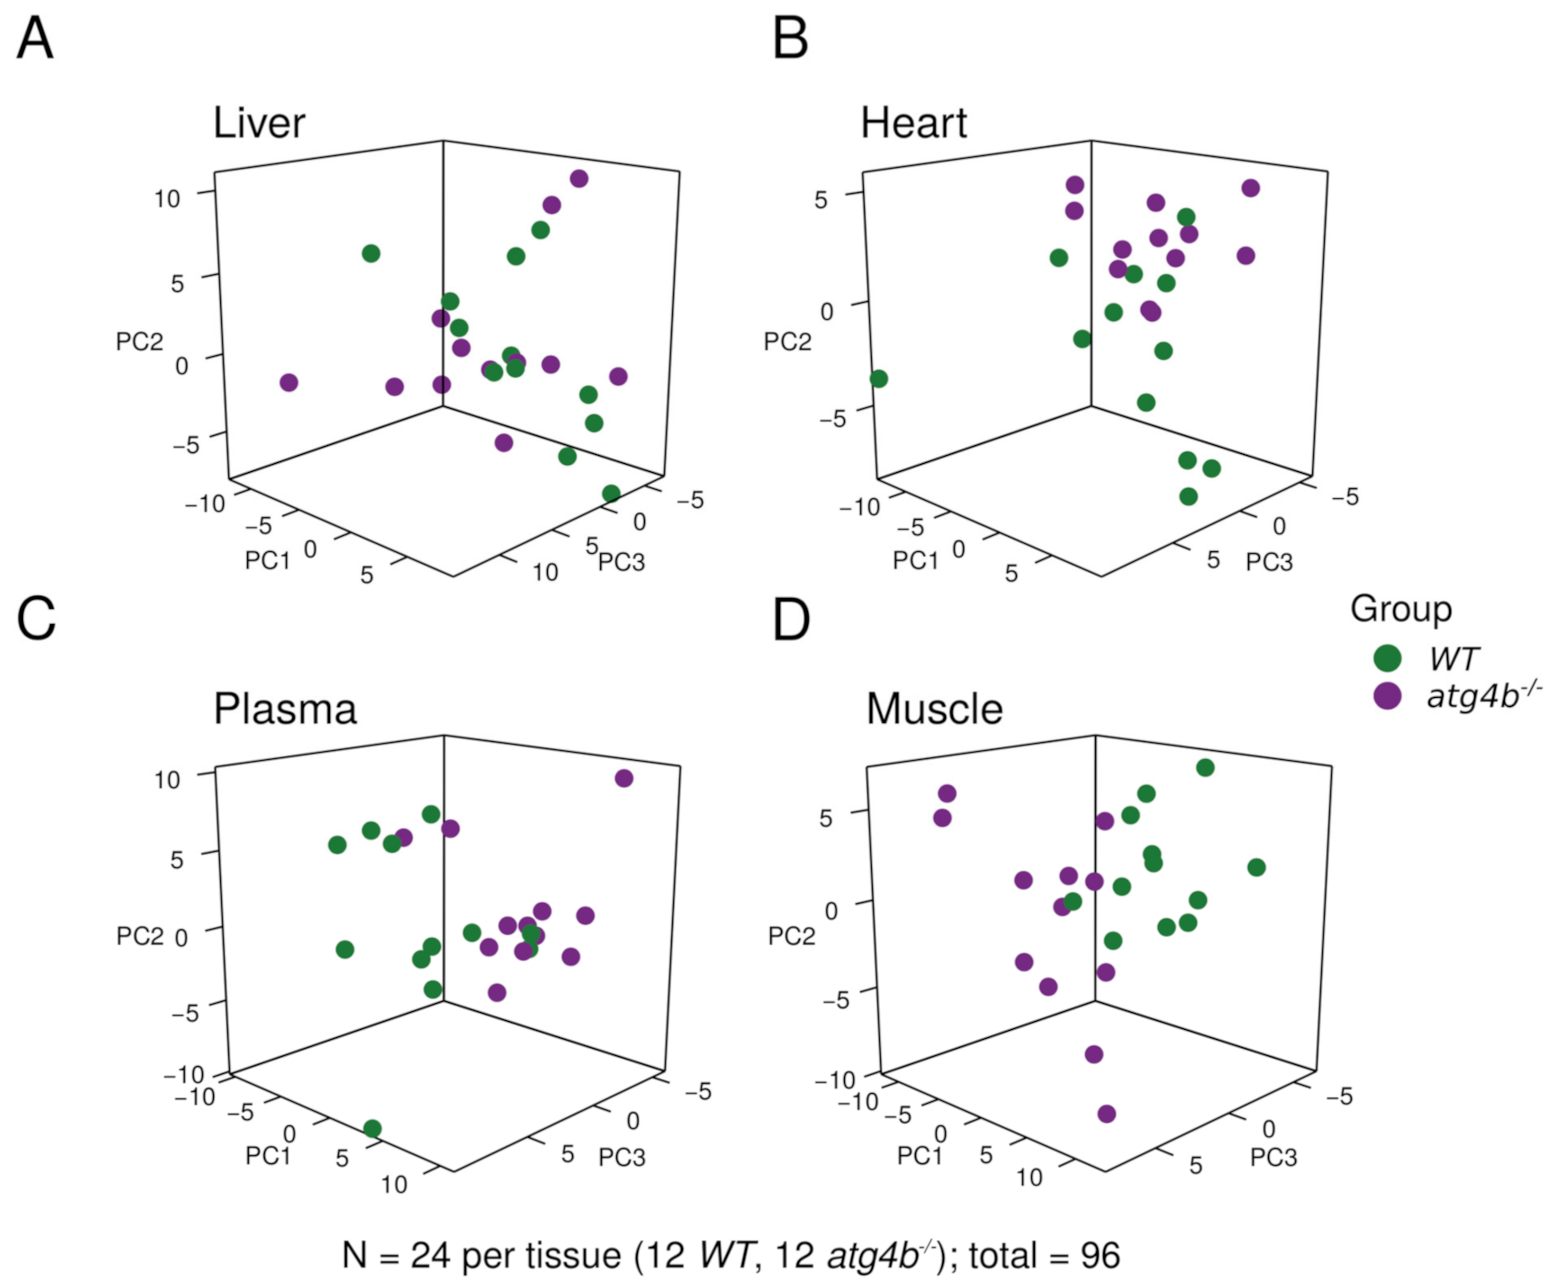
Abstract
:1. Introduction
2. Results and Discussion
2.1. Metabolomic Profiling of Autophagy-Deficient Mouse Tissues
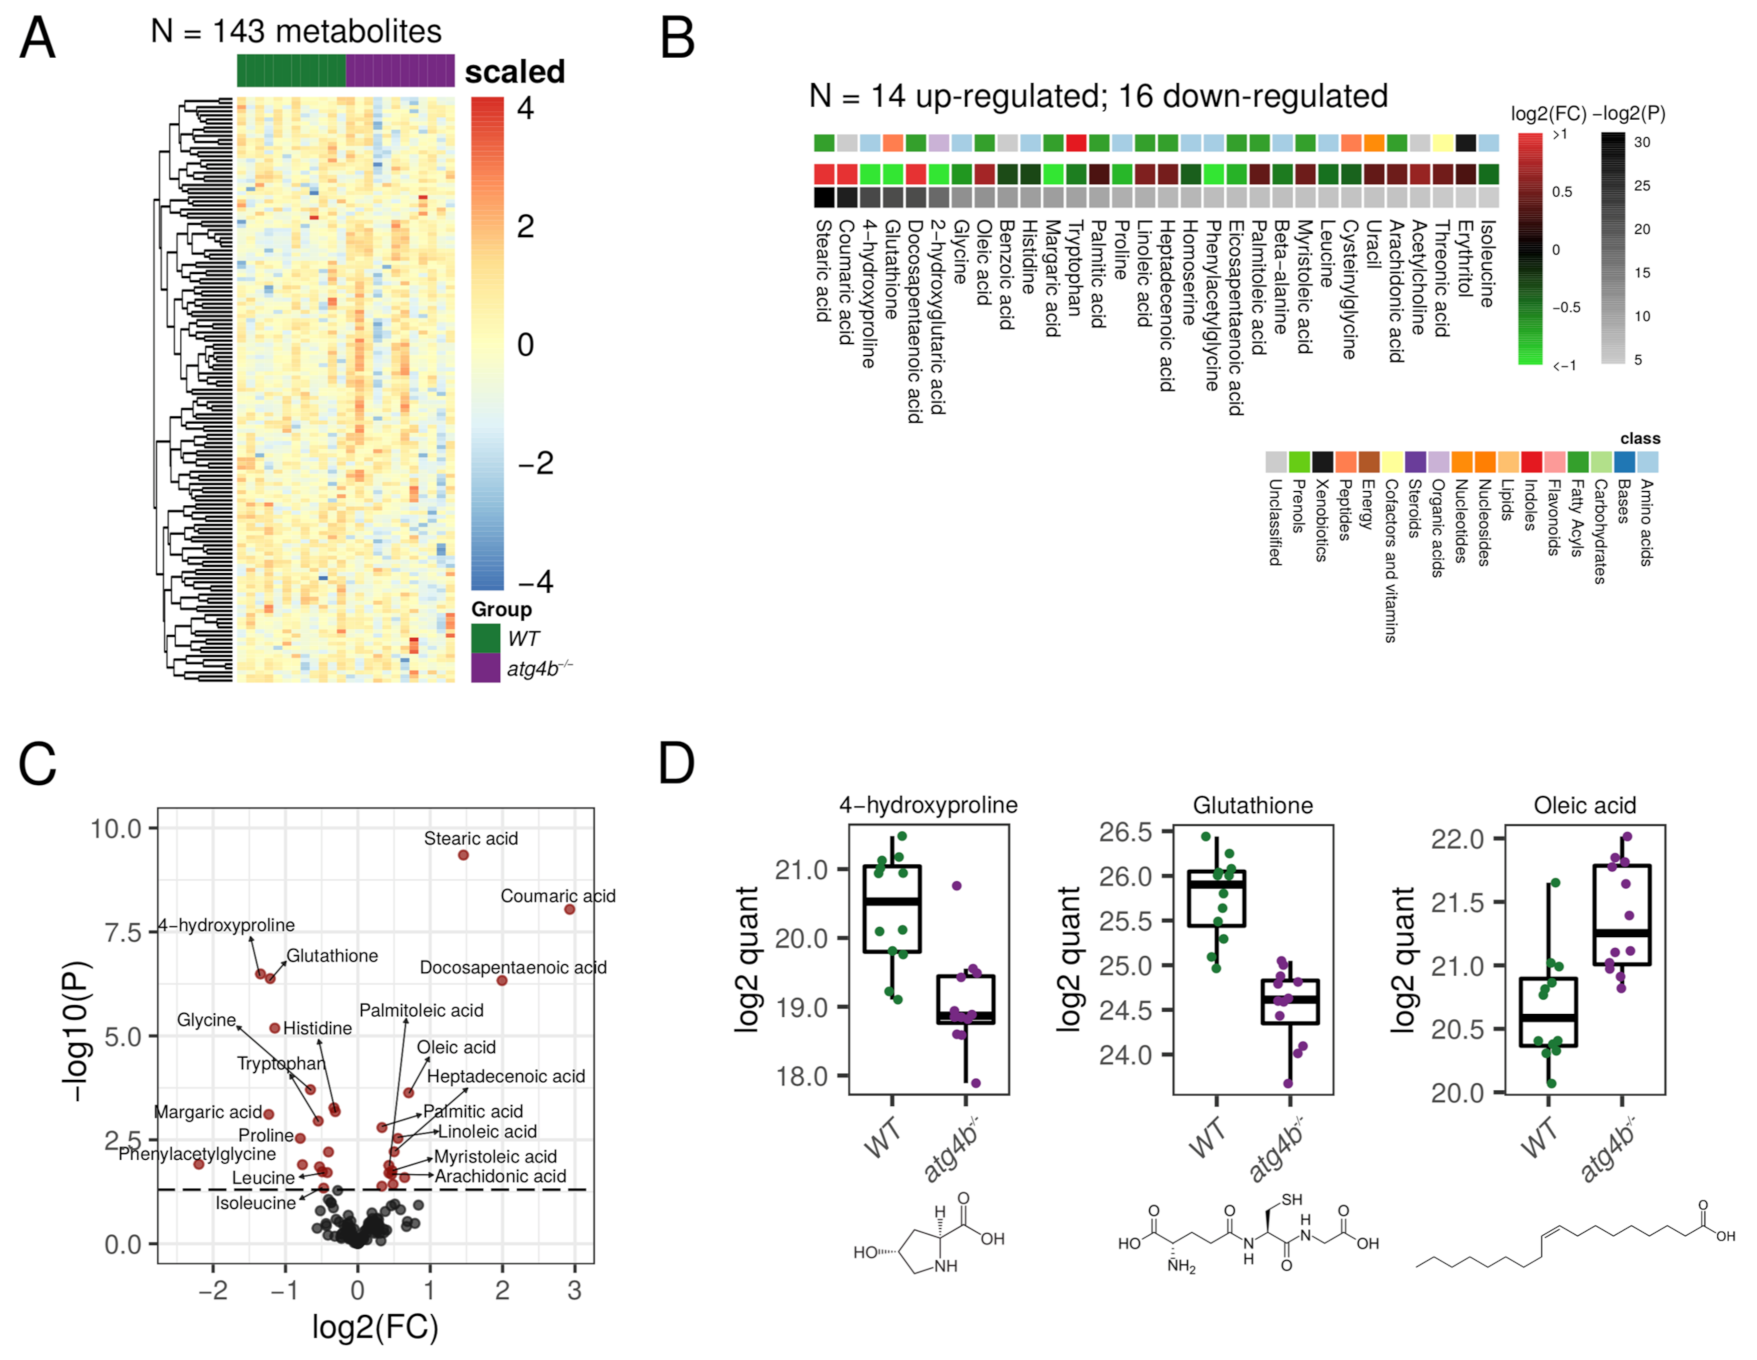
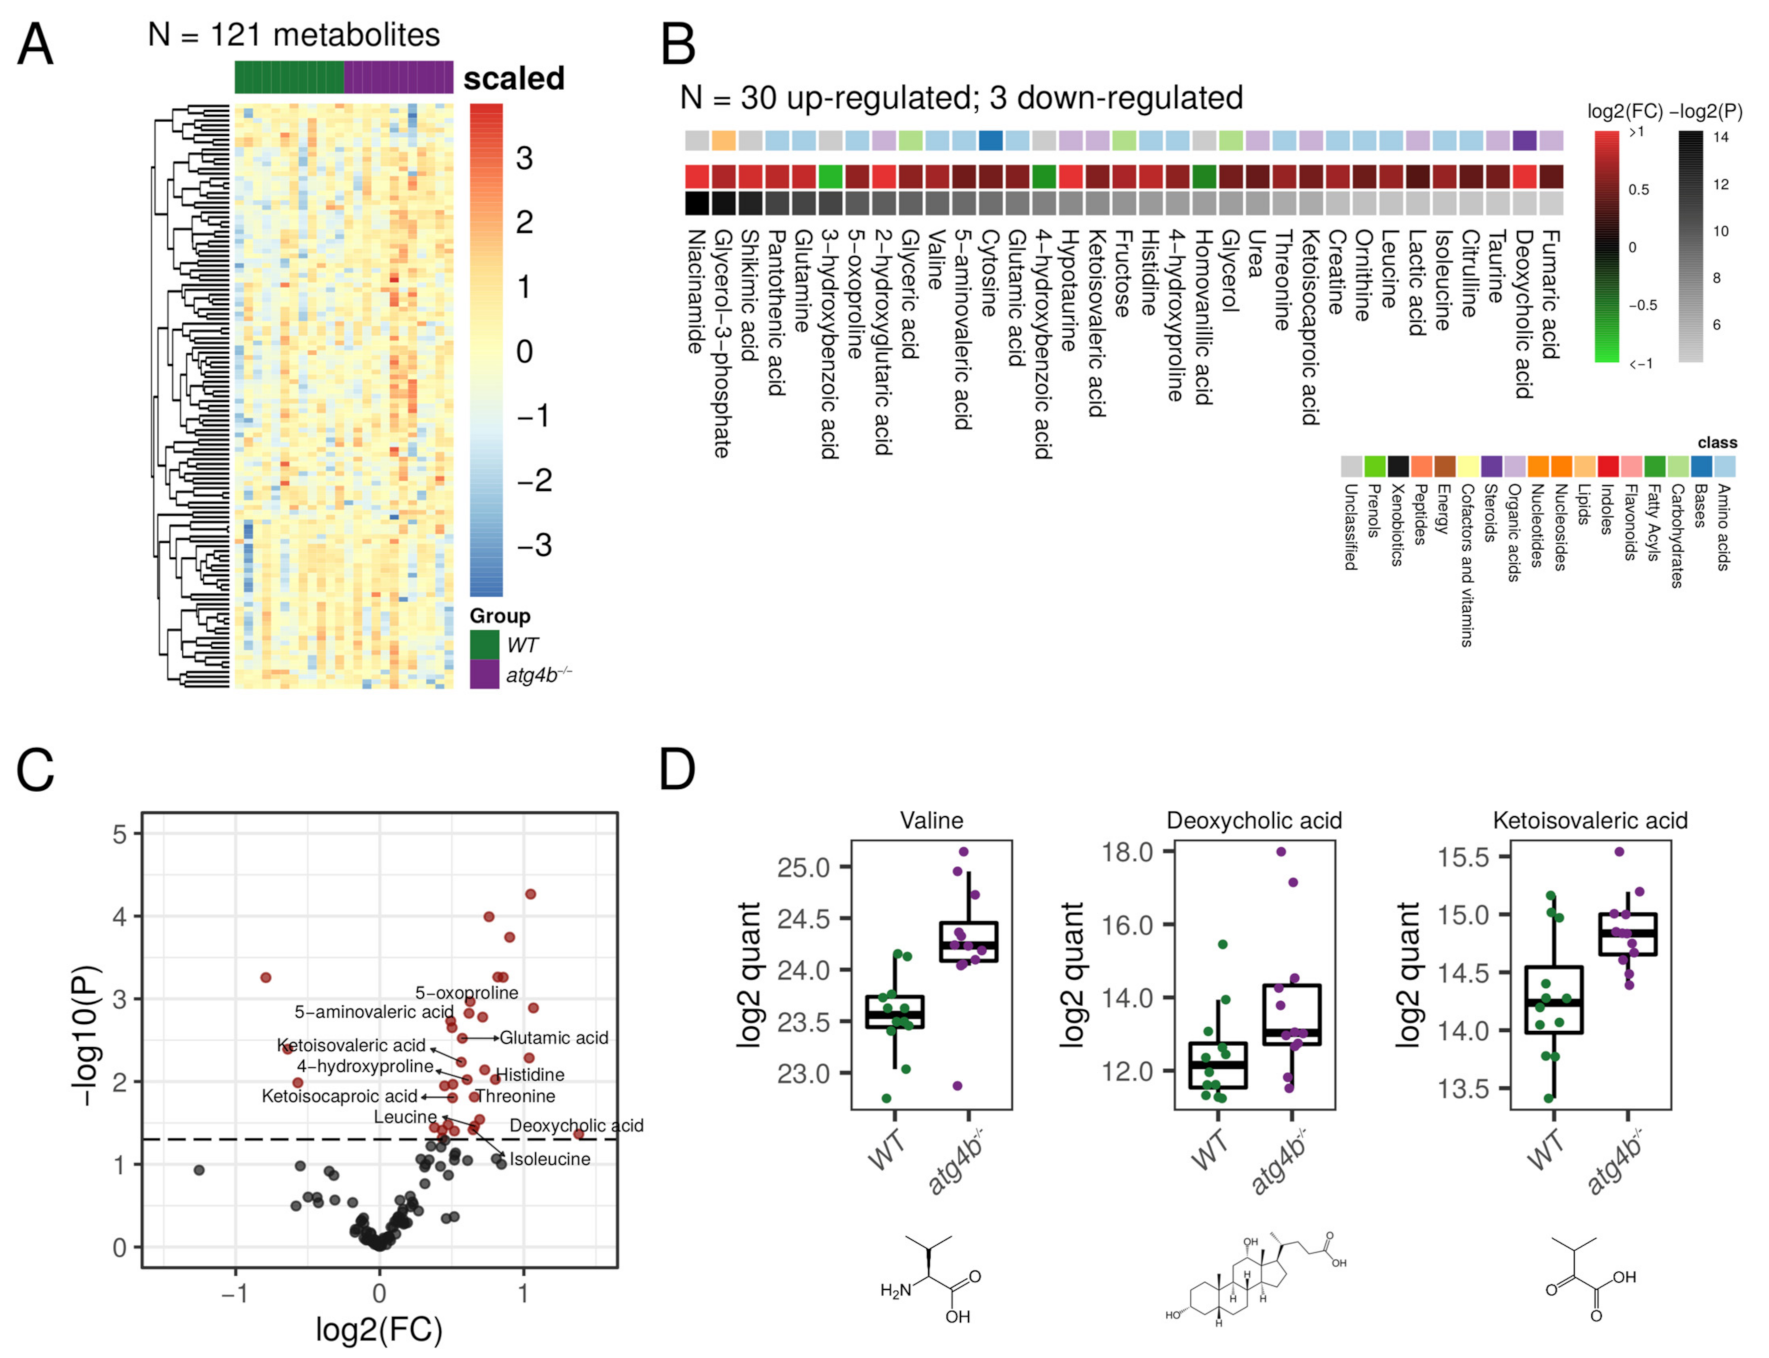
2.2. Autophagy Deficiency upon ATG4B Loss Leads to Alterations in Amino Acid and Fatty Acid Metabolism of the Skeletal Muscle
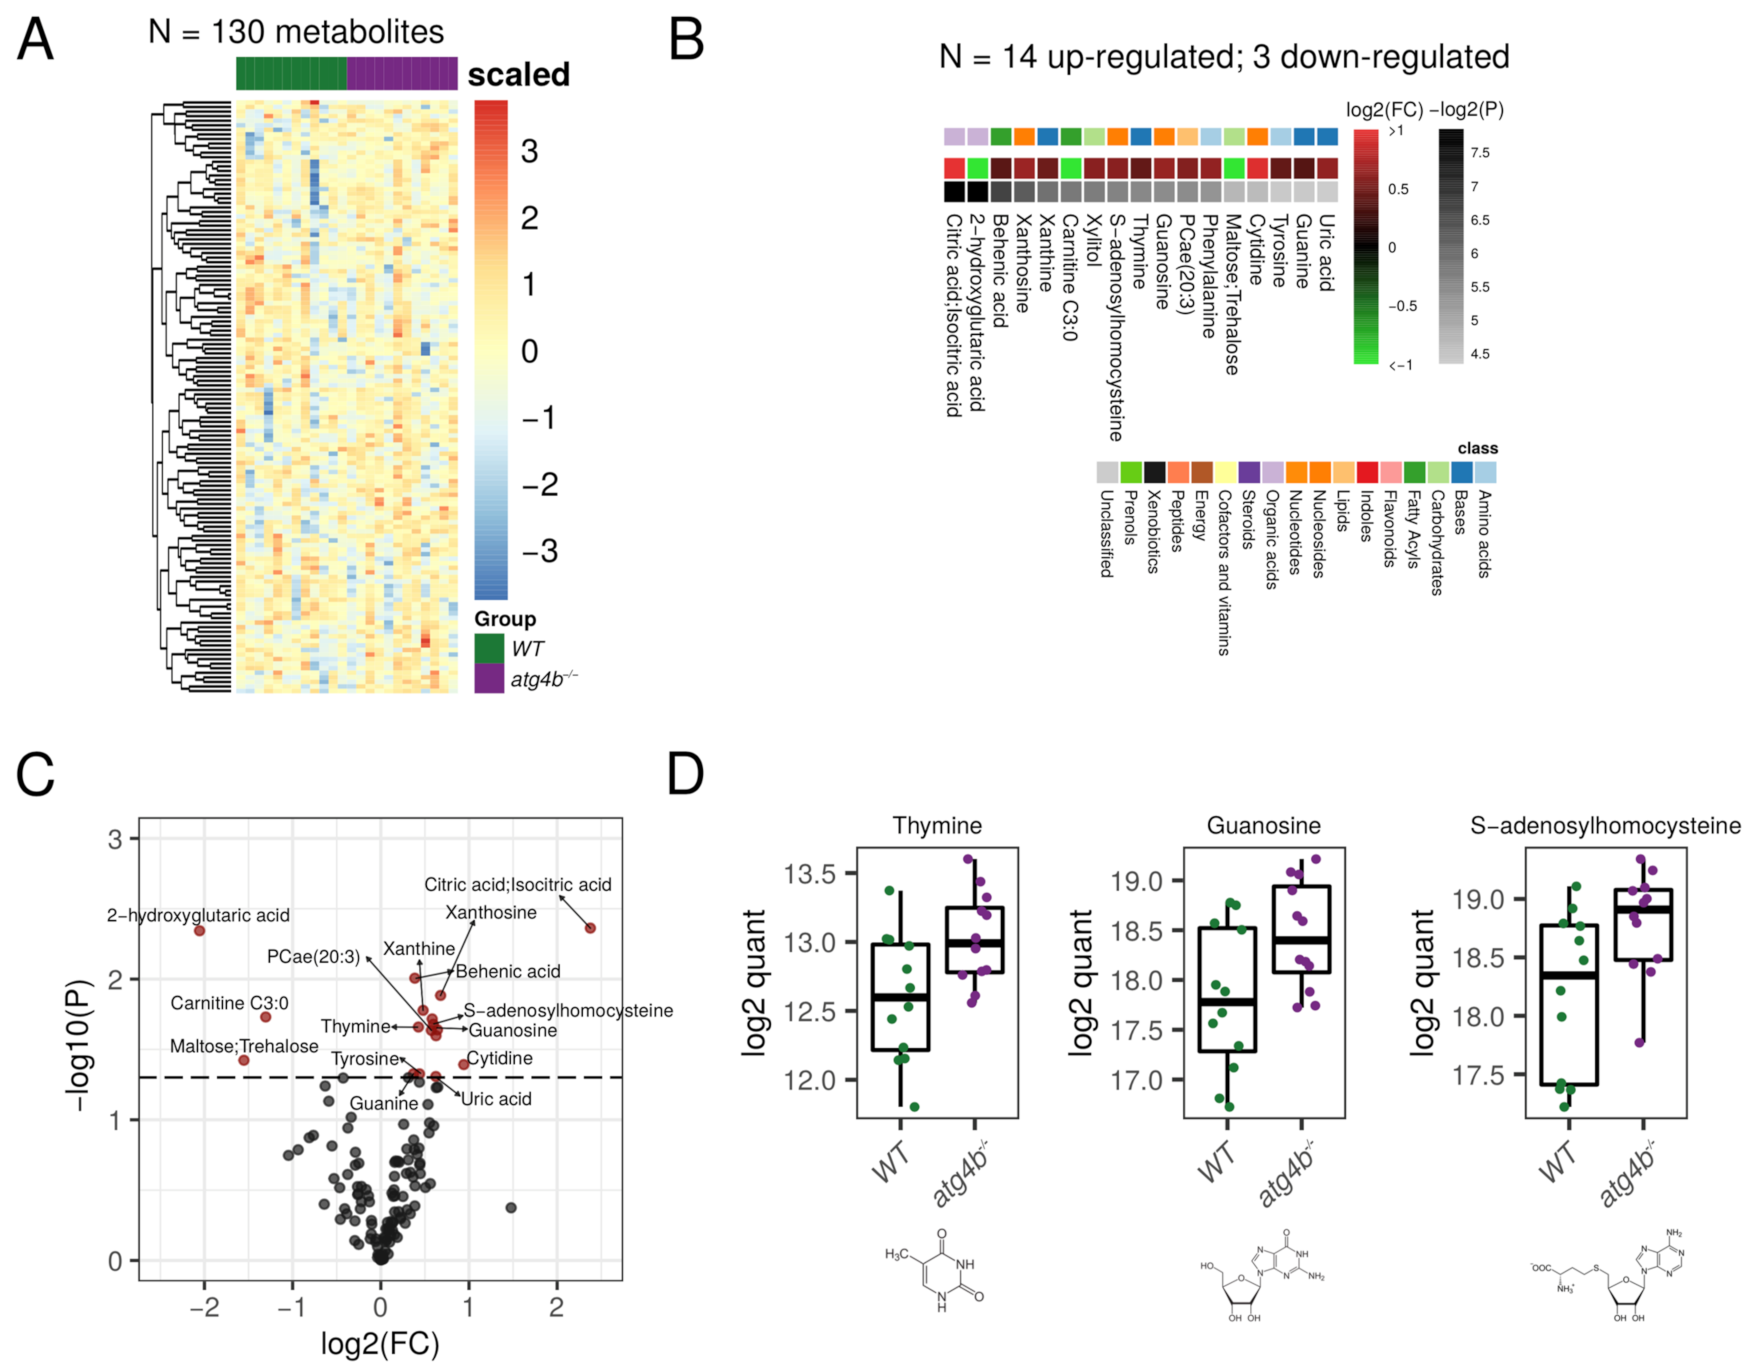
2.3. Autophagy Deficiency upon ATG4B Loss Leads to Alterations in Nitrogenous Bases and Nucleotides Metabolism of the Heart
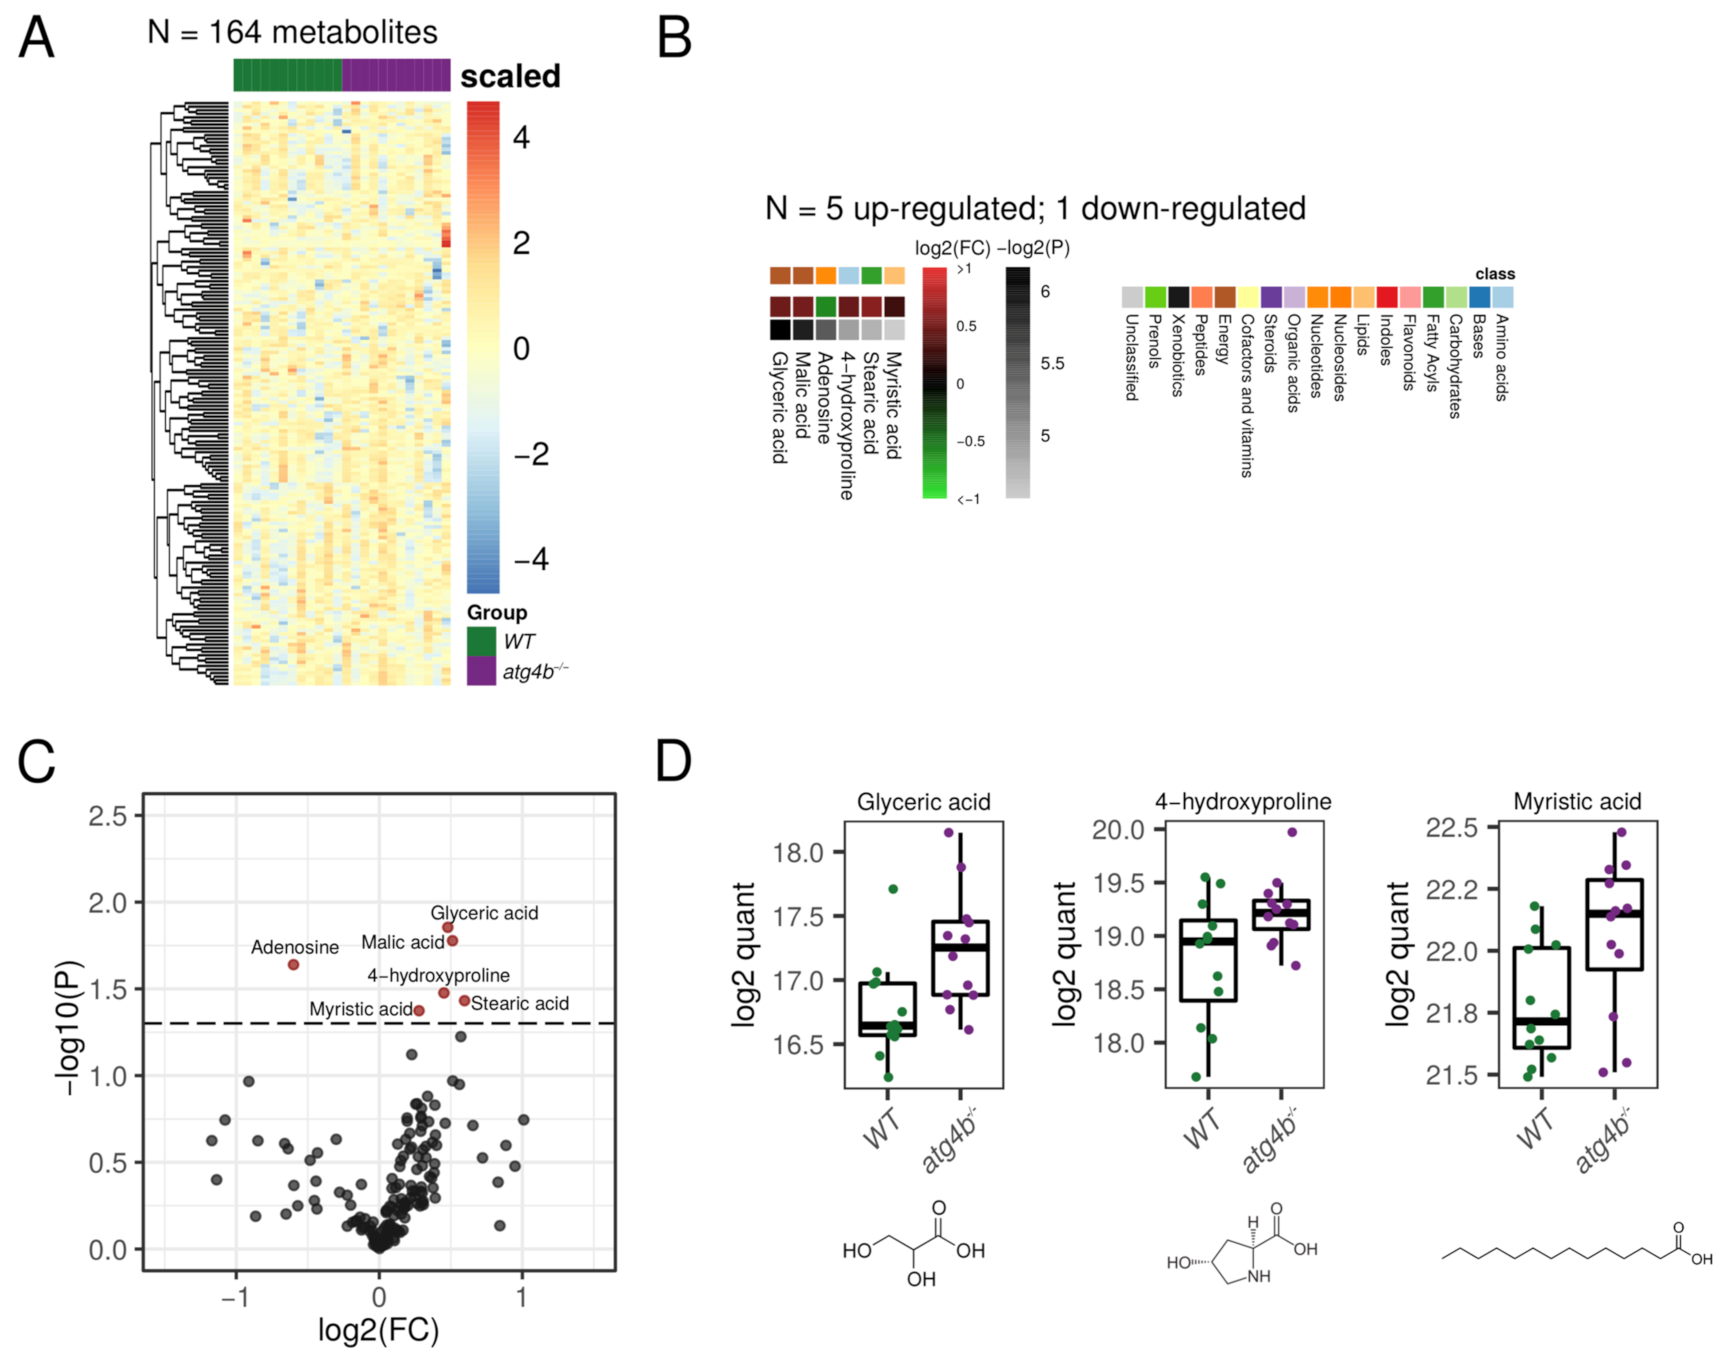
2.4. Autophagy Deficiency upon ATG4B Loss Has a Minor Impact in Liver Tissue Metabolome
2.5. Metabolomic Alterations Caused by Autophagy Deficiency in Plasma
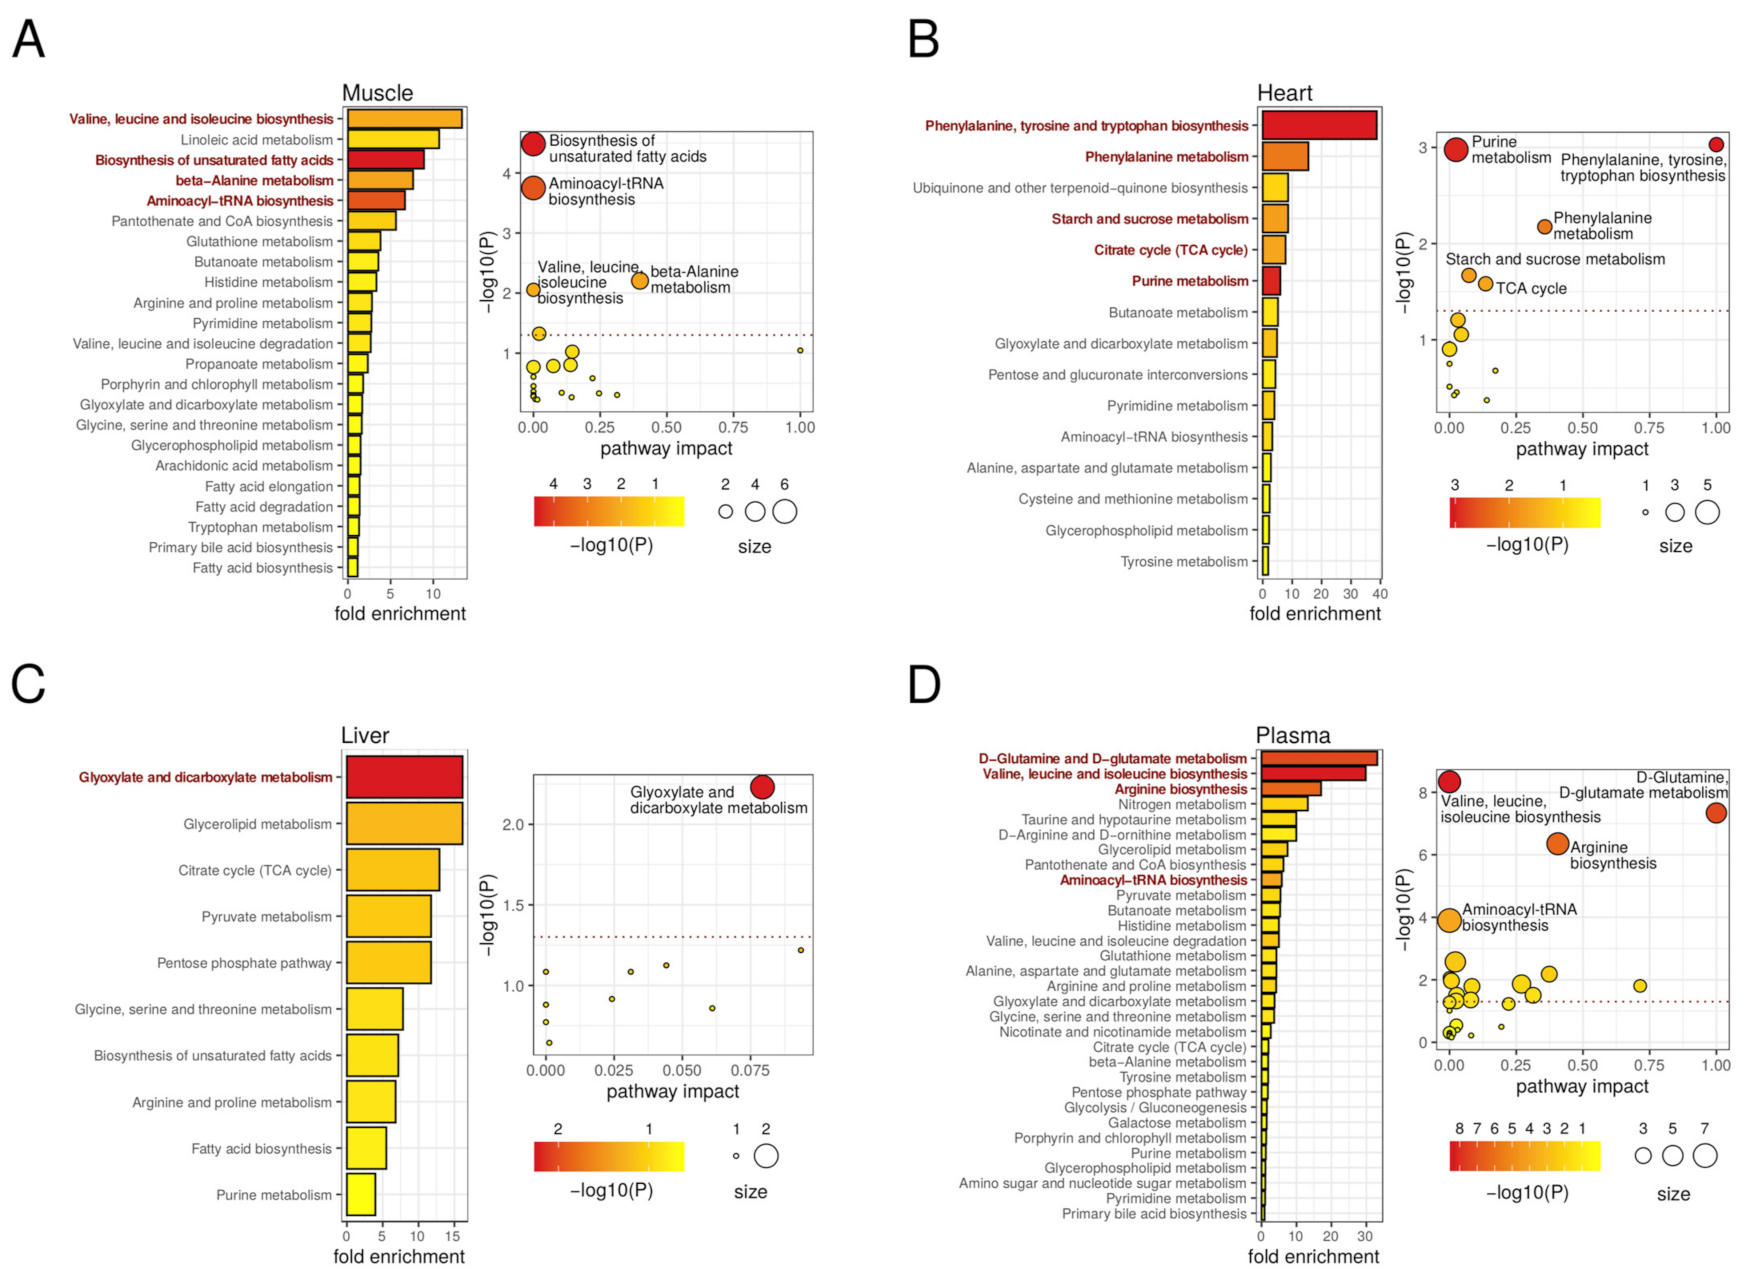
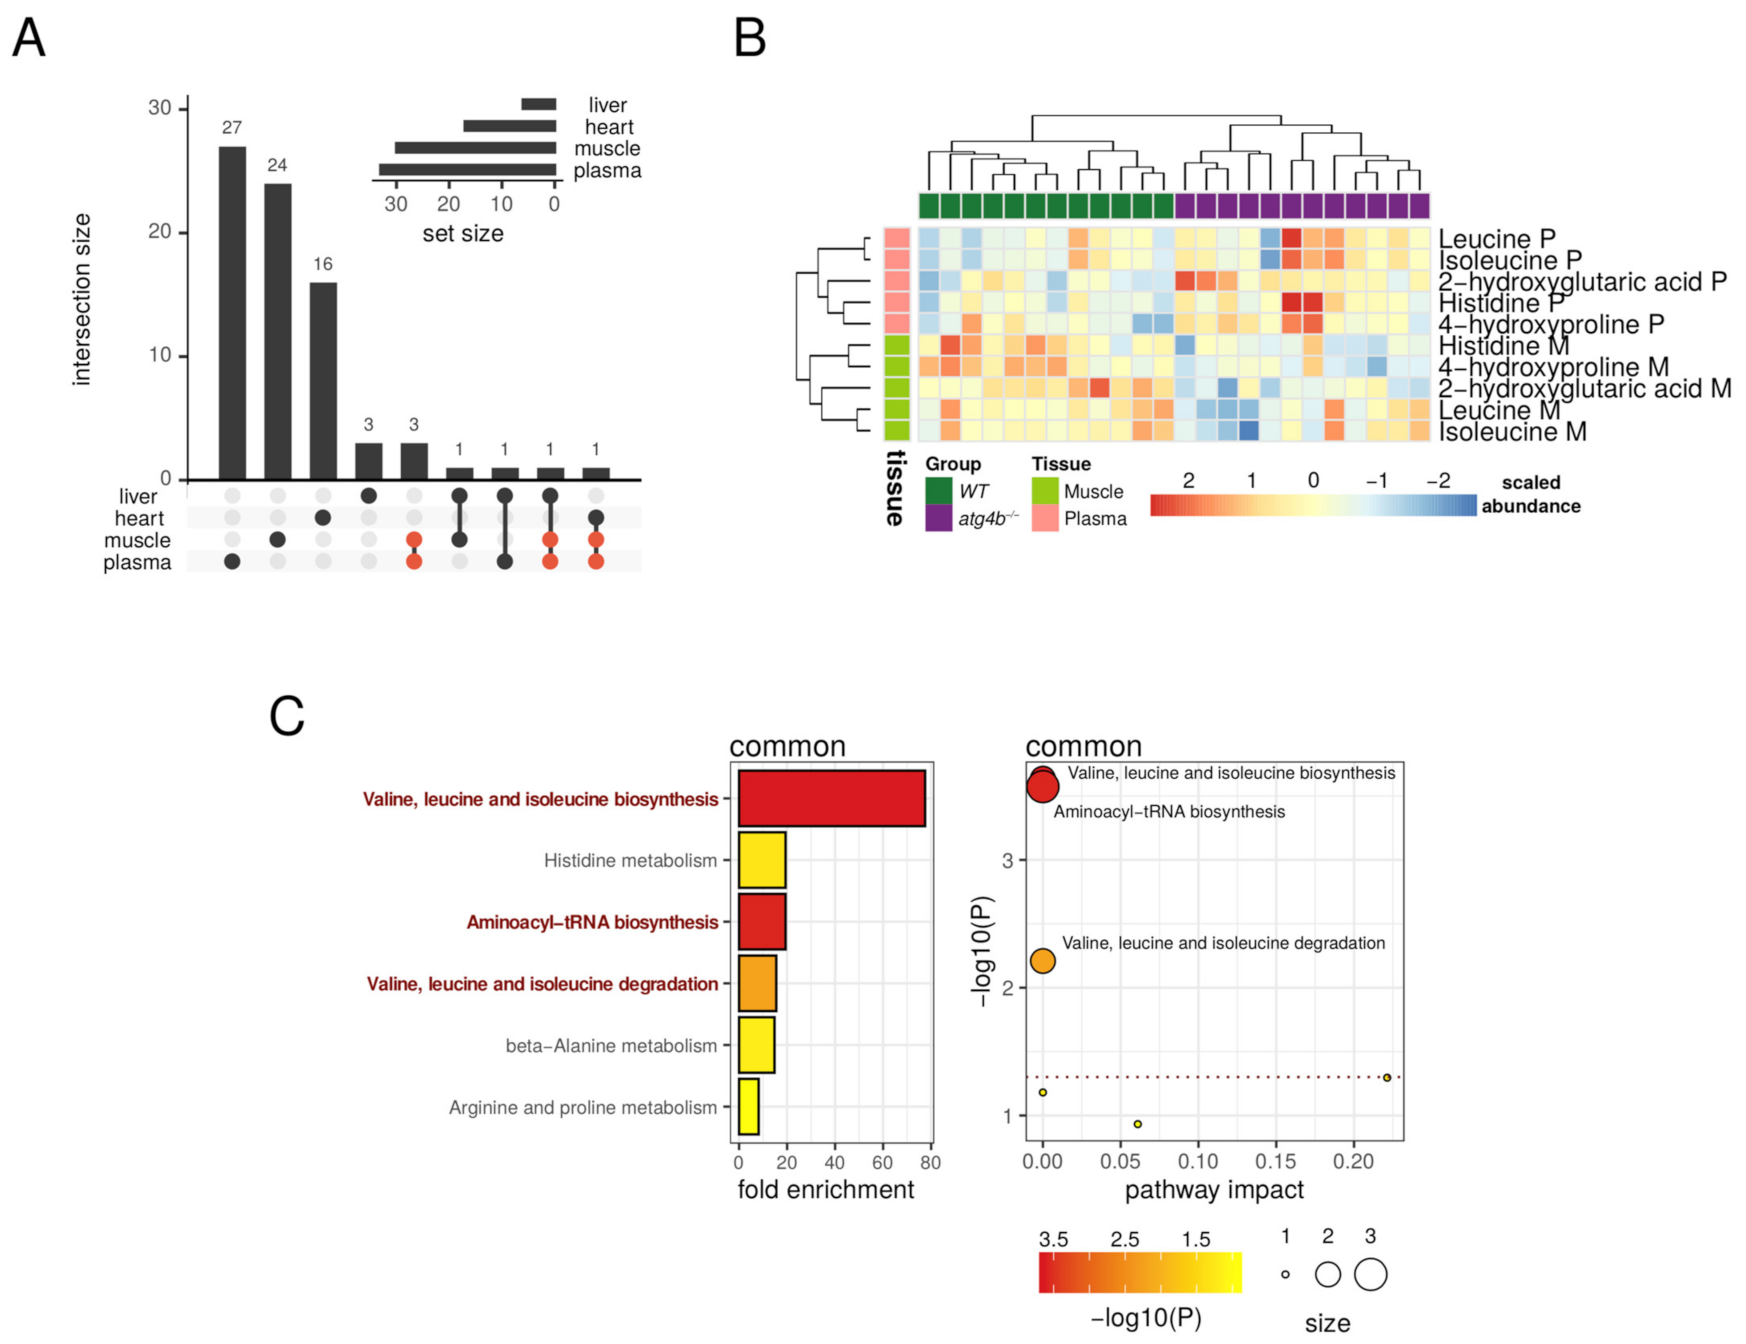
2.6. Metabolic Pathways Affected by Authophagy Deficiency Are Tissue-Dependent
3. Materials and Methods
3.1. Tissue Samples Preparation for Metabolomics Analyses
3.2. Targeted Analysis by GC Coupled to Triple Quadrupole (QQQ) Mass Spectrometry
3.3. Untargeted Analysis by UHPLC Coupled to Quadrupole-Time of Flight (QTOF) Mass Spectrometry
3.4. Targeted Analysis by UHPLC Coupled to Triple Quadrupole (QQQ) Mass Spectrometry
3.5. Signal Processing for LC-QTOF Profiles
3.6. Metabolite Data Preprocessing and Statistical Analyses
4. Concluding Remarks
Supplementary Materials
Author Contributions
Funding
Institutional Review Board Statement
Informed Consent Statement
Data Availability Statement
Conflicts of Interest
References
- Mizushima, N.; Levine, B.; Cuervo, A.M.; Klionsky, D.J. Autophagy fights disease through cellular self-digestion. Nature 2008, 451, 1069–1075. [Google Scholar] [CrossRef] [PubMed] [Green Version]
- He, C.; Klionsky, D.J. Regulation mechanisms and signaling pathways of autophagy. Annu. Rev. Genet. 2009, 43, 67–93. [Google Scholar] [CrossRef] [PubMed] [Green Version]
- Mizushima, N.; Komatsu, M. Autophagy: Renovation of cells and tissues. Cell 2011, 147, 728–741. [Google Scholar] [CrossRef] [PubMed] [Green Version]
- Kroemer, G.; Marino, G.; Levine, B. Autophagy and the integrated stress response. Mol. Cell 2010, 40, 280–293. [Google Scholar] [CrossRef] [Green Version]
- Wu, X.; Won, H.; Rubinsztein, D.C. Autophagy and mammalian development. Biochem. Soc. Trans. 2013, 41, 1489–1494. [Google Scholar] [CrossRef] [Green Version]
- Fernandez, A.F.; Lopez-Otin, C. The functional and pathologic relevance of autophagy proteases. J. Clin. Investig. 2015, 125, 33–41. [Google Scholar] [CrossRef] [Green Version]
- Marino, G.; Fernandez, A.F.; Cabrera, S.; Lundberg, Y.W.; Cabanillas, R.; Rodriguez, F.; Salvador-Montoliu, N.; Vega, J.A.; Germana, A.; Fueyo, A.; et al. Autophagy is essential for mouse sense of balance. J. Clin. Investig. 2010, 120, 2331–2344. [Google Scholar] [CrossRef] [Green Version]
- Bravo-San Pedro, J.M.; Sica, V.; Martins, I.; Pol, J.; Loos, F.; Maiuri, M.C.; Durand, S.; Bossut, N.; Aprahamian, F.; Anagnostopoulos, G.; et al. Acyl-CoA-Binding Protein Is a Lipogenic Factor that Triggers Food Intake and Obesity. Cell Metab. 2019, 30, 754–767. [Google Scholar] [CrossRef] [Green Version]
- Castoldi, F.; Hyvonen, M.T.; Durand, S.; Aprahamian, F.; Sauvat, A.; Malik, S.A.; Baracco, E.E.; Vacchelli, E.; Opolon, P.; Signolle, N.; et al. Chemical activation of SAT1 corrects diet-induced metabolic syndrome. Cell Death Differ. 2020, 27, 2904–2920. [Google Scholar] [CrossRef]
- Castoldi, F.; Humeau, J.; Martins, I.; Lachkar, S.; Loew, D.; Dingli, F.; Durand, S.; Enot, D.; Bossut, N.; Chery, A.; et al. Autophagy-mediated metabolic effects of aspirin. Cell Death Discov. 2020, 6, 129. [Google Scholar] [CrossRef]
- Castoldi, F.; Vacchelli, E.; Zitvogel, L.; Maiuri, M.C.; Pietrocola, F.; Kroemer, G. Systemic autophagy in the therapeutic response to anthracycline-based chemotherapy. Oncoimmunology 2019, 8, e1498285. [Google Scholar] [CrossRef]
- Lopez-Alonso, I.; Aguirre, A.; Gonzalez-Lopez, A.; Fernandez, A.F.; Amado-Rodriguez, L.; Astudillo, A.; Batalla-Solis, E.; Albaiceta, G.M. Impairment of autophagy decreases ventilator-induced lung injury by blockade of the NF-κB pathway. J. Physiol.-Lung Cell. Mol. Physiol. 2013, 304, L844–L852. [Google Scholar] [CrossRef] [Green Version]
- Rodriguez-Muela, N.; Boya, P. Axonal damage, autophagy and neuronal survival. Autophagy 2012, 8, 286–288. [Google Scholar] [CrossRef] [Green Version]
- Cabrera, S.; Fernandez, A.F.; Marino, G.; Aguirre, A.; Suarez, M.F.; Espanol, Y.; Vega, J.A.; Laura, R.; Fueyo, A.; Fernandez-Garcia, M.S.; et al. ATG4B/autophagin-1 regulates intestinal homeostasis and protects mice from experimental colitis. Autophagy 2013, 9, 1188–1200. [Google Scholar] [CrossRef] [Green Version]
- Ezaki, J.; Matsumoto, N.; Takeda-Ezaki, M.; Komatsu, M.; Takahashi, K.; Hiraoka, Y.; Taka, H.; Fujimura, T.; Takehana, K.; Yoshida, M.; et al. Liver autophagy contributes to the maintenance of blood glucose and amino acid levels. Autophagy 2011, 7, 727–736. [Google Scholar] [CrossRef] [Green Version]
- Kuma, A.; Komatsu, M.; Mizushima, N. Autophagy-monitoring and autophagy-deficient mice. Autophagy 2017, 13, 1619–1628. [Google Scholar] [CrossRef] [Green Version]
- Griffiths, W.J.; Koal, T.; Wang, Y.; Kohl, M.; Enot, D.P.; Deigner, H.P. Targeted metabolomics for biomarker discovery. Angew. Chem. Int. Ed. 2010, 49, 5426–5445. [Google Scholar] [CrossRef]
- Kuma, A.; Hatano, M.; Matsui, M.; Yamamoto, A.; Nakaya, H.; Yoshimori, T.; Ohsumi, Y.; Tokuhisa, T.; Mizushima, N. The role of autophagy during the early neonatal starvation period. Nature 2004, 432, 1032–1036. [Google Scholar] [CrossRef]
- May, M.E.; Buse, M.G. Effects of branched-chain amino acids on protein turnover. Diabetes Metab. Rev. 1989, 5, 227–245. [Google Scholar] [CrossRef]
- Saxton, R.A.; Sabatini, D.M. mTOR Signaling in Growth, Metabolism, and Disease. Cell 2017, 168, 960–976. [Google Scholar] [CrossRef] [Green Version]
- Le Couteur, D.G.; Solon-Biet, S.M.; Cogger, V.C.; Ribeiro, R.; de Cabo, R.; Raubenheimer, D.; Cooney, G.J.; Simpson, S.J. Branched chain amino acids, aging and age-related health. Ageing Res. Rev. 2020, 64, 101198. [Google Scholar] [CrossRef]
- Zhao, Y.; Cholewa, J.; Shang, H.; Yang, Y.; Ding, X.; Wang, Q.; Su, Q.; Zanchi, N.E.; Xia, Z. Advances in the Role of Leucine-Sensing in the Regulation of Protein Synthesis in Aging Skeletal Muscle. Front. Cell Dev. Biol. 2021, 9, 646482. [Google Scholar] [CrossRef]
- Manifava, M.; Smith, M.; Rotondo, S.; Walker, S.; Niewczas, I.; Zoncu, R.; Clark, J.; Ktistakis, N.T. Dynamics of mTORC1 activation in response to amino acids. Elife 2016, 5. [Google Scholar] [CrossRef]
- Brosnan, M.E.; Brosnan, J.T. Histidine Metabolism and Function. J. Nutr. 2020, 150 (Suppl. 1), 2570S–2575S. [Google Scholar] [CrossRef]
- Ninomiya, S.; Nakamura, N.; Nakamura, H.; Mizutani, T.; Kaneda, Y.; Yamaguchi, K.; Matsumoto, T.; Kitagawa, J.; Kanemura, N.; Shiraki, M.; et al. Low Levels of Serum Tryptophan Underlie Skeletal Muscle Atrophy. Nutrients 2020, 12, 978. [Google Scholar] [CrossRef] [Green Version]
- Zhong, Z.; Wheeler, M.D.; Li, X.; Froh, M.; Schemmer, P.; Yin, M.; Bunzendaul, H.; Bradford, B.; Lemasters, J.J. L-Glycine: A novel antiinflammatory, immunomodulatory, and cytoprotective agent. Curr. Opin. Clin. Nutr. Metab. Care 2003, 6, 229–240. [Google Scholar] [CrossRef]
- Eastell, R.; Hannon, R.A.; Garnero, P.; Campbell, M.J.; Delmas, P.D. Relationship of early changes in bone resorption to the reduction in fracture risk with risedronate: Review of statistical analysis. J. Bone Miner. Res. 2007, 22, 1656–1660. [Google Scholar] [CrossRef]
- Houtkooper, R.H.; Argmann, C.; Houten, S.M.; Canto, C.; Jeninga, E.H.; Andreux, P.A.; Thomas, C.; Doenlen, R.; Schoonjans, K.; Auwerx, J. The metabolic footprint of aging in mice. Sci. Rep. 2011, 1, 134. [Google Scholar] [CrossRef]
- Fontana, L.; Partridge, L.; Longo, V.D. Extending healthy life span—From yeast to humans. Science 2010, 328, 321–326. [Google Scholar] [CrossRef] [Green Version]
- Rebrin, I.; Kamzalov, S.; Sohal, R.S. Effects of age and caloric restriction on glutathione redox state in mice. Free Radic. Biol. Med. 2003, 35, 626–635. [Google Scholar] [CrossRef] [Green Version]
- Toczek, M.; Zielonka, D.; Zukowska, P.; Marcinkowski, J.T.; Slominska, E.; Isalan, M.; Smolenski, R.T.; Mielcarek, M. An impaired metabolism of nucleotides underpins a novel mechanism of cardiac remodeling leading to Huntington’s disease related cardiomyopathy. Biochim. Biophys. Acta 2016, 1862, 2147–2157. [Google Scholar] [CrossRef] [PubMed]
- Marino, G.; Madeo, F.; Kroemer, G. Autophagy for tissue homeostasis and neuroprotection. Curr. Opin. Cell Biol. 2011, 23, 198–206. [Google Scholar] [CrossRef] [PubMed]
- Taneike, M.; Yamaguchi, O.; Nakai, A.; Hikoso, S.; Takeda, T.; Mizote, I.; Oka, T.; Tamai, T.; Oyabu, J.; Murakawa, T.; et al. Inhibition of autophagy in the heart induces age-related cardiomyopathy. Autophagy 2010, 6, 600–606. [Google Scholar] [CrossRef] [PubMed]
- Becker, B.F.; Gerlach, E. Uric Acid, the Major Catabolite of Cardiac Adenine Nucleotides and Adenosine, Originates in the Coronary Endothelium; Springer: Berlin/Heidelberg, Germany, 1987; pp. 209–222. [Google Scholar]
- Bai, H.; Sun, K.; Wu, J.H.; Zhong, Z.H.; Xu, S.L.; Zhang, H.R.; Gu, Y.H.; Lu, S.F. Proteomic and metabolomic characterization of cardiac tissue in acute myocardial ischemia injury rats. PLoS ONE 2020, 15, e0231797. [Google Scholar] [CrossRef]
- Tanaka, Y.; Nagoshi, T.; Yoshii, A.; Oi, Y.; Takahashi, H.; Kimura, H.; Ito, K.; Kashiwagi, Y.; Tanaka, T.D.; Yoshimura, M. Xanthine oxidase inhibition attenuates doxorubicin-induced cardiotoxicity in mice. Free Radic. Biol. Med. 2021, 162, 298–308. [Google Scholar] [CrossRef]
- Regan, V.; Richard, S. Chapter 19—Metabolic Regulation of DNA Methylation in Mammalian Cells. In Handbook of Epigenetics, 2nd ed.; Academic Press: Cambridge, MA, USA, 2017; pp. 293–305. [Google Scholar]
- James, S.J.; Melnyk, S.; Pogribna, M.; Pogribny, I.P.; Caudill, M.A. Elevation in S-adenosylhomocysteine and DNA hypomethylation: Potential epigenetic mechanism for homocysteine-related pathology. J. Nutr. 2002, 132 (Suppl. 8), 2361S–2366S. [Google Scholar] [CrossRef]
- Barroso, M.; Handy, D.E.; Castro, R. The Link Between Hyperhomocysteinemia and Hypomethylation:Implications for Cardiovascular Disease. J. Inborn Errors Metab. Screen. 2017, 5. [Google Scholar] [CrossRef] [Green Version]
- Parkhitko, A.A.; Binari, R.; Zhang, N.; Asara, J.M.; Demontis, F.; Perrimon, N. Tissue-specific down-regulation of S-adenosyl-homocysteine via suppression of dAhcyL1/dAhcyL2 extends health span and life span in Drosophila. Genes Dev. 2016, 30, 1409–1422. [Google Scholar] [CrossRef] [Green Version]
- Zhang, Z.Y.; Monleon, D.; Verhamme, P.; Staessen, J.A. Branched-Chain Amino Acids as Critical Switches in Health and Disease. Hypertension 2018, 72, 1012–1022. [Google Scholar] [CrossRef]
- Liao, X.; Liu, B.; Qu, H.; Zhang, L.; Lu, Y.; Xu, Y.; Lyu, Z.; Zheng, H. A High Level of Circulating Valine Is a Biomarker for Type 2 Diabetes and Associated with the Hypoglycemic Effect of Sitagliptin. Mediators Inflamm. 2019, 2019, 8247019. [Google Scholar] [CrossRef]
- Sailer, M.; Dahlhoff, C.; Giesbertz, P.; Eidens, M.K.; de Wit, N.; Rubio-Aliaga, I.; Boekschoten, M.V.; Muller, M.; Daniel, H. Increased plasma citrulline in mice marks diet-induced obesity and may predict the development of the metabolic syndrome. PLoS ONE 2013, 8, e63950. [Google Scholar] [CrossRef] [Green Version]
- Fernandez, A.F.; Barcena, C.; Martinez-Garcia, G.G.; Tamargo-Gomez, I.; Suarez, M.F.; Pietrocola, F.; Castoldi, F.; Esteban, L.; Sierra-Filardi, E.; Boya, P.; et al. Autophagy couteracts weight gain, lipotoxicity and pancreatic beta-cell death upon hypercaloric pro-diabetic regimens. Cell Death Dis. 2017, 8, e2970. [Google Scholar] [CrossRef]
- Lynch, C.J.; Adams, S.H. Branched-chain amino acids in metabolic signalling and insulin resistance. Nat. Rev. Endocrinol. 2014, 10, 723–736. [Google Scholar] [CrossRef] [Green Version]
- Hoffmann, B.; Helbling, C.; Schadewaldt, P.; Wendel, U. Impact of longitudinal plasma leucine levels on the intellectual outcome in patients with classic MSUD. Pediatr. Res. 2006, 59, 17–20. [Google Scholar] [CrossRef] [Green Version]
- Marino, G.; Pietrocola, F.; Eisenberg, T.; Kong, Y.; Malik, S.A.; Andryushkova, A.; Schroeder, S.; Pendl, T.; Harger, A.; Niso-Santano, M.; et al. Regulation of autophagy by cytosolic acetyl-coenzyme A. Mol. Cell 2014, 53, 710–725. [Google Scholar] [CrossRef] [Green Version]
- Mitsubuchi, H.; Owada, M.; Endo, F. Markers associated with inborn errors of metabolism of branched-chain amino acids and their relevance to upper levels of intake in healthy people: An implication from clinical and molecular investigations on maple syrup urine disease. J. Nutr. 2005, 135 (Suppl. 6), 1565S–1570S. [Google Scholar] [CrossRef]
- Fenves, A.Z.; Kirkpatrick, H.M., 3rd; Patel, V.V.; Sweetman, L.; Emmett, M. Increased anion gap metabolic acidosis as a result of 5-oxoproline (pyroglutamic acid): A role for acetaminophen. Clin. J. Am. Soc. Nephrol. 2006, 1, 441–447. [Google Scholar] [CrossRef]
- Minisola, S.; Antonelli, R.; Mazzuoli, G. Clinical significance of free plasma hydroxyproline measurement in metabolic bone disease. J. Clin. Chem. Clin. Biochem. 1985, 23, 515–519. [Google Scholar] [CrossRef]
- Murguia, M.J.; Vailas, A.; Mandelbaum, B.; Norton, J.; Hodgdon, J.; Goforth, H.; Riedy, M. Elevated plasma hydroxyproline. A possible risk factor associated with connective tissue injuries during overuse. Am. J. Sports Med. 1988, 16, 660–664. [Google Scholar] [CrossRef]
- Gabr, S.A.; Alghadir, A.H.; Sherif, Y.E.; Ghfar, A.A. Hydroxyproline as a Biomarker in Liver Disease. In Biomarkers in Liver Disease; Preedy, V.R., Ed.; Springer: Dordrecht, The Netherlands, 2016; pp. 1–21. [Google Scholar]
- Staels, B.; Fonseca, V.A. Bile acids and metabolic regulation: Mechanisms and clinical responses to bile acid sequestration. Diabetes Care 2009, 32 (Suppl. 2), S237–S245. [Google Scholar] [CrossRef] [Green Version]
- Watanabe, M.; Houten, S.M.; Mataki, C.; Christoffolete, M.A.; Kim, B.W.; Sato, H.; Messaddeq, N.; Harney, J.W.; Ezaki, O.; Kodama, T.; et al. Bile acids induce energy expenditure by promoting intracellular thyroid hormone activation. Nature 2006, 439, 484–489. [Google Scholar] [CrossRef]
- Zietak, M.; Kozak, L.P. Bile acids induce uncoupling protein 1-dependent thermogenesis and stimulate energy expenditure at thermoneutrality in mice. Am. J. Physiol. Endocrinol. Metab. 2016, 310, E346–E354. [Google Scholar] [CrossRef] [Green Version]
- Abrigo, J.; Gonzalez, F.; Aguirre, F.; Tacchi, F.; Gonzalez, A.; Meza, M.P.; Simon, F.; Cabrera, D.; Arrese, M.; Karpen, S.; et al. Cholic acid and deoxycholic acid induce skeletal muscle atrophy through a mechanism dependent on TGR5 receptor. J. Cell Physiol. 2021, 236, 260–272. [Google Scholar] [CrossRef]
- Mouzaki, M.; Wang, A.Y.; Bandsma, R.; Comelli, E.M.; Arendt, B.M.; Zhang, L.; Fung, S.; Fischer, S.E.; McGilvray, I.G.; Allard, J.P. Bile Acids and Dysbiosis in Non-Alcoholic Fatty Liver Disease. PLoS ONE 2016, 11, e0151829. [Google Scholar] [CrossRef] [Green Version]
- Xia, J.; Wishart, D.S. MSEA: A web-based tool to identify biologically meaningful patterns in quantitative metabolomic data. Nucleic Acids Res. 2010, 38, W71–W77. [Google Scholar] [CrossRef] [Green Version]
- Tsugawa, H.; Tsujimoto, Y.; Sugitate, K.; Sakui, N.; Nishiumi, S.; Bamba, T.; Fukusaki, E. Highly sensitive and selective analysis of widely targeted metabolomics using gas chromatography/triple-quadrupole mass spectrometry. J. Biosci. Bioeng. 2014, 117, 122–128. [Google Scholar] [CrossRef] [Green Version]
- Draper, J.; Enot, D.P.; Parker, D.; Beckmann, M.; Snowdon, S.; Lin, W.; Zubair, H. Metabolite signal identification in accurate mass metabolomics data with MZedDB, an interactive m/z annotation tool utilising predicted ionisation behaviour ‘rules’. BMC Bioinform. 2009, 10, 227. [Google Scholar] [CrossRef] [Green Version]
- Ritchie, M.E.; Phipson, B.; Wu, D.; Hu, Y.; Law, C.W.; Shi, W.; Smyth, G.K. limma powers differential expression analyses for RNA-sequencing and microarray studies. Nucleic Acids Res. 2015, 43, e47. [Google Scholar] [CrossRef]
- Xia, J.; Psychogios, N.; Young, N.; Wishart, D.S. MetaboAnalyst: A web server for metabolomic data analysis and interpretation. Nucleic Acids Res. 2009, 37, W652–W660. [Google Scholar] [CrossRef] [Green Version]
- Kanehisa, M.; Sato, Y.; Kawashima, M.; Furumichi, M.; Tanabe, M. KEGG as a reference resource for gene and protein annotation. Nucleic Acids Res. 2016, 44, D457–D462. [Google Scholar] [CrossRef] [Green Version]
- Lahiri, V.; Hawkins, W.D.; Klionsky, D.J. Watch What You (Self-) Eat: Autophagic Mechanisms that Modulate Metabolism. Cell Metab. 2019, 29, 803–826. [Google Scholar] [CrossRef] [PubMed] [Green Version]
- Martinez-Lopez, N.; Singh, R. Autophagy and Lipid Droplets in the Liver. Annu. Rev. Nutr. 2015, 35, 215–237. [Google Scholar] [CrossRef] [PubMed]


Publisher’s Note: MDPI stays neutral with regard to jurisdictional claims in published maps and institutional affiliations. |
© 2021 by the authors. Licensee MDPI, Basel, Switzerland. This article is an open access article distributed under the terms and conditions of the Creative Commons Attribution (CC BY) license (https://creativecommons.org/licenses/by/4.0/).
Share and Cite
Martínez-García, G.G.; Pérez, R.F.; Fernández, Á.F.; Durand, S.; Kroemer, G.; Mariño, G. Autophagy Deficiency by Atg4B Loss Leads to Metabolomic Alterations in Mice. Metabolites 2021, 11, 481. https://0-doi-org.brum.beds.ac.uk/10.3390/metabo11080481
Martínez-García GG, Pérez RF, Fernández ÁF, Durand S, Kroemer G, Mariño G. Autophagy Deficiency by Atg4B Loss Leads to Metabolomic Alterations in Mice. Metabolites. 2021; 11(8):481. https://0-doi-org.brum.beds.ac.uk/10.3390/metabo11080481
Chicago/Turabian StyleMartínez-García, Gemma G., Raúl F. Pérez, Álvaro F. Fernández, Sylvere Durand, Guido Kroemer, and Guillermo Mariño. 2021. "Autophagy Deficiency by Atg4B Loss Leads to Metabolomic Alterations in Mice" Metabolites 11, no. 8: 481. https://0-doi-org.brum.beds.ac.uk/10.3390/metabo11080481