Article

The Sterol Transporter Npc2c Controls Intestinal Stem Cell Mitosis and Host–Microbiome Interactions in Drosophila

by
Constantina Neophytou
,
Euripides Soteriou
and
Chrysoula Pitsouli
*
Department of Biological Sciences, University of Cyprus, 1 University Avenue, 2109 Aglantzia, Cyprus
*
Author to whom correspondence should be addressed.
These authors contributed equally to this work.
Submission received: 19 September 2023 / Revised: 5 October 2023 / Accepted: 12 October 2023 / Published: 16 October 2023
(This article belongs to the Special Issue Host-Microbe-Metabolite Interaction in Intestinal Health)

Abstract

:
Cholesterol is necessary for all cells to function. The intracellular cholesterol transporters Npc1 and Npc2 control sterol trafficking and their malfunction leads to Neimann–Pick Type C disease, a rare disorder affecting the nervous system and the intestine. Unlike humans that encode single Npc1 and Npc2 transporters, flies encompass two Npc1 (Npc1a-1b) and eight Npc2 (Npc2a-2h) members, and most of the Npc2 family genes remain unexplored. Here, we focus on the intestinal function of Npc2c in the adult. We find that Npc2c is necessary for intestinal stem cell (ISC) mitosis, maintenance of the ISC lineage, survival upon pathogenic infection, as well as tumor growth. Impaired mitosis of Npc2c-silenced midguts is accompanied by reduced expression of Cyclin genes, and genes encoding ISC regulators, such as Delta, unpaired1 and Socs36E. ISC-specific Npc2c silencing induces Attacin-A expression, a phenotype reminiscent of Gram-negative bacteria overabundance. Metagenomic analysis of Npc2c-depleted midguts indicates intestinal dysbiosis, whereby decreased commensal complexity is accompanied by increased gamma-proteobacteria. ISC-specific Npc2c silencing also results in increased cholesterol aggregation. Interestingly, administration of the non-steroidal ecdysone receptor agonist, RH5849, rescues mitosis of Npc2c-silenced midguts and increases expression of the ecdysone response gene Broad, underscoring the role of Npc2c and sterols in ecdysone signaling. Assessment of additional Npc2 family members indicates potential redundant roles with Npc2c in ISC control and response to ecdysone signaling. Our results highlight a previously unidentified essential role of Npc2c in ISC mitosis, as well as an important role in ecdysone signaling and microbiome composition in the Drosophila midgut.

1. Introduction

Proliferating cells rely on nutrients acquired from the environment and directed into metabolic pathways to support cell-specific functions and maintain homeostasis [1]. One of the most widely studied nutrients is cholesterol, which is essential for all multicellular organisms: it is a steroid hormone precursor [2], it is involved in the integrity and fluidity of the lipid bilayer [3] and contributes to cell signaling [4]. Maintenance of cholesterol levels under specific limits is necessary for normal cellular functions, whereas plasma cholesterol deficiency due to impaired cholesterol metabolism may lead to serious malformations and behavioral or developmental problems [5]. A cholesterol-rich diet has been associated with increased risk for cardiovascular disease, obesity and gastrointestinal cancer [6,7,8,9,10]. Since the intestinal stem cells (ISCs) are considered the cells of origin of intestinal tumors, and evidence from research in Drosophila shows that gut microbiota-derived nutrients can modulate ISCs [11], one could speculate that cholesterol availability and metabolism may impinge on ISC function and, therefore, contribute to tumorigenesis. Indeed, a recent study in mice has shown that dietary cholesterol acts as a mitogen for ISCs and increases cholesterol synthesis, promoting tumorigenesis [12]. Similarly, another study in Drosophila melanogaster has shown that dietary cholesterol alters the Notch signaling pathway, a key ISC differentiation pathway, the dysfunction of which leads to tumors [13].
In mammals, the mechanisms regulating cholesterol biosynthesis are well characterized [14], but those controlling its uptake from the diet, removal and turnover have only recently started to be understood. Drosophila cannot synthesize cholesterol [15], but it has been used extensively to study its homeostasis because the mechanisms for cholesterol uptake and intracellular trafficking are conserved between mammals and flies [16]. For example, Drosophila encodes several genes involved in the absorption, metabolism and transport of sterols [17,18,19,20]. Cholesterol is absorbed through receptor-mediated endocytosis by intestinal enterocytes (ECs) and it is subsequently transported to lysosomes. Then, under the control of the Niemann–Pick type C (Npc) proteins, it moves to organelles, such as the endoplasmic reticulum, and upon esterification, it is transported to peripheral tissues [21]. Cholesterol homeostasis is achieved through the sterol-regulatory element binding proteins (SREBPs) and liver X receptors (LXRs). SREBPs are transcription factors [22], and LXRs are nuclear receptors mediating transcriptional responses upon cholesterol binding [23]. Unlike mammals, the single Drosophila SREBP ortholog responds to palmitate instead of sterols [22,24]. On the other hand, the Drosophila nuclear hormone receptor 96 (DHR96), a homolog of the mammalian LXRs [20,25], is crucial for cholesterol homeostasis. In particular, at low cholesterol levels, DHR96 is active and targets genes, including NPC gene family members, whereas at high cholesterol, DHR96 is inhibited [20]. The second homologue of the mammalian LXRs in flies is the Ecdysone receptor (EcR), which binds with high affinity to the Drosophila steroid hormone, ecdysone [26]. Drosophila uses cholesterol as a precursor to synthesize ecdysone, which is converted into the metabolically active 20-hydroxy-ecdysone (20E) by the P450 enzyme [27]. Similar to vertebrates, where steroids are needed for growth and reproduction, in flies, 20E regulates developmental transitions, such as larval molting and metamorphosis, acts on nervous and reproductive systems, and affects lifespan and metabolism [28,29]. In the fly intestine, it has been shown to induce proliferation and gut growth [30], as well as stem cell fate decisions [31].
The Drosophila midgut is maintained by pluripotent ISCs, which typically divide asymmetrically to self-renew and produce two types of progenitor cells, the enteroblasts (EBs) or the enteroendocrine precursors (pre-EEs). EBs and pre-EEs terminally differentiate into the absorptive ECs and enteroendocrine cells (EEs), respectively. ISC proliferation and differentiation are regulated by conserved signaling pathways including Notch, Jak/Stat, EGFR, Insulin-receptor, Wnt/Wingless, Hippo and Dpp-signaling during homeostasis and regeneration [32]. In addition, systemic hormones secreted in the hemolymph act on distant organs and may regulate ISC proliferation [33]. Interestingly, recent evidence suggests that mating-induced 20E produced in the ovaries activates the EcR in neighboring posterior midgut progenitors (ISCs and EBs), inducing the expression of the early response gene, Ecdysone-induced-protein-75B (Eip75B). Eip75B, the human PPARg and REV-ERB homologue [34,35], promotes EB differentiation towards the EC fate upon mating [31]. Similarly, 20E feeding or mating-produced 20E induces ISC mitosis through progenitor-specific upregulation of two EcR target genes, Eip75B and the transcription factor Broad (Br) [30]. Taken together, previous findings indicate a significant role of ecdysone and sterol metabolism in ISC-mediated intestinal homeostasis.
In humans, Npc1 and Npc2 mutations cause Neimann–Pick Type C disease [36], a rare disorder characterized by impaired cholesterol trafficking, which affects the central nervous system, bone marrow, liver, spleen, and intestine [37,38]. In addition, a role of Npc2 in olfactory sensing through regulation of putative odorant carrier proteins has been identified in mites [39,40], while Npc1 mutant mice exhibit olfactory impairment due to astrocytosis and microgliosis [41]. The human Npc1 and Npc2 genes act synergistically to maintain homeostatic cholesterol metabolism through trafficking between late endosomes/lysosomes [36,42,43]. In flies, the Npc gene family encodes known regulators of cholesterol metabolism and ecdysteroid biosynthesis [44]. Humans have only two Npc genes, Npc1 and Npc2, whereas the Drosophila genome encodes two Npc1 homologs (Npc1a and Npc1b) and 8 Npc2 homologs (Npc2a-h) [18]. Npc1a controls intracellular sterol trafficking needed for ecdysteroid biosynthesis [21,45] and Npc1b is involved in sterol uptake in the midgut [46]. Among the eight Npc2 proteins, Npc2a has the highest amino acid similarity to the human Npc2 (36% identity) [18]. Npc2a and Npc2b have redundant roles in intracellular cholesterol trafficking and ecdysteroid biosynthesis [13]. Among the fly Npc genes, Npc1b and Npc2c-e are regulated by DHR96 and dietary cholesterol [20]. In addition, transcriptome analysis of DHR96 mutant adult males found Npc1b, Npc2c and Npc2e significantly upregulated, and Npc2d, Npc2g and Npc2h downregulated compared to controls [47]. However, the roles of Npc2c-h remain a mystery. Npc2 proteins, are subdivided in three groups based on the number of cysteine residues they encompass. Npc2a-c and Npc2f contain six, Npc2d-e contain seven and Npc2g-h contain eight cysteine residues [48]. Representative members of each group, the Npc2a, Npc2e and Npc2h, were found to bind to conserved microbial components, such as bacterial lipopolysaccharide (LPS), peptidoglycan (PG), lipoteichoic acid (LTA) and the lipid A in vitro. In S2 cells, Npc2a and Npc2e binding on PG activates Diptericin (Dipt), which encodes an antimicrobial peptide (AMP) that activates the immune deficiency (IMD) pathway, suggesting innate immunity roles for Npc2 proteins in Drosophila [48]. This finding highlighted their similarity to vertebrate Npc2, which also regulates immune signaling, via binding on LPS and lipid A.
Here, to begin to understand the unexplored roles of Npc2 family genes in Drosophila, we investigated the function of Npc2c in the adult Drosophila midgut. We found that Npc2c is necessary in the adult intestine for ISC mitosis, homeostasis and tumorigenesis. Npc2c exerts its effects on physiology through the regulation of intestinal sterol quantity and the ecdysone pathway.

2. Materials and Methods

2.1. Drosophila Stocks and Rearing

All stocks were routinely maintained at 18 °C or 25 °C on a 12:12 h light/dark cycle on a standard fly medium, 10 g agar, 43.5 g cornmeal, 30 g yeast, 24 g sugar, 5.3 mL of a 20% Tegasept dissolved in 100% ethanol and 3.8 mL 99% propionic acid for 1000 mL. The following Gal4 lines were used for cell-type specific expression: for progenitors (ISCs and EBs), w; esg-Gal4 UAS-GFP tub-Gal80ts (esgts) [49]; for ISCs, w; esg-Gal4 UAS-GFP; Su(H)-Gal80 tub-Gal80ts (ISCts) [50]; for EBs, w; Su(H)-Gal4 UAS-CD8GFP tub-Gal80ts20/CyO (Su(H)ts) [51]; and for ECs, w tub-Gal80ts/FM7; Myo1A-Gal4 UAS- EGFP/CyO (MyOts) [52].
Other lines used in this study were w1118 (BDSC# 6326), w; esg-Gal4 UAS-eGFP tub-Gal80ts/CyO; UAS-Ras1Q13/TM6C [53]. All the UAS-RNAi lines used in this study are listed in Table S1 (Key Resources Table). For MARCM analysis, the following genotypes were used: w hs-FLP tub-Gal4 UAS-nlsGFP/FM7; FRT82B tub-Gal80/TM6B [54], w; FRT82B arm-lacZ/TM6B (BDSC# 7369), w; Npc2cRNAi1/CyO; FRT82B arm-lacZ (this study).
GAL4-UAS crosses carrying tub-Gal80ts [55,56] were reared at 18 °C and female adult flies (5 to 7 days old) were transferred to 29 °C for 5 days for transgene induction.
To test the efficiency of w; UAS-Npc2cRNAi1 and w; UAS-Npc2cRNAi2, the flies were crossed to w; Act5C-Gal4 UAS-GFP/CyO and reared at 25 °C. Late L3 GFP-positive larvae were collected for RNA extraction.

2.2. MARCM Clones

For MARCM clones [57] w hs-FLP tub-Gal4 UAS-nlsGFP/FM7; FRT82B tub-Gal80/TM6B flies were crossed to w; FRT82B arm-lacZ/TM6B (control) or w; Npc2cRNAi1/CyO; FRT82B arm-lacZ/TM6C (Npc2c-silenced). Crosses were incubated at 25 °C. 2- to 4-day old adult female progeny were heat-shocked at 37 °C for 60 min to induce FLP. Heat-shocked flies were subsequently transferred to fresh standard medium every two days and the midguts of at least 10 flies of each genotype were dissected, fixed and immunostained after 1, 3, 7, 12 and 14 days. Quantification of clone number and size was performed on whole midguts under a fluorescence microscope (Zeiss Axioscope A.1, Oberkochen, Germany).

2.3. Oral Administration of Bacteria

Female mated 5-to-7-day-old flies were used for all feeding assays. Pseudomonas aeruginosa (P.a.): P.a. feeding was performed as previously described [58]. The P.a. strain PA14 was maintained as LB-50% glycerol stock at −80 °C. A single colony of PA14 was grown at 37 °C in liquid LB to OD600nm = 3, corresponding to 5 × 10⁹ bacteria/mL. Female mature flies of the desired genotype were starved for 5 h and added in groups of 10 per fly vial containing a cotton ball at the bottom soaked with 5 mL of 0.5 mL PA14 OD600nm = 3, 1 mL 20% sucrose and 3.5 mL ddH2O. For uninfected control, 1 mL sucrose 20% and 4 mL dH2O was used. Flies were incubated for 48 h at 29 °C (for all experiments utilizing the Gal4-UAS, unless otherwise noted).

2.4. Oral Administration of Chemicals

EcR agonist, RH5849: RH5849 oral administration was performed as previously described [31]. Fly food was reheated in the microwave and for each vial needed, 2 mL of liquid fly food was mixed with 340 mM RH5849 (DrEhrenstorfer#DRE-C16813000). Specifically, for 1 mL of fly food, 5 uL of 20 ug/mL stock solution, diluted in methanol, was added and thoroughly mixed. As a control (mock), an equivalent amount of methanol was added to the fly food. Groups of 10–15 female mature flies of the desired genotype were transferred from 18 °C (on standard fly food) to RH5849/methanol-supplemented vials at 29 °C for 5 days to allow RNAi induction. Flies were transferred on freshly prepared supplemented food, every day. Then, the flies were incubated for 48 h at 29 °C on sucrose 4% or P.a. supplemented with 340 mM RH5849 or methanol (control).
Cholesterol: P.a. infection assays with 250 μg/mL cholesterol were performed using cholesterol from a 25 mg/mL stock solution dissolved in 100% ethanol. Specifically, cotton balls at the bottom of the vials were each soaked with 0.5 mL P.a. OD600nm = 3, 1 mL 20% sucrose, 3.45 mL ddH2O, and 0.05 mL of cholesterol stock solution. For uninfected controls, 1 mL 20% sucrose, 3.95 mL ddH2O, and 0.05 mL of cholesterol stock solution were used.
20 Hydroxyecdysone (20E): 20E was diluted in 100% ethanol (stock 5 mg/mL). Flies were transferred in 50 mL closed falcon tubes, and a Whatman paper disc was placed on the outside surface of their perforated lid. The disc was covered with heat-killed yeast paste (0.3 g/mL) supplemented with 20E at 0.008 mg/g diluted in ethanol and it was sealed with parafilm to reduce evaporation. Flies were allowed to feed on the yeast paste through small holes on the lid of the tubes. UAS-RNAi was induced for 5 days at 29 °C. The flies were flipped daily on fresh tubes and 2 days’ feeding with sucrose or P.a. was performed. Mock samples: absolute ethanol was added instead of 20E, at the same final concentration.

2.5. Midgut Tumorigenesis

Tumors were induced in the midgut ISCs/EBs via the Gal4-UAS-Gal80ts system. w; esg-Gal4 UAS-eGFP tub-Gal80ts; UAS-Ras1Q13 flies express GFP and the activated form of Ras-GTPase, RasQ13, in ISCs/EBs. To simultaneously downregulate Npc2c in the progenitor compartment of RasQ13 tumorous intestines, we crossed w; esg-Gal4 UAS-eGFP tub-Gal80ts; UAS-Ras1Q13 to w; UAS-Npc2cRNAi1 and w1118 (control). Crosses were reared at 18 °C, and emerging adults were maintained at 18 °C to mature for 5–7 days. Then, mated adult females were transferred to 29 °C to induce the transgenes for 1 day followed by 2 days feeding on a 4% sucrose (uninfected) or P.a. infection medium.

2.6. Dissections and Immunohistochemistry

Dissections of adult midguts and immunohistochemistry were performed as previously described [58]. Flies were dissected on Sylgard (VWR) plates in 1× PBS (130 mM NaCI, 70 mM NA2HPO4, 30 mM NaH2PO4), fixed in 4% formaldehyde (Polysciences, Warrington, PA, USA) in 1× PBS for 20 min at RT, and rinsed three times with 1× PBS. Blocking was performed in PBT (1× PBS, 0.2% Triton-Χ, 0.5% BSA) at RT for at least 20 min. Primary antibodies were diluted in PBT and incubated overnight at 4 °C. Primary antibodies were washed 3 times at RT for 10 min in PT (1× PBS, 0.2% Triton X-100). Tissues were incubated in secondary antibodies diluted in PBT including DAPI (Sigma, St. Louis, MI, USA) for 1–2 h at RT with mild shaking. Samples were washed 3 times and mounted in Vectashield (Vector Laboratories, Newark, CA, USA). The primary antibodies were rabbit anti-pH3 (Millipore 1:4000), mouse anti-Prospero (DSHB 1:100), chicken anti-GFP (Invitrogen, Waltham, MA, USA 1:2000), rabbit anti-GFP (Invitrogen 1:3000), rabbit anti-cleaved Caspase-3 (Cell signaling #9661 1:400), and mouse anti-Armadillo (DSHB 1:100). Secondary antibodies conjugated to Alexa 488 and Alexa 555 (Invitrogen) were used at 1:1000. DAPI was used to stain DNA (Sigma 1:4000 of 10 mg/mL stock).

2.7. Npc2c Polyclonal Antibody

A fragment corresponding to amino acids 1-165 of Drosophila Npc2c protein (UniProt ID: Q9VH31) was cloned by Boster (https://www.bosterbio.com, accessed on 10 June 2023) in tagged vectors. Bacterially expressed aa1-165 of Npc2c was purified and used to immunize rabbits to generate polyclonal antibodies. These are available by Boster (Cat# DZ41252).

2.8. Filipin Staining

For Filipin staining of free sterols, dissected midguts were fixed for 20 min in 4% formaldehyde (Polysciences) and washed three times with 1× PBS. Midguts were stained with 50 μg/mL filipin (from 25 mg/mL stock in DMSO) in PBS for 45 min in the dark. After two washes with 1× PBS, samples were mounted in Vectashield (Vector) and imaged by confocal microscope.

2.9. Survival Assay

Adult flies in triplicates of ten 3-to-5-day-old female flies for each genotype were infected with P. aeruginosa PA14, as descripted above. Flies were shifted to 29 °C and the number of dead and alive flies was recorded every 24 h.

2.10. Smurf Assay/Gut Permeability

The Smurf assay [59] was performed in triplicates of 15 female flies in each vial. Flies were maintained at 18 °C and transgene expression was induced for 5 days or 14 days at 29 °C. The flies were starved in empty vials for 5 h and then transferred for 5 h, 16 h at 29 °C in vials with cotton balls soaked with 5 mL 4% sucrose with 0.5% w/v Bromophenol blue pH = 7. Also, upon 5 days induction at 29 °C, flies were fed on P.a. infection mix for 16 h and then were transferred for 5 h on cotton balls with Bromophenol blue. The Smurf phenotype was assessed under the stereoscope and flies whose body was blue throughout (from head to tail) were recorded as Smurfs, indicating that the epithelial integrity is lost and the dye escaped in the hemolymph.

2.11. RNA Isolation and RT-qPCR

Total RNA was extracted from 25 dissected adult midguts per genotype per condition in triplicates using Qiazol (Qiagen, Hilden, Germany) and dissolved in RNase-free water. A total of 800 ng of total RNA was freed from genomic DNA using the RQ1 RNase-Free DNase Kit (Promega, Alexandria, New South Wales). Reverse transcription was performed using 145.4 ng of the total DNase-treated RNA using the TaKaRa PrimeScript RT Master Mix Kit. qPCR reactions were performed using gene-specific primers, the sequences of which are provided in Table S2 with the amplification program shown in Table S3, using the Bio-Rad CFX Manager 3.1 program. Gene expression was normalized to the expression of two references genes, RpL32 and a-tub using the 2-ΔΔCt method. At least 3 biological replicates were used to calculate the mean and standard deviation.

2.12. Bacterial Load

Three externally sterilized (by brief dipping into 100% ethanol and drying) flies from each genotype/condition were used to determine bacterial colony-forming units (CFUs). Flies were placed into 2 mL Eppendorf tubes containing 200 μL BHI agar (BHI broth supplemented with 1 mL 0.5% Hemin and 0.5 mL of 0.5% Vitamin K1) and a stainless-steel 5 mm bead (Qiagen), and were homogenized with the TissueLyser II (Qiagen) at 50 Hz for 10 min. Total microflora CFUs were estimated by serial dilutions, and plating of 100 μL on BHI plates, which are then incubated overnight at 37 °C. CFUs per fly were calculated by dividing the number of CFUs on the plates by three, considering the dilution used. CFUs were performed twice, in triplicate.

2.13. Microbiota Analysis

A. Culture-independent. Female flies were surface-sterilized in 100% ethanol prior to dissection in sterile 1× PBS for 2 min. Forceps and dissection plates were also sterilized in 100% ethanol prior to dissection. Two pools of 50 dissected midguts per genotype were placed into 2 mL Eppendorf tubes containing 700 μL of lysis buffer (Invitrogen #A29790) and a stainless-steel 5 mm bead (Qiagen), and were homogenized with the TissueLyser II (Qiagen) at 50 Hz for 5 min. Bacterial DNA was extracted using the PurelinkTM Microbiome DNA purification kit (Invitrogen). Bacterial DNA was eluted in 90 uL of elution buffer and used for 16S rRNA sequencing. Primers targeting the V3/V4 regions were used for 16S metagenomic sequencing library preparation. Illumina MiSeq paired-end (2 × 300 bp) sequencing was performed (Macrogen Europe B.V., Amsterdam, The Netherlands), followed by an Operational Taxonomic unit (OTU) analysis for Bacteria and Archaea using the NCBI 16S database (Macrogen Europe B.V.). The raw 16S rRNA gene sequencing data are available from the National Center for Biotechnology Information (NCBI) with Sequence Read Archive (SRA) accession number PRJNA804129.
B. Culture-dependent. Several pools of 3 female individuals (5–7 day old from 18 °C and 5 days at 29 °C) were surface-sterilized in 100% ethanol, homogenized in 200 μL BHI and plated on BHI agar, as described above. Based on colony morphological characteristics, two representative isolates were observed. Each colony was used to inoculate 50 μL of sterile DNase/RNase-free water and DNA was extracted by boiling for 6 min at 95 °C and then 10 min on ice. Total DNA was used for bacterial 16S rRNA amplification with 27F and 1492R primers, using the KAPA HiFi HotStart Ready Mix PCR Kit (Roche, Basel, Switzerland). The 16S colony PCR amplification program is described in Table S4. PCR products were detected on 1% agarose gel (with 0.2 μg/mL Ethidium bromide) by electrophoresis. PCR products were purified using the NucleoSpin Gel and PCR Clean up (Macherey-Nagel, Düren, Germany) and sequenced (Macrogen Europe B.V.). The NCBI BLAST sequence analysis tool was used to analyze the sequences.

2.14. Image Acquisition and Analysis

The number of pH3-positive cells and MARCM clones was counted under the fluorescent microscope (Zeiss Axioscope A.1) at 20× magnification along the whole midgut.
All the images shown are stacks of optical sections acquired using the Leica TCS SP2 DMIRE2 confocal microscope. Confocal images were captured at 40× magnification, zoom 1× (unless otherwise noted) and 1024 × 1024 format and produced as a maximum projection of 10–15 serial sections. Images to be compared were acquired with the exact same settings. For cell quantification, at least 10 images from two sequential 37.5 × 37.5 μm frames of posterior regions P4(R5) and P3(R4c) were analyzed in Image J. Different channels were separated and each cell population was measured independently. For comparisons among the genotypes, the ratio of the total number of each cell population over the total number of cells per frame was calculated. Midgut area was measured by manually highlighting the surface of each midgut in each frame, using the Freehand selection tool of the software. Similarly, for EE quantification in tumorous midguts, images from the same regions were used for calculating the ratio of EEs per total nuclei per frame.
Sterol measurements (Filipin staining) were acquired from confocal maximum projection images which were stacks of 3–4 sections of the posterior regions P3(R4c). Fast acquisition was necessary because the fluorescence signal of filipin photobleaches quickly. The surface area of each gut per frame was manually highlighted using Image J and the fluorescence (area integrated intensity) of each midgut was measured. To calculate the corrected total midgut fluorescence, for each image, the product of the area and the mean background fluorescence was subtracted from the integrated intensity measured initially.
The EC nucleus maximum cross-section area was measured as previously described [51]. Confocal images of posterior regions P4(R5) and P3(R4c) captured using the same parameters as above. According to confocal photo properties, the distance in pixels was converted to μm (it is known that the distance of 1024 pixels equals 375 μm). Single-channel images (DAPI staining) were analyzed by adjusting the threshold to produce 2-pixel intensities on the photo: black and white. A binary version of each image was generated and the type of measurement was specified to the Analyze particles option. To increase measurement accuracy, the infinity value was set to either 1 or 2, to exclude calculation of random speckles in the photo. Particles smaller than 23 μm2 and merged nuclei were also excluded from the analysis. Measurements of area corresponding to each numbered nucleus were plotted using Prism 9 and Student’s t-test was used for statistical analysis.

2.15. Statistical Analysis

The numerical results are presented as mean ± standard deviation of the mean. Statistical significance was evaluated using the two-tailed Student’s t-test when comparing the averages of two groups of values, with the minimum of 10 values each. Comparisons between the relative mRNA levels in different genotypes/conditions was performed with the minimum of 3 biological replicates for each. For CFUs, we used at least 6 biological replicates and significance was tested using the Mann–Whitney U Test (www.socscistatistics.com, accessed on 15 June 2023). For fly survival, the Kaplan–Meier method was performed, using the log-rank test (MedCalc: https://www.mdcalc.com, accessed on 10 June 2022). The Prism 9 (v.9.0.0) software was used to perform all tests except the U-test. The type of statistical test used for each experiment and the number of samples tested are indicated in the figure legends. p-values are indicated as ns, not significant, * 0.01 < p ≤ 0.05, ** 0.001 < p ≤ 0.01, *** 0.0001 < p ≤ 0.001, **** p ≤ 0.0001.

3. Results

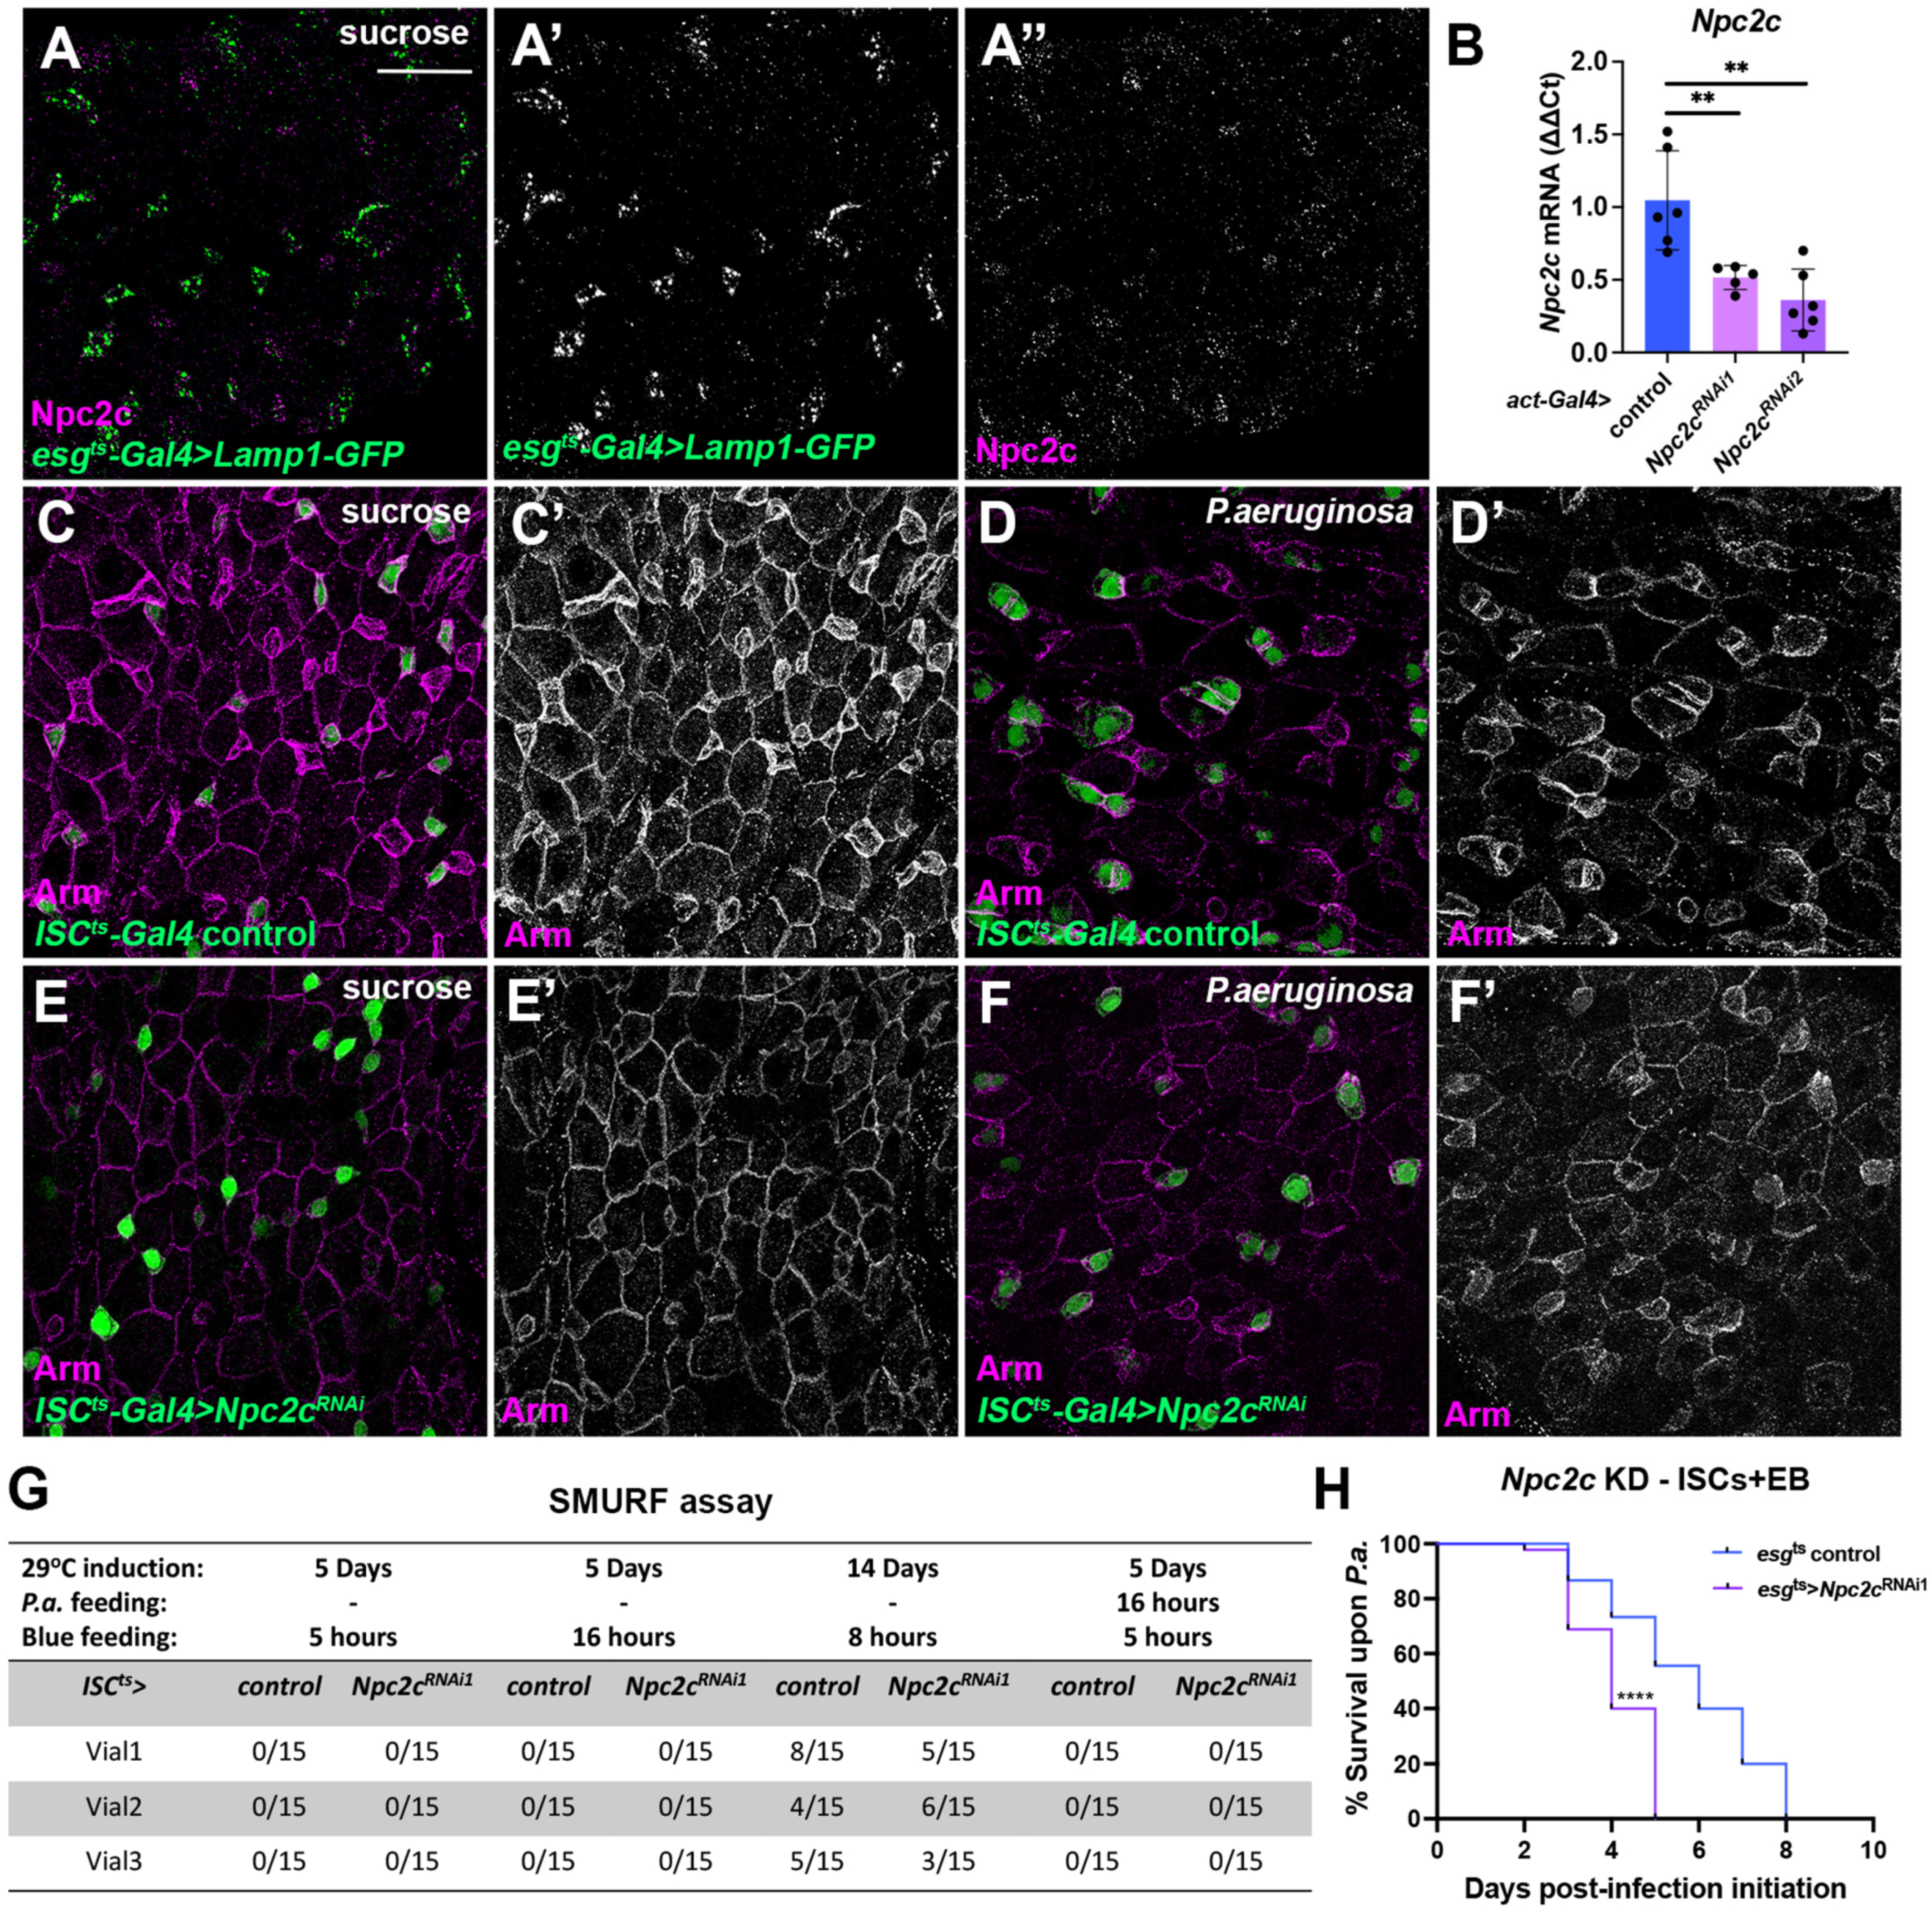
3.1. Npc2c Is Expressed in the Midgut Epithelium and Affects Physiology

To start exploring the role of Npc2c, we assessed its expression in silico through database searches. According to the FlyAtlas2 [60], Npc2c expression is restricted to the larval and adult midgut. Cell type-specific adult midgut expression analysis [61] in FlygutSeq shows that the eight Npc2 family members (Npc2a-h) exhibit variable expression in different intestinal cell populations (Figure S1A) and respond differently to pathogenic Pseudomonas entomophila (P.e.) infection (Figure S1B). In particular, Npc2c mRNA was detected at low levels in all types of intestinal cells and it was turned on specifically in ISC/EB progenitors upon P.e. infection. To assess Npc2c protein expression and localization in the adult midgut, we generated a polyclonal anti-Npc2c antibody (see Methods 2.7). We used the esgts-Gal4 (esg-Gal4 UAS-EGFP tub-Gal80ts) driver [49] to label ISCs and EBs of the posterior midgut with the lysosomal marker Lamp-GFP [62] and we assessed Npc2c expression using anti-Npc2c. We found that Npc2c was expressed in ICSs/EBs of the posterior midgut and exhibited vesicular localization, albeit rarely colocalizing with lysosomes (Figure 1A).
To assess the role of Npc2c in the adult intestinal epithelium, we used tissue-specific RNAi to silence the gene. First, we used RT-qPCR to test the knockdown efficiency of two independent UAS-Npc2cRNAi lines upon ubiquitous overexpression using Act5C-Gal4 in larvae. We found that both UAS-Npc2cRNAi1 (VDRC KK101583) and UAS-Npc2cRNAi2 (VDRC GD31139) led to significantly reduced Npc2c mRNA levels (0.51% for Npc2cRNAi1 and 0.36% for Npc2cRNAi2) compared to controls at 25 °C (Figure 1B). Then, we silenced Npc2c specifically in the adult ISCs using the ISCts-Gal4 (esg-Gal4 UAS-EGFP tub-Gal80ts Su(H)-Gal80) driver and noticed that Npc2c loss led to intestinal epithelial cell shape changes both in uninfected conditions and upon oral bacterial infection with Pseudomonas aeruginosa (P.a.), a pathogen causing intestinal regenerative inflammation [58]. Specifically, the Npc2c-silenced ISCs lost their triangular shape (Figure 1C–F). Immunostaining for the Drosophila β-catenin homologue, Armadillo (Arm), that decorates adherens junctions [63], confirmed that Npc2-deficient ISCs were morphologically different from wild-type because they lost membrane Arm and their shape became round (Figure 1C,E). Infected midguts exhibited inhomogeneous adherens junction staining, especially of the most apically positioned ECs, where Arm was significantly reduced (Figure 1D). The reduction of membrane Arm staining occurred also in all epithelial cells upon ISC-specific Npc2c knockdown (Figure 1F). Since Arm is deregulated upon ISC-specific Npc2c silencing, we hypothesized that intestinal epithelial integrity might be affected. To assess the latter, we performed Smurf assays in the presence and absence of P.a. at different time points (Figure 1G). Enumeration of Smurfs showed no difference between the control and Npc2c-deficient flies at different conditions (Figure 1G). Nevertheless, ISC/EB-specific Npc2c knockdown reduced the overall organismal fitness as it increased fly susceptibility to P.a. infection, underscored by the reduction of the lethal time 50% (LT50%) from >5 to 4 days compared to controls (Figure 1H). These results highlight that Npc2c expression in the adult intestinal progenitors impinges on fly physiology.

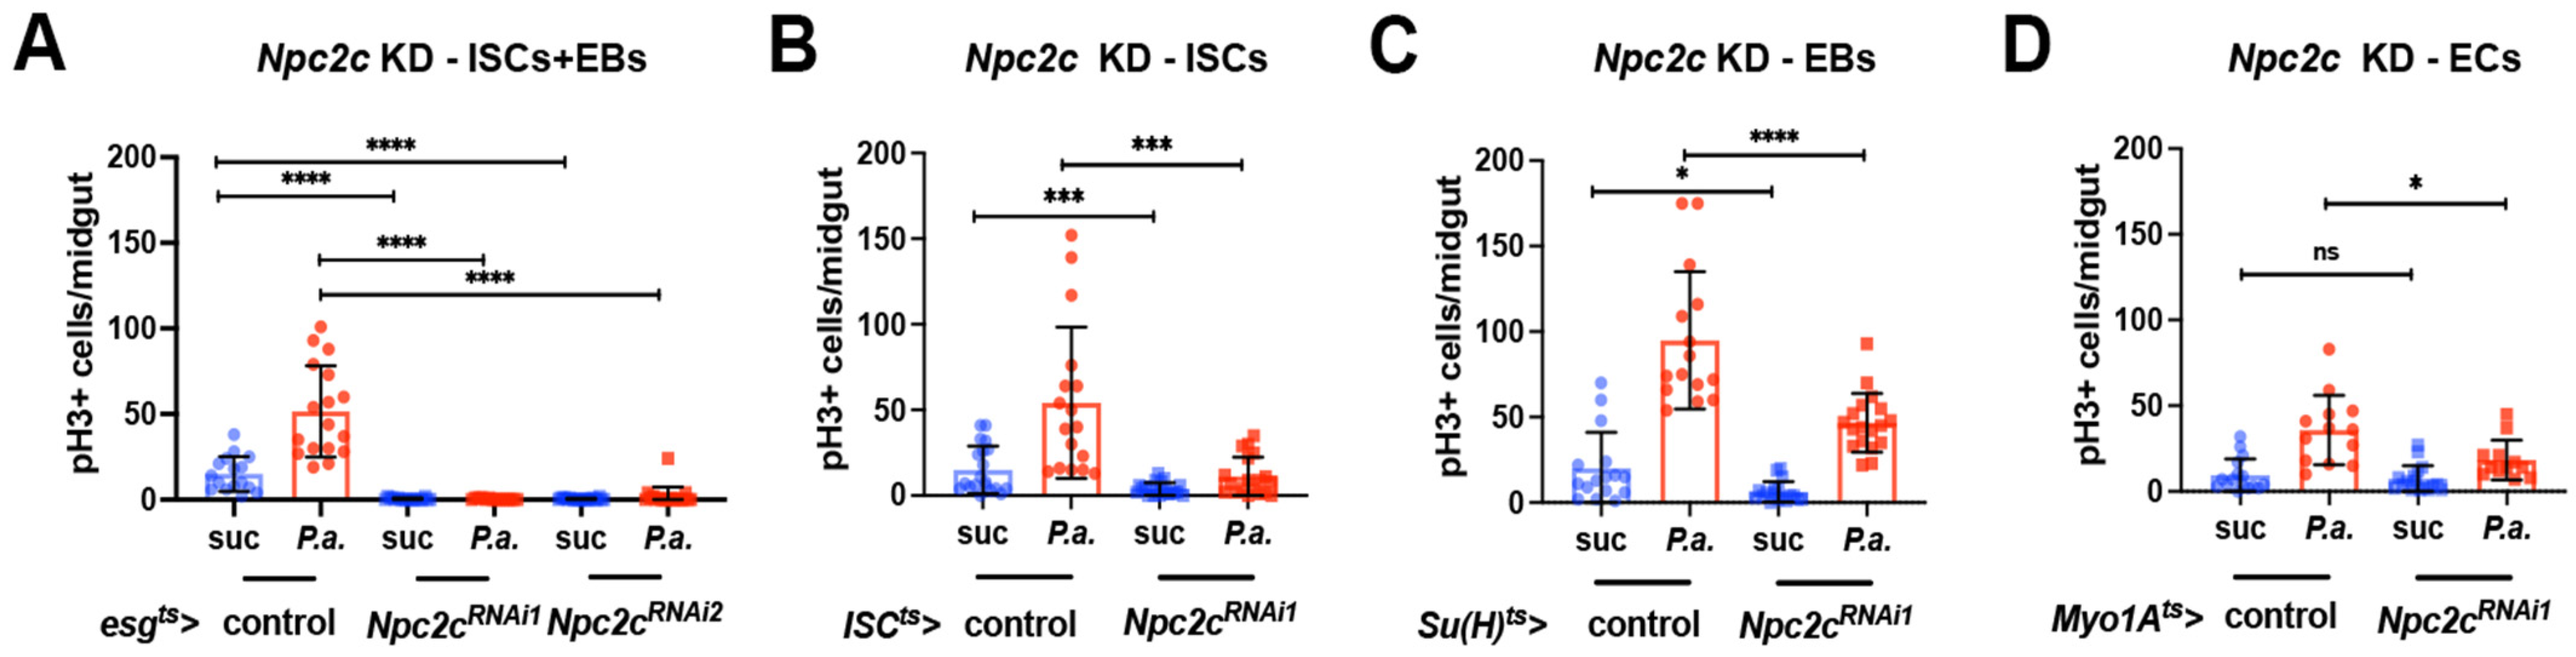
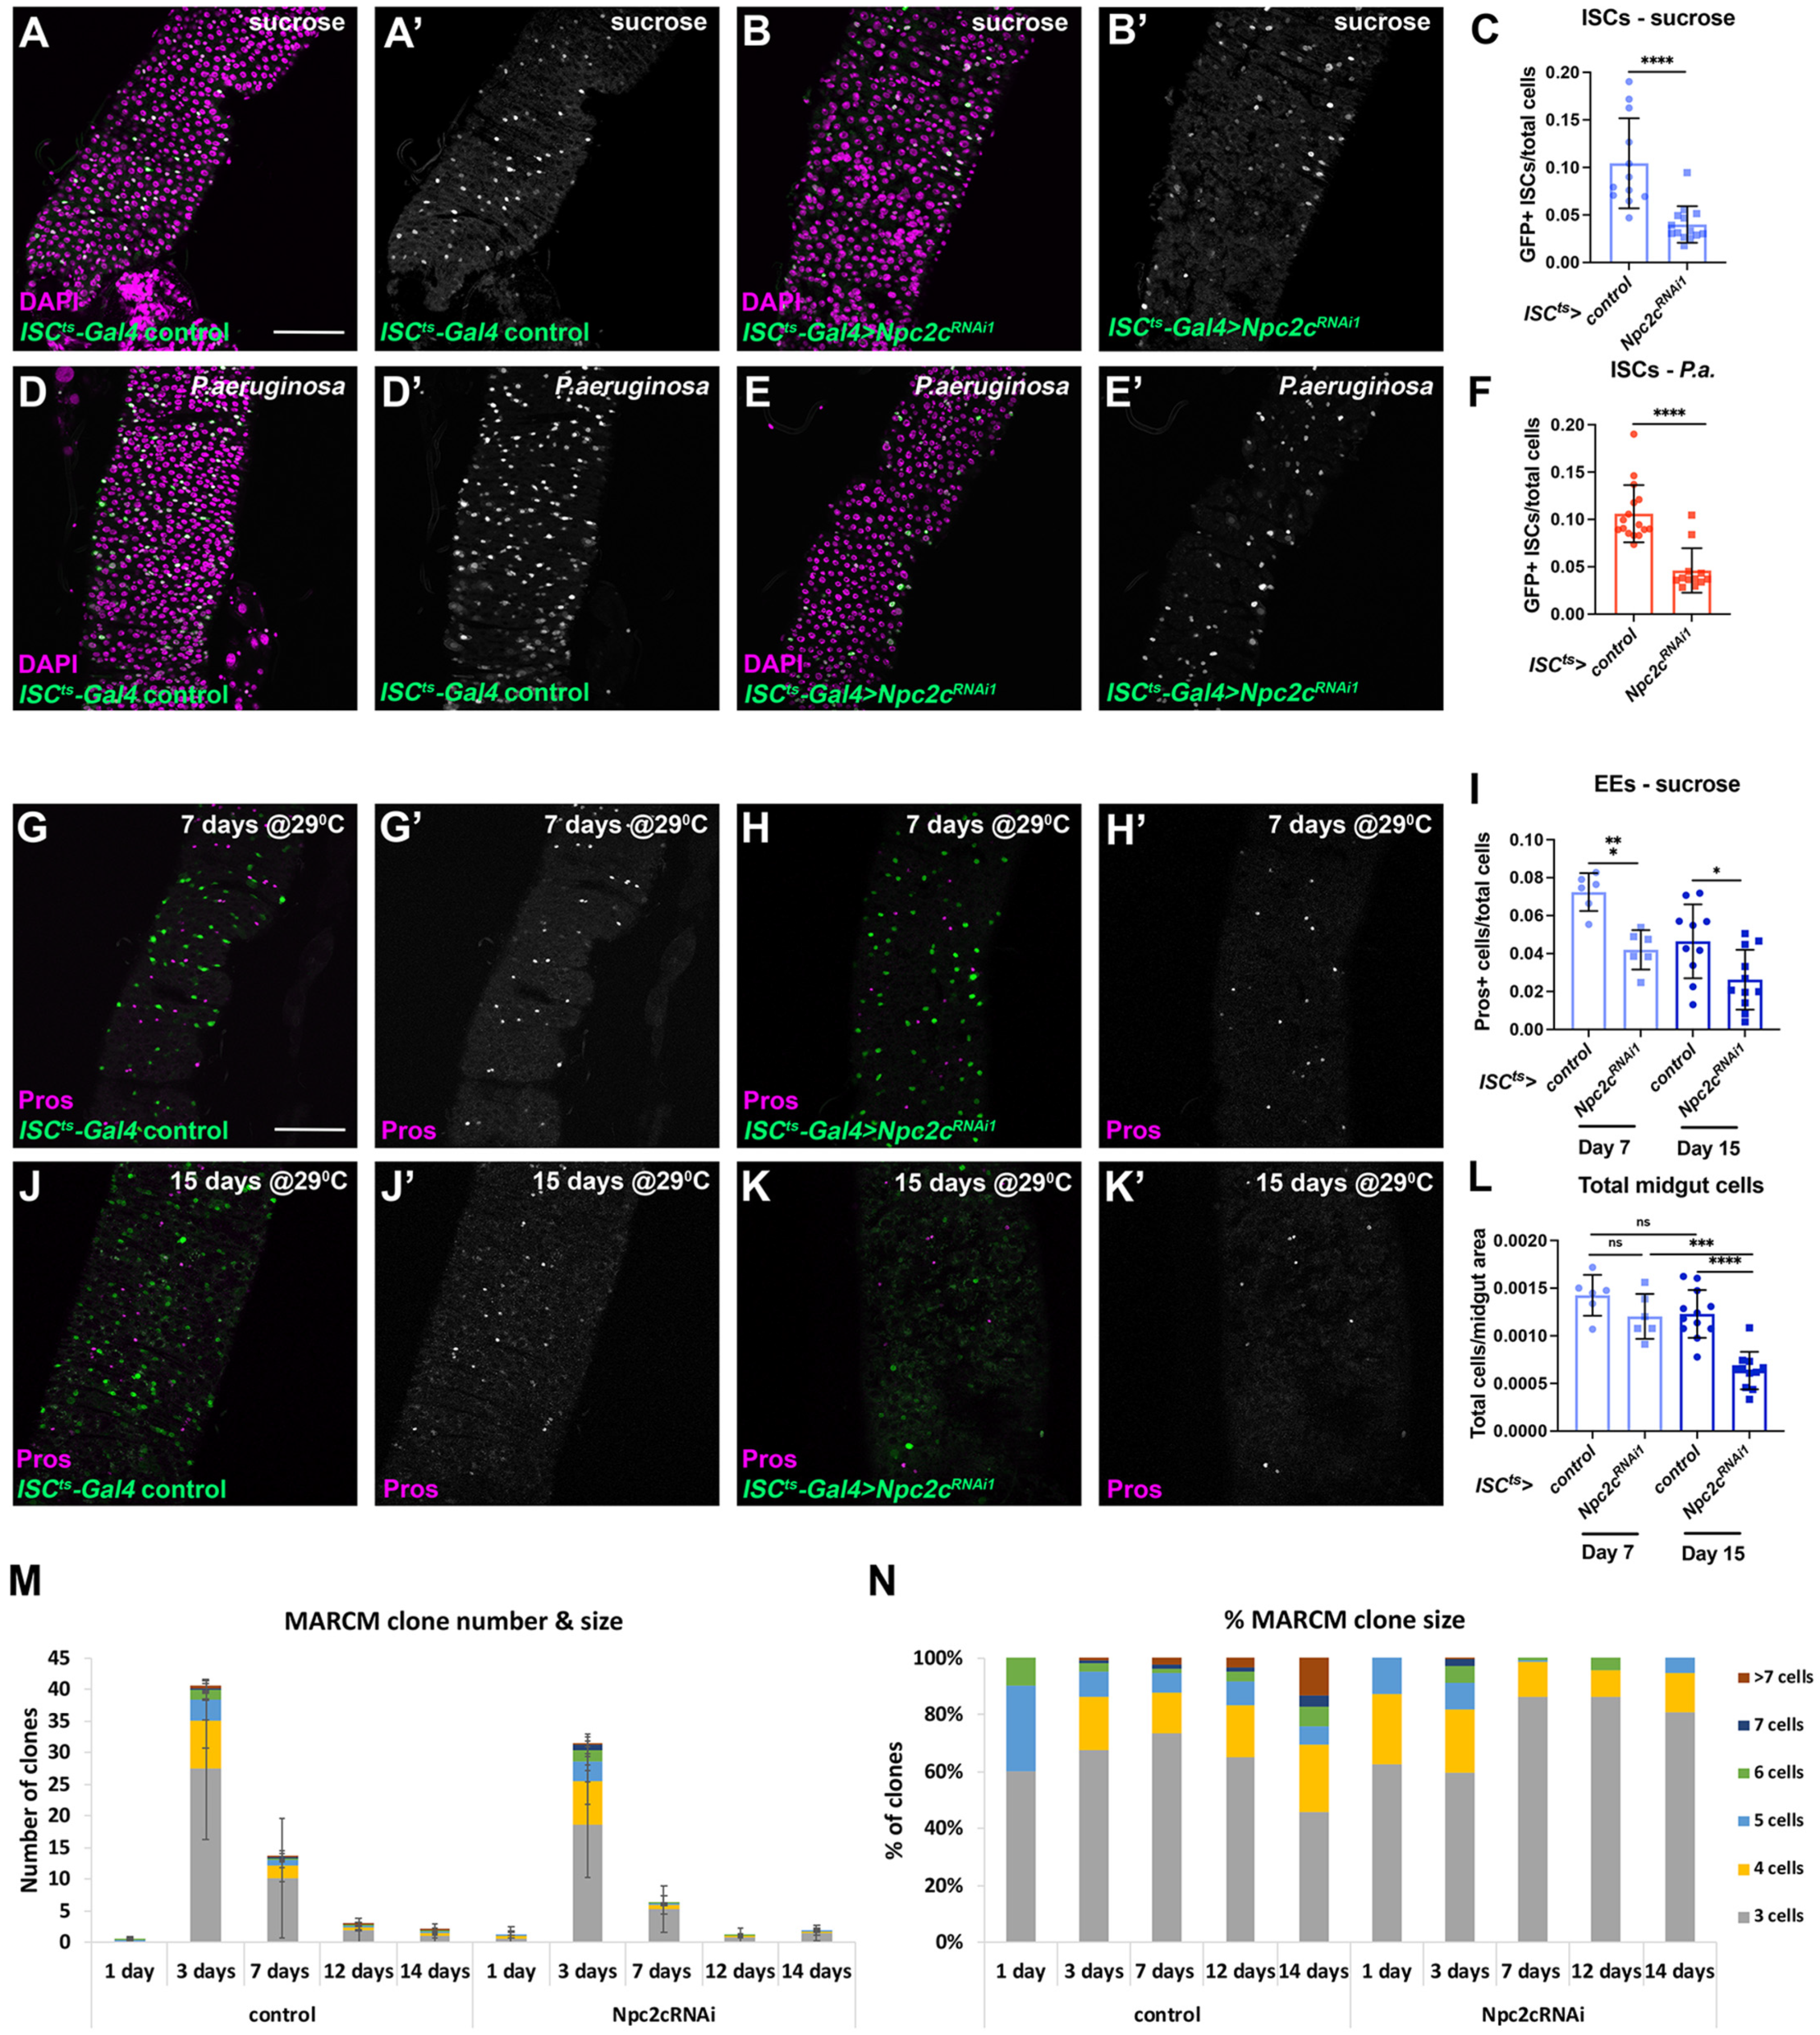
3.2. Npc2c Autonomously Controls ISC Mitosis

Increased ISC mitosis is a protective mechanism against infection that promotes survival upon oral P.a. administration [51]. To assess whether mitosis is affected in Npc2c-silenced midguts, we specifically silenced Npc2c in different intestinal populations, in baseline conditions and upon oral P.a. infection. First, we used the ISC/EB-specific esgts-Gal4 driver to label intestinal progenitor cells with EGFP and simultaneously silence Npc2c in the adult midgut with each of the two RNAi lines. Strikingly, ISC/EB-specific Npc2c knockdown inhibited intestinal mitosis almost completely in baseline conditions and upon P.a.-induced regeneration (Figure 2A). To further dissect the adult midgut cellular specificity of Npc2c function, we silenced Npc2c in ISCs using ISCts-Gal4, EBs using Su(H)ts-Gal4 (Su(H)-Gal4 tub-Gal80ts UAS-EGFP) and ECs using Myo1Ats-Gal4 (Myo1A-Gal4 tub-Gal80ts UAS-EGFP). We found that ISC-specific Npc2c knockdown caused a dramatic reduction of ISC mitosis phenocopying the esgts-Gal4-driven Npc2c knockdown (Figure 2B), whereas EB- or EC-specific Npc2c silencing had milder effects on ISC mitosis (Figure 2C,D). Since, in flies, the generation rate of differentiated midgut cells is adapted to ISC number changes to maintain homeostasis [64,65], we assessed how regeneration failure due to ISC-specific Npc2c deficiency affected different intestinal cell populations and the ISC/differentiated cell balance. When Npc2c was silenced specifically in the ISCs, using the ISCts-Gal4, we observed fewer GFP-positive ISCs compared to the control (Figure 3A,B,D,E). Cell quantifications in control and Npc2c-deficient flies underscored the significant reduction of ISCs in both uninfected and P.a.-infected posterior midguts (Figure 3C,F). To assess cell differentiation in Npc2c-depleted midguts with reduced ISCs, we first quantified Prospero (Pros)-positive cells which correspond to the EE lineage. We found that ISC-specific Npc2c silencing for 7 days led to reduced EEs in the posterior midgut of uninfected flies (Figure 3G,J,I). Since the Drosophila intestinal epithelium is renewed approximately every two weeks [66], we also assessed EE numbers on day 15 post-Npc2cRNAi induction and found that EEs were further reduced (Figure 3H,I,K). Importantly, the total number of intestinal cells, stained by the nucleus marker DAPI was not significantly altered upon ISC-specific Npc2c silencing on day 7 post-transgene induction. However, on day 15 post-Npc2cRNAi induction, the total midgut cell number was significantly reduced compared to the control (Figure 3L), indicating that, similar to EEs, the differentiated ECs were also reduced upon Npc2c knockdown.
ISCs of Npc2c-silenced midguts could be lost due to cell death or because of problematic maintenance. First, to assess the kinetics of ISC mitosis loss, we performed a time-course experiment with and without p.a. infection. We found that ISC mitosis was gradually reduced starting from 16 h after initiation of Npc2cRNAi induction, and by 36 h, it was eliminated (Figure S2A). Thus, we wanted to assess cell maintenance effects before mitosis elimination and focused at 24 h post-Npc2cRNAi induction. To assess cell death, we stained control and Npc2c-silenced midguts with an antibody detecting the cleaved form of Caspase-3. We found no difference in apoptosis in uninfected control and Npc2c-silenced midguts (Figure S2B,C) (we occasionally detected Caspase-3-positive cells, as previously reported [66]). Infected control and Npc2c-silenced midguts exhibited increased apoptosis, which was restricted to differentiated ECs, but not ISCs (Figure S2D,E) (as previously reported [52]). To assess the role of Npc2c in ISC mitosis and maintenance, we generated positively marked Npc2c-deficient midgut clones using Mosaic Analysis with a Repressible Cell Marker (MARCM) method [57]. We assessed the number of clones per midgut and the number of cells per clone in control and Npc2cRNAi lineages at different time points (Figure 3M,N). Interestingly, we found that Npc2cRNAi and control clones were generated at similar frequencies (Figure 3M). Furthermore, the number of clones increased between day 1 and day 3 by approximately 20-fold and 15-fold in the two genotypes and then was gradually decreased at a similar rate. Strikingly, we observed a growth impairment in the Npc2c-deficient clones, contrary to the wild-type ISC clones, which, as expected, were increasing in size at later time points. For example, on day 14 post-induction, no Npc2cRNAi clone contained more than 5 cells, whereas more than 25% of control clones included 6 cells or above (Figure 3N). Therefore, we conclude that Npc2c is necessary for ISC mitosis and maintenance of the stem cell lineage.
Since our results indicate that Npc2c regulates ISC mitosis, and we know that stem cell mitosis and cancer are intimately connected [51,67], we assessed the effects of Npc2c silencing in Ras-tumorous intestines. By expressing Npc2cRNAi in tumorous midguts overexpressing through esgts-Gal4 an activated form of Drosophila Ras (RasQ13), we found that Npc2c silencing decreased tumor mitosis and growth. More specifically, esgts > RasQ13 tumors developed rapidly, populating the whole midgut 3 days post-induction at 29 °C, independent of P.a. infection (Figure 4A,B). In contrast, Npc2c-silenced esgts > RasQ13 tumors exhibited reduced size (Figure 4C,D) accompanied by dramatically decreased mitosis: ~10-fold reduction in pH3-positive cells with or without the synergistic effect of P.a. (Figure 4E). In addition, although esgts > RasQ13 tumors promote EC rather than EE differentiation causing a reduction of EEs [52], we found that tumor-specific Npc2c silencing resulted in increased EE numbers by ~8-fold and ~5-fold in the presence and absence of bacterial synergy, respectively (Figure 4F). Overall, these data indicate that Npc2c acts in tumor cells to regulate tumorigenesis.

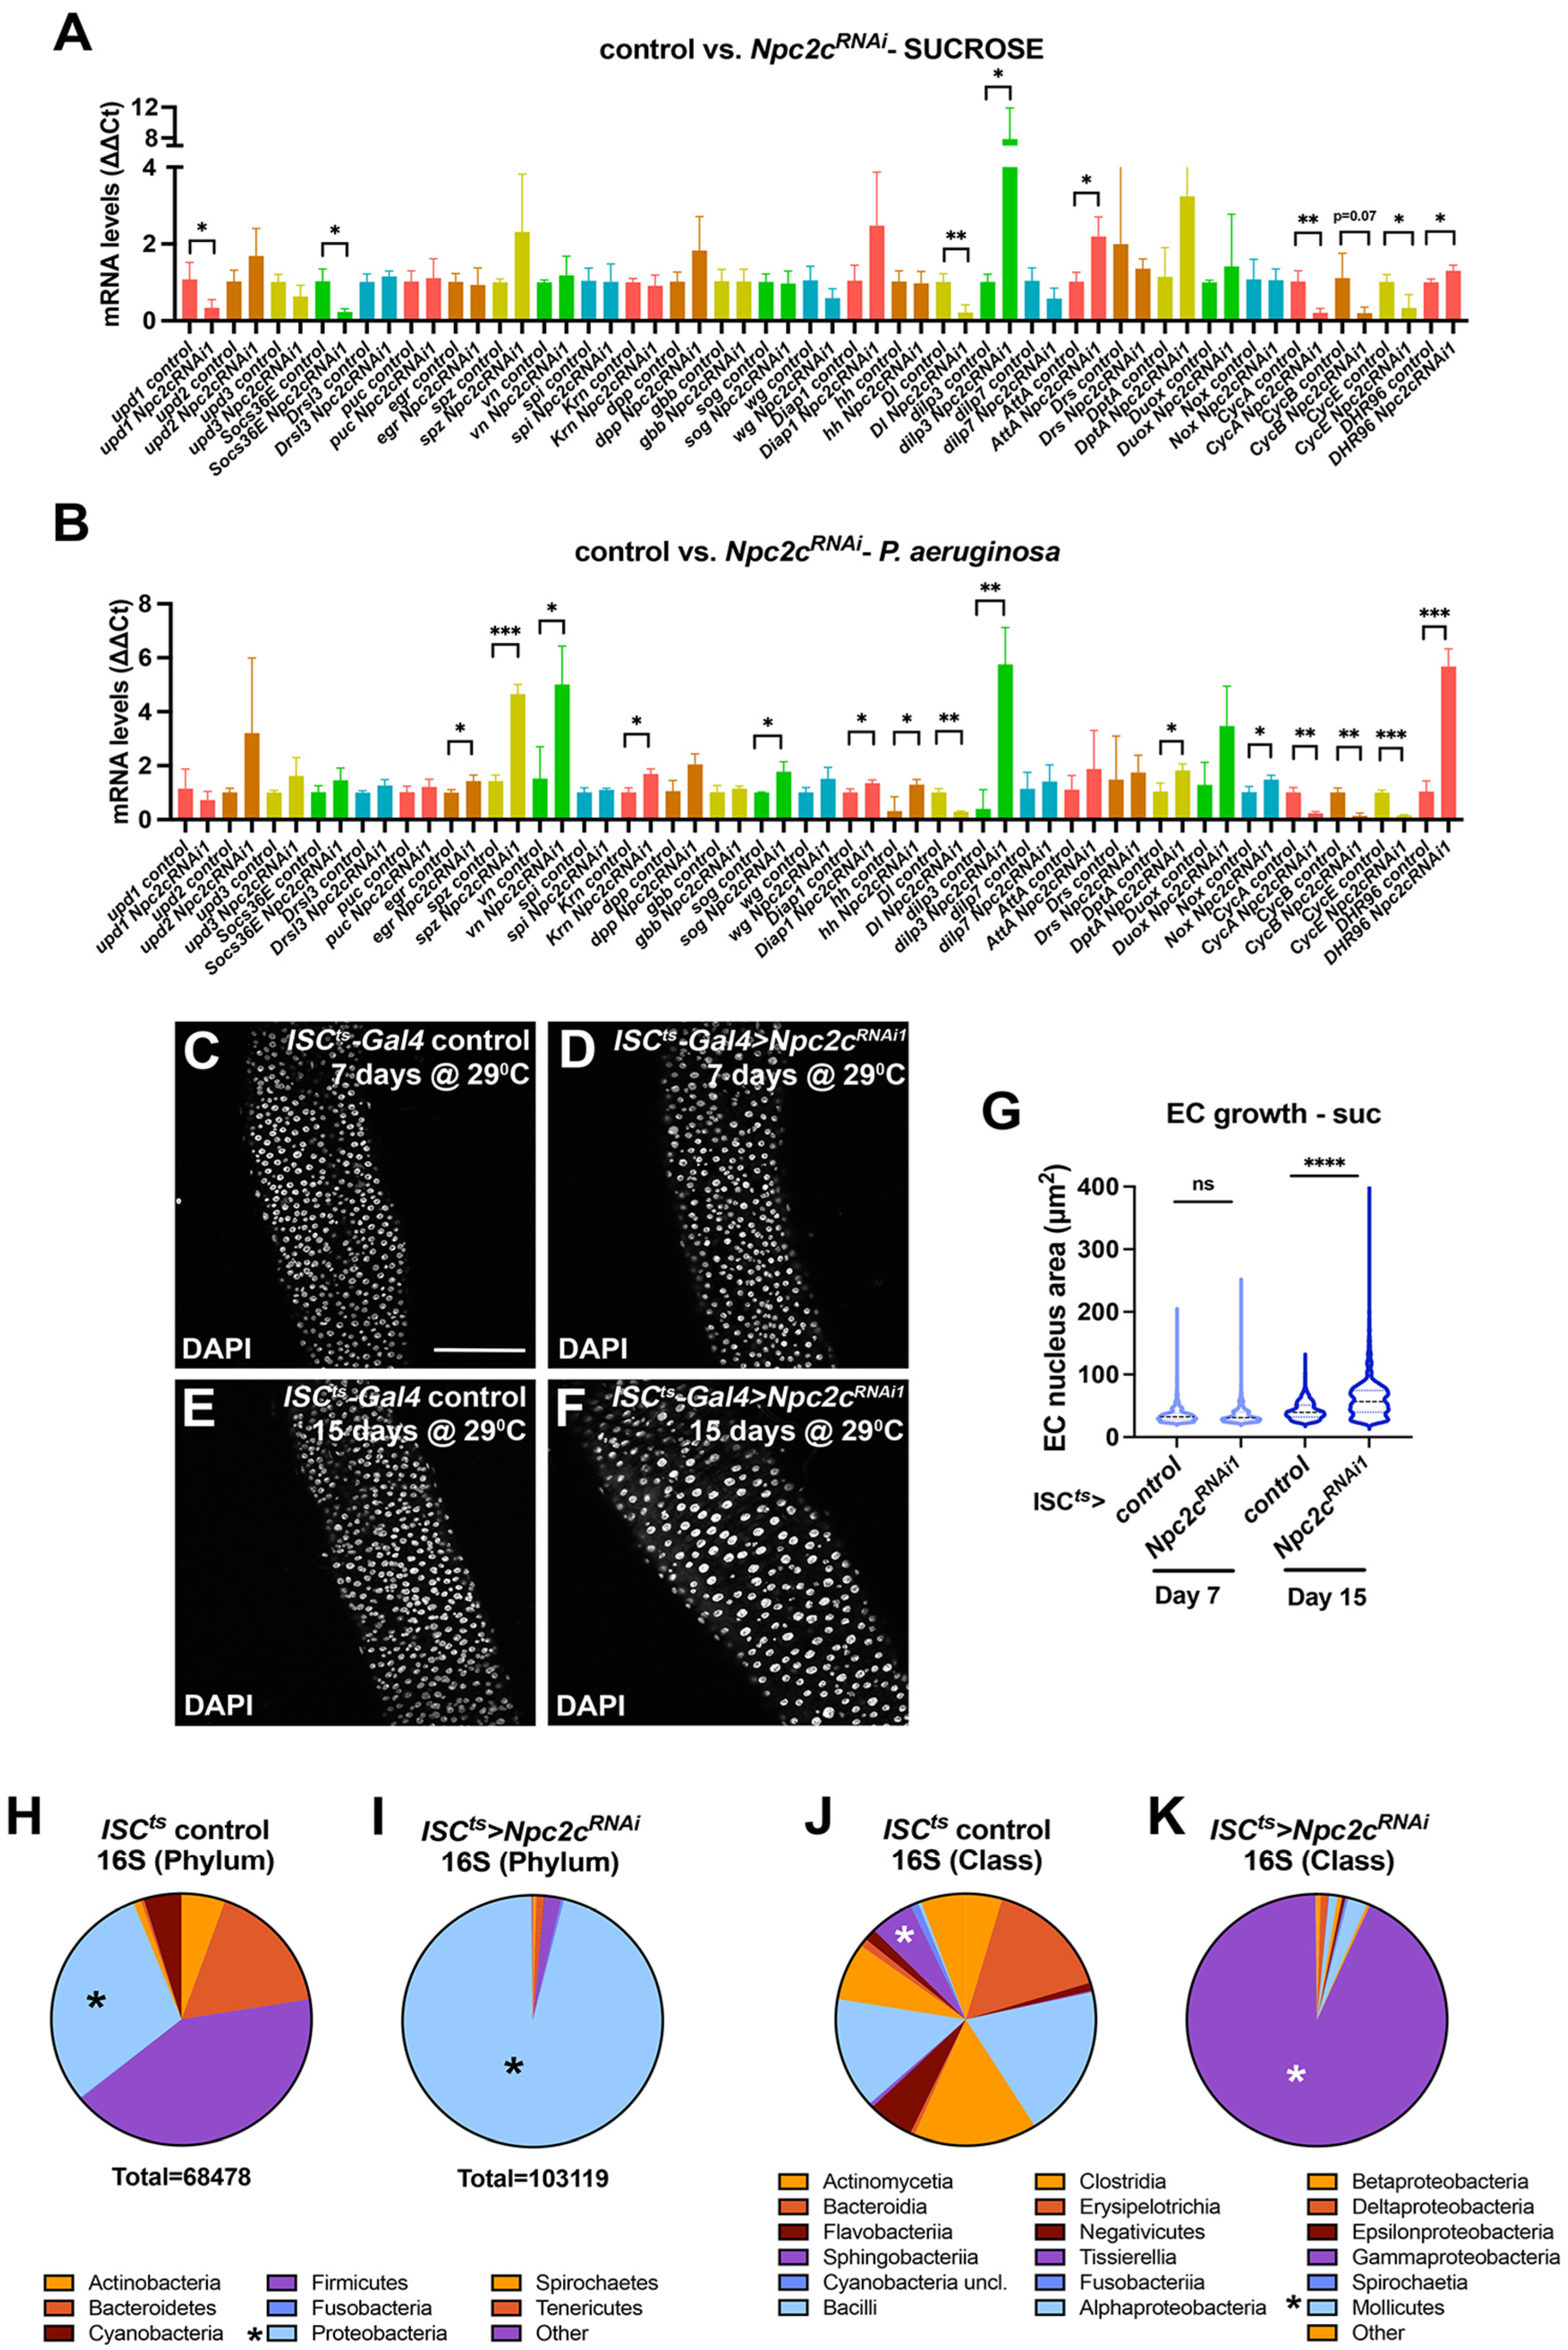
3.3. Npc2c Silencing Affects Expression of Mitotic Regulators and Leads to Intestinal Dysbiosis

To assess whether conserved signaling pathways and genes with known roles in the Drosophila midgut might be implicated in the Npc2c-silencing phenotypes, we performed gene expression analysis using RT-qPCR in control and progenitor-specific Npc2c-silenced uninfected and P.a.-infected midguts. Specifically, we assessed expression of genes implicated in ISC proliferation and differentiation, including members of the Jak/Stat, EGFR, JNK, Notch, Wg and Hippo pathways, immunity pathways, as well as mitosis regulators. We also tested expression of the DHR96 gene, which is involved in sterol homeostasis (Figure 5A,B). In agreement with the severe mitosis impairment caused by Npc2c knockdown, we observed significantly lower expression of mitotic cyclins in Npc2c-silenced midguts in both uninfected and P.a.-infected conditions. Specifically, the mRNA expression levels of three cyclins, CycA, CycB and CycE, were reduced by more than 5-fold. In addition, expression of the Notch ligand Delta (Dl), which marks the ISCs and mediates their differentiation [68], was dramatically reduced in Npc2c-silenced midguts. Altogether, the reduced expression of Cyclin genes and Dl in Npc2c-silenced midguts compared to wild-type controls is indicative of the impaired ISC mitosis and the decreased ISC numbers accompanying Npc2c knockdown.
Interestingly, in uninfected, but not P.a.-infected midguts, the mRNA level of the Jak/Stat ligand Unpaired 1 (Upd1) and the direct target of the pathway, Socs36E, were downregulated in progenitor-specific Npc2c-silenced midguts (Figure 5A,B). Since the Upd1-Jak/Stat pathway controls basal turnover of the midgut epithelium [69], we hypothesized that Npc2c may regulate Upd1 activity and therefore ISC proliferation in baseline, uninfected conditions. In Npc2c-deficient flies, other genes such as the Drosophila insulin-like peptide 3 (Dilp3) and the antimicrobial peptide Attacin A (AttA) were significantly upregulated in uninfected conditions (Figure 5A), whereas in P.a.-infected midguts, several genes encoding ligands that control ISC proliferation/differentiation and host defense were upregulated. These included genes encoding the EGFR pathway ligands vein (vn) and Keren (Krn), the Drosophila TNF-α ligand eiger (egr), the Insulin receptor ligand Dilp3, Hedgehog (hh), and the Hippo pathway effector Drosophila inhibitor of apoptosis 1 (Diap1). In addition, genes encoding the IMD/antimicrobial peptide Diptericin A (DptA), the NADPH oxidase Nox, and the Toll pathway ligand, Spatzle (spz) were also found increased in P.a.-infected Npc2c-silenced midguts (Figure 5B). Finally, expression of DHR96 was induced upon Npc2c silencing in both uninfected and P.a.-infected conditions, indicating a feedback regulation between Npc2c and DHR96 (Figure 5A,B).
ISC elimination and decrease in ISC mitosis via CycE downregulation can trigger compensatory EC polyploidization [51]. Since progenitor-specific Npc2c silencing blocked mitosis almost completely and reduced CycE expression significantly, we tested EC ploidy in control and ISC-specific Npc2c-silenced midguts. To assess EC ploidy, we measured the EC nucleus maximum cross-sectional area, which was previously shown to strongly correlate with EC DNA content [51]. Specifically, we imaged intestinal nuclei and measured EC nucleus size in adult wild-type and ISC-specific Npc2c-silenced midguts in baseline conditions on day 7 and day 15 upon UAS-Npc2cRNAi induction. We observed that Npc2c-silenced midguts did not exhibit a significant difference in the EC nucleus area on day 7 compared to control midguts (Figure 5C,D,G). However, ECs were significantly enlarged on day 15 (Figure 5E–G). Nevertheless, this compensatory EC endoreplication upon Npc2c silencing did not suffice for tissue maintenance and survival upon infection (Figure 1H).
Previous in vitro experiments in cultured S2 cells showed that over-expression of several Npc2 genes activated IMD and stimulated DptA expression [48]. Interestingly, we showed that ISC/EB-specific Npc2c knockdown upregulated expression of AttA (Figure 5A), an AMP known to be induced in the midgut in response to Gram-negative bacteria [70]. Thus, we hypothesized that ISC/EB-specific Npc2c silencing may induce dysbiosis in the midgut, which activates the IMD pathway and AMP transcription. To address this hypothesis, we performed 16S rDNA sequencing of uninfected control and uninfected ISC/EB-specific Npc2c-silenced midguts in biological replicates. We found that Npc2c-silenced midguts encompassed increased numbers of commensal bacteria (103119 compared to 68478 identified in the control midguts). Furthermore, the microbiome of Npc2c-silenced midguts exhibited decreased complexity. For example, common phyla present in control flies, such as Actinobacteria, Bacteroidetes and Firmicutes, were significantly decreased in Npc2c-silenced flies, whereas, the abundance of other commensals, such as Proteobacteria, was increased from 30% to 95% (Figure 5H,I). Specifically, Npc2c-deficient midguts favored the growth of Gram-negative gamma-proteobacteria (Figure 5J,K), and specifically the species Gilliamena intestini. To validate the metagenomics results and isolate candidate species involved in dysbiosis, we assessed changes in the abundance of commensal bacteria in independent experiments by counting colony-forming units (CFUs) of wild-type and Npc2c-silenced flies in uninfected conditions. Using a nutrient-rich medium, brain heart infusion (BHI), that allows growth of various hard-to-grow microorganisms, we confirmed an increase in the abundance of commensals upon Npc2c knockdown, albeit not statistically significant, as well as reduced complexity in the types of isolated colonies in anaerobic conditions (not shown). In particular, colonies with five and three distinct morphological characteristics, were isolated from control and Npc2c-silenced midguts, respectively. Colony PCR followed by 16S rDNA gene sequencing identified common commensals, including Lactobacillus spp. (L. plantarum and L. brevis) and Enterococcus spp. (Enterococcus termitis) in control and Npc2c-silenced flies, but proteobacteria could not be isolated. Overall, these findings highlight the significance of Npc2c in microbiota homeostasis, which is responsible for the induction of host defense mechanisms and epithelial homeostasis.

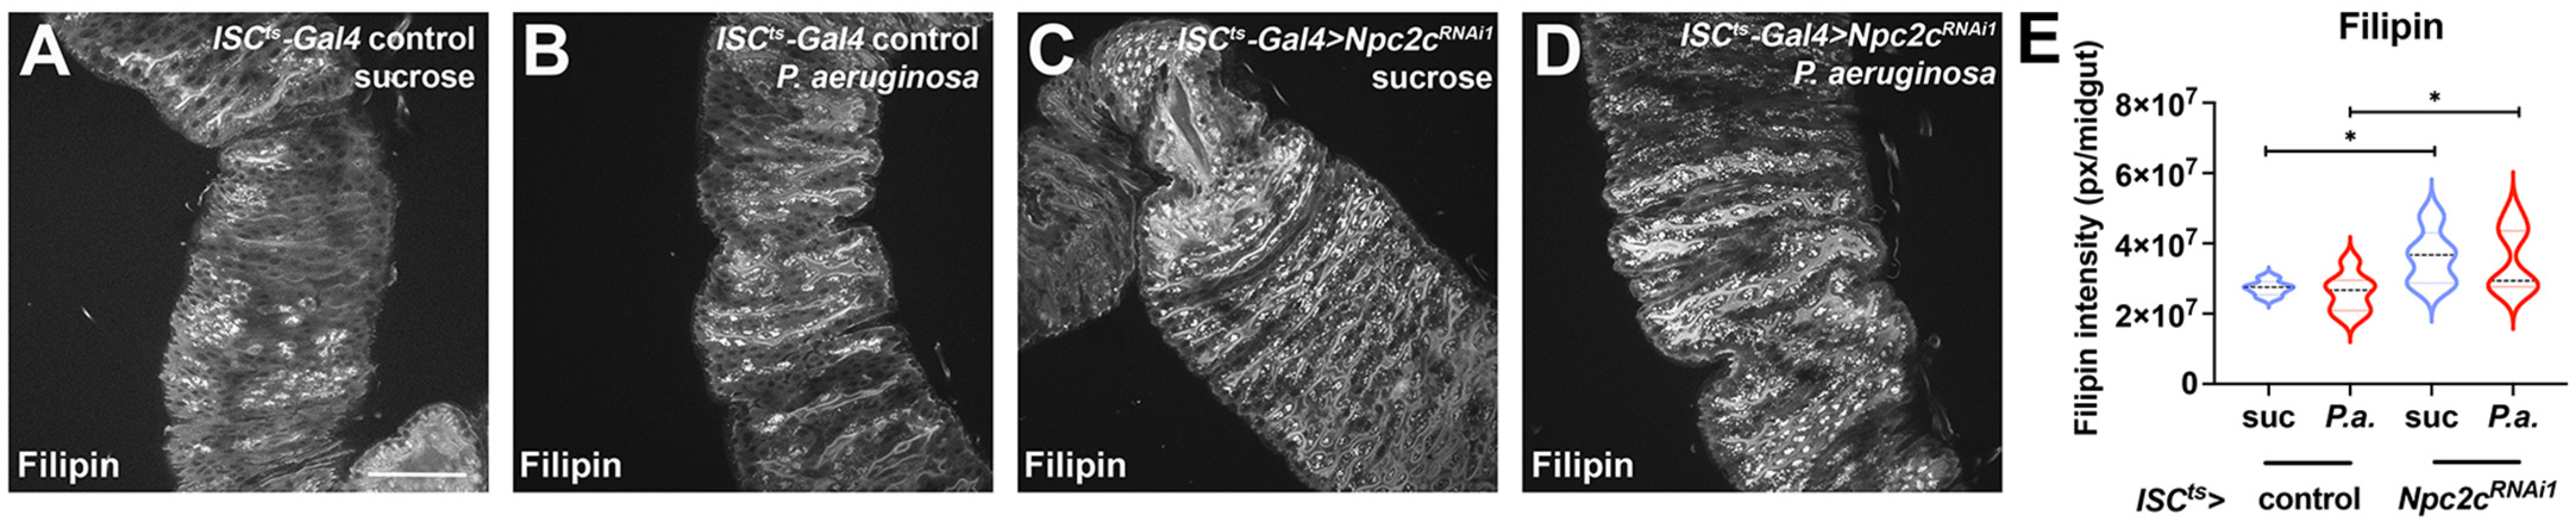
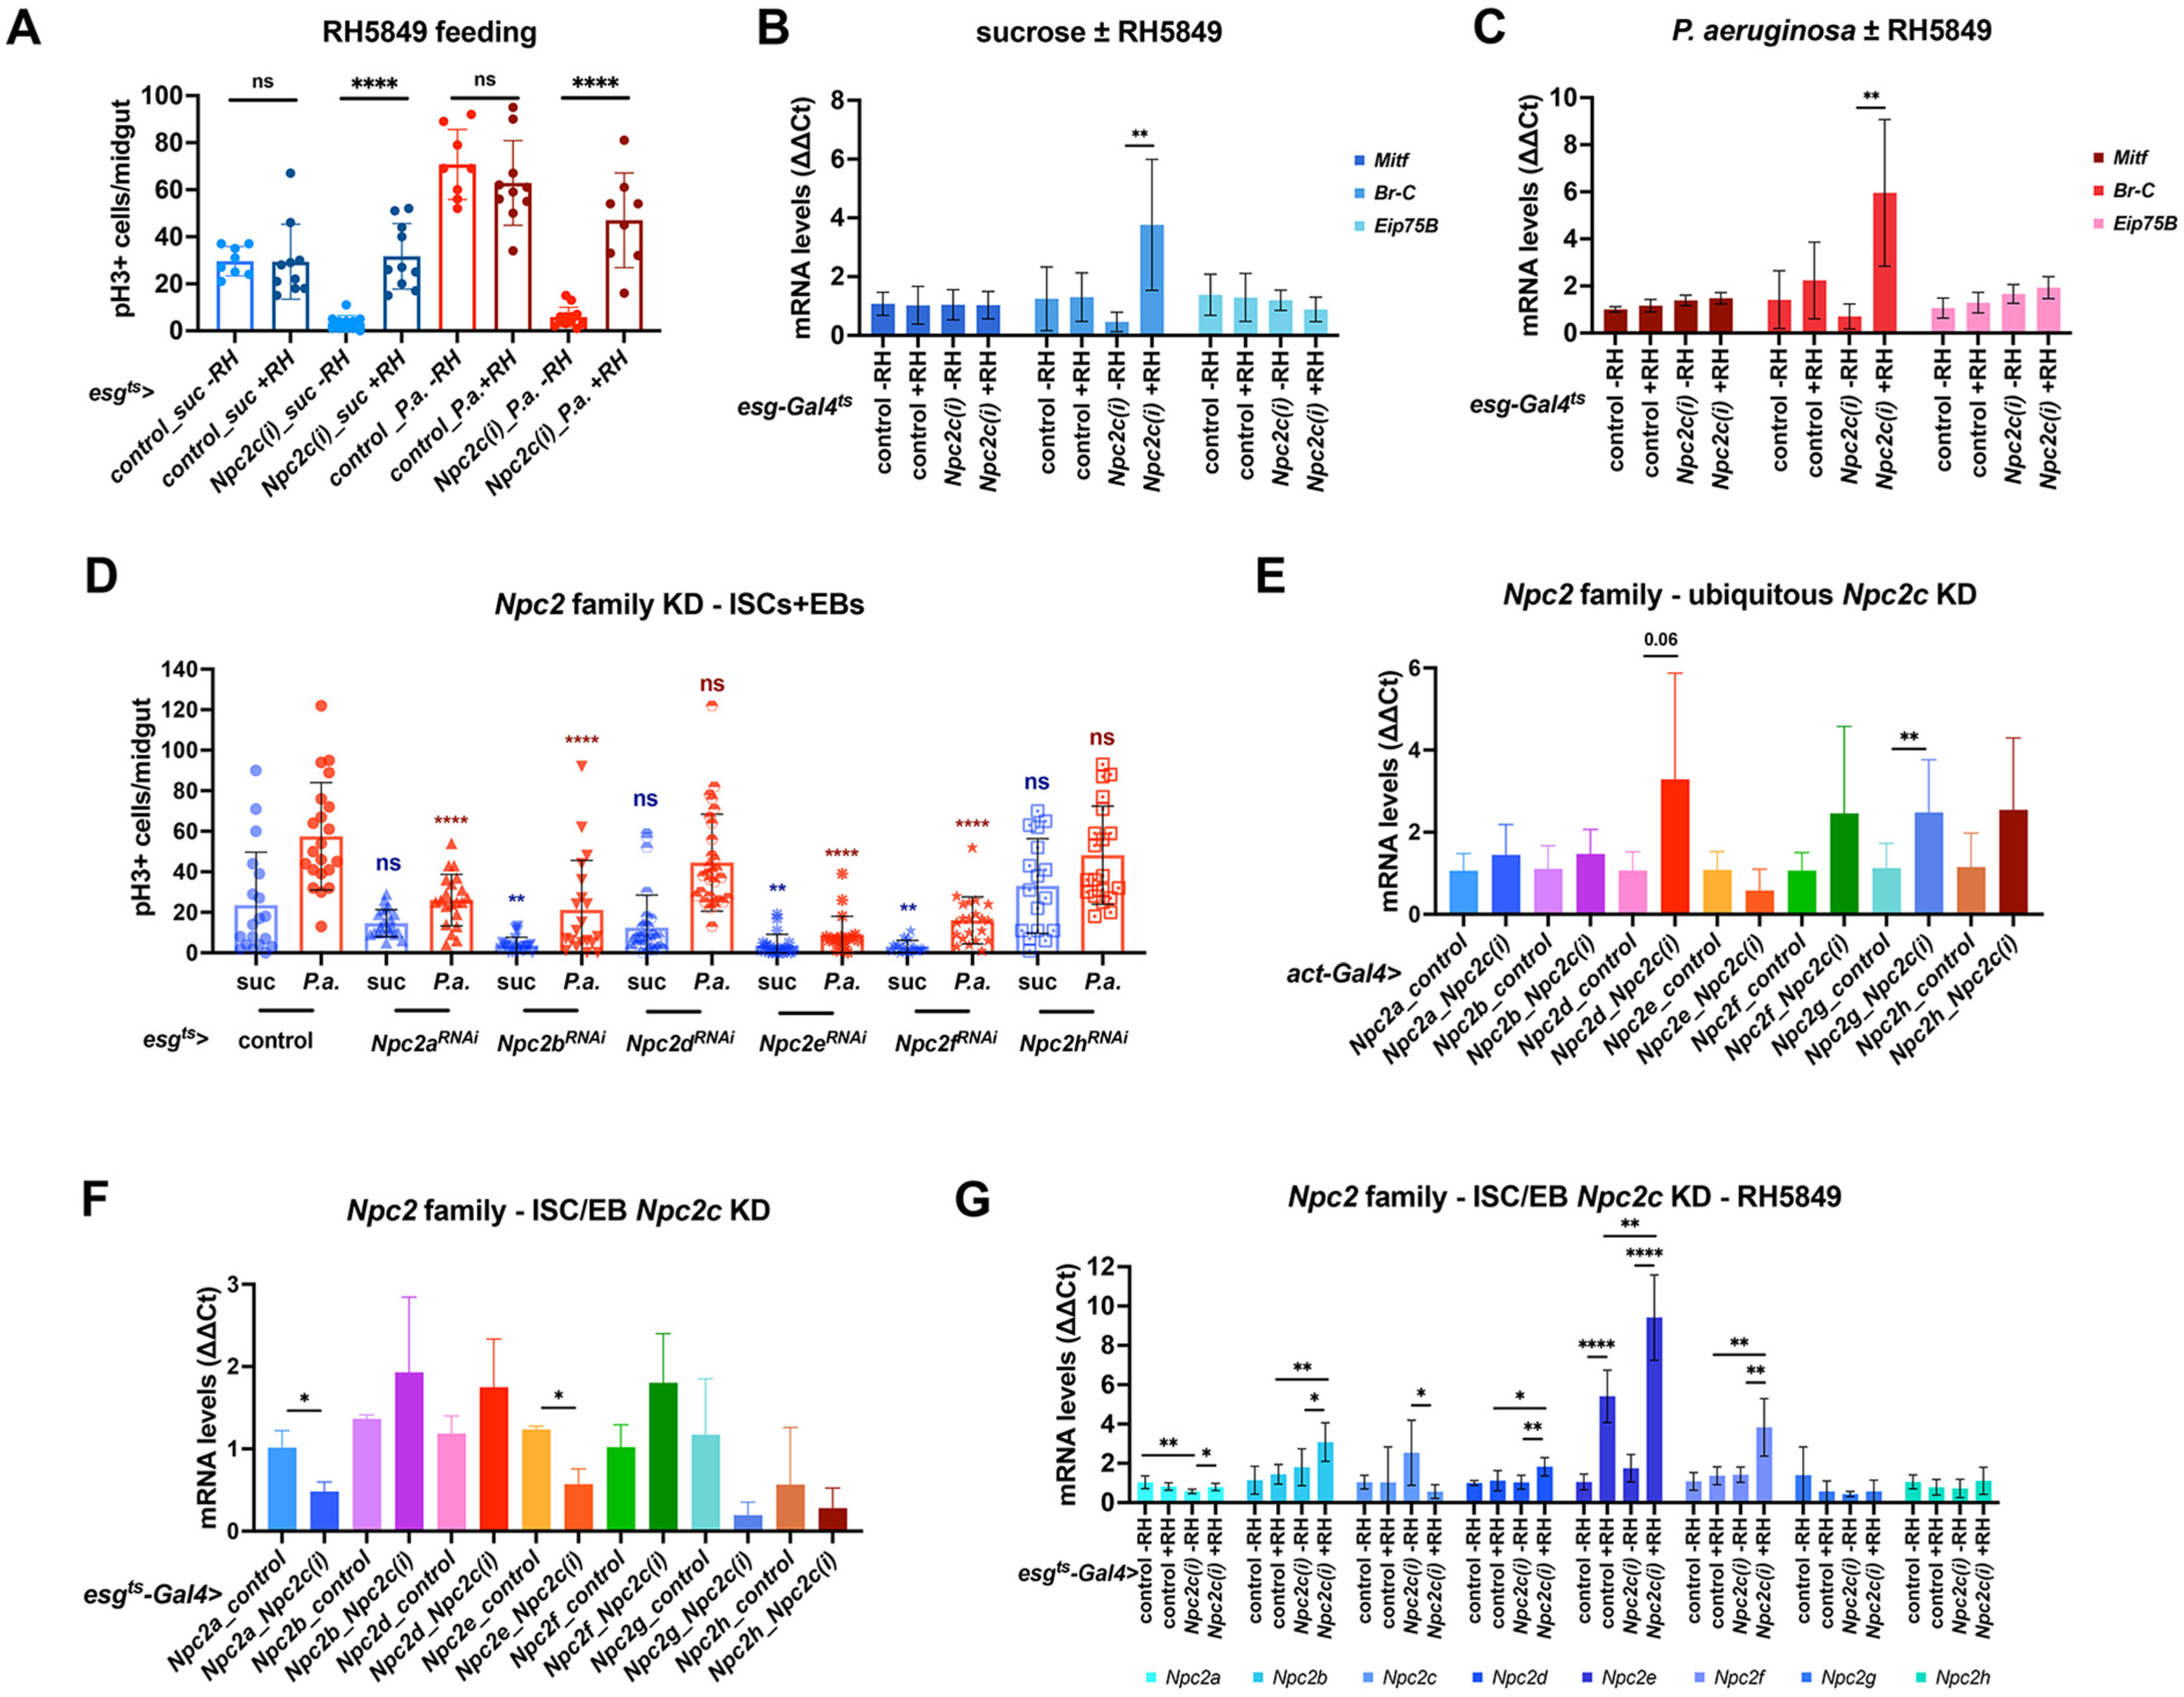
3.4. ISC-Specific Npc2c Silencing Impairs Cholesterol Trafficking and Controls Ecdysone Signaling

Previous gene expression studies support a specific role of the posterior midgut in lipogenesis and the processing of specific lipids, including sphingolipids and cholesterol [13,61,71]. Importantly, Npc2c together with the gene encoding the cholesterol acyltransferase (ACAT) were found to be selectively expressed in the posterior midgut [13]. To assess whether Npc2c controls cholesterol accumulation, we stained control and Npc2c-deficient midguts with Filipin. Filipin labels non-esterified sterols and is commonly used to study sterol accumulation in mammalian cells, but has also been used to assess Npc1a mutants in Drosophila [21,72]. We found aberrant accumulation of free cholesterol in both uninfected (Figure 6A,C) and P.a.-infected midguts (Figure 6B,D) upon ISC-specific Npc2c knockdown (Figure 6A–E). This result underscores a critical role of Npc2c in intestinal sterol distribution.
Sterol transport to the ER/mitochondria controls synthesis of 20E, larval molting and metamorphosis [73]. In addition, ovary-produced 20E activates the Ecdysone receptor (EcR) signaling cascade in the neighboring posterior midgut ISCs, which, in turn, promotes Ecdysone-induced-protein-75B (Eip75B)-mediated EB to EC differentiation [31]. Here, we tried to rescue the mitosis impairment of Npc2-deficient progenitors by supplementing the fly diet either with 250 ug/mL cholesterol or with 0.008 mg/g 20E. We found that cholesterol did not rescue mitosis (Figure S3A), probably because Npc2c deficiency impaired its trafficking. Also, we found that 20E administration could not rescue mitosis (Figure S3B). Since 20E is easily metabolized and cleared by the gut, we switched to the non-steroidal EcR agonist RH5849, which is highly stable, specific and has higher efficacy compared to 20E [31,74,75]. Indeed, supplementation of the fly diet with RH5849 at 50 ug/mL fully rescued the mitosis impairment caused by Npc2c silencing, reflected by ~10- and ~9-fold increase in the mitotic index of Npc2c-deficient flies in uninfected and P.a.-infected midguts, respectively (Figure 7A). Binding of 20E to EcR triggers the activation of a small set of primary response genes, many of which encode transcription factors [76]. To understand how Npc2c impinges on 20E signaling to control ISC activity, we assessed the expression of two known EcR targets: the transcription factor Broad (Br) and the nuclear receptor and PPARγ-homologue, Eip75B, upon progenitor-specific Npc2c silencing in the presence or absence of infection, with or without RH5849 supplementation. We also assessed expression of the Drosophila ortholog PPARγ-dependent Transcription Factor EB (TFEB), Mitf, which, like TFEB [77], is involved in the lysosomal–autophagy pathway [78]. In both uninfected and P.a.-infected Npc2c-silenced midguts, Br, but not Eip75B or Mitf, was significantly reduced, and its expression was significantly increased upon supplementation with RH5849 (Figure 7B,C). However, in uninfected flies, the expression levels of Eip75B and Mitf remained unchanged upon Npc2c silencing and the supplementation of RH5849 (Figure 7B); P.a. infection showed tentatively lower expression in untreated Npc2c-silenced midguts, which was increased upon RH5849 supplementation (Figure 7C). Overall, these results highlight that Npc2c-transported sterol controls the EcR pathway, which, through its effector Br, regulates ISC mitosis by acting downstream or in parallel to Npc2c.

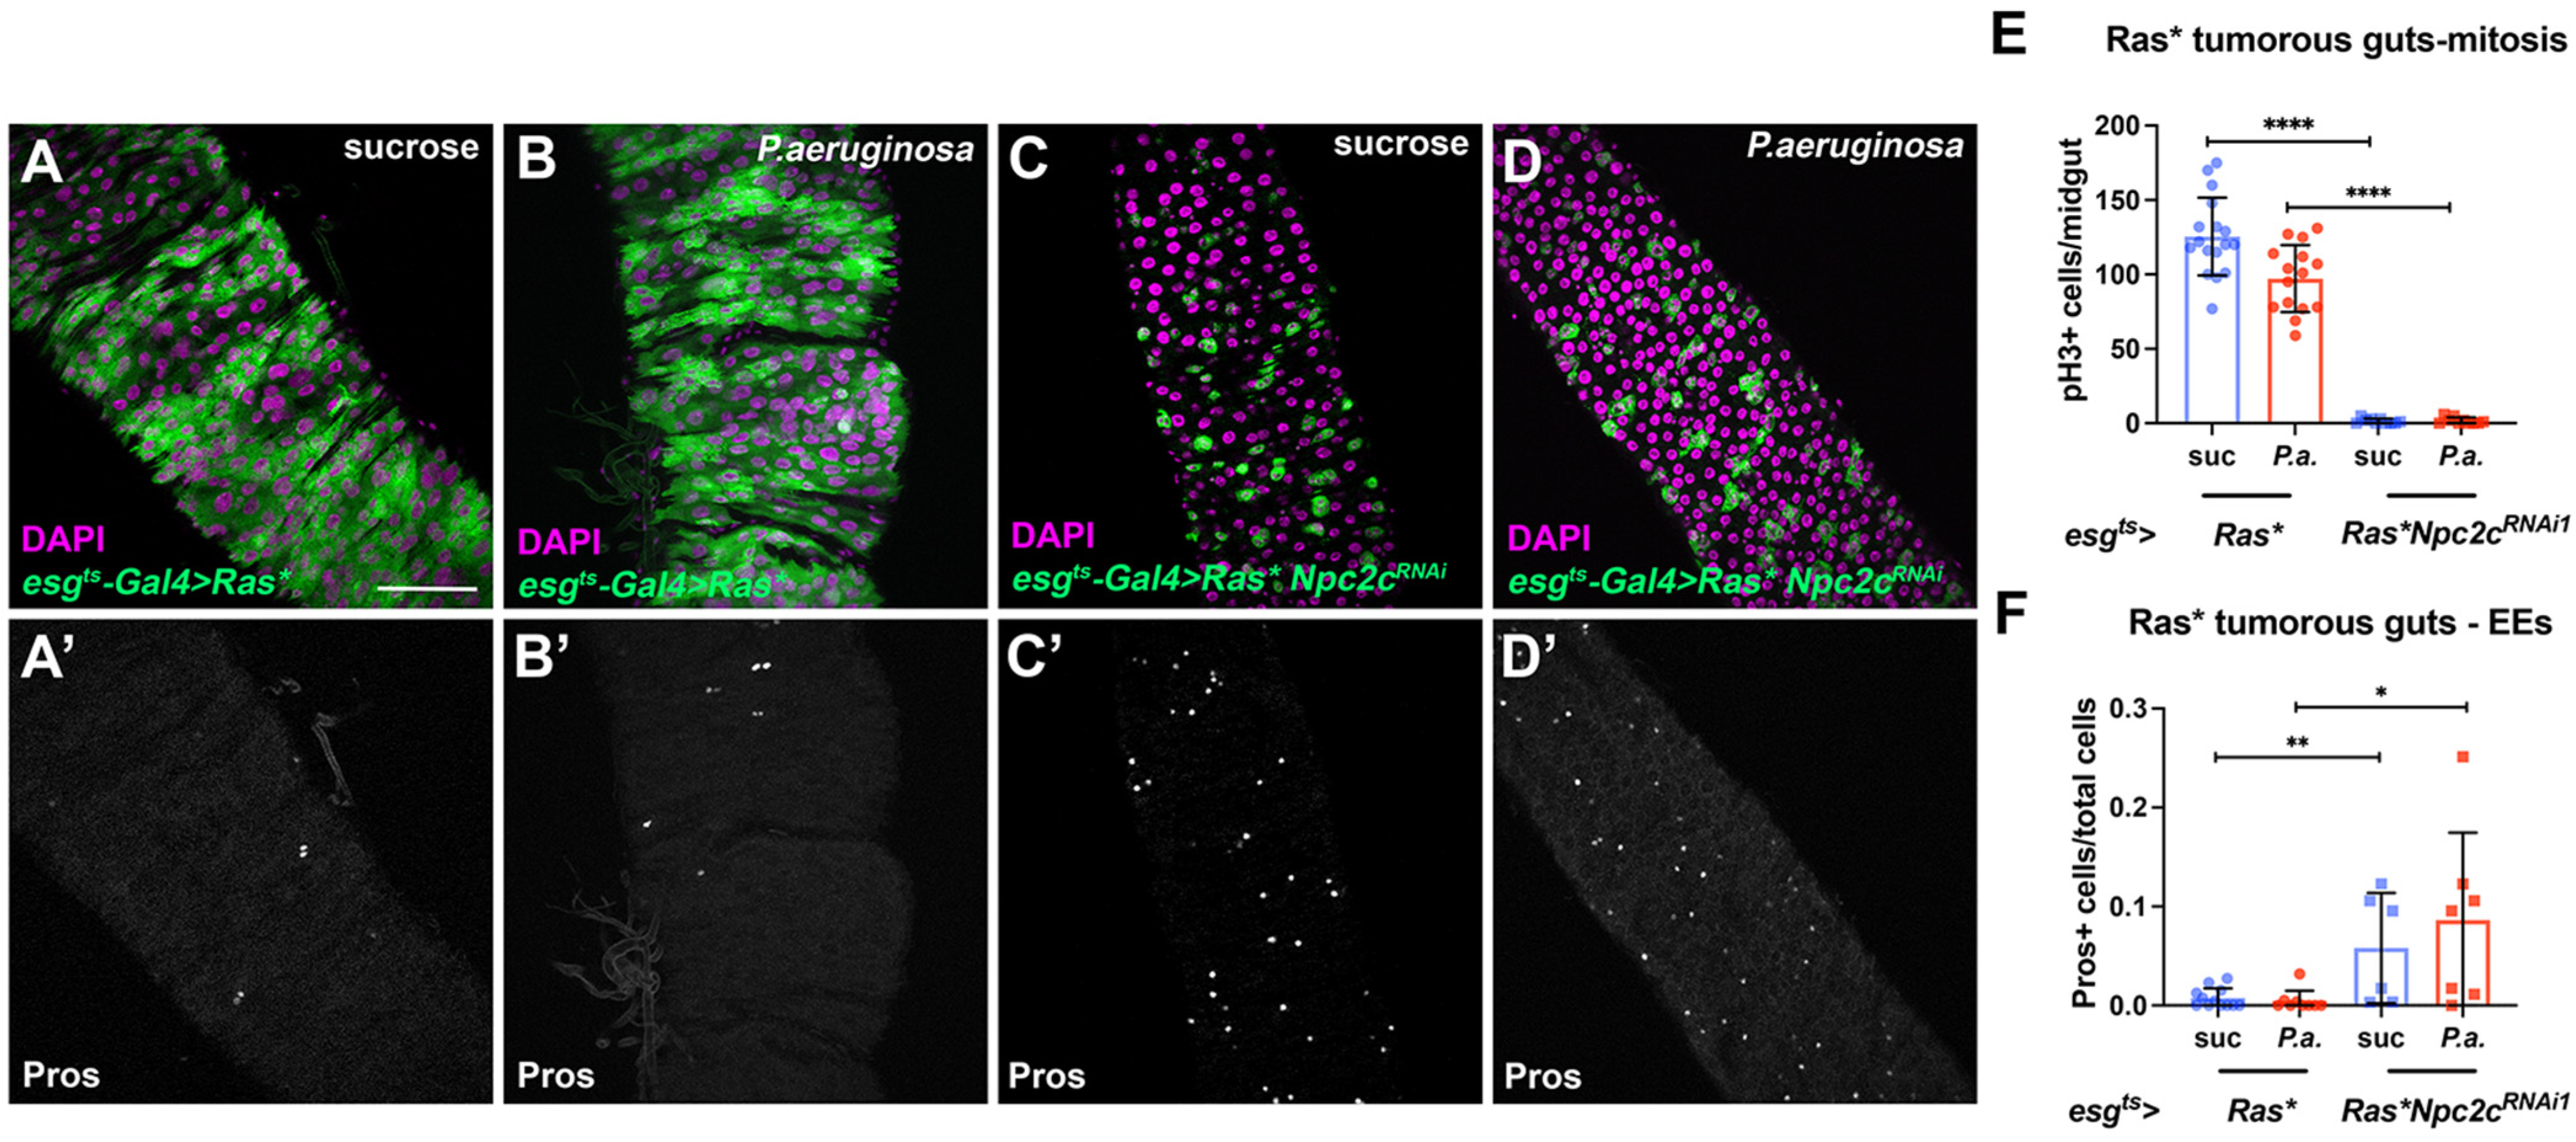
3.5. Additional Npc2 Family Genes Control Intestinal Mitosis

Interestingly, another member of the Npc2 family, Npc2b, was previously shown to transport sterol in the midgut and its ISC-specific silencing significantly reduced EEs [13], a phenotype reminiscent of Npc2c silencing. To examine whether Npc2b and other Npc2 family members act similarly to Npc2c in intestinal progenitors, we specifically silenced Npc2a, -b, -d, -e, -f, -h (an RNAi line for Npc2g was not available) in adult midgut progenitors using esgts-Gal4 and we quantified mitosis in uninfected and P.a.-infected conditions. We found that Npc2b, -e, -f knockdown significantly decreased mitosis in uninfected and P.a.-infected midguts, whereas Npc2a silencing only mildly reduced mitosis in P.a.-infected midguts (Figure 7D). On the contrary, Npc2d and Npc2h silenced midguts exhibited no difference in mitosis (Figure 7D). Since Npc2 family genes exhibit broad and specific expression patterns, but their expression might be cross-regulated, we decided to assess the expression of Npc2 genes in animals with ubiquitous downregulation of Npc2c. We found that ubiquitous Npc2c silencing in larvae induced the expression of Npc2d, -f, -g and -h (Figure 7E). This phenotype indicates strong redundancy between Npc2c and other Npc2 family members. To assess whether this is also true in the adult intestine, where the expression of Npc2 genes varies in different cell types and upon infection challenge (Figure S1), we performed RT-qPCR of control and ISC/EB-specific Npc2c-silenced adult midguts in uninfected conditions. We found that the levels of Npc2a and Npc2e mRNA were significantly downregulated upon progenitor-specific Npc2c silencing (Figure 7F).
To further characterize how Npc2 family members correlate to Npc2c and the 20E pathway, we assessed their expression upon RH5849 supplementation in the absence of bacterial infection. In the absence of the chemical, we observed similar results as those described previously (Figure 7F), with the exception of the Npc2e expression, which behaved opposite upon Npc2c-silencing. In uninfected conditions, administration of RH5849 strikingly induced Npc2e expression in control flies, whereas RH5849 significantly increased the expression of Npc2b, Npc2e and Npc2f in Npc2c-silenced flies compared to mock control. Npc2f appeared to be significantly overexpressed in both mock and drug-administered flies (Figure 7E). Conclusively, these results indicate that not only Npc2c expression, but also other Npc2 genes, which might act synergistically, are also regulated by the ecdysone pathway.

4. Discussion

NPCs are intracellular sterol-binding and sterol-transporting proteins, with Npc1 encompassing a transmembrane domain unlike Npc2 [79]. Specifically, human Npc2 localizes in puncta that co-stain with the lysosomal marker cathepsin D and the late lysosomal/endosomal marker Lamp-1 in cultured fibroblasts [80]. We found that Drosophila Npc2c staining is also punctate, but unlike its human counterpart, it does not colocalize with the Lamp-1 marker in midgut progenitors (Figure 1A). Intriguingly, Npc2e, the closest fly paralogue to Npc2c, encodes a secreted protein with the ability to bind bacterial components and activate AMPs upon overexpression in S2 cells [48]. This raises the question whether the midgut Npc2c puncta correspond to extracellular accumulations. Future experiments will resolve the precise cellular localization of Npc2c.
To investigate whether silencing of Npc2c might affect expression of the other seven Npc2 family members, we ubiquitously downregulated Npc2c in larvae and found that most Npc2 mRNAs (except Npc2e) tend to increase, with Npc2g increasing most significantly (Figure 7E). The Npc2c-silenced larvae develop into adults, indicating that Npc2c is not necessary for development and this may be due to possible redundancy between Npc2c and other Npc2′s. Interestingly, ISC/EB-specific Npc2c knockdown does not broadly induce Npc2 gene expression. In fact, we observe significant reduction of Npc2a and Npc2e in the adult midgut. Given that ISC/EB-specific silencing of several Npc2 genes reduces ISC mitosis, the observed effects on mRNA expression indicate potential cross regulation. It is worth noting that ISC/EB-Npc2e silencing phenocopies Npc2c loss and eliminates midgut mitosis in both uninfected and P.a.-infected conditions (Figure 7D). Our results also underscore the role of Npc2c in midgut sterol availability and subsequent ecdysone action. We found that administration of the ecdysone agonist RH5849 rescues the mitosis impairment caused by the ISC/EB-specific Npc2c silencing, potentially through expression of the Br transcription factor (Figure 7A–C). Interestingly, we also found that RH5849 directly induces Npc2e in wild-type midguts, and this is enhanced in ISC/EB Npc2c-silenced midguts. Simultaneously, Npc2a appears to be downregulated in Npc2c-silenced flies treated with vehicle, and its expression is rescued by RH5849 administration (Figure 7E). Given that Npc2a is also necessary for midgut mitosis upon P.a. infection, it seems that 20E signaling mediates Npc2c action in the midgut. Nevertheless, the interplay of fly Npc2 genes remains unclear. It is likely that different cholesterol substrates may be able to bind Npc2 proteins, contributing to homeostatic cholesterol metabolism. For example, the human Npc2 protein exists in different glycoforms that bind different sterols, such as cholesterol, oxysterols, and plant sterols [81]. However, it is not yet known whether the fly Npc2 protein repertoire is so broad to mimic the different glycoforms observed in humans, or to bind specific kinds of sterols more than others.
Since we silenced Npc2c in intestinal progenitors, we would not expect an effect on the production of 20E, which occurs in the ovaries of mated flies [31]. This is evident by the unchanged expression of Eip75B, which is a canonical early 20E target gene [82], in control and experimental flies. It is therefore a mystery why Br is downregulated upon Npc2c silencing in the midgut progenitors while it is upregulated via the administration of the 20E agonist RH5849. A possible explanation could be that without the drug, progenitor numbers decrease in Npc2c-silenced flies (Figure 3C,F). According to FlyGutSeq [61], Br is expressed more in ISCs and less in EBs at basal conditions, while its expression in EBs goes up by 27.5-fold upon P. entomophila infection. The loss of progenitors in our experimental flies could therefore explain the reduction of Br. The rescue of mitosis, and as such the integrity of ISCs, may explain the restoration of Br levels. However, we cannot rule out possible modifications in its expression by cholesterol trafficking. More research is needed to decipher the role of cholesterol intracellular transport in modifying the expression of Br and elucidate the relationship between Br and the fly Npc2 genes. This could help us understand the axis of steroid availability, cholesterol metabolism, and cellular membrane integrity, and its roles in cellular division.
Understanding the role of cholesterol in cellular division is important not only in degenerative diseases such as Neimann–Pick type-C disease, but also in the context of cancer. Cholesterol has been shown to contribute to cancer growth through the phosphoinositide-3 kinase (PI3K)/protein kinase B (AKT) pathway [83]. Lovastatin, an inhibitor of the rate-limiting cholesterol synthesis enzyme 3-hydroxy-3-methyl-glutaryl-CoA (HMG-CoA) reductase, downregulates PI3K, AKT, and mammalian target of rapamycin (mTOR) in colorectal cancer cells via a phosphatase and tensin homologue (PTEN)- and bone morphogenetic protein (BMP)-dependent manner [84]. A small pilot study shows that Simvastatin administration recapitulates the downregulation of phosphorylated mTOR and induces a tentative increase in BMP in colorectal cancer patients [84]. Furthermore, an analysis of 999 colorectal cancer patients shows reduced death incidence for patients taking statins, which benefits more the patients who have tumors with intact BMP signaling [85]. Although a meta-analysis shows statins to be effective in preventing and treating colorectal cancer [86], patients with previously treated metastatic disease do not appear to benefit from a combinatorial regimen of chemotherapy and statins [87]. Here, we show that targeting cholesterol trafficking is an effective way of blocking mitosis in transformed RasV12 cells (Figure 4) as well as healthy progenitors in the fly midgut (Figure 2A,B), revealing an attractive avenue of future research for intestinal cancer treatment. Despite previous research showing that Npc genes are not associated with Alzheimer’s disease (AD) [88], efforts to target cholesterol trafficking as anti-cancer therapy will have to consider possible wide-spread effects not only in ISCs, but also in the brain, since cholesterol metabolism deregulation and cholesterol penetration through a disrupted blood–brain barrier has been suggested to contribute to AD [89,90], a mechanism which could hypothetically be implicated in Parkinson’s disease as well [90,91]. In addition, any interventions involving the Npc genes will also have to consider the neurodegenerative effects observed in Niemann–Pick Type C disease [38].
Finally, it is becoming clear that impairment of cholesterol trafficking in the intestine can lead to microbiome alterations. For example, intestinal dysbiosis has been shown in Npc1 mutant Balb/c mice, exhibiting increased proteobacteria and cyanobacteria [92]. Our results agree with the role of Npc genes in maintaining a normal gut microbiome, as we also observed an increase in proteobacteria upon Npc2c silencing (Figure 5H–K). Interestingly, proteobacteria have been associated with human disease [93]. The upregulation of the AMP AttA (Figure 4) in Npc2c-silenced midguts indicates the presence of a pathogenic organism and lets us speculate that the increase in gamma-proteobacteria may be a sign of pathogenicity. Since it has been shown that Npc2a and Npc2e activate the AMP DptA when stimulated with PGs [48], it would be interesting to investigate if fly Npc2 genes are also responsible for the upregulation of AttA. Additional work is also needed to establish whether the observed microbiome changes are due to loss of progenitor mitosis, aggregation of sterols, or a combination of the two events. It is also unknown whether the disruption of cholesterol trafficking in the Drosophila midgut progenitors and sterol aggregation, or the loss of progenitor cells directly give a competitive advantage to proteobacteria or whether the observed impairments result in the death of the lost microbiota.
In conclusion, we found that Npc2c loss in ISCs/EBs results in reduced ISC mitosis, impaired cholesterol metabolism, and dysbiosis in Drosophila. Mitosis can be rescued by administration of the non-steroidal ecdysone agonist RH5849, which results in overexpression of certain Drosophila Npc2 family genes. Our results highlight the importance of Npc2c for ISC-mediated intestinal homeostasis, and more specifically the necessity of intact cholesterol metabolism in ISCs for effective tissue regeneration. Furthermore, our results indicate redundant roles between Drosophila Npc2 genes.

Supplementary Materials

The following supporting information can be downloaded at https://0-www-mdpi-com.brum.beds.ac.uk/article/10.3390/metabo13101084/s1. Table S1: Key Resources Table; Table S2: List of primer sequences; Table S3: qPCR amplification program; Table S4: 16S colony PCR amplification program; Figure S1: Npc2 gene family expression in adult midguts; Figure S2: Progenitor-specific Npc2c silencing reduces mitosis effectively, but it does not cause apoptosis; Figure S3: Supplementation of the diet with cholesterol or 20E does not rescue reduced mitosis caused by Npc2c silencing.

Author Contributions

C.N. and E.S. designed and performed experiments, and analyzed data. C.P. conceived the project, designed experiments, and supervised the work. C.N. complied the data and wrote the manuscript with E.S. and C.P. All authors have read and agreed to the published version of the manuscript.

Funding

This work was co-funded by the European Regional Development Fund and the Republic of Cyprus through the Research and Innovation Foundation Project: EXCELLENCE/0918/0082 to C.P. The APC was funded by the University of Cyprus.

Institutional Review Board Statement

Not applicable.

Informed Consent Statement

Not applicable.

Data Availability Statement

The authors declare that the data supporting the findings of this study are available within the paper and its supplementary information files.

Acknowledgments

The authors would like to thank the BDSC, the VDRC, and the TRiP for fly stocks, the Developmental Studies Hybridoma Bank (DSHB) for antibodies, and members of the Pitsouli and Apidianakis laboratories for feedback on the project.

Conflicts of Interest

The authors declare no conflict of interest.

References

  1. Heiden, M.G.V.; Lunt, S.Y.; Dayton, T.L.; Fiske, B.P.; Israelsen, W.J.; Mattaini, K.R.; Vokes, N.I.; Stephanopoulos, G.; Cantley, L.C.; Metallo, C.M.; et al. Metabolic pathway alterations that support cell proliferation. Cold Spring Harb. Symp. Quant. Biol. 2011, 76, 325–334. [Google Scholar] [CrossRef] [PubMed]
  2. Miller, W.L.; Auchus, R.J. The molecular biology, biochemistry, and physiology of human steroidogenesis and its disorders. Endocr. Rev. 2011, 32, 81–151. [Google Scholar] [CrossRef]
  3. Yang, S.T.; Kreutzberger, A.J.B.; Lee, J.; Kiessling, V.; Tamm, L.K. The role of cholesterol in membrane fusion. Chem. Phys. Lipids 2016, 199, 136–143. [Google Scholar] [CrossRef] [PubMed]
  4. Jefcoate, C.R.; Lee, J. Cholesterol signaling in single cells: Lessons from STAR and sm-FISH. J. Mol. Endocrinol. 2018, 60, R213–R235. [Google Scholar] [CrossRef] [PubMed]
  5. Yu, H.; Patel, S.B. Recent insights into the Smith-Lemli-Opitz syndrome. Clin. Genet. 2005, 68, 383–391. [Google Scholar] [CrossRef]
  6. Jung, E.; Kong, S.Y.; Ro, Y.S.; Ryu, H.H.; Shin, S.D. Serum Cholesterol Levels and Risk of Cardiovascular Death: A Systematic Review and a Dose-Response Meta-Analysis of Prospective Cohort Studies. Int. J. Environ. Res. Public Health 2022, 19, 8272. [Google Scholar] [CrossRef]
  7. Klop, B.; Elte, J.W.; Cabezas, M.C. Dyslipidemia in obesity: Mechanisms and potential targets. Nutrients 2013, 5, 1218–1240. [Google Scholar] [CrossRef]
  8. Holtzman, E.J.; Yaari, S.; Goldbourt, U. Serum cholesterol and the risk of colorectal cancer. N. Engl. J. Med. 1987, 317, 114. [Google Scholar] [CrossRef]
  9. Baek, A.E.; Nelson, E.R. The Contribution of Cholesterol and Its Metabolites to the Pathophysiology of Breast Cancer. Horm. Cancer 2016, 7, 219–228. [Google Scholar] [CrossRef]
  10. Ma, Y.; Yang, Y.; Wang, F.; Zhang, P.; Shi, C.; Zou, Y.; Qin, H. Obesity and risk of colorectal cancer: A systematic review of prospective studies. PLoS ONE 2013, 8, e53916. [Google Scholar] [CrossRef]
  11. Neophytou, C.; Pitsouli, C. How Gut Microbes Nurture Intestinal Stem Cells: A Drosophila Perspective. Metabolites 2022, 12, 169. [Google Scholar] [CrossRef] [PubMed]
  12. Wang, B.; Rong, X.; Palladino, E.N.D.; Wang, J.; Fogelman, A.M.; Martín, M.G.; Alrefai, W.A.; Ford, D.A.; Tontonoz, P. Phospholipid Remodeling and Cholesterol Availability Regulate Intestinal Stemness and Tumorigenesis. Cell Stem Cell 2018, 22, 206–220.e4. [Google Scholar] [CrossRef] [PubMed]
  13. Obniski, R.; Sieber, M.; Spradling, A.C. Dietary Lipids Modulate Notch Signaling and Influence Adult Intestinal Development and Metabolism in Drosophila. Dev. Cell 2018, 47, 98–111.e5. [Google Scholar] [CrossRef] [PubMed]
  14. Brown, M.S.; Goldstein, J.L. A Receptor-Mediated Pathway for Cholesterol Homeostasis (Nobel Lecture). Angew. Chem. Int. Ed. Engl. 1986, 25, 583–602. [Google Scholar] [CrossRef]
  15. Clark, A.J.; Bloch, K. The Absence of Sterol Synthesis in Insects. J. Biol. Chem. 1959, 234, 2578–2582. [Google Scholar] [CrossRef]
  16. Van Hoof, D.; Rodenburg, K.W.; Van der Horst, D.J. Receptor-mediated endocytosis and intracellular trafficking of lipoproteins and transferrin in insect cells. Insect Biochem. Mol. Biol. 2005, 35, 117–128. [Google Scholar] [CrossRef]
  17. Horner, M.A.; Pardee, K.; Liu, S.; King-Jones, K.; Lajoie, G.; Edwards, A.; Krause, H.M.; Thummel, C.S. The Drosophila DHR96 nuclear receptor binds cholesterol and regulates cholesterol homeostasis. Genes. Dev. 2009, 23, 2711–2716. [Google Scholar] [CrossRef]
  18. Huang, X.; Warren, J.T.; Buchanan, J.; Gilbert, L.I.; Scott, M.P. Drosophila Niemann-Pick Type C-2 genes control sterol homeostasis and steroid biosynthesis: A model of human neurodegenerative disease. Development 2007, 134, 3733–3742. [Google Scholar] [CrossRef]
  19. Niwa, R.; Niwa, Y.S. The Fruit Fly Drosophila melanogaster as a Model System to Study Cholesterol Metabolism and Homeostasis. Cholesterol 2011, 2011, 176802. [Google Scholar] [CrossRef]
  20. Bujold, M.; Gopalakrishnan, A.; Nally, E.; King-Jones, K. Nuclear receptor DHR96 acts as a sentinel for low cholesterol concentrations in Drosophila melanogaster. Mol. Cell Biol. 2010, 30, 793–805. [Google Scholar] [CrossRef]
  21. Huang, X.; Suyama, K.; Buchanan, J.; Zhu, A.J.; Scott, M.P. A Drosophila model of the Niemann-Pick type C lysosome storage disease: dnpc1a is required for molting and sterol homeostasis. Development 2005, 132, 5115–5124. [Google Scholar] [CrossRef]
  22. Brown, M.S.; Goldstein, J.L. The SREBP pathway: Regulation of cholesterol metabolism by proteolysis of a membrane-bound transcription factor. Cell 1997, 89, 331–340. [Google Scholar] [CrossRef]
  23. Kalaany, N.Y.; Mangelsdorf, D.J. LXRS and FXR: The yin and yang of cholesterol and fat metabolism. Annu. Rev. Physiol. 2006, 68, 159–191. [Google Scholar] [CrossRef] [PubMed]
  24. Seegmiller, A.C.; Dobrosotskaya, I.; Goldstein, J.L.; Ho, Y.K.; Brown, M.S.; Rawson, R.B. The SREBP Pathway in Drosophila: Regulation by Palmitate, Not Sterols. Dev. Cell 2002, 2, 229–238. [Google Scholar] [CrossRef] [PubMed]
  25. Bonneton, F.; Laudet, V. 6—Evolution of Nuclear Receptors in Insects. In Insect Endocrinology; Gilbert, L.I., Ed.; Academic Press: San Diego, CA, USA, 2012; pp. 219–252. [Google Scholar]
  26. Riddiford, L.M.; Cherbas, P.; Truman, J.W. Ecdysone receptors and their biological actions. Vitam. Horm. 2000, 60, 1–73. [Google Scholar] [CrossRef]
  27. Petryk, A.; Warren, J.T.; Marqués, G.; Jarcho, M.P.; Gilbert, L.I.; Kahler, J.; Parvy, J.P.; Li, Y.; Dauphin-Villemant, C.; O’Connor, M.B. Shade is the Drosophila P450 enzyme that mediates the hydroxylation of ecdysone to the steroid insect molting hormone 20-hydroxyecdysone. Proc. Natl. Acad. Sci. USA 2003, 100, 13773–13778. [Google Scholar] [CrossRef] [PubMed]
  28. Simon, A.F.; Shih, C.; Mack, A.; Benzer, S. Steroid control of longevity in Drosophila melanogaster. Science 2003, 299, 1407–1410. [Google Scholar] [CrossRef]
  29. Tricoire, H.; Battisti, V.; Trannoy, S.; Lasbleiz, C.; Pret, A.M.; Monnier, V. The steroid hormone receptor EcR finely modulates Drosophila lifespan during adulthood in a sex-specific manner. Mech. Ageing Dev. 2009, 130, 547–552. [Google Scholar] [CrossRef]
  30. Ahmed, S.M.H.; Maldera, J.A.; Krunic, D.; Paiva-Silva, G.O.; Pénalva, C.; Teleman, A.A.; Edgar, B.A. Fitness trade-offs incurred by ovary-to-gut steroid signalling in Drosophila. Nature 2020, 584, 415–419. [Google Scholar] [CrossRef]
  31. Zipper, L.; Jassmann, D.; Burgmer, S.; Görlich, B.; Reiff, T. Ecdysone steroid hormone remote controls intestinal stem cell fate decisions via the PPARγ-homolog Eip75B in Drosophila. eLife 2020, 9, e55795. [Google Scholar] [CrossRef]
  32. Miguel-Aliaga, I.; Jasper, H.; Lemaitre, B. Anatomy and Physiology of the Digestive Tract of Drosophila melanogaster. Genetics 2018, 210, 357–396. [Google Scholar] [CrossRef] [PubMed]
  33. Reiff, T.; Jacobson, J.; Cognigni, P.; Antonello, Z.; Ballesta, E.; Tan, K.J.; Yew, J.Y.; Dominguez, M.; Miguel-Aliaga, I. Endocrine remodelling of the adult intestine sustains reproduction in Drosophila. eLife 2015, 4, e06930. [Google Scholar] [CrossRef] [PubMed]
  34. Marvin, K.A.; Reinking, J.L.; Lee, A.J.; Pardee, K.; Krause, H.M.; Burstyn, J.N. Nuclear receptors homo sapiens Rev-erbbeta and Drosophila melanogaster E75 are thiolate-ligated heme proteins which undergo redox-mediated ligand switching and bind CO and NO. Biochemistry 2009, 48, 7056–7071. [Google Scholar] [CrossRef] [PubMed]
  35. King-Jones, K.; Thummel, C.S. Nuclear receptors—A perspective from Drosophila. Nat. Rev. Genet. 2005, 6, 311–323. [Google Scholar] [CrossRef] [PubMed]
  36. Carstea, E.D.; Morris, J.A.; Coleman, K.G.; Loftus, S.K.; Zhang, D.; Cummings, C.; Gu, J.; Rosenfeld, M.A.; Pavan, W.J.; Krizman, D.B.; et al. Niemann-Pick C1 Disease Gene: Homology to Mediators of Cholesterol Homeostasis. Science 1997, 277, 228–231. [Google Scholar] [CrossRef] [PubMed]
  37. Vanier, M.T. Niemann-Pick disease type C. Orphanet J. Rare Dis. 2010, 5, 16. [Google Scholar] [CrossRef]
  38. Hammond, N.; Munkacsi, A.B.; Sturley, S.L. The complexity of a monogenic neurodegenerative disease: More than two decades of therapeutic driven research into Niemann-Pick type C disease. Biochim. Biophys. Acta (BBA)—Mol. Cell Biol. Lipids 2019, 1864, 1109–1123. [Google Scholar] [CrossRef]
  39. Nganso, B.T.; Mani, K.; Eliash, N.; Rafaeli, A.; Soroker, V. Towards disrupting Varroa–honey bee chemosensing: A focus on a Niemann-Pick type C2 transcript. Insect Mol. Biol. 2021, 30, 519–531. [Google Scholar] [CrossRef]
  40. Mani, K.; Nganso, B.T.; Rodin, P.; Otmy, A.; Rafaeli, A.; Soroker, V. Effects of Niemann-Pick type C2 (NPC2) gene transcripts silencing on behavior of Varroa destructor and molecular changes in the putative olfactory gene networks. Insect Biochem. Mol. Biol. 2022, 148, 103817. [Google Scholar] [CrossRef]
  41. Hovakimyan, M.; Meyer, A.; Lukas, J.; Luo, J.; Gudziol, V.; Hummel, T.; Rolfs, A.; Wree, A.; Witt, M. Olfactory deficits in Niemann-Pick type C1 (NPC1) disease. PLOS ONE 2013, 8, e82216. [Google Scholar] [CrossRef]
  42. Neufeld, E.B.; Wastney, M.; Patel, S.; Suresh, S.; Cooney, A.M.; Dwyer, N.K.; Roff, C.F.; Ohno, K.; Morris, J.A.; Carstea, E.D.; et al. The Niemann-Pick C1 Protein Resides in a Vesicular Compartment Linked to Retrograde Transport of Multiple Lysosomal Cargo. J. Biol. Chem. 1999, 274, 9627–9635. [Google Scholar] [CrossRef] [PubMed]
  43. Xu, Z.; Farver, W.; Kodukula, S.; Storch, J. Regulation of sterol transport between membranes and NPC2. Biochemistry 2008, 47, 11134–11143. [Google Scholar] [CrossRef] [PubMed]
  44. Huang, X.; Warren, J.T.; Gilbert, L.I. New players in the regulation of ecdysone biosynthesis. J. Genet. Genom. 2008, 35, 1–10. [Google Scholar] [CrossRef] [PubMed]
  45. Fluegel, M.L.; Parker, T.J.; Pallanck, L.J. Mutations of a Drosophila NPC1 gene confer sterol and ecdysone metabolic defects. Genetics 2006, 172, 185–196. [Google Scholar] [CrossRef] [PubMed]
  46. Voght, S.P.; Fluegel, M.L.; Andrews, L.A.; Pallanck, L.J. Drosophila NPC1b Promotes an Early Step in Sterol Absorption from the Midgut Epithelium. Cell Metab. 2007, 5, 195–205. [Google Scholar] [CrossRef]
  47. Sieber, M.H.; Thummel, C.S. The DHR96 nuclear receptor controls triacylglycerol homeostasis in Drosophila. Cell Metab. 2009, 10, 481–490. [Google Scholar] [CrossRef]
  48. Shi, X.Z.; Zhong, X.; Yu, X.Q. Drosophila melanogaster NPC2 proteins bind bacterial cell wall components and may function in immune signal pathways. Insect Biochem. Mol. Biol. 2012, 42, 545–556. [Google Scholar] [CrossRef]
  49. Micchelli, C.A.; Perrimon, N. Evidence that stem cells reside in the adult Drosophila midgut epithelium. Nature 2006, 439, 475–479. [Google Scholar] [CrossRef]
  50. Zeng, X.; Hou, S.X. Enteroendocrine cells are generated from stem cells through a distinct progenitor in the adult Drosophila posterior midgut. Development 2015, 142, 644–653. [Google Scholar] [CrossRef]
  51. Tamamouna, V.; Panagi, M.; Theophanous, A.; Demosthenous, M.; Michail, M.; Papadopoulou, M.; Teloni, S.; Pitsouli, C.; Apidianakis, Y. Evidence of two types of balance between stem cell mitosis and enterocyte nucleus growth in the Drosophila midgut. Development 2020, 147, dev189472. [Google Scholar] [CrossRef]
  52. Apidianakis, Y.; Pitsouli, C.; Perrimon, N.; Rahme, L. Synergy between bacterial infection and genetic predisposition in intestinal dysplasia. Proc. Natl. Acad. Sci. USA 2009, 106, 20883–20888. [Google Scholar] [CrossRef] [PubMed]
  53. Neophytou, C.; Pitsouli, C. Biotin controls intestinal stem cell mitosis and host-microbiome interactions. Cell Rep. 2022, 38, 110505. [Google Scholar] [CrossRef] [PubMed]
  54. Pitsouli, C.; Delidakis, C. The interplay between DSL proteins and ubiquitin ligases in Notch signaling. Development 2005, 132, 4041–4050. [Google Scholar] [CrossRef]
  55. Brand, A.H.; Perrimon, N. Targeted gene expression as a means of altering cell fates and generating dominant phenotypes. Development 1993, 118, 401–415. [Google Scholar] [CrossRef]
  56. McGuire, S.E.; Mao, Z.; Davis, R.L. Spatiotemporal gene expression targeting with the TARGET and gene-switch systems in Drosophila. Sci. STKE 2004, 2004, pl6. [Google Scholar] [CrossRef] [PubMed]
  57. Lee, T.; Luo, L. Mosaic analysis with a repressible cell marker for studies of gene function in neuronal morphogenesis. Neuron 1999, 22, 451–461. [Google Scholar] [CrossRef]
  58. Apidianakis, Y.; Rahme, L.G. Drosophila melanogaster as a model host for studying Pseudomonas aeruginosa infection. Nat. Protoc. 2009, 4, 1285–1294. [Google Scholar] [CrossRef]
  59. Rera, M.; Clark, R.I.; Walker, D.W. Intestinal barrier dysfunction links metabolic and inflammatory markers of aging to death in Drosophila. Proc. Natl. Acad. Sci. USA 2012, 109, 21528–21533. [Google Scholar] [CrossRef]
  60. Leader, D.P.; Krause, S.A.; Pandit, A.; Davies, S.A.; Dow, J.A.T. FlyAtlas 2: A new version of the Drosophila melanogaster expression atlas with RNA-Seq, miRNA-Seq and sex-specific data. Nucleic Acids Res. 2017, 46, D809–D815. [Google Scholar] [CrossRef]
  61. Buchon, N.; Osman, D.; David, F.P.; Fang, H.Y.; Boquete, J.P.; Deplancke, B.; Lemaitre, B. Morphological and molecular characterization of adult midgut compartmentalization in Drosophila. Cell Rep. 2013, 3, 1725–1738. [Google Scholar] [CrossRef]
  62. Pulipparacharuvil, S.; Akbar, M.A.; Ray, S.; Sevrioukov, E.A.; Haberman, A.S.; Rohrer, J.; Krämer, H. Drosophila Vps16A is required for trafficking to lysosomes and biogenesis of pigment granules. J. Cell Sci. 2005, 118, 3663–3673. [Google Scholar] [CrossRef] [PubMed]
  63. Peifer, M.; Wieschaus, E. The segment polarity gene armadillo encodes a functionally modular protein that is the Drosophila homolog of human plakoglobin. Cell 1990, 63, 1167–1176. [Google Scholar] [CrossRef] [PubMed]
  64. de Navascués, J.; Perdigoto, C.N.; Bian, Y.; Schneider, M.H.; Bardin, A.J.; Martínez-Arias, A.; Simons, B.D. Drosophila midgut homeostasis involves neutral competition between symmetrically dividing intestinal stem cells. EMBO J. 2012, 31, 2473–2485. [Google Scholar] [CrossRef] [PubMed]
  65. Jin, Y.; Patel, P.H.; Kohlmaier, A.; Pavlovic, B.; Zhang, C.; Edgar, B.A. Intestinal Stem Cell Pool Regulation in Drosophila. Stem Cell Rep. 2017, 8, 1479–1487. [Google Scholar] [CrossRef] [PubMed]
  66. Ohlstein, B.; Spradling, A. The adult Drosophila posterior midgut is maintained by pluripotent stem cells. Nature 2006, 439, 470–474. [Google Scholar] [CrossRef] [PubMed]
  67. Tomasetti, C.; Li, L.; Vogelstein, B. Stem cell divisions, somatic mutations, cancer etiology, and cancer prevention. Science 2017, 355, 1330–1334. [Google Scholar] [CrossRef]
  68. Ohlstein, B.; Spradling, A. Multipotent Drosophila intestinal stem cells specify daughter cell fates by differential notch signaling. Science 2007, 315, 988–992. [Google Scholar] [CrossRef]
  69. Osman, D.; Buchon, N.; Chakrabarti, S.; Huang, Y.T.; Su, W.C.; Poidevin, M.; Tsai, Y.C.; Lemaitre, B. Autocrine and paracrine unpaired signaling regulate intestinal stem cell maintenance and division. J. Cell Sci. 2012, 125, 5944–5949. [Google Scholar] [CrossRef]
  70. Buonocore, F.; Fausto, A.M.; Della Pelle, G.; Roncevic, T.; Gerdol, M.; Picchietti, S. Attacins: A Promising Class of Insect Antimicrobial Peptides. Antibiotics 2021, 10, 212. [Google Scholar] [CrossRef]
  71. Marianes, A.; Spradling, A.C. Physiological and stem cell compartmentalization within the Drosophila midgut. ELife 2013, 2, e00886. [Google Scholar] [CrossRef]
  72. Louwette, S.; Régal, L.; Wittevrongel, C.; Thys, C.; Vandeweeghde, G.; Decuyper, E.; Leemans, P.; De Vos, R.; Van Geet, C.; Jaeken, J.; et al. NPC1 defect results in abnormal platelet formation and function: Studies in Niemann–Pick disease type C1 patients and zebrafish. Hum. Mol. Genet. 2012, 22, 61–73. [Google Scholar] [CrossRef] [PubMed]
  73. Warren, J.T.; Petryk, A.; Marques, G.; Jarcho, M.; Parvy, J.P.; Dauphin-Villemant, C.; O’Connor, M.B.; Gilbert, L.I. Molecular and biochemical characterization of two P450 enzymes in the ecdysteroidogenic pathway of Drosophila melanogaster. Proc. Natl. Acad. Sci. USA 2002, 99, 11043–11048. [Google Scholar] [CrossRef]
  74. Wing, K.D. RH 5849, a nonsteroidal ecdysone agonist: Effects on a Drosophila cell line. Science 1988, 241, 467–469. [Google Scholar] [CrossRef]
  75. Robinson, P.D.; Morgan, E.D.; Wilson, I.D.; Lafont, R. The metabolism of ingested and injected [3H]ecdysone by final instar larvae of Heliothis armigera. Physiol. Entomol. 1987, 12, 321–330. [Google Scholar] [CrossRef]
  76. Uyehara, C.M.; Leatham-Jensen, M.; McKay, D.J. Opportunistic binding of EcR to open chromatin drives tissue-specific developmental responses. Proc. Natl. Acad. Sci. USA 2022, 119, e2208935119. [Google Scholar] [CrossRef] [PubMed]
  77. Chandra, S.; Roy, A.; Jana, M.; Pahan, K. Cinnamic acid activates PPARα to stimulate Lysosomal biogenesis and lower Amyloid plaque pathology in an Alzheimer’s disease mouse model. Neurobiol. Dis. 2019, 124, 379–395. [Google Scholar] [CrossRef]
  78. Bouché, V.; Espinosa, A.P.; Leone, L.; Sardiello, M.; Ballabio, A.; Botas, J. Drosophila Mitf regulates the V-ATPase and the lysosomal-autophagic pathway. Autophagy 2016, 12, 484–498. [Google Scholar] [CrossRef]
  79. Meng, Y.; Heybrock, S.; Neculai, D.; Saftig, P. Cholesterol Handling in Lysosomes and Beyond. Trends Cell Biol. 2020, 30, 452–466. [Google Scholar] [CrossRef]
  80. Chikh, K.; Vey, S.; Simonot, C.; Vanier, M.T.; Millat, G. Niemann–Pick type C disease: Importance of N-glycosylation sites for function and cellular location of the NPC2 protein. Mol. Genet. Metab. 2004, 83, 220–230. [Google Scholar] [CrossRef]
  81. Liou, H.-L.; Dixit, S.S.; Xu, S.; Tint, G.S.; Stock, A.M.; Lobel, P. NPC2, the Protein Deficient in Niemann-Pick C2 Disease, Consists of Multiple Glycoforms That Bind a Variety of Sterols. J. Biol. Chem. 2006, 281, 36710–36723. [Google Scholar] [CrossRef]
  82. Uyehara, C.M.; McKay, D.J. Direct and widespread role for the nuclear receptor EcR in mediating the response to ecdysone in Drosophila. Proc. Natl. Acad. Sci. USA 2019, 116, 9893–9902. [Google Scholar] [CrossRef] [PubMed]
  83. Wu, C.; Wang, M.; Shi, H. Cholesterol Promotes Colorectal Cancer Growth by Activating the PI3K/AKT Pathway. J. Oncol. 2022, 2022, 1515416. [Google Scholar] [CrossRef] [PubMed]
  84. Ouahoud, S.; Jacobs, R.J.; Peppelenbosch, M.P.; Fühler, G.M.; Heijmans, J.; Diks, S.; Wildenberg, M.E.; Hawinkels, L.; Kodach, L.L.; Voorneveld, P.W.; et al. Kinome-wide analysis of the effect of statins in colorectal cancer. Br. J. Cancer 2021, 124, 1978–1987. [Google Scholar] [CrossRef]
  85. Voorneveld, P.W.; Reimers, M.S.; Bastiaannet, E.; Jacobs, R.J.; van Eijk, R.; Zanders, M.M.J.; Herings, R.M.C.; van Herk-Sukel, M.P.P.; Kodach, L.L.; van Wezel, T.; et al. Statin Use After Diagnosis of Colon Cancer and Patient Survival. Gastroenterology 2017, 153, 470–479.e4. [Google Scholar] [CrossRef] [PubMed]
  86. Dobrzycka, M.; Spychalski, P.; Łachiński, A.J.; Kobiela, P.; Jędrusik, P.; Kobiela, J. Statins and Colorectal Cancer—A Systematic Review. Exp. Clin. Endocrinol. Diabetes 2020, 128, 255–262. [Google Scholar] [CrossRef] [PubMed]
  87. Lim, S.H.; Kim, T.W.; Hong, Y.S.; Han, S.W.; Lee, K.H.; Kang, H.J.; Hwang, I.G.; Lee, J.Y.; Kim, H.S.; Kim, S.T.; et al. A randomised, double-blind, placebo-controlled multi-centre phase III trial of XELIRI/FOLFIRI plus simvastatin for patients with metastatic colorectal cancer. Br. J. Cancer 2015, 113, 1421–1426. [Google Scholar] [CrossRef]
  88. Xiao, X.; Liao, X.; Zhou, Y.; Weng, L.; Guo, L.; Zhou, L.; Wang, X.; Liu, X.; Liu, H.; Bi, X.; et al. Variants in the Niemann-pick type C genes are not associated with Alzheimer’s disease: A large case-control study in the Chinese population. Neurobiol. Aging 2022, 116, 49–54. [Google Scholar] [CrossRef]
  89. Rudge, J.D. The Lipid Invasion Model: Growing Evidence for This New Explanation of Alzheimer’s Disease. J. Alzheimers Dis. 2023, 94, 457–470. [Google Scholar] [CrossRef]
  90. Rudge, J.D. A New Hypothesis for Alzheimer’s Disease: The Lipid Invasion Model. J. Alzheimers Dis. Rep. 2022, 6, 129–161. [Google Scholar] [CrossRef]
  91. Kiani, L. 27-Hydroxycholesterol propagates α-synuclein pathology in Parkinson disease. Nat. Rev. Neurol. 2023, 19, 573. [Google Scholar] [CrossRef]
  92. Cougnoux, A.; Movassaghi, M.; Picache, J.A.; Iben, J.R.; Navid, F.; Salman, A.; Martin, K.; Farhat, N.Y.; Cluzeau, C.; Tseng, W.C.; et al. Gastrointestinal Tract Pathology in a BALB/c Niemann-Pick Disease Type C1 Null Mouse Model. Dig. Dis. Sci. 2018, 63, 870–880. [Google Scholar] [CrossRef] [PubMed]
  93. Rizzatti, G.; Lopetuso, L.R.; Gibiino, G.; Binda, C.; Gasbarrini, A. Proteobacteria: A Common Factor in Human Diseases. Biomed. Res. Int. 2017, 2017, 9351507. [Google Scholar] [CrossRef] [PubMed]
Figure 1. Npc2c is expressed in intestinal progenitors and controls midgut cell morphology and organismal physiology. (A) Npc2 protein expression (magenta) in the adult posterior midgut progenitors highlighted with esgts-Gal4 > Lamp1-GFP (green), which labels the lysosomes. (A’,A”) correspond to the separate green and magenta channels of (A), respectively. (B) Npc2 mRNA expression in third instar larvae upon ubiquitous Npc2c knockdown with two independent UAS-RNAi lines (UAS-Npc2cRNAi1 is UAS-Npc2cKK101583 and UAS-Npc2cRNAi2 is UAS-Npc2cGD31139) under the control of Act5C-Gal4. N = 6 biological replicates for each sample. (CF) Adult posterior midguts of control ISCts-Gal4 (C,D) and ISCts-Gal4 > Npc2cRNAi1 (E,F) without (C,E) and with P.a. infection (D,F) stained for Arm (magenta). GFP (green) labels the ISCs in all panels (CF). Arm staining is shown separately in (C’F’). (G) Smurf assay for ISCts-Gal4 control and ISCts-Gal4 > Npc2cRNAi1 does not show any effect of Npc2c on gut permeability. (H) Adult esgts-Gal4 control and esgts-Gal4 > Npc2cRNAi1 flies (triplicate experiment with 15 flies each) were subjected to continuous oral P.a. infection and their survival was measured. Scale bars in (A,CF) are 48 μm. Error bars correspond to the standard deviation. Experiments were repeated at least twice. One-way ANOVA for multiple comparisons was used to test significance in (B); the Kaplan–Meier log rank test was used to assess significance in (H). ns, not significant; ** 0.001 < p ≤ 0.01, **** p ≤ 0.0001.
Metabolites 13 01084 g001
Figure 2. Npc2c is necessary in ISCs for midgut mitosis. (AD) Quantification of the mitotic index (pH3-positive cells per midgut) of control and Npc2c-silenced midguts in ISC/EB progenitors (A), ISCs (B), EBs (C) and ECs (D) without (suc, sucrose; blue bars) and with P.a. oral infection (red bars). Experiments were repeated at least twice. At least 15 midguts were used for each condition. Error bars correspond to the standard deviation. Statistical significance was tested with Student’s t-test in (BD) and one-way ANOVA for multiple comparisons in (A) (N ≥ 12 per condition). ns, not significant; * 0.01 < p ≤ 0.05, *** 0.0001 < p ≤ 0.001, **** p ≤ 0.0001.
Metabolites 13 01084 g002
Figure 3. Npc2c regulates midgut mitosis and intestinal homeostasis. (A,B) Examples of ISCts-Gal4 control and ISCts-Gal4 > Npc2cRNAi1 posterior midguts in uninfected conditions (suc, sucrose feeding), highlighting the GFP-positive ISCs (green in (A,B) and grey in (A’,B’)) and stained for the nucleus marker DAPI (magenta). (C) Quantification of GFP-positive ISCs from the genotypes shown in (A,B). (D,E) Examples of ISCts-Gal4 control and ISCts-Gal4 > Npc2cRNAi1 posterior midguts (A,B) in P.a.-infected conditions, highlighting the GFP-positive ISCs (green in (D,E) and grey in (D’,E’)) and stained for the nucleus marker DAPI (magenta). (F) Quantification of GFP-positive ISCs from the genotypes shown in (D,E). (G,H) Examples of ISCts-Gal4 control and ISCts-Gal4 > Npc2cRNAi1 posterior midguts with transgene induction at 29 °C for 7 days in uninfected conditions, highlighting the GFP-positive ISCs (green in (G,H) and grey in (G’,H’)) and stained for the nucleus marker DAPI (magenta). (I) Quantification of the ratio of Pros-positive EEs to the total cell number in the conditions shown in (G,H,J,K). (J,K) Examples of ISCts-Gal4 control and ISCts-Gal4 > Npc2cRNAi1 posterior midguts with transgene induction at 29 °C for 15 days in uninfected conditions, highlighting the GFP-positive ISCs (green in (J,K) and grey in (J’,K’)) and stained for the nucleus marker DAPI (magenta). (L) Quantification of the total number of cells per midgut area for the conditions shown in (G,H,J,K). (M) Quantification of the number of MARCM clones per midgut and the size of individual lineages for control (genotype w hsFLP tub-Gal4 UAS-nlsGFP/+; FRT82B tub-Gal80/FRT82B arm-lacZ) and Npc2cRNAi1 (genotype w hsFLP tub-Gal4 UAS-nlsGFP/+; UAS-SmvtRNAi1/+; FRT82B tub-Gal80/FRT82B arm-lacZ) MARCM clones 1, 3, 7, 12, and 14 days post heat shock/induction. (N) Plotting of the percentage of cell numbers in individual lineages in control and Npc2cRNAi1 MARCM clones 1, 3, 7, 12, and 14 days post heat shock/induction. Experiments were repeated at least twice. Error bars correspond to the standard deviation. Scale bars, 75 μm. Student’s t-test was used to test significance in (C,F,I) and one-way ANOVA for multiple comparisons was used in (L). ns, not significant; * 0.01 < p ≤ 0.05, ** 0.001 < p ≤ 0.01, *** 0.0001 < p ≤ 0.001, **** p ≤ 0.0001.
Metabolites 13 01084 g003
Figure 4. Npc2c is necessary for intestinal tumorigenesis. (AD) Examples of posterior esgts-Gal4 > RasQ13 tumorous midguts without (A,B) and with Npc2cRNAi1 (C,D) without (suc, sucrose feeding) (A,C) and with P.a. oral infection (B,D) stained with DAPI (magenta) and Pros (separate grey channel in (A’D’). Scale bars, 75 μm. (E) Quantification of mitotic pH3-positive cells in tumorous midguts without and with Npc2cRNAi1 without (blue bars) and with P.a. oral infection (red bars). (F) Quantification of Pros-positive EEs in tumorous midguts without and with Npc2cRNAi1 without (blue bars) and with P.a. oral infection (red bars). Experiments were repeated at least twice. Error bars correspond to the standard deviation. Student’s t-test and the Mann–Whitney U-test were used to test significance in (E) (N ≥ 12 for each condition) and (F) (N ≥ 6 for each condition), respectively. ns, not significant; * 0.01 < p ≤ 0.05, ** 0.001 < p ≤ 0.01, **** p ≤ 0.0001.
Metabolites 13 01084 g004
Figure 5. Npc2c-silenced midguts exhibit reduced expression of mitosis regulators, increased EC endoreplication and intestinal dysbiosis. (A,B) RT-qPCR analysis of candidate genes in esgts-Gal4 control and Npc2cRNAi1 midguts in uninfected (suc, sucrose) (A) and P.a.-infected conditions (B). Bars indicate the mean of at least 3 biological replicates. (CF) Examples of ISCts-Gal4 control (C,E) and ISCts-Gal4 > Npc2cRNAi1 (D,F) posterior midguts upon transgene induction at 29 °C for 7 days (C,D) and 15 days (E,F) in uninfected conditions. The DAPI channel highlighting all midgut nuclei is shown in grey in (CF). (G) Quantification of EC growth through measurement of the EC nucleus cross-sectional area from maximum intensity projections of DAPI images (as shown in (CF)) of ISCts-Gal4 control and ISCts-Gal4 > Npc2cRNAi1 at 7 and 15 days of induction at 29 °C. (H,I) Bacterial composition (phyla) from dissected midguts determined by 16S rDNA sequencing in uninfected esgts-Gal4 control (H) and Npc2cRNAi1 (I) midguts. (J,K) Bacterial composition (Class) from dissected midguts determined by 16S rDNA sequencing in uninfected esgts-Gal4 control (J) and Npc2cRNAi1 (I) midguts. Sequencing in (HK) was performed in biological replicates and the data were merged. Scale bars, 75 μm. Error bars correspond to the standard deviation. Statistical significance was tested with Student’s t-test or the Mann–Whitney U-test in (A,B) (N = 3 or N = 6) and Student’s t-test for G (N = 50). ns, not significant; * 0.01 < p ≤ 0.05, ** 0.001 < p ≤ 0.01, *** 0.0001 < p ≤ 0.001, **** p ≤ 0.0001.
Metabolites 13 01084 g005
Figure 6. Npc2c-silenced midguts exhibit increased sterol aggregation. (AD) Examples of ISCts-Gal4 control (A,B) and ISCts-Gal4 > Npc2cRNAi1 (C,D) posterior midguts in uninfected (sucrose feeding) (A,C) and P.a.-infected (B,D) conditions stained with filipin (in grey) to highlight sterol aggregates. (E) Quantification of the filipin fluorescent signal from images like those shown in (AD). Experiments were repeated at least twice. Scale bars, 75 μm. Error bars correspond to the standard deviation. Statistical significance in (E) was tested with Student’s t-test (N ≥ 10). ns, not significant; * 0.01 < p ≤ 0.05.
Metabolites 13 01084 g006
Figure 7. Npc2c mediates 20E signaling and interacts with other Npc2 family members. (A) Quantification of the mitotic index (pH3-positive cells) in esgts-Gal4 control and esgts-Gal4 > Npc2cRNAi1 uninfected (suc, sucrose feeding) and P.a.-infected adult midguts upon supplementation of the 20E agonist RH5849. (B,C) RT-qPCR analysis of Mitf, Br and Eip75B in esgts-Gal4 control and esgts-Gal4 > Npc2cRNAi1 midguts in the presence of absence of RH5849 in uninfected (B) and P.a.-infected conditions (C). (D) Quantification of the mitotic index in adult midguts of esgts-Gal4 control and Npc2RNAi family members (Npc2a, -b, -d, -e, -f, -h) in uninfected (blue bars) and P.a.-infected (red bars) conditions. (E) RT-qPCR analysis of Npc2 gene family (Npc2a-h) in Act5C-Gal4 control and Act5C-Gal4 > Npc2cRNAi1 third instar larvae. (F) RT-qPCR analysis of Npc2 gene family (Npc2a-h) in esgts-Gal4 control and esgts-Gal4 > Npc2cRNAi1 midguts in uninfected conditions. (G) RT-qPCR analysis of Npc2 gene family (Npc2a-h) in esgts-Gal4 control and esgts-Gal4 > Npc2cRNAi1 midguts in the presence or absence of RH5849 in uninfected conditions. Experiments were repeated at least twice. Error bars correspond to the standard deviation. Statistical significance was tested with the Mann–Whitney U-test in (A) (N ≥ 8), (B,C,EG) (N = 6) and Student’s t-test in (D) (N ≥ 12). ns, not significant; * 0.01 < p ≤ 0.05, ** 0.001 < p ≤ 0.01, **** p ≤ 0.0001.
Metabolites 13 01084 g007
Disclaimer/Publisher’s Note: The statements, opinions and data contained in all publications are solely those of the individual author(s) and contributor(s) and not of MDPI and/or the editor(s). MDPI and/or the editor(s) disclaim responsibility for any injury to people or property resulting from any ideas, methods, instructions or products referred to in the content.

