
Honey Quality and Microplastic Migration from Food Packaging: A Potential Threat for Consumer Health?

 , , and
Abstract
:1. Introduction
2. Packaging Materials and Their Degradation Parameters
2.1. Plastic (Polymeric) Packaging
2.1.1. Polymeric Food Packaging Materials
2.1.2. Polymer Degradation Parameters
2.2. Glass Packaging
2.3. Metal Packaging
3. MPs/NPs Migration from Plastic Packaging into Food
3.1. Generic
3.2. Important Research Works for MPs/NPs and Plasticizers Migration into Food
3.2.1. Food Simulations
3.2.2. Real Food Samples
4. Honey Properties and Postharvest Handling
4.1. Types of Honey
4.2. Honey Properties
4.2.1. Viscosity/Crystallization
4.2.2. Viscosity/Heat
4.2.3. Viscosity/Water Activity
4.2.4. pH
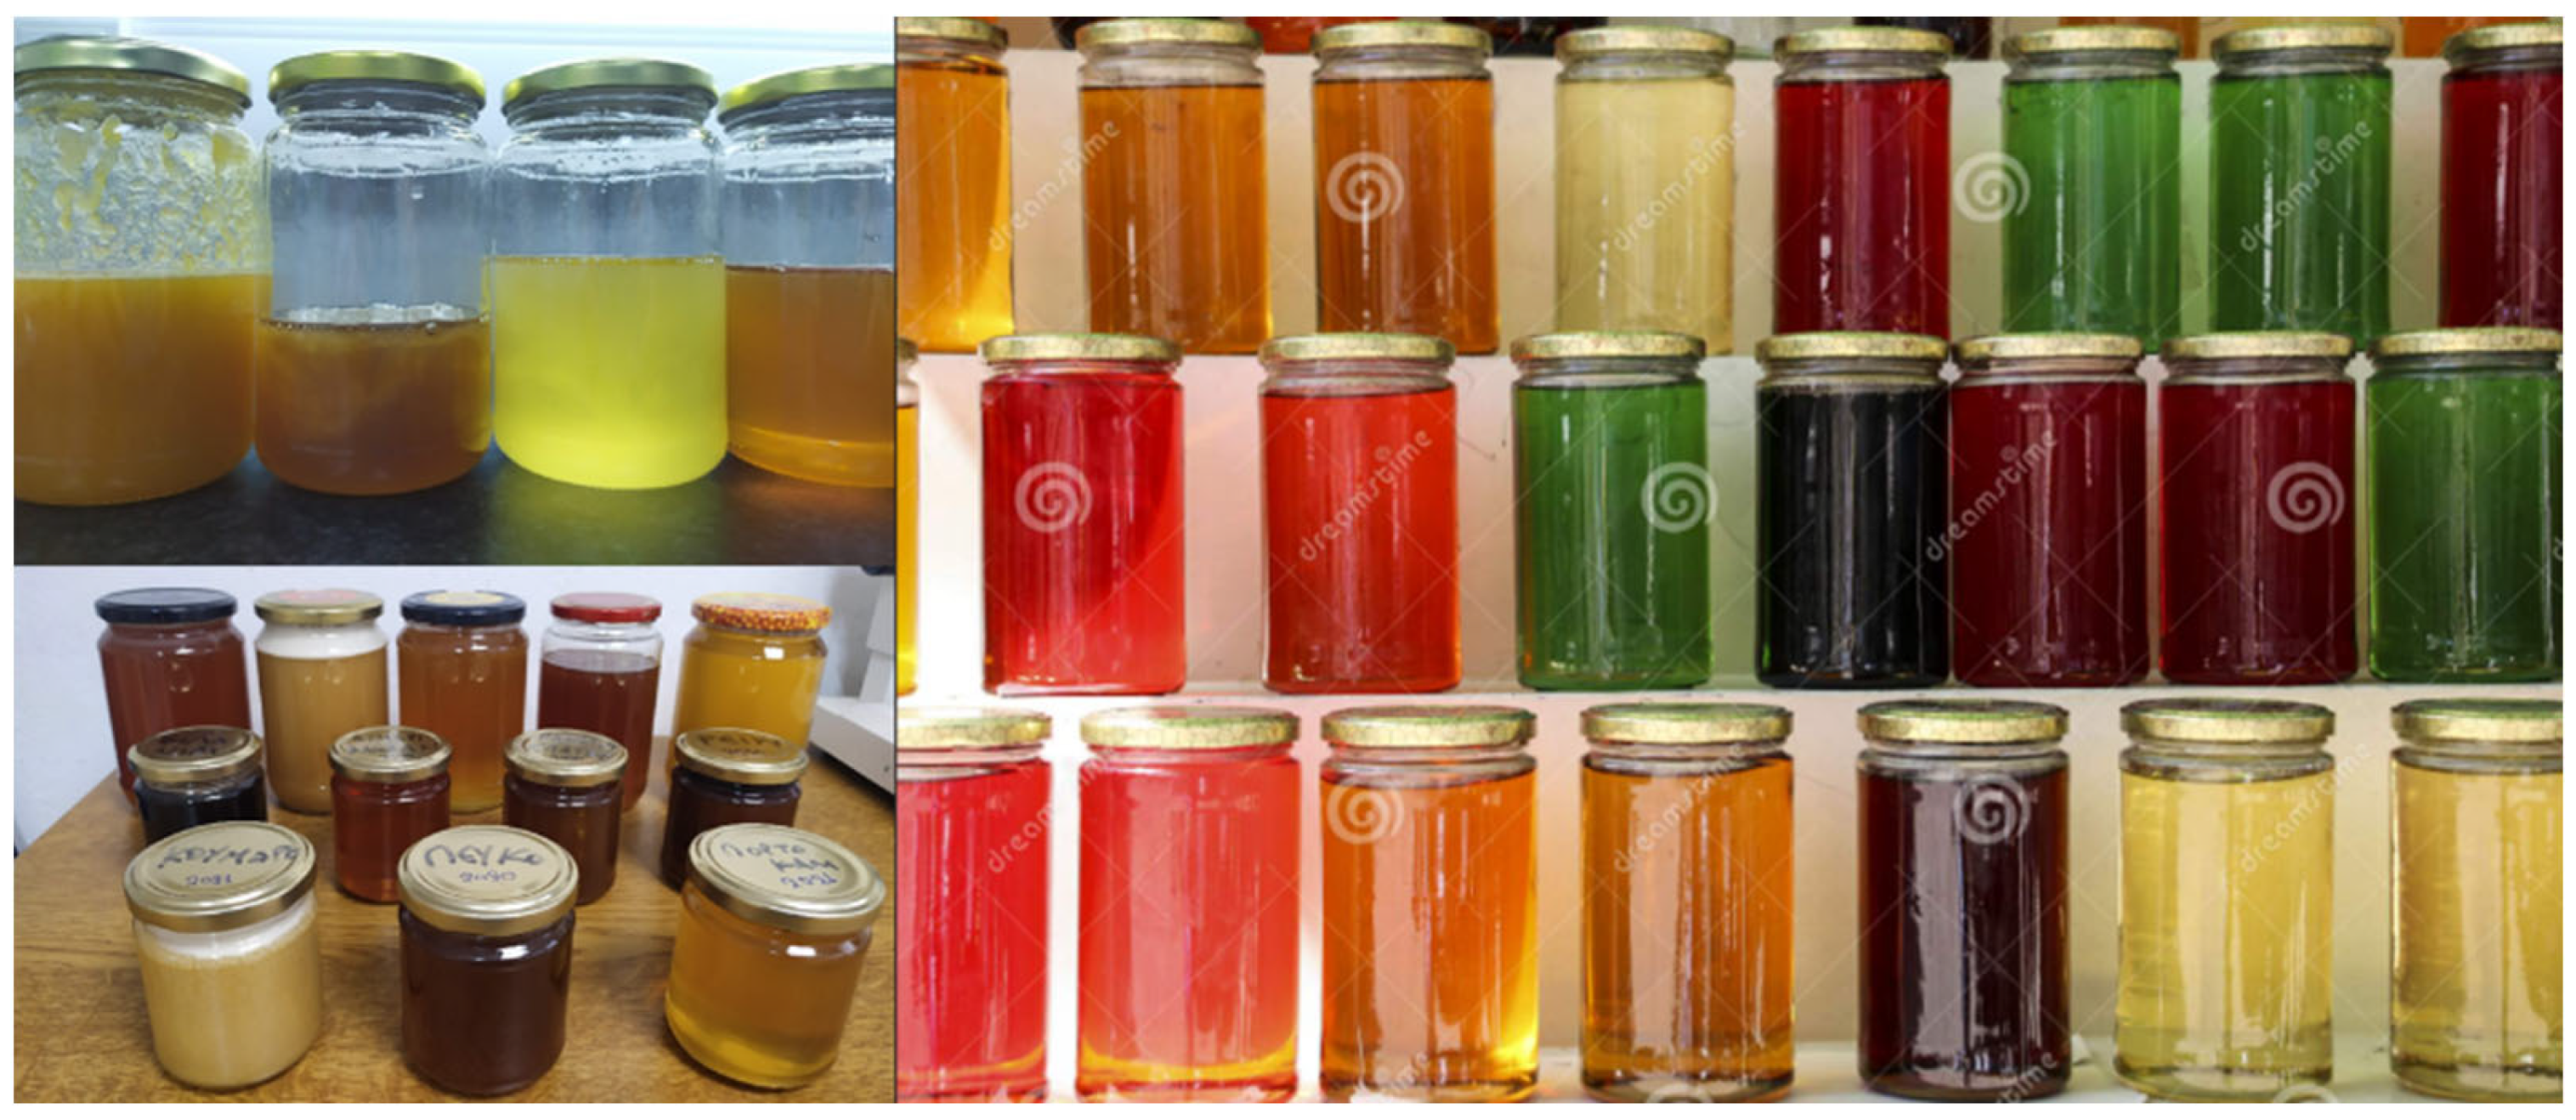
4.2.5. Color
4.2.6. Optical Properties
4.3. Factors That Affect Honey Properties
4.3.1. Storage Time
4.3.2. Temperature
4.3.3. Humidity, Water Activity, and Moisture Content
5. Recent Evidence and Spectroscopic Analytical Techniques on the Presence of MPs/NPs in Honey
5.1. Honey Characterization through Spectroscopic Techniques
5.2. Spectroscopic Determination of MPs/NPs in Honey and Foodstuffs
5.2.1. Chemical Compounds in Honey—General Overview
5.2.2. Spectroscopic Detection of MPs/NPs in Honey
5.2.3. Spectroscopic Detection of MPs/NPs in Foodstuffs
6. Discussion
7. Conclusions
Author Contributions
Funding
Institutional Review Board Statement
Informed Consent Statement
Data Availability Statement
Conflicts of Interest
Abbreviations
| MPs | microplastics |
| NPs | nanoplastics |
| LDPE | low-density polyethylene |
| HDPE | high-density polyethylene |
| PET | polyethylene terephthalate |
| PP | polypropylene |
| PC | polycarbonate |
| PVDC | polyvinylidene chloride |
| PS | polystyrene |
| DEHA | Di-2-ethylhexyl adipate |
| TBOEP | tris(2-butoxyethyl) phosphate |
| UV | ultraviolet |
| L* | lightness |
| α* | redness |
| b* | yellowness |
| BPF | brown pigment formation |
| TPC | total phenolic content |
| RI | refractive index |
| FTIR | Fourier-transform infrared spectroscopy |
| PCA | principal component analysis |
| PLS | partial least squares |
| LDA | linear discriminant analysis |
| ATR | Attenuated total reflectance |
| GC | Gas chromatography |
| PY | pyrolysis |
| MS | mass spectrometry |
| DLLME | Dispersive liquid-liquid microextraction |
| HPLC | High-performance liquid chromatography |
| FPA | focal plane array |
| NR | Nile red |
| XPS | extruded polystyrene |
| SEM | scanning electron microscopy |
| FCMs | Food Contact Materials |
References
- Karbalaei, S.; Hanachi, P.; Walker, T.R.; Cole, M. Occurrence, sources, human health impacts and mitigation of microplastic pollution. Environ. Sci. Pollut. Res. 2018, 25, 36046–36063. [Google Scholar] [CrossRef] [PubMed]
- Kumar, R.; Manna, C.; Padha, S.; Verma, A.; Sharma, P.; Dhar, A.; Ghosh, A.; Bhattacharya, P. Micro(nano)plastics pollution and human health: How plastics can induce carcinogenesis to humans? Chemosphere 2022, 298, 134267. [Google Scholar] [CrossRef] [PubMed]
- Cho, S.; Kim, Y.; Chung, H. Feasibility study for simple on-line Raman spectroscopic detection of microplastic particles in water using perfluorocarbon as a particle-capturing medium. Anal. Chim. Acta 2021, 1165, 338518. [Google Scholar] [CrossRef]
- Pittroff, M.; Muller, Y.K.; Witzig, C.S.; Scheurer, M.; Storck, F.R.; Zumbulte, N. Microplastic analysis in drinking water based on fractionated filtration sampling and Raman microspectroscopy. Environ. Sci. Pollut. Res. 2021, 28, 59439–59451. [Google Scholar] [CrossRef]
- Zhang, D.; Cui, Y.; Zhou, H.; Jin, C.; Yu, X.; Xu, Y.; Li, Y.; Zhang, C. Microplastic pollution in water, sediment, and fish from artificial reefs around the Ma’an Archipelago, Shengsi, China. Sci. Total Environ. 2020, 703, 134768. [Google Scholar] [CrossRef]
- Avio, C.G.; Pittura, L.; d’Errico, G.; Abel, S.; Amorello, S.; Marino, G.; Gorbi, S.; Regoli, F. Distribution and characterization of microplastic particles and textile microfibers in Adriatic food webs: General insights for biomonitoring strategies. Environ. Pollut. 2020, 258, 113766. [Google Scholar] [CrossRef] [PubMed]
- Dantas, N.; Duarte, O.S.; Ferreira, W.C.; Ayala, A.P.; Rezende, C.F.; Feitosa, C.V. Plastic intake does not depend on fish eating habits: Identification of microplastics in the stomach contents of fish on an urban beach in Brazil. Mar. Pollut. Bull. 2020, 153, 110959. [Google Scholar] [CrossRef]
- Lachenmeier, D.W.; Kocareva, J.; Noack, D.; Kuballa, T. Microplastic identification in German beer-an artefact of laboratory contamination? Dtsch. Lebensm.-Rundsch. 2015, 111, 437–440. [Google Scholar]
- Diaz-Basantes, M.F.; Conesa, J.A.; Fullana, A. Microplastics in Honey, Beer, Milk and Refreshments in Ecuador as Emerging Contaminants. Sustainability 2020, 12, 5514. [Google Scholar] [CrossRef]
- Muhlschlegel, P.; Hauk, A.; Walter, U.; Sieber, R. Lack of evidence for microplastic contamination in honey. Food Addit. Contam. Part A 2017, 34, 1982–1989. [Google Scholar] [CrossRef]
- Wrona, M.; Nerin, C. Analytical Approaches for Analysis of Safety of Modern Food Packaging: A Review. Molecules 2020, 25, 752. [Google Scholar] [CrossRef] [PubMed] [Green Version]
- Hee, Y.Y.; Weston, K.; Suratman, S. The effect of storage conditions and washing on microplastic release from food and drink containers. Food Packag. Shelf Life 2022, 32, 100826. [Google Scholar] [CrossRef]
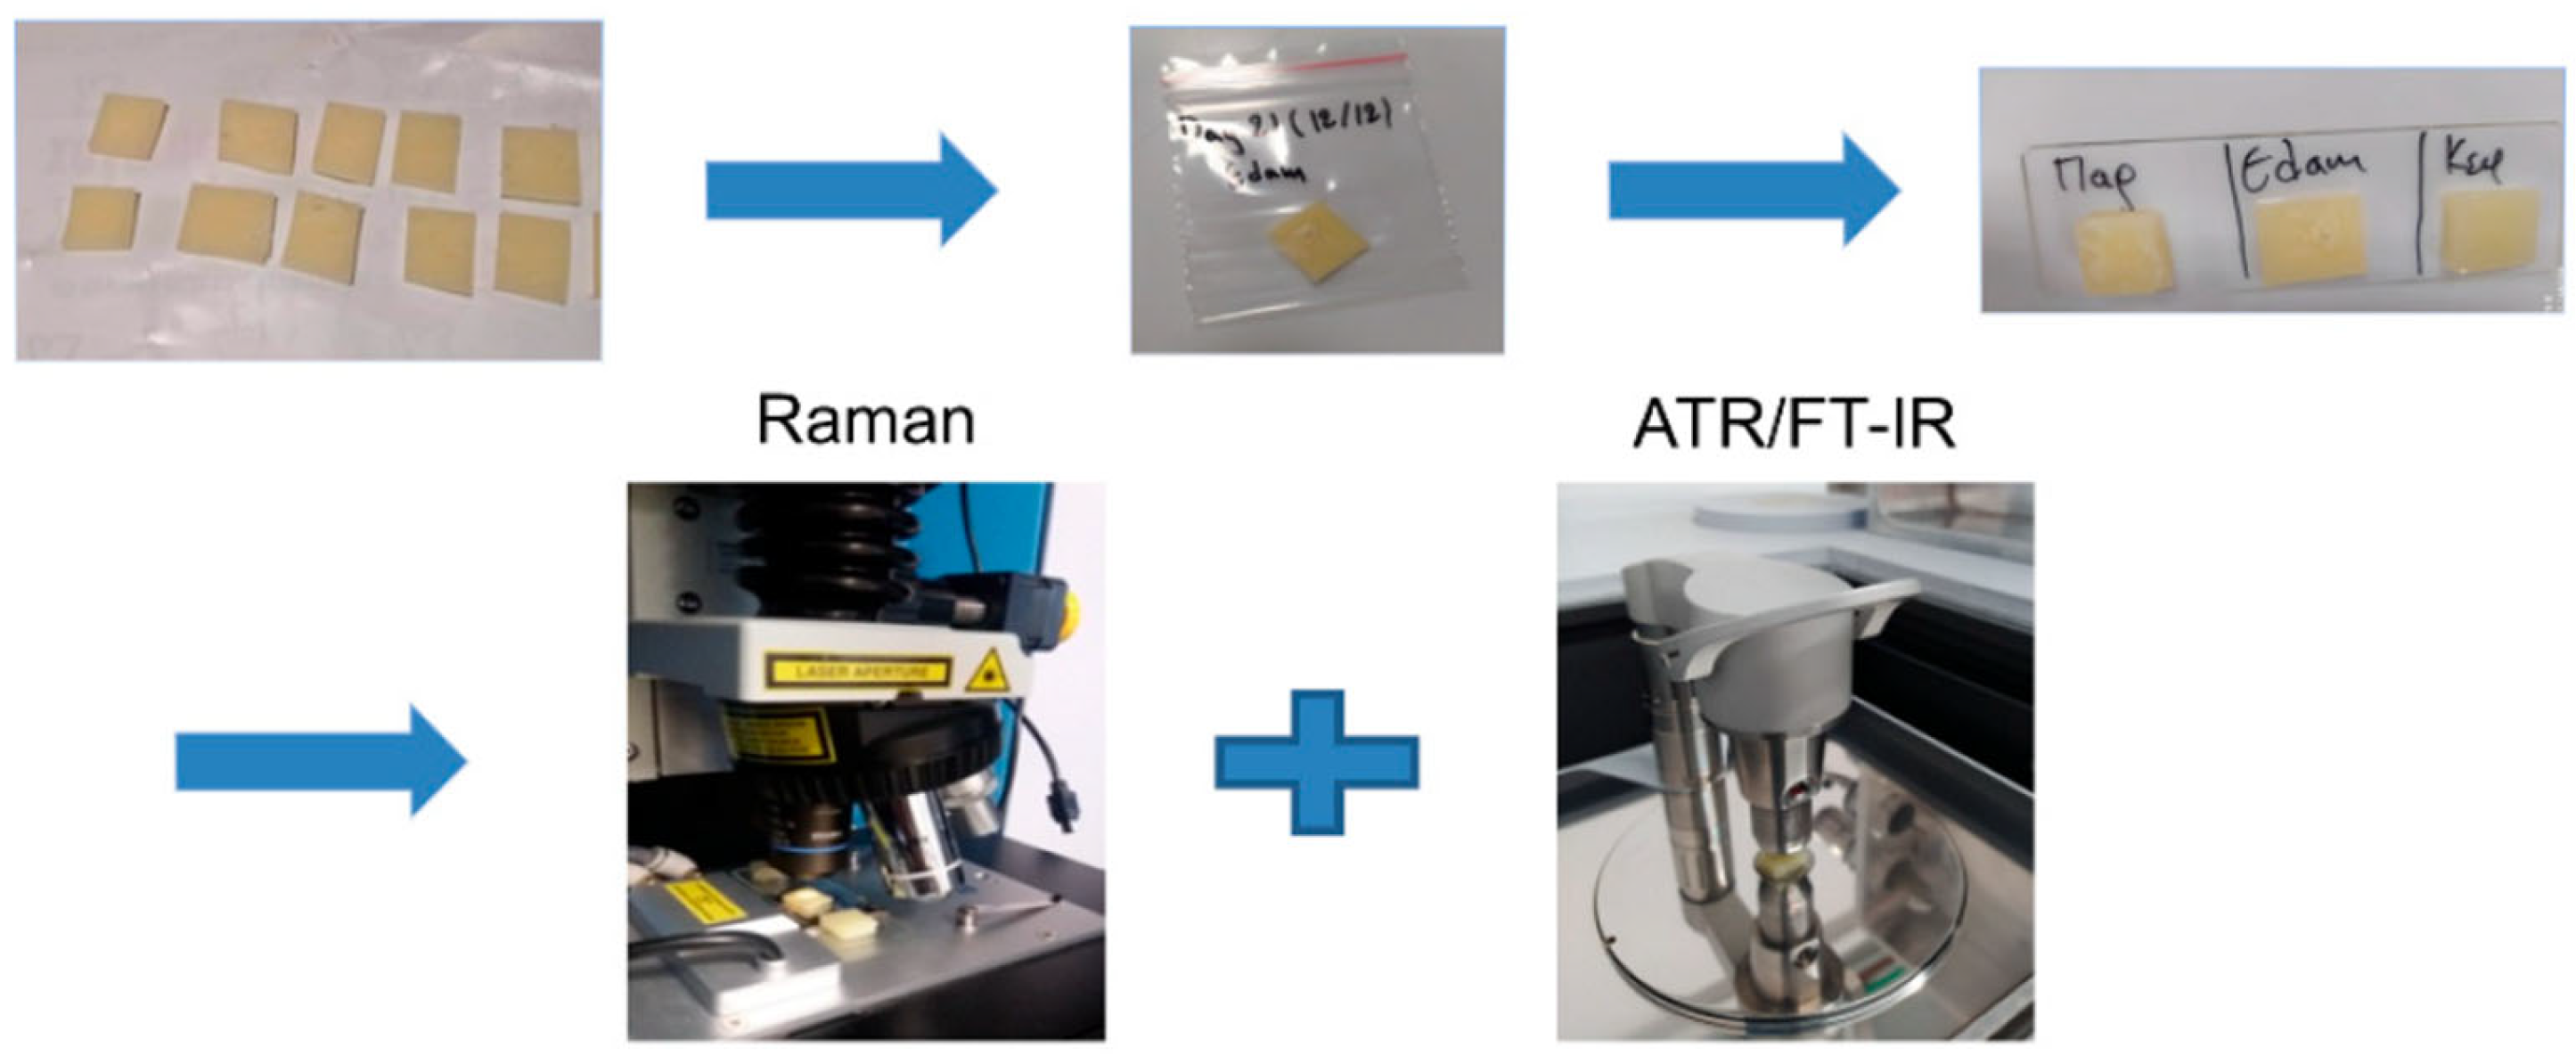
- Katsara, K.; Kenanakis, G.; Viskadourakis, Z.; Papadakis, V.M. Polyethylene Migration from Food Packaging on Cheese Detected by Raman and Infrared (ATR/FT-IR) Spectroscopy. Materials 2021, 14, 3872. [Google Scholar] [CrossRef] [PubMed]
- Guerreiro, T.M.; de Oliveira, D.N.; Melo, C.F.O.R.; de Oliveira Lima, E.; Catharino, R.R. Migration from plastic packaging into meat. Food Res. Int. 2018, 109, 320–324. [Google Scholar] [CrossRef]
- Hossain, M.L.; Lim, L.Y.; Hammer, K.; Hettiarachchi, D.; Locher, C. Honey-Based Medicinal Formulations: A Critical Review. Appl. Sci. 2021, 11, 5159. [Google Scholar] [CrossRef]
- Ali, H.; Rafique, K.; Ullah, R.; Saleem, M.; Ahmad, I. Classification of Sidr honey and detection of sugar adulteration using right angle fluorescence spectroscopy and chemometrics. Eur. Food Res. Technol. 2022, 248, 1823–1829. [Google Scholar] [CrossRef]
- Yeter, O.; Aydin, A. The fate of acetamiprid and its degradation during long-term storage of honey. Food Addit. Contam. Part A Chem. Anal. Control Expo Risk Assess. 2020, 37, 288–303. [Google Scholar] [CrossRef]
- Islam, M.K.; Lawag, I.L.; Green, K.J.; Sostaric, T.; Hammer, K.A.; Lim, L.Y.; Locher, C. An investigation of the suitability of melissopalynology to authenticate Jarrah honey. Curr. Res. Food Sci. 2022, 5, 506–514. [Google Scholar] [CrossRef]
- Ahmed, S.; Sulaiman, S.A.; Baig, A.A.; Ibrahim, M.; Liaqat, S.; Fatima, S.; Jabeen, S.; Shamim, N.; Othman, N.H. Honey as a Potential Natural Antioxidant Medicine: An Insight into Its Molecular Mechanisms of Action. Oxidative Med. Cell. Longev. 2018, 2018, 8367846. [Google Scholar] [CrossRef] [Green Version]
- Almasaudi, S. The antibacterial activities of honey. Saudi J. Biol. Sci. 2021, 28, 2188–2196. [Google Scholar] [CrossRef]
- Gkoutzouvelidou, M.; Panos, G.; Xanthou, M.N.; Papachristoforou, A.; Giaouris, E. Comparing the Antimicrobial Actions of Greek Honeys from the Island of Lemnos and Manuka Honey from New Zealand against Clinically Important Bacteria. Foods 2021, 10, 1402. [Google Scholar] [CrossRef] [PubMed]
- Badawy, O.F.; Shafii, S.S.; Tharwat, E.E.; Kamal, A.M. Antibacterial activity of bee honey and its therapeutic usefulness against Escherichia coli O157:H7 and Salmonella typhimurium infection. Rev. Sci. Tech. 2004, 23, 1011–1022. [Google Scholar] [CrossRef] [PubMed] [Green Version]
- Singh, I.; Singh, S. Honey moisture reduction and its quality. J. Food Sci. Technol. 2018, 55, 3861–3871. [Google Scholar] [CrossRef]
- Ananias, K.R.; de Melo, A.A.; de Moura, C.J. Analysis of moisture content, acidity and contamination by yeast and molds in Apis mellifera L. honey from central Brazil. Braz. J. Microbiol. 2013, 44, 679–683. [Google Scholar] [CrossRef] [Green Version]
- Lenhardt, L.; Bro, R.; Zekovic, I.; Dramicanin, T.; Dramicanin, M.D. Fluorescence spectroscopy coupled with PARAFAC and PLS DA for characterization and classification of honey. Food Chem. 2015, 175, 284–291. [Google Scholar] [CrossRef]
- Anjos, O.; Campos, M.G.; Ruiz, P.C.; Antunes, P. Application of FTIR-ATR spectroscopy to the quantification of sugar in honey. Food Chem. 2015, 169, 218–223. [Google Scholar] [CrossRef] [PubMed]
- De Oliveira, L.F.; Colombara, R.; Edwards, H. Fourier Transform Raman Spectroscopy of Honey. Appl. Spectrosc. 2002, 56, 306–311. [Google Scholar] [CrossRef]
- Goodacre, R.; Radovic, B.; Anklam, E. Progress Toward the Rapid Nondestructive Assessment of the Floral Origin of European Honey Using Dispersive Raman Spectroscopy. Appl. Spectrosc. 2002, 56, 521–527. [Google Scholar] [CrossRef]
- Huzortey, A.A.; Arefi, A.; Anderson, B.; Khadem, H.; Sackey, S.S.; Mahmoodi-Khaledi, E.; Tavassoli, S.H. 532-nm Laser-Excited Raman Spectroscopic Evaluation of Iranian Honey. Food Anal. Methods 2021, 15, 772–782. [Google Scholar] [CrossRef]
- Mendes, E.; Duarte, N. Mid-Infrared Spectroscopy as a Valuable Tool to Tackle Food Analysis: A Literature Review on Coffee, Dairies, Honey, Olive Oil and Wine. Foods 2021, 10, 477. [Google Scholar] [CrossRef]
- Muller Molnar, C.; Berghian-Grosan, C.; Magdas, D.A. An optimized green preparation method for the successful application of Raman spectroscopy in honey studies. Talanta 2020, 208, 120432. [Google Scholar] [CrossRef] [PubMed]
- Tao, W.T.; Yuan, P.; Guo, W.J.; Liu, J.E. The Application of Quality Identification in Honey by Photoacoustic Spectroscopy. Guang Pu Xue Yu Guang Pu Fen Xi 2015, 35, 1177–1181. [Google Scholar] [PubMed]
- Orfanakis, E.; Markoulidakis, M.; Philippidis, A.; Zoumi, A.; Velegrakis, M. Optical spectroscopy methods combined with multivariate statistical analysis for the classification of Cretan thyme, multi-floral and honeydew honey. J. Sci. Food Agric. 2021, 101, 5337–5347. [Google Scholar] [CrossRef] [PubMed]
- Ozbalci, B.; Boyaci, I.H.; Topcu, A.; Kadilar, C.; Tamer, U. Rapid analysis of sugars in honey by processing Raman spectrum using chemometric methods and artificial neural networks. Food Chem. 2013, 136, 1444–1452. [Google Scholar] [CrossRef]
- Kozlowicz, K.; Rozylo, R.; Gladyszewska, B.; Matwijczuk, A.; Gladyszewski, G.; Chocyk, D.; Samborska, K.; Piekut, J.; Smolewska, M. Identification of sugars and phenolic compounds in honey powders with the use of GC-MS, FTIR spectroscopy, and X-ray diffraction. Sci. Rep. 2020, 10, 16269. [Google Scholar] [CrossRef]
- Penalver, R.; Arroyo-Manzanares, N.; Campillo, N.; Vinas, P. Targeted and untargeted gas chromatography-mass spectrometry analysis of honey samples for determination of migrants from plastic packages. Food Chem. 2021, 334, 127547. [Google Scholar] [CrossRef]
- Gouin, T.; Ellis-Hutchings, R.; Thornton Hampton, L.M.; Lemieux, C.L.; Wright, S.L. Screening and prioritization of nano- and microplastic particle toxicity studies for evaluating human health risks-development and application of a toxicity study assessment tool. Microplast. Nanoplast. 2022, 2, 2. [Google Scholar] [CrossRef]
- Kato, L.S.; Conte-Junior, C.A. Safety of Plastic Food Packaging: The Challenges about Non-Intentionally Added Substances (NIAS) Discovery, Identification and Risk Assessment. Polymers 2021, 13, 2077. [Google Scholar] [CrossRef]
- POMA. Advantages and Disadvantages of Plastic Packaging. Available online: http://poma.com.vn/en/advantages-and-disadvantages-of-plastic-packaging/ (accessed on 1 May 2022).
- Cruz, R.M.S.; Rico, B.P.M.; Vieira, M.C. 9-Food packaging and migration. In Food Quality and Shelf Life; Galanakis, C.M., Ed.; Academic Press: Cambridge, MA, USA, 2019; pp. 281–301. [Google Scholar]
- PACKCON.org. Polymers in Food Packaging. Available online: http://packcon.org/index.php/en/articles/102-2016/192-polymers-in-food-packaging (accessed on 1 May 2022).
- Bansal, R.; Gupta, G. Plastic in Food Packaging: Safety Concerns for Our Health and Environment. J. Nutr. Sci. Healthy Diet. 2020, 1, 16–21. [Google Scholar]
- CHOICE. Is Plastic Food Packaging Dangerous? Available online: https://www.choice.com.au/food-and-drink/food-warnings-and-safety/plastic/articles/plastics-and-food (accessed on 1 May 2022).
- Castle, L.; Mercer, A.J.; Startin, J.R.; Gilbert, J. Migration from plasticized films into foods. 2. Migration of di-(2-ethylhexyl)adipate from PVC films used for retail food packaging. Food Addit. Contam. 1987, 4, 399–406. [Google Scholar] [CrossRef]
- Keller and Heckman LPP. Can PVC be Used in Packaging in Europe? In The National Law Review; National Law Forum L.L.C.: Hinsdale, IL, USA, 2018; Volume XII, p. 219. [Google Scholar]
- Yakes, B.J.; Moskowitz, J.; Crump, E.; Ellsworth, Z.; Carlos, K.; Begley, T. Evaluation of portable vibrational spectroscopy for identifying plasticizers in dairy tubing. Food Addit. Contam. Part A 2022, 39, 817–827. [Google Scholar] [CrossRef] [PubMed]
- Czogała, J.; Pankalla, E.; Turczyn, R. Recent Attempts in the Design of Efficient PVC Plasticizers with Reduced Migration. Materials 2021, 14, 844. [Google Scholar] [CrossRef] [PubMed]
- T.C.E. Plastic Honey Containers. 1895. Available online: https://www.thecarycompany.com/containers/plastic/bottles/honey (accessed on 1 May 2022).
- Products, Q.T.P. What’s the Materials for the Clear Stick Package for Honey Products. Available online: http://www.valuepackaging.cn/whats-the-materials-for-the-clear-stick-package-for-honey-products/ (accessed on 1 May 2022).
- Alin, J.; Hakkarainen, M. Microwave heating causes rapid degradation of antioxidants in polypropylene packaging, leading to greatly increased specific migration to food simulants as shown by ESI-MS and GC-MS. J. Agric. Food Chem. 2011, 59, 5418–5427. [Google Scholar] [CrossRef] [PubMed]
- Rastkari, N.; Zare Jeddi, M.; Yunesian, M.; Ahmadkhaniha, R. The Effect of Storage Time, Temperature and Type of Packaging on the Release of Phthalate Esters into Packed Acidic Liquids. Food Technol. Biotechnol. 2017, 55, 562–569. [Google Scholar] [CrossRef] [PubMed]
- Birch, Q.T.; Potter, P.M.; Pinto, P.X.; Dionysiou, D.D.; Al-Abed, S.R. Isotope ratio mass spectrometry and spectroscopic techniques for microplastics characterization. Talanta 2021, 224, 121743. [Google Scholar] [CrossRef]
- Plota, A.; Masek, A. Lifetime Prediction Methods for Degradable Polymeric Materials-A Short Review. Materials 2020, 13, 4507. [Google Scholar] [CrossRef]
- Hernandez, L.M.; Xu, E.G.; Larsson, H.C.E.; Tahara, R.; Maisuria, V.B.; Tufenkji, N. Plastic Teabags Release Billions of Microparticles and Nanoparticles into Tea. Environ. Sci. Technol. 2019, 53, 12300–12310. [Google Scholar] [CrossRef]
- Nascimento, A.G.M.; Toledo, B.S.; Guimaraes, J.T.; Ramos, G.; da Cunha, D.T.; Pimentel, T.C.; Cruz, A.G.; Freitas, M.Q.; Esmerino, E.A.; Marsico, E.T. The impact of packaging design on the perceived quality of honey by Brazilian consumers. Food Res. Int. 2022, 151, 110887. [Google Scholar] [CrossRef]
- GPI, Glass Packaging Institute. Benefits of Glass Packaging. Available online: https://www.gpi.org/benefits-of-glass-packaging (accessed on 1 May 2022).
- Strategies, P. Increasing Use of Glass in Food and Pharmaceutical Packaging Driving Market Growth. Available online: https://www.packagingstrategies.com/articles/89084-increasing-use-of-glass-in-food-and-pharmaceutical-packaging-driving-market-growth (accessed on 1 May 2022).
- Deshwal, G.K.; Panjagari, N.R. Review on metal packaging: Materials, forms, food applications, safety and recyclability. J. Food Sci. Technol. 2020, 57, 2377–2392. [Google Scholar] [CrossRef]
- Rubio-Armendáriz, C.; Alejandro-Vega, S.; Paz-Montelongo, S.; Gutiérrez-Fernández, Á.J.; Carrascosa-Iruzubieta, C.J.; Hardisson-de la Torre, A. Microplastics as Emerging Food Contaminants: A Challenge for Food Safety. Int. J. Environ. Res. Public Health 2022, 19, 1174. [Google Scholar] [CrossRef]
- Duan, C.; Fang, Y.; Sun, J.; Li, Z.; Wang, Q.; Bai, J.; Peng, H.; Liang, J.; Gao, Z. Effects of fast food packaging plasticizers and their metabolites on steroid hormone synthesis in H295R cells. Sci. Total Environ. 2020, 726, 138500. [Google Scholar] [CrossRef] [PubMed]
- Montoille, L.; Morales Vicencio, C.; Fontalba, D.; Ortiz, J.A.; Moreno-Serna, V.; Peponi, L.; Matiacevich, S.; Zapata, P.A. Study of the effect of the addition of plasticizers on the physical properties of biodegradable films based on kefiran for potential application as food packaging. Food Chem. 2021, 360, 129966. [Google Scholar] [CrossRef] [PubMed]
- Pomatto, V.; Cottone, E.; Cocci, P.; Mozzicafreddo, M.; Mosconi, G.; Nelson, E.R.; Palermo, F.A.; Bovolin, P. Plasticizers used in food-contact materials affect adipogenesis in 3T3-L1 cells. J. Steroid Biochem. Mol. Biol. 2018, 178, 322–332. [Google Scholar] [CrossRef] [PubMed]
- Campanale, C.; Galafassi, S.; Savino, I.; Massarelli, C.; Ancona, V.; Volta, P.; Uricchio, V.F. Microplastics pollution in the terrestrial environments: Poorly known diffuse sources and implications for plants. Sci. Total Environ. 2022, 805, 150431. [Google Scholar] [CrossRef] [PubMed]
- Ivleva, N.P.; Wiesheu, A.C.; Niessner, R. Microplastic in Aquatic Ecosystems. Angew. Chem. Int. Ed. 2017, 56, 1720–1739. [Google Scholar] [CrossRef] [PubMed]
- Karalija, E.; Carbó, M.; Coppi, A.; Colzi, I.; Dainelli, M.; Gašparović, M.; Grebenc, T.; Gonnelli, C.; Papadakis, V.; Pilić, S.; et al. Interplay of plastic pollution with algae and plants: Hidden danger or a blessing? J. Hazard. Mater. 2022, 438, 129450. [Google Scholar] [CrossRef]
- Toussaint, B.; Raffael, B.; Angers-Loustau, A.; Gilliland, D.; Kestens, V.; Petrillo, M.; Rio-Echevarria, I.M.; van den Eede, G. Review of micro- and nanoplastic contamination in the food chain. Food Addit. Contam. Part A 2019, 36, 639–673. [Google Scholar] [CrossRef]
- Vitali, C.; Peters, R.; Janssen, H.-G.; Nielen, M.W.F. Microplastics and nanoplastics in food, water, and beverages, part I. Occurrence. TrAC Trends Anal. Chem. 2022, 116670. [Google Scholar] [CrossRef]
- Habib, R.Z.; Poulose, V.; Alsaidi, R.; Al Kendi, R.; Iftikhar, S.H.; Mourad, A.I.; Kittaneh, W.F.; Thiemann, T. Plastic cutting boards as a source of microplastics in meat. Food Addit. Contam. Part A Chem. Anal. Control Expo Risk Assess. 2022, 39, 609–619. [Google Scholar] [CrossRef]
- Ajaj, A.; J’Bari, S.; Ononogbo, A.; Buonocore, F.; Bear, J.C.; Mayes, A.G.; Morgan, H. An Insight into the Growing Concerns of Styrene Monomer and Poly(Styrene) Fragment Migration into Food and Drink Simulants from Poly(Styrene) Packaging. Foods 2021, 10, 1136. [Google Scholar] [CrossRef]
- Fasihnia, S.H.; Peighambardoust, S.H.; Peighambardoust, S.J.; Oromiehie, A.; Soltanzadeh, M.; Peressini, D. Migration analysis, antioxidant, and mechanical characterization of polypropylene-based active food packaging films loaded with BHA, BHT, and TBHQ. J. Food Sci. 2020, 85, 2317–2328. [Google Scholar] [CrossRef] [PubMed]
- Hahladakis, J.N.; Velis, C.A.; Weberb, R.; Iacovidoua, E.; Purnella, P. An overview of chemical additives present in plastics: Migration, release, fate and environmental impact during their use, disposal and recycling. J. Hazard. Mater. 2018, 344, 179–199. [Google Scholar] [CrossRef] [PubMed]
- Castle, L.; Mayo, A.; Crews, C.; Gilbert, J. Migration of Poly(ethylene terephthalate) (PET) Oligomers from PET Plastics into Foods during Microwave and Conventional Cooking and into Bottled Beverages. J. Food Prot. 1989, 52, 337–342. [Google Scholar] [CrossRef] [PubMed]
- Galotto, M.; Guarda, A. Suitability of alternative fatty food simulants to study the effect of thermal and microwave heating on overall migration of plastic packaging. Packag. Technol. Sci. 2004, 17, 219–223. [Google Scholar] [CrossRef]
- Mercea, P.; Losher, C.; Herburger, M.; Piringer, O.G.; Tosa, V.; Cassart, M.; Dawkins, G.; Faust, B. Repeated migration of additives from a polymeric article in food simulants. Polym. Test. 2020, 85, 106436. [Google Scholar] [CrossRef]
- López-Cervantes, J.; Sánchez-Machado, D.; Simal-Lozano, J.; Paseiro-Losada, P. Migration of Ethylene Terephthalate Oligomers from Roasting Bags into Olive Oil. Chromatographia 2003, 58, 321–326. [Google Scholar] [CrossRef]
- Cai, R.; Nthoiwa, K.; Ge, C. Effect of Microwave Heating on the Migration of Additives from PS, PP and PET Container into Food Simulants. J. Appl. Packag. Res. 2014, 6, 11–22. [Google Scholar] [CrossRef] [Green Version]
- Wang, Q.; Storm, B. Migration Study of Polypropylene (PP) Oil Blends in Food Simulants. Macromol. Symp. 2006, 242, 307–314. [Google Scholar] [CrossRef]
- Begley, T.H.; Gay, M.L.; Hollifield, H.C. Determination of migrants in and migration from nylon food packaging. Food Addit. Contam. 1995, 12, 671–676. [Google Scholar] [CrossRef]
- El-Ziney, M.G.; Tawfik, M.S. Migration levels of monostyrene from polystyrene containers to dairy products. MOJ Food Process Technol. 2016, 3, 267–271. [Google Scholar] [CrossRef] [Green Version]
- Kedzierski, M.; Lechat, B.; Sire, O.; Maguer, G.; Tilly, V.; Bruzaud, S. Microplastic contamination of packaged meat: Occurrence and associated risks. Food Packag. Shelf Life 2020, 24, 100489. [Google Scholar] [CrossRef]
- Cella, C.; La Spina, R.; Mehn, D.; Fumagalli, F.; Ceccone, G.; Valsesia, A.; Gilliland, D. Detecting Micro- and Nanoplastics Released from Food Packaging: Challenges and Analytical Strategies. Polymers 2022, 14, 1238. [Google Scholar] [CrossRef] [PubMed]
- Shruti, V.C.; Pérez-Guevara, F.; Elizalde-Martínez, I.; Kutralam-Muniasamy, G. First study of its kind on the microplastic contamination of soft drinks, cold tea and energy drinks-Future research and environmental considerations. Sci. Total Environ. 2020, 726, 138580. [Google Scholar] [CrossRef]
- Shruti, V.C.; Pérez-Guevara, F.; Elizalde-Martínez, I.; Kutralam-Muniasamy, G. Toward a unified framework for investigating micro(nano)plastics in packaged beverages intended for human consumption. Environ. Pollut. 2021, 268, 115811. [Google Scholar] [CrossRef] [PubMed]
- MIEL, W.S.H. Honey. Available online: https://weynshoning.be/en/products/honey/ (accessed on 6 May 2022).
- Legislation UK. Council Directive 2001/110/EC of 20 December 2001 Relating to Honey. 2001. Available online: https://www.legislation.gov.uk/eudr/2001/110/contents (accessed on 25 June 2022).
- Zawawi, N.; Chong, P.J.; Mohd Tom, N.N.; Saiful Anuar, N.S.; Mohammad, S.M.; Ismail, N.; Jusoh, A.Z. Establishing Relationship between Vitamins, Total Phenolic and Total Flavonoid Content and Antioxidant Activities in Various Honey Types. Molecules 2021, 26, 4399. [Google Scholar] [CrossRef]
- Popek, S. Identification of honey types. Nahrung 2003, 47, 39–40. [Google Scholar] [CrossRef] [PubMed]
- Hellwig, M.; Ruckriemen, J.; Sandner, D.; Henle, T. Unique Pattern of Protein-Bound Maillard Reaction Products in Manuka (Leptospermum scoparium) Honey. J. Agric. Food Chem. 2017, 65, 3532–3540. [Google Scholar] [CrossRef]
- Eroglu, O.; Deniz, T.; Kisa, U.; Comu, F.M.; Kaygusuz, S.; Kocak, O.M. The effect of different types of honey on healing infected wounds. J. Wound Care 2018, 27, S18–S25. [Google Scholar] [CrossRef]
- Kardamas. Varieties of Greek Honey. Available online: https://www.kardamas.com/blog/varieties-of-greek-honey (accessed on 1 May 2022).
- Nagai, T.; Kai, N.; Tanoue, Y.; Suzuki, N. Chemical properties of commercially available honey species and the functional properties of caramelization and Maillard reaction products derived from these honey species. J. Food Sci. Technol. 2018, 55, 586–597. [Google Scholar] [CrossRef]
- Akbulut, M.; Ozcan, M.M.; Coklar, H. Evaluation of antioxidant activity, phenolic, mineral contents and some physicochemical properties of several pine honeys collected from Western Anatolia. Int. J. Food Sci. Nutr. 2009, 60, 577–589. [Google Scholar] [CrossRef]
- Hussein, S.Z.; Yusoff, K.M.; Makpol, S.; Yusof, Y.A. Antioxidant capacities and total phenolic contents increase with gamma irradiation in two types of Malaysian honey. Molecules 2011, 16, 6378–6395. [Google Scholar] [CrossRef] [PubMed]
- Molaveisi, M.; Beigbabaei, A.; Akbari, E.; Noghabi, M.S.; Mohamadi, M. Kinetics of temperature effect on antioxidant activity, phenolic compounds and color of Iranian jujube honey. Heliyon 2019, 5, e01129. [Google Scholar] [CrossRef] [Green Version]
- Ranjbar, A.M.; Sadeghpour, O.; Khanavi, M.; Shams Ardekani, M.R.; Moloudian, H.; Hajimahmoodi, M. Effects of the Deslagging Process on some Physicochemical Parameters of Honey. Iran. J. Pharm. Res. 2015, 14, 657–662. [Google Scholar] [PubMed]
- Starowicz, M.; Ostaszyk, A.; Zielinski, H. The Relationship between the Browning Index, Total Phenolics, Color, and Antioxidant Activity of Polish-Originated Honey Samples. Foods 2021, 10, 967. [Google Scholar] [CrossRef] [PubMed]
- Stagos, D.; Soulitsiotis, N.; Tsadila, C.; Papaeconomou, S.; Arvanitis, C.; Ntontos, A.; Karkanta, F.; Adamou-Androulaki, S.; Petrotos, K.; Spandidos, D.A.; et al. Antibacterial and antioxidant activity of different types of honey derived from Mount Olympus in Greece. Int. J. Mol. Med. 2018, 42, 726–734. [Google Scholar] [CrossRef] [Green Version]
- Dreamstime. Honey of Different Colors in the Same Glass Jars on the Bazaar in Mostar, Bosnia and Herzegovina. Available online: https://www.dreamstime.com/honey-different-colors-same-glass-jars-bazaar-mostar-bosnia-herzegovina-honey-different-colors-image168450678 (accessed on 6 May 2022).
- MartÍNez, R.; Schvezov, N.; Brumovsky, L.; Pucciarelli, A. Influence of temperature and packaging type on quality parameters and antimicrobial properties during Yateí honey storage. Food Sci. Technol. 2017, 38, 196–202. [Google Scholar] [CrossRef] [Green Version]
- Petretto, G.L.; Tuberoso, C.I.; Vlahopoulou, G.; Atzei, A.; Mannu, A.; Zrira, S.; Pintore, G. Volatiles, color characteristics and other physico-chemical parameters of commercial Moroccan honeys. Nat. Prod. Res. 2016, 30, 286–292. [Google Scholar] [CrossRef]
- Otmani, I.; Abdennour, C.; Dridi, A.; Kahalerras, L.; Halima-Salem, A. Characteristics of the bitter and sweet honey from Algeria Mediterranean coast. Vet. World 2019, 12, 551–557. [Google Scholar] [CrossRef] [Green Version]
- Al-Habsi, N.A.; Davis, F.J.; Niranjan, K. Development of novel methods to determine crystalline glucose content of honey based on DSC, HPLC, and Viscosity measurements, and their use to examine the setting propensity of honey. J. Food Sci. 2013, 78, E845–E852. [Google Scholar] [CrossRef]
- Zamora, M.; Chirife, J. Determination of water activity change due to crystallization in honeys from Argentina. Food Control 2006, 17, 59–64. [Google Scholar] [CrossRef] [Green Version]
- Galgali, P.; Varma, A.; Puntambekar, U.; Gokhale, D. Towards Biodegradable Polyolefins: Strategy of Anchoring Minute Quantities of Monosaccharides and Disaccharides onto Functionalized Polystyrene, and Their Effect on Facilitating Polymer Biodegradation Electronic Supplementary Information (ESI) Available: Experimental Details and Weight Loss Data. Chem. Commun. 2002, 2002, 2884–2885. Available online: http://0-www-rsc-org.brum.beds.ac.uk/suppdata/cc/b2/b209254a (accessed on 25 June 2022). [CrossRef]
- Jang, J.-C.; Shin, P.-K.; Yoon, J.-S.; Lee, I.-M.; Lee, H.-S.; Kim, M.-N. Glucose effect on the biodegradation of plastics by compost from food garbage. Polym. Degrad. Stab. 2002, 76, 155–159. [Google Scholar] [CrossRef]
- Kedzierska-Matysek, M.; Florek, M.; Wolanciuk, A.; Skalecki, P.; Litwinczuk, A. Characterisation of viscosity, colour, 5-hydroxymethylfurfural content and diastase activity in raw rape honey (Brassica napus) at different temperatures. J. Food Sci. Technol. 2016, 53, 2092–2098. [Google Scholar] [CrossRef] [PubMed] [Green Version]
- Aljohar, H.I.; Maher, H.M.; Albaqami, J.; Al-Mehaizie, M.; Orfali, R.; Orfali, R.; Alrubia, S. Physical and chemical screening of honey samples available in the Saudi market: An important aspect in the authentication process and quality assessment. Saudi Pharm. J. 2018, 26, 932–942. [Google Scholar] [CrossRef]
- Hailu, D.; Belay, A. Melissopalynology and antioxidant properties used to differentiate Schefflera abyssinica and polyfloral honey. PLoS ONE 2020, 15, e0240868. [Google Scholar] [CrossRef]
- Bodor, Z.; Benedek, C.; Urbin, Á.; Szabó, D.; Sipos, L. Colour of honey: Can we trust the Pfund scale?—An alternative graphical tool covering the whole visible spectra. LWT 2021, 149, 111859. [Google Scholar] [CrossRef]
- MIEL, W.S.H. Colour and Taste of the Honey. Available online: https://weynshoning.be/en/bees-and-honey/honey-classification/colour-and-taste/ (accessed on 6 May 2022).
- Cavaco, T.; Figueira, A.C.; Gonzalez-Dominguez, R.; Sayago, A.; Fernandez-Recamales, A. Evolution of Physicochemical Parameters during the Thermal-Based Production of Agua-mel, a Traditional Portuguese Honey-Related Food Product. Molecules 2021, 27, 57. [Google Scholar] [CrossRef]
- Jalaludin, I.; Kim, J. Comparison of ultraviolet and refractive index detections in the HPLC analysis of sugars. Food Chem. 2021, 365, 130514. [Google Scholar] [CrossRef]
- Ghramh, H.A.; Khan, K.A.; Ahmed, Z.; Ansari, M.J. Quality evaluation of Saudi honey harvested from the Asir province by using high-performance liquid chromatography (HPLC). Saudi J. Biol. Sci. 2020, 27, 2097–2105. [Google Scholar] [CrossRef] [PubMed]
- Brudzynski, K.; Sjaarda, C.; Maldonado-Alvarez, L. A new look on protein-polyphenol complexation during honey storage: Is this a random or organized event with the help of dirigent-like proteins? PLoS ONE 2013, 8, e72897. [Google Scholar] [CrossRef] [Green Version]
- Castro-Vazquez, L.; Diaz-Maroto, M.C.; Gonzalez-Vinas, M.A.; de la Fuente, E.; Perez-Coello, M.S. Influence of storage conditions on chemical composition and sensory properties of citrus honey. J. Agric. Food Chem. 2008, 56, 1999–2006. [Google Scholar] [CrossRef] [PubMed]
- Da Silva, P.M.; Gonzaga, L.V.; de Azevedo, M.S.; Biluca, F.C.; Schulz, M.; Costa, A.C.O.; Fett, R. Stability of volatile compounds of honey during prolonged storage. J. Food Sci. Technol. 2020, 57, 1167–1182. [Google Scholar] [CrossRef] [PubMed]
- Fasasi, K.A. Physicochemical attributes of Nigerian natural honey from honeybees (Apis mellifera adansonii) (Hymenoptera: Apidae) and its shelf life in storage at room temperature. Pak. J. Biol. Sci. 2012, 15, 1027–1033. [Google Scholar] [CrossRef]
- Seraglio, S.K.T.; Bergamo, G.; Gonzaga, L.V.; Fett, R.; Costa, A.C.O. Effect of long-term and heating storage on honey visible spectrum: An alternative parameter for quality monitoring of bracatinga honeydew honey. J. Food Sci. Technol. 2021, 58, 4815–4822. [Google Scholar] [CrossRef]
- Kedzierska-Matysek, M.; Florek, M.; Wolanciuk, A.; Skalecki, P. Effect of freezing and room temperatures storage for 18 months on quality of raw rapeseed honey (Brassica napus). J. Food Sci. Technol. 2016, 53, 3349–3355. [Google Scholar] [CrossRef] [PubMed] [Green Version]
- Turkmen, N.; Sari, F.; Poyrazoglu, E.S.; Velioglu, Y.S. Effects of prolonged heating on antioxidant activity and colour of honey. Food Chem. 2006, 95, 653–657. [Google Scholar] [CrossRef]
- Sakata, Y.; Uddin, M.A.; Muto, A. Degradation of polyethylene and polypropylene into fuel oil by using solid acid and non-acid catalysts. J. Anal. Appl. Pyrolysis 1999, 51, 135–155. [Google Scholar] [CrossRef]
- Zhang, L.; Tsui, T.H.; Loh, K.C.; Dai, Y.; Tong, Y.W. Effects of plastics on reactor performance and microbial communities during acidogenic fermentation of food waste for production of volatile fatty acids. Bioresour. Technol. 2021, 337, 125481. [Google Scholar] [CrossRef]
- Fauzi, N.; Farid, M. High-pressure processing of Manuka honey: Brown pigment formation, improvement of antibacterial activity and hydroxymethylfurfural content. Int. J. Food Sci. Technol. 2014, 50, 178–185. [Google Scholar] [CrossRef] [Green Version]
- Stefas, D.; Gyftokostas, N.; Nanou, E.; Kourelias, P.; Couris, S. Laser-Induced Breakdown Spectroscopy: An Efficient Tool for Food Science and Technology (from the Analysis of Martian Rocks to the Analysis of Olive Oil, Honey, Milk, and Other Natural Earth Products). Molecules 2021, 26, 4981. [Google Scholar] [CrossRef]
- Gok, S.; Severcan, M.; Goormaghtigh, E.; Kandemir, I.; Severcan, F. Differentiation of Anatolian honey samples from different botanical origins by ATR-FTIR spectroscopy using multivariate analysis. Food Chem. 2015, 170, 234–240. [Google Scholar] [CrossRef]
- Lorenc, Z.; Pasko, S.; Pakula, A.; Teper, D.; Salbut, L. An attempt to classify the botanical origin of honey using visible spectroscopy. J. Sci. Food Agric. 2021, 101, 5272–5277. [Google Scholar] [CrossRef] [PubMed]
- Batsoulis, A.N.; Siatis, N.G.; Kimbaris, A.C.; Alissandrakis, E.K.; Pappas, C.S.; Tarantilis, P.A.; Harizanis, P.C.; Polissiou, M.G. FT-Raman spectroscopic simultaneous determination of fructose and glucose in honey. J. Agric. Food Chem. 2005, 53, 207–210. [Google Scholar] [CrossRef]
- Tahir, H.E.; Xiaobo, Z.; Zhihua, L.; Jiyong, S.; Zhai, X.; Wang, S.; Mariod, A.A. Rapid prediction of phenolic compounds and antioxidant activity of Sudanese honey using Raman and Fourier transform infrared (FT-IR) spectroscopy. Food Chem. 2017, 226, 202–211. [Google Scholar] [CrossRef]
- Anguebes, F.; Pat, L.; Ali, B.; Guerrero, A.; Cordova, A.V.; Abatal, M.; Garduza, J.P. Application of Multivariable Analysis and FTIR-ATR Spectroscopy to the Prediction of Properties in Campeche Honey. J. Anal. Methods Chem. 2016, 2016, 5427526. [Google Scholar] [CrossRef] [PubMed] [Green Version]
- Huang, F.; Song, H.; Guo, L.; Guang, P.; Yang, X.; Li, L.; Zhao, H.; Yang, M. Detection of adulteration in Chinese honey using NIR and ATR-FTIR spectral data fusion. Spectrochim. Acta Part A Mol. Biomol. Spectrosc. 2020, 235, 118297. [Google Scholar] [CrossRef] [PubMed]
- Sotiropoulou, N.S.; Xagoraris, M.; Revelou, P.K.; Kaparakou, E.; Kanakis, C.; Pappas, C.; Tarantilis, P. The Use of SPME-GC-MS IR and Raman Techniques for Botanical and Geographical Authentication and Detection of Adulteration of Honey. Foods 2021, 10, 1671. [Google Scholar] [CrossRef]
- Riswahyuli, Y.; Rohman, A.; Setyabudi, F.; Raharjo, S. Indonesian wild honey authenticity analysis using attenuated total reflectance-fourier transform infrared (ATR-FTIR) spectroscopy combined with multivariate statistical techniques. Heliyon 2020, 6, e03662. [Google Scholar] [CrossRef]
- Li, S.; Shan, Y.; Zhu, X.; Zhang, X.; Ling, G. Detection of honey adulteration by high fructose corn syrup and maltose syrup using Raman spectroscopy. J. Food Compos. Anal. 2012, 28, 69–74. [Google Scholar] [CrossRef]
- Carabetta, S.; Di Sanzo, R.; Campone, L.; Fuda, S.; Rastrelli, L.; Russo, M. High-Performance Anion Exchange Chromatography with Pulsed Amperometric Detection (HPAEC-PAD) and Chemometrics for Geographical and Floral Authentication of Honeys from Southern Italy (Calabria region). Foods 2020, 9, 1625. [Google Scholar] [CrossRef]
- Aykas, D.P.; Shotts, M.-L.; Rodriguez-Saona, L.E. Authentication of commercial honeys based on Raman fingerprinting and pattern recognition analysis. Food Control 2020, 117, 107346. [Google Scholar] [CrossRef]
- Raypah, M.E.; Omar, A.F.; Muncan, J.; Zulkurnain, M.; Abdul Najib, A.R. Identification of Stingless Bee Honey Adulteration Using Visible-Near Infrared Spectroscopy Combined with Aquaphotomics. Molecules 2022, 27, 2324. [Google Scholar] [CrossRef] [PubMed]
- De Souza, R.R.; Fernandes, D.D.S.; Diniz, P. Honey authentication in terms of its adulteration with sugar syrups using UV-Vis spectroscopy and one-class classifiers. Food Chem. 2021, 365, 130467. [Google Scholar] [CrossRef] [PubMed]
- Hu, S.; Li, H.; Chen, C.; Chen, C.; Zhao, D.; Dong, B.; Lv, X.; Zhang, K.; Xie, Y. Raman spectroscopy combined with machine learning algorithms to detect adulterated Suichang native honey. Sci. Rep. 2022, 12, 3456. [Google Scholar] [CrossRef] [PubMed]
- Notardonato, I.; Passarella, S.; Ianiri, G.; Di Fiore, C.; Russo, M.V.; Avino, P. Analytical Scheme for Simultaneous Determination of Phthalates and Bisphenol A in Honey Samples Based on Dispersive Liquid-Liquid Microextraction Followed by GC-IT/MS. Effect of the Thermal Stress on PAE/BP-A Levels. Methods Protoc. 2020, 3, 23. [Google Scholar] [CrossRef] [Green Version]
- Von Eyken, A.; Ramachandran, S.; Bayen, S. Suspected-target screening for the assessment of plastic-related chemicals in honey. Food Control 2020, 109, 106941. [Google Scholar] [CrossRef]
- Al Naggar, Y.; Brinkmann, M.; Sayes, C.M.; Al-Kahtani, S.N.; Dar, S.A.; El-Seedi, H.R.; Grunewald, B.; Giesy, J.P. Are Honey Bees at Risk from Microplastics? Toxics 2021, 9, 109. [Google Scholar] [CrossRef]
- Wang, K.; Li, J.H.; Zhao, L.W.; Mu, X.Y.; Wang, C.; Wang, M.; Xue, X.F.; Qi, S.Z.; Wu, L.M. Gut microbiota protects honey bees (Apis mellifera L.) against polystyrene microplastics exposure risks. J. Hazard. Mater. 2021, 402, 123828. [Google Scholar] [CrossRef]
- Liebezeit, G.; Liebezeit, E. Non-pollen particulates in honey and sugar. Food Addit. Contam. Part A 2013, 30, 2136–2140. [Google Scholar] [CrossRef]
- Gerd Liebezeit, E.L. Origin of Synthetic Particles in Honeys. Pol. J. Food Nutr. Sci. 2015, 65, 143–147. [Google Scholar] [CrossRef] [Green Version]
- Edo, C.; Fernández-Alba, A.R.; Vejsnæs, F.; van der Steen, J.J.M.; Fernández-Piñas, F.; Rosal, R. Honeybees as active samplers for microplastics. Sci. Total Environ. 2021, 767, 144481. [Google Scholar] [CrossRef] [PubMed]
- Jin, M.K.; Wang, X.; Ren, T.; Wang, J.; Shan, J.J. Microplastics contamination in food and beverages: Direct exposure to humans. J. Food Sci. 2021, 86, 2816–2837. [Google Scholar] [CrossRef] [PubMed]
- Vinay Kumar, B.N.; Loschel, L.A.; Imhof, H.K.; Loder, M.G.J.; Laforsch, C. Analysis of microplastics of a broad size range in commercially important mussels by combining FTIR and Raman spectroscopy approaches. Environ. Pollut. 2021, 269, 116147. [Google Scholar] [CrossRef] [PubMed]
- Leung, M.M.; Ho, Y.W.; Lee, C.H.; Wang, Y.; Hu, M.; Kwok, K.W.H.; Chua, S.L.; Fang, J.K. Improved Raman spectroscopy-based approach to assess microplastics in seafood. Environ. Pollut. 2021, 289, 117648. [Google Scholar] [CrossRef] [PubMed]
- Leung, M.M.; Ho, Y.W.; Maboloc, E.A.; Lee, C.H.; Wang, Y.; Hu, M.; Cheung, S.G.; Fang, J.K. Determination of microplastics in the edible green-lipped mussel Perna viridis using an automated mapping technique of Raman microspectroscopy. J. Hazard. Mater. 2021, 420, 126541. [Google Scholar] [CrossRef] [PubMed]
- Tympa, L.E.; Katsara, K.; Moschou, P.N.; Kenanakis, G.; Papadakis, V.M. Do Microplastics Enter Our Food Chain via Root Vegetables? A Raman Based Spectroscopic Study on Raphanus sativus. Materials 2021, 14, 2329. [Google Scholar] [CrossRef] [PubMed]
- Prata, J.C.; Paço, A.; Reis, V.; da Costa, J.P.; Fernandes, A.J.S.; da Costa, F.M.; Duarte, A.C.; Rocha-Santos, T. Identification of microplastics in white wines capped with polyethylene stoppers using micro-Raman spectroscopy. Food Chem. 2020, 331, 127323. [Google Scholar] [CrossRef]
- Shruti, V.C.; Pérez-Guevara, F.; Roy, P.D.; Kutralam-Muniasamy, G. Analyzing microplastics with Nile Red: Emerging trends, challenges, and prospects. J. Hazard. Mater. 2022, 423, 127171. [Google Scholar] [CrossRef]
- Kang, H.; Park, S.; Lee, B.; Ahn, J.; Kim, S. Modification of a Nile Red Staining Method for Microplastics Analysis: A Nile Red Plate Method. Water 2020, 12, 3251. [Google Scholar] [CrossRef]
- El Hayany, B.; El Fels, L.; Quenea, K.; Dignac, M.F.; Rumpel, C.; Gupta, V.K.; Hafidi, M. Microplastics from lagooning sludge to composts as revealed by fluorescent staining- image analysis, Raman spectroscopy and pyrolysis-GC/MS. J. Environ. Manag. 2020, 275, 111249. [Google Scholar] [CrossRef]
- Prata, J.C.; da Costa, J.P.; Fernandes, A.J.S.; da Costa, F.M.; Duarte, A.C.; Rocha-Santos, T. Selection of microplastics by Nile Red staining increases environmental sample throughput by micro-Raman spectroscopy. Sci. Total Environ. 2021, 783, 146979. [Google Scholar] [CrossRef]
- Lu, J.; Xue, Q.; Bai, H.; Wang, N. Design of a confocal micro-Raman spectroscopy system and research on microplastics detection. Appl. Opt. 2021, 60, 8375–8383. [Google Scholar] [CrossRef] [PubMed]
- Luo, Y.; Gibson, C.T.; Chuah, C.; Tang, Y.; Naidu, R.; Fang, C. Applying Raman imaging to capture and identify microplastics and nanoplastics in the garden. J. Hazard. Mater. 2022, 426, 127788. [Google Scholar] [CrossRef] [PubMed]
- Fang, C.; Luo, Y.; Zhang, X.; Zhang, H.; Nolan, A.; Naidu, R. Identification and visualisation of microplastics via PCA to decode Raman spectrum matrix towards imaging. Chemosphere 2021, 286, 131736. [Google Scholar] [CrossRef] [PubMed]
- Fang, C.; Sobhani, Z.; Zhang, X.; Gibson, C.T.; Tang, Y.; Naidu, R. Identification and visualisation of microplastics/nanoplastics by Raman imaging (ii): Smaller than the diffraction limit of laser? Water Res. 2020, 183, 116046. [Google Scholar] [CrossRef] [PubMed]
- Fang, C.; Sobhani, Z.; Zhang, X.; McCourt, L.; Routley, B.; Gibson, C.T.; Naidu, R. Identification and visualisation of microplastics/nanoplastics by Raman imaging (iii): Algorithm to cross-check multi-images. Water Res. 2021, 194, 116913. [Google Scholar] [CrossRef]
- Sobhani, Z.; Al Amin, M.; Naidu, R.; Megharaj, M.; Fang, C. Identification and visualisation of microplastics by Raman mapping. Anal. Chim. Acta 2019, 1077, 191–199. [Google Scholar] [CrossRef]
- Pironti, C.; Ricciardi, M.; Motta, O.; Miele, Y.; Proto, A.; Montano, L. Microplastics in the Environment: Intake through the Food Web, Human Exposure and Toxicological Effects. Toxics 2021, 9, 224. [Google Scholar] [CrossRef]
- Ivleva, N.P. Chemical Analysis of Microplastics and Nanoplastics: Challenges, Advanced Methods, and Perspectives. Chem. Rev. 2021, 121, 11886–11936. [Google Scholar] [CrossRef]
- Ji, Z.; Huang, Y.; Feng, Y.; Johansen, A.; Xue, J.; Tremblay, L.A.; Li, Z. Effects of pristine microplastics and nanoplastics on soil invertebrates: A systematic review and meta-analysis of available data. Sci. Total Environ. 2021, 788, 147784. [Google Scholar] [CrossRef]
- Makhdoumi, P.; Hossini, H.; Pirsaheb, M. A review of microplastic pollution in commercial fish for human consumption. Rev. Environ. Health 2022. [Google Scholar] [CrossRef]
- Zhang, Y.; Wang, S.; Olga, V.; Xue, Y.; Lv, S.; Diao, X.; Zhang, Y.; Han, Q.; Zhou, H. The potential effects of microplastic pollution on human digestive tract cells. Chemosphere 2022, 291, 132714. [Google Scholar] [CrossRef]
- Ragusa, A.; Svelato, A.; Santacroce, C.; Catalano, P.; Notarstefano, V.; Carnevali, O.; Papa, F.; Rongioletti, M.C.A.; Baiocco, F.; Draghi, S.; et al. Plasticenta: First evidence of microplastics in human placenta. Environ. Int. 2021, 146, 106274. [Google Scholar] [CrossRef] [PubMed]
- Meng, X.; Zhang, J.; Wang, W.; Gonzalez-Gil, G.; Vrouwenvelder, J.S.; Li, Z. Effects of nano- and microplastics on kidney: Physicochemical properties, bioaccumulation, oxidative stress and immunoreaction. Chemosphere 2022, 288, 132631. [Google Scholar] [CrossRef] [PubMed]
- Cheng, W.; Li, X.; Zhou, Y.; Yu, H.; Xie, Y.; Guo, H.; Wang, H.; Li, Y.; Feng, Y.; Wang, Y. Polystyrene microplastics induce hepatotoxicity and disrupt lipid metabolism in the liver organoids. Sci. Total Environ. 2022, 806, 150328. [Google Scholar] [CrossRef]
- Çobanoğlu, H.; Belivermiş, M.; Sıkdokur, E.; Kılıç, Ö.; Çayır, A. Genotoxic and cytotoxic effects of polyethylene microplastics on human peripheral blood lymphocytes. Chemosphere 2021, 272, 129805. [Google Scholar] [CrossRef]
- Junhao, C.; Xining, Z.; Xiaodong, G.; Li, Z.; Qi, H.; Siddique, K.H.M. Extraction and identification methods of microplastics and nanoplastics in agricultural soil: A review. J. Environ. Manag. 2021, 294, 112997. [Google Scholar] [CrossRef]


| Simulants | Contact Foods |
|---|---|
| 10% Ethanol/distilled water | Aqueous foods (pH > 4.5) |
| 3% Acetic acid | Acidic food (pH < 4.5) |
| 50% aq. Ethanol | Diary food products |
| 95% aq. Ethanol, olive, and corn oil | High fat content foods |
| Honey Discrimination | Examples of Honey Types |
|---|---|
| Geographical origin | Linden (Europe), Orange blossom (Spain and Mexico), Clover (New Zealand and Canada), Sage (California), Eucalyptus (Australia), Tupelo (Georgia/Florida), Dandelion (Eurasia), Wildflower (multiple flower sources or varieties), Manuka (New Zealand [88], Treatment of wounds [89]), Acacia (North America and Europe), Buckwheat (United States and parts of Canada), Sourwood (Southeast and Midwestern United States), Floral (Greek honey [90]) |
| Flower origin | Multi-flower Monofloral honeys: Acacia, litchi, orange, coffee lavender, blueberry, Eucalyptus, Rosemary, Forest [91] |
| Μode of production and/or presentation | Comb honey, chunk honey or cut comb in honey, drained honey, extracted honey, pressed honey, filtered honey |
Publisher’s Note: MDPI stays neutral with regard to jurisdictional claims in published maps and institutional affiliations. |
© 2022 by the authors. Licensee MDPI, Basel, Switzerland. This article is an open access article distributed under the terms and conditions of the Creative Commons Attribution (CC BY) license (https://creativecommons.org/licenses/by/4.0/).
Share and Cite
Katsara, K.; Kenanakis, G.; Alissandrakis, E.; Papadakis, V.M. Honey Quality and Microplastic Migration from Food Packaging: A Potential Threat for Consumer Health? Microplastics 2022, 1, 406-427. https://0-doi-org.brum.beds.ac.uk/10.3390/microplastics1030030
Katsara K, Kenanakis G, Alissandrakis E, Papadakis VM. Honey Quality and Microplastic Migration from Food Packaging: A Potential Threat for Consumer Health? Microplastics. 2022; 1(3):406-427. https://0-doi-org.brum.beds.ac.uk/10.3390/microplastics1030030
Chicago/Turabian StyleKatsara, Klytaimnistra, George Kenanakis, Eleftherios Alissandrakis, and Vassilis M. Papadakis. 2022. "Honey Quality and Microplastic Migration from Food Packaging: A Potential Threat for Consumer Health?" Microplastics 1, no. 3: 406-427. https://0-doi-org.brum.beds.ac.uk/10.3390/microplastics1030030