Sex Differences of Vitamin D Status across BMI Classes: An Observational Prospective Cohort Study


 , ,
, , 

Abstract
:1. Introduction
2. Material and Methods
2.1. Study Design
2.2. Setting
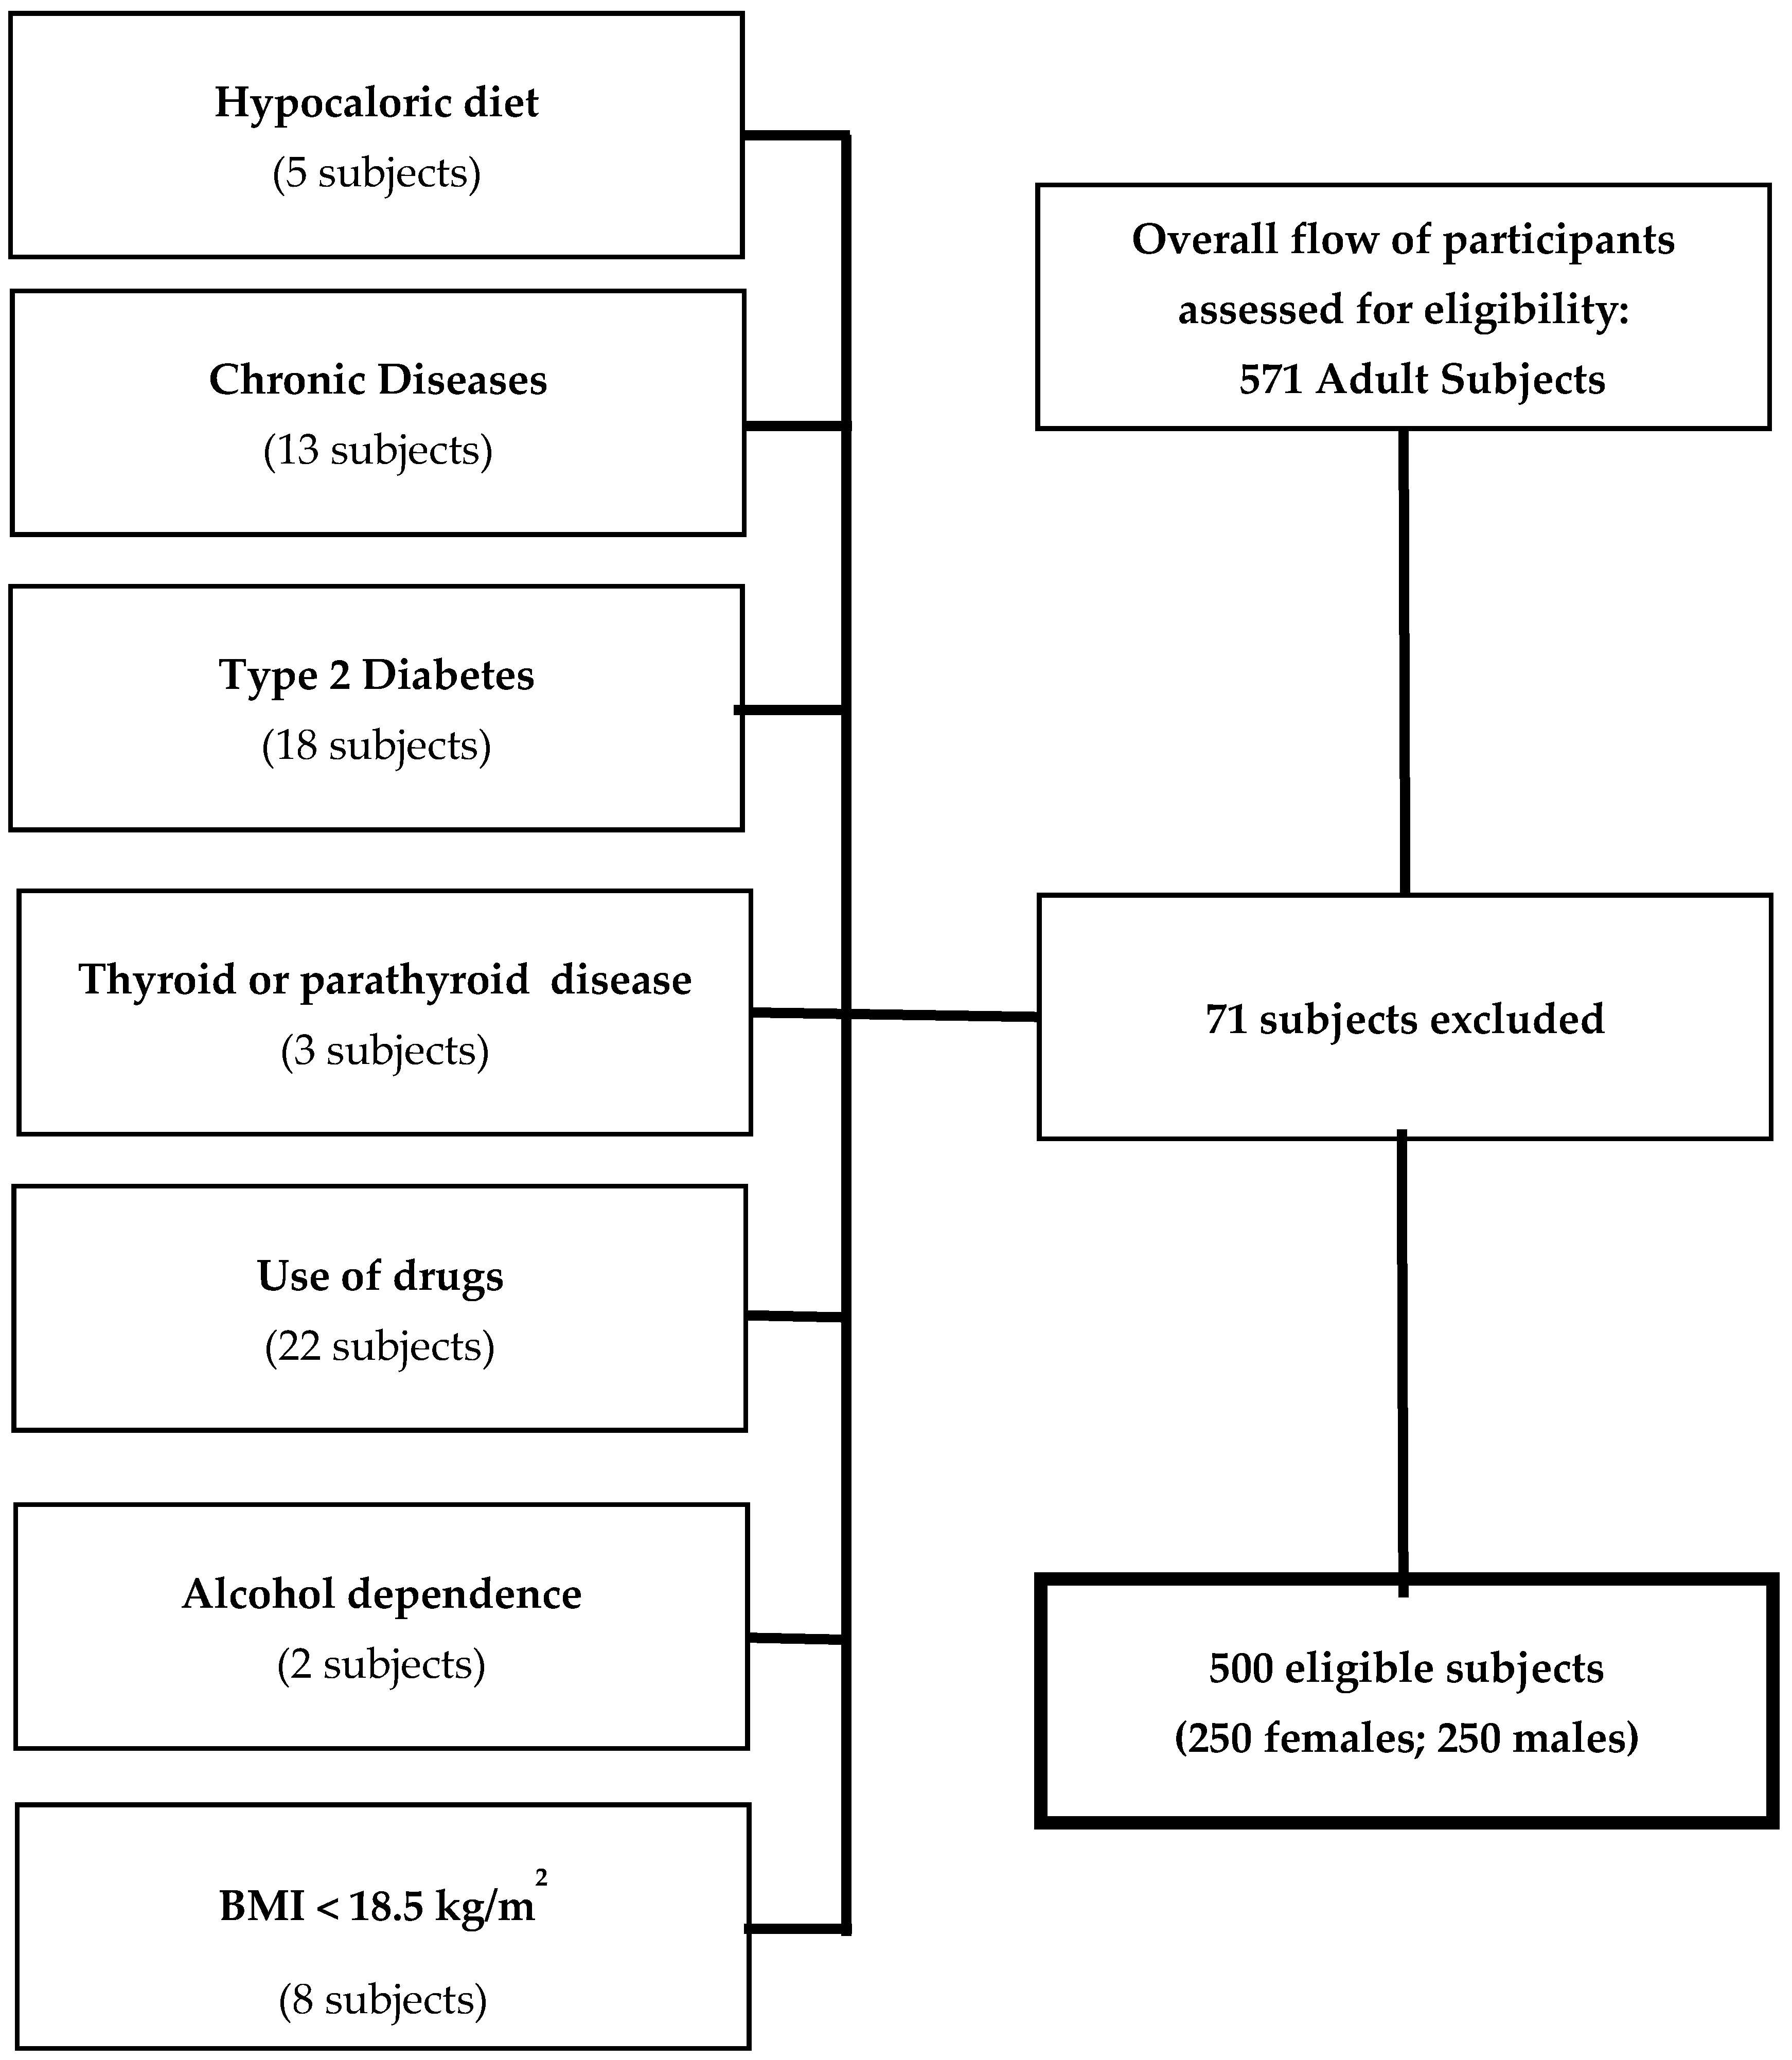
2.3. Participants
- Hypocaloric diet in the last three months (5 subjects);
- Chronic diseases that could interfere fluid homeostasis, such as liver or renal chronic diseases, cancer, acute or chronic inflammatory diseases (13 subjects);
- Altered concentration of serum creatinine, serum calcium, or albumin;
- Presence of T2DM (defined by criteria of the American Diabetes Association as follows: basal plasma glucose level ≥ 126 mg/dL on two occasions, or glycated hemoglobin (HbA1c) ≥ 6.5% (≥48 mmol/mol) on two occasions, or both at the same time. Participants on antidiabetic medication were considered to have T2DM (18 subjects);
- Uncontrolled thyroid or parathyroid disease (3 subjects);
- Current therapy with calcium, vitamin D supplementation or osteoporosis therapies, anti-inflammatory drugs, statin, and other hypolipidemic agents (22 subjects);
- Alcohol dependence diagnosed based on the Diagnostic and Statistical Manual of Mental Disorders (DSM)-V diagnostic criteria (2 subjects);
- Pacemakers or defibrillators which could potentially interfere with BIA assessment;
- Patients having a BMI lower than 18.5 kg/m2 (8 subjects).
2.4. Measurements
2.4.1. Anthropometric Measurements
2.4.2. Bioelectrical Impedance Analysis
2.4.3. Assay Methods
2.4.4. Bias
2.4.5. Study Size
2.4.6. Statistical Analysis
3. Results
3.1. Participants
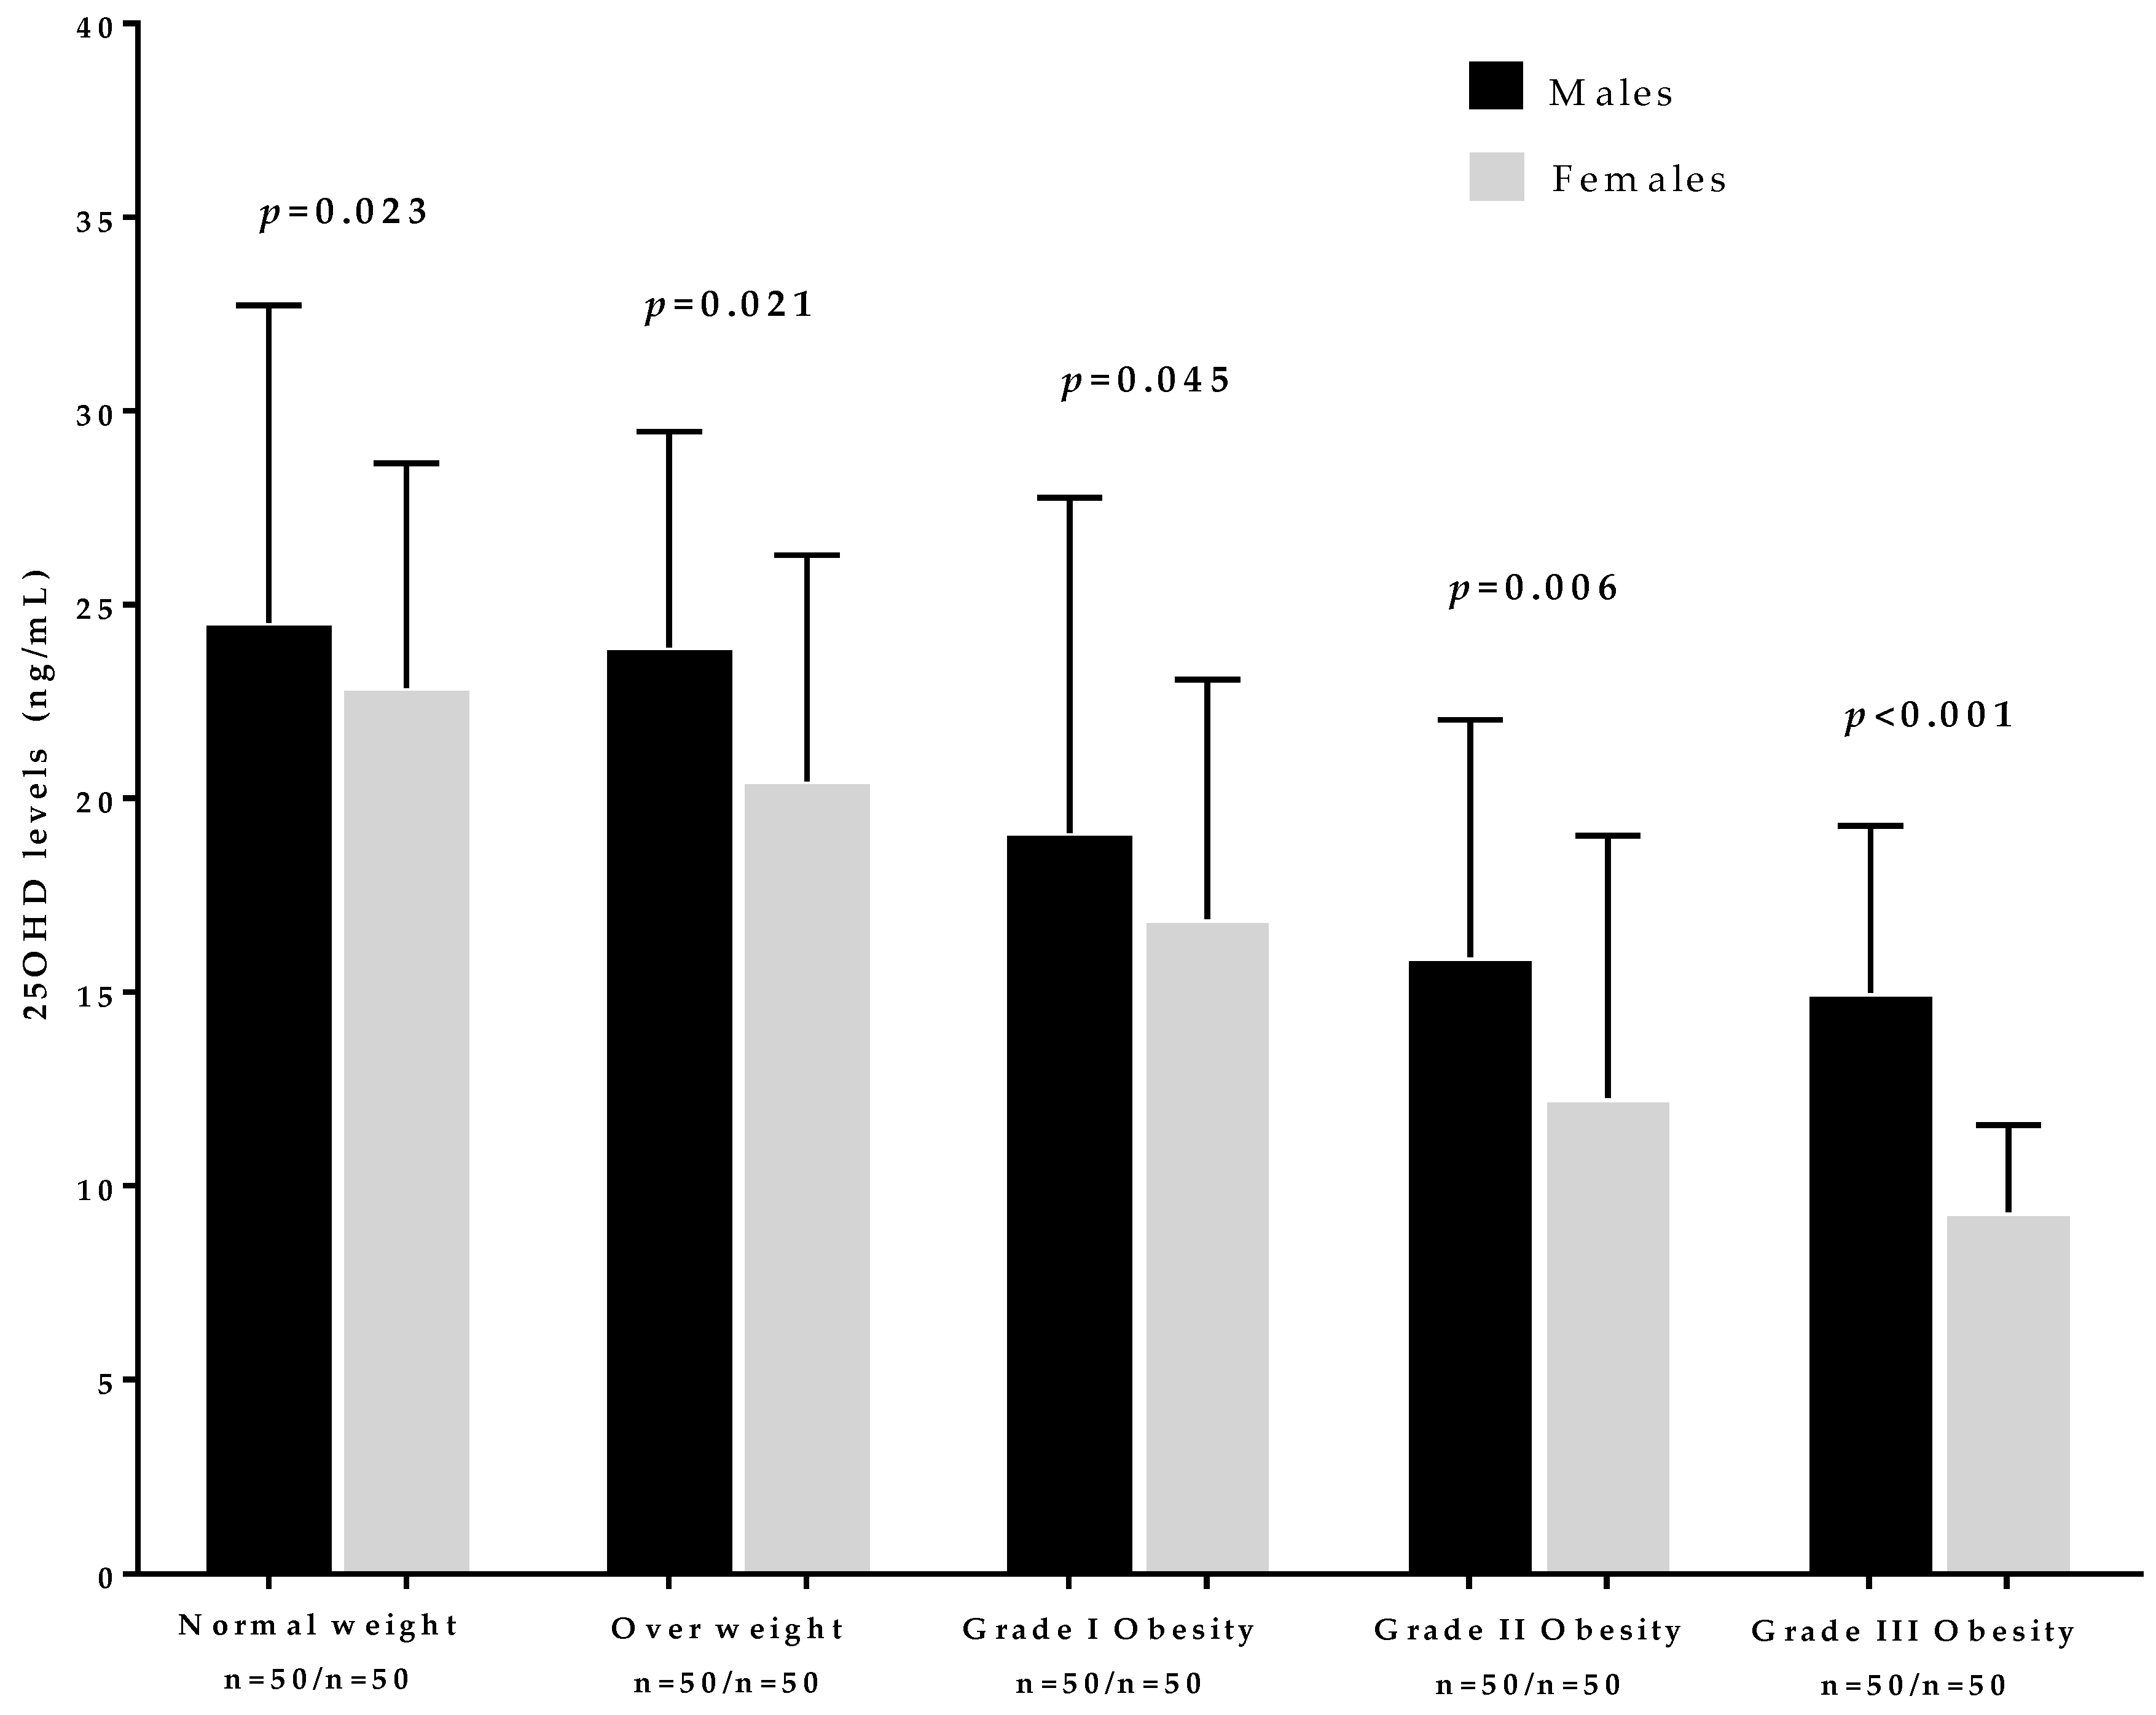
3.2. Descriptive Data
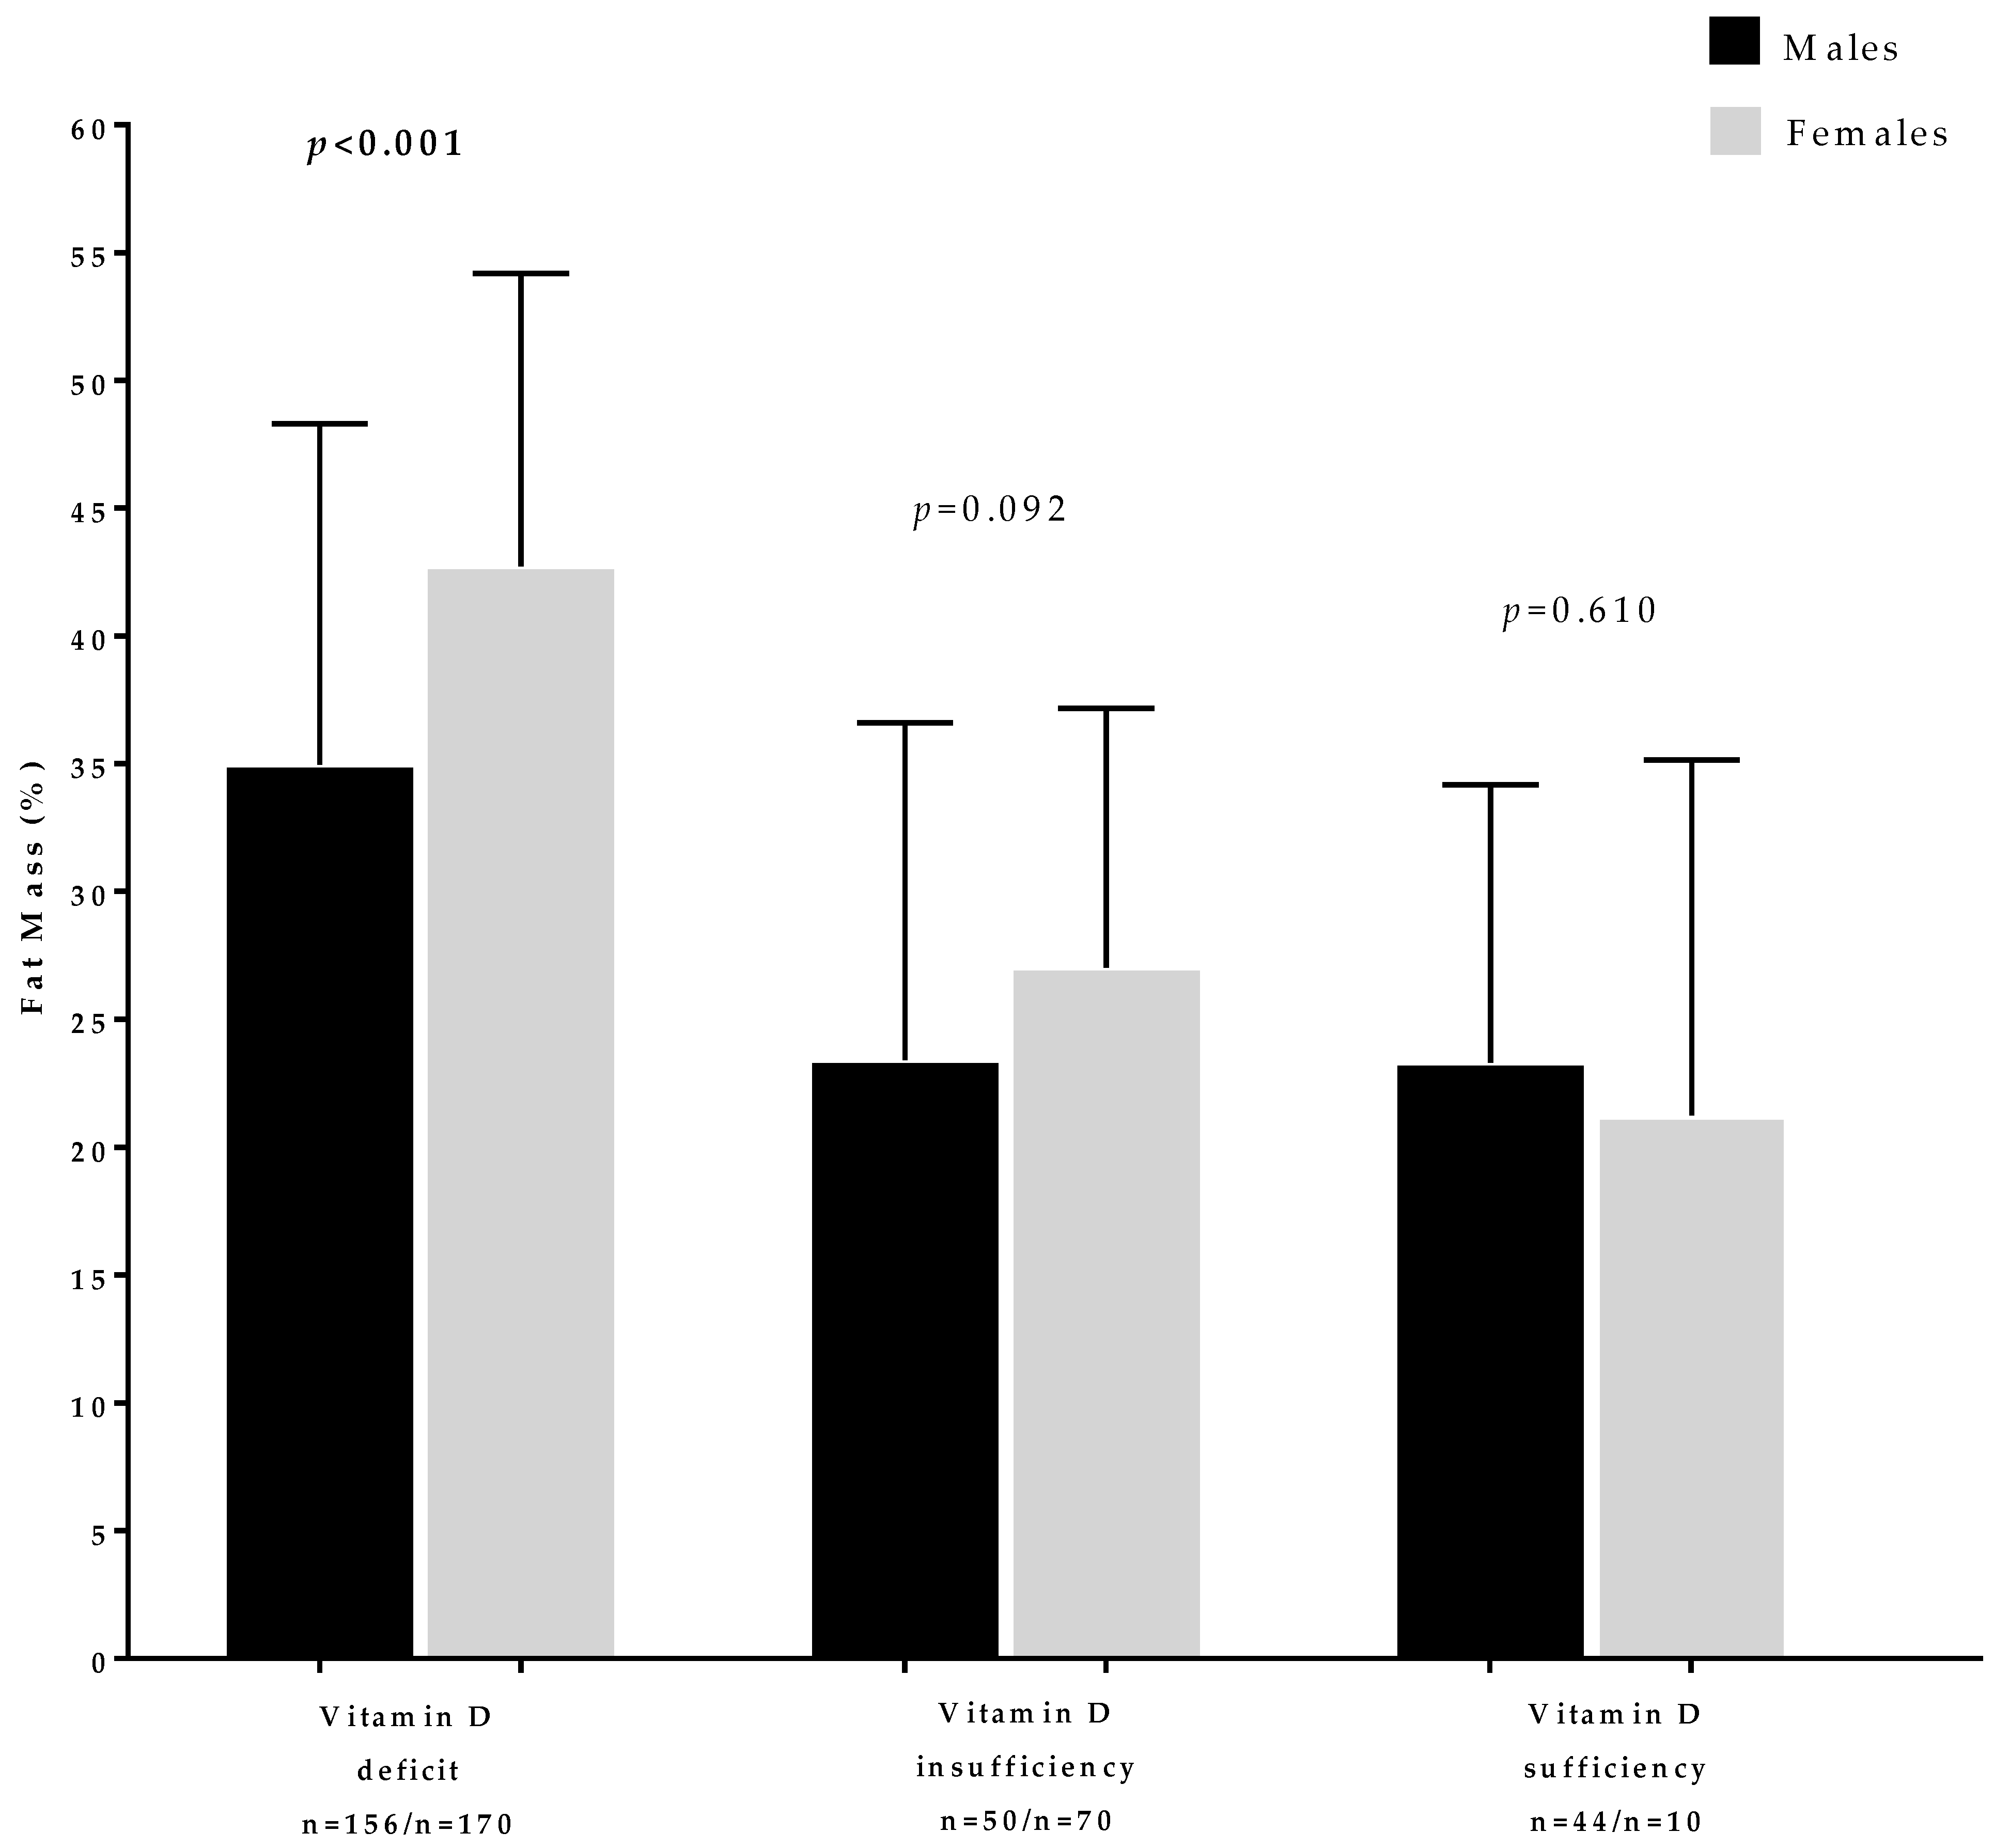
3.3. Impact of Sex Difference on Vitamin D Relationship with Age and Body Composition Parameters
4. Discussion
Author Contributions
Funding
Acknowledgments
Conflicts of Interest
Abbreviations
| 25OHD | serum concentration serum concentration of vitamin D |
| BMI | body mass index; BIA, bioelectrical impedance analysis |
| FM | fat mass |
| T1DM | type 1 diabetes |
| T2DM | type 2 diabetes |
| NHANES | National Health and Nutrition Examination Survey |
| PTH | parathyroid hormone |
| HbA1c | glycated hemoglobin |
| DSM | Diagnostic and Statistical Manual of Mental Disorders |
| WHO | World Health Organization |
| kHz | kilohertz |
| ESPEN | European Society of Parental and Enteral Nutrition |
| PhA | phase angle |
| Xc | reactance |
| R | resistance |
| CVs | coefficients of variation |
| FFM | free fat mass |
| TBW | total body water |
| ECW | extra-cellular water |
| ICW | intra-cellular water |
References
- Muscogiuri, G.; Mitri, J.; Mathieu, C.; Badenhoop, K.; Tamer, G.; Orio, F.; Mezza, T.; Vieth, R.; Colao, A.; Pittas, A. Mechanisms in endocrinology: Vitamin D as a potential contributor in endocrine health and disease. Eur. J. Endocrinol. 2014, 171, R101–R110. [Google Scholar] [CrossRef] [Green Version]
- Muscogiuri, G.; Altieri, B.; Annweiler, C.; Balercia, G.; Pal, H.B.; Boucher, B.J.; Cannell, J.J.; Foresta, C.; Grubler, M.R.; Kotsa, K.; et al. Vitamin D and chronic diseases: The current state of the art. Arch. Toxicol. 2017, 91, 97–107. [Google Scholar] [CrossRef]
- Muscogiuri, G.; Sorice, G.P.; Prioletta, A.; Policola, C.; Della Casa, S.; Pontecorvi, A.; Giaccari, A. 25-Hydroxyvitamin D concentration correlates with insulin-sensitivity and BMI in obesity. Obesity 2010, 18, 1906–1910. [Google Scholar] [CrossRef]
- Barrea, L.; Savastano, S.; Di Somma, C.; Savanelli, M.C.; Nappi, F.; Albanese, L.; Orio, F.; Colao, A. Low serum vitamin D-status, air pollution and obesity: A dangerous liaison. Rev. Endocr. Metab. Disord. 2017, 18, 207–214. [Google Scholar] [CrossRef] [Green Version]
- Savastano, S.; Barrea, L.; Savanelli, M.C.; Nappi, F.; Di Somma, C.; Orio, F.; Colao, A. Low vitamin D status and obesity: Role of nutritionist. Rev. Endocr. Metab. Disord. 2017, 18, 215–225. [Google Scholar] [CrossRef]
- Forrest, K.Y.; Stuhldreher, W.L. Prevalence and correlates of vitamin D deficiency in US adults. Nutr. Res. 2011, 31, 48–54. [Google Scholar] [CrossRef]
- Wortsman, J.; Matsuoka, L.Y.; Chen, T.C.; Lu, Z.; Holick, M.F. Decreased bioavailability of vitamin D in obesity. Am. J. Clin. Nutr. 2000, 72, 690–693. [Google Scholar] [CrossRef]
- Abbasi, A.A.; Amin, M.; Smiertka, J.K.; Grunberger, G.; MacPherson, B.; Hares, M.; Lutrzykowski, M.; Najar, A. Abnormalities of vitamin D and calcium metabolism after surgical treatment of morbid obesity: A study of 136 patients. Endocr. Pract. 2007, 13, 131–136. [Google Scholar] [CrossRef]
- Drincic, A.T.; Armas, L.A.; Van Diest, E.E.; Heaney, R.P. Volumetric dilution, rather than sequestration best explains the low vitamin D status of obesity. Obesity 2012, 20, 1444–1448. [Google Scholar] [CrossRef]
- Dawson-Hughes, B.; Harris, S.S.; Dallal, G.E. Plasma calcidiol, season, and serum parathyroid hormone concentrations in healthy elderly men and women. Am. J. Clin. Nutr. 1997, 65, 67–71. [Google Scholar] [CrossRef]
- Snijder, M.B.; van Dam, R.M.; Visser, M.; Deeg, D.J.; Dekker, J.M.; Bouter, L.M.; Seidell, J.C.; Lips, P. Adiposity in relation to vitamin D status and parathyroid hormone levels: A population-based study in older men and women. J. Clin. Endocrinol. Metab. 2005, 90, 4119–4123. [Google Scholar] [CrossRef] [Green Version]
- Bell, N.H.; Shaw, S.; Turner, R.T. Evidence that 1,25-dihydroxyvitamin D3 inhibits the hepatic production of 25-hydroxyvitamin D in man. J. Clin. Investig. 1984, 74, 1540–1544. [Google Scholar] [CrossRef]
- Johnson, L.K.; Hofso, D.; Aasheim, E.T.; Tanbo, T.; Holven, K.B.; Andersen, L.F.; Roislien, J.; Hjelmesaeth, J. Impact of gender on vitamin D deficiency in morbidly obese patients: A cross-sectional study. Eur. J. Clin. Nutr. 2012, 66, 83–90. [Google Scholar] [CrossRef]
- Carnevale, V.; Modoni, S.; Pileri, M.; Di Giorgio, A.; Chiodini, I.; Minisola, S.; Vieth, R.; Scillitani, A. Longitudinal evaluation of vitamin D status in healthy subjects from southern Italy: Seasonal and gender differences. Osteoporos. Int. 2001, 12, 1026–1030. [Google Scholar] [CrossRef]
- Savastano, S.; Di Somma, C.; Colao, A.; Barrea, L.; Orio, F.; Finelli, C.; Pasanisi, F.; Contaldo, F.; Tarantino, G. Preliminary data on the relationship between circulating levels of Sirtuin 4, anthropometric and metabolic parameters in obese subjects according to growth hormone/insulin-like growth factor-1 status. Growth Horm. IGF Res. 2015, 25, 28–33. [Google Scholar] [CrossRef]
- Savanelli, M.C.; Scarano, E.; Muscogiuri, G.; Barrea, L.; Vuolo, L.; Rubino, M.; Savastano, S.; Colao, A.; Di Somma, C. Cardiovascular risk in adult hypopituitaric patients with growth hormone deficiency: Is there a role for vitamin D? Endocrine 2016, 52, 111–119. [Google Scholar] [CrossRef]
- Barrea, L.; Di Somma, C.; Macchia, P.E.; Falco, A.; Savanelli, M.C.; Orio, F.; Colao, A.; Savastano, S. Influence of nutrition on somatotropic axis: Milk consumption in adult individuals with moderate-severe obesity. Clin. Nutr. 2017, 36, 293–301. [Google Scholar] [CrossRef] [Green Version]
- Waist Circumference and Waist-Hip Ratio. Available online: http://apps.who.int/iris/bitstream/10665/44583/1/9789241501491_eng.pdf (accessed on 7 July 2019).
- Yanovski, S.Z.; Hubbard, V.S.; Heymsfield, S.B.; Lukaski, H.C. Bioelectrical impedance analysis in body composition measurement: National Institutes of Health Technology Assessment Conference Statement. Am. J. Clin. Nutr. 1996, 64, 524S–532S. [Google Scholar] [CrossRef]
- Barrea, L.; Muscogiuri, G.; Di Somma, C.; Tramontano, G.; De Luca, V.; Illario, M.; Colao, A.; Savastano, S. Association between Mediterranean diet and hand grip strength in older adult women. Clin. Nutr. 2019, 38, 721–729. [Google Scholar] [CrossRef]
- Barrea, L.; Muscogiuri, G.; Di Somma, C.; Annunziata, G.; Megna, M.; Falco, A.; Balato, A.; Colao, A.; Savastano, S. Coffee consumption, metabolic syndrome and clinical severity of psoriasis: Good or bad stuff? Arch. Toxicol. 2018, 92, 1831–1845. [Google Scholar] [CrossRef]
- Savanelli, M.C.; Barrea, L.; Macchia, P.E.; Savastano, S.; Falco, A.; Renzullo, A.; Scarano, E.; Nettore, I.C.; Colao, A.; Di Somma, C. Preliminary results demonstrating the impact of Mediterranean diet on bone health. J. Transl. Med. 2017, 15, 81. [Google Scholar] [CrossRef] [Green Version]
- Kyle, U.G.; Bosaeus, I.; De Lorenzo, A.D.; Deurenberg, P.; Elia, M.; Manuel Gomez, J.; Lilienthal Heitmann, B.; Kent-Smith, L.; Melchior, J.C.; Pirlich, M.; et al. Bioelectrical impedance analysis-part II: Utilization in clinical practice. Clin. Nutr. 2004, 23, 1430–1453. [Google Scholar] [CrossRef]
- Barrea, L.; Muscogiuri, G.; Laudisio, D.; Somma, C.D.; Salzano, C.; Pugliese, G.; Alteriis, G.; Colao, A.; Savastano, S. Phase Angle: A Possible Biomarker to Quantify Inflammation in Subjects with Obesity and 25(OH)D Deficiency. Nutrients 2019, 11, 1747. [Google Scholar] [CrossRef] [Green Version]
- Barrea, L.; Muscogiuri, G.; Annunziata, G.; Laudisio, D.; de Alteriis, G.; Tenore, G.C.; Colao, A.; Savastano, S. A New Light on Vitamin D in Obesity: A Novel Association with Trimethylamine-N-Oxide (TMAO). Nutrients 2019, 11, 1310. [Google Scholar] [CrossRef] [Green Version]
- Holick, M.F.; Binkley, N.C.; Bischoff-Ferrari, H.A.; Gordon, C.M.; Hanley, D.A.; Heaney, R.P.; Murad, M.H.; Weaver, C.M.; Endocrine, S. Evaluation, treatment, and prevention of vitamin D deficiency: An Endocrine Society clinical practice guideline. J. Clin. Endocrinol. Metab. 2011, 96, 1911–1930. [Google Scholar] [CrossRef] [Green Version]
- Blum, M.; Dolnikowski, G.; Seyoum, E.; Harris, S.S.; Booth, S.L.; Peterson, J.; Saltzman, E.; Dawson-Hughes, B. Vitamin D(3) in fat tissue. Endocrine 2008, 33, 90–94. [Google Scholar] [CrossRef]
- Gallagher, D.; Heymsfield, S.B.; Heo, M.; Jebb, S.A.; Murgatroyd, P.R.; Sakamoto, Y. Healthy percentage body fat ranges: An approach for developing guidelines based on body mass index. Am. J. Clin. Nutr. 2000, 72, 694–701. [Google Scholar] [CrossRef]
- Gurrici, S.; Hartriyanti, Y.; Hautvast, J.G.; Deurenberg, P. Relationship between body fat and body mass index: Differences between Indonesians and Dutch Caucasians. Eur. J. Clin. Nutr. 1998, 52, 779–783. [Google Scholar] [CrossRef] [Green Version]
- Burger, J. Gender differences in meal patterns: Role of self-caught fish and wild game in meat and fish diets. Environ. Res. 2000, 83, 140–149. [Google Scholar] [CrossRef]
- Kull, M.; Kallikorm, R.; Lember, M. Body mass index determines sunbathing habits: Implications on vitamin D levels. Intern. Med. J. 2009, 39, 256–258. [Google Scholar] [CrossRef]
- Falk, M.; Anderson, C.D. Influence of age, gender, educational level and self-estimation of skin type on sun exposure habits and readiness to increase sun protection. Cancer Epidemiol. 2013, 37, 127–132. [Google Scholar] [CrossRef]
- Harris, S.S.; Dawson-Hughes, B. The association of oral contraceptive use with plasma 25-hydroxyvitamin D levels. J. Am. Coll. Nutr. 1998, 17, 282–284. [Google Scholar] [CrossRef] [PubMed]
- Saarem, K.; Pedersen, J.I. Sex differences in the hydroxylation of cholecalciferol and of 5 beta-cholestane-3 alpha, 7 alpha, 12 alpha-triol in rat liver. Biochem. J. 1987, 247, 73–78. [Google Scholar] [CrossRef] [PubMed]
- Moller, U.K.; Streym, S.; Jensen, L.T.; Mosekilde, L.; Schoenmakers, I.; Nigdikar, S.; Rejnmark, L. Increased plasma concentrations of vitamin D metabolites and vitamin D binding protein in women using hormonal contraceptives: A cross-sectional study. Nutrients 2013, 5, 3470–3480. [Google Scholar] [CrossRef] [PubMed]
- Knight, J.A.; Wong, J.; Blackmore, K.M.; Raboud, J.M.; Vieth, R. Vitamin D association with estradiol and progesterone in young women. Cancer Causes Control 2010, 21, 479–483. [Google Scholar] [CrossRef]
- Tak, Y.J.; Lee, J.G.; Kim, Y.J.; Park, N.C.; Kim, S.S.; Lee, S.; Cho, B.M.; Kong, E.H.; Jung, D.W.; Yi, Y.H. Serum 25-hydroxyvitamin D levels and testosterone deficiency in middle-aged Korean men: A cross-sectional study. Asian J. Androl. 2015, 17, 324–328. [Google Scholar] [CrossRef]
- Pilz, S.; Frisch, S.; Koertke, H.; Kuhn, J.; Dreier, J.; Obermayer-Pietsch, B.; Wehr, E.; Zittermann, A. Effect of vitamin D supplementation on testosterone levels in men. Horm. Metab. Res. 2011, 43, 223–225. [Google Scholar] [CrossRef]
- Lerchbaum, E.; Pilz, S.; Trummer, C.; Schwetz, V.; Pachernegg, O.; Heijboer, A.C.; Obermayer-Pietsch, B. Vitamin D and Testosterone in Healthy Men: A Randomized Controlled Trial. J. Clin. Endocrinol. Metab. 2017, 102, 4292–4302. [Google Scholar] [CrossRef]
- Lerchbaum, E.; Trummer, C.; Theiler-Schwetz, V.; Kollmann, M.; Wolfler, M.; Heijboer, A.C.; Pilz, S.; Obermayer-Pietsch, B. Effects of vitamin D supplementation on androgens in men with low testosterone levels: A randomized controlled trial. Eur. J. Nutr. 2018. [Google Scholar] [CrossRef] [Green Version]
- Savastano, S.; Belfiore, A.; Di Somma, C.; Mauriello, C.; Rossi, A.; Pizza, G.; De Rosa, A.; Prestieri, G.; Angrisani, L.; Colao, A. Validity of bioelectrical impedance analysis to estimate body composition changes after bariatric surgery in premenopausal morbidly women. Obes. Surg. 2010, 20, 332–339. [Google Scholar] [CrossRef]
- Achamrah, N.; Colange, G.; Delay, J.; Rimbert, A.; Folope, V.; Petit, A.; Grigioni, S.; Dechelotte, P.; Coeffier, M. Comparison of body composition assessment by DXA and BIA according to the body mass index: A retrospective study on 3655 measures. PLoS ONE 2018, 13, e0200465. [Google Scholar] [CrossRef] [PubMed] [Green Version]


| Parameters | Males Mean ± SD or Number (%) n = 250 | Females Mean ± SD or Number (%) n = 250 | p-Value |
|---|---|---|---|
| Age (years) | 37.42 ± 11.84 | 36.58 ± 11.77 | 0.429 |
| Weight (kg) | 103.43 ± 25.00 | 89.05 ± 23.06 | <0.001 |
| Height (m) | 1.76 ± 0.05 | 1.64 ± 0.07 | <0.001 |
| BMI (kg/m2) | 33.19 ± 7.87 | 33.01 ± 7.93 | 0.804 |
| Normal weight | 50, 20% | 50, 20% | χ2 = 0.01, 0.908 |
| Overweight | 50, 20% | 50, 20% | |
| Grade I obesity | 50, 20% | 50, 20% | |
| Grade II obesity | 50, 20% | 50, 20% | |
| Grade III obesity | 50, 20% | 50, 20% | |
| 25OHD concentration (ng/mL) | 19.70 ± 8.31 | 16.36 ± 7.49 | <0.001 |
| Deficiency | 156, 62.4% | 170, 68.0% | χ2 = 2.80, p = 0.094 |
| Insufficiency | 50, 20.0% | 70, 28.0% | χ2 = 4.29, p = 0.038 |
| Sufficiency | 44, 17.6% | 10, 4.0% | χ2 = 23.31, p = 0.001 |
| Parameters | Males n = 250 | Females n = 250 | p-Value |
|---|---|---|---|
| R (Ω) | 467.9 ± 88.9 | 486.6 ± 84.5 | 0.02 |
| Xc (Ω) | 49.2 ± 10.2 | 46.8 ± 8.9 | 0.005 |
| FM (%) | 30.6 ± 14.0 | 37.5 ± 13.6 | <0.001 |
| FFM (%) | 69.4 ± 14.0 | 62.5 ± 13.6 | <0.001 |
| TBW (%) | 54.4 ± 10.8 | 46.7 ± 10.1 | <0.001 |
| ECW (%) | 45.8 ± 3.9 | 48.2 ± 3.5 | <0.001 |
| ICW (%) | 54.2 ± 3.9 | 51.8 ± 3.5 | <0.001 |
| Parameters | 25OHD Concentration (ng/mL) | |||
|---|---|---|---|---|
| Males (n = 250) | Females (n = 250) | |||
| r | p-Value | r | p-Value | |
| Age (years) | −0.002 | 0.98 | −0.08 | 0.22 |
| BMI (kg/m2) | −0.47 | <0.001 | −0.69 | <0.001 |
| R (Ω) | −0.16 | 0.01 | −0.11 | 0.08 |
| Xc (Ω) | 0.22 | 0.001 | 0.37 | <0.001 |
| FM (%) | −0.45 | <0.001 | −0.72 | <0.001 |
| FFM (%) | 0.45 | <0.001 | 0.72 | <0.001 |
| TBW (Lt) | 0.41 | <0.001 | 0.68 | <0.001 |
| ECW (Lt) | −0.52 | <0.001 | −0.74 | <0.001 |
| ICW (Lt) | 0.52 | <0.001 | 0.74 | <0.001 |
| Parameters | Multiple Regression Analysis | |||
|---|---|---|---|---|
| R2 | β | t | p-Value | |
| FM (%) | 0.35 | 0.59 | 16.5 | <0.001 |
| BMI (kg/m2) | 0.36 | 0.17 | −2.4 | 0.01 |
| Sex | 0.38 | 0.13 | −3.3 | 0.01 |
© 2019 by the authors. Licensee MDPI, Basel, Switzerland. This article is an open access article distributed under the terms and conditions of the Creative Commons Attribution (CC BY) license (http://creativecommons.org/licenses/by/4.0/).
Share and Cite
Muscogiuri, G.; Barrea, L.; Somma, C.D.; Laudisio, D.; Salzano, C.; Pugliese, G.; de Alteriis, G.; Colao, A.; Savastano, S. Sex Differences of Vitamin D Status across BMI Classes: An Observational Prospective Cohort Study. Nutrients 2019, 11, 3034. https://0-doi-org.brum.beds.ac.uk/10.3390/nu11123034
Muscogiuri G, Barrea L, Somma CD, Laudisio D, Salzano C, Pugliese G, de Alteriis G, Colao A, Savastano S. Sex Differences of Vitamin D Status across BMI Classes: An Observational Prospective Cohort Study. Nutrients. 2019; 11(12):3034. https://0-doi-org.brum.beds.ac.uk/10.3390/nu11123034
Chicago/Turabian StyleMuscogiuri, Giovanna, Luigi Barrea, Carolina Di Somma, Daniela Laudisio, Ciro Salzano, Gabriella Pugliese, Giulia de Alteriis, Annamaria Colao, and Silvia Savastano. 2019. "Sex Differences of Vitamin D Status across BMI Classes: An Observational Prospective Cohort Study" Nutrients 11, no. 12: 3034. https://0-doi-org.brum.beds.ac.uk/10.3390/nu11123034