
Application of RP-18 TLC Retention Data to the Prediction of the Transdermal Absorption of Drugs


1
Department of Analytical Chemistry, Faculty of Pharmacy, Medical University of Lodz, ul. Muszyńskiego 1, 90-151 Łódź, Poland
2
Chemistry Research Laboratory, Department of Chemistry, University of Oxford, Mansfield Road, Oxford OX1 3TA, UK
*
Author to whom correspondence should be addressed.
Pharmaceuticals 2021, 14(2), 147; https://0-doi-org.brum.beds.ac.uk/10.3390/ph14020147
Submission received: 31 December 2020
/
Revised: 7 February 2021
/
Accepted: 7 February 2021
/
Published: 12 February 2021
(This article belongs to the Special Issue Selected Papers from the 6th International Electronic Conference on Medicinal Chemistry (ECMC2020))
Abstract
:Several chromatographic parameters (RM0 and S obtained from RP-18 TLC with methanol—pH 7.4 phosphate buffer mobile phases by extrapolation to zero concentration of methanol; Rf and RM obtained from RP-18 TLC with acetonitrile—pH 7.4 phosphate buffer 70:30 v/v as a mobile phase) and calculated molecular descriptors (molecular weight—MW; molar volume—VM; polar surface area—PSA; total count of nitrogen and oxygen atoms—(N+O); H-bond donor count—HD; H-bond acceptor count—HA; distribution coefficient—log D; total energy—ET; binding energy—Eb; hydration energy—Eh; energy of the highest occupied molecular orbital—EHOMO; energy of the lowest unoccupied orbital—ELUMO; electronic energy—Ee; surface area—Sa; octanol-water partition coefficient—log P; dipole moment—DM; refractivity—R, polarizability—α) and their combinations (Rf/PSA, RM/MW, RM/VM) were tested in order to generate useful models of solutes’ skin permeability coefficient log Kp. It was established that neither RM0 nor S obtained in the conditions used in this study is a good predictor of the skin permeability coefficient. The chromatographic parameters Rf and Rf/PSA were also unsuitable for this purpose. A simple and potentially useful, purely computational model based on (N+O), log D and HD as independent variables and accounting for ca. 83% of total variability was obtained. The evaluation of parameters derived from RM (RM, RM/MW, RM/VM) as independent variables in log Kp models proved that RM/VM is the most suitable descriptor belonging to this group. In a search for a reliable log Kp model based on this descriptor two possibilities were considered: a relatively simple model based on 5 independent variables: (N+O), log D, RM/VM, ET and Eh and a more complex one, involving also Eb, MW and PSA.
1. Introduction
The skin is the heaviest organ in the human body. Its average surface area is ca. 2 m2 and it accounts for about 1/10 of the total bodyweight [1]. The skin provides a selective barrier, allowing transdermal delivery of drugs and providing protection against harmful chemicals. Topically applied drugs and other compounds enter the body via either the transepidermal pathway (diffusion across the skin layers) or the appendageal pathway (through hair follicles or sweat ducts), the latter being considered significantly less important [1]. In the transepidermal pathway the molecule permeates the skin either transcellularly or intercellularly and the preferred route depends on the solute’s molecular properties—small hydrophilic molecules prefer the transcellular route and lipophilic ones favor the opposite [1]. The rate of drug permeation through skin is expressed as the flux (J)—the amount of substance permeated per unit area and unit time. The flux depends on the permeabilityof the skin to the permeant (Kp) and the gradient of permeant concentration across the skin(Δc): J = Kp∙Δc.
For passive diffusion, the permeability coefficient Kp depends on the partition coefficient P, the diffusion coefficient D and the diffusional pathlength h: Kp = P∙D/h.
The ability of compounds to cross the skin barrier is of great interest to pharmaceutical and medicinal chemists because the transdermal delivery of drugs is an effective alternative to systemic delivery. This ability is also important in the context of environmental toxicology, because many harmful substances enter the body through skin. Transdermal permeation of drugs may be studied using many methods, including in vitro experiments on excised human skin [2] but there are many problems connected with this methodology. Aside from ethical considerations, the compound’s skin permeability may differ significantly between individuals, depending on age and race and even between skin samples taken from the same individual. Percutaneous absorption is therefore studied on other, more convenient, models, including pig, rabbit, rat, mouse or shed snake skin, cultured human skin cells, or synthetic membranes [2,3]. However, such models require much tedious experimental work, so alternative solutions have been sought. Skin permeation depends on some readily obtained physicochemical parameters of a molecule, including the well-established predictor of lipophilicity and biological activity of compounds, the partition coefficient between aqueous and organic layers log Pow [4]. However, it was demonstrated that log Pow cannot be applied as a single measure of log Kp across a very wide range of chemical families, so molecular weight or volume were incorporated as additional descriptors [5,6]. Further research supported a relationship between Kp and hydrogen bond donor and acceptor activity (Hd and Ha, respectively) [7] and a melting point MPt [8]. Other authors stressed the importance of solvation free energy [9]. Log Kp was also correlated with Abraham’s solute descriptors [10,11,12]. Following QSAR studies on skin permeation, models involving log Pow and Mw along with further descriptors were developed [13,14,15]. Different computational skin permeability models have been reviewed and compared [15,16,17,18,19,20,21,22], and the most interesting equations discussed there are presented in Table 1.
More recent developments in the field of in silico evaluation of skin permeability include the model proposed by Chenet et al., [24], in which predictions of skin permeability may be based on certain molecular properties and topological descriptors.
The equation proposed by Potts is among the most accurate and the most frequently cited of the computational models of skin permeability coefficient [21,22], although the model developed by Mitragotri [25] is also interesting [21]—supposedly giving even more reliable predictions—but the model by Potts has the benefit of simplicity.
Chromatography is a powerful technique for acquiring measurements of physicochemical and biological properties of solutes, including the ability of compounds to cross different biological barriers [26,27,28]. It is superior to techniques based on excised human skin, animal experiments or even cell cultures because it is more reproducible and it usually involves commercially available chromatographic supports. The chromatographic techniques used to predict the skin permeability of solutes include normal- and reversed-phase thin layer chromatography [29,30], immobilized artificial membrane (IAM) column chromatography [31,32,33,34], RP-18 column chromatography [33,34,35], column chromatography on a novel stationary phase based on immobilized keratin [36], biopartitioning micellar chromatography (BMC) [37,38,39], micellar electrokinetic chromatography [34], and liposome electrokinetic chromatography [40]. Available models of skin permeability parameters, based on liquid chromatographic descriptors, are presented in Table 2.
From the equations presented in Table 2, it can be concluded that skin permeability coefficient is connected with chromatographic parameters (log k or RM0 for column and thin layer chromatography, respectively) via linear or reverse parabolic relationships. Chromatographic retention parameters are used either as sole skin permeability predictors, or they are combined with additional descriptors (log Pow, V, Mw or MPt).
The objective of this study was to examine the relationships between the skin permeability coefficient log Kp and different, RP-18 chromatography-derived descriptors and other physicochemical parameters for a large group of structurally unrelated compounds, mainly drugs.
2. Results and Discussion
2.1. General Considerations
The majority of compounds analyzed in this study are drugs, administered either orally or in the form of injections, and whose transdermal delivery, in certain cases, is of interest. On the other hand, some topically applied substances (e.g., cosmetic preservatives) may exhibit the unwanted ability to cross the skin barrier. The skin permeability coefficient (Kp) is an important parameter that helps in the assessment of compounds’ epidermal permeability; however, the experimentally determined values of Kp are available for only a few drugs, within the studied group. For this reason it was decided that the models of skin permeability involving thin layer chromatographic and calculated descriptors should be generated and validated using Kp values obtained in silico with the EpiSuite software (DERMWIN v. 2 module) (log KpEPI), recommended by the US Environmental Protection Agency [41] and, at a final stage of these investigations, tested on a sub-group of analyzed solutes whose experimental log Kp values could be found (log Kpexp). The estimation methodology used by DERMWIN is based on the Equation (2), related to the Potts model:
log Kp (cm/h) = −2.80 + 0.66 log Pow − 0.0056MW (R2 = 0.66)
The values of log KpEPI obtained using DERMWIN are given in Table 3.
2.2. Thin Layer Chromatographic Parameters—Extrapolation Methodology
Reversed-phase thin layer chromatography has been used to predict physicochemical properties and bioavailability of compounds for many years [26] and the chromatographic parameter considered in these investigations is usually the RM value defined by Bate-Smith and Westall (Equation (2)) [42]:
RM = log (1/Rf − 1)
The partitioning between chromatographic supports and an aqueous mobile phase resembles that between biomembranes and the aqueous phase. The most common approach to obtain the chromatographic retention parameters for water as a mobile phase is by using a series of chromatographic experiments with mobile phases containing different concentrations φ of a water-miscible solvent (organic modifier). Plots of RM vs. φ are extrapolated to zero concentration of the modifier to furnish RM0 and the most common method to do so is by using the linear Soczewiński-Wachmeister Equation (3) [43].
RM = RM0 + S∙φ
Apart from the RM0 value, other useful chromatographic descriptors derived from the linear extrapolation of RM to purely aqueous conditions are the slope S and C0 = −RM0/S.
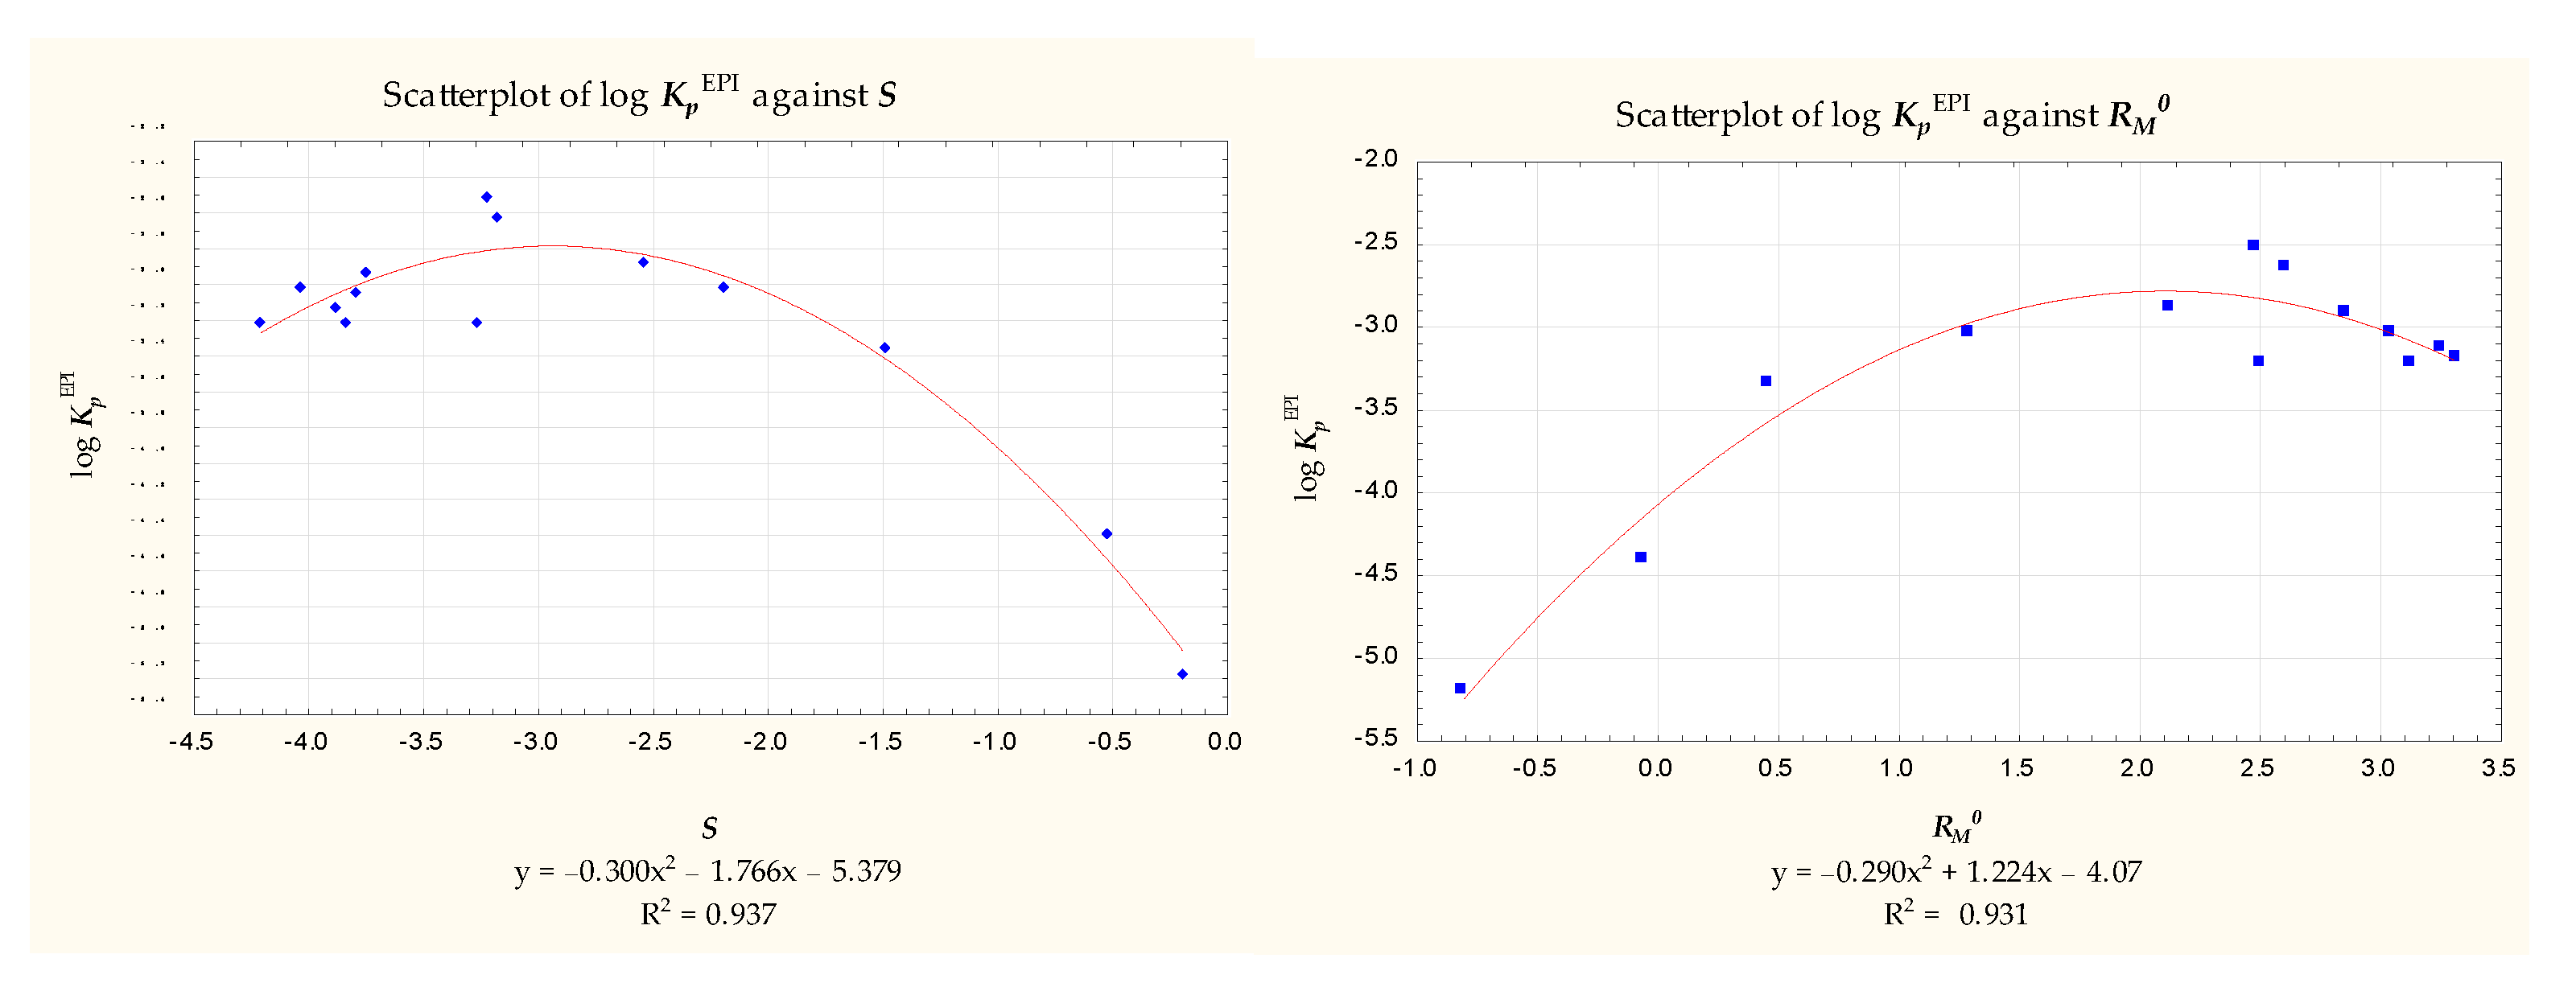
The compounds 1 to 22 and 62 were chromatographed on the RP-18 stationary phase using methanol—pH 7.4 buffer mobile phases as described in Section 3. The values of RM were calculated and plotted against the organic modifier concentration φ. The chromatographic parameters RM0 and S obtained according to Equation (3) (Table 4) were correlated with the log KpEPI values presented in Table 3, and the resulting correlations were found to be unsatisfactory. Neither RM0 nor S correlated with log KpEPI for the whole group of 23 compounds. 14 compounds (2, 3, 5, 6, 8, 9, 10, 11, 16, 17, 18, 20, 21, 62) gave reverse parabolic relationships with RM0 and S (Figure 1), but the remaining solutes did not fit any reasonable pattern.
From this, it was evident that RM0 and S obtained in the chromatographic conditions described in Section 3 could not be used as sole predictors of log Kp. Attempts to generate a multivariate relationship between log Kp and the calculated physicochemical parameters, involving RM0 or S, failed and a purely computational model (4) was obtained by forward stepwise regression:
log Kp = 7.340 (±2.265) + 0.00018 (±0.00376) PSA + 0.803 (±0.096) log D + 0.980 (±0.235) EHOMO − 0.959 (±0.184) ELUMO + 0.049 (±0.018) Eh − 0.116 (±0.019) α
(n = 23, R2 = 0.948, R2adj. = 0.928, F = 48.367, p < 0.00000, se = 0.316)
(n = 23, R2 = 0.948, R2adj. = 0.928, F = 48.367, p < 0.00000, se = 0.316)
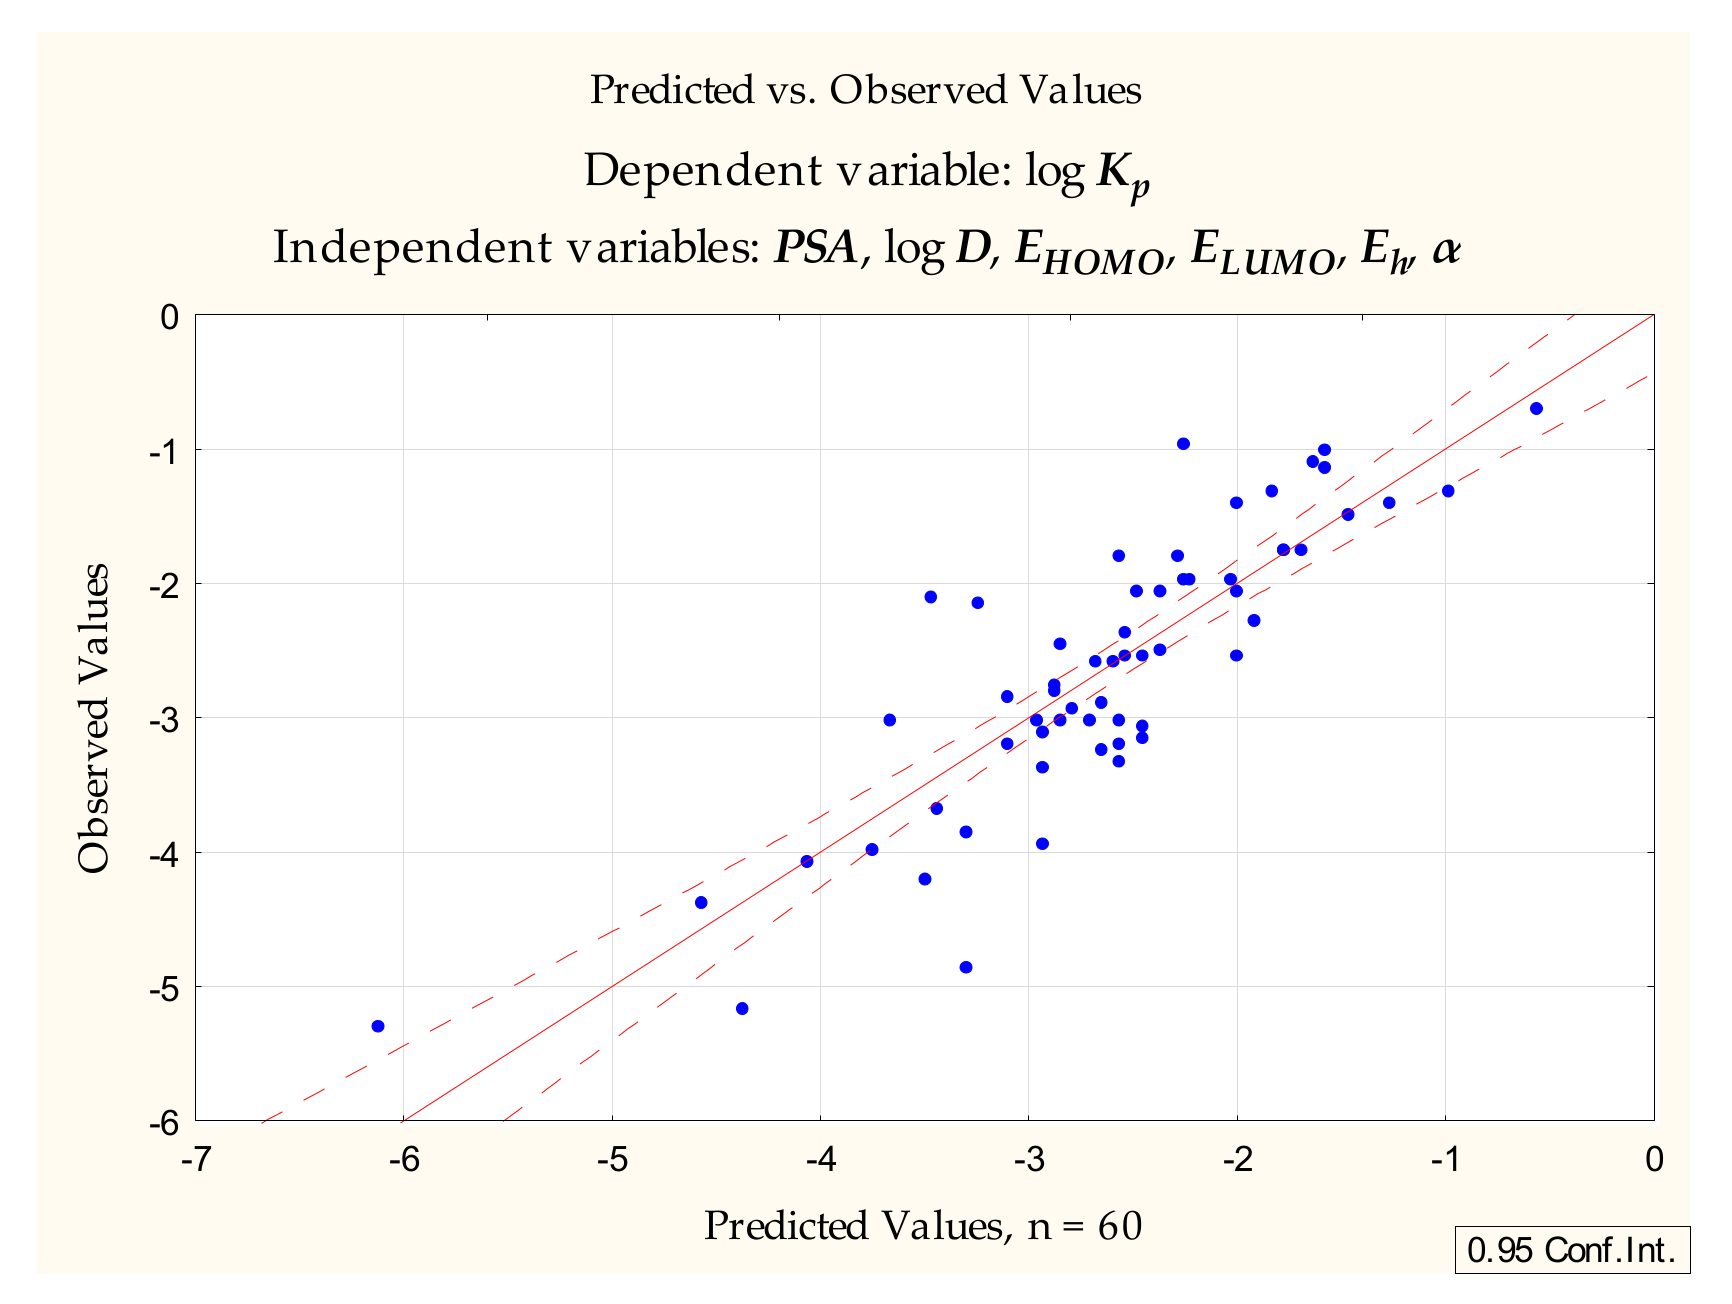
The same set of dependent variables was applied to compounds 1 to 60 to furnish the Equation (5) (Figure 2):
log Kp = −1.524 (±1.386) − 0.0176 (±0.0042) PSA + 0.241 (±0.058) log D + 0.0149 (±0.140) EHOMO + 0.0472 (±0.189) ELUMO + 0.0311 (±0.0215) Eh − 0.0113 (±0.0110) α
(n = 60, R2 = 0.731, R2adj. = 0.700, F = 23.994, p < 0.00000, se = 0.572)
(n = 60, R2 = 0.731, R2adj. = 0.700, F = 23.994, p < 0.00000, se = 0.572)
The Equations (4) and (5), based on the set of purely computational variables PSA, log D, EHOMO, ELUMO, Eh and α, are relatively simple and logical, since they involve some properties responsible for drug absorption (lipophilicity, polar surface area and polarizability) [44,45]. However, apart from poor statistics, the differences between the parameters of the Equations (4) and (5) suggest that they lack the required universality with respect to larger groups of structurally unrelated compounds.
2.3. Single Chromatographic Run Retention Parameters—Rf
The extrapolation method, although commonly used and recognized, has certain drawbacks. Several chromatographic experiments are required and the extrapolated RM0 values depend on an organic modifier and its concentration range used to generate RM = f(φ) plots. Some studies, therefore, use the single chromatographic run approach in which the Rf and RM values are collected using a single concentration of an organic modifier in a mobile phase [46]. The single chromatographic run approach was used to predict the lipophilicity of selected cosmetic raw materials [47] and, in separate work, yielded two chromatographic descriptors, Rf and Rf/PSA, used to study the blood-brain barrier permeation of solutes [48,49,50]. Apart from providing reliable lipophilicity descriptors, this methodology has additional advantages: it requires considerably less experimental work than any extrapolation or interpolation method, and none of the additional factors mentioned earlier (such as the modifier concentration range or the type of extrapolation curve) need to be taken into consideration.
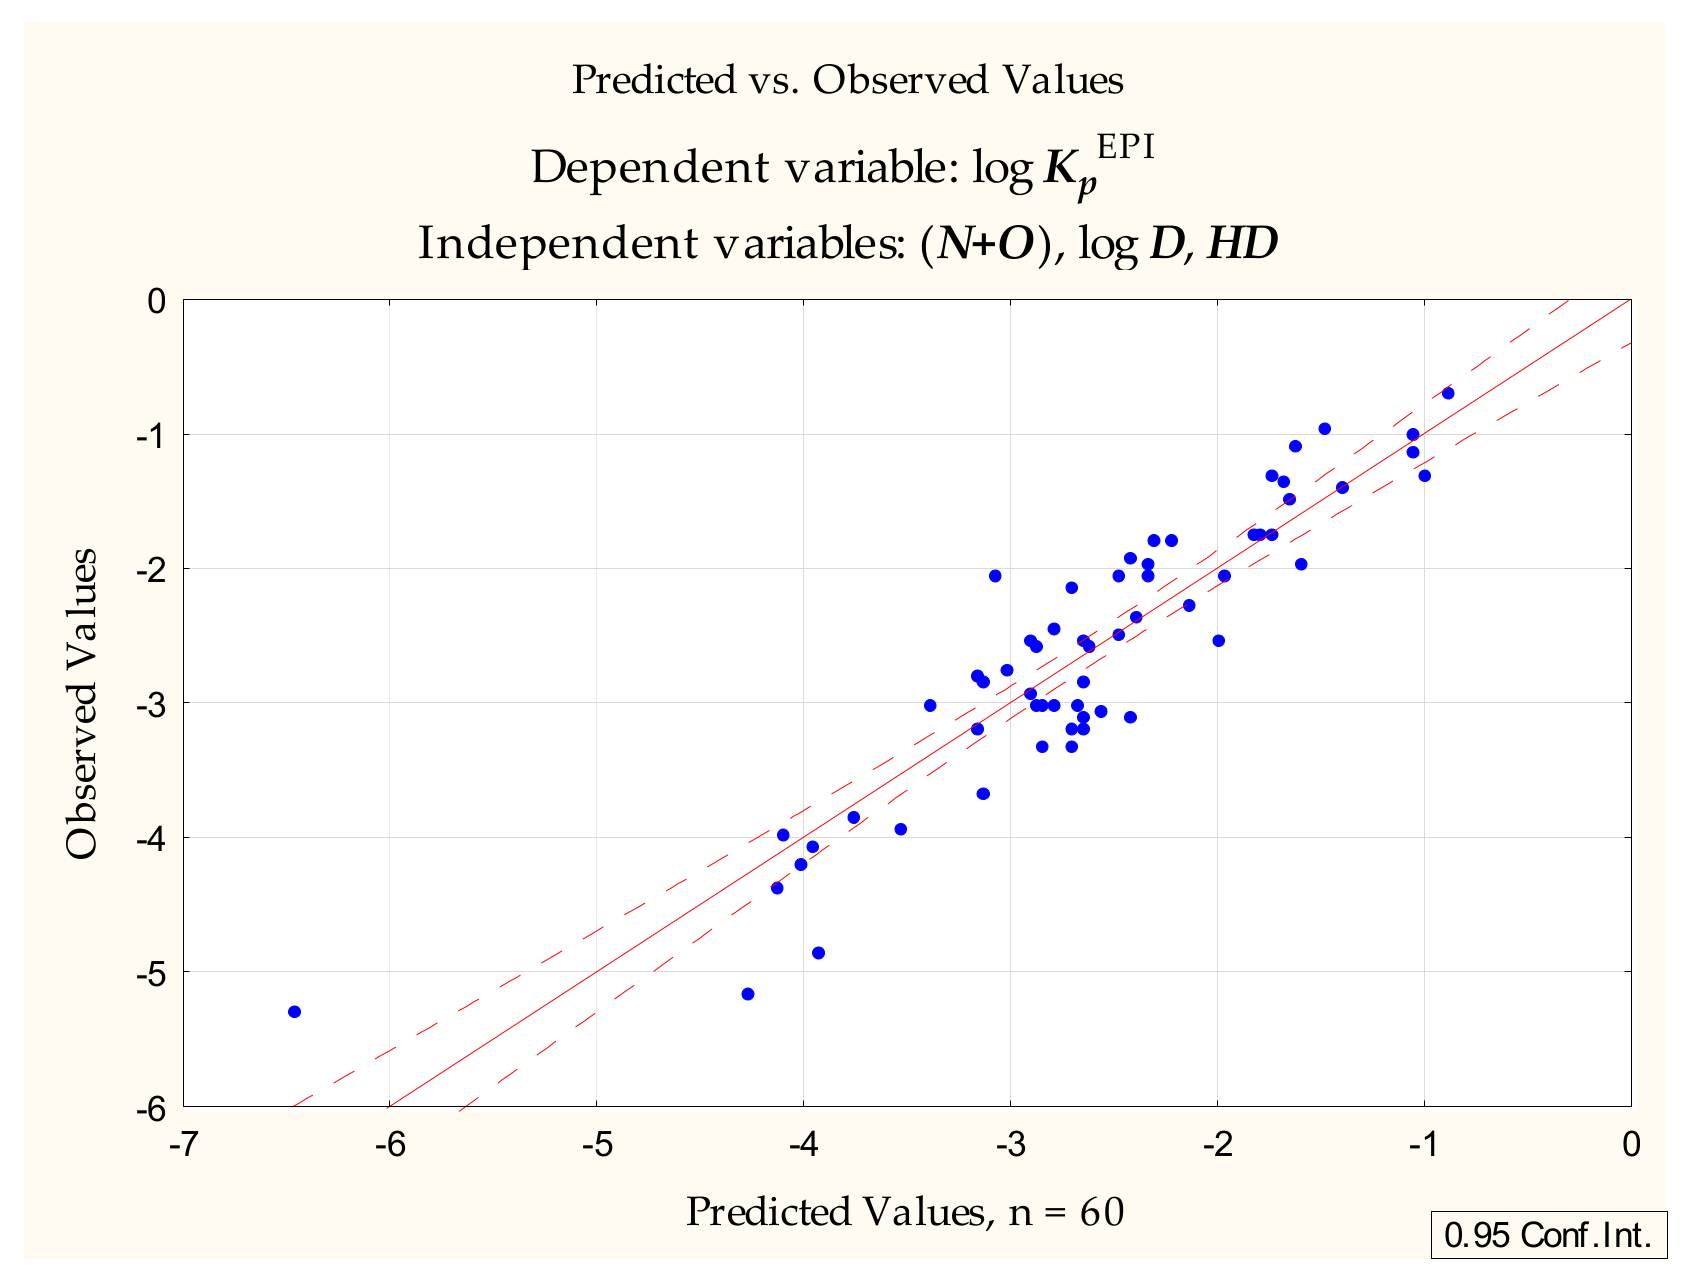
Following the unsuccessful attempts to generate useful and universal models of the skin permeability coefficient using thin layer chromatographic retention parameters obtained by extrapolation (RM0, S), attention turned to the single RP-18 chromatographic run approach developed in the earlier study of blood-brain barrier permeation [48,49,50]. The models presented in those studies involve Rf (collected as described in Section 3) and a novel parameter derived from it: Rf/PSA. The latter (combined with Rf and a number of calculated physicochemical parameters) is a particularly good predictor of the blood-brain barrier permeability (expressed as steady state blood-brain partition ratio, log BB). In the case of the skin permeability coefficient, however, this parameter (and Rf itself) failed to be selected in the course of the forward stepwise regression. The most interesting model (6) (Figure 3) generated at this stage of our investigations did not contain any chromatographic parameters and was as follows:
log Kp = −1.390 (±0.181) − 0.352 (±0.034) (N+O) + 0.155 (±0.037) log D − 0.229 (±0.062) HD
(n = 60, R2 = 0.833, R2adj. = 0.824, F = 92.270, p < 0.0000, se = 0.438)
(n = 60, R2 = 0.833, R2adj. = 0.824, F = 92.270, p < 0.0000, se = 0.438)
This model accounts for over 83% of total variability and contains the independent variables introduced in the following order: (N+O), log D, HD. The variables in the equation are strongly related to the conditions of good oral availability [44,45] and the ability to cross the blood-brain barrier [48,49,50,51]. The equation obtained at the very first stage of this regression, containing (N+O) as a sole independent variable, accounts for as much as 70% of total variability. The coefficients for (N+O) and HD are negative, which (as already observed, e.g., by Lien and Gaot [23]) suggests that excessive hydrogen bonding is an obstacle to epidermal permeability.
At this point the group of 60 studied compounds was divided into two subsets: a training set (1 to 40) and a test set (41 to 60).Equation (7) generated for the training set, and containing the same independent variables as Equation (6), was as follows:
log Kp = −1.561 (±0.248) − 0.319 (±0.041) (N+O) + 0.177 (±0.053) log D− 0.256 (±0.072) HD
(n = 40, R2 = 0.819, R2adj. = 0.804, F = 54.356, p < 0.00000, se = 0.456)
(n = 40, R2 = 0.819, R2adj. = 0.804, F = 54.356, p < 0.00000, se = 0.456)
The values of log Kp were calculated for compounds 41 to 60 according to Equation (7) and plotted against the reference log KpEPI values presented in Table 3. The linear relationship between these two groups of log Kp values improved when salicylic acid (60), whose KpEPI value seems to be overestimated compared to Kpexp (due to the molecule’s combined polarity and acidic properties, 60 is not a very good skin permeant), was removed as an outlier (R2 = 0.83 and 0.89, respectively).
The model (6) was also tested on a subgroup of 9 compounds, analyzed in this study, whose log Kpexp values were available (12, 16, 21, 40, 56, 60, 61, 62, 63). The resulting dependence is linear, with R2 = 0.92, which is a much better result than that obtained for the relationship between log Kpexp and log KpEPI (for n = 9, R2 = 0.40).
2.4. Single Chromatographic Run Retention Parameters—RM
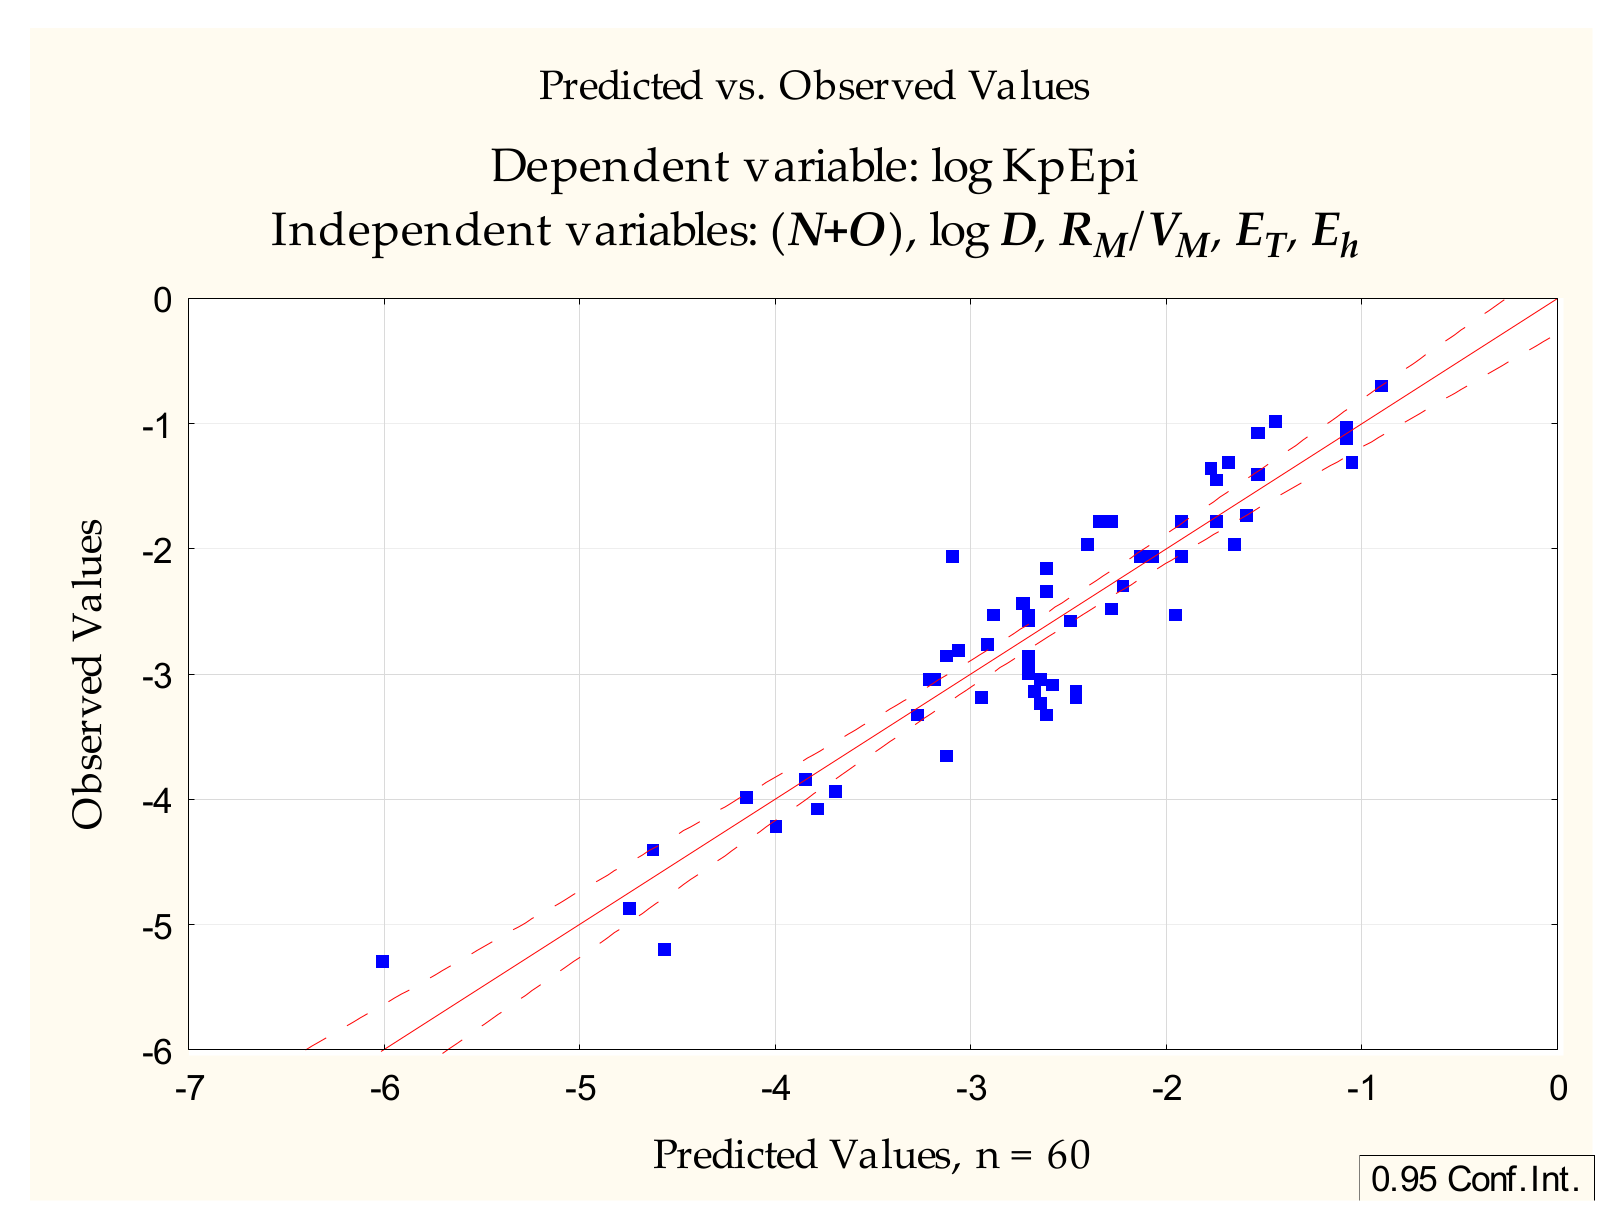
With the promising equations (6) and (7) in hand, attention turned to the possibility of using RM values calculated from Rf obtained according to Section 3. Apart from RM itself, other TLC-derived variables were tested: RM/VM and RM/MW. The first model (8) involving RM–derived parameters, generated by forward stepwise multiple regression, was as follows (Figure 4):
log Kp = −1.651 (±0.185) − 0.370 (±0.034) (N+O) + 0.130 (±0.034) log D + 90.44 (±43.04) (RM/VM) − 0.0000058 (±0.0000019) ET +0.0293 (±0.014) Eh
(n = 60, R2 = 0.868, R2adj. = 0.855, F = 70.869, p < 0.0000, se = 0.397)
(n = 60, R2 = 0.868, R2adj. = 0.855, F = 70.869, p < 0.0000, se = 0.397)
In Equation (8) the independent variables were introduced in the following order: (N+O), log D, RM/VM, ET, Eh. The difference between this model and Equation (6) was not very significant; HD was replaced with RM/VM, and two more independent variables, responsible for a very small improvement in statistics, were introduced (ET, Eh), but (N+O) and log D still accounted for the greatest percentage of variability.
The group of 60 studied compounds was, as before, divided into a training set (1 to 40) and a test set (41 to 60). Equation (9), generated for the training set and containing the same independent variables as Equation (8), was as follows:
log Kp = −1.602 (±0.296) − 0.346 (±0.072) (N+O) + 0.156 (±0.067) log D + 108.57 (±51.25) (RM/VM) − 0.0000024 (±0.0000058) ET + 0.0254 (±0.0187) Eh
(n = 40, R2 = 0.823, R2adj. = 0.797, F = 31.654, p < 0.00000, se = 0.464)
(n = 40, R2 = 0.823, R2adj. = 0.797, F = 31.654, p < 0.00000, se = 0.464)
Values of log Kp were calculated for compounds 41 to 60 according to Equation (9) and were plotted against the reference log KpEPI values. Just as in the case of Equation (7), the linear relationship between these two groups of log Kp values improved when salicylic acid (60) was removed as an outlier (R2 = 0.87 and 0.92, respectively).
The model (8) was also tested on a subgroup of nine compounds, analyzed in this study, whose log Kpexp values were available (12, 16, 21, 40, 56, 60, 61, 62, 63). The resulting relationship was linear, with R2 = 0.80, which is a much better result than that obtained for the relationship between log Kpexp and log KpEPI (for n = 9, R2 = 0.40), but not as good as in the case of the Equation (6).
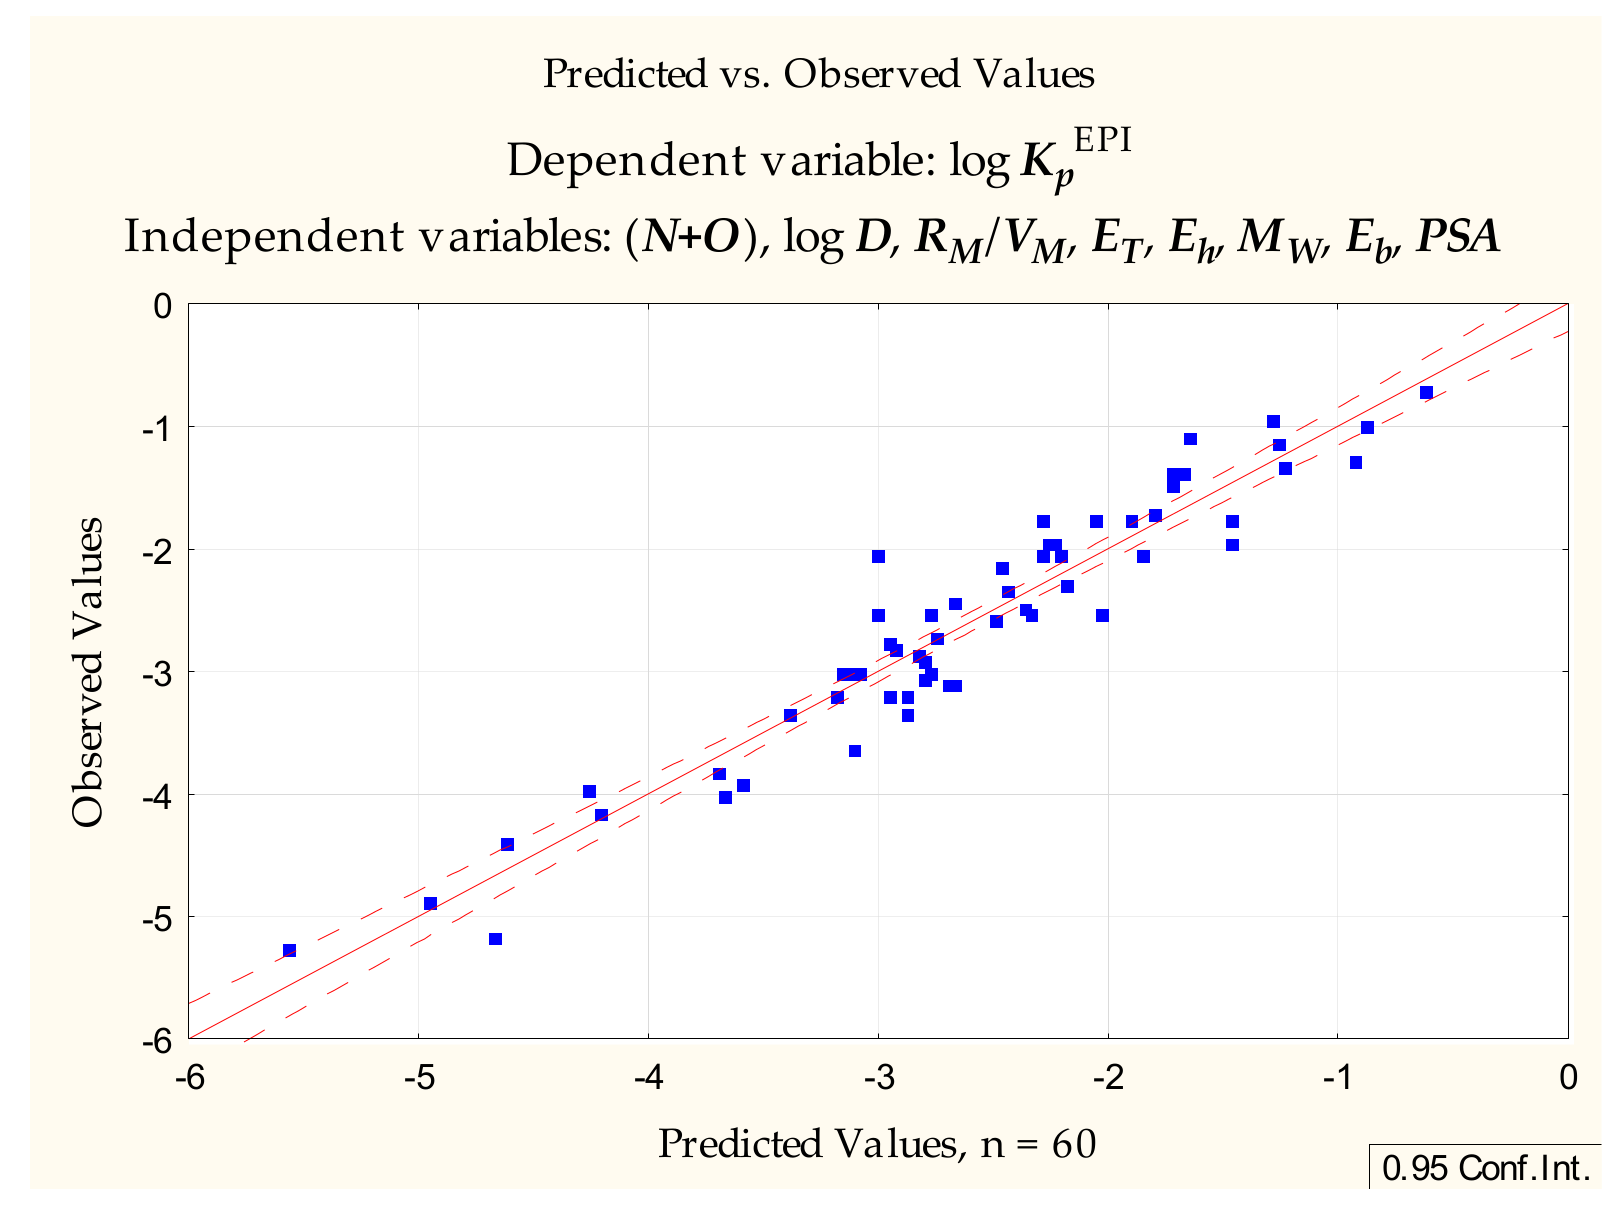
Equations (8) and (9) account for 87 and 82% of total variability, respectively, and have the advantage of being very simple; however, an attempt was made to improve their predictive abilities by adding further independent variables. Equation (10) (Figure 5) contains, apart from (N+O), log D and RM/VM some more variables, MW and PSA, traditionally linked to good absorption properties, and it accounts for over 91% of total variability:
log Kp = −1.559 (±0.181) − 0.381 (±0.054) (N+O) + 0.176 (±0.036) log D + 146.43 (±37.66) RM/VM − 0.0000100 (±0.0000019) ET +0.0469 (±0.014) Eh − 0.0095 (±0.0020) MW − 0.00048 (±0.00011) Eb + 0.0108 (±0.0037) PSA
(n = 60, R2 = 0.913, R2adj. = 0.899, F = 66.710, p < 0.0000, se = 0.332)
(n = 60, R2 = 0.913, R2adj. = 0.899, F = 66.710, p < 0.0000, se = 0.332)
The same set of variables as in Equation (10) was applied to the training set (compounds 1 to 40). The Equation (11) generated at this stage was as follows:
log Kp = −1.426 (±0.283) − 0.398 (±0.130) (N+O) + 0.157 (±0.063) log D + 168.41 (±51.99) RM/VM − 0.0000327 (±0.0000221) ET +0.0237 (±0.0204) Eh − 0.0116 (±0.0046) MW − 0.000255 (±0.000189) Eb + 0.00305 (±0.00813) PSA
(n = 40, R2 = 0.863, R2adj. = 0.827, F = 24.361, p < 0.0000, se = 0.428)
(n = 40, R2 = 0.863, R2adj. = 0.827, F = 24.361, p < 0.0000, se = 0.428)
Equation (11) improved significantly after one compound (19) was removed. The difference between the Kp(11) and KpEPI values for this compound is probably due to its very high energies and PSA, coincidentally leading to overestimated skin permeability, calculated according to Equation (11):
log Kp = −1.590 (±0.185) − 0.399 (±0.084) (N+O) + 0.178 (±0.041) log D + 138.00 (±34.01) RM/VM − 0.000014 (±0.000015) ET +0.067 (±0.015) Eh − 0.012 (±0.003) MW − 0.000568 (±0.000131) Eb + 0.014 (±0.006) PSA
(n = 39, R2 = 0.937, R2adj. = 0.921, F = 56.137, p < 0.0000, se = 0.278)
(n = 39, R2 = 0.937, R2adj. = 0.921, F = 56.137, p < 0.0000, se = 0.278)
The values of log Kp were calculated for compounds 41 to 60 according to Equation (12) and plotted against the reference log KpEPI values. Just as in the case of Equation (9), the linear relationship between these two groups of log Kp values improved when salicylic acid (60) was removed as an outlier (R2 = 0.831 and 0.886, respectively).
The model (10) was also tested on a subgroup of nine compounds, analyzed in this study whose log Kpexp values were available (12, 16, 21, 40, 56, 60, 61, 62, 63). The resulting dependence was linear, with R2 = 0.83, which is a much better result than that obtained for the relationship between log Kpexp and log KpEPI.
3. Materials and Methods
3.1. Chemicals
The 63 drugs analyzed during these investigations were isolated from pharmaceutical preparations, purchased from Sigma-Aldrich (St. Louis, MO, USA)or donated as free samples by Polfa-Pabianice (Pabianice, Poland). The purity of drugs isolated from pharmaceutical preparations was assessed by TLC and densitometry (Section 3). All isolated drugs gave single chromatographic spots (densitometric peaks) and were used without further purification. Drugs purchased from Sigma-Aldrich were of analytical or pharmacopeial grade. Distilled water used for chromatography was from an in-house distillation apparatus. Analytical grade acetonitrile and methanol were from Avantor Performance Materials Poland S.A. (formerly POCh S.A., Gliwice, Poland). pH 7.4 phosphate buffered saline was from Sigma-Aldrich.
3.2. Thin Layer Chromatography
Thin layer chromatography was performed on 10 × 20 cm glass-backed RP-18 F254s TLC plates (layer thickness 0.25 mm) from Merck (Darmstadt, Germany). Before use, the plates were pre-washed with methanol-dichloromethane 1:1 (v/v) and dried overnight in ambient conditions. Solutions of compounds 1 to 63 in methanol (1 μg·μL−1, spotting volume 1 μL), were spotted with a Hamilton microsyringe, 15 mm from the plate bottom edge, starting 10 mm from the plate edge, at 8 mm intervals. The chromatographic plates were developed in a vertical chromatographic chamber lined with filter paper and previously saturated with the mobile phase vapor for 20 min. The mobile phase consisted of acetonitrile—pH 7.4 phosphate buffered saline 70:30 (v/v) or methanol—pH 7.4 phosphate buffered saline (methanol contents from 90 to 50% v/v in 5% increments). The development distance was 95 mm from the plate bottom edge. After development, the plates were dried at room temperature and examined under UV light (254nm) and with a CD60 densitometer (Desaga, Germany, multiwavelength scan, 200–300 nm at 20 nm intervals). All chromatograms were repeated in duplicate, and the mean Rf values were used in further investigations. The chromatographic data are presented in Table 4.
3.3. Calculated Molecular Descriptors
The molecular descriptors for compounds investigated during this study were calculated with HyperChem 8.0, utilizing PM3 semi-empirical method with the Polak-Ribiere algorithm: total dipole moment—DM [D], logarithm of the octanol-water partition coefficient—log P, van der Waals molar volume—VM [Å3], surface area (grid and approximate)—Sa [Å2], molecular weight—Mw [g mol−1], energy of the highest occupied molecular orbital—EHOMO [eV], energy of the lowest unoccupied molecular orbital—ELUMO [eV], total energy—ET [kcal mol−1], binding energy—Eb [kcal mol−1], electronic energy—Ee [kcal mol−1], hydration energy—Eh [kcal mol−1], refractivity—R [Å3], polarizability—α [Å3]. Other physicochemical parameters (distribution coefficient—log D, polar surface area—PSA [Å2], H-bond donor count—HD, and H-bond acceptor count—HA) were calculated using ACD/Labs 8.0 software. The calculated molecular descriptors are given in Table 5. Statistical analysis was done using Statistica v.13 or StatistiXL v. 2.
4. Conclusions
This work has established that RM/VM is a useful descriptor of skin permeability derived from RP-18 thin layer chromatography. In a search for reliable log Kp models based on this descriptor two possibilities were considered: a relatively simple model based on 5 independent variables: (N+O), log D, RM/VM, ET and Eh (Equations (8) and (9)) and a more complex one, containing also Eb, MW and PSA (Equations (10)–(12)). The latter accounts for over 90% of total variability and involves all the major properties that determine the drugs’ ability to cross biological barriers (lipophilicity, molecular size, ability to form hydrogen bonds). It should be mentioned here that a very simple parameter (N+O) accounts for as much as 70% of the total log Kp variability; log D and RM/VM account for a further 10 and 5%, respectively.
Skin permeability is a difficult property to measure.Due to the limited availability of experimental permeability data for the solutes investigated in this study, the reference skin permeability coefficients were calculated according to a widely accepted model based on log Pow and MW (log KpEPI).
The advantages of this model are clear—it is based on easily obtained molecular properties, whose influence upon the skin permeability is well documented [21]. Of course, the reference model has also its limitations: it overestimates the results for very hydrophilic molecules [52,53], underestimates the values for non-hydrogen bonding solutes [52], and fails for extremely lipophilic compounds or solutes having a very high tendency to hydrogen bonding [18,53]. However, the group of solutes examined in this study does not include molecules of very high lipophilicity or with a very high tendency to H-bonding, and the differences between log KpEPI and log Kpexp for hydrophilic solutes or non-H-bond donors are moderate. Small discrepancies between the calculated and experimental reference values (log KpEPI and log Kpexp, respectively) for hydrophilic solutes or those without the H-donor sites may be a likely reason why the correlations between the experimental log Kpexp values (where available) and the log Kp values calculated according to the equations developed in this study ((6), (8) and (10)) are better than those between log Kpexp and log KpEPI for the same subgroup of compounds.
To conclude, Equations (6), (8) and (10) have been shown to be efficient tools for skin permeability predictions. Although Equation (10) provides the closest correlation, Equations (6) and (8) have the advantages of clarity and avoidance of colinearity between the variables; the simplest solutions are usually the best.
Author Contributions
Conceptualization, A.W.S.; methodology, A.W.S. and E.B.; investigation, A.W.S.; writing—original draft preparation, A.W.S.; revision—J.R. All authors have read and agreed to the published version of the manuscript.
Funding
This research was supported by an internal grant of the Medical University of Łódź no. 503/3-016-03/503-31-001.
Institutional Review Board Statement
Not applicable.
Informed Consent Statement
Not applicable.
Data Availability Statement
The data presented in this study are available in this manuscript.
Conflicts of Interest
The authors declare no conflict of interest. The funders had no role in the design of the study; in the collection, analyses, or interpretation of data; in the writing of the manuscript, or in the decision to publish the results.
Abbreviations
Kp—skin permeability coefficient; PSA—polar surface area; D—distribution coefficient; Pow—octanol-water partition coefficient; Mw—molecular weight; MPt—melting point; Hb—total H-bond count; SsssCH—sum of E-state indices for all methyl groups; ABSQon—sum of absolute charges on nitrogen and oxygen atoms; A—hydrogen bond acidity; B—hydrogen bond basicity; S—dipolar interactions; E—excess molar refractivity; V—McGowan’s characteristic volume; Hd—H-bond donor activity; Ha—H-bond acceptor activity; IAM—immobilized artificial membrane; BMC—biomedical chromatography; k—retention factor in column liquid chromatography; Rf—retention factor in TLC; TLC—thin layer chromatography; RP—reversed phase (chromatography); Pmw—micelle-water partitioning coefficient; kIAM and kBMC—retention factors in IAM and BMC chromatography, respectively; log kwIAM—log kIAM measured at or extrapolated to purely aqueous conditions; Δlog kwIAM—the difference between log kwIAM measured and predicted on the basis of log Pow; V—McGowan’s characteristic volume; Ksc—human skin-water partition coefficient; DM—total dipole moment; VM—van der Waals molar volume; Sa(a)—surface area (approximate); Sa(g) –surface area (grid); EHOMO—energy of the highest occupied molecular; ELUMO—energy of the lowest unoccupied molecular orbital; ET—total energy; Eb—binding energy; Ee—electronic energy; Eh—hydration energy; R—refractivity; α—polarizability; HD—H-bond donor count; HA—H-bond acceptor count; (N+O)—total nitrogen and oxygen atom count; Neoplastic-80—antineoplastic-like property at 80% similarity; ALOGP—log Pow calculated using ALOGP algorithm; F06[C-N]—frequency of carbon-nitrogen bond at a topological distance of 06; QXXp—electrostatic interactions between electric quadrupoles of van der Waals forces; π2H—solute dipolarity/polarizability; Σα2H—solute overall hydrogen-bond acidity; β2H—solute overall hydrogen bond basicity.
References
- Ng, K.W.; Lau, W.M. Skin Deep: The Basics of Human Skin Structure and Drug Penetration. Percutaneous Penetration Enhanc. Chem. Methods Penetration Enhanc. 2015, 3–11. [Google Scholar] [CrossRef]
- Todo, H. Transdermal Permeation of Drugs in Various Animal Species. Pharmaceutics 2017, 9, 33. [Google Scholar] [CrossRef] [Green Version]
- Neupane, R.; Boddu, S.H.S.; Renukuntla, J.; Babu, R.J.; Tiwari, A.K. Alternatives to Biological Skin in Permeation Studies: Current Trends and Possibilities. Pharmaceutics 2020, 12, 152. [Google Scholar] [CrossRef] [Green Version]
- El Tayar, N.; Tsai, R.-S.; Testa, B.; Carrupt, P.-A.; Hansch, C.; Leo, A. Percutaneous Penetration of Drugs: A Quantitative Structure–Permeability Relationship Study. J. Pharm. Sci. 1991, 80, 744–749. [Google Scholar] [CrossRef]
- Anderson, B.D.; Raykar, P.V. Solute Structure-Permeability Relationships in Human Stratum Corneum. J. Investig. Dermatol. 1989, 93, 280–286. [Google Scholar] [CrossRef] [Green Version]
- Potts, R.O.; Guy, R.H. Predicting Skin Permeability. Pharm. Res. 1992, 09, 663–669. [Google Scholar] [CrossRef]
- Potts, R.O.; Guy, R.H. A Predictive Algorithm for Skin Permeability: The Effects of Molecular Size and Hydrogen Bond Activity. Pharm. Res. 1995, 12, 1628–1633. [Google Scholar] [CrossRef] [PubMed]
- Barratt, M.D. Quantitative structure-activity relationships for skin permeability. Toxicol. Vitr. 1995, 9, 27–37. [Google Scholar] [CrossRef]
- Neumann, D.; Kohlbacher, O.; Merkwirth, C.; Lengauer, T. A Fully Computational Model for Predicting Percutaneous Drug Absorption. J. Chem. Inf. Modeling 2006, 46, 424–429. [Google Scholar] [CrossRef]
- Abraham, M.H.; Chadha, H.S.; Mitchell, R.C. The Factors that Influence Skin Penetration of Solutes. J. Pharm. Pharmacol. 1995, 47, 8–16. [Google Scholar] [CrossRef]
- Abraham, M.H.; Martins, F.; Mitchell, R.C. Algorithms For Skin Permeability Using Hydrogen Bond Descriptors: The Problem of Steroids. J. Pharm. Pharmacol. 1997, 49, 858–865. [Google Scholar] [CrossRef]
- Abraham, M.H.; Martins, F. Human Skin Permeation and Partition: General Linear Free-Energy Relationship Analyses. J. Pharm. Sci. 2004, 93, 1508–1523. [Google Scholar] [CrossRef] [PubMed]
- Patel, H.; Berge, W.F.; Cronin, M.T.D. Quantitative structure–activity relationships (QSARs) for the prediction of skin permeation of exogenous chemicals. Chemosphere 2002, 48, 603–613. [Google Scholar] [CrossRef]
- Chang, Y.-C.; Chen, C.-P.; Chen, C.-C. Predicting Skin Permeability of Chemical Substances using a Quantitative Structure-activity Relationship. Procedia Eng. 2012, 45, 875–879. [Google Scholar] [CrossRef]
- Neely, B.J.; Madihally, S.V.; Robinson, R.L.; Gasem, K.A.M. Nonlinear Quantitative Structure-Property Relationship Modeling of Skin Permeation Coefficient. J. Pharm. Sci. 2009, 98, 4069–4084. [Google Scholar] [CrossRef] [Green Version]
- Wilschut, A.; Berge, W.F.; Robinson, P.J.; McKone, T.E. Estimating skin permeation. The validation of five mathematical skin permeation models. Chemosphere 1995, 30, 1275–1296. [Google Scholar] [CrossRef]
- Moss, G.P.; Dearden, J.C.; Patel, H.; Cronin, M.T.D. Quantitative structure–permeability relationships (QSPRs) for percutaneous absorption. Toxicol. Vitr. 2002, 16, 299–317. [Google Scholar] [CrossRef]
- Mitragotri, S.; Anissimov, Y.G.; Bunge, A.L.; Frasch, H.F.; Guy, R.H.; Hadgraft, J.; Kasting, G.B.; Lane, M.E.; Roberts, M.S. Mathematical models of skin permeability: An overview. Int. J. Pharm. 2011, 418, 115–129. [Google Scholar] [CrossRef] [PubMed] [Green Version]
- Fitzpatrick, D.; Corish, J.; Hayes, B. Modelling skin permeability in risk assessment—The future. Chemosphere 2004, 55, 1309–1314. [Google Scholar] [CrossRef]
- Geinoz, S.; Guy, R.H.; Testa, B.; Carrupt, P.-A. Quantitative Structure-Permeation Relationships (QSPeRs) to Predict Skin Permeation: A Critical Evaluation. Pharm. Res. 2004, 21, 83–92. [Google Scholar] [CrossRef] [Green Version]
- Lian, G.; Chen, L.; Han, L. An evaluation of mathematical models for predicting skin permeability. J. Pharm. Sci. 2008, 97, 584–598. [Google Scholar] [CrossRef] [PubMed]
- Alonso, C.; Carrer, V.; Espinosa, S.; Zanuy, M.; Córdoba, M.; Vidal, B.; Domínguez, M.; Godessart, N.; Coderch, L.; Pont, M. Prediction of the skin permeability of topical drugs using in silico and in vitro models. Eur. J. Pharm. Sci. 2019, 136, 104945. [Google Scholar] [CrossRef]
- Lien, E.J.; Gaot, H. QSAR Analysis of Skin Permeability of Various Drugs in Man as Compared to in Vivo and in Vitro Studies in Rodents. Pharm. Res. 1995, 12, 583–587. [Google Scholar] [CrossRef]
- Chen, C.-P.; Chen, C.-C.; Huang, C.-W.; Chang, Y.-C. Evaluating Molecular Properties Involved in Transport of Small Molecules in Stratum Corneum: A Quantitative Structure-Activity Relationship for Skin Permeability. Molecules 2018, 23, 911. [Google Scholar] [CrossRef] [Green Version]
- Mitragotri, S. A theoretical analysis of permeation of small hydrophobic solutes across the stratum corneum based on Scaled Particle Theory. J. Pharm. Sci. 2002, 91, 744–752. [Google Scholar] [CrossRef] [PubMed]
- Sobańska, A.W. Application of planar chromatographic descriptors to the prediction of physicochemical properties and biological activity of compounds. J. Liq. Chromatogr. Relat. Technol. 2018, 41, 255–271. [Google Scholar] [CrossRef]
- Sobańska, A.W.; Brzezińska, E. Phospholipid-based Immobilized Artificial Membrane (IAM) Chromatography: A PowerfulTool to Model Drug Distribution Processes. Curr. Pharm. Des. 2017, 23, 6784–6794. [Google Scholar] [CrossRef]
- Sobańska, A.W.; Brzezińska, E. Application of planar and column micellar liquid chromatography to the prediction of physicochemical properties and biological activity of compounds. J. Liq. Chromatogr. Relat. Technol. 2019, 42, 227–237. [Google Scholar] [CrossRef]
- Jevric, L.R.; Podunavac Kuzmanovic, S.O.; Svarc Gajic, J.V.; Kovacevic, S.; Jovanovic, B.Z. RP- HPTLC Retention Data in Correlation with the In-silico ADME Properties of a Series of s-triazine Derivatives. Iran. J. Pharm. Res. 2014, 13, 1203–1211. [Google Scholar] [CrossRef]
- Kovačević, S.Z.; Jevrić, L.R.; Podunavac Kuzmanović, S.O.; Lončar, E.S. Prediction of In-silico ADME Properties of 1,2-O-Isopropylidene Aldohexose Derivatives. Iran. J. Pharm. Res. 2014, 13, 899–907. [Google Scholar]
- Nasal, A.; Sznitowska, M.; Buciński, A.; Kaliszan, R. Hydrophobicity parameter from high-performance liquid chromatography on an immobilized artificial membrane column and its relationship to bioactivity. J. Chromatogr. A 1995, 692, 83–89. [Google Scholar] [CrossRef]
- Barbato, F.; Cappello, B.; Miro, A.; La Rotonda, M.; Quaglia, F. Chromatographic indexes on immobilized artificial membranes for the prediction of transdermal transport of drugs. II Farm. 1998, 53, 655–661. [Google Scholar] [CrossRef]
- Lázaro, E.; Ràfols, C.; Abraham, M.H.; Rosés, M. Chromatographic Estimation of Drug Disposition Properties by Means of Immobilized Artificial Membranes (IAM) and C18 Columns. J. Med. Chem. 2006, 49, 4861–4870. [Google Scholar] [CrossRef]
- Hidalgo-Rodríguez, M.; Soriano-Meseguer, S.; Fuguet, E.; Ràfols, C.; Rosés, M. Evaluation of the suitability of chromatographic systems to predict human skin permeation of neutral compounds. Eur. J. Pharm. Sci. 2013, 50, 557–568. [Google Scholar] [CrossRef] [PubMed]
- Soriano-Meseguer, S.; Fuguet, E.; Port, A.; Rosés, M. Estimation of skin permeation by liquid chromatography. ADMET DMPK 2018, 6, 140–152. [Google Scholar] [CrossRef] [Green Version]
- Turowski, M.; Kaliszan, R. Keratin immobilized on silica as a new stationary phase for chromatographic modelling of skinpermeation. J. Pharm. Biomed. Anal. 1997, 15, 1325–1333. [Google Scholar] [CrossRef]
- Martínez-Pla, J.J.; Martín-Biosca, Y.; Sagrado, S.; Villanueva-Camañas, R.M.; Medina-Hernández, M.J. Biopartitioning micellar chromatography to predict skin permeability. Biomed. Chromatogr. 2003, 17, 530–537. [Google Scholar] [CrossRef] [PubMed]
- Martinez-Pla, J.; Martin-Biosca, Y.; Sagrado, S.; Villanueva-Camanas, R.; Medina-Hernandez, M. Evaluation of the pH effect of formulations on the skin permeability of drugs by biopartitioning micellar chromatography. J. Chromatogr. A 2004, 1047, 255–262. [Google Scholar] [CrossRef]
- Waters, L.J.; Shahzad, Y.; Stephenson, J. Modelling skin permeability with micellar liquid chromatography. Eur. J. Pharm. Sci. 2013, 50, 335–340. [Google Scholar] [CrossRef]
- Wang, Y.; Sun, J.; Liu, H.; Liu, J.; Zhang, L.; Liu, K.; He, Z. Predicting skin permeability using liposome electrokinetic chromatography. Analyst 2009, 134, 267–272. [Google Scholar] [CrossRef]
- Seung Lim, J. EPI Suite: A Fascinate Predictive Tool for Estimating the Fates of Organic Contaminants. J. Bioremediation Biodegrad. 2016. [Google Scholar] [CrossRef] [Green Version]
- Bate-Smith, E.C.; Westall, R.G. Chromatographic behaviour and chemical structure I. Some naturally occurring phenolic substances. Biochim. et Biophys. Acta 1950, 4, 427–440. [Google Scholar] [CrossRef]
- Soczewiński, E.; Wachtmeister, C.A. The relation between the composition of certain ternary two- phase solvent systems and RM values. J. Chromatogr. A 1962, 7, 311–320. [Google Scholar] [CrossRef]
- Lipinski, C.A. Lead- and drug-like compounds: The rule-of-five revolution. Drug Discov. Today Technol. 2004, 1, 337–341. [Google Scholar] [CrossRef]
- Veber, D.F.; Johnson, S.R.; Cheng, H.-Y.; Smith, B.R.; Ward, K.W.; Kopple, K.D. Molecular Properties That Influence the Oral Bioavailability of Drug Candidates. J. Med. Chem. 2002, 45, 2615–2623. [Google Scholar] [CrossRef] [PubMed]
- Komsta, Ł.; Skibiński, R.; Berecka, A.; Gumieniczek, A.; Radkiewicz, B.; Radoń, M. Revisiting thin-layer chromatography as a lipophilicity determination tool—A comparative study on several techniques with a model solute set. J. Pharm. Biomed. Anal. 2010, 53, 911–918. [Google Scholar] [CrossRef]
- Sobańska, A.W.; Wójcicka, K.; Brzezińska, E. Evaluation of the lipophilicity of selected sunscreens- A chemometric analysis of thin-layer chromatographic retention data. J. Sep. Sci. 2014, 37, 3074–3081. [Google Scholar] [CrossRef]
- Sobańska, A.W.; Brzezińska, E. Application of RP-18 thin-layer chromatography and quantitative structure–activity relationship analysis for the prediction of the blood–brain barrier permeation. JPC J. Planar Chromatogr. Mod. TLC 2016, 29, 287–298. [Google Scholar] [CrossRef]
- Sobańska, A.W.; Wanat, K.; Brzezińska, E. Prediction of the Blood-Brain Barrier Permeability Using RP-18 Thin Layer Chromatography. Open Chem. 2019, 17, 43–56. [Google Scholar] [CrossRef]
- Pyzowski, J.; Brzezińska, E.; Sobańska, A.W. RP-18 chromatographic-based study of the blood—brain barrier permeability of selected sunscreens and preservatives. JPC J. Planar Chromatogr. Mod. TLC 2017, 30, 275–284. [Google Scholar] [CrossRef]
- Geldenhuys, W.J.; Mohammad, A.S.; Adkins, C.E.; Lockman, P.R. Molecular determinants of blood–brain barrier permeation. Ther. Deliv. 2015, 6, 961–971. [Google Scholar] [CrossRef] [PubMed]
- Fu, X.C.; Wang, G.P.; Wang, Y.F.; Liang, W.Q.; Yu, Q.S.; Chow, M.S.S. Limitations of Potts and Guy model and a predictive algorithm for skin permeability including the effects of hydrogen-bond on diffusivity. Pharmazie 2004, 59, 282–285. [Google Scholar] [PubMed]
- Cronin, M.T.D.; Dearden, J.C.; Moss, G.P.; Murray-Dickson, G. Investigation of the mechanism of flux across human skin in vitro by quantitative structure-permeability relationships. Eur. J. Pharm. Sci. 1999, 7, 325–330. [Google Scholar] [CrossRef]
Figure 1.
Scatterplots of log KpEPI vs. S and RM0 (n = 14).

Figure 2.
Equation (5)—predicted vs. observed values.

Figure 3.
Equation (6)—predicted vs. observed values.

Figure 4.
Equation (8)—predicted vs. observed values.

Figure 5.
Equation (10), predicted vs. observed values.


Table 1.
Selected computational models of skin permeation.
| Equation | n | R | Ref. |
|---|---|---|---|
| log kp = −1.36 Δlog Poct-hept− 3.38 | 21 | 0.90 | [4] |
| log Kp = −6.3 + 0.71 log Pow − 0.0061 Mw | 93 | 0.82 | [6] |
| log Kp = 0.82 log Pow − 0.0093 VM − 0.039 MPt − 2.36 | 60 | 0.95 | [8] |
| log Kp = 0.84 log Pow − 0.07 (log Pow)2 − 0.27 Hb − 1.84 log Mw + 4.39 | 22 | 0.98 | [23] |
| log Kp = 0.652 log Pow − 0.00603 Mw − 0.623 ABSQon − 0.313 SsssCH − 2.30 | 143 | 0.95 | [13] |
| log Kp = −5.426 − 0.106 E − 0.473 S − 0.473 A − 3.000 B + 2.296 V | 119 | 0.91 | [12] |
| log Kp = −3.05 − 0.0065 QXXp + 0.65 ALOGP − 1.75 Neoplastic-80 + 0.22 F06[C-N] | 158 | 0.91 | [14] |
| log Kp = −5.426 − 0.106 E − 0.473 S − 0.473 A − 3.000 B + 2.296 V | 119 | 0.91 | [12] |
| log Kp = −5.048 − 0.586 π2H − 0.633Σα2H − 3.481 Σβ2H + 1.787 V | 46 | 0.98 | [10] |
Where: log Pow—octanol-water partition coefficient; Δlog Poct-hept—the difference between logarithms of octanol-water and heptane-water partition coefficients; MW—molecular weight; VM—molecular volume; MPt—melting point; SsssCH—sum of E-state indices for all methyl groups; ABSQon—sum of absolute charges on nitrogen and oxygen atoms; Hb—total H-bond count; A, B, S, E, V—Abraham’s solvation parameters (A—hydrogen bond acidity; B—hydrogen bond basicity; S—dipolar interactions; E—excess molar refractivity; V—McGowan’s characteristic volume); Neoplastic-80—antineoplastic-like property at 80% similarity; ALOGP—log Pow calculated using ALOGP algorithm; F06[C-N]—frequency of carbon-nitrogen bond at a topological distance of 06; QXXp—electrostatic interactions between electric quadrupoles of van der Waals forces; π2H—solute dipolarity/polarizability; Σα2H—solute overall hydrogen-bond acidity; β2H—solute overall hydrogen bond basicity.
Table 2.
Selected relationships between skin permeability and liquid chromatographic descriptors.
| Equation | n | R | Reference | |
|---|---|---|---|---|
| NP TLC | log Kp = −1.318 (RM0)2 − 7.529 RM0 − 9.142 (dioxane-cyclohexane) | 7 7 | 0.98 | [30] |
| log Kp = −0.762 (RM0)2 − 5.146 RM0 − 6.955 (THF-cyclohexane) | 0.97 | |||
| IAM HPLC | log Kp= −10.19 + 1.77 log kIAM | 10 | 0.94 | [31] |
| log Ksc= 0.40 + 0.64 log kIAM | 10 | 0.97 | ||
| log Kp= −6.16 − 0.46 (log kIAM)2 + 1.54 log kIAM | 14 | 0.80 | ||
| log Kp = −6.09 + 1.05 log kIAM | 14 | 0.88 | ||
| log Kp= −5.154 + 1.443 log kIAM | 32 | 0.51 | [33] | |
| log Ksc= 1.555 + 1.522 log kIAM | 15 | 0.92 | ||
| log Kp= −5.09 + 1.94 log kIAM | 32 | 0.55 | [34] | |
| log Kp= −3.58 + 2.56 log kIAM − 1.12 V | 32 | 0.86 | ||
| log Kp= −2.419 Δlog kwIAM − 2.206 | 10 | 0.95 | [32] | |
| log Kp= −2.136 Δlog kwIAM + 0.037 log Pow − 2.373 | 10 | 0.94 | ||
| log Kp= −2.182 Δlog kwIAM + 0.046 log kwIAM − 2.323 | 10 | 0.94 | ||
| RP-18 | log Kp = −4.76 + 1.44 log k − 1.16 V | 27 | 0.91 | [34] |
| log Kp = −5.728 + 1.636 log k (MSC18 column) | 32 | 0.75 | [33] | |
| log Kp = −5.865 + 1.849 log k(RP-18 column) | 32 | 0.73 | ||
| log Ksc = 1.131 + 0.855 log k (MSC18 column) | 15 | 0.87 | ||
| log Ksc = 1.099 + 0.95 log k (RP-18 column) | 15 | 0.85 | ||
| BMC | log Kp = −3.3 + 1.3 log kBMC − 0.008 MPt | 42 | 0.91 | [37] |
| log Kp = −2.24 + 1.83 log Pmw − 0.0123 Mw | 22 | 0.91 | [39] | |
| Keratin | log Kp = −6.558 + 1.920 log kIAM − 1.039 log kKERATIN | 17 | 0.93 | [36] |
Where: Kp—skin permeability coefficient; Rf—retention factor in thin layer chromatography; RM = log (1/Rf − 1) and RM0 are obtained by extrapolation of RM values from a series of TLC experiments conducted for different concentrations φ of a modifier in mobile phases to zero concentration of the modifier, according to the equation: RM = RM0 + Sφ; Pmw—micelle-water partitioning coefficient; k—retention factor in column liquid chromatography; kIAM, kBMC, kKERATIN—retention factors in IAM, BMC and immobilized keratin chromatography, respectively; kwIAM—kIAM measured at or extrapolated to purely aqueous conditions; Δlog kwIAM—the difference between log kwIAM measured and predicted on the basis of log Pow; V—McGowan’s characteristic volume; Mw—molecular weight; MPt—melting point; Ksc—human skin-water partition coefficient.
Table 3.
Reference, experimental and calculated values of log Kp.
| log KpEPI | log Kp(6) | log Kp(7) | log Kp(8) | log Kp(9) | log Kp(10) | log Kp(12) | log Kpexp | ||
|---|---|---|---|---|---|---|---|---|---|
| 1 | Diazepam | −2.53 | −1.99 | −1.99 | −1.94 | −1.95 | −2.02 | −2.01 | |
| 2 | Temazepam | −3.04 | −2.68 | −2.70 | −2.63 | −2.66 | −2.77 | −2.80 | |
| 3 | Alprazolam | −3.13 | −2.41 | −2.39 | −2.47 | −2.43 | −2.69 | −2.82 | |
| 4 | Medazepam | −1.39 | −1.41 | −1.41 | −1.53 | −1.54 | −1.68 | −1.67 | |
| 5 | Bromazepam | −3.22 | −2.71 | −2.73 | −2.64 | −2.65 | −3.17 | −3.25 | |
| 6 | Chlordiazepoxide | −2.87 | −2.66 | −2.68 | −2.69 | −2.73 | −2.83 | −2.84 | |
| 7 | Midazolam | −1.75 | −1.83 | −1.82 | −1.92 | −1.97 | −2.29 | −2.30 | |
| 8 | Oxazepam | −2.92 | −2.90 | −2.94 | −2.70 | −2.73 | −2.80 | −2.80 | |
| 9 | Lorazepam | −3.02 | −2.87 | −2.91 | −2.71 | −2.74 | −3.14 | −3.22 | |
| 10 | Lormetazepam | −3.20 | −2.66 | −2.68 | −2.48 | −2.53 | −2.87 | −2.87 | |
| 11 | Clorazepate | −3.21 | −3.16 | −3.15 | −2.95 | −2.94 | −2.94 | −2.96 | |
| 12 | Ibuprofen | −1.32 | −1.74 | −1.80 | −1.69 | −1.66 | −1.23 | −1.14 | −1.44 [9] |
| 13 | Zolpidem | −1.97 | −2.32 | −2.29 | −2.41 | −2.47 | −2.24 | −2.10 | |
| 14 | Tamoxifen | −0.70 | −0.87 | −0.80 | −0.89 | −0.89 | −0.61 | −0.51 | |
| 15 | Propranolol | −1.95 | −2.42 | −2.48 | −2.41 | −2.46 | −2.25 | −2.18 | |
| 16 | Ranitidine | −4.39 | −4.12 | −4.09 | −4.62 | −4.58 | −4.62 | −4.83 | −4.05 [9] |
| 17 | Methyldopa | −5.18 | −4.27 | −4.41 | −4.58 | −4.70 | −4.66 | −4.67 | |
| 18 | Amizepin | −2.50 | −2.49 | −2.56 | −2.29 | −2.29 | −2.36 | −2.38 | |
| 19 | Enalapril | −4.87 | −3.93 | −3.88 | −4.74 | −3.65 | −4.94 | −2.55 | |
| 20 | Paracetamol | −3.35 | −2.85 | −2.97 | −3.27 | −3.34 | −3.40 | −3.41 | |
| 21 | Aspirin | −3.03 | −2.84 | −2.88 | −3.17 | −3.21 | −3.07 | −3.00 | −2.14 [9] |
| 22 | Cefuroxime | −5.29 | −6.45 | −6.33 | −6.00 | −6.03 | −5.56 | −5.38 | |
| 23 | Theophylline | −3.84 | −3.76 | −3.77 | −3.86 | −3.84 | −3.69 | −3.63 | |
| 24 | Verapamil | −2.84 | −3.14 | −3.06 | −3.14 | −3.27 | −2.93 | −2.80 | |
| 25 | Clobazam | −3.08 | −2.55 | −2.56 | −2.58 | −2.64 | −2.81 | −2.79 | |
| 26 | Mitrazapin | −2.28 | −2.14 | −2.17 | −2.22 | −2.27 | −2.17 | −2.11 | |
| 27 | Promazine | −1.38 | −1.68 | −1.73 | −1.76 | −1.82 | −1.71 | −1.62 | |
| 28 | Phenytoin | −2.58 | −2.87 | −2.91 | −2.69 | −2.69 | −2.50 | −2.46 | |
| 29 | Hydroxyzine | −3.34 | −2.71 | −2.74 | −2.62 | −2.72 | −2.86 | −2.89 | |
| 30 | Mianserin | −1.47 | −1.66 | −1.71 | −1.74 | −1.80 | −1.73 | −1.67 | |
| 31 | Valproic acid | −1.79 | −2.30 | −2.43 | −2.27 | −2.30 | −1.90 | −1.83 | |
| 32 | Zopiclone | −3.97 | −4.10 | −4.00 | −4.13 | −4.21 | −4.25 | −4.14 | |
| 33 | Haloperidol | −2.06 | −2.35 | −2.40 | −2.08 | −2.24 | −2.28 | −2.19 | |
| 34 | Risperidone | −2.79 | −3.15 | −3.07 | −3.07 | −3.18 | −2.94 | −2.79 | |
| 35 | Loperamide | −2.06 | −2.48 | −2.47 | −2.14 | −2.29 | −2.21 | −2.11 | |
| 36 | Phenylbutazone | −2.44 | −2.78 | −2.82 | −2.73 | −2.84 | −2.66 | −2.57 | |
| 37 | Clonidine | −3.04 | −2.80 | −2.91 | −2.63 | −2.68 | −3.16 | −3.25 | |
| 38 | PABA | −3.02 | −3.38 | −3.57 | −3.22 | −3.26 | −3.09 | −3.11 | |
| 39 | Propylparaben | −1.80 | −2.23 | −2.27 | −2.35 | −2.31 | −2.06 | −2.05 | |
| 40 | Methylparaben | −2.36 | −2.39 | −2.45 | −2.61 | −2.57 | −2.44 | −2.47 | −2.04 [8] |
| 41 | Quetiap Quetiapine | −3.67 | −3.14 | −3.14 | −3.11 | −3.19 | −3.09 | −3.07 | |
| 42 | Chlorprotixen | −1.13 | −1.06 | −1.10 | −1.09 | −1.14 | −1.25 | −1.20 | |
| 43 | Perazine | −2.05 | −1.96 | −1.96 | −1.93 | −1.99 | −1.84 | −1.74 | |
| 44 | Trifluoperazine | −1.75 | −1.79 | −1.77 | −1.58 | −1.73 | −1.79 | −1.65 | |
| 45 | Thioridazine | −0.96 | −1.48 | −1.50 | −1.44 | −1.52 | −1.27 | −1.09 | |
| 46 | Fluconazole | −4.19 | −4.00 | −3.96 | −4.00 | −4.04 | −4.21 | −4.24 | |
| 47 | Tolperisone | −1.76 | −1.74 | −1.80 | −1.75 | −1.82 | −1.45 | −1.28 | |
| 48 | Fenspiride | −2.75 | −3.02 | −3.09 | −2.91 | −3.00 | −2.75 | −2.66 | |
| 49 | Pizotifen | −1.00 | −1.04 | −1.09 | −1.08 | −1.12 | −0.87 | −0.75 | |
| 50 | Cyproheptadine | −1.30 | −0.99 | −1.02 | −1.05 | −1.08 | −0.93 | −0.86 | |
| 51 | Clozapine | −2.52 | −2.91 | −2.96 | −2.69 | −2.79 | −2.99 | −2.97 | |
| 52 | Tiapride | −4.05 | −3.96 | −3.99 | −3.77 | −3.91 | −3.66 | −3.51 | |
| 53 | Olanzapine | −2.56 | −2.61 | −2.62 | −2.50 | −2.52 | −2.34 | −2.25 | |
| 54 | Betahistine | −3.12 | −2.66 | −2.84 | −2.68 | −2.75 | −2.66 | −2.66 | |
| 55 | Dexketoprofen | −2.16 | −2.71 | −2.82 | −2.61 | −2.70 | −2.45 | −2.37 | |
| 56 | Caffeine | −3.94 | −3.52 | −3.50 | −3.68 | −3.68 | −3.58 | −3.51 | −3.64 [34] |
| 57 | Hymecromone | −2.53 | −2.66 | −2.68 | −2.89 | −2.84 | −2.77 | −2.83 | |
| 58 | Ketotifen | −1.99 | −1.58 | −1.62 | −1.64 | −1.71 | −1.47 | −1.32 | |
| 59 | Clemastine | −1.09 | −1.62 | −1.66 | −1.52 | −1.63 | −1.64 | −1.57 | |
| 60 | Salicylic acid | −2.08 | −3.07 | −3.22 | −3.09 | −3.10 | −2.99 | −3.05 | −2.84 [9] |
| 61 | Indomethacin | −1.97 | −3.40 | −3.44 | −3.24 | −3.36 | −3.49 | −3.51 | −3.67 [9,13] |
| 62 | Piroxicam | −2.63 | −4.05 | −4.00 | −3.85 | −3.84 | −3.68 | −3.65 | −3.81 [9,13] |
| 63 | Naproxen | −1.98 | −2.60 | −2.69 | −2.63 | −2.68 | −2.52 | −2.54 | −2.54 [37] |
Where: log Kpexp—experimental values; log KpEPI—values calculated using DERMWIN software; log Kp(6) to log Kp(10) and log Kp(12)—values calculated according to Equations (6)–(10) and (12).
Table 4.
Chromatographic parameters for compounds 1 to 63.
| Rf | Rf/PSA | RM | RM/MW | RM/VM | RM0 | S | ||
|---|---|---|---|---|---|---|---|---|
| 1 | Diazepam | 0.33 | 0.0101 | 0.308 | 0.00108 | 0.00123 | 3.578 | −4.176 |
| 2 | Temazepam | 0.50 | 0.0095 | 0.000 | 0.00000 | 0.00000 | 3.050 | −3.798 |
| 3 | Alprazolam | 0.22 | 0.0058 | 0.550 | 0.00178 | 0.00204 | 3.254 | −3.877 |
| 4 | Medazepam | 0.56 | 0.0359 | −0.105 | −0.00039 | −0.00042 | 2.528 | −3.035 |
| 5 | Bromazepam | 0.51 | 0.0094 | −0.017 | −0.00005 | −0.00007 | 2.496 | −3.269 |
| 6 | Chlordiazepoxide | 0.62 | 0.0117 | −0.213 | −0.00070 | −0.00079 | 2.131 | −2.551 |
| 7 | Midazolam | 0.58 | 0.0230 | −0.140 | −0.00043 | −0.00051 | 2.235 | −2.741 |
| 8 | Oxazepam | 0.60 | 0.0097 | −0.176 | −0.00061 | −0.00073 | 2.864 | −3.752 |
| 9 | Lorazepam | 0.61 | 0.0099 | −0.194 | −0.00060 | −0.00076 | 3.031 | −4.037 |
| 10 | Lormetazepam | 0.49 | 0.0093 | 0.017 | 0.00005 | 0.00006 | 3.303 | −4.207 |
| 11 | Clorazepate | 0.47 | 0.0060 | 0.052 | 0.00017 | 0.00020 | 3.117 | −3.840 |
| 12 | Ibuprofen | 0.46 | 0.0122 | 0.078 | 0.00038 | 0.00037 | 4.139 | −4.895 |
| 13 | Zolpidem | 0.68 | 0.0181 | −0.327 | −0.00106 | −0.00109 | 1.744 | −2.341 |
| 14 | Tamoxifen | 0.48 | 0.0381 | 0.043 | 0.00012 | 0.00015 | 5.041 | −5.908 |
| 15 | Propranolol | 0.82 | 0.0198 | −0.659 | −0.00254 | −0.00254 | 2.059 | −3.004 |
| 16 | Ranitidine | 0.82 | 0.0074 | −0.659 | −0.00208 | −0.00220 | 0.343 | −0.518 |
| 17 | Methyldopa | 0.98 | 0.0094 | −1.690 | −0.00800 | −0.00914 | 2.480 | −0.197 |
| 18 | Amizepin | 0.55 | 0.0119 | −0.087 | −0.00033 | −0.00040 | 2.484 | −3.221 |
| 19 | Enalapril | 0.82 | 0.0085 | −0.659 | −0.00175 | −0.00175 | 2.035 | −2.994 |
| 20 | Paracetamol | 0.85 | 0.0172 | −0.753 | −0.00498 | −0.00542 | 0.459 | −1.500 |
| 21 | Aspirin | 0.76 | 0.0119 | −0.501 | −0.00278 | −0.00328 | 1.301 | −2.204 |
| 22 | Cefuroxime | 0.77 | 0.0039 | −0.525 | −0.00124 | −0.00160 | 2.023 | −3.307 |
| 23 | Theophylline | 0.79 | 0.0114 | −0.575 | −0.00319 | −0.00110 | ||
| 24 | Verapamil | 0.77 | 0.0120 | −0.525 | −0.00115 | −0.00036 | ||
| 25 | Clobazam | 0.50 | 0.0124 | 0 | 0 | 0 | ||
| 26 | Mitrazapin | 0.71 | 0.0366 | −0.389 | −0.00147 | −0.00049 | ||
| 27 | Promazine | 0.71 | 0.0223 | −0.389 | −0.00137 | −0.00045 | ||
| 28 | Phenytoin | 0.70 | 0.0120 | −0.368 | −0.00146 | −0.00051 | ||
| 29 | Hydroxyzine | 0.76 | 0.0212 | −0.501 | −0.00134 | −0.00046 | ||
| 30 | Mianserin | 0.77 | 0.1185 | −0.525 | −0.00199 | −0.00065 | ||
| 31 | Valproic acid | 0.54 | 0.1185 | −0.070 | −0.00048 | −0.00013 | ||
| 32 | Zopiclone | 0.80 | 0.1185 | −0.602 | −0.00155 | −0.00059 | ||
| 33 | Haloperidol | 0.78 | 0.0192 | −0.550 | −0.00146 | −0.00053 | ||
| 34 | Risperidone | 0.55 | 0.0089 | −0.087 | −0.00021 | −0.00008 | ||
| 35 | Loperamide | 0.53 | 0.0121 | −0.052 | −0.00011 | −0.00004 | ||
| 36 | Phenylbutazone | 0.39 | 0.0096 | 0.194 | 0.00063 | 0.00021 | ||
| 37 | Clonidine | 0.83 | 0.0234 | −0.689 | −0.00299 | −0.00110 | ||
| 38 | PABA | 0.85 | 0.0134 | −0.753 | −0.00549 | −0.00170 | ||
| 39 | Propylparaben | 0.61 | 0.0131 | −0.194 | −0.00108 | −0.00032 | ||
| 40 | Methylparaben | 0.72 | 0.0155 | −0.410 | −0.00270 | −0.00084 | ||
| 41 | Quetiapine | 0.72 | 0.0098 | −0.410 | −0.00107 | −0.00037 | ||
| 42 | Chlorprotixen | 0.57 | 0.0200 | −0.122 | −0.00039 | −0.00013 | ||
| 43 | Perazine | 0.44 | 0.0126 | 0.105 | 0.00031 | 0.00011 | ||
| 44 | Trifluoperazine | 0.44 | 0.0126 | 0.105 | 0.00026 | 0.00010 | ||
| 45 | Thioridazine | 0.52 | 0.0091 | −0.035 | −0.00009 | −0.00003 | ||
| 46 | Fluconazole | 0.68 | 0.0095 | −0.327 | −0.00107 | −0.00042 | ||
| 47 | Tolperisone | 0.75 | 0.0369 | −0.477 | −0.00194 | −0.00059 | ||
| 48 | Fenspiride | 0.80 | 0.0178 | −0.602 | −0.00231 | −0.00076 | ||
| 49 | Pizotifen | 0.55 | 0.0175 | −0.087 | −0.00029 | −0.00010 | ||
| 50 | Cyproheptadine | 0.62 | 0.1914 | −0.213 | −0.00074 | −0.00024 | ||
| 51 | Clozapine | 0.68 | 0.0220 | −0.327 | −0.00100 | −0.00035 | ||
| 52 | Tiapride | 0.81 | 0.0096 | −0.630 | −0.00192 | −0.00064 | ||
| 53 | Olanzapine | 0.60 | 0.0102 | −0.176 | −0.00056 | −0.00020 | ||
| 54 | Betahistine | 0.72 | 0.0289 | −0.410 | −0.00301 | −0.00079 | ||
| 55 | Dexketoprofen | 0.61 | 0.0112 | −0.194 | −0.00076 | −0.00025 | ||
| 56 | Caffeine | 0.66 | 0.0123 | −0.288 | −0.00148 | −0.00050 | ||
| 57 | Hymecromone | 0.73 | 0.0157 | −0.432 | −0.00245 | −0.00083 | ||
| 58 | Ketotifen | 0.70 | 0.0144 | −0.368 | −0.00119 | −0.00042 | ||
| 59 | Clemastine | 0.45 | 0.0361 | 0.087 | 0.00025 | 0.00009 | ||
| 60 | Salicylic acid | 0.70 | 0.0122 | −0.368 | −0.00266 | −0.00088 | ||
| 61 | Indomethacin | 0.46 | 0.0066 | −0.069 | 0.000195 | 0.00007 | ||
| 62 | Piroxicam | 0.50 | 0.0046 | 0 | 0 | 0 | 2.598 | −3.193 |
| 63 | Naproxen | 0.59 | 0.0127 | −0.158 | −0.00069 | −0.00022 |
Table 5.
Calculated descriptors for compounds 1 to 63.
| PSA | HD | HA | log D | N+O | MW | ET | Eb | Ee | DM | EHOMO | ELUMO | Sa(a) | Sa(g) | VM | Eh | log P | R | α | ||
|---|---|---|---|---|---|---|---|---|---|---|---|---|---|---|---|---|---|---|---|---|
| 1 | Diazepam | 32.7 | 0 | 3 | 2.96 | 3 | 284.7 | −69,868 | −3697 | −488,334 | 3.32 | −9.20 | −0.76 | 279.6 | 283.8 | 250.5 | −2.75 | 0.94 | 87.8 | 31.0 |
| 2 | Temazepam | 52.9 | 1 | 4 | 2.20 | 4 | 300.7 | −76,642 | −3799 | −541,464 | 3.98 | −9.27 | −0.87 | 289.2 | 291.9 | 257.1 | −7.84 | 1.08 | 89.0 | 31.6 |
| 3 | Alprazolam | 38.1 | 0 | 4 | 2.50 | 4 | 308.8 | −73,284 | −3950 | −550,378 | 6.48 | −9.65 | −1.23 | 293.7 | 299.4 | 269.4 | −9.24 | 2.13 | 95.4 | 33.8 |
| 4 | Medazepam | 15.6 | 0 | 2 | 4.43 | 2 | 270.8 | −63,807 | −3705 | −454,146 | 2.35 | −8.82 | −0.40 | 277.4 | 284.4 | 250.0 | −1.58 | 1.75 | 88.1 | 30.9 |
| 5 | Bromazepam | 54.4 | 1 | 4 | 2.06 | 4 | 316.2 | −67,922 | −3290 | −441,623 | 3.46 | −9.33 | −0.79 | 255.3 | 270.6 | 236.5 | −5.68 | −0.42 | 83.4 | 29.1 |
| 6 | Chlordiazepoxide | 53.1 | 1 | 4 | 2.36 | 4 | 301.8 | −74,644 | −3933 | −566,228 | 1.88 | −8.67 | −0.31 | 304.6 | 304.2 | 268.3 | −7.93 | 0.39 | 91.5 | 32.9 |
| 7 | Midazolam | 25.3 | 0 | 3 | 3.93 | 3 | 325.8 | −82,444 | −4091 | −609,612 | 4.38 | −9.17 | −0.96 | 300.0 | 309.6 | 277.3 | −3.37 | 0.13 | 98.4 | 34.4 |
| 8 | Oxazepam | 61.7 | 2 | 4 | 2.31 | 4 | 286.7 | −73,199 | −3524 | −494,470 | 2.74 | −9.13 | −0.73 | 266.5 | 274.9 | 240.7 | −7.92 | 0.84 | 84.1 | 29.8 |
| 9 | Lorazepam | 61.7 | 2 | 4 | 2.47 | 4 | 321.2 | −80,151 | −3508 | −544,373 | 4.02 | −9.28 | −0.87 | 283.6 | 291.3 | 254.6 | −9.96 | 0.61 | 88.8 | 31.7 |
| 10 | Lormetazepam | 52.9 | 1 | 4 | 2.36 | 4 | 335.2 | −83,588 | −3778 | −599,987 | 1.93 | −9.12 | −0.64 | 307.2 | 308.3 | 271.7 | −4.85 | 0.86 | 93.7 | 33.5 |
| 11 | Clorazepate | 78.8 | 2 | 5 | 2.90 | 5 | 314.7 | −82,710 | −3797 | −581,135 | 3.32 | −9.27 | −0.93 | 288.7 | 293.6 | 258.0 | −10.98 | 0.68 | 88.9 | 31.7 |
| 12 | Ibuprofen | 37.3 | 1 | 2 | 3.72 | 2 | 206.3 | −55,498 | −3380 | −344,748 | 1.86 | −9.51 | 0.06 | 262.5 | 251.3 | 210.1 | −4.81 | 2.75 | 64.1 | 24.0 |
| 13 | Zolpidem | 37.6 | 0 | 4 | 3.07 | 4 | 307.4 | −77,368 | −4724 | −613,528 | 4.07 | −8.56 | −0.55 | 355.6 | 351.1 | 300.7 | −1.03 | −0.22 | 99.6 | 35.9 |
| 14 | Tamoxifen | 12.5 | 0 | 2 | 7.88 | 2 | 371.5 | −91,827 | −6085 | −810,401 | 0.59 | −8.88 | 0.09 | 446.1 | 438.0 | 283.3 | −2.55 | 2.88 | 131.6 | 46.2 |
| 15 | Propranolol | 41.5 | 2 | 3 | 3.10 | 3 | 259.4 | −68,465 | −4113 | −472,868 | 1.26 | −8.62 | −0.43 | 311.9 | 307.7 | 259.4 | −7.41 | 0.68 | 83.4 | 30.3 |
| 16 | Ranitidine | 111.6 | 2 | 7 | 1.23 | 7 | 316.4 | −83,560 | −4192 | −562,535 | 3.41 | −7.96 | −0.21 | 403.6 | 378.1 | 299.3 | −28.08 | −4.02 | 89.1 | 33.6 |
| 17 | Methyldopa | 103.8 | 5 | 5 | 0.12 | 5 | 211.2 | −62,797 | −2902 | −363,522 | 2.59 | −9.03 | −0.01 | 225.9 | 224.7 | 185.0 | −21.50 | −1.46 | 57.2 | 21.1 |
| 18 | Amizepin | 46.3 | 2 | 3 | 2.67 | 3 | 263.3 | −59,477 | −3441 | −409,257 | 3.32 | −9.01 | −0.59 | 243.5 | 249.9 | 219.2 | −6.48 | −0.28 | 80.0 | 27.4 |
| 19 | Enalapril | 95.9 | 2 | 7 | 2.43 | 7 | 376.5 | −102,647 | −5843 | −879,009 | 2.57 | −8.94 | 0.28 | 421.3 | 441.2 | 376.5 | −2.24 | 2.57 | 111.0 | 42.3 |
| 20 | Paracetamol | 49.3 | 2 | 3 | 0.34 | 3 | 151.2 | −42,346 | −2132 | −207,000 | 4.31 | −8.43 | 0.21 | 174.8 | 172.1 | 139.0 | −10.61 | −1.32 | 45.6 | 16.2 |
| 21 | Aspirin | 63.6 | 1 | 4 | 1.19 | 4 | 180.2 | −54,523 | −2335 | −277,770 | 0.49 | −9.66 | −0.57 | 192.6 | 187.3 | 152.8 | −7.43 | −0.26 | 48.0 | 17.4 |
| 22 | Cefuroxime | 199.1 | 4 | 12 | 0.47 | 12 | 424.4 | −122,720 | −4706 | −1,017,047 | 3.74 | −9.47 | −1.61 | 222.3 | 377.3 | 328.4 | −18.43 | −2.18 | 99.7 | 38.1 |
| 23 | Theophylline | 69.3 | 1 | 6 | −0.20 | 6 | 180.2 | −50,484 | −2233 | −281,145 | 3.47 | −9.11 | −0.57 | 301.7 | 335.5 | 523.0 | −5.34 | −1.31 | 45.1 | 17.0 |
| 24 | Verapamil | 64.0 | 0 | 6 | 2.33 | 6 | 454.6 | −121,717 | −7044 | −1,150,691 | 3.64 | −8.78 | −0.95 | 705.7 | 817.4 | 1453.9 | −8.35 | 2.81 | 136.6 | 51.5 |
| 25 | Clobazam | 40.6 | 0 | 4 | 1.59 | 4 | 300.7 | −76,643 | −3800 | −546,998 | 0.55 | −8.68 | −0.23 | 402.3 | 486.0 | 813.3 | −3.41 | −1.40 | 89.7 | 31.5 |
| 26 | Mitrazapin | 19.4 | 0 | 3 | 1.97 | 3 | 265.4 | −64,413 | −4174 | −512,476 | 0.83 | −8.38 | 0.08 | 352.3 | 476.4 | 798.4 | −1.47 | 1.16 | 87.1 | 31.6 |
| 27 | Promazine | 31.8 | 0 | 2 | 2.63 | 2 | 284.4 | −65,321 | −4185 | 501,582 | 2.89 | −7.84 | −0.24 | 461.7 | 508.8 | 860.3 | −1.65 | 1.37 | 93.7 | 34.2 |
| 28 | Phenytoin | 58.2 | 2 | 4 | 2.48 | 4 | 252.3 | −66,250 | −3542 | −454,910 | 2.86 | −9.90 | −0.39 | 333.5 | 435.7 | 716.5 | −7.67 | 2.26 | 70.0 | 27.7 |
| 29 | Hydroxyzine | 35.9 | 1 | 4 | 2.00 | 4 | 374.9 | −95,297 | −5407 | 805,537 | 1.70 | −9.13 | −0.11 | 563.4 | 637.5 | 1092.8 | −8.90 | 3.49 | 107.1 | 41.7 |
| 30 | Mianserin | 6.5 | 0 | 2 | 2.76 | 2 | 264.4 | −63,761 | −4290 | −510,168 | 0.77 | −8.46 | 0.20 | 365.6 | 479.6 | 808.8 | −0.80 | 0.94 | 91.2 | 32.3 |
| 31 | Valproic acid | 37.3 | 1 | 2 | 0.16 | 2 | 144.2 | −41,139 | −2450 | −216,934 | 4.47 | −11.03 | 1.11 | 372.6 | 356.7 | 539.8 | −4.39 | 2.61 | 40.3 | 16.2 |
| 32 | Zopiclone | 91.8 | 0 | 9 | 0.65 | 8 | 388.8 | −102,536 | −4710 | −838,854 | 4.51 | −9.36 | −1.28 | 489.2 | 598.1 | 1025.2 | −5.05 | −1.83 | 101.9 | 37.9 |
| 33 | Haloperidol | 40.5 | 1 | 3 | 2.11 | 3 | 375.9 | −100,303 | −5164 | −774,341 | 1.14 | −9.12 | −0.70 | 526.5 | 605.2 | 1035.8 | −4.30 | 3.38 | 102.6 | 39.8 |
| 34 | Risperidone | 61.9 | 0 | 6 | 2.27 | 6 | 410.5 | −111,074 | −5964 | −985,849 | 5.49 | −8.87 | −0.88 | 489.7 | 640.6 | 1127.2 | −4.39 | 0.63 | 118.5 | 43.5 |
| 35 | Loperamide | 43.8 | 1 | 4 | 3.53 | 4 | 477.0 | −119,284 | −7065 | −1,205,052 | 3.73 | −8.93 | −0.09 | 588.1 | 713.8 | 1308.0 | −5.22 | 5.01 | 139.4 | 54.5 |
| 36 | Phenylbutazone | 40.6 | 0 | 4 | 0.10 | 4 | 308.4 | −80,026 | −4646 | −632,151 | 0.90 | −9.32 | −0.26 | 473.7 | 543.9 | 920.5 | −3.25 | 1.84 | 98.4 | 35.0 |
| 37 | Clonidine | 35.4 | 2 | 3 | 0.65 | 3 | 230.1 | −53,612 | −2372 | −304,330 | 1.17 | −8.96 | −0.19 | 321.3 | 401.1 | 624.9 | −5.73 | 0.28 | 62.2 | 22.7 |
| 38 | PABA | 63.3 | 3 | 3 | −1.61 | 3 | 137.1 | −38,905 | −1859 | −176,902 | 4.29 | −8.50 | −0.21 | 247.8 | 298.6 | 442.5 | −11.00 | 0.96 | 37.5 | 14.3 |
| 39 | Propylparaben | 46.5 | 1 | 3 | 2.87 | 3 | 180.2 | −51,913 | −2627 | −272,388 | 1.43 | −9.52 | −0.40 | 378.1 | 386.8 | 599.2 | −7.99 | 2.30 | 48.6 | 19.1 |
| 40 | Methylparaben | 46.5 | 1 | 3 | 1.81 | 3 | 152.2 | −45,017 | −2067 | −210,788 | 1.54 | −9.53 | −0.42 | 308.2 | 325.8 | 488.0 | −9.09 | 1.49 | 39.3 | 15.5 |
| 41 | Quetiapine | 73.6 | 1 | 5 | 1.55 | 5 | 383.5 | −95,297 | −5413 | −823,576 | 2.20 | −8.64 | −0.70 | 535.3 | 637.5 | 1098.9 | −11.29 | 2.84 | 111.6 | 43.0 |
| 42 | Chlorprotixen | 28.5 | 0 | 1 | 4.40 | 1 | 315.9 | −70,896 | −4164 | −520,729 | 1.94 | −8.35 | −0.56 | 510.5 | 545.8 | 912.1 | −1.47 | 4.33 | 95.5 | 36.4 |
| 43 | Perazine | 35.0 | 0 | 3 | 3.13 | 3 | 339.5 | −79,041 | −5068 | −693,691 | 2.18 | −7.81 | −0.17 | 453.1 | 550.9 | 986.5 | −1.37 | −0.76 | 114.4 | 40.3 |
| 44 | Trifluoperazine | 35.0 | 0 | 3 | 4.21 | 3 | 407.5 | −111,907 | −5402 | −911,148 | 3.51 | −8.19 | −0.79 | 534.0 | 599.0 | 1067.0 | −0.91 | −0.19 | 119.7 | 41.8 |
| 45 | Thioridazine | 57.1 | 0 | 2 | 3.94 | 2 | 370.6 | −82,689 | −5253 | −744,945 | 0.86 | −7.78 | −0.41 | 484.9 | 581.1 | 1039.3 | −1.39 | −0.42 | 123.0 | 43.8 |
| 46 | Fluconazole | 71.8 | 1 | 7 | 0.50 | 7 | 306.3 | −89,231 | −3607 | −625,777 | 0.86 | −10.43 | −1.03 | 345.7 | 469.7 | 783.0 | −10.28 | −1.41 | 79.5 | 28.6 |
| 47 | Tolperisone | 20.3 | 0 | 2 | 2.27 | 2 | 245.4 | −62,429 | −4147 | −464,977 | 2.97 | −9.05 | −0.15 | 436.5 | 486.1 | 815.0 | 1.41 | 3.01 | 79.6 | 29.5 |
| 48 | Fenspiride | 45.1 | 1 | 4 | 0.04 | 4 | 260.3 | −69,140 | −4020 | −499,628 | 5.09 | −9.28 | 0.16 | 401.1 | 475.0 | 791.6 | −4.01 | 1.40 | 73.7 | 28.8 |
| 49 | Pizotifen | 31.5 | 0 | 1 | 4.49 | 1 | 295.4 | −67,399 | −4466 | −549,282 | 1.15 | −8.89 | −0.32 | 379.1 | 505.1 | 869.1 | −0.98 | 1.58 | 95.7 | 35.7 |
| 50 | Cyproheptadine | 3.2 | 0 | 1 | 4.86 | 1 | 287.4 | −68,558 | −4726 | −566,080 | 1.04 | −8.73 | −0.36 | 378.9 | 516.5 | 887.5 | −1.13 | 1.77 | 102.8 | 36.0 |
| 51 | Closapine | 30.9 | 1 | 4 | 0.76 | 4 | 326.8 | −78,188 | −4481 | −629,966 | 3.11 | −8.45 | −0.61 | 433.0 | 545.3 | 926.1 | −2.78 | −0.73 | 103.5 | 36.5 |
| 52 | Tiapride | 84.1 | 1 | 6 | −1.48 | 6 | 328.4 | −88,376 | −4474 | −658,862 | 5.32 | −9.27 | −0.73 | 605.9 | 582.1 | 979.5 | −5.66 | −1.56 | 91.2 | 31.4 |
| 53 | Olanzapine | 59.1 | 1 | 4 | 2.68 | 4 | 312.4 | −72,794 | −4389 | −594,188 | 3.31 | −8.21 | −0.72 | 437.2 | 534.2 | 901.5 | −4.10 | 1.66 | 95.3 | 35.9 |
| 54 | Betahistine | 24.9 | 1 | 2 | −2.18 | 2 | 136.2 | −33,605 | −2197 | −176,624 | 2.59 | −9.19 | −0.05 | 328.2 | 351.2 | 521.3 | −4.27 | −0.52 | 46.0 | 16.6 |
| 55 | Dexketoprofen | 54.4 | 1 | 3 | −0.25 | 3 | 254.3 | −69,002 | −3723 | −449,051 | 1.60 | −9.97 | −0.57 | 402.6 | 470.1 | 768.0 | −6.46 | 2.56 | 79.9 | 28.2 |
| 56 | Caffeine | 53.5 | 0 | 6 | −0.13 | 6 | 194.2 | −53,927 | −2508 | −319,054 | 3.78 | −8.90 | −0.49 | 341.4 | 365.3 | 572.9 | −2.21 | −1.06 | 50.0 | 18.9 |
| 57 | Hymecromone | 46.5 | 1 | 3 | 2.36 | 4 | 176.2 | −50,477 | −2397 | −262,408 | 5.98 | −9.21 | −0.91 | 289.5 | 341.9 | 520.9 | −9.80 | −0.56 | 51.5 | 18.2 |
| 58 | Ketotifen | 48.6 | 0 | 2 | 3.28 | 2 | 309.4 | −73,450 | −4448 | −586,056 | 4.06 | −9.09 | −0.97 | 389.1 | 508.1 | 876.7 | −2.17 | 0.26 | 99.6 | 35.8 |
| 59 | Clemastine | 12.5 | 0 | 2 | 3.04 | 2 | 343.9 | −84,433 | −5152 | −711,749 | 1.96 | −8.95 | −0.15 | 501.2 | 584.3 | 1012.5 | −0.80 | 4.66 | 101.4 | 39.6 |
| 60 | Salicylic acid | 57.5 | 2 | 3 | −1.06 | 3 | 138.1 | −41,583 | −1801 | −184,688 | 0.99 | −9.45 | −0.60 | 236.5 | 284.1 | 420.5 | −11.88 | −0.04 | 38.6 | 13.7 |
| 61 | Indomethacin | 69.6 | 1 | 5 | −0.16 | 5 | 357.8 | −95,725 | −4971 | −704,963 | 2.36 | −8.56 | −0.61 | 509.6 | 562.9 | 961.3 | −9.47 | −1.43 | 103.3 | 36.7 |
| 62 | Piroxicam | 108.0 | 2 | 7 | 1.71 | 7 | 331.3 | −88,167 | −3947 | −657,874 | 5.06 | −8.99 | −1.21 | 320.8 | 308.3 | 268.4 | −11.67 | −2.25 | 91.6 | 30.3 |
| 63 | Naproxen | 46.5 | 1 | 3 | 0.47 | 3 | 230.3 | −63,546 | −3396 | −390,177 | 2.42 | −8.67 | −0.53 | 395.2 | 445.4 | 703.3 | −9.53 | 0.56 | 70.6 | 25.3 |
Publisher’s Note: MDPI stays neutral with regard to jurisdictional claims in published maps and institutional affiliations. |
© 2021 by the authors. Licensee MDPI, Basel, Switzerland. This article is an open access article distributed under the terms and conditions of the Creative Commons Attribution (CC BY) license (http://creativecommons.org/licenses/by/4.0/).
Share and Cite
MDPI and ACS Style
Sobańska, A.W.; Robertson, J.; Brzezińska, E. Application of RP-18 TLC Retention Data to the Prediction of the Transdermal Absorption of Drugs. Pharmaceuticals 2021, 14, 147. https://0-doi-org.brum.beds.ac.uk/10.3390/ph14020147
AMA Style
Sobańska AW, Robertson J, Brzezińska E. Application of RP-18 TLC Retention Data to the Prediction of the Transdermal Absorption of Drugs. Pharmaceuticals. 2021; 14(2):147. https://0-doi-org.brum.beds.ac.uk/10.3390/ph14020147
Chicago/Turabian StyleSobańska, Anna W., Jeremy Robertson, and Elżbieta Brzezińska. 2021. "Application of RP-18 TLC Retention Data to the Prediction of the Transdermal Absorption of Drugs" Pharmaceuticals 14, no. 2: 147. https://0-doi-org.brum.beds.ac.uk/10.3390/ph14020147
Note that from the first issue of 2016, this journal uses article numbers instead of page numbers. See further details here.