
Hormetic Responses of Photosystem II in Tomato to Botrytis cinerea
by
 , ,
, ,
Maria-Lavrentia Stamelou
1,2, 
Ilektra Sperdouli
2 ,
,
Ioanna Pyrri
3,
Ioannis-Dimosthenis S. Adamakis
1 and 
Michael Moustakas
4,*
1
Section of Botany, Department of Biology, National and Kapodistrian University of Athens, GR-15784 Athens, Greece
2
Institute of Plant Breeding and Genetic Resources, Hellenic Agricultural Organization–Demeter, Thermi, GR-57001 Thessaloniki, Greece
3
Section of Ecology & Systematics, Department of Biology, National and Kapodistrian University of Athens, GR-15784 Athens, Greece
4
Department of Botany, Aristotle University of Thessaloniki, GR-54124 Thessaloniki, Greece
*
Author to whom correspondence should be addressed.
Plants 2021, 10(3), 521; https://0-doi-org.brum.beds.ac.uk/10.3390/plants10030521
Submission received: 1 February 2021
/
Revised: 2 March 2021
/
Accepted: 7 March 2021
/
Published: 10 March 2021
(This article belongs to the Special Issue Photosynthetic Responses to Biotic and Abiotic Stress)
Abstract
:Botrytis cinerea, a fungal pathogen that causes gray mold, is damaging more than 200 plant species, and especially tomato. Photosystem II (PSII) responses in tomato (Solanum lycopersicum L.) leaves to Botrytis cinerea spore suspension application were evaluated by chlorophyll fluorescence imaging analysis. Hydrogen peroxide (H2O2) that was detected 30 min after Botrytis application with an increasing trend up to 240 min, is possibly convening tolerance against B. cinerea at short-time exposure, but when increasing at relative longer exposure, is becoming a damaging molecule. In accordance, an enhanced photosystem II (PSII) functionality was observed 30 min after application of B. cinerea, with a higher fraction of absorbed light energy to be directed to photochemistry (ΦPSΙΙ). The concomitant increase in the photoprotective mechanism of non-photochemical quenching of photosynthesis (NPQ) resulted in a significant decrease in the dissipated non-regulated energy (ΦNO), indicating a possible decreased singlet oxygen (1O2) formation, thus specifying a modified reactive oxygen species (ROS) homeostasis. Therefore, 30 min after application of Botrytis spore suspension, before any visual symptoms appeared, defense response mechanisms were triggered, with PSII photochemistry to be adjusted by NPQ in a such way that PSII functionality to be enhanced, but being fully inhibited at the application spot and the adjacent area, after longer exposure (240 min). Hence, the response of tomato PSII to B. cinerea, indicates a hormetic temporal response in terms of “stress defense response” and “toxicity”, expanding the features of hormesis to biotic factors also. The enhanced PSII functionality 30 min after Botrytis application can possible be related with the need of an increased sugar production that is associated with a stronger plant defense potential through the induction of defense genes.
1. Introduction
Botrytis cinerea, a fungal pathogen that causes gray mold, is damaging more than 200 plant species, especially tomato, cucumber, strawberry, potato, and ornamental plants [1,2]. B. cinerea releases ethylene to accelerate leaf wither, decreasing photosynthetic efficiency and affecting plant production resulting in huge economic losses [2,3]. This pathogen kills plant tissues previous to feeding on them, and uses a variety of toxic molecules to decompose the host cells [4,5]. Symptoms initial develop on infected tissues as limited lesions that subsequently become necrotic and spread to other tissues [5]. Thus, lesion development induced by the necrotrophic fungus B. cinerea influences growth performance of tomato plants [6]. Sugars produced by plants, although beneficial for the pathogen as nutrient source, are often associated with stronger plant defense potential, through their involvement in the induction of phenylpropanoids and/or defense genes [7]. Infection by B. cinerea induces increased respiration on the infected tissues, leading to a severe drop in the O2 concentration in an otherwise fully aerobic leaf [8].
In plant cellular metabolism, and especially in chloroplasts, reactive oxygen species (ROS) are continuously produced at basal levels that are incapable to cause damage, as they are being scavenged by different antioxidant mechanisms [9,10,11,12]. However, under most biotic or abiotic stresses an increased production of ROS occurs that can lead to oxidative stress if it is not scavenged by enzymatic or non-enzymatic antioxidants [11,12,13,14,15]. However, ROS derived from the chloroplasts also play a role in plant resistance against B. cinerea [15].
ROS, such as superoxide anion radical (O2•−), hydrogen peroxide (H2O2), and singlet oxygen (1O2), produced in chloroplasts play dual roles as they generate oxidative stress and also confer essential biological function as redox signaling in response to biotic and abiotic stress conditions [14,15,16]. The role of chloroplast antioxidants, that often have overlying or interrelating functions, is not to totally eliminate ROS, but rather to achieve a suitable balance between production and removal so that to counterpart photosynthetic function, permitting an effective diffusion of signals to the nucleus and adjusting a plethora of physiological functions [13,16,17]. Leaf image analysis is also used as an objective and accurate alternative method to quantify ROS production at the affected leaf areas, and has proven to be a useful tool in plant science [15].
Photosynthesis is a fundamental process in plant physiology, and its regulation plays a central role in plant defense against biotic and abiotic stresses [18,19]. Photosynthesis studies seem incomplete without some chlorophyll fluorescence data, since minor modifications in plant metabolism make this technique appropriate to provide insight into plant-stress interaction [18,19,20,21,22,23,24]. Chlorophyll fluorescence analysis has been extensively used to uncover perturbations on the photosynthetic efficiency due to nutrient deficiency, drought stress, soil salinity, metal toxicity, wastewater toxicity, pathogenic diseases, etc. [25,26,27,28,29,30,31,32,33]. The development of the method of chlorophyll fluorescence imaging analysis (CF-IA) permits the revealing of the leaf spatiotemporal photosynthetic heterogeneity at the total leaf surface, that is ignored when measuring chlorophyll fluorescence with the classical point measurement techniques [18,20,21,22,23]. CF-IA is a highly effective non-invasive method for the estimation of the inhibition or damage in the PSII electron transfer process, serving as an extremely sensitive indicator of photosynthetic efficiency under both biotic and abiotic stress conditions [24,34,35,36,37,38,39]. The fact that biotic stresses are typically heterogeneous, being spatiotemporal, renders chlorophyll fluorescence imaging apparatuses powerful tools to study the impact of biotic stress on leaf photosynthetic performance [37].
Plants respond to biotic and abiotic stresses by a plethora of mechanisms [13,40]. A low-level of stress or a short exposure duration has been frequently referred to stimulate plant performance [13,20,40,41,42,43,44]. This enhancement can be achieved through a basal level of ROS [9,10,13,16,45], that is being regulated by the photoprotective mechanism of photosynthesis, the non-photochemical quenching (NPQ) [23,43,46]. NPQ under stress conditions decreases electron transport rate (ETR) to avoid ROS formation [35,47]. ROS production that can occur through PSII damage can prevent the repair of PSII reaction centres [35,48]. Dose–response studies are proposing hormesis as a widespread phenomenon usual in nature and independent of the kind of stressor, the physiological process or the organism it occurs [13,40,43,44,49].
In the present work we used CF-IA to quantify the impact of B. cinerea spore suspension application on photosystem II (PSII) in tomato leaves, combined with ROS detection at the inoculated leaf area. We monitored the time-lapsed PSII functionality and try to gain an insight into the mechanisms that play a role in plant defense response to the fungal pathogen.
2. Results
2.1. Visible Symptoms of Botrytis cinerea Spore Application on Tomato
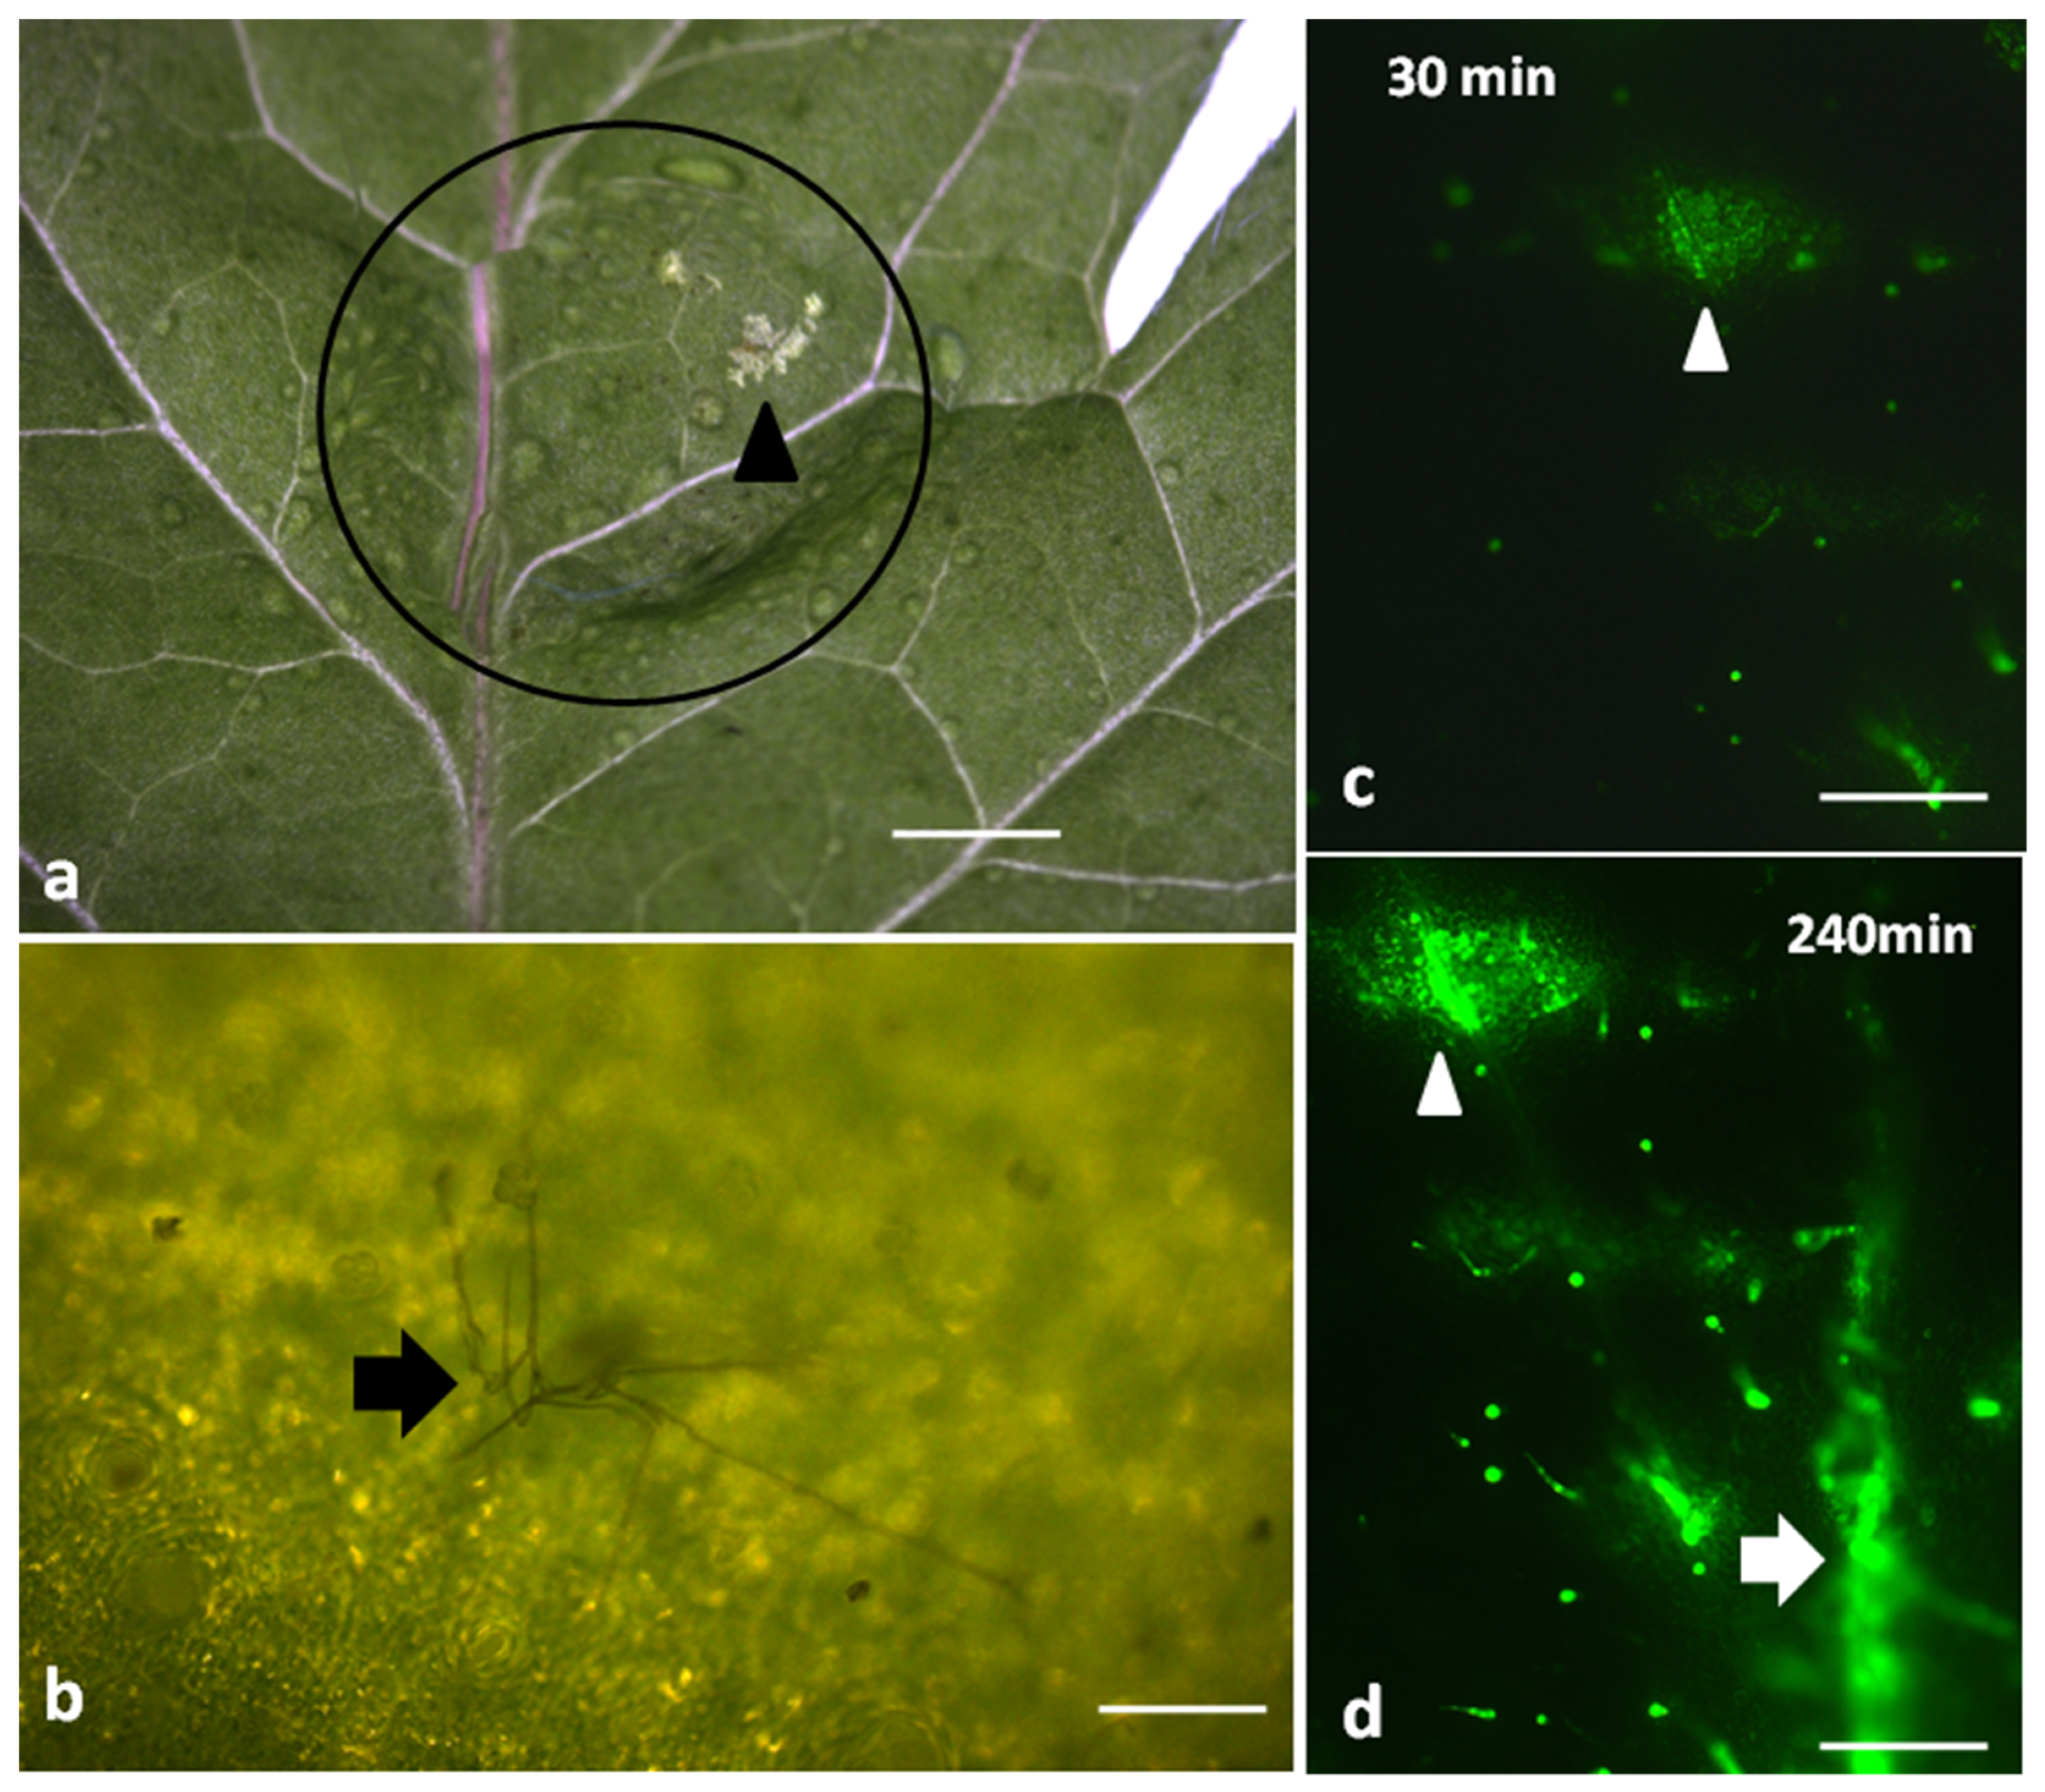
Visual damage on tomato leaflets could be detected only after 24 h of the 20 μL spore suspension application (105–107 spores/mL) (Figure 1a), with the apparent hyphae formation to be also observed (Figure 1b). Leaflet damage appeared as a discoloration of the leaf epidermis (white spot) (arrow in Figure 1a).
2.2. Hydrogen Peroxide Detection after Botrytis cinerea Spore Application
At 30 min after B. cinerea spore suspension application, H2O2 production was detected at the drop’s application area only (arrowhead in Figure 1c), but with time, H2O2 production gradually increased and spread out (Figure 1d). Thus, after 240 min, DCF-DA signal intensified in the application area (arrowhead in Figure 1d) and H2O2 detection expanded to the leaf veins as well (arrow in Figure 1d).
2.3. Allocation of Absorbed Light Energy at PSII before and after Spore Application
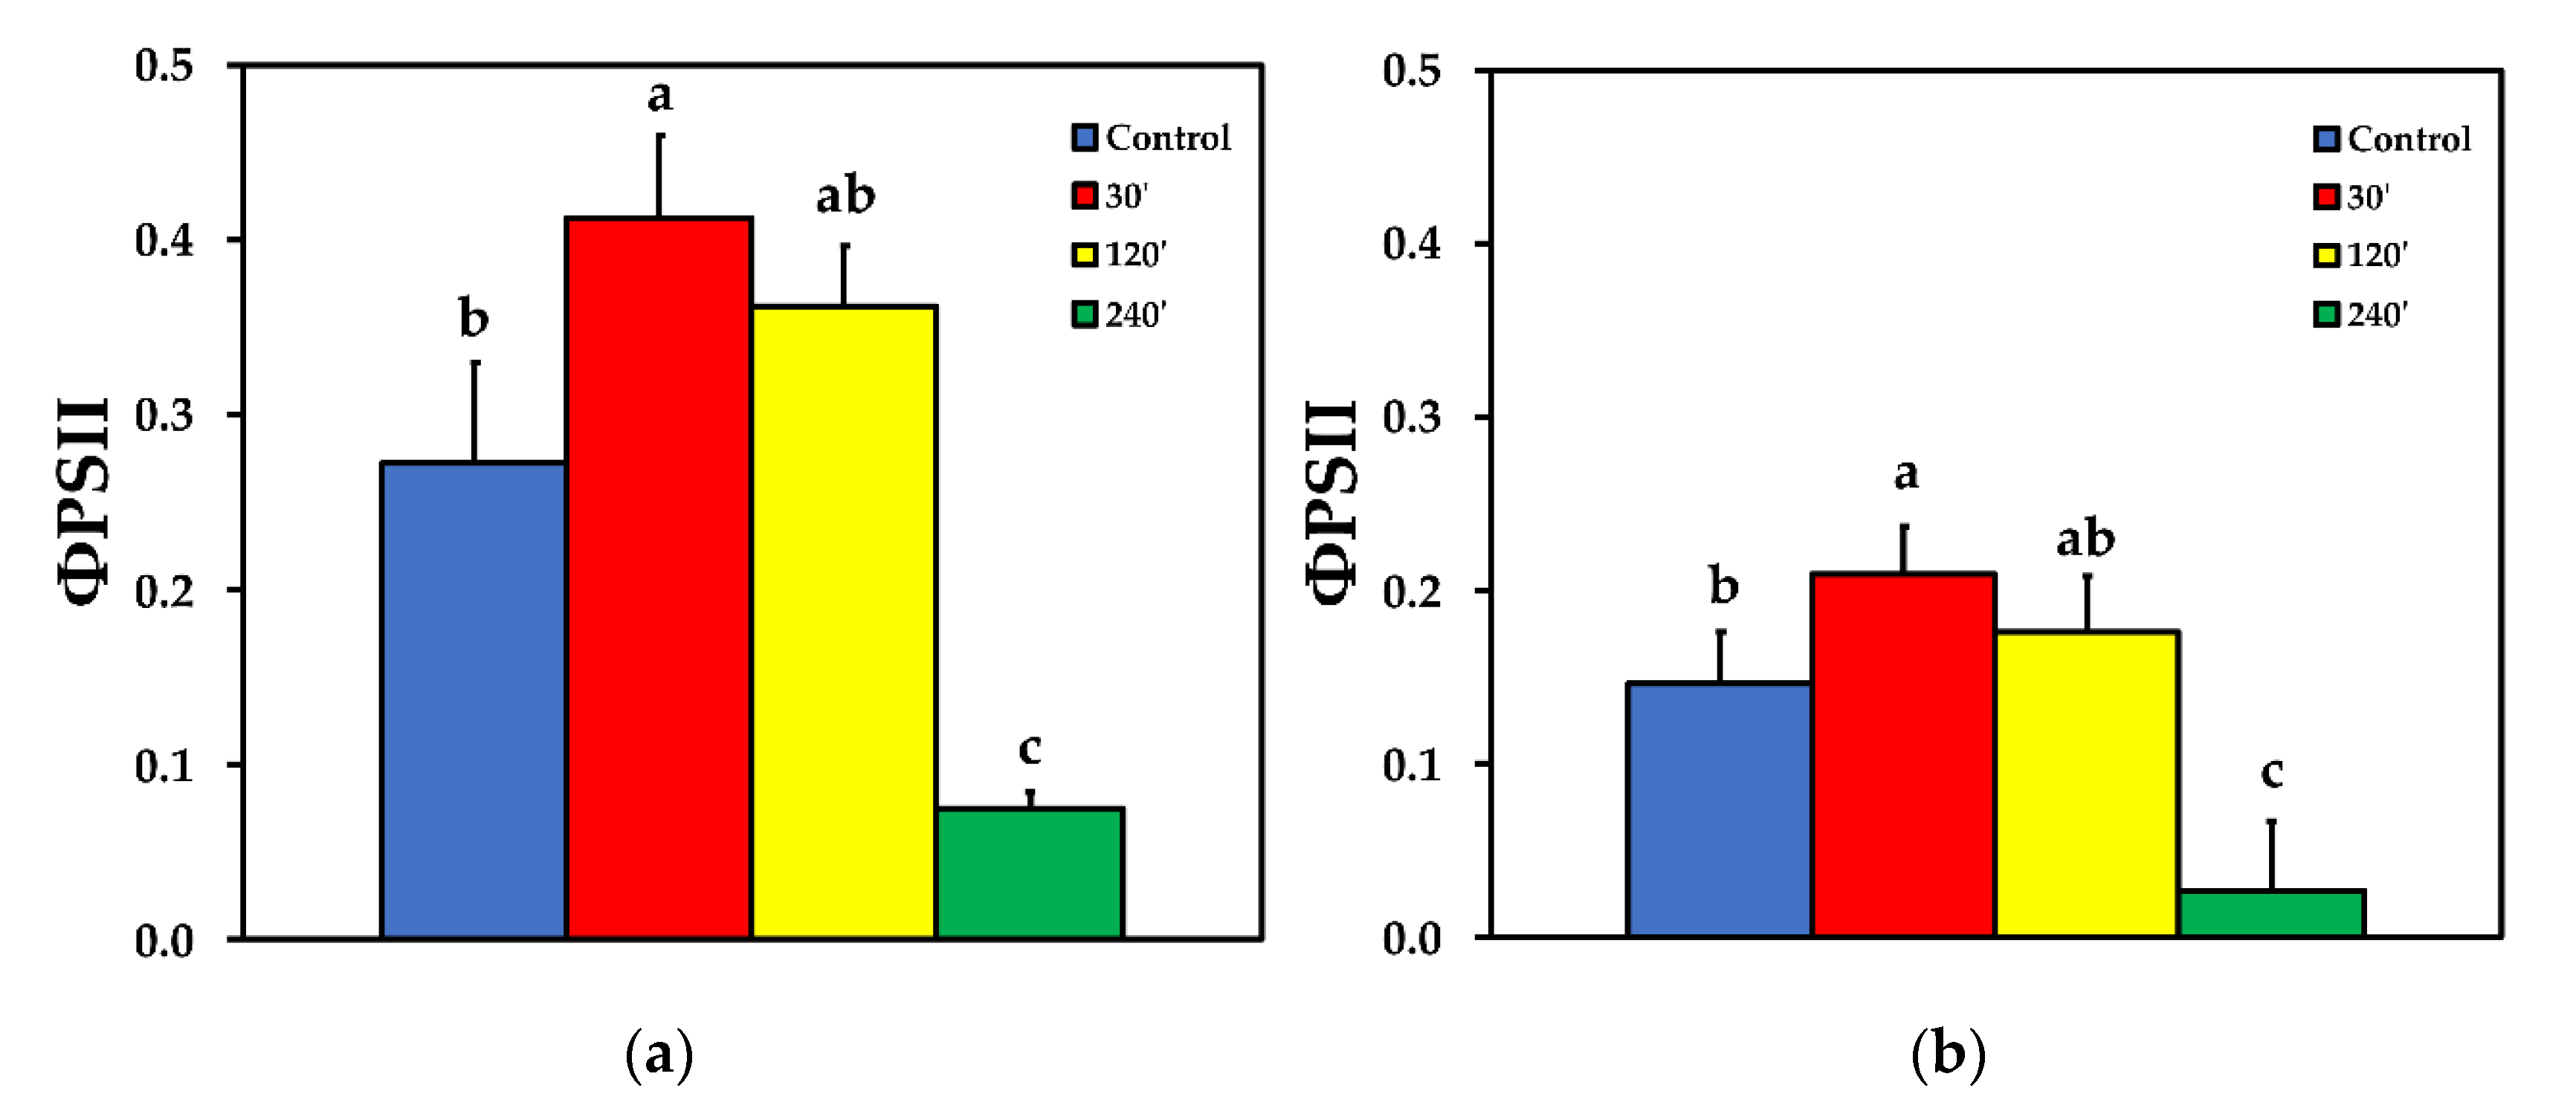
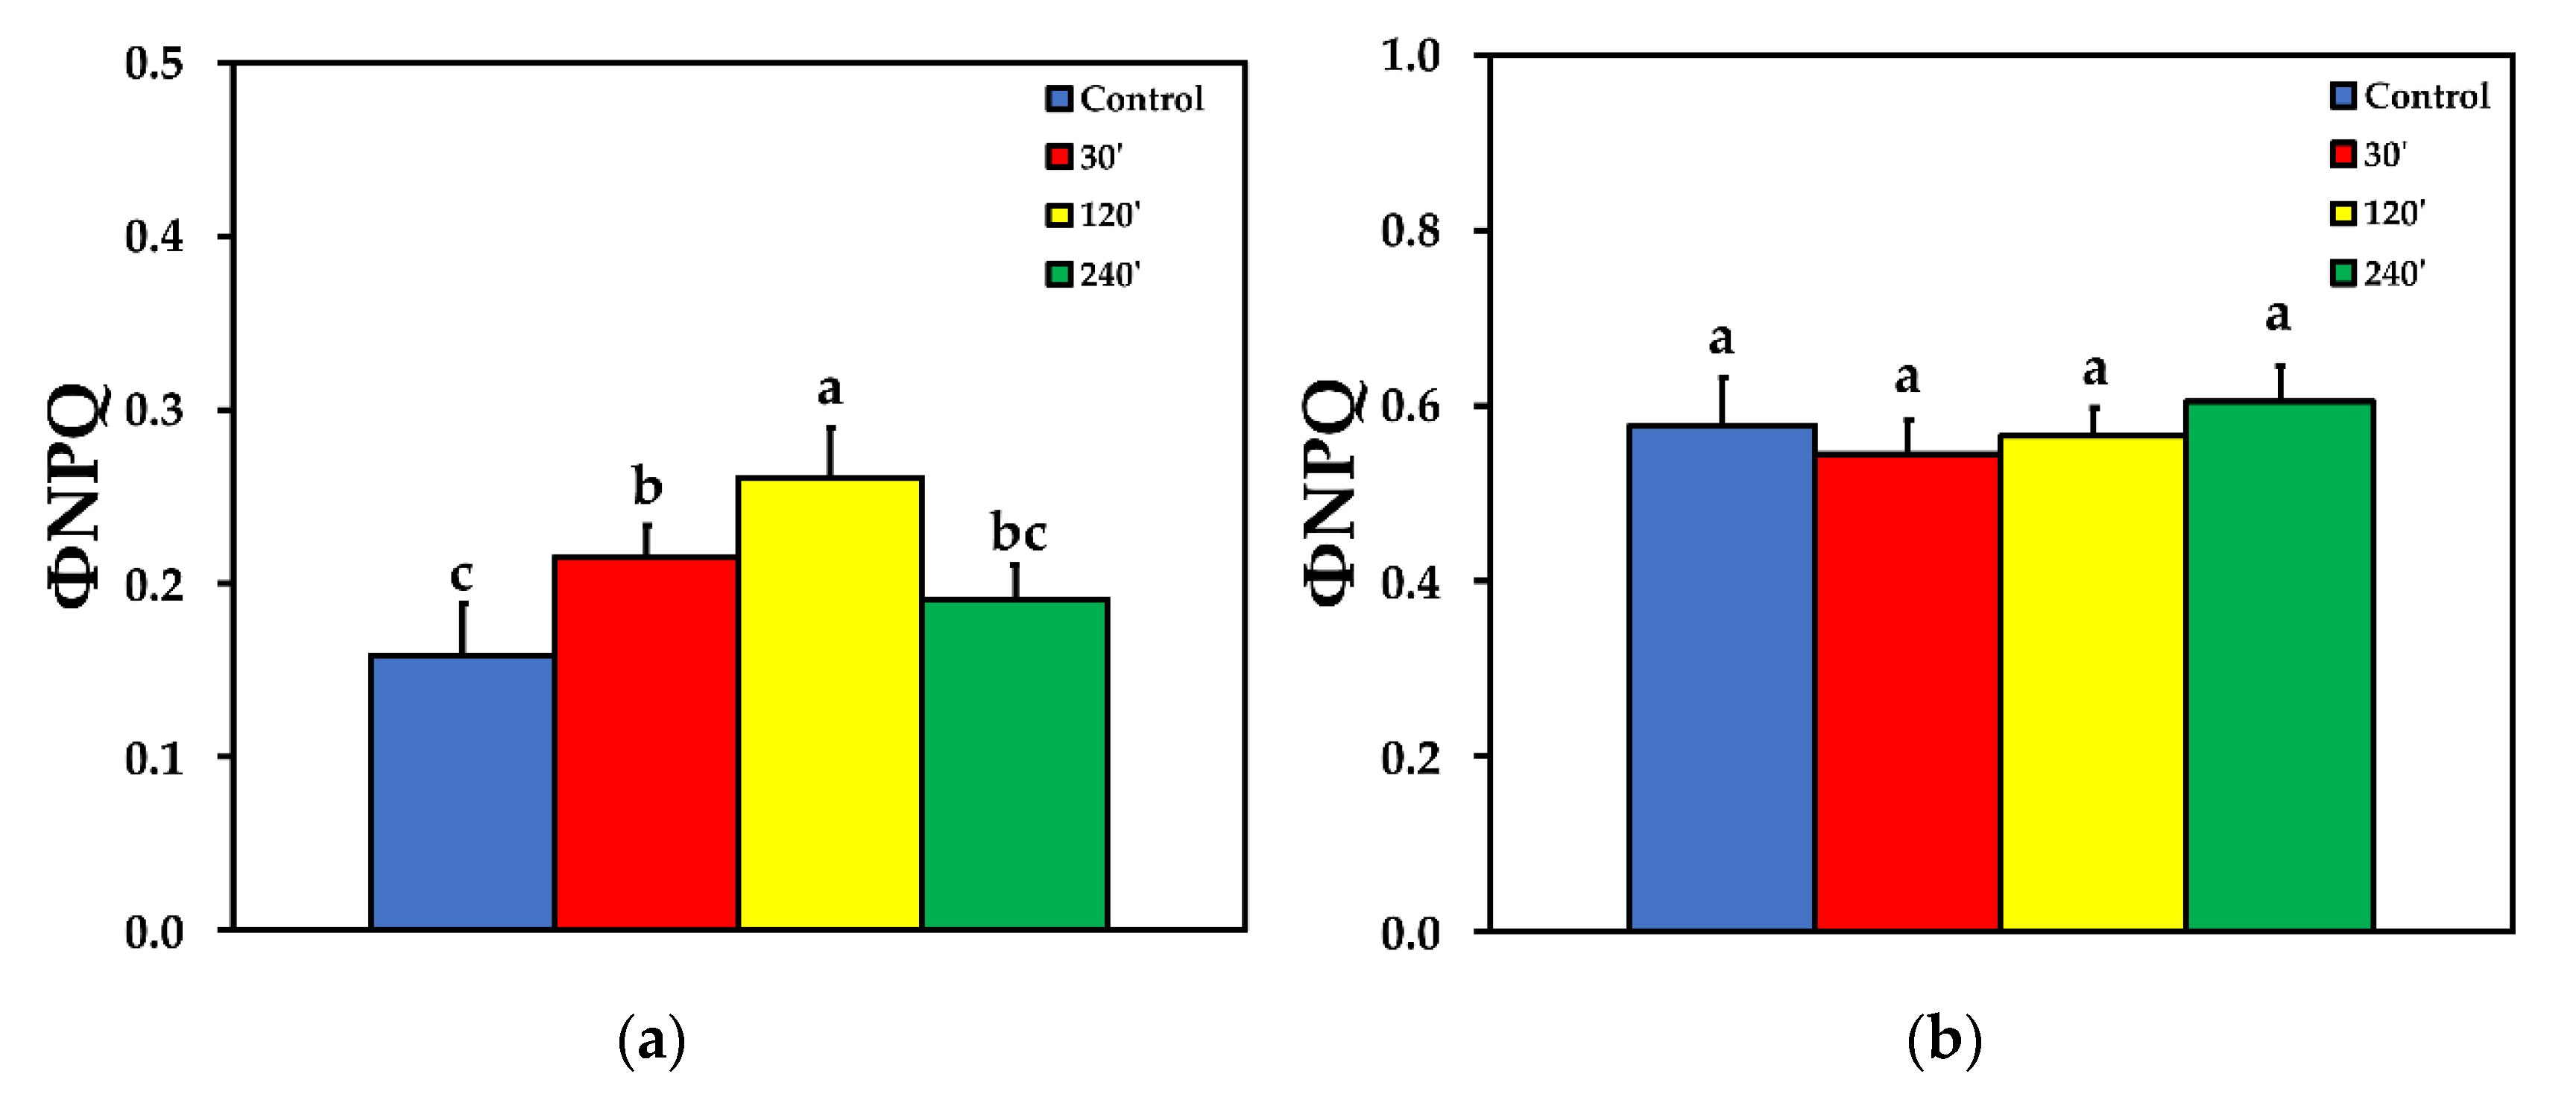
We estimated the fraction of the absorbed light energy that is used for photochemistry (ΦPSΙΙ), is lost by regulated heat dissipation (ΦNPQ), and that of non-regulated energy loss (ΦNO), that add up to unity [35]. The effective quantum yield of PSII photochemistry (ΦPSII) 30 min after spore suspension application increased significantly compared to control, while 120 min after spore suspension application it did not differ compared to control, at both LL and HL treatments. ΦPSII decreased significantly compared to control, 240 min after spore suspension application, at both LL and HL (Figure 2). The quantum yield of regulated non-photochemical energy loss in PSII (ΦNPQ) increased significantly up to 120 min after spore suspension application, but later on decreased to control level at LL (Figure 3a), while at HL treatment there was no significant difference compared to control at all measurements after spore suspension application (Figure 3b).
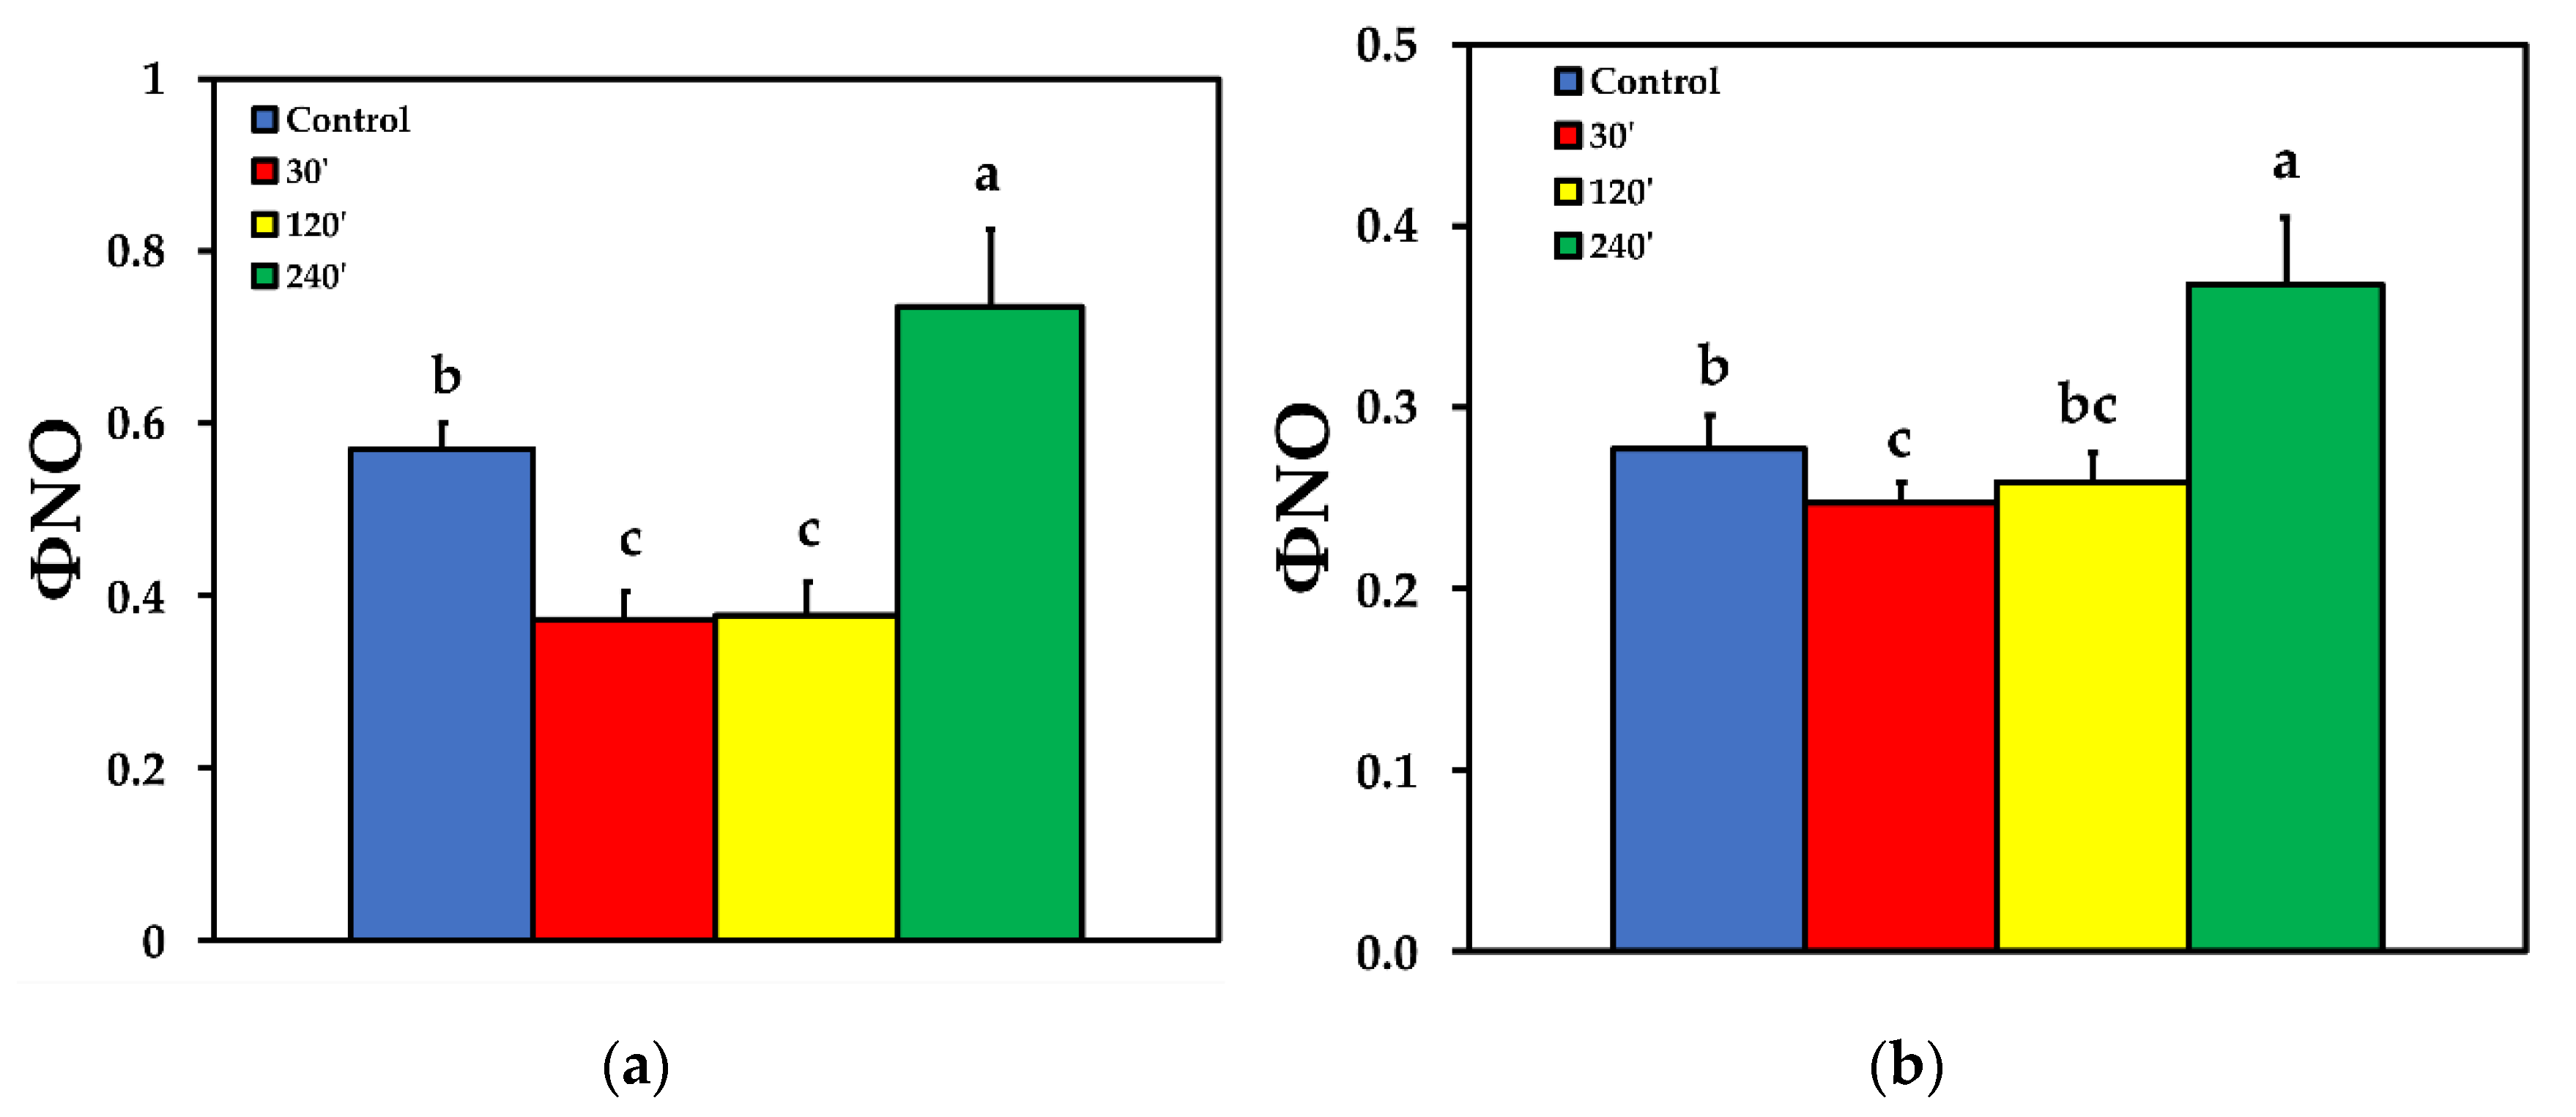
Due to the increase of ΦNPQ at 30 and 120 min after spore suspension application, the quantum yield of non-regulated energy loss in PSII (ΦNO) decreased compared to control, but increased significantly 240 min after spore suspension application at LL (Figure 4a). At HL, the pattern was similar to LL, with the exception that of 120 min after spore suspension application, where ΦNO was at the same level with control plants (Figure 4b).
2.4. Photoprotective Dissipation of Excitation Energy as Heat (NPQ)
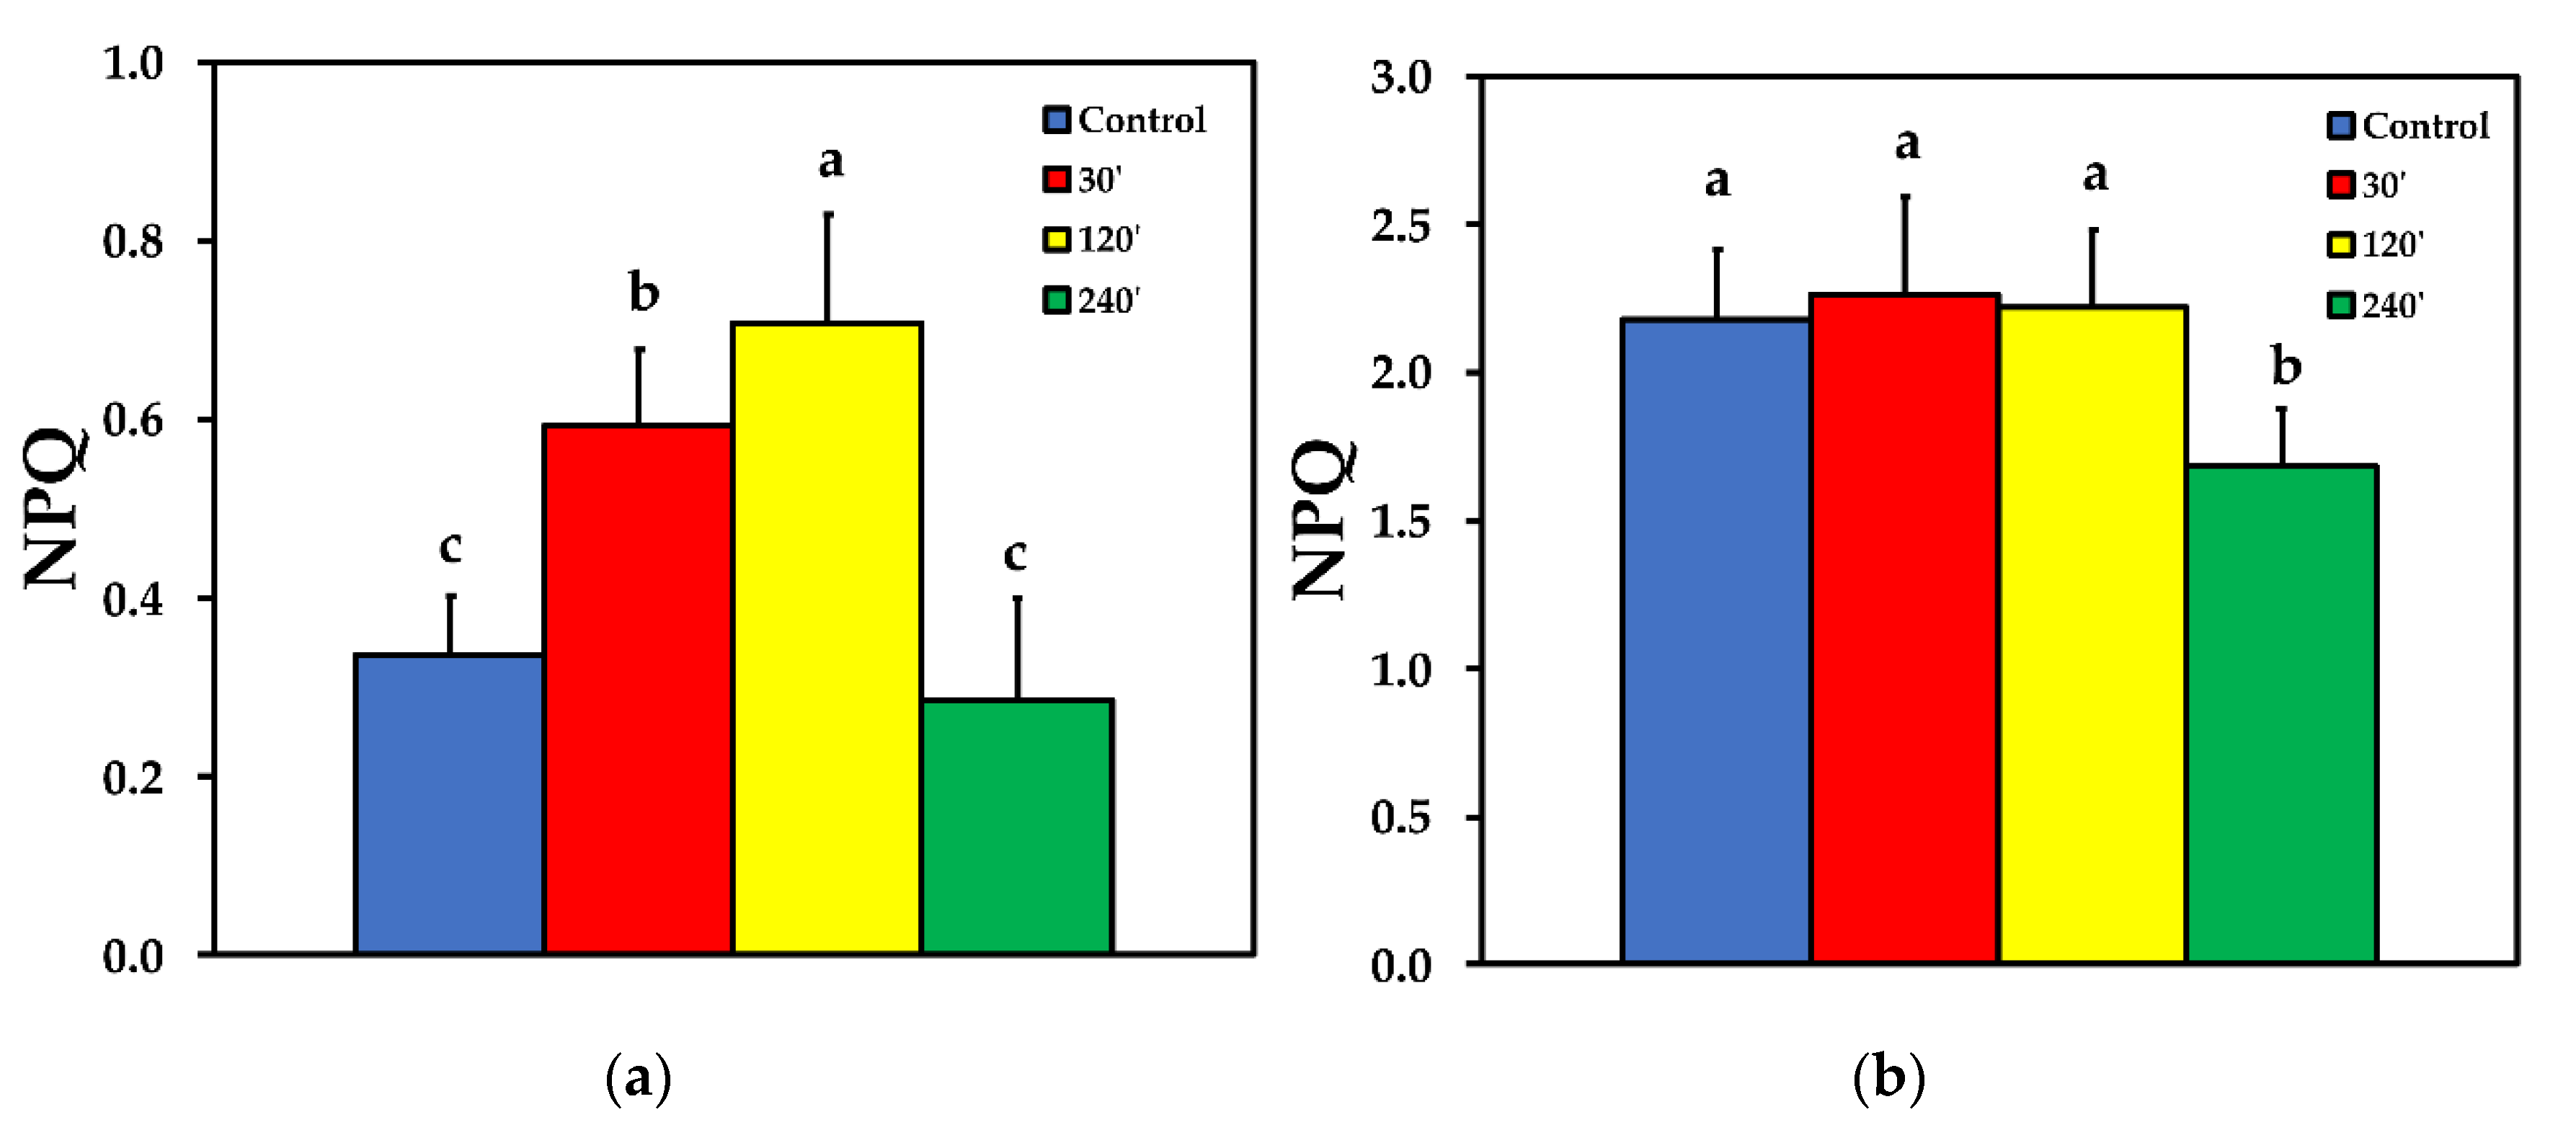
The non-photochemical chlorophyll fluorescence quenching (NPQ) increased significantly up to 120 min after spore application, but later on decreased to control level at LL (Figure 5a). At HL treatment, there was no significant difference compared to control, at 30 and 120 min after spore application, while at 240 min after spore application, NPQ was significantly lower than control (Figure 5b).
2.5. Chlorophyll a Fluorescence Images
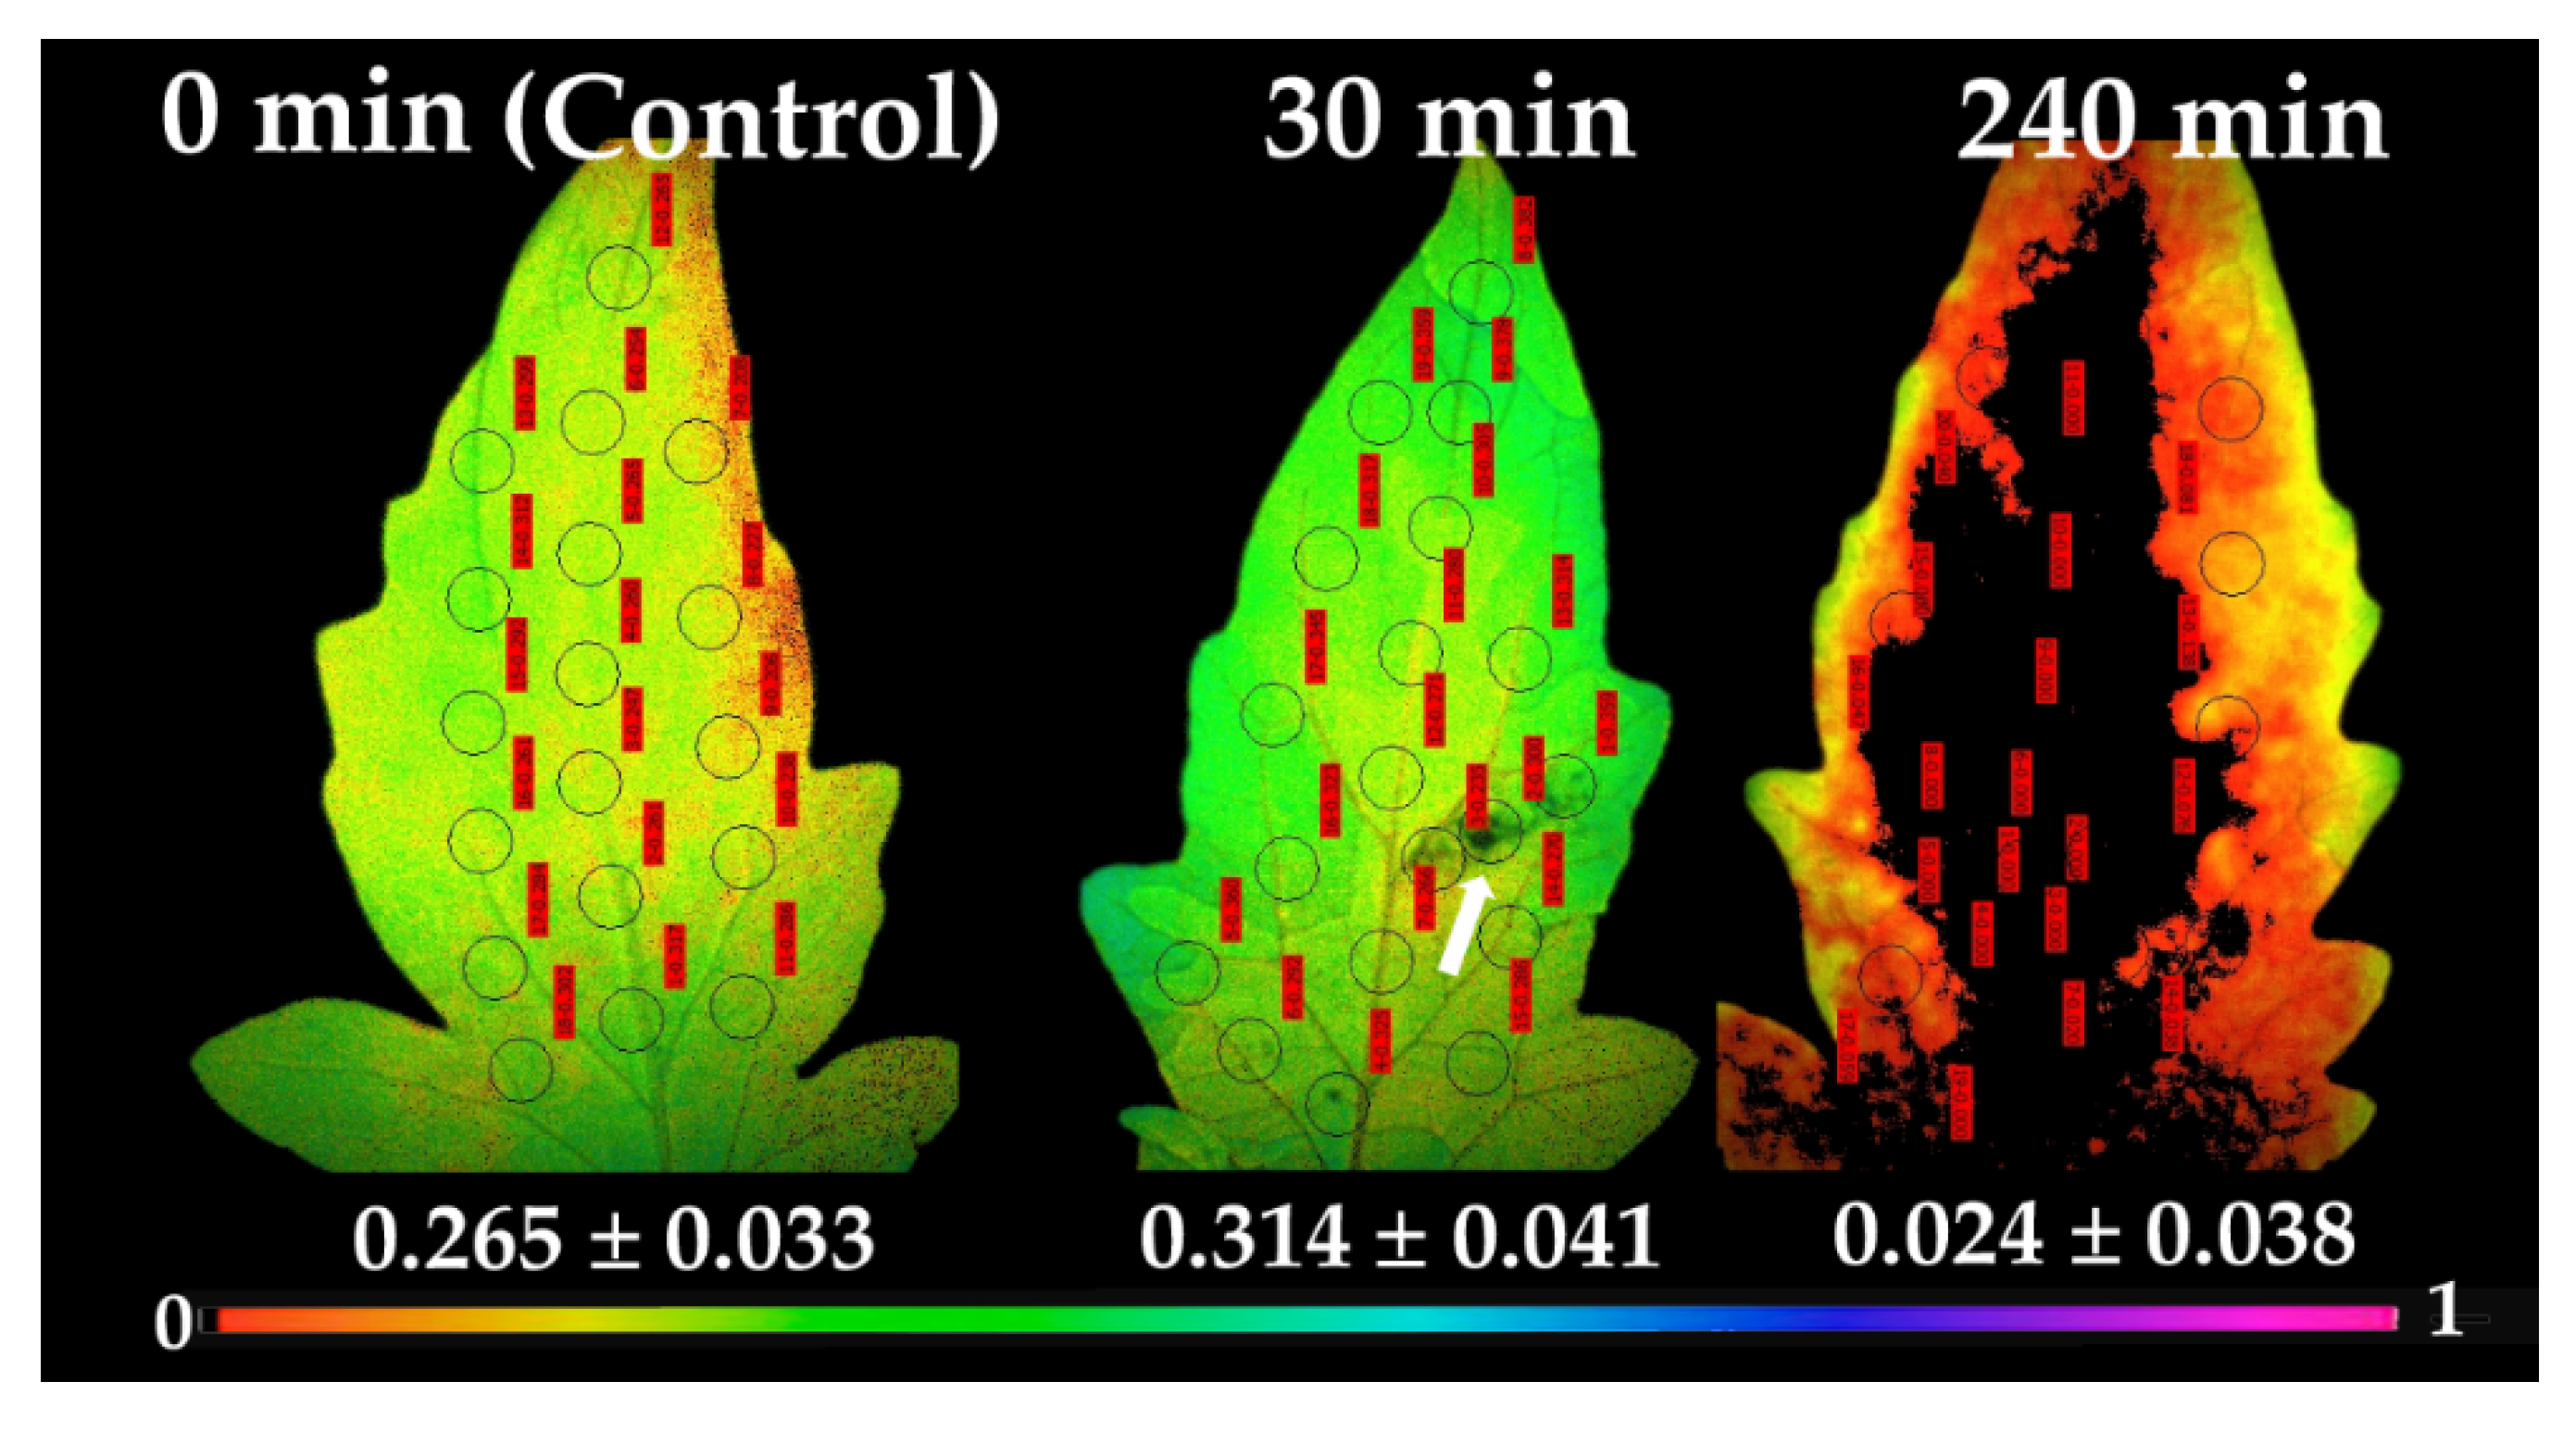
At 30 min after application of B. cinerea suspension, ΦPSII decreased in the direct vicinity of the spore application area, compared to control values (arrow in Figure 6). At the same time at the surrounding area and the rest of the leaflet, an increased ΦPSII was observed, having as a result a higher ΦPSII value at the whole leaflet compared to control. At 240 min after spore application, the effective quantum yield of PSII photochemistry was severely affected at the whole leaflet area, being totally interrupted (ΦPSII = 0) at the application spot and the adjacent area, and on most of the leaflet, with a high photosynthetic heterogeneity to be observed (Figure 6).
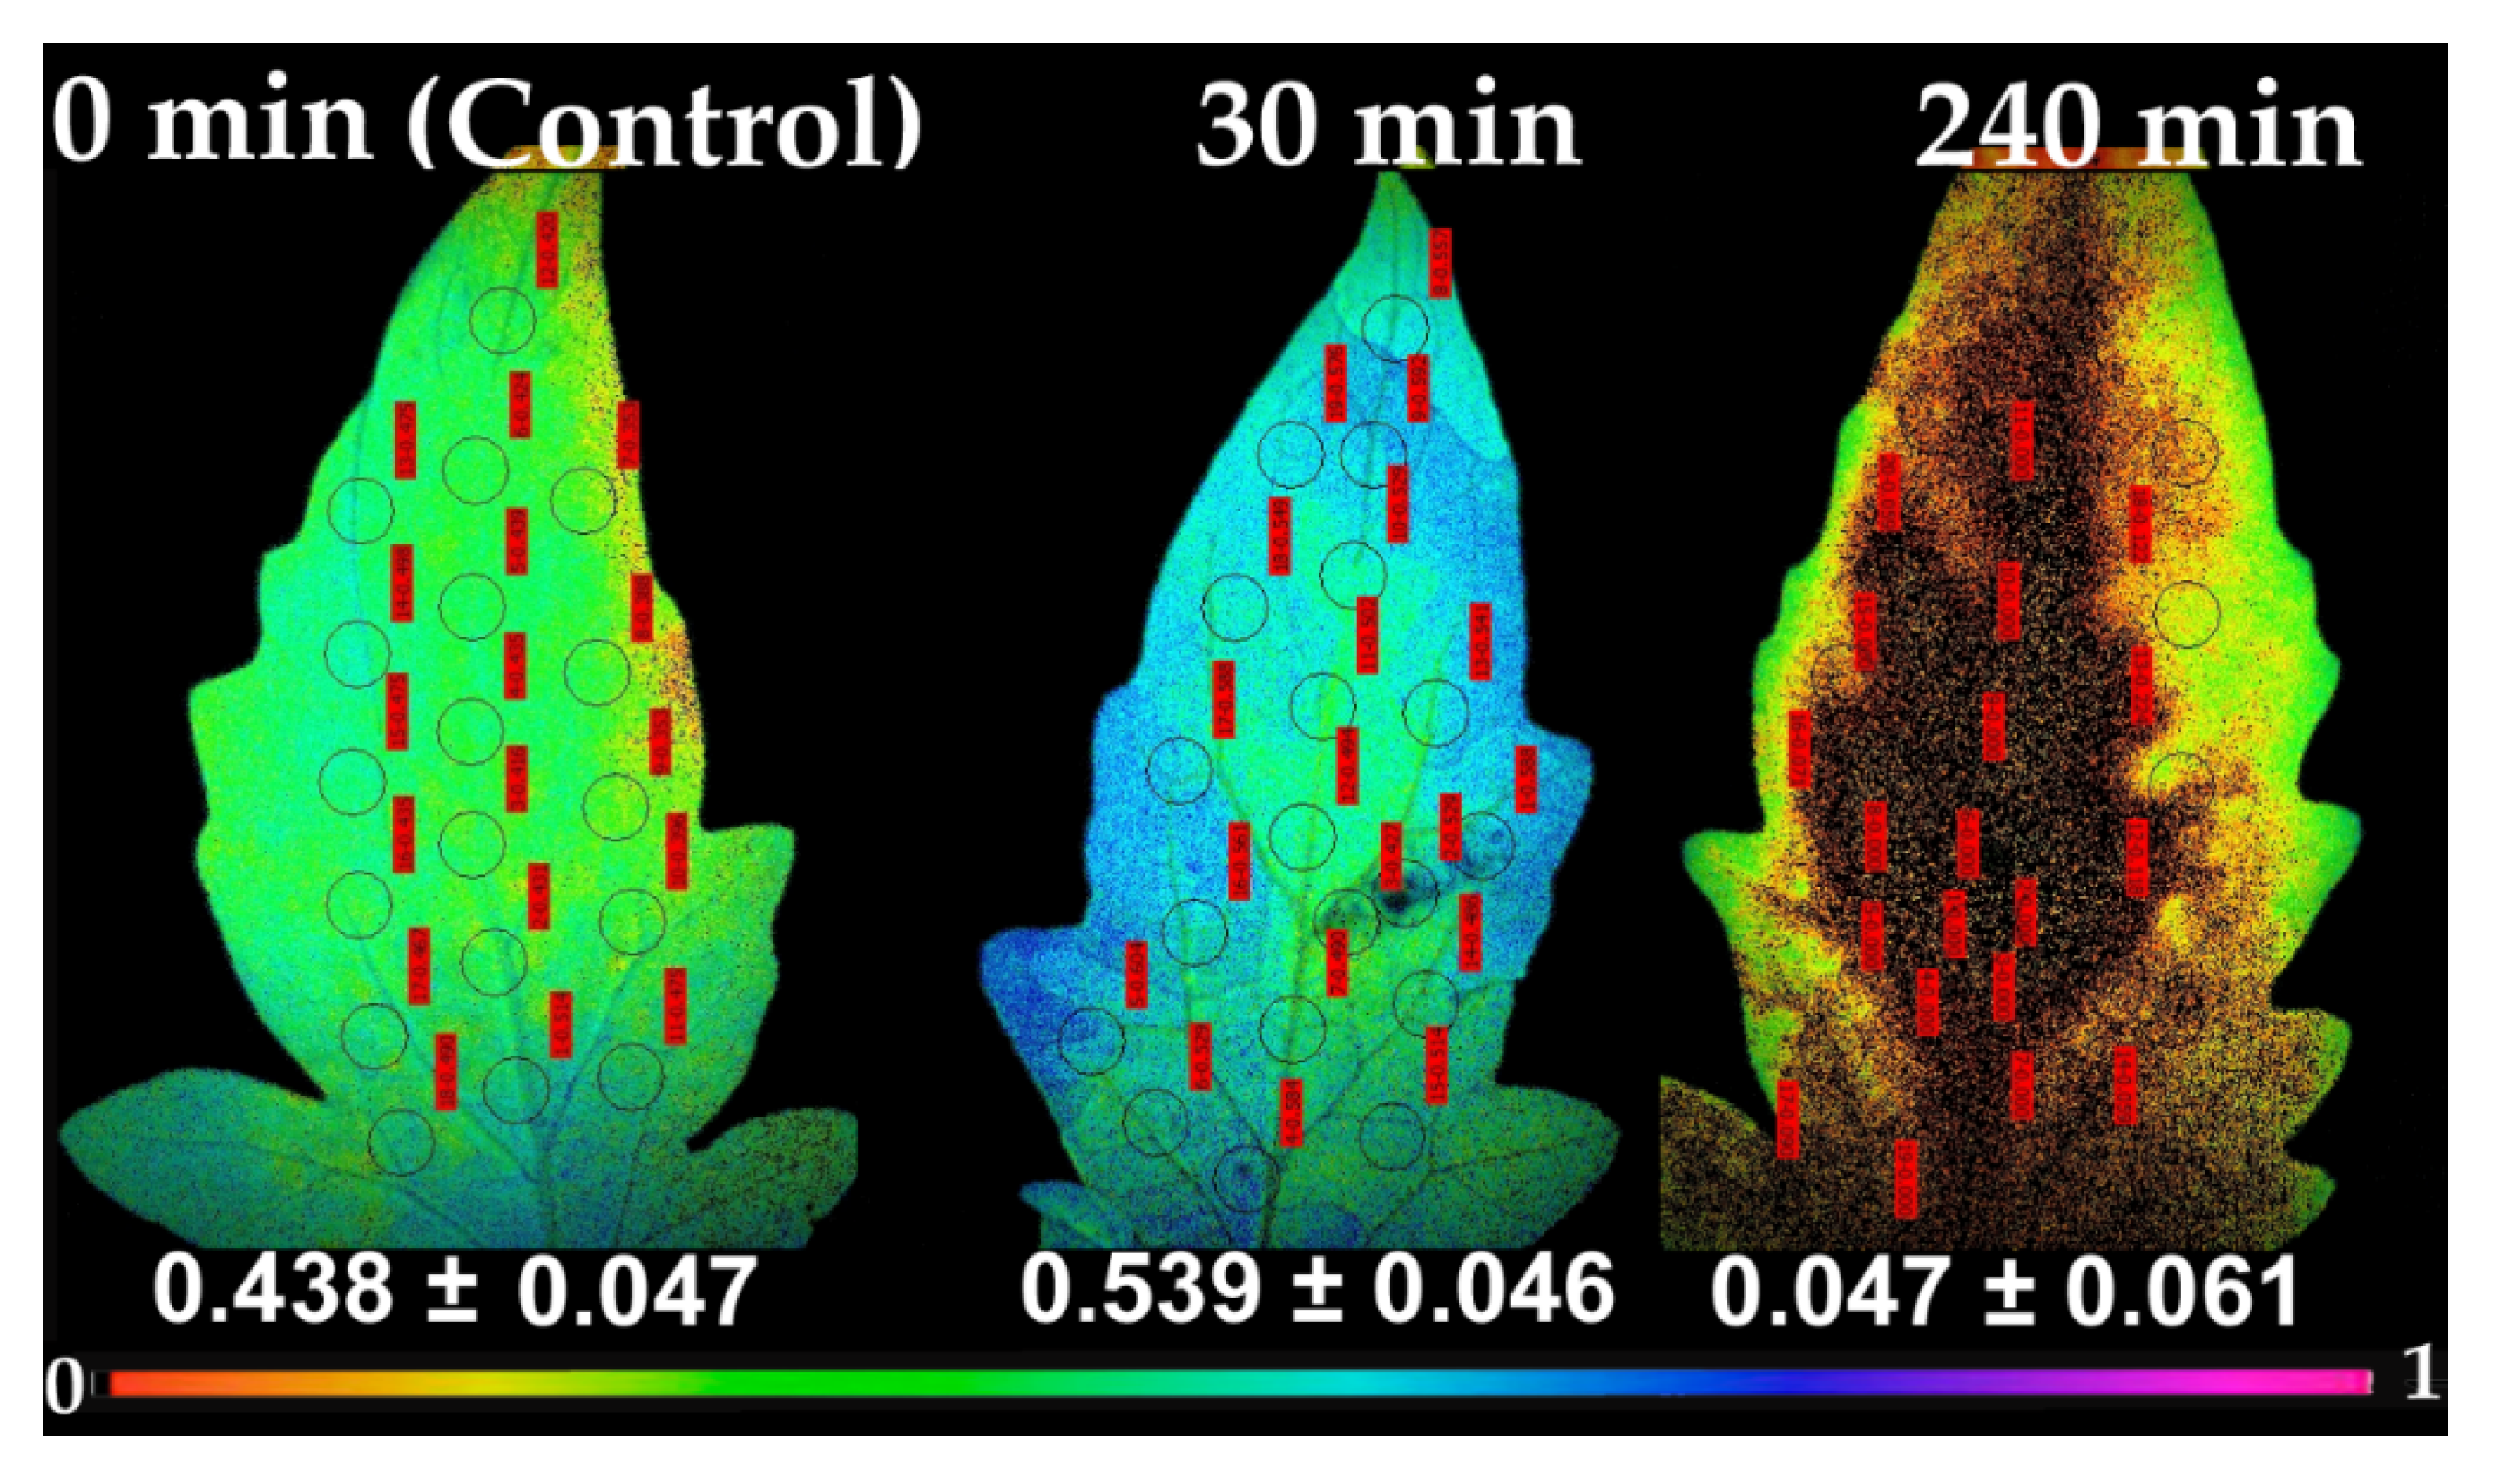
Following the pattern of ΦPSII, the redox state of the plastoquinone pool, that is a measure of the number of open PSII reaction centers (qp), 30 min after spore suspension application increased at the whole leaflet (54% open), compared to control (44% open) (Figure 7). In accordance to ΦPSII pattern, at 240 min after spore application, most reaction centers at the application spot and the adjacent area, were completely closed (qp = 0), and also on most of the leaflet, with only a 5% of reaction centers to remain open at the whole leaflet (Figure 7).
3. Discussion
Plant pathogens are divided into biotrophics, that attack the host cells conserving host viability and gaining nutrients from living cells, and necrotrophics, that get their nutrients by killing the host plant [8]. Botrytis cinerea is a necrotrophic plant pathogen causing gray mold disease on several crop plant species, producing enormous damage in crop production [4]. Thus, there is increasing interest in the mechanism(s) utilized by plants to counteract infection by this fungus [8].
The necrotrophic pathogen B. cinerea is able to induce ROS generation, especially H2O2, in a plethora of plant species [50,51], either directly or indirectly (e.g., via the toxin botrydial) [52]. In our experimental set up, H2O2 was detected 30 min after spore suspension application and gradually increased (Figure 1). The question that arises is on the role of this H2O2 production. One possible explanation proposed from various researchers was that the H2O2 produced could directly fight off the fungi [51]. However, this hypothesis was abandoned since H2O2 production does not affect fungi development, given that B. cinerea poses effective ROS-detoxification systems, while at the same time B. cinerea can even contribute to ROS increase by producing its own ROS [50,51]. The rapid accumulation of H2O2 observed (Figure 1), is a widespread defense mechanism of higher plants against pathogen attack [50].
Non-photochemical chlorophyll fluorescence quenching (NPQ), the key photoprotective process in plants that dissipates excess light energy as heat and protects photosynthesis [11,12,53,54,55,56], increased significantly up to 120 min after spore suspension application, but later on decreased to control level (Figure 5a). Similarly, NPQ increased in ice leaves in the surrounding area of the infection by B. cinerea [24]. After 240 min of B. cinerea spore suspension application, NPQ at HL was significantly lower than the control (Figure 5b). This indicates that when Botrytis application was combined with HL, the photoprotective mechanism was no longer buffering the excess light stress levels, indicating an imbalance between energy supply and demand [57,58,59,60]. This, results in increased 1O2 and H2O2 production [61] as we observed (Figure 1b and Figure 4b) respectively. Non-photochemical quenching is a major component of the systemic acquired acclimation and systemic acquired resistance which is tightly related to ROS [10,56]. Chloroplasts through the operation of photosynthesis play an important role as redox sensors of environmental conditions and elicit acclimatory or stress defense responses [62,63]. Tomato leaflets after B. cinerea spore suspensions application show an increased capacity to keep quinone (QA) oxidized, thus, to have a higher fraction of open PSII reaction centers (qp) compared to controls (Figure 7), indicating an enhanced PSII functionality.
At 30 min after spore suspensions application, a decreased ΦPSII in the direct vicinity of the application spot compared to control values was detected (Figure 6), while at the surrounding area and the rest of the leaflet, an increased ΦPSII was observed, specifying that the biotic stress was signaled to the rest of the leaflet regions, distant from the spore application area, having as a result a higher ΦPSII value at the whole leaflet compared to control. It has been frequently shown that H2O2 diffuses through leaf veins to act as a long-distance molecule, triggering the stress defense response in plants [9,12,14,16,23]. An inhibition of photosynthesis by decreased ΦPSII values in the direct vicinity of the B. cinerea infection sites of tomato leaflets was recorded [64], but, with no alterations in the primary metabolism in the rest of the leaf tissue [64]. Decays in the effective quantum yield of PSII photochemistry (ΦPSII) and increases in NPQ values before any visual symptoms appeared were observed in cashew seedlings inoculated with Lasiodiplodia theobromae [65].
The enhancement of ΦPSII 30 min after B. cinerea spore application (Figure 2) and the concurrent increase of the regulated non-photochemical energy loss in PSII (ΦNPQ) (Figure 3), resulted in a significant decrease in the quantum yield of non-regulated energy loss in PSII (ΦNO) (Figure 4). ΦNO comprises of chlorophyll fluorescence internal conversions and intersystem crossing, that results to 1O2 formation via the triplet state of chlorophyll (3chl*) [53,66,67,68]. Thus, after application of B. cinerea on tomato leaflets, the decreased ΦNO indicates decreased 1O2, that is considered as a highly damaging ROS produced by PSII [14,69,70,71,72]. However, 240 min after B. cinerea application, the increased ΦNO suggests high levels of 1O2 (Figure 4) that could act synergistically with the high H2O2 level (Figure 1d), in chloroplast damage [15,73]. Botrytis cinerea is a necrotrophic fungus that produces constantly toxic compounds which ultimately cause cell death [4]. Then, the fungus feeds on the dead tissue, thus, causing noticeable necrotic lesions [4].
While 1O2 creation via 3chl* decreased 30 min after spore application compared to control (Figure 4a), H2O2 was detected to appear 30 min after spore application (Figure 1c), and gradually to increase (Figure 1d). Hydrogen peroxide levels were positively correlated with disease severity [74], and low hydrogen peroxide levels appear to be the best indicator for leaf resistance to B. cinerea in strawberry leaves [74], while, chloroplast-generated ROS play a major role in B. cinerea –induced leaf damage [73], that eventually results in cell death (necrosis) [4]. As ROS formation by energy transfer (1O2), and electron transport (H2O2) is simultaneous, it seems likely that their signaling pathways occasionally antagonize each other [13]. A low increase in ROS level is considered as favorable for activating defense responses [13,50,75,76], but an excessive ROS level is damaging to PSII functionality [9,13], which seems to be the case in our experimentation.
Botrytis cinerea that has been placed second in rank order of the top 10 fungal plant pathogens [77] can develop microscopic infections in epidermal cells of leaves that remain hidden for a certain period but after sporulation they convert in sources of primary inoculum and spread to other tissues [74].
The enhanced PSII functionality 30 min after Botrytis application can possible be related with the need of an increased sugar production that is associated with a stronger plant defense potential through the induction of defense genes [7]. However, increased levels of soluble sugars have been shown to support B. cinerea growth in tomato leaves [6]. In Rosa chinensis leaves, exogenous jasmonate (JA) spraying was shown to be essential for inducing defense response against B. cinerea [5]. Plant defenses can be activated by ROS [50], or by elicitor molecules such as chitosan [78], and γ-aminobutyric acid (GABA) [79], that are able to induce resistance mechanisms against B. cinerea.
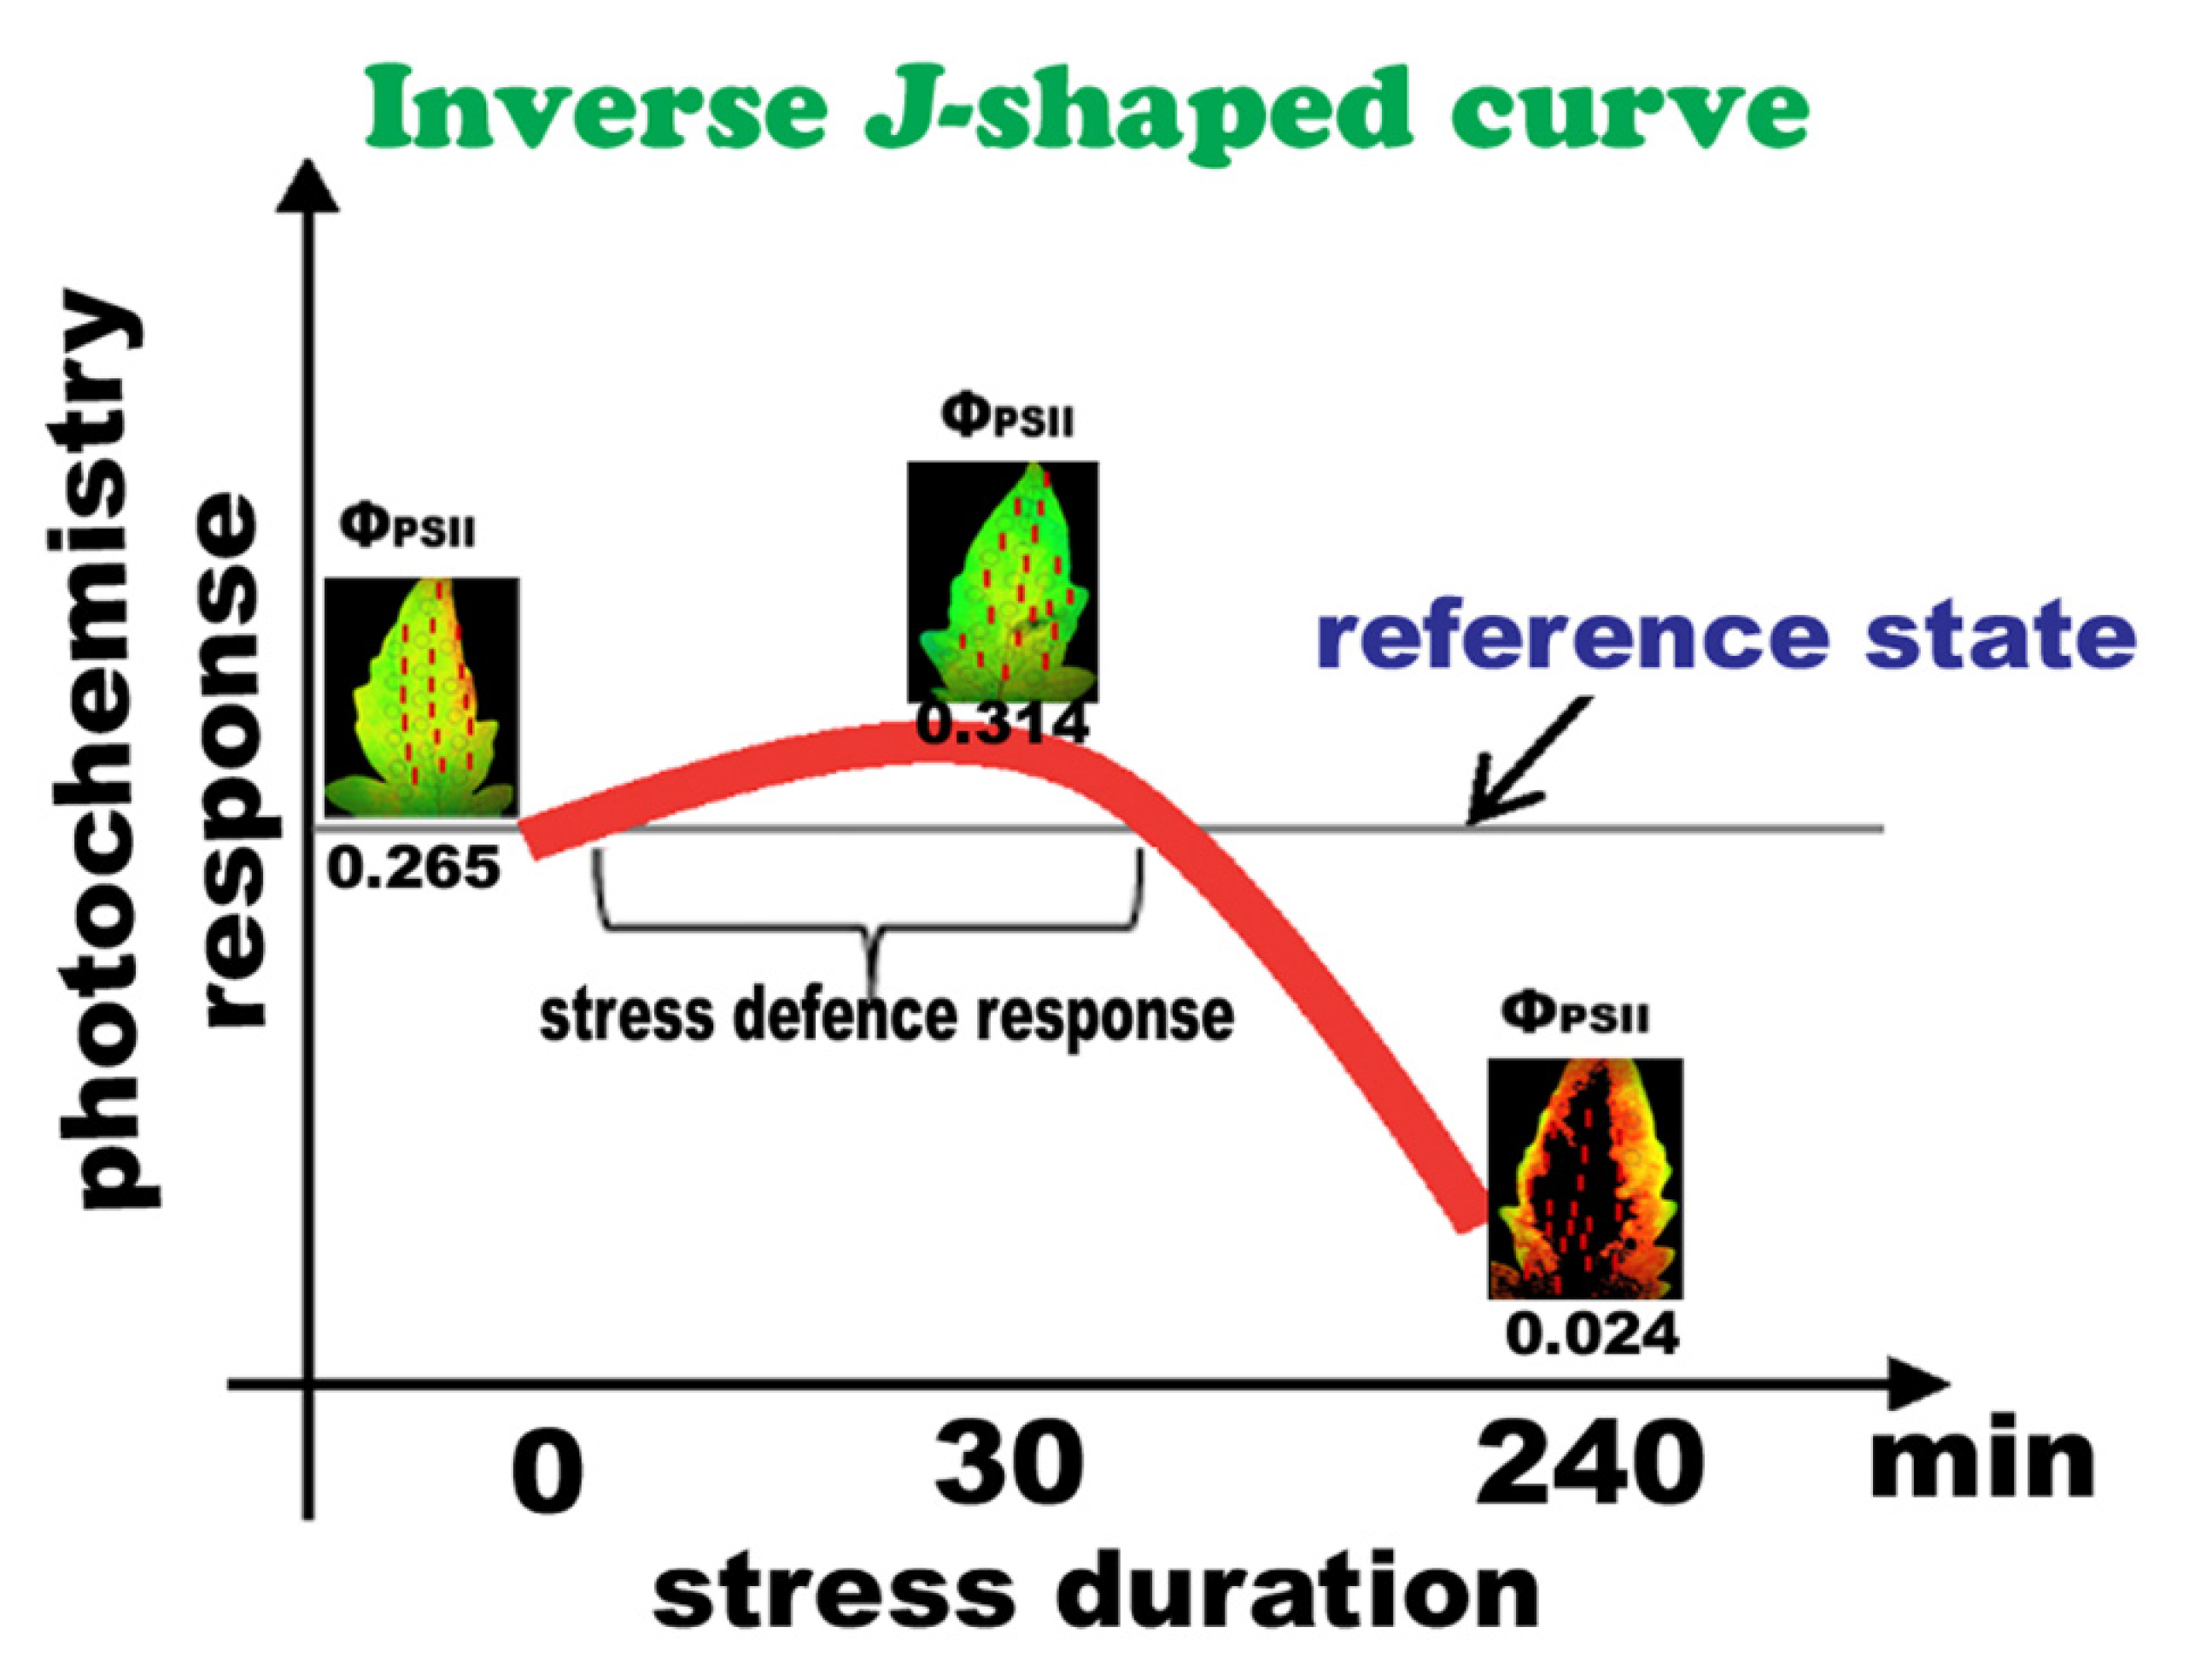
Photosystem II responses of tomato leaflets to B. cinerea inoculation can be described as a time-dependent hormetic response (Figure 8) in terms of “stress defense response” and “toxicity” [76,80]. Activation by a low-dose effect or short-time exposure is a common phenomenon that is associated with the term “hormesis”, typically indicating a positive biological response [13,44,55,81,82,83,84,85,86]. There are published studies reporting a time-dependent hormesis [55,82], but it is only recently that analysis has been made regarding the features of hormesis as a function of time [13,81,82], and according to our data, under biotic stress.
4. Materials and Methods
4.1. Plant Material and Growth Conditions
Tomato (Solanum lycopersicum L.) plants (20 cm in height) were obtained from the market and transported to a growth chamber with 20 ± 1/18 ± 1 °C day/night temperature, 10-h photoperiod with photosynthetic photon flux density (PPFD) 220 ± 20 μmol quanta m−2 s−1 and relative humidity 50 ± 5/60 ± 5% day/night.
4.2. Pathogen Culture and Spore Suspension Application
Botrytis cinerea ATHUM 4850 obtained from the ATHUM Culture Collection of Fungi of the National and Kapodistrian University of Athens Mycetotheca was used for tomato leaf spore application and was cultured on a solid nutrient medium (Potato Dextrose Agar, PDA, BD Difco, Oxford, UK) containing 0.5 mL L−1 lactic acid 1N at 23 °C until sporulation. Sporulated cultures were transferred in 100 mL sterilized distilled water and gently vortexed for spore release.
Tomato 5th leaflets were detached and laid on Petri dishes containing two sterilized blotting filter papers (Whatman, Schleicher and Schuell, Ottawa, Canada), wetted with sterile water. A drop (20 μL) of B. cinerea aqueous spore suspension (105–107 spores/mL) was applied on tomato leaflets with a micropipette [87] as shown on Figure 1a, while leaves treated with a drop (20 μL) of sterile water (without B. cinera spores) were considered as controls.
4.3. Hydrogen Peroxide Imaging Detection
H2O2 imaging detection, in control, and at 30, 120, and 240 min after spore suspension application, was performed as described earlier [12]. Briefly, inoculated and non-inoculated tomato leaflets were incubated with 25 μM 2′, 7′-dichlorofluorescein diacetate (DCF-DA, Sigma-Aldrich, Chemie GmbH, Schnelldorf, Germany) for 30 min in the dark, to visualize H2O2 production.many
Inoculated and control tomato leaflets were observed under a Zeiss Axioplan epifluoresence microscope equipped with an AxioCam MRc 5 digital camera. Photographs were obtained with the ZEN 2 version software according to the manufacturer’s instructions.
4.4. Chlorophyll Fluorescence Imaging Analysis
An Imaging PAM M-Series system (Heinz Walz Instruments, Effeltrich, Germany) was used for the chlorophyll fluorescence measurements of the dark adapted (15 min) control and infected tomato leaflets as described in detail previously [39]. Measurements were conducted in leaves treated with a drop (20 μL) of sterile water (without B. cinera spores, control, 0 min) and after 30, 120 and 240 min of B. cinerea aquatic spore suspension application. The light intensities that were used for the photosynthetic efficiency measurements were 230 μmol photons m−2 s−1, a low light (LL) intensity similar to the growth light, a moderate light (ML) intensity at 640 μmol photons m−2 s−1, and a high light (HL) one, at 900 μmol photons m−2 s−1. Representative areas of interest (AOIs) were selected in each leaflet so as to cover the whole leaflet area. The chlorophyll fluorescence parameters that were measured together with their definitions are shown in Table 1. Color-coded images of the effective quantum yield of PSII photochemistry (ΦPSΙΙ) and the redox state of the plastoquinone pool (qp), obtained at ML intensity at 640 μmol photons m−2 s−1, are also presented.
4.5. Statistics
Statistically significant differences among the means were determined, from three independent treatments with each treatment consisting of three leaflets from three different tomato plants, using two-way ANOVA. Means (± SD) were considered statistically different at a level of p < 0.05.
5. Conclusions
In the present study, 30 min after application of Botrytis spore suspension in tomato leaflets, before any visual symptoms appeared, defense response mechanisms were triggered, with light energy use to be adjusted by NPQ in a such way that PSII functionality to be enhanced. The underlying mechanism involved was possible activated by H2O2, that was detected 30 min after Botrytis application with an increasing trend up to 240 min. This, is possibly convening tolerance against B. cinerea at short-time exposure, but at relatively longer exposure time when H2O2 is increasing, it is becoming a damaging molecule. Hence, the response of tomato PSII to B. cinerea, indicates a hormetic temporal response, in terms of “stress defense response” and “toxicity”, expanding the features of hormesis to biotic factors also.
Author Contributions
Conceptualization, I.-D.S.A. and M.M.; methodology, M.-L.S., I.S., I.P. and I.-D.S.A.; software, M.-L.S., I.S., I.P. and M.M.; validation, I.P., I.-D.S.A. and M.M.; formal analysis, I.-D.S.A., I.S., I.P. and M.M.; investigation, M.-L.S., I.S., I.P. and I.-D.S.A.; resources, I.S., I.P., I.-D.S.A. and M.M.; data curation, M.-L.S., I.S., I.P., I.-D.S.A. and M.M.; writing—original draft preparation, I.-D.S.A. and M.M.; writing—review and editing, I.S., I.P., I.-D.S.A. and M.M.; visualization, I.-D.S.A. and M.M.; supervision, I.S., I.-D.S.A. and M.M.; project administration, I.S., I.-D.S.A. and M.M.; funding acquisition, I.S., I.P., I.-D.S.A. and M.M.; All authors have read and agreed to the published version of the manuscript.
Funding
M.-L.S. was partly supported by the internship program of the National and Kapodistrian University of Athens, mis code 5032778, operational program “Competitiveness-Entrepreneurship & Innovation 2014–2020”, ESPA partnership agreements 2014–2020.
Institutional Review Board Statement
Not applicable.
Informed Consent Statement
Not applicable.
Data Availability Statement
No new data were created or analyzed in this study. Data sharing is not applicable to this article.
Conflicts of Interest
The authors declare no conflict of interest.
References
- Yu, W.; Zhao, R.; Sheng, J.; Shen, L. SlERF2 is associated with methyl jasmonate-mediated defense response against Botrytis cinerea in tomato fruit. J. Agric. Food Chem. 2018, 66, 9923–9932. [Google Scholar] [CrossRef]
- Hou, R.; Shi, J.; Ma, X.; Wei, H.; Hu, J.; Tsang, Y.F.; Gao, M.T. Effect of phenolic acids derived from rice straw on Botrytis cinerea and infection on tomato. Waste Biomass Valor. 2020, 11, 6555–6563. [Google Scholar] [CrossRef]
- Cristescu, S.M.; De Martinis, D.; Hekkert, S.L.; Parker, D.H.; Harren, F.J.M. Ethylene production by Botrytis cinerea in vitro and in tomatoes. Appl. Environ. Microbiol. 2002, 68, 5342–5350. [Google Scholar] [CrossRef] [Green Version]
- Williamson, B.; Tudzynski, B.; Tudzynski, P.; van Kan, J.A. Botrytis cinerea: The cause of grey mould disease. Mol. Plant Pathol. 2007, 8, 561–580. [Google Scholar] [CrossRef]
- Ren, H.; Bai, M.; Sun, J.; Liu, J.; Ren, M.; Dong, Y.; Wang, N.; Ning, G.; Wang, C. RcMYB84 and RcMYB123 mediate jasmonate-induced defense responses against Botrytis cinerea in rose (Rosa chinensis). Plant J. 2020, 103, 1839–1849. [Google Scholar] [CrossRef]
- Courbier, S.; Grevink, S.; Sluijs, E.; Bonhomme, P.O.; Kajala, K.; Van Wees, S.C.M.; Pierik, R. Far-red light promotes Botrytis cinerea disease development in tomato leaves via jasmonate-dependent modulation of soluble sugars. Plant Cell Environ. 2020, 43, 2769–2781. [Google Scholar] [CrossRef]
- Moghaddam, M.R.B.; Van Den Ende, W. Sugars and plant innate immunity. J. Exp. Bot. 2012, 63, 3989–3998. [Google Scholar] [CrossRef] [Green Version]
- Valeri, M.C.; Novi, G.; Weits, D.A.; Mensuali, A.; Perata, P.; Loreti, E. Botrytis cinerea induces local hypoxia in Arabidopsis leaves. New Phytol. 2021, 229, 173–185. [Google Scholar] [CrossRef] [Green Version]
- Mittler, R. ROS are good. Trends Plant Sci. 2017, 22, 11–19. [Google Scholar] [CrossRef] [Green Version]
- Czarnocka, W.; Karpiński, S. Friend or foe? Reactive oxygen species production, scavenging and signaling in plant response to environmental stresses. Free. Radic. Biol. Med. 2018, 122, 4–20. [Google Scholar] [CrossRef]
- Moustaka, J.; Moustakas, M. Photoprotective mechanism of the non-target organism Arabidopsis thaliana to paraquat exposure. Pest. Biochem. Physiol. 2014, 111, 1–6. [Google Scholar] [CrossRef]
- Moustaka, J.; Tanou, G.; Adamakis, I.D.; Eleftheriou, E.P.; Moustakas, M. Leaf age dependent photoprotective and antioxidative mechanisms to paraquat-induced oxidative stress in Arabidopsis thaliana. Int. J. Mol. Sci. 2015, 16, 13989–14006. [Google Scholar] [CrossRef] [Green Version]
- Adamakis, I.-D.S.; Sperdouli, I.; Hanć, A.; Dobrikova, A.; Apostolova, E.; Moustakas, M. Rapid hormetic responses of photosystem II photochemistry of clary sage to cadmium exposure. Int. J. Mol. Sci. 2021, 22, 41. [Google Scholar] [CrossRef]
- Moustaka, J.; Tanou, G.; Giannakoula, A.; Adamakis, I.D.S.; Panteris, E.; Eleftheriou, E.P.; Moustakas, M. Anthocyanin accumulation in poinsettia leaves and its functional role in photo-oxidative stress. Environ. Exp. Bot. 2020, 175, 104065. [Google Scholar] [CrossRef]
- Kuźniak, E.; Swiercz, U.; Chojak, J.; Sekulska-Nalewajko, J.; Gocławski, J. Automated image analysis for quantification of histochemical detection of reactive oxygen species and necrotic infection symptoms in plant leaves. J. Plant Interact. 2014, 9, 167–174. [Google Scholar] [CrossRef]
- Adamakis, I.D.S.; Sperdouli, I.; Eleftheriou, E.P.; Moustakas, M. Hydrogen peroxide production by the spot-like mode action of bisphenol A. Front. Plant Sci. 2020, 11, 1196. [Google Scholar] [CrossRef]
- Adamakis, I.D.S.; Malea, P.; Sperdouli, I.; Panteris, E.; Kokkinidi, D.; Moustakas, M. Evaluation of the spatiotemporal effects of bisphenol A on the leaves of the seagrass Cymodocea nodosa. J. Hazard. Mater. 2021, 404, 124001. [Google Scholar] [CrossRef]
- Barbagallo, R.P.; Oxborough, K.; Pallett, K.E.; Baker, N.R. Rapid noninvasive screening for perturbations of metabolism and plant growth using chlorophyll fluorescence imaging. Plant Physiol. 2003, 132, 485–493. [Google Scholar] [CrossRef] [Green Version]
- Kalaji, M.H.; Goltsev, V.N.; Żuk-Golaszewska, K.; Zivcak, M.; Brestic, M. Chlorophyll Fluorescence: Understanding Crop Performance—Basics and Applications, 1st ed.; CRC Press: Boca Raton, FL, USA, 2017; p. 236. ISBN 9781315153605. [Google Scholar]
- Sperdouli, I.; Moustakas, M. Spatio-temporal heterogeneity in Arabidopsis thaliana leaves under drought stress. Plant Biol. 2012, 14, 118–128. [Google Scholar] [CrossRef]
- Bayçu, G.; Moustaka, J.; Gevrek-Kürüm, N.; Moustakas, M. Chlorophyll fluorescence imaging analysis for elucidating the mechanism of photosystem II acclimation to cadmium exposure in the hyperaccumulating plant Noccaea caerulescens. Materials 2018, 11, 2580. [Google Scholar] [CrossRef] [Green Version]
- Moustakas, M.; Hanć, A.; Dobrikova, A.; Sperdouli, I.; Adamakis, I.D.S.; Apostolova, E. Spatial heterogeneity of cadmium effects on Salvia sclarea leaves revealed by chlorophyll fluorescence imaging analysis and laser ablation inductively coupled plasma mass spectrometry. Materials 2019, 12, 2953. [Google Scholar] [CrossRef] [Green Version]
- Sperdouli, I.; Moustaka, J.; Antonoglou, O.; Adamakis, I.-D.S.; Dendrinou-Samara, C.; Moustakas, M. Leaf age-dependent effects of foliar-sprayed CuZn nanoparticles on photosynthetic efficiency and ROS generation in Arabidopsis thaliana. Materials 2019, 12, 2498. [Google Scholar] [CrossRef] [Green Version]
- Sekulska-Nalewajko, J.; Kornaś, A.; Gocławski, J.; Miszalski, Z.; Kuźniak, E. Spatial referencing of chlorophyll fluorescence images for quantitative assessment of infection propagation in leaves demonstrated on the ice plant: Botrytis cinerea pathosystem. Plant Methods 2019, 15, 18. [Google Scholar] [CrossRef] [Green Version]
- Papadakis, I.E.; Giannakoula, A.; Therios, I.; Moustakas, M.; Nastou, A. Photosystem 2 activity of Citrus volkameriana (L.) leaves as affected by Mn nutrition and irradiance. Photosynthetica 2007, 45, 208–213. [Google Scholar] [CrossRef]
- Asfi, M.; Ouzounidou, G.; Panajiotidis, S.; Therios, I.; Moustakas, M. Toxicity effects of olive-mill wastewater on growth, photosynthesis and pollen morphology of spinach plants. Ecotoxicol. Environ. Saf. 2012, 80, 69–75. [Google Scholar] [CrossRef]
- Asfi, M.; Ouzounidou, G.; Moustakas, M. Evaluation of olive oil mill wastewater toxicity on spinach. Environ. Sci. Pollut. Res. 2012, 19, 2363–2371. [Google Scholar] [CrossRef] [PubMed]
- Murchie, E.H.; Lawson, T. Chlorophyll fluorescence analysis: A guide to good practice and understanding some new applications. J. Exp. Bot. 2013, 64, 3983–3998. [Google Scholar] [CrossRef] [Green Version]
- Guidi, L.; Calatayud, A. Non-invasive tools to estimate stress-induced changes in photosynthetic performance in plants inhabiting Mediterranean areas. Environ. Exp. Bot. 2014, 103, 42–52. [Google Scholar] [CrossRef]
- Sperdouli, I.; Moustakas, M. Differential blockage of photosynthetic electron flow in young and mature leaves of Arabidopsis thaliana by exogenous proline. Photosynthetica 2015, 53, 471–477. [Google Scholar] [CrossRef]
- Kalaji, H.M.; Jajoo, A.; Oukarroum, A.; Brestic, M.; Zivcak, M.; Samborska, I.A.; Cetner, M.D.; Łukasik, I.; Goltsev, V.; Ladle, R.J. Chlorophyll a fluorescence as a tool to monitor physiological status of plants under abiotic stress conditions. Acta Physiol. Plant. 2016, 38, 1–11. [Google Scholar] [CrossRef] [Green Version]
- Moustaka, J.; Ouzounidou, G.; Bayçu, G.; Moustakas, M. Aluminum resistance in wheat involves maintenance of leaf Ca2+ and Mg2+ content, decreased lipid peroxidation and Al accumulation, and low photosystem II excitation pressure. BioMetals 2016, 29, 611–623. [Google Scholar] [CrossRef]
- Moustaka, J.; Ouzounidou, G.; Sperdouli, I.; Moustakas, M. Photosystem II is more sensitive than photosystem I to Al3+ induced phytotoxicity. Materials 2018, 11, 1772. [Google Scholar] [CrossRef] [Green Version]
- Sperdouli, I.; Moustakas, M. Differential response of photosystem II photochemistry in young and mature leaves of Arabidopsis thaliana to the onset of drought stress. Acta Physiol. Plant. 2012, 34, 1267–1276. [Google Scholar] [CrossRef]
- Moustakas, M.; Bayçu, G.; Sperdouli, I.; Eroğlu, H.; Eleftheriou, E.P. Arbuscular mycorrhizal symbiosis enhances photosynthesis in the medicinal herb Salvia fruticosa by improving photosystem II photochemistry. Plants 2020, 9, 962. [Google Scholar] [CrossRef]
- Meng, L.; Mestdagh, H.; Ameye, M.; Audenaert, K.; Höfte, M.; Van Labeke, M.C. Phenotypic variation of Botrytis cinerea isolates is influenced by spectral light quality. Front. Plant Sci. 2020, 11, 1233. [Google Scholar] [CrossRef]
- Pérez-Bueno, M.L.; Pineda, M.; Barón, M. Phenotyping plant responses to biotic stress by chlorophyll fluorescence imaging. Front. Plant Sci. 2019, 10, 1135. [Google Scholar] [CrossRef] [PubMed]
- Moustakas, M.; Bayçu, G.; Gevrek-Kürüm, N.; Moustaka, J.; Csatári, I.; Rognes, S.E. Spatiotemporal heterogeneity of photosystem II function during acclimation to zinc exposure and mineral nutrition changes in the hyperaccumulator Noccaea caerulescens. Environ. Sci. Pollut. Res. 2019, 26, 6613–6624. [Google Scholar] [CrossRef] [PubMed]
- Moustaka, J.; Panteris, E.; Adamakis, I.D.S.; Tanou, G.; Giannakoula, A.; Eleftheriou, E.P.; Moustakas, M. High anthocyanin accumulation in poinsettia leaves is accompanied by thylakoid membrane unstacking, acting as a photoprotective mechanism, to prevent ROS formation. Environ. Exp. Bot. 2018, 154, 44–55. [Google Scholar] [CrossRef]
- Agathokleous, E. Environmental hormesis, a fundamental non-monotonic biological phenomenon with implications in ecotoxicology and environmental safety. Ecotoxicol. Environ. Saf. 2018, 148, 1042–1053. [Google Scholar] [CrossRef] [Green Version]
- Christou, A.; Michael, C.; Fatta-Kassinos, D.; Fotopoulos, V. Can the pharmaceutically active compounds released in agroecosystems be considered as emerging plant stressors? Environ. Int. 2018, 114, 360–364. [Google Scholar] [CrossRef]
- Muszynska, E.; Labudda, M. Dual role of metallic trace elements in stress biology-from negative to beneficial impact on plants. Int. J. Mol. Sci. 2019, 20, 3117. [Google Scholar] [CrossRef] [Green Version]
- Agathokleous, E.; Feng, Z.; Peñuelas, J. Chlorophyll hormesis: Are chlorophylls major components of stress biology in higher plants? Sci. Total Environ. 2020, 726, 138637. [Google Scholar] [CrossRef] [PubMed]
- Małkowski, E.; Sitko, K.; Szopiński, M.; Gieroń, Z.; Pogrzeba, M.; Kalaji, H.M.; Zieléznik-Rusinowska, P. Hormesis in plants: The role of oxidative stress, auxins and photosynthesis in corn treated with Cd or Pb. Int. J. Mol. Sci. 2020, 21, 2099. [Google Scholar] [CrossRef] [Green Version]
- Rozhko, T.V.; Nogovitsyna, E.I.; Badun, G.A.; Lukyanchuk, A.N.; Kudryasheva, N.S. Reactive Oxygen Species and low-dose effects of tritium on bacterial cells. J. Environ. Radioact. 2019, 208–209, 106035. [Google Scholar] [CrossRef] [Green Version]
- Malea, P.; Charitonidou, K.; Sperdouli, I.; Mylona, Z.; Moustakas, M. Zinc uptake, photosynthetic efficiency and oxidative stress in the seagrass Cymodocea nodosa exposed to ZnO nanoparticles. Materials 2019, 12, 2101. [Google Scholar] [CrossRef] [Green Version]
- Roach, T.; Na, C.S.; Stöggl, W.; Krieger-Liszkay, A. The non-photochemical quenching protein LHCSR3 prevents oxygen-dependent photoinhibition in Chlamydomonas reinhardtii. J. Exp. Bot. 2020, 71, 2650–2660. [Google Scholar] [CrossRef]
- Nishiyama, Y.; Yamamoto, H.; Allakhverdiev, S.I.; Inaba, M.; Yokota, A.; Murata, N. Oxidative stress inhibits the repair of photodamage to the photosynthetic machinery. EMBO J. 2001, 20, 5587–5594. [Google Scholar] [CrossRef] [PubMed]
- Agathokleous, E.; Kitao, M.; Calabrese, E.J. Hormesis: A compelling platform for sophisticated plant science. Trends Plant Sci. 2019, 24, 318–327. [Google Scholar] [CrossRef]
- Rolke, Y.; Liu, S.; Quidde, T.; Williamson, B.; Schouten, A.; Weltring, K.M.; Siewers, V.; Tenberge, K.B.; Tudzynski, B.; Tudzynski, P. Functional analysis of H2O2-generating systems in Botrytis cinerea: The major Cu-Zn-superoxide dismutase (BCSOD1) contributes to virulence on French bean, whereas a glucose oxidase (BCGOD1) is dispensable. Mol. Plant Pathol. 2004, 5, 17–27. [Google Scholar] [CrossRef]
- Hua, L.; Yong, C.; Zhanquan, Z.; Boqiang, L.; Guozheng, Q.; Shiping, T. Pathogenic mechanisms and control strategies of Botrytis cinerea causing post-harvest decay in fruits and vegetables. Food Qual. Saf. 2018, 3, 111–119. [Google Scholar] [CrossRef] [Green Version]
- Colmenares, A.J.; Aleu, J.; Durán-Patrón, R.; Collado, I.G.; Hernández-Galán, R. The putative role of botrydial and related metabolites in the infection mechanism of Botrytis cinerea. J. Chem. Ecol. 2002, 28, 997–1005. [Google Scholar] [CrossRef]
- Müller, P.; Li, X.P.; Niyogi, K.K. Non-photochemical quenching. A response to excess light energy. Plant Physiol. 2001, 125, 1558–1566. [Google Scholar] [CrossRef] [Green Version]
- Ruban, A.V. Nonphotochemical chlorophyll fluorescence quenching: Mechanism and effectiveness in protecting plants from photodamage. Plant Physiol. 2016, 170, 1903–1916. [Google Scholar] [CrossRef] [PubMed] [Green Version]
- Agathokleous, E.; Kitao, M.; Harayama, H. On the nonmonotonic, hormetic photoprotective response of plants to stress. Dose-Response 2019, 17, 1–3. [Google Scholar] [CrossRef] [PubMed] [Green Version]
- Vitale, L.; Vitale, E.; Costanzo, G.; De Maio, A.; Arena, C. Photo-protective mechanisms and the role of poly (ADP-ribose) polymerase activity in a facultative CAM plant exposed to long-term water deprivation. Plants 2020, 9, 1192. [Google Scholar] [CrossRef] [PubMed]
- Külheim, C.; Ågren, J.; Jansson, S. Rapid regulation of light harvesting and plant fitness in the field. Science 2002, 297, 91–93. [Google Scholar] [CrossRef] [PubMed]
- Li, X.; Müller-Moulé, P.; Gilmore, A.M.; Niyogi, K.K. PsbS-dependent enhancement of feedback de-excitation protects photosystem II from photoinhibition. Proc. Natl. Acad. Sci. USA 2002, 99, 15222–15227. [Google Scholar] [CrossRef] [PubMed] [Green Version]
- Sperdouli, I.; Moustakas, M. Leaf developmental stage modulates metabolite accumulation and photosynthesis contributing to acclimation of Arabidopsis thaliana to water deficit. J. Plant Res. 2014, 127, 481–489. [Google Scholar] [CrossRef]
- Sperdouli, I.; Moustakas, M. A better energy allocation of absorbed light in photosystem II and less photooxidative damage contribute to acclimation of Arabidopsis thaliana young leaves to water deficit. J. Plant Physiol. 2014, 171, 587–593. [Google Scholar] [CrossRef]
- Dietz, K.J.; Pfannschmidt, T. Novel regulators in photosynthetic redox control of plant metabolism and gene expression. Plant Physiol. 2011, 155, 1477–1485. [Google Scholar] [CrossRef] [Green Version]
- Li, Z.; Wakao, S.; Fischer, B.B.; Niyogi, K.K. Sensing and responding to excess light. Annu. Rev. Plant Biol. 2009, 60, 239–260. [Google Scholar] [CrossRef] [PubMed]
- Gawronski, P.; Burdiak, P.; Scharff, L.B.; Mielecki, J.; Górecka, M.; Zaborowska, M.; Leister, D.; Waszczak, C.; Karpiński, S. CIA2 and CIA2-LIKE are required for optimal photosynthesis and stress responses in Arabidopsis thaliana. Plant J. 2021, 105, 619–638. [Google Scholar] [CrossRef] [PubMed]
- Berger, S.; Papadopoulos, M.; Schreiber, U.; Kaiser, W.; Roits, T. Complex regulation of gene expression, photosynthesis and sugar levels by pathogen infection in tomato. Physiol. Plant. 2004, 122, 419–428. [Google Scholar] [CrossRef]
- Muniz, C.R.; Freire, F.C.O.; Viana, F.M.P.; Cardoso, J.E.; Sousa, C.A.F.; Guedes, M.I.F.; van der Schoor, R.; Jalink, H. Monitoring cashew seedlings during interactions with the fungus Lasiodiplodia theobromae using chlorophyll fluorescence imaging. Photosynthetica 2014, 52, 529–537. [Google Scholar] [CrossRef]
- Kasajima, I.; Ebana, K.; Yamamoto, T.; Takahara, K.; Yano, M.; Kawai-Yamada, M.; Uchimiya, H. Molecular distinction in genetic regulation of nonphotochemical quenching in rice. Proc. Natl. Acad. Sci. USA 2011, 108, 13835–13840. [Google Scholar] [CrossRef] [Green Version]
- Gawroński, P.; Witoń, D.; Vashutina, K.; Bederska, M.; Betliński, B.; Rusaczonek, A.; Karpiński, S. Mitogen-activated protein kinase 4 is a salicylic acid-independent regulator of growth but not of photosynthesis in Arabidopsis. Mol. Plant 2014, 7, 1151–1166. [Google Scholar] [CrossRef] [Green Version]
- Hideg, É.; Spetea, C.; Vass, I. Singlet oxygen production in thylakoid membranes during photoinhibition as detected by EPR spectroscopy. Photosynth. Res. 1994, 39, 191–199. [Google Scholar] [CrossRef]
- Op den Camp, R.G.L.; Przybyla, D.; Ochsenbein, C.; Laloi, C.; Kim, C.; Danon, A.; Wagner, D.; Hideg, É.; Göbel, C.; Feussner, I.; et al. Rapid induction of distinct stress responses after the release of singlet oxygen in Arabidopsis. Plant Cell 2003, 15, 2320–2332. [Google Scholar] [CrossRef] [PubMed] [Green Version]
- Krieger-Liszkay, A.; Fufezan, C.; Trebst, A. Singlet oxygen production in photosystem II and related protection mechanism. Photosynth. Res. 2008, 98, 551–564. [Google Scholar] [CrossRef]
- Triantaphylidès, C.; Havaux, M. Singlet oxygen in plants: Production, detoxification and signaling. Trends Plant Sci. 2009, 14, 219–228. [Google Scholar] [CrossRef] [PubMed]
- Telfer, A. Singlet oxygen production by PSII under light stress: Mechanism, detection and the protective role of beta-carotene. Plant Cell Physiol. 2014, 55, 1216–1223. [Google Scholar] [CrossRef] [Green Version]
- Rossi, F.R.; Krapp, A.R.; Bisaro, F.; Maiale, S.J.; Pieckenstain, F.L.; Carrillo, N. Reactive oxygen species generated in chloroplasts contribute to tobacco leaf infection by the necrotrophic fungus Botrytis cinerea. Plant J. 2017, 92, 761–773. [Google Scholar] [CrossRef] [PubMed] [Green Version]
- Meng, L.; Höfte, M.; Van Labeke, M.C. Leaf age and light quality influence the basal resistance against Botrytis cinerea in strawberry leaves. Environ. Exp. Bot. 2019, 157, 35–45. [Google Scholar] [CrossRef]
- Moustakas, M. The role of metal ions in biology, biochemistry and medicine. Materials 2021, 14, 549. [Google Scholar] [CrossRef] [PubMed]
- Calabrese, E.J. Hormetic mechanisms. Crit. Rev. Toxicol. 2013, 43, 580–606. [Google Scholar] [CrossRef] [PubMed]
- Dean, R.; Van Kan, J.A.; Pretorius, Z.A.; Hammond-Kosack, K.E.; Di Pietro, A.; Spanu, P.D.; Rudd, J.J.; Dickman, M.; Kahmann, R.; Ellis, J.; et al. The top 10 fungal pathogens in molecular plant pathology. Mol. Plant Pathol. 2012, 13, 414–430. [Google Scholar] [CrossRef] [PubMed] [Green Version]
- De Vega, D.; Holden, N.; Hedley, P.E.; Morris, J.; Luna, E.; Newton, A. Chitosan primes plant defence mechanisms against Botrytis cinerea, including expression of Avr9/Cf-9 rapidly elicited genes. Plant Cell Environ. 2021, 44, 290–303. [Google Scholar] [CrossRef]
- van Rensburg, H.C.J.; Van den Ende, W. Priming with γ-aminobutyric acid against Botrytis cinerea reshuffles metabolism and reactive oxygen species: Dissecting signalling and metabolism. Antioxidants 2020, 9, 1174. [Google Scholar] [CrossRef]
- Agathokleous, E.; Calabrese, E.J. Hormesis: The dose response for the 21st Century: The future has arrived. Toxicology 2019, 425, 152249. [Google Scholar] [CrossRef]
- Agathokleous, E.; Feng, Z.; Iavicoli, I.; Calabrese, E.J. The two faces of nanomaterials: A quantification of hormesis in algae and plants. Environ. Int. 2019, 131, 105044. [Google Scholar] [CrossRef]
- Agathokleous, E.; Kitao, M.; Calabrese, E.J. Hormesis: Highly generalizable and beyond laboratory. Trends Plant Sci. 2020, 25, 1076–1086. [Google Scholar] [CrossRef]
- Calabrese, E.J. Hormesis: Path and progression to significance. Int. J. Mol. Sci. 2018, 19, 2871. [Google Scholar] [CrossRef] [PubMed] [Green Version]
- Rozhko, T.V.; Nemtseva, E.V.; Gardt, M.V.; Raikov, A.V.; Lisitsa, A.E.; Badun, G.A.; Kudryasheva, N.S. Enzymatic responses to low-intensity radiation of tritium. Int. J. Mol. Sci. 2020, 21, 8464. [Google Scholar] [CrossRef] [PubMed]
- Calabrese, E.J.; Agathokleous, E. Accumulator plants and hormesis. Environ. Pollut. 2021, 274, 116526. [Google Scholar] [CrossRef] [PubMed]
- Małkowski, E.; Sitko, K.; Zieleźnik-Rusinowska, P.; Gieroń, Ż.; Szopiński, M. Heavy metal toxicity: Physiological implications of metal toxicity in plants. In Plant Metallomics and Functional Omics; Sablok, G., Ed.; Springer: Cham, Switzerland, 2019; pp. 253–301. [Google Scholar]
- Zhang, S.; Li, X.; Sun, Z.; Shao, S.; Hu, L.; Ye, M.; Shi, K. Antagonism between phytohormone signalling underlies the variation in disease susceptibility of tomato plants under elevated CO2. J. Exp. Bot. 2015, 66, 1951–1963. [Google Scholar] [CrossRef] [Green Version]
Figure 1.
A visible damage (arrowhead) can be observed on a tomato leaf 24 h after application of a Botrytis cinerea spore suspension drop (circle) (a). B. cinerea hyphae (arrow) visible on the leaf epidermis 24 h after the spore suspension application (b). Staining of tomato leaflets with 2′, 7′-dichlorofluorescein diacetate (DCF-DA) for hydrogen peroxide (H2O2) detection after 30 (c) and 240 min (d) of B. cinerea application. Hydrogen peroxide generation is visible as green fluorescence (c,d). Scale Bars: 1 mm in (a), 0.2 mm in (b), and 500 μm in (c,d).

Figure 2.
The effective quantum yield of PSII photochemistry (ΦPSII) before (control) and after 30, 120 and 240 min of B. cinerea aquatic spore suspension application on tomato leaflets, measured at 230 μmol photons m−2 s−1 (a), and at 900 μmol photons m−2 s−1 (b). Error bars are standard deviations (n = 6). Columns with different letters are statistically different (p < 0.05).

Figure 3.
The quantum yield of regulated non-photochemical energy loss in PSII (ΦNPQ) before (control) and after 30, 120 and 240 min of B. cinerea aquatic spore suspension application on tomato leaflets, measured at 230 μmol photons m−2 s−1 (a), and at 900 μmol photons m−2 s−1 (b). Error bars are standard deviations (n = 6). Columns with different letters are statistically different (p < 0.05).

Figure 4.
The quantum yield of non-regulated energy loss in PSII (ΦNO) before (control) and after 30, 120 and 240 min of B. cinerea aquatic spore suspension application on tomato leaflets, measured at 230 μmol photons m−2 s−1 (a), and at 900 μmol photons m−2 s−1 (b). Error bars are standard deviations (n = 6). Columns with different letters are statistically different (p < 0.05).

Figure 5.
The non-photochemical quenching (NPQ), reflecting heat dissipation, before (control) and after 30, 120 and 240 min of B. cinerea aquatic spore suspensions application on tomato leaflets, measured at 230 μmol photons m−2 s−1 (a), and at 900 μmol photons m−2 s−1 (b). Error bars are standard deviations (n = 6). Columns with different letters are statistically different (p < 0.05).

Figure 6.
Chlorophyll fluorescence images of ΦPSΙΙ, measured at 640 μmol photons m−2 s−1, before (0 min, control) and after 30 and 240 min of B. cinerea suspension application on tomato leaflets. The color code depicted at the bottom ranges from values 0.0 to 1.0. The circles in each image denote the areas of interest (AOI) that were selected in each leaflet and are complemented by red labels with their ΦPSΙΙ values, while whole leaflet value is presented. Arrowhead at ΦPSΙΙ image after 30 min of B. cinerea suspension application points at the visible area of the aquatic spore suspensions.

Figure 7.
Chlorophyll fluorescence images of the fraction of open PSII reaction centers (qp), measured at 640 μmol photons m−2 s−1, before (0 min, control) and after 30 and 240 min of B. cinerea spore suspension application on tomato leaflets. The color code depicted at the bottom ranges from values 0.0 to 1.0. The circles in each image denote the areas of interest (AOI) that were selected in each leaflet and are complemented by red labels with qp values, while whole leaflet value is presented.

Figure 8.
Overview of the hormetic response of photosystem II in tomato (at moderate light intensity), to B. cinerea spore application. The hormetic effect is defined by an inverse J-shaped biphasic curve with a short exposure time to have a stimulatory effect but at longer exposure time severe toxic effects to be apparent.


Table 1.
Definitions of the chlorophyll fluorescence parameters and their calculation.
| Parameter | Definition | Calculation |
|---|---|---|
| ΦPSII | The effective quantum yield of PSII photochemistry | (Fm′ − Fs)/Fm′ |
| ΦNPQ | The quantum yield of regulated non-photochemical energy loss in PSII, that is heat dissipation for photoprotection | Fs/Fm′ − Fs/Fm |
| ΦNO | The quantum yield of non-regulated energy loss in PSII | Fs/Fm |
| NPQ | The non-photochemical quenching that reflects heat dissipation of excitation energy | (Fm − Fm′)/Fm′ |
| qp | The photochemical quenching, that is the redox state of the plastoquinone pool, is a measure of the number of open PSII reaction centers | (Fm′ − Fs)/(Fm′ − Fo′) |
Publisher’s Note: MDPI stays neutral with regard to jurisdictional claims in published maps and institutional affiliations. |
© 2021 by the authors. Licensee MDPI, Basel, Switzerland. This article is an open access article distributed under the terms and conditions of the Creative Commons Attribution (CC BY) license (http://creativecommons.org/licenses/by/4.0/).
Share and Cite
MDPI and ACS Style
Stamelou, M.-L.; Sperdouli, I.; Pyrri, I.; Adamakis, I.-D.S.; Moustakas, M. Hormetic Responses of Photosystem II in Tomato to Botrytis cinerea. Plants 2021, 10, 521. https://0-doi-org.brum.beds.ac.uk/10.3390/plants10030521
AMA Style
Stamelou M-L, Sperdouli I, Pyrri I, Adamakis I-DS, Moustakas M. Hormetic Responses of Photosystem II in Tomato to Botrytis cinerea. Plants. 2021; 10(3):521. https://0-doi-org.brum.beds.ac.uk/10.3390/plants10030521
Chicago/Turabian StyleStamelou, Maria-Lavrentia, Ilektra Sperdouli, Ioanna Pyrri, Ioannis-Dimosthenis S. Adamakis, and Michael Moustakas. 2021. "Hormetic Responses of Photosystem II in Tomato to Botrytis cinerea" Plants 10, no. 3: 521. https://0-doi-org.brum.beds.ac.uk/10.3390/plants10030521
Note that from the first issue of 2016, this journal uses article numbers instead of page numbers. See further details here.